aerial photography aerial platforms are primarily stable wing aircraft. aircraft are often used to...
TRANSCRIPT

Aerial Photography
Aerial platforms are primarily stable wing aircraft. Aircraft are often used to collect very detailed images and facilitate the collection of data over virtually any portion of the Earth's surface at any time.
The scale and quality of the data collected is affected by several factors including, but not limited to, altitude of the aircraft, position of the plane, and the quality of the photographic equipment used.

CameraCamera

Cameras
Cameras view an area on the ground and after the light passes through the lens it is recorded onto the exposure plane.

Cameras
The area captured by the camera is affected by the:
Focal length of the lens
Platform altitude
Format and size of the filmFocal length is the distance from the center of the lens to the exposure plane. The longer the focal length, the smaller the area on the ground that is recorded, but the result is a more detailed photograph.

Cameras
Cameras use light sensitive film which records UV, Visible and Near Infrared wavelengths.
Three types of images are possible:
Black & White
True Color
Color IR or False Color

Cameras
Camera Angles
When the camera is pointed directly at the ground, a vertical photo is taken, thus reducing distortion. Vertical photos are used when high resolution is required.
When the camera is pointed to the side of the aircraft, an oblique photo is taken. Oblique photos contain more distortion, however they are good for visualizing height differences.

Satellite Imagery
There are two types of sensors:
Passive
ActivePassive sensors record EMR that originates from the sun and is reflected off of the objects it encounters.
Active sensors provide their own energy source and record the reflected response as it interacts with various objects.

Examples of Sensors
Examples of Passive Sensors:
Landsat MSS & TM
SPOT
IKONOS
Examples of Active Sensors:
Radar
Sonar

Passive Sensors
Multispectral Scanning Many electronic (as opposed to photographic) remote sensors acquire
data using scanning systems, which employ a sensor with a narrow field of view (i.e. IFOV) that sweeps over the terrain to build up and produce a two-dimensional image of the surface.
A scanning system used to collect data over a variety of different wavelength ranges is called a multispectral scanner (MSS)
There are two main modes or methods of scanning employed to acquire multispectral image data - across-track scanning, and along-track scanning.

Multispectral Scanning
Across-track scanning rotating mirror (A). A bank of internal detectors (B) The IFOV (C) of the sensor and the
altitude of the platform determine the ground resolution cell viewed (D), and thus the spatial resolution. The angular field of view (E) is the sweep of the mirror, measured in degrees, used to record a scan line, and determines the width of the imaged swath (F).
Multispectral Scanning
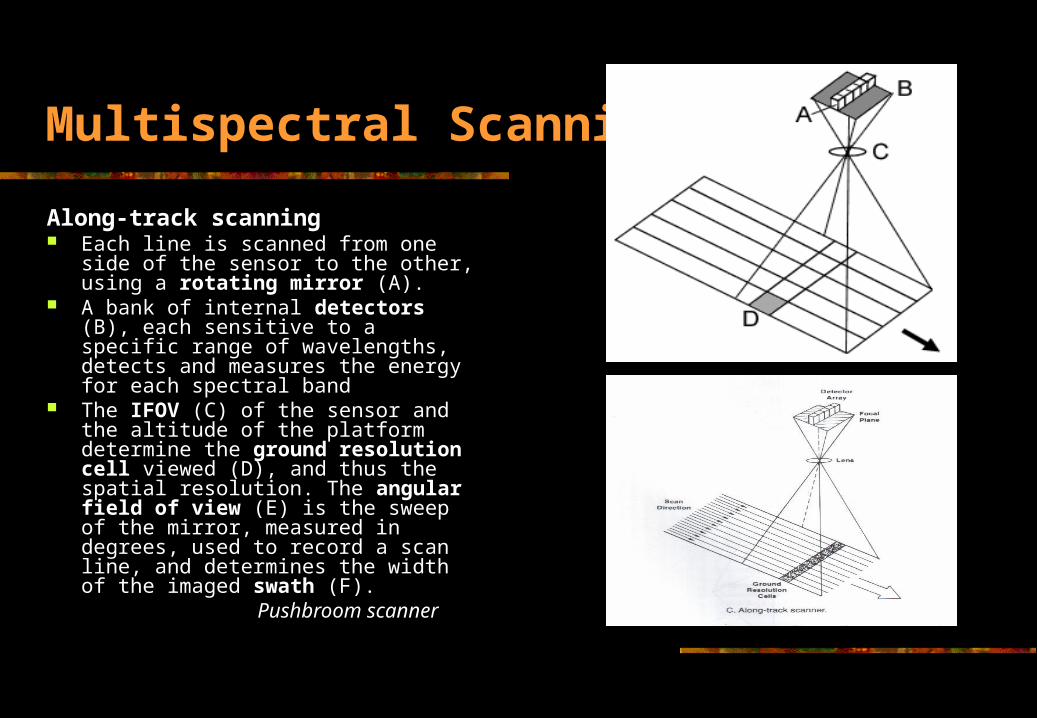
Along-track scanning Each line is scanned from one side of the
sensor to the other, using a rotating mirror (A).
A bank of internal detectors (B), each sensitive to a specific range of wavelengths, detects and measures the energy for each spectral band
The IFOV (C) of the sensor and the altitude of the platform determine the ground resolution cell viewed (D), and thus the spatial resolution. The angular field of view (E) is the sweep of the mirror, measured in degrees, used to record a scan line, and determines the width of the imaged swath (F).
Pushbroom scanner

Multi-Spectral ScannerMulti-Spectral Scanner
• 4 filters produce spectral bands4 filters produce spectral bands– 0.5 - 0.6 µm (green)0.5 - 0.6 µm (green)
– 0.6 - 0.7 µm (red)0.6 - 0.7 µm (red)
– 0.7 - 0.8 µm (photo-IR)0.7 - 0.8 µm (photo-IR)
– 1.1 µm (near-IR).1.1 µm (near-IR).
• Light through each filter reaches its set of six Light through each filter reaches its set of six electronic detectors (24 in all) that subdivide electronic detectors (24 in all) that subdivide the cross-track scan into 6 parallel lines, each the cross-track scan into 6 parallel lines, each equivalent to a ground width of 79 m (259 ft).equivalent to a ground width of 79 m (259 ft).

Passive Sensors
Landsat MSS (Multispectral Scanner) - 1972
Spatial Resolution: 56m x 79m
Spectral Resolution:4 Bands
Temporal Resolution:16 days
Swath:185 km

Passive Sensors
Landsat TM (Thematic Mapper) - 1982
Spatial Resolution:
30m x 30m
Spectral Resolution:7 Bands
Temporal Resolution:
16 days
Swath:
185 km

Passive Sensors
SPOT Panchromatic - 1986
Spatial Resolution:
10m x 10m
Spectral Resolution:
1 Band
Temporal Resolution:
26 days
Swath:60 km

Passive Sensors
SPOT XS (Multispectral) - 1986
Spatial Resolution:20m x 20m
Spectral Resolution:3 Bands
Temporal Resolution:26 days
Swath:60 km

Passive Sensors
IKONOS Panchromatic - 1999
Spatial Resolution:
1m x 1m
Spectral Resolution:
1 Band
Temporal Resolution:
3 days
Swath:
11 km

Passive Sensors
IKONOS Multispectral - 1999
Spatial Resolution:
4m x 4m
Spectral Resolution:
4 Bands
Temporal Resolution:
3 days
Swath:
11 km

Active Sensors
RadarRadar data are produced when a radar transmitter emits a beam of micro or millimeter waves, the waves reflect from the surfaces they strike, and the backscattered radiation is detected by the radar’s system’s receiving antenna, which is tuned to the frequency of the transmitted waves.
Radar microwaves can penetrate the atmosphere day or night under virtually all weather conditions, providing data even in the presence of haze, light rain, snow, clouds, or smoke.

real aperture radar
microwave
energy emitted across-track
return time measured (slant range)
amount of energy (scattering) synthetic aperture radar
microwave
higher resolution - extended antenna simulated by forward motion of platform
ERS-1, -2 SAR (AMI), Radarsat SAR, JERS SAR
Sensor System

MSS Scene of CaliforniaMSS Scene of California
• Urban is most reflective in Bands 4 and 5;Urban is most reflective in Bands 4 and 5;
• Suburban is strong in Bands 4 and 7 (the latter Suburban is strong in Bands 4 and 7 (the latter tied to the influence of planted vegetation). tied to the influence of planted vegetation).
• The signatures for forest and healthy croplands are The signatures for forest and healthy croplands are similar but the heights of the bars for Bands 6 and similar but the heights of the bars for Bands 6 and 7 are greater for the crops; 7 are greater for the crops;
• the bar heights for small grains and fallow fields the bar heights for small grains and fallow fields are similar but the response for Bands 4 and 5 is are similar but the response for Bands 4 and 5 is just a bit higher than for 6 and 7just a bit higher than for 6 and 7

Thematic MapperThematic Mapper
• Band 1 is superior to MSS 4 in detecting some Band 1 is superior to MSS 4 in detecting some features in waterfeatures in water
• Band 5 is sensitive to variations in water contentBand 5 is sensitive to variations in water content
• Band 7 likewise reacts to moisture contents and Band 7 likewise reacts to moisture contents and is especially suited to detecting hydrous minerals is especially suited to detecting hydrous minerals (such as clays (such as clays
• Band 6 can distinguish a radiant temperature Band 6 can distinguish a radiant temperature difference of ~ 0.6 degrees C difference of ~ 0.6 degrees C

Thematic Mapper Thematic Mapper CharacteristicsCharacteristics
Band Wavelength Response Resolution
1 0.45 - 0.52 Blue-Green 30
2 0.52 - 0.60 Green 30
3 0.63 - 0.69 Red 30
4 0.76 - 0.90 Near IR 30
5 1.55 - 1.75 Mid-IR 30
6 10.40 - 12.50 Thermal IR 120
7 2.08 - 2.35 Mid-IR 30

Other Satellite SystemsOther Satellite Systems• AVHRRAVHRR
– 5 channel, visible, near-infrared, thermal portions of 5 channel, visible, near-infrared, thermal portions of spectrumspectrum
– Used for studying vegetation conditions, regional Used for studying vegetation conditions, regional tracking, snow cover, continent analysis, geophysical tracking, snow cover, continent analysis, geophysical characteristics (temperature)characteristics (temperature)
• GOESGOES– geosynchronous orbit for meteorological applicationsgeosynchronous orbit for meteorological applications

SPOT vs. LandsatSPOT vs. Landsat

SPOT Color and SPOT Color and PanchromaticPanchromatic

Merging Data SetsMerging Data Sets
• Merge of a Landsat Merge of a Landsat TM subscene TM subscene rendered in IHS rendered in IHS (Intensity; Hue; (Intensity; Hue; Saturation) color Saturation) color and a 2-meter (6.6 and a 2-meter (6.6 feet) resolution feet) resolution space photo space photo onboard the Russian onboard the Russian Mir StationMir Station