aei public opinion sstudies - american enterprise … public opinion studies american enterprise...
TRANSCRIPT

American Enterprise Institute compilation
S
POLLS ON PATRIOTISM
Compiled by Karlyn Bowman, Resident Fellow, AEI,
Eleanor O’Neil, Research Assistant, AEI,
and Heather Sims, Research Assistant, AEI
(June 2015)
AEI Public Opinion
Studies
American Enterprise Institute compilation 2
Table of Contents
PATRIOTISM IN THE U.S. AND ABROAD ...................................................... 3
Self-professed Patriotism ..................................................................................... 3
Views of Other Americans’ Patriotism ..............................................................18
International Comparisons .................................................................................22
The U.S. versus Elsewhere ................................................................................24
September 11th Effects ......................................................................................29
Flying the Flag ...................................................................................................32
WHAT DOES IT MEAN TO BE A PATRIOT .................................................34
ATTITUDES OF YOUNG PEOPLE ..................................................................39

American Enterprise Institute compilation
Self-Professed Patriotism
How proud are you to be an American . . . very proud, quite proud, not very proud, or not at all proud?
Very Quite Not very Not at all
proud proud proud proud
Jun. 1981 Gallup 78% 19% 2% 1%
Dec. 1981 Gallup 80 16 2 1
Jun. 1986 Gallup 89 10 1 *
Jun. 1990 Gallup 74 23 2 *
May 1991 Gallup 77 19 3 *
Nov. 2000* Gallup 73 22 4 1
Note: *Question wording was, “How proud are you of being an American today . . . ?”
How proud are you to be an American . . . extremely proud, very proud, moderately proud, only a little proud, or not at
all proud?
Extremely Very Moderately Only a little Not at all
proud proud proud proud proud
Jan. 2001 Gallup 55% 32% 9% 1% 1%
Jun. 2002 Gallup/USA Today/CNN 65 25 6 1 2
Sep. 2002 ABC 69 23 5 1 1
Jun. 2003 Gallup/USA Today/CNN 70 20 6 2 1
Jan. 2004 Gallup/USA Today/CNN 69 22 5 3 1
Jan. 2005 Gallup/USA Today/CNN 61 22 12 3 1
Jan. 2006 Gallup 59 26 9 3 1
Jun. 2006 Gallup 57 25 10 3 3
Jan. 2007 Gallup 57 27 14 3 2
Jun. 2008 CNN/ORC 62 27 7 2 1
Jan. 2009 CNN/ORC 57 26 12 3 1
Jan. 2009 Gallup/USA Today 58 24 12 3 2
PATRIOTISM IN THE U.S. and ABROAD: Before September 11th, 2001, substantial
majorities consistently told pollsters that they were proud to be Americans. In a Gallup question from
January 2001, for example, 55 percent described themselves as “extremely” proud of being an
American and 32 percent “very” proud. Just 2 percent said they were “only a little” or “not at all”
proud.
The events of September 11th produced overt displays of patriotism. People said they flew
their flags more than in the past, and they sang the Star Spangled Banner. Those activities receded,
but patriotic sentiment is still strong. In June 2013, when Gallup repeated the question, 57 percent
described themselves as extremely proud and 28 percent very proud. Four percent said they were only
a little or not at all proud. In the 2014 General Social Survey, 67 percent said they were very proud of
being American and 28 percent somewhat proud.
In the most recent multicountry World Values Survey, the top ranked country for self-
expressed patriotism was Qatar with 98 percent of its citizens reporting to be “very” proud to be
citizens of that country. Fifty-six percent of Americans said they were very proud to be American
citizens, locating our country more than midway down in this highest response category.
American patriotism is not blind patriotism. Polls show that Americans find a lot to criticize
in their society. In June 2015, only 28 percent told Gallup that they satisfied with the way things are
going in the United States at this time. Seventy-one percent were dissatisfied. But they still love their
country, and they are not reluctant to say so.

American Enterprise Institute compilation 4
Nov. 2009 Pew 48 38 11 4 1
Jun. 2010 Pew 52 31 8 4 2
May 2011 CBS/NYT 61 25 12 1 0
Jun. 2013 Gallup 57 28 10 3 1
(Percentage who say “Extremely Proud” by party)
Republicans Democrats
Jan. 2001 Gallup 62% 52%
Jun. 2002 Gallup/USA Today/CNN 77 58
Sep. 2002 Gallup/USA Today/CNN 80 61
Jun. 2003 Gallup/USA Today/CNN 84 61
Jan. 2004 Gallup/USA Today/CNN 82 57
Jan. 2005 Gallup/USA Today/CNN 71 54
Jun. 2006 Gallup/USA Today 74 47
Jun. 2008 CNN/ORC 79 53
Jan. 2009 CNN/ORC 68 51
Jan. 2009 Gallup/USA Today 78 45
Jun. 2010 Pew 69 43
May 2011 CBS/NYT 76 53
Jun. 2013 Gallup 71 56
How proud are you to be an American – extremely proud, very proud, moderately proud, only a little proud or not at all
proud?
Extremely Very Moderately Only a little Not at all
proud proud proud proud proud
Mar. 2002 ABC/Wash Post 74% 18% 5% 2% 1%
Sep. 2002 ABC/Wash Post 69 23 6 1 1
Sep. 2006 ABC/Wash Post 60 24 10 3 2
How proud are you to be an American – extremely proud, very proud, moderately proud, only a little proud or not at all
proud?
Extremely Very Moderately Only a little Not at all
proud proud proud proud proud
Jun. 2013 PRRI 51% 31% 12% 3% 1%
How proud are you to be an American, are you extremely proud, somewhat proud, or not proud?
Extremely Somewhat Not
proud proud proud
Mar. 1981* Civic Services 78% 13% 2%
Nov. 1981 PIPV 81 16 1
Jun. 1991# AP 87 11 1
Note: *Question wording was “…or not proud at all?” #Question wording was “Generally speaking, how proud are you
to be an American?”

American Enterprise Institute compilation
How proud are you to be an American...extremely proud, very proud, somewhat proud, or not very proud?
Extremely Very Somewhat Not very
proud proud proud proud
Nov. 1988 ANES 67% 27% 6% 1%
Jan. 1994 NORC 47 39 13 1
Percentage who say “extremely proud”, 1994:
White 49%
Black 35
Republican 56
Democrat 47
Independent 40
College graduate 41
Non-college graduate 49
18-30 37
31-44 40
45-59 53
60-74 66
75+ 54
How proud are you of being American?
Very Somewhat Not very Not proud
proud proud proud at all
2004 NORC 79% 16% 2% --
2014 NORC 67 28 2 1
Percentage who said “very proud,” 2014:
White 67%
Black 68
Republican 78
Democrat 62
Independent 61
Highest degree completed:
Less than high school 62
High school 70
Junior college 67
Bachelor 64
Graduate 63
Millennials (Ages 18–33) 56
Generation X (34–49) 68
Baby Boomers (50–68) 67
Silent Generation (69–86) 86

American Enterprise Institute compilation 6
How proud are you of being an American citizen? (CBS)
How proud would you say you are to be an American citizen? (Harris Interactive)
Very Somewhat Not very Not at all
proud proud proud proud
May 1995 CBS 82% 14% 2% 1%
May 2002 Harris Interactive 84 12 2 *
Aug 2009 Harris Interactive 78 18 3 1
How much would you agree or disagree with the following statements: I am proud to be an American. Do you strongly
agree, agree, neither agree or disagree, disagree, or disagree strongly?
Strongly Strongly
agree Agree Neither Disagree disagree
Sep.-Oct. 2001* ISR 81% 12% 2% 1% 1%
Mar.-Apr. 2002 ISR 70 24 2 2 1
Note: *Poll conducted September 13-27, 2001.
Which of these describes you well? [Check all that apply]
May 2014 Pew
Applies Not selected/No answer
Compassion and helping others are 74% 26%
my core values
Often feel proud to be American 56 44
Rarely worry what others think of me 52 48
Sports fan 36 64
Skeptical of medical experts’ recommendations 23 77
Which of these describes you well? [Check all that apply]
May 2014 Pew
Honor and duty are Often feel proud Think of myself as
my core values to be American a typical American
Total 52% 56% 65%
How patriotic are you? Would you say extremely patriotic, very patriotic, somewhat patriotic, or not especially
patriotic?
Extremely Very Somewhat Not especially
patriotic patriotic patriotic patriotic
Jun. 1994 Gallup 21% 43% 28% 7%
Jun. 1999 Gallup/
CNN/USA Today 21 44 28 7
Jan. 2002 Gallup/Harwood 24 47 24 4
Aug. 2002 Wash Post/
Kaiser/Harvard 27 43 24 5
Jun. 2005 Gallup/CNN/
USA Today 26 46 22 5
May 2006 AARP/ICR 19 38 28 12
Jun. 2010 Gallup/USA Today 32 42 19 6

American Enterprise Institute compilation
There’s been a lot of talk in the last few years about patriotism in America. Do you consider yourself very patriotic,
somewhat patriotic, or not very patriotic?
Very Somewhat Not very
patriotic patriotic patriotic
Jun. 1983 NYT 52% 38% 7%
Nov. 1983 NYT 53 37 5
Jun. 1991 CBS/NYT 55 37 5
Sept. 2001 CBS/NYT 72 24 3
Aug. 2006 CBS/NYT 62 33 4
How would you describe yourself?
Very Somewhat Not very Not at all
patriotic patriotic patriotic patriotic
Jul. 2009 Economist/YouGov 42% 42% 9% 7%
May 2011 Economist/YouGov 50 36 10 4
Jun. 2011 Economist/YouGov 49 38 9 4
Jun. 2013 Economist/YouGov 45 40 9 7
Note: Online survey.
Next, I'm going to read you some words and phrases and ask you to rate how well each describes you. Please use a
scale from 1 to 10, where '10' represents a description that is perfect for you, and '1' represents a description that is
totally wrong for you. On this scale of 1 to 10, how well does ________ describe you?
Feb. 2014 Pew
---------------------Describes very well (Points 8-10 on a 10-point scale)-----------------
A patriotic An A religious A supporter
person environmentalist person of gay rights
National response 65% 39% 49% 39%
Responses of
Millennials 49 32 36 51
Gen Xers 64 42 52 37
Boomers 75 42 55 33
Silent Generation 81 44 61 32
Note: Millennials are 18-33 years old, Gen Xers are 34-49 years old, and the Silent Generation 69-86 years old in this
Pew study.
Now I am going to read you another series of statements on some different topics. For each statement, please tell me if
you completely agree with it, mostly agree with it, mostly disagree with it, or completely disagree with it. The first one
is...I am very patriotic?
Completely Mostly Mostly Completely
agree agree disagree disagree
May 1987 Pew 43% 46% 7% 1%
May 1988 Pew 51 38 6 2
Feb. 1989 Pew 51 40 6 1
May 1990 Pew 48 40 8 2
Nov. 1991 Pew 58 33 5 2
Jun. 1992 Pew 52 39 5 2
Jul. 1994 Pew 51 40 6 2
Nov. 1997 Pew 48 42 6 2
Sep. 1999 Pew 49 38 8 3
Aug. 2002 Pew 54 38 2 4
Aug. 2003 Pew 56 35 5 2
Dec. 2006-
Jan. 2007 Pew 49 41 6 2

American Enterprise Institute compilation 8
Apr. 2009 Pew 54 34 6 3
Sep. 2011 Pew 54 31 9 4
Apr. 2012 Pew 52 36 6 3
(Percentage who say “Completely Agree” by party)
Republicans Democrats
May 1987 Pew 51% 40%
May 1988 Pew 59 48
Nov. 1991 Pew 65 52
Jun. 1992 Pew 58 49
Jul. 1994 Pew 64 45
Nov. 1997 Pew 59 43
Sep. 1999 Pew 64 49
Aug. 2002 Pew 63 50
Aug. 2003 Pew 71 48
Jan. 2007 Pew 61 45
Apr. 2009 Pew 71 46
Sep. 2011 Pew 67 48
Apr. 2012 Pew 65 42
(Percentage who say “Completely Agree” by race)
White Black
May 1987 Pew 44% 27%
May 1988 Pew 54 32
Feb. 1989 Pew 53 34
May 1990 Pew 50 46
Nov. 1991 Pew 61 44
Jun. 1992 Pew 55 37
Jul. 1994 Pew 53 39
Nov. 1997 Pew 50 33
Sep. 1999 Pew 52 32
Aug. 2002 Pew 57 45
Aug. 2003 Pew 59 38
Jan. 2007 Pew 54 37
Apr. 2009 Pew 61 35
Apr. 2012 Pew 57 33
How important is being an American to you, where 0 is not at all important and 10 is the most important thing in your
life?
0-2 3-4 5-6 7-8 9-10
1996 NORC 4% 3% 15% 24% 55%
Do you agree or disagree with the following statement: being an American is a big part of who I am?
Agree Disagree
Mar. 2000 NYT 91% 8%
When you hear the national anthem, the Star Spangled Banner, being played, do you usually feel proud to be an
American?
Yes No
May 2002 Harris Interactive 90% 5%
Aug. 2009 Harris Interactive 87 7
Given everything that has happened in the United States and around the world, do you personally feel more or less
patriotic today than you did five years ago?
More Less Same
Jun. 2006 Fox 57% 17% 25%

American Enterprise Institute compilation
During your lifetime, what event has made you most proud to be an American?
June 2013 PRRI
Military service/Military achievements 17%
Response to September 11th attacks 14
Freedom 12
Humanitarian/Disaster work 8
Personal experience/Success 7
Equality/Opportunity 6
Obama’s election 6
Being born in U.S./Becoming a citizen 5
Moon landing 5
Government/Other political leaders 3
Other 13
Has there ever been a time when you were not proud to be an American?
Yes No
Jun. 2013 PRRI 31% 68%
Jun. 2015 PRRI 35 63
(If ever felt not proud or didn’t know): During your lifetime, what event has made you feel not proud to be an
American?
June 2013 PRRI
Wars 29%
Treatment of minorities/Racism 14
American culture 11
Barack Obama 11
George W. Bush 10
American foreign policy 9
Government/Public officials/Politics 6
Other 8
How much would you say you love this country—very much, quite a lot, some, or only a little?
Very much Quite a lot Some A little
Oct. 2010* Fox 87% 11% 2% -
Oct. 2010^ Fox 81 14 3 -
Note: *Asked of likely voters. ^Asked of registered voters.
Do you love America?
February 2015 Economist/YouGov
Yes No Not sure
Total 85% 6% 9%
Ages
18–29 71 15 14
30–44 83 7 10
45–64 90 1 8
65+ 93 3 4
Note: Online survey.

American Enterprise Institute compilation 10
Are you proud or ashamed of this country?
Proud Ashamed
May 2007 Zogby 89% 9%
How proud are you of the United States?
Very Somewhat Not very Not at all
proud proud proud proud
Aug. 2007 Zogby 69% 20% 9% 2%
Sep. 2007 Zogby 67 21 9 3
Dec. 2007 Zogby 69 21 7 3
May-Jun. 2009 Zogby 60 28 9 2
How proud are you of America in each of the following...very proud, somewhat proud, or not proud at all?
Very Somewhat Not very Not proud
proud proud proud at all
Its scientific and technological achievements
1996 NORC 48% 42% 4% 1%
Sep. 2001 NORC 76 21 2 *
Mar. 2002 NORC 70 28 1 *
Sep. 2002 Wash Post 69 28 2 1
2004 NORC 57 36 3 1
2014 NORC 46 48 5 2
Its history
1996 NORC 48% 37% 8% 4%
Sep. 2001 NORC 68 26 4 2
Mar. 2002 NORC 56 37 5 1
Sep. 2002 Wash Post 62 33 2 2
2004 NORC 61 30 5 2
2014 NORC 53 39 6 3
America’s armed forces
1996 NORC 47% 40% 7% 2%
Sep. 2001 NORC 80 17 1 1
Mar. 2002 NORC 84 15 1 *
Sep. 2002 Wash Post 81 16 1 2
2004 NORC 74 19 4 2
2014 NORC 66 27 6 2
Its achievements in the arts and literature
1996 NORC 29% 54% 8% 2%
Sep. 2001 NORC 56 37 3 1
Mar. 2002 NORC 49 43 4 1
Sep. 2002 Wash Post 46 46 3 2
2004 NORC 39 47 6 1
2014 NORC 36 55 7 1
The way democracy works
1996 NORC 28% 52% 13% 3%
Sep. 2001 NORC 61 36 2 1
Mar. 2002 NORC 52 44 3 1
Sep. 2002 Wash Post 49 41 5 4
2004 NORC 32 52 8 2
2014 NORC 27 54 16 4

American Enterprise Institute compilation 11
America’s economic achievements
1996 NORC 28% 51% 15% 3%
Sep. 2001 NORC 60 35 4 *
Mar. 2002 NORC 57 37 4 2
Sep. 2002 Wash Post 40 49 7 3
2004 NORC 38 47 10 3
2014 NORC 25 50 19 6
Its political influence in the world
1996 NORC 21% 55% 16% 3%
Sep. 2001 NORC 38 51 7 2
Mar. 2002 NORC 34 55 7 3
Sep. 2002 Wash Post 30 48 13 8
2004 NORC 22 52 18 3
2014 NORC 14 52 27 7
Its fair and equal treatment of all groups in society
1996 NORC 17% 37% 30% 11%
Sep. 2001 NORC 35 46 14 4
Mar. 2002 NORC 24 52 19 5
Sep. 2002 Wash Post 28 45 15 11
2004 NORC 26 47 18 6
2014 NORC 18 44 28 10
Its achievements in sports
1996 NORC 36% 48% 8% 3%
2004 NORC 42 44 7 2
2014 NORC 38 51 8 3
Its Social Security system
1996 NORC 14% 35% 37% 11%
2004 NORC 13 41 33 10
2014 NORC 13 39 34 15
Note: Sep. 2001 NORC survey conducted after Sep. 11 terrorist attacks, on Sep. 13-27.
Do you feel things in this country are generally going in the right direction or do you feel things have pretty seriously
gotten off on the wrong track?
Don’t know/
Right direction Wrong track No answer
Jul. 2012 CBS/NYT 30% 64% 6%
Sep. 2012 CBS/NYT 40 54 6
Oct. 2012 CBS/NYT 39 54 7
Feb. 2013 CBS/NYT 40 54 6
Apr. 2013 CBS/NYT 34 59 7
May 2013 CBS/NYT 31 61 9
Jun. 2013 CBS/NYT 35 59 6
Jul. 2013 CBS/NYT 35 60 4
Sep 2013 CBS/NYT 29 66 5
Oct. 2013 CBS/NYT 23 72 4
Nov.2013 CBS/NYT 27 68 5
Dec. 2013 CBS/NYT 30 63 7
Jan. 2013 CBS/NYT 33 61 6
Feb. 2014 CBS/NYT 32 63 6
Mar. 2014 CBS/NYT 32 61 8
May 2014 CBS 30 62 7
Jul. 2014 CBS 25 67 9

American Enterprise Institute compilation 12
Sep. 2014 CBS/NYT 27 66 7
Oct. 2014 (early) CBS 29 65 6
Oct. 2014 (mid) CBS 26 65 9
Oct. 2014 (late) CBS 27 66 8
Jan. 2015 CBS 38 56 7
Feb. 2015 CBS 37 56 7
Mar. 2015 CBS 30 62 8
Apr. 2015 CBS/NYT 31 63 6
May 2015 CBS/NYT 33 63 5
Note: *CBS/NYT poll wording: “Do you feel things in this country are generally going in the right direction or do you
feel things have pretty seriously gotten off on the wrong track?”
In general, are you satisfied or dissatisfied with the way things are going in the United States at this time?
Satisfied Dissatisfied No opinion
Feb. 1979 Gallup 26% 69% 5%
Jul. 1979 Gallup 12 84 4
Nov. 1979 Gallup 19 77 4
Jan. 1981 Gallup 17 78 5
Jun. 1981 Gallup 33 61 6
Dec. 1981 Gallup 27 67 6
Apr. 1982 Gallup 25 71 4
Sep. 1982 Gallup 24 72 4
Nov. 1982 Gallup 24 72 4
Aug. 1983 Gallup 35 59 6
Feb. 1984 Gallup 50 46 4
Sep.–Oct. 1984 Gallup 48 45 7
Dec. 1984 Gallup 52 40 8
Nov. 1985 Gallup 51 46 3
Mar. 1986 Gallup 66 30 4
Jun. 1986 Gallup 69 26 5
Sep. 1986 Gallup 58 38 4
Dec. 1986 Gallup 47 49 4
Aug.–Sep. 1987 Gallup 45 49 6
May 1988 Gallup 41 54 5
Sep.–Oct. 1988 Gallup 56 40 4
Jan.–Feb. 1989 Gallup 45 50 5
May 1989 Gallup 44 50 6
Feb. 1990 Gallup 55 39 6
Jul. 1990 Gallup 45 51 4
Aug. 1990 Gallup 43 51 6
Aug.–Sep. 1990 Gallup 51 44 5
Sep. 1990 Gallup 37 58 5
Oct. (Mid) 1990 Gallup 29 67 4
Oct. (Late) 1990 Gallup 31 66 3
Nov. 1990 Gallup 32 64 4
Dec. 1990 Gallup 33 64 3
Jan. (Early) 1991 Gallup 32 61 7
Jan. (Mid) 1991 Gallup 62 33 5
Feb. 1991 Gallup 54 40 6
Feb.–Mar. 1991 Gallup 66 31 3
Mar. 1991 Gallup 52 43 5
May 1991 Gallup 49 49 2
Jul. 1991 Gallup 43 50 7
Aug. 1991 Gallup 49 45 6
Oct. 1991 Gallup 39 57 4
Oct.–Nov. 1991 Gallup 35 62 3

American Enterprise Institute compilation 13
Dec. 1991 Gallup 37 60 3
Jan. 1992 Gallup 24 74 2
Jan.–Feb. 1992 Gallup 24 75 1
Feb.–Mar. 1992 Gallup 21 78 1
Mar. 1992 Gallup 19 80 1
Apr. 1992 Gallup 19 80 1
May 1992 Gallup 20 77 3
Jun. 1992 Gallup 14 84 2
Jul.–Aug. 1992 Gallup 17 80 3
Aug.–Sep. 1992 Gallup 22 73 5
Nov. 1992 Gallup 26 68 6
Jan. 1993 Gallup 29 68 3
Feb. 1993 Gallup 25 71 4
May 1993 Gallup 24 73 3
Nov. 1993 Gallup 27 70 3
Dec. 1993 Gallup 34 63 3
Jan. 1994 Gallup 35 62 3
Feb. 1994 Gallup 36 61 3
Mar. 1994 Gallup 35 62 3
Apr. 1994 Gallup 32 65 3
May 1994 Gallup 33 64 3
Jul. 1994 Gallup 33 65 2
Oct. 1994 Gallup 31 66 3
Nov. (Early) 1994 Gallup 30 66 4
Nov. (Late) 1994 Gallup 29 67 4
Mar. 1995 Gallup 30 66 4
Jul. 1995 Gallup 32 65 3
Aug. 1995 Gallup 33 64 3
Jan. 1996 Gallup 24 72 4
Mar. (Early) 1996 Gallup 41 56 2
Mar. (Mid) 1996 Gallup 36 61 3
May 1996 Gallup 37 60 3
Aug. 1996 Gallup 38 57 5
Aug.–Sep. 1996 Gallup 45 50 5
Oct. 1996 Gallup 39 56 5
Nov. 1996 Gallup 47 47 6
Dec. 1996 Gallup 43 55 2
Jan. 1997 Gallup 50 47 3
May 1997 Gallup 46 51 3
Aug. 1997 Gallup 50 48 2
Dec. 1997 Gallup 50 46 4
Jan.–Feb. 1998 Gallup 63 35 2
Feb. (Mid) 1998 Gallup 39 37 4
Feb. (Late) 1998 Gallup 64 32 4
Apr. 1998 Gallup 58 38 4
May 1998 Gallup 59 36 5
Aug. (Mid) 1998 Gallup 60 36 4
Aug. (Late) 1998 Gallup 63 34 3
Oct.–Nov. 1998 Gallup 60 34 6
Dec. 1998 Gallup 50 48 2
Jan. 1999 Gallup 70 28 2
Feb. 1999 Gallup 71 26 3
Apr. (Mid) 1999 Gallup 58 39 3
Apr. (Late) 1999 Gallup 51 45 4
May 1999 Gallup 51 46 3
Jun. 1999 Gallup 55 43 3
Aug. 1999 Gallup 62 35 3
Sep. 1999 Gallup 52 45 3

American Enterprise Institute compilation 14
Jan. 2000 Gallup 69 28 3
Feb. 2000 Gallup 65 32 3
Apr. 2000 Gallup 59 37 4
May 2000 Gallup 55 42 3
Jun. 2000 Gallup 56 39 5
Jul. 2000 Gallup 61 35 4
Aug. 2000 Gallup 63 33 4
Aug.–Sep. 2000 Gallup 59 38 3
Oct. 2000 Gallup 62 36 2
Nov. 2000 Gallup 58 41 1
Dec. 2000 Gallup 51 46 3
Jan. 2001 Gallup 56 41 3
Feb. 2001 Gallup 51 45 4
Mar. 2001 Gallup 53 44 3
Apr. 2001 Gallup 50 47 3
May 2001 Gallup 46 50 4
Jun. 2001 Gallup 51 46 3
Jul. 2001 Gallup 51 46 3
Aug. 2001 Gallup 48 49 3
Sep. (Mid) 2001 Gallup 43 55 2
Sep. (Late) 2001 Gallup 61 36 4
Oct. 2001 Gallup 67 29 4
Nov. 2001 Gallup 65 33 2
Dec. 2001 Gallup 70 28 2
Jan. 2002 Gallup 65 32 3
Feb. 2002 Gallup 61 37 2
Mar. 2002 Gallup 61 37 2
Apr. 2002 Gallup 61 37 2
May 2002 Gallup 56 40 4
Jun. 2002 Gallup 52 44 4
Jul. (Early) 2002 Gallup 49 48 3
Jul. (Mid) 2002 Gallup 49 47 4
Jul. (Late) 2002 Gallup 48 49 3
Aug. 2002 Gallup 47 50 3
Sep. 2002 Gallup 47 51 2
Oct. 2002 Gallup 47 49 4
Oct.–Nov. 2002 Gallup 48 47 5
Nov. 2002 Gallup 46 51 3
Dec. 2002 Gallup 46 51 3
Jan. 2003 Gallup 42 56 2
Feb. (Early) 2003 Gallup 40 58 2
Feb. (Mid) 2003 Gallup 39 58 3
Mar. (Early) 2003 Gallup 36 61 3
Mar. (Late) 2003 Gallup 60 38 2
Apr. 2003 Gallup 55 41 4
May 2003 Gallup 54 45 1
Jun. 2003 Gallup 47 51 2
Jul. 2003 Gallup 50 48 2
Aug. 2003 Gallup 46 52 2
Sep. 2003 Gallup 40 58 2
Oct. 2003 Gallup 41 57 2
Nov. 2003 Gallup 44 54 2
Dec. 2003 Gallup 50 48 2
Jan. (Early) 2004 Gallup 55 43 2
Jan. (Mid) 2004 Gallup 46 53 1
Feb. 2004 Gallup 45 54 1
Mar. 2004 Gallup 39 60 1
Apr. 2004 Gallup 41 57 2

American Enterprise Institute compilation 15
May (Early) 2004 Gallup 36 62 2
May (Mid) 2004 Gallup 37 62 1
Jun. 2004 Gallup 39 59 2
Jul. 2004 Gallup 41 57 2
Aug. 2004 Gallup 44 55 1
Sep. 2004 Gallup 41 56 3
Oct. (Mid) 2004 Gallup 41 57 2
Oct. (Late) 2004 Gallup 44 53 3
Nov. 2004 Gallup 44 54 2
Dec. 2004 Gallup 45 53 2
Jan. 2005 Gallup 46 53 1
Feb. (Mid) 2005 Gallup 46 52 2
Feb. (Late) 2005 Gallup 45 52 3
Mar. (Mid) 2005 Gallup 42 36 2
Mar. (Late) 2005 Gallup 38 59 3
Apr. 2005 Gallup 38 59 3
May (Early) 2005 Gallup 39 58 3
May (Late) 2005 Gallup 41 55 4
Jun. (Early) 2005 Gallup 38 60 2
Jun. (Late) 2005 Gallup 42 56 2
Jul. (Mid) 2005 Gallup 42 57 1
Jul. (Late) 2005 Gallup 40 58 2
Aug. (Mid) 2005 Gallup 37 60 3
Aug. (Late) 2005 Gallup 34 62 4
Sep. (Mid) 2005 Gallup 34 65 1
Sep. (Late) 2005 Gallup 39 59 2
Oct. (Mid) 2005 Gallup 31 68 1
Oct. (Late) 2005 Gallup 35 63 2
Nov. (Mid) 2005 Gallup 31 66 3
Nov. (Late) 2005 Gallup 36 62 2
Dec. (Early) 2005 Gallup 35 62 3
Dec. (Mid) 2005 Gallup 36 62 2
Jan. (Early) 2006 Gallup 36 61 3
Jan. (Mid) 2006 Gallup 35 62 3
Feb. 2006 Gallup 35 62 3
Mar. 2006 Gallup 29 68 2
Apr. 2006 Gallup 27 71 2
May 2006 Gallup 25 72 3
Jun. 2006 Gallup 30 67 2
Jul. (Early) 2006 Gallup 32 65 3
Jul. (Late) 2006 Gallup 33 65 2
Aug. 2006 Gallup 28 69 3
Sep. 2006 Gallup 32 67 2
Oct. 2006 Gallup 30 68 2
Nov. (Early) 2006 Gallup 35 61 4
Nov. (Mid) 2006 Gallup 31 67 2
Dec. 2006 Gallup 30 69 1
Jan. 2007 Gallup 35 63 2
Feb. 2007 Gallup 34 64 2
Mar. 2007 Gallup 30 68 2
Apr. 2007 Gallup 33 65 2
May 2007 Gallup 25 73 2
Jun. 2007 Gallup 24 74 2
Jul. 2007 Gallup 27 71 3
Aug. 2007 Gallup 24 73 3
Sep. 2007 Gallup 28 71 2
Oct. (Early) 2007 Gallup 25 73 2
Oct. (Mid) 2007 Gallup 26 72 2

American Enterprise Institute compilation 16
Nov. 2007 Gallup 20 76 3
Dec. 2007 Gallup 27 70 3
Jan. 2008 Gallup 24 73 3
Feb. 2008 Gallup 20 78 2
Mar. 2008 Gallup 19 80 2
Apr. 2008 Gallup 15 83 1
May 2008 Gallup 14 85 1
Jun. 2008 Gallup 14 84 1
Jul. 2008 Gallup 17 81 2
Aug. (Early) 2008 Gallup 17 80 3
Aug. (Mid) 2008 Gallup 18 81 1
Sep. 2008 Gallup 21 77 2
Oct. (Early) 2008 Gallup 9 90 1
Oct. (Mid) 2008 Gallup 7 91 1
Oct.–Nov. 2008 Gallup 13 85 2
Nov. (Early) 2008 Gallup 13 84 3
Nov. (Mid) 2008 Gallup 11 87 2
Dec. 2008 Gallup 10 88 2
Jan. 2009 Gallup 13 85 3
Feb. 2009 Gallup 15 82 3
Mar. 2009 Gallup 19 77 4
Apr. 2009 Gallup 26 69 6
May 2009 Gallup 35 62 3
Jun. 2009 Gallup 34 63 4
Jul. 2009 Gallup 30 65 5
Aug. 2009 Gallup 36 63 1
Aug.–Sep. 2009 Gallup 29 70 1
Oct. (Early) 2009 Gallup 36 71 3
Oct. (Mid) 2009 Gallup 26 72 2
Nov. 2009 Gallup 24 74 1
Dec. 2009 Gallup 25 73 2
Jan. 2010 Gallup 23 76 2
Feb. 2010 Gallup 21 77 2
Mar. 2010 (early) Gallup 19 79 2
Mar. 2010 (late) Gallup 23 75 2
Apr. 2010 Gallup 27 71 2
May (Early) 2010 Gallup 24 74 2
May (Late) 2010 Gallup 25 73 2
Jun. 2010 Gallup 23 75 1
Jul. 2010 Gallup 21 76 3
Aug. (Early) 2010 Gallup 21 77 2
Aug. (Late) 2010 Gallup 20 78 2
Sep. 2010 Gallup 19 79 1
Oct. (Early) 2010 Gallup 21 77 2
Oct. (Late) 2010 Gallup 22 75 3
Nov. 2010 Gallup 19 79 2
Dec. 2010 Gallup 17 81 2
Jan. 2011 Gallup 19 78 3
Feb. 2011 Gallup 23 75 2
Mar. 2011 Gallup 18 80 2
Apr. (Mid) 2011 Gallup 19 78 3
Apr. (Late) 2011 Gallup 22 75 3
May 2011 Gallup 26 72 2
Jun. 2011 Gallup 20 78 2
Jul. 2011 Gallup 16 81 2
Aug. 2011 Gallup 11 88 1
Sep. 2011 Gallup 11 88 1
Oct. (Early) 2011 Gallup 13 85 2

American Enterprise Institute compilation 17
Oct. (Late) 2011 Gallup 22 76 2
Nov. 2011 Gallup 12 86 2
Nov.–Dec. 2011 Gallup 14 86 *
Dec. 2011 Gallup 15 84 1
Jan. 2012 Gallup 18 80 2
Feb. 2012 Gallup 22 77 1
Mar. 2012 Gallup 26 72 2
Apr. 2012 Gallup 24 74 2
Jun. 2012 Gallup 20 77 2
Jul. 2012 Gallup 28 69 3
Aug. 2012 Gallup 23 75 2
Sep. 2012 Gallup 30 68 2
Oct. 2012 Gallup 30 68 2
Nov. (Early) 2012 Gallup 33 64 2
Nov. (Late) 2012 Gallup 31 68 1
Dec. 2012 Gallup 23 72 6
Jan. 2013 Gallup 25 71 4
Feb. 2013 Gallup 27 72 2
Mar. 2013 Gallup 21 77 2
Apr. 2013 Gallup 30 67 3
May 2013 Gallup 24 74 2
Jun. 2013 Gallup 27 71 2
Jul. 2013 Gallup 28 68 3
Aug. 2013 Gallup 22 75 2
Sep. 2013 Gallup 23 75 1
Oct. 2013 Gallup 16 82 2
Nov. 2013 Gallup 20 78 3
Dec. 2013 Gallup 23 76 1
Jan. 2014 Gallup 23 75 2
Feb. 2014 Gallup 22 77 2
Mar. 2014 Gallup 25 73 2
May 2014 Gallup 25 74 2
Jun. 2014 Gallup 23 74 3
Jul. 2014 Gallup 24 73 3
Aug. 2014 Gallup 22 76 2
Sep. 2014 Gallup 23 76 2
Oct. 2014 Gallup 21 77 2
Oct.–Nov. 2014 Gallup 27 70 3
Nov. 2014 Gallup 20 77 3
Dec. 2014 Gallup 23 76 2
Jan.2015 Gallup 32 66 2
Feb. 2015 Gallup 32 66 1
Mar. 2015 Gallup 31 67 2
Apr. 2015 Gallup 28 70 1
May 2015 Gallup 26 72 2
June 2015 Gallup 28 71 1
Are you proud or ashamed to have Barack Obama as President?
Proud Ashamed
Oct. 2009 Zogby 52% 35%
Jun. 2009 Zogby 53 34
Jul. 2009 Zogby 52 37
Aug. 2009 (Mid) Zogby 52 38
Aug. 2009 (Late) Zogby 52 35
Sept. 2009 (Mid) Zogby 53 35
Sept. 2009 (Late) Zogby 54 34

American Enterprise Institute compilation 18
Oct. 2009 Zogby 52 35
Nov. 2009 Zogby 52 35
Dec. 2009 (Mid) Zogby 50 38
Dec. 2009 (Late) Zogby 50 37
Jan. 2010 Zogby 51 35
Feb 2010 (Early) Zogby 53 33
Feb. 2010 (Mid) Zogby 54 34
Feb 2010 (Late) Zogby 49 35
March 2010 Zogby 48 38
April 2010 Zogby 50 39
Are you proud or ashamed that George W. Bush is President of the United States?
Proud Ashamed
Jan. 2002* Zogby 82% 8%
Nov. 2003 Zogby 56 26
Jan. 2005 Zogby 54 31
Jun. 2005 Zogby 51 37
Sep. 2005 (Early) Zogby 49 38
Sep. 2005 (Late) Zogby 50 36
May 2007 Zogby 45 42
Note: * Question wording was “Are you proud or ashamed to have George W. Bush as President
of the United States?”
Are you proud or ashamed that Bill Clinton is President of the United States?
Proud Ashamed
Jul. 1998 Zogby 46% 31%
Sept. 1998 (Mid) Zogby 29 52
Sept. 1998 (Late) Zogby 35 50
Oct. 1998 (Early) Zogby 32 52
Oct. 1998 (Mid) Zogby 34 48
Jan. 1999 Zogby 40 42
Jan. 2000 Zogby 38 44
Views of Other Americans’ Patriotism
Do you think average Americans are more or less patriotic than they were 25 years ago?
More Less
patriotic patriotic
Jun. 1998 Fox 18% 68%
Jun. 1999 Fox 16 74
Jun.–Jul. 2003 Fox 55 30
Jun 2004 Fox 45 37
Jun. 2005 Fox 43 42
Jun. 2006 Fox 36 50
(Demographic breakdown, Jun. 2006, Party ID)
Democrat 39% 46
Republican 36 54
Independent 30 54
American Enterprise Institute compilation 19
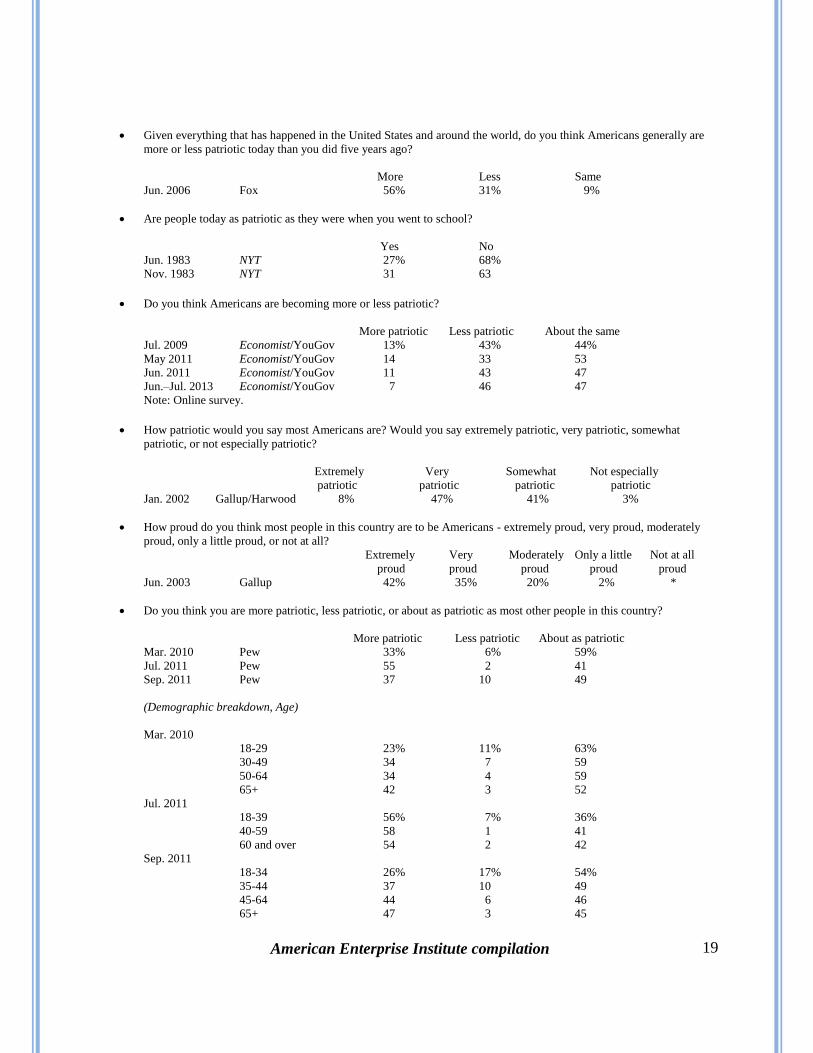
Given everything that has happened in the United States and around the world, do you think Americans generally are
more or less patriotic today than you did five years ago?
More Less Same
Jun. 2006 Fox 56% 31% 9%
Are people today as patriotic as they were when you went to school?
Yes No
Jun. 1983 NYT 27% 68%
Nov. 1983 NYT 31 63
Do you think Americans are becoming more or less patriotic?
More patriotic Less patriotic About the same
Jul. 2009 Economist/YouGov 13% 43% 44%
May 2011 Economist/YouGov 14 33 53
Jun. 2011 Economist/YouGov 11 43 47
Jun.–Jul. 2013 Economist/YouGov 7 46 47
Note: Online survey.
How patriotic would you say most Americans are? Would you say extremely patriotic, very patriotic, somewhat
patriotic, or not especially patriotic?
Extremely Very Somewhat Not especially
patriotic patriotic patriotic patriotic
Jan. 2002 Gallup/Harwood 8% 47% 41% 3%
How proud do you think most people in this country are to be Americans - extremely proud, very proud, moderately
proud, only a little proud, or not at all?
Extremely Very Moderately Only a little Not at all
proud proud proud proud proud
Jun. 2003 Gallup 42% 35% 20% 2% *
Do you think you are more patriotic, less patriotic, or about as patriotic as most other people in this country?
More patriotic Less patriotic About as patriotic
Mar. 2010 Pew 33% 6% 59%
Jul. 2011 Pew 55 2 41
Sep. 2011 Pew 37 10 49
(Demographic breakdown, Age)
Mar. 2010
18-29 23% 11% 63%
30-49 34 7 59
50-64 34 4 59
65+ 42 3 52
Jul. 2011
18-39 56% 7% 36%
40-59 58 1 41
60 and over 54 2 42
Sep. 2011
18-34 26% 17% 54%
35-44 37 10 49
45-64 44 6 46
65+ 47 3 45

American Enterprise Institute compilation 20
(Education)
Mar. 2010
LT HS grad 27% 6% 61%
HS grad 32 6 60
Some college 36 6 56
College plus 35 6 58
Sep. 2011
LT HS grad 33% 12% 47%
High school grad 41 8 46
Some college 37 12 49
College plus 35 9 54
(Gender)
Mar. 2010
Male 36% 5% 57%
Female 30 7 60
Jul. 2011
Male 56% 2% 41%
Female 49 7 44
Sep. 2011
Male 39% 9% 48%
Female 36 10 50
(Party ID)
Mar. 2010
Republican 43% 2% 54%
Democrat 26 8 64
Independent 32 8 58
Sep. 2011
Republican 56% 3% 39%
Democrat 30% 11% 55%
Independent 33% 11% 51%
(Race/Ethnicity)
Mar. 2010
White 35% 5% 59%
Black 26 8 60
Hispanic 29 9 60
Jul. 2011
White 57% 2% 39%
Black 36 1 61
Hispanic 60 6 33
Sep. 2011
White 39% 8% 50%
Black 34 8 50
Hispanic 33 17 46

American Enterprise Institute compilation 21
Do you think you are more patriotic than most people, less patriotic than most people, or about as patriotic as most
people?
February 2015 Economist/YouGov
More patriotic Less patriotic About as patriotic
Total 27% 13% 51%
Republican 45% 8% 45%
Democrat 17 13 64
Independent 25 16 47
Ages
18–29 15% 27% 41%
30–44 19 15 54
45–64 34 7 55
65+ 38 6 54
White 29% 12% 53%
Black 15 25 48
Hispanic 27 11 46
Note: Online survey.
Would you describe yourself as more or less patriotic than the average American? Is that a lot or a little?
A lot A little Same A little A lot
more more patriotic less less
patriotic patriotic (Vol.) patriotic patriotic
Jun. 1998 Fox 27% 33% 25% 9% 2%
Jun. 1999 Fox 27 33 26 9 2
Oct. 2001 Fox 31 28 30 8 1
Jun.–Jul. 2003 Fox 32 29 28 6 1
Jun. 2004 Fox 37 27 24 8 1
Jun. 2005 Fox 31 26 30 8 1
Jun. 2006 Fox 34 32 20 11 2
(Demographic breakdown, Jun. 2006, Party ID)
Democrats 28% 28% 21% 19% 2%
Republicans 44 34 16 4 2
Independents 28 37 23 7 3
How much do you agree or disagree that strong patriotic feelings in America . . . ?
2014 National Opinion Research Center
Neither
Agree agree nor Disagree
strongly Agree disagree Disagree strongly
Strengthen America’s place in the world 37% 40% 17% 5% 1%
Lead to intolerance in America 7 37 27 26 4
Are needed for America to remain united 27 52 13 8 1
Lead to negative attitudes towards
immigrants in America 7 36 24 30 4

American Enterprise Institute compilation 22
International Comparisons How proud are you to be [substitute own nationality]? (1999-2004 World Values Survey; 2005-2009 World Values
Survey; 2010-2014 World Values Survey)
-------------------------Very Proud-----------------------
2010–2014 2005–2009 1999–2004
Qatar 98% NA NA
Ghana 96 93% NA
Puerto Rico NA NA 92%
Ecuador 91 NA NA
Venezuela NA NA 90
Mali NA 88 NA
Guatemala NA 87 NA
Trinidad and Tobago 87 90 NA
Uzbekistan 87 NA NA
Jordan 85 70 66
Philippines 85 NA 87
Mexico 84 83 79
Yemen 82 NA NA
Thailand 82 85 NA
Burkina Faso NA 81 NA
Rwanda 81 78 NA
Tanzania NA NA 81
Colombia 80 90 NA
Vietnam NA 80 77
Pakistan 79 NA 81
Libya 77 NA NA
Kuwait 76 NA NA
Zimbabwe 76 NA 78
Georgia NA 75 NA
Turkey 75 76 65
Saudi Arabia NA NA 74
Bangladesh NA NA 73
Azerbaijan 72 NA NA
Albania NA NA 72
Armenia 71 NA NA
Australia 70 69 NA
Ethiopia NA 70 NA
Canada NA 68 65
India NA 69 67
Nigeria 67 NA 72
Morocco 66 58 91
Uganda NA NA 66
Malaysia 65 69 NA
Palestine 65 NA NA
Egypt 64 73 82
New Zealand 63 66 NA
Iran NA 63 90
Peru 62 NA 76
Kazakhstan 62 NA NA
South Africa 62 78 75
Zambia NA 62 NA
Poland 60 62 NA
Algeria 59 NA 72
Macedonia NA NA 58
Tunisia 57 NA NA
United States 56 62 71

American Enterprise Institute compilation 23
Indonesia NA 56 48
Finland NA 55 NA
Spain 55 58 60
Israel NA NA 54
Kyrgyzstan 54 NA 43
Norway NA 51 NA
Iraq 50 81 77
Uruguay 50 73 NA
Great Britain NA 50 NA
Argentina 49 61 65
Chile 49 59 72
Cyprus 47 49 NA
Singapore 48 NA 44
Slovenia 49 55 NA
Romania 43 37 NA
Hungary NA 43 NA
Serbia and Montenegro NA 42 **
Italy NA 41 NA
Sweden 40 40 39
Brazil NA 39 NA
Bulgaria NA 39 NA
Andorra NA 37 NA
Lebanon 37 NA NA
Bosnia NA NA 35
Belarus 31 NA NA
Switzerland NA 31 NA
Russia 29 44 NA
France NA 28 NA
Ukraine 26 30 NA
Japan 25 21 21
Germany 24 20 NA
South Korea 24 19 17
China 22 22 25
Estonia 21 NA NA
Netherlands 21 26 NA
Moldova NA 19 23
Taiwan 15 13 NA
Note: NA = Not Asked. **Serbia and Montenegro were two separate countries in this asking. Serbia’s percentage was
38, and Montenegro’s percentage was 24.
How much do you agree or disagree with the following statements...I would rather be a citizen of (country) than of any
other country in the world? (2003–2004 World Values Survey)
How much do you agree or disagree with the following statement? Generally speaking, (country) is a better country
than most other countries? (2003–2004 World Values Survey)
----Rather be a citizen of my---- ---------My country is------
---- country than any other---- -------a better country------
Strongly Strongly
agree Agree agree Agree
Philippines 48% 36% 22% 32%
United States 74 15 40 38 India* NA NA NA NA
Ireland 40 41 10 45
South Africa 42 42 26 44
Mexico* NA NA NA NA
Poland 41 37 6 25
Turkey* NA NA NA NA

American Enterprise Institute compilation 24
Nigeria* NA NA NA NA
New Zealand 53 28 28 46
Brazil* NA NA NA NA
Canada 58 27 30 49
Chile 44 39 16 40
Iceland* NA NA NA NA
Argentina* NA NA NA NA
Portugal 36 46 9 34
Slovenia 39 31 6 23
Hungary 51 35 7 25
Austria 50 27 24 43
Britain 40 31 13 35
Spain 20 54 10 38
Finland 56 25 20 46
Romania* NA NA NA NA
Norway 45 32 14 47
Bulgaria 54 25 15 29
Denmark 56 27 29 38
Northern Ireland* NA NA NA NA
Italy* 29 34 7 31
Sweden 29 32 9 31
China* NA NA NA NA
France 35 25 11 30
Latvia 12 31 3 24
South Korea 37 33 10 33
Switzerland 20 35 3 22
Slovakia 25 28 3 17
Belarus* NA NA NA NA
Russia 44 33 19 29
Czech Republic 31 38 6 23
Belgium* NA NA NA NA
Japan 61 25 39 37
Lithuania* NA NA NA NA
Estonia* NA NA NA NA
Germany 18 41 3 31
Netherlands* 16 32 8 37
Note: NA = Not Asked. * means that the results are from NORC’s 1995 data for the second and third question. Question
wording is the same.
The U.S. versus Elsewhere: Is America Exceptional?
Do you agree or disagree with the following statement? The United States is the greatest country in the history of the
world.
Agree Disagree
Jun. 2007 Fox 80% 16%
Note: Asked of registered voters.
Do you agree or disagree with the following statement? The United States is the greatest country in the world.
Agree Disagree
Jul. 2013 Fox 79% 18%
Note: Asked of registered voters.

American Enterprise Institute compilation 25
Do you believe the United States is the best country in the world to live in or is there another country that is better?
U.S. Another country
Feb. 2007 Fox 86% 7%
Feb. 2009 Fox 90 7
Note: Asked of registered voters.
Do you believe the United States is the best country in the world to live in, or not?
Yes No
Apr. 2011 Fox 84% 12%
Mar. 2015 Fox 83 14
Note: Asked of registered voters.
How much do you agree or disagree with the following statements...agree strongly, agree, neither agree nor disagree,
disagree, or disagree strongly? Generally speaking, America is a better country than most other countries.
Agree Disagree
strongly Agree Neither Disagree strongly
1996 NORC 39% 41% 12% 5% 2%
Sept. 2001 NORC 54 31 9 5 1
Dec. 2001 NORC 53 33 7 6 1
2004 NORC 40 39 14 4 1
2014 NORC 26 47 18 8 1
Note: 2004 Survey asked of half sample.
Which of the following statements best describes your opinion about the United States?
The US stands above The US is one of the greatest There are other
all other countries in countries in the world along countries that are
the world with some others better than the US
Mar. 2011 Pew 38% 53% 8%
Sep. 2011 Pew 48 42 8
Mar. 2014 Pew 28 58 12
Note: Answer format varies slightly between the two questions.
Some people say the United States has a unique character that makes it the greatest country in the world. Others say that
every country is unique, and the United States is no greater than other nations. Which view is closer to your own?
Unique character
makes the US Every country is unique,
the greatest country The US is no greater
in the world than other nations
2012 Chicago Council on Global Affairs 70% 29%
Because of the United States’ history and its Constitution, do you think the US has a unique character that makes it the
greatest country in the world, or don’t you think so?
Yes, has unique No, don’t
character think so
Dec. 2010 Gallup/USA Today 80% 18%
Partisan breakdown
Republican 91% 7%
Democrat 73 23
Independent 77 22

American Enterprise Institute compilation 26
I’m going to read a few statements: for each one, please tell me if you agree or disagree with it...Whatever its faults, the
United States still has the best system of government in the world?
Agree Disagree
Apr. 1992 ABC 85% 14%
Sep. 1994 ABC 84 13
May 1996 ABC 83 15
Dec. 2000 ABC/Wash Post 89 11
Dec. 2007^ ABC/Facebook 81 17
Sept. 2010* Kaiser/Harvard/Wash Post 77 21
Aug. 2011 Wash Post 77 21
Note: *Question wording read “Please tell me whether you agree or disagree with the following statement. Whatever its
faults, the United States still has the best system of government in the world. Do you agree or disagree?” ^ Oversample of
18–29 year olds.
Do you think the United States is losing some of its standing in the world, or not?
Yes, it is No, it isn’t
Jun. 2013 Fox 82% 15%
Jun. 2014 Fox 80 19
Note: Asked of registered voters.
How much do you agree or disagree with the following statements...agree strongly, agree, neither agree nor disagree,
disagree, or disagree strongly? The world would be a better place if people from other countries were more like
Americans.
Agree Disagree
strongly Agree Neither Disagree strongly
1996 NORC 14% 24% 33% 21% 4%
Sept. 2001 NORC 26 23 18 25 6
Dec. 2001 NORC 21 27 21 25 6
2004 NORC 16 26 34 18 6
2014 NORC 7 23 36 28 7
Note: 2004 Survey asked of a half sample.
Do you agree or disagree with the following statement: the American way of life is superior to that of any other country?
(If Agree) Do you say you agree strongly or would you agree somewhat?
Strongly Somewhat
agree agree Disagree
Jan. 1975 Yankelovich 58% 22% 20%
Jun. 1982 Yankelovich 70 20 10
Jun. 1983 NYT 57 21 17
Do you feel that the quality of life is better in America than in most other advanced industrial countries, about the same,
or do you feel that people are better off in most other advanced industrial countries than they are in the United States?
----------------------Quality of life------------------------
Better in About Better in other
America the same countries
1994 NORC 79% 15% 4%
Do you think the United States is exceptional?
Yes No Not sure
Feb. 2015 Economist/YouGov 70% 17% 14%
Note: Online survey.

American Enterprise Institute compilation 27
We’d like you to compare the United States to other industrialized countries in a few different areas. Do you think the
U.S. is the best in the world, above average, average, or below average in ____________ compared to other industrialized
countries?
Best in Above Below
the world average Average average
Its scientific achievements
Apr.–May 2009 Pew 17% 47% 26% 5%
Aug. 2014 Pew 15 39 34 9
Its military
Apr.–May 2009 Pew 42 39 13 3
Aug. 2014 Pew 39 37 15 5
Its economy
Apr.–May 2009 Pew 12 22 33 31
Aug. 2014 Pew 7 26 36 29
Science, technology, engineering, and
math education for grades K to 12
Aug. 2014 Pew 7 22 39 29
Its political system
Apr.–May 2009 Pew 19 31 29 16
Aug. 2014 Pew 12 22 32 31
Medical treatment*
Aug. 2014 Pew 17 34 29 20
Its health care*
Apr.–May 2009 Pew 15 23 32 27
Aug. 2014 Pew 9 16 32 39
Note: *Asked of a half sample.
How much do you agree or disagree with the following statements…agree strongly, agree, neither agree nor disagree,
disagree or disagree strongly? I would rather be a citizen of America than of any other country in the world.
Strongly Strongly
agree Agree Neither Disagree disagree
Feb. 1996^ NORC 70% 20% 7% 2% 1%
Sept. 2001 NORC 89 8 2 1 -
Sep.–Oct. 2001*# ISR 82 12 2 2 1
Dec. 2001 NORC 88 9 2 1 -
Mar.–Apr. 2002# ISR 65 27 4 3 1
2004^ NORC 74 15 7 2 1
2014 NORC 60 26 10 4 1
Note: *Poll conducted September 13–27, 2001. ^Asked of half sample. #Question wording read “How much would you
agree or disagree with the following statement: I would rather be a citizen of American than of any other country in the
world? Do you strongly agree, agree neither agree or disagree, disagree, or disagree strongly?”
All things being equal, would you prefer to live in the United States or would you prefer to live in some other country?
U.S. Other country
Mar. 2004 Fox 93% 5%
Jun. 2005 Fox 93 6
(Demographic breakdown, Jun. 2005, Party ID)
Democrat 89% 10%
Republican 98 1
Independent 92 6

American Enterprise Institute compilation 28
If you could be a citizen of any country in the world, which one would you choose?
U.S. Other
Feb. 2003 ORC 83% 15%
Note: Of those who answered “Other,” the top countries mentioned were Canada and Australia, both at 3 percent.
If you were free to do so, would you like to go and settle in another country?
Yes No
Mar. 1948 Gallup 3% 93%
Mar. 1949 Gallup 6 93
Feb. 1950 Gallup 5 93
Jan. 1960 Gallup 6 91
Feb. 1971 Gallup 11 86
Apr. 1972 Gallup 13 87
Dec. 1972 Gallup 11 86
Jan. 1974 Gallup 10 87
Jun. 1976 Gallup 9 89
May 1991 Gallup 9 90
Apr. 1995 Gallup 12 87
Note: *Question wording was, “Please tell me whether you strongly agree, somewhat agree, somewhat disagree, or
strongly disagree with the following statement...If I were free to do so, I would like to go and settle in another country?”
Results are combined.
If you could double your income by getting a good job in another country, would you take the job even if it meant you
would have to live away from the United States for several years?
Yes No
Jun. 1983 NYT 24% 70%
If you could improve your work or living conditions, how willing or unwilling would you be to move outside
America...very willing, fairly willing, neither willing nor unwilling, fairly unwilling, or very unwilling?
Very Fairly Fairly Very
willing willing Neither unwilling unwilling
Feb. 1996 NORC 6% 9% 11% 16% 55%
If you had the opportunity to leave the United States and permanently live in another country, would you take it?
Yes No
May 2006 Fox 17% 76%
Note: When broken down by party, 8 percent of Republicans and 24 percent of Democrats said they would leave the
United States.
Do you think that most people living in other countries would like to live in the United States if they could?
Yes No
Feb. 2007 Fox 74% 13%
Do you think that most people living in the United States would like to live somewhere else if they could?
Yes No
Feb. 2007 Fox 9% 78%
American Enterprise Institute compilation 29
September 11th Effects
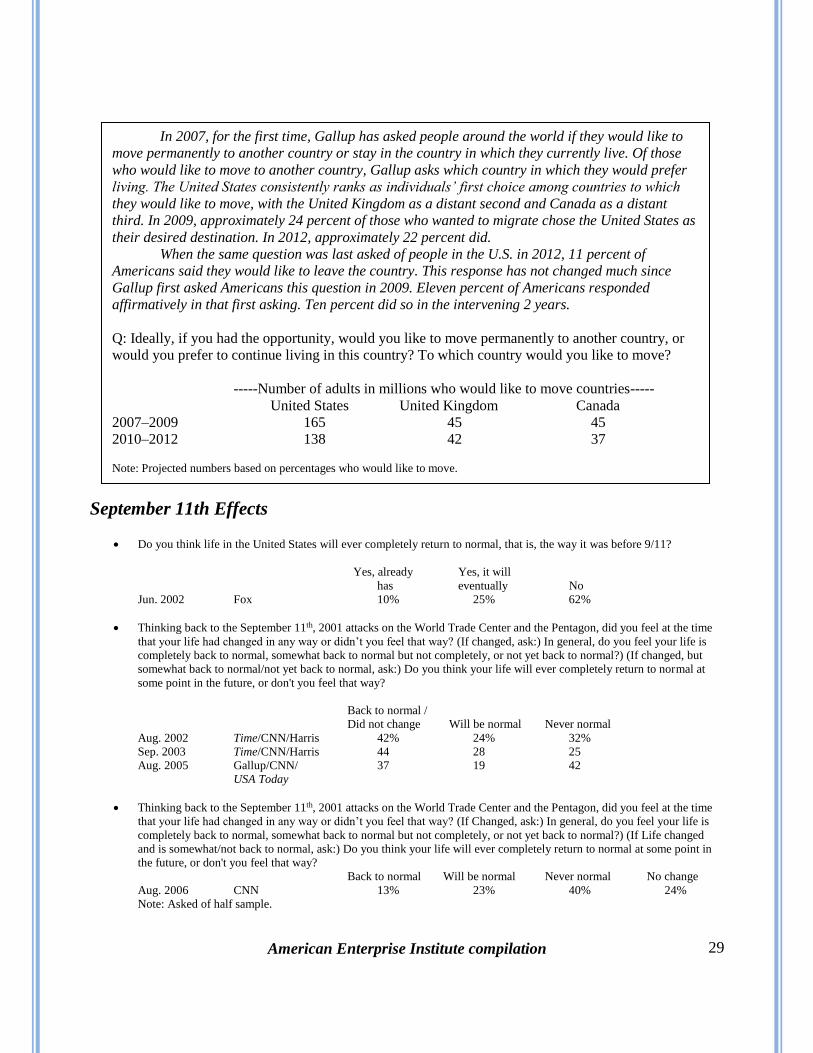
Do you think life in the United States will ever completely return to normal, that is, the way it was before 9/11?
Yes, already Yes, it will
has eventually No
Jun. 2002 Fox 10% 25% 62%
Thinking back to the September 11th, 2001 attacks on the World Trade Center and the Pentagon, did you feel at the time
that your life had changed in any way or didn’t you feel that way? (If changed, ask:) In general, do you feel your life is
completely back to normal, somewhat back to normal but not completely, or not yet back to normal?) (If changed, but
somewhat back to normal/not yet back to normal, ask:) Do you think your life will ever completely return to normal at
some point in the future, or don't you feel that way?
Back to normal /
Did not change Will be normal Never normal
Aug. 2002 Time/CNN/Harris 42% 24% 32%
Sep. 2003 Time/CNN/Harris 44 28 25
Aug. 2005 Gallup/CNN/ 37 19 42
USA Today
Thinking back to the September 11th, 2001 attacks on the World Trade Center and the Pentagon, did you feel at the time
that your life had changed in any way or didn’t you feel that way? (If Changed, ask:) In general, do you feel your life is
completely back to normal, somewhat back to normal but not completely, or not yet back to normal?) (If Life changed
and is somewhat/not back to normal, ask:) Do you think your life will ever completely return to normal at some point in
the future, or don't you feel that way?
Back to normal Will be normal Never normal No change
Aug. 2006 CNN 13% 23% 40% 24%
Note: Asked of half sample.
In 2007, for the first time, Gallup has asked people around the world if they would like to
move permanently to another country or stay in the country in which they currently live. Of those
who would like to move to another country, Gallup asks which country in which they would prefer
living. The United States consistently ranks as individuals’ first choice among countries to which
they would like to move, with the United Kingdom as a distant second and Canada as a distant
third. In 2009, approximately 24 percent of those who wanted to migrate chose the United States as
their desired destination. In 2012, approximately 22 percent did.
When the same question was last asked of people in the U.S. in 2012, 11 percent of
Americans said they would like to leave the country. This response has not changed much since
Gallup first asked Americans this question in 2009. Eleven percent of Americans responded
affirmatively in that first asking. Ten percent did so in the intervening 2 years.
Q: Ideally, if you had the opportunity, would you like to move permanently to another country, or
would you prefer to continue living in this country? To which country would you like to move?
-----Number of adults in millions who would like to move countries-----
United States United Kingdom Canada
2007–2009 165 45 45
2010–2012 138 42 37
Note: Projected numbers based on percentages who would like to move.

American Enterprise Institute compilation 30
Do you think Americans are more _______ today than they were before September 11?
Jun. 2002 Fox
Yes No
Patriotic 85% 12%
Caring 77 19
Determined 76 17
Honest 40 46
Which of the following best describes your level of patriotism after September 11? Would you say you feel much more
patriotic, somewhat more patriotic, or do you have about the same level of patriotism?
Much more Somewhat more About the
patriotic patriotic same
Jan. 2002 TIPP/IBD-CSM 36% 24% 39%
Right after September 11, many people noted increased feelings of patriotism and neighborliness. Since then do you think
those feelings have faded a little, some but not a lot, a lot but not completely, or have those feelings completely faded?
Feelings of
patriotism Some, but A lot, but not
faded a little not a lot completely Completely All (Vol.)
Mar. 2002 Fox 32% 33% 10% 2% 19%
Jun. 2002 Fox 34 37 13 1 12
Sep. 2002 Fox 34 30 10 3 19
The next questions are about the September 11th terrorist attacks on the United States. As far as you can tell, did each of
the following actually happen, or not? (If Yes) Do you think this will probably last for a long while, for only a few
months or is it already over?
Jan. 2002 Public Agenda/Pew Charitable Trusts
---------------Will last-----------------
Yes, No, did not Long Few Already
happened happen time months over
Some people thought that Americans
would appreciate their country more
in the aftermath of the terrorist attacks. 87% 12% 54% 38% 6%
Some people thought that people would
become more caring and thoughtful
toward one another as a result of the
terrorist attacks 74 24 34 46 18
Some people thought that America’s
elected officials would put politics
aside and pay more attention to what
was good for the country as a result
of the terrorist attacks 55 39 30 45 23
Please tell me whether or not you have done each of the following things in response to last week’s events. Have you
displayed an American flag?
Yes No
Sep. 2001 PSRA/Newsweek 79% 21%

American Enterprise Institute compilation 31
Within the past two weeks, have you, personally, done any of the following as a direct result of September 11th? How
about display an American flag?
Yes No
Sep. 2001* Gallup/CNN/USA Today 82% 18%
Mar. 2002 Gallup/CNN/USA Today 68 32
Sep. 2002 Gallup/CNN/USA Today 66 34
Note: * Question wording was, “As a result of the terrorist attacks this past Tuesday, have you, personally, done or plan
to do any of the following? How about...?”
In the past week have you made a special effort to display the flag?
Yes No
Sep. 2001 Fox 80% 20%
Oct. 2001 Fox 79 20
Mar. 2002 Fox 61 39
Have you purchased an American flag in the last 10 months, that is, since September 11, 2001?
Yes No
Jun. 2002 Fox 55% 45%
Since September 11th, has there been too much, too little or the right amount of showing the American flag?
Too Right Too much amount little Oct. 2001 Pew 8% 73% 17% Mar. 2002 Pew 16 66 16
Please tell me whether each of these is something you have or have not done as a result of the terrorist attacks...Sang God
Bless America?
Yes No
Sep. 2001 Harris Interactive 70% 30%
Please tell me whether each of these is something you have or have not done as a result of the terrorist attacks...Sang the
Star Spangled Banner?
Yes No
Sep. 2002 Harris Interactive 63% 37%
Since September 11, have you been more or less likely to wear red, white, and blue?
More likely Less likely Same
Oct. 2001 Fox 60% 8% 30%
Will you, personally, be doing anything this Fourth of July as a remembrance of the events of September 11th, or not?
Yes No
Jun. 2002 Gallup/CNN/USA Today 35% 60%
Thinking back, do each of the following describe or not describe your reactions in the weeks and months following the
September 11th terrorist attack? I felt more patriotic.
Yes No
Aug. 2006 Time/SRBI 68% 30%
American Enterprise Institute compilation 32
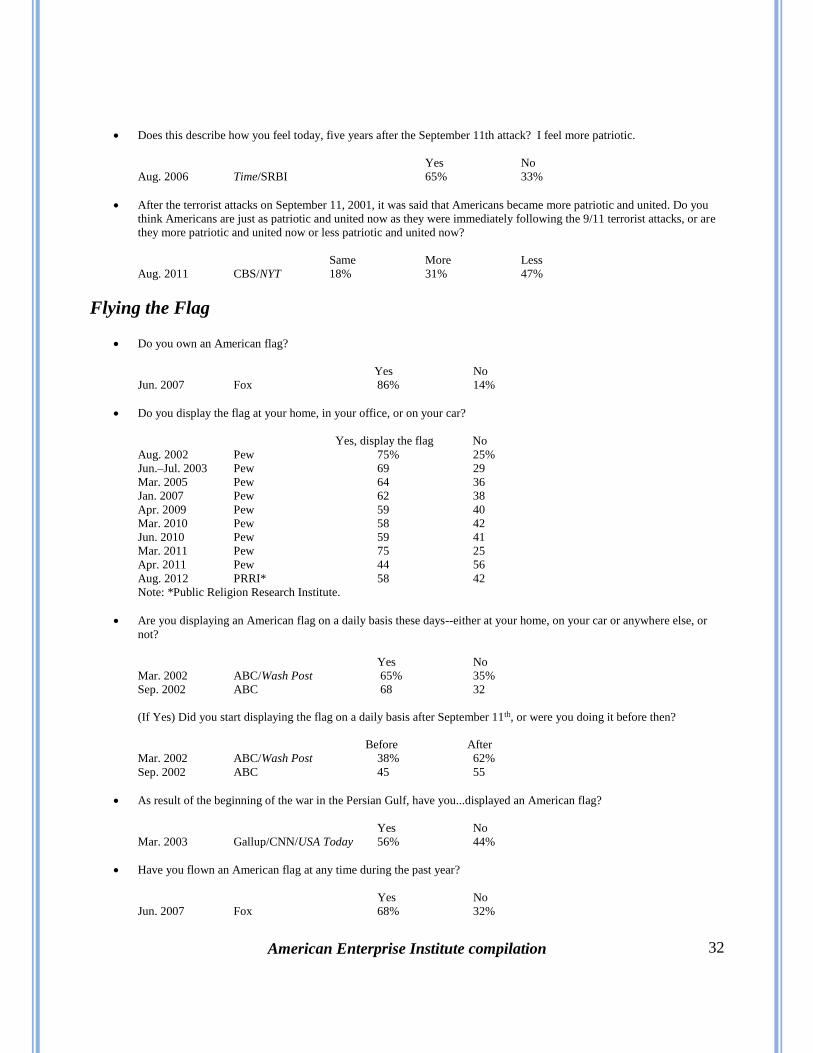
Does this describe how you feel today, five years after the September 11th attack? I feel more patriotic.
Yes No
Aug. 2006 Time/SRBI 65% 33%
After the terrorist attacks on September 11, 2001, it was said that Americans became more patriotic and united. Do you
think Americans are just as patriotic and united now as they were immediately following the 9/11 terrorist attacks, or are
they more patriotic and united now or less patriotic and united now?
Same More Less
Aug. 2011 CBS/NYT 18% 31% 47%
Flying the Flag
Do you own an American flag?
Yes No
Jun. 2007 Fox 86% 14%
Do you display the flag at your home, in your office, or on your car?
Yes, display the flag No
Aug. 2002 Pew 75% 25%
Jun.–Jul. 2003 Pew 69 29
Mar. 2005 Pew 64 36
Jan. 2007 Pew 62 38
Apr. 2009 Pew 59 40
Mar. 2010 Pew 58 42
Jun. 2010 Pew 59 41
Mar. 2011 Pew 75 25
Apr. 2011 Pew 44 56
Aug. 2012 PRRI* 58 42
Note: *Public Religion Research Institute.
Are you displaying an American flag on a daily basis these days--either at your home, on your car or anywhere else, or
not?
Yes No
Mar. 2002 ABC/Wash Post 65% 35%
Sep. 2002 ABC 68 32
(If Yes) Did you start displaying the flag on a daily basis after September 11th, or were you doing it before then?
Before After
Mar. 2002 ABC/Wash Post 38% 62%
Sep. 2002 ABC 45 55
As result of the beginning of the war in the Persian Gulf, have you...displayed an American flag?
Yes No
Mar. 2003 Gallup/CNN/USA Today 56% 44%
Have you flown an American flag at any time during the past year?
Yes No
Jun. 2007 Fox 68% 32%

American Enterprise Institute compilation 33
And again, thinking about your own community, are there a lot, some, or hardly any displays of patriotism such as flags,
bumper stickers, and signs?
A lot Some Hardly any
Aug. 2002 Pew 78% 18% 4%
Which of the following, if any, do you think you will do this Fourth of July? How about display an American flag?
Yes No
Jun.–Jul. 2001 Gallup/CNN/USA Today 66% 33%
Jun. 2002 Gallup/CNN/USA Today 83 16
May 2006 ICR 68 30
Thinking about things that some people do, please say how likely are you to engage in the following activities.
June 2013 Public Religion Research Institute
Very Somewhat Not too Not at all
likely likely likely likely
Thank a member of the military
for their service 81% 14% 2% 2%
Sing the national anthem 69 17 7 6
Display an American flag at
your home or in your car 59 22 10 9
Attend a public 4th of July
celebration this year 53 27 10 9
Make a special effort to buy
products that are made in
America, even if they cost more 50 35 10 5
Now as I read a few statements please tell me whether you completely agree, mostly agree, mostly disagree or completely
disagree with each one . . . It is important to publicly show support for you country by doing things such as displaying the
flag.
Completely Mostly Mostly Completely
agree agree disagree disagree
Jun. 2015 PRRI 52% 32% 9% 5%

American Enterprise Institute compilation 34
Does someone actually have to do something to be patriotic--or is it enough to love your country?
Do something Enough
Jun. 1983 NYT 33% 61%
Nov. 1983 NYT 34 59
Here are some things that people think of as patriotic. Other people think that patriotism really doesn’t have much to do
with these things. What do you think? Is _______ a sign of patriotism, or doesn’t patriotism have much to do with it?
Sign of Not a sign
patriotism of patriotism
Voting
Jun. 1983 NYT 83% 14%
Nov. 1983 NYT 81 16
Serving in the armed forces
Jun. 1983 NYT 72% 21%
Nov. 1983 NYT 63 31
Doing jury duty
Jun. 1983 NYT 67% 28%
Nov. 1983 NYT 63 31
Joining in the singing of the Star Spangled Banner
Jun. 1983 NYT 77% 19%
Paying taxes honestly
Jun. 1983 NYT 61% 33%
Working in the Peace Corps
Jun. 1983 NYT 55% 34%
Buying only American products
Jun. 1983 NYT 52% 43%
Working in a political campaign
Jun. 1983 NYT 49% 44%
WHAT DOES IT MEAN TO BE A PATRIOT?: Pollsters don’t often ask people what
it means to be a patriot. Around 60 percent told New York Times interviewers in 1983 that it was
enough to love your country to be patriotic. A third said you needed to “do something.” More than
seven in ten said serving in the military was a demonstration of patriotism.
In August 2008, Greenberg Quinlan Rosner Research asked how patriotic several activities
were. Voting (78 percent), saying the Pledge of Allegiance (70 percent), working hard at your job (62
percent), volunteering in your community (61 percent) and paying your fair share of taxes (61 percent)
ranked at the top as very patriotic activities. Accepting what government officials say without
questioning ranked last, with only 11 percent saying it was very patriotic.
In June 2014, Fox News asked whether various activities were acts of patriotism. Ninety-four
percent considered flying the American flag an act of patriotism, the most of any activity. Ninety-three
percent said voting in elections was an act of patriotism, and 90 percent said joining the military was
an act of patriotism.
A few other pollsters have explored obligations of citizenship, and their data are reproduced
below.

American Enterprise Institute compilation 35
_________: Please tell me if you consider it an act of patriotism, or not?
Fox News
Yes No
Flying an American flag
Jun. 2014 94% 6%
Voting in elections
Apr. 2002 80 15
Jun. 2014 93 7
Joining the military
Jun. 2014 90 9
Serving on a jury
Jun. 2014 83 16
Staying informed on the news
Jun. 2014 79 20
Paying taxes
Apr. 2002 67 26
Jun. 2014 78 20
Volunteering on a political campaign
Jun. 2014 70 28
Participating in a political protest
Jun. 2014 61 34
Owning a gun
Jun. 2014 50 47
Note: Asked of registered voters.
We all know that Americans have certain rights, such as the right to free speech and to a free public education. Now I’d
like you to consider what obligations or responsibilities, if any, we have towards others. For each of the following, do
you feel it is an absolutely essential obligation for us as Americans, a very important obligation, or is entirely a matter of
personal preference...?
Jan.–Apr. 1996 Gallup/UVA
Absolutely Very Somewhat Personal
essential important important preference
Treating all people equally regardless of
race or ethnic background 57% 33% 6% 4%
Reporting a crime that one has witnessed 54 36 7 4
Taking action to help if you hear someone
screaming or see them being attacked 54 34 7 6
Being able to speak and understand English 53 33 11 4
Voting in elections 53 29 9 9
Working to reduce inequality and injustice 41 42 12 6
Being civil with others with whom we
disagree 35 45 14 6
Keeping fully informed about news and
public issues 30 42 19 10
Donating blood or organs to help with
medical needs 20 37 18 26
Volunteering time to community service 16 42 26 16

American Enterprise Institute compilation 36
Do you feel the following is a very important obligation, a somewhat important obligation, or not an obligation that a
citizen owes to the country...?
Feb. 1999 Penn/Schoen/Berland (D)
Very Somewhat Not an
important important obligation
Reporting a crime you may have witnessed 90% 7% 2%
Attending parent teacher conferences 89 9 2
Voting in elections 87 10 3
Being able to speak and understand English 85 12 3
Serving in the military if drafted 76 13 10
Keeping fully informed about news and public issues 73 24 2
Serving on a jury if called 73 23 3
Contributing to help the less fortunate 71 22 6
Protesting unjust public policies 61 22 12
Participating in “Town Hall” community decision
making meetings 59 31 7
Participating in neighborhood organizations 56 38 5
Volunteering some time to community services 55 40 3
Volunteering for the military 48 35 16
Patriotism means many things to many people. I am going to read a number of activities that some people believe are
important parts of patriotism. For each activity, I would like you to say if you agree or disagree that the activity is an
“important part of patriotism.” How about...?
Jan. 2002 Gallup/Harwood
Agree Disagree
Voting 97% 3%
Volunteering in the community 89 11
Displaying an American flag 86 14
Working for the common good, even when it runs
counter to one’s immediate self-interests 85 13
Engaging in conversations with other people about
important political issues our nation faces 84 15
Raising one’s voice in opposition to prevailing public
opinion in times of national crisis if one believes
core democratic values at stake 83 16
Donating money to a community organization that helps
those in need 82 17
Questioning the decisions of our nation’s leaders, even
when they are trying to rally the country 77 21
Demonstrating on behalf of a cause one believes in
strongly even when the cause is unpopular 75 24
Attending a parade celebrating America 74 26

American Enterprise Institute compilation 37
Now I’m going to read you some things people do in America. For each one, please rate how patriotic a thing it is with
one hundred meaning that thing is very patriotic, zero meaning very unpatriotic, and fifty meaning neither very patriotic
or very unpatriotic. You can use any number from zero to one hundred, the higher the number the more patriotic you
think that thing is. If you have no opinion please say so…
Aug. 2008 Greenberg Quinlan Rosner Research
Very Somewhat Neutral Somewhat Very
patriotic patriotic (50) unpatriotic unpatriotic
(76-100) (51-75) (26-49) (0-25)
Voting 78% 8% 7% 2% 3%
Saying the Pledge of Allegiance 70 12 11 2 4
Working hard at your job 62 16 12 1 5
Volunteering in your community 61 20 10 1 4
Paying your fair share of taxes 61 13 15 2 6
Wearing an American flag pin 46 19 18 2 11
Prayer 42 7 22 2 18
Protesting bad government decisions 38 22 17 6 11
Agreeing with the president in a time
of war, no matter what 22 14 27 6 27
Accepting what government officials
say without questioning it 11 12 20 9 43
Note: Survey conducted of a half sample.
Is it possible for someone to do the following things and still be considered patriotic?
Economist/YouGov
Yes No
Refuse to serve in a war that they oppose
Jul. 2009 56% 44%
Jun. 2011 59 41
Disobey a law that they think is immoral
Jul. 2009 62% 38%
Jun. 2011 62 38
Criticize our leaders to foreigners
Jun. 2009 53% 47%
Jul. 2011 55 45
Refuse to pay taxes
Jun. 2009 44% 56%
Jul. 2011 36 64
Burn an American flag in protest
Jul. 2009 22% 78%
Jun. 2011 20 80
Jun. 2013 18 71
Some people say the following things are important for being truly American. Others say they are not important. How
important do you think each of the following is...to respect America’s political institutions and laws...very important,
fairly important, not very important or not important at all?
Very Fairly Not very Not important
important important important at all
1996 NORC 63% 28% 5% 2%
2004 NORC 74 23 2 1
2014 NORC 65 29 4 3
Note: 2004 Survey asked of half sample.

American Enterprise Institute compilation 38
Do you think that Americans should support this county in wartime even if they believe that its actions are wrong?
Yes No
Jun. 1983 NYT 70% 23%
Nov. 1983 NYT 72 21
Do you think someone can be patriotic if they don’t support the Iraq war?
Yes No
Mar. 2006 CBS 83% 12%
Do you believe it is unpatriotic to protest any actions the U.S. may take in response to the terrorist attacks, or not?
Not unpatriotic Unpatriotic
Sep. 2001 Gallup/CNN/USA Today 50% 47%
Do you think the Americans who are protesting against the war are acting unpatriotic during a time of national crisis, or
acting appropriately by expressing their opinions?
Expressing Acting
opinions unpatriotically
Oct. 2001 Fox 59% 33%
How much do you agree or disagree with the following statements...agree strongly, agree, neither agree nor disagree,
disagree, or disagree strongly? People should support their country even if the country is in the wrong?
Agree Disagree
strongly Agree Neither Disagree strongly
1996 NORC 11% 21% 18% 37% 11%
2004 NORC 12 24 22 31 9
2014 NORC 8 23 23 37 9

American Enterprise Institute compilation 39
Now I’m going to read you some different goals that young people might have. Using a scale from 1 to 10, please rate
each one in terms of its importance to you personally. If a particular goal is “extremely important” to you pick a number
closer to 10. If it has average importance, pick a number around 5 or 6. And if a particular goal is not really important to
you pick a number closer to 1. You can select any number between 1 and 10, depending on how strongly you feel. Here
is the first one–being a good American who cares about the good of the country?
---------------Asked of persons 15 to 24 years of age-----------------
1-2 3-4 5-6 7-8 9-10
Nov. 1998 Tarrance/ Lake-Snell/NASS 2% 3% 15% 37% 43%
And using the same scale, with 1 meaning not important at all, and 10 being the most important thing in your life–how
important is being an American to you personally?
------------------Asked of persons 15 to 24 years of age-----------------
1-2 3-4 5-6 7-8 9-10
Nov. 1998 Tarrance/ Lake-Snell/NASS 3% 2% 9% 25% 62%
When it comes to your feelings about being an American, do you consider yourself very patriotic, somewhat patriotic, not
very patriotic, or not at all patriotic?
--------------Asked of college undergraduates, 2001–2004-------------
----------------Asked of persons 18 to 24 years old, 2008---------------
Very Somewhat Not very Not at
patriotic patriotic patriotic all
Oct. 2001 Harvard IOP 48% 44% 6% 1% Oct. 2002 Harvard IOP 33 57 8 2
Apr. 2003 Harvard IOP 43 49 7 1
Oct. 2003 Harvard IOP 39 50 9 2
Mar. 2004 Harvard IOP 32 55 10 2
Oct. 2004 Harvard IOP 39 49 9 2
Oct. 2008 Harvard IOP 33 45 17 5
Note: IOP stands for Institute of Politics.
How patriotic are you? Would you say...extremely patriotic, very patriotic, somewhat patriotic, or not especially
patriotic?
-------------------Asked of persons 18 to 29 years old---------------------
Extremely Very Somewhat Not especially
patriotic patriotic patriotic patriotic
Aug. 2002 Wash Post/Kaiser/Harvard 18% 33% 36% 11%
Jun. 2005 Gallup/CNN/USA Today 21 41 27 12
Note: Among those in the 30–49 age bracket, 71 percent said they were “extremely” or “very” patriotic; in the 50–64
age breakdown, 79 percent said they were “extremely” or “very” patriotic; in the 65+ age bracket, 76 percent said they
were “extremely” or “very” patriotic.
ATTITUDES OF YOUNG PEOPLE: In his book Surprise, Security, and the American
Experience, historian John Lewis Gaddis relates a story about a classroom experience after 9/11.
“Would it be OK now for us to be patriotic?” a student asked the professor. Gaddis replied, “Yes, I
think it would.” Although we don’t have available to us historical data on college students’ patriotism,
a near majority of them (48 percent) in a poll taken soon after 9/11 described themselves as very
patriotic and another 44 percent as somewhat patriotic. In October 2008, those responses were 33 and
45 percent, respectively.
Young people, like their elders, are not enthusiastic about reinstating the draft, although they
seem receptive to other forms of community and national service. (See the authors for additional data on
this point.)

American Enterprise Institute compilation 40
Which of the following do you most agree with...Being a good citizen means having some special obligations or being a
good citizens simply means being a good person?
-----Asked of college undergraduates----
Special Good
obligations person
Apr. 2003 Harvard IOP 52% 46%
In your opinion, which of the following is the most important kind of activity a citizen can engage in?
Jan. 2002 CIRCLE
------15-25 year olds-----
Getting involved in politics and government 12%
Participating in national organizations trying to change our society 23
Volunteering in local community activities to address local problems 49
Not sure 11
Note: CIRCLE stands for Center for Information and Research on Civic Learning and Engagement. CIRCLE studies
youth civic and political participation and produces an Annual Youth Survey.
Now I am going to read you some things people have suggested to focus more on citizenship and do more for their
community and country. For each suggestion, please tell me whether you favor or oppose it.
Jan. 2002 CIRCLE
------15–25 year olds-----
Favor Oppose
Requiring all graduating high school students to complete a
certain amount of community service to receive their diploma 43% 55%
Instituting a new kind of draft that gives people the choice between
civilian or military service 61 30
Making classes on civics and government a requirement for high school graduation 66 31
Offering every young person a chance to do a full year of national or community
service and earn money toward college or advanced training 81 17
Would you favor or oppose requiring all young men/women to give one year of service to the nation, either in the military
services or in non-military work here or abroad, such as work in hospitals or with elderly people?
-----------Asked of persons 13 to 17 years old---------
Young men Young women
favor favor
1977 Gallup 47% 38%
1984 Gallup 62 51
1986 Gallup 62 56
1989 Gallup 49 44
1992 Gallup 52 47
Would you favor or oppose requiring all young Americans to give one year of service to the nation, either in the military
services or in non-military work here or abroad, such as work in hospitals or with elderly people?
-------Asked of persons 13 to 17 years old-------
Favor
2000 Gallup 51%
2004* Gallup 42
Note: * Question wording was “Would you favor or oppose requiring all men and women to give one year of service
to the nation, either in the military or in non-military work, such as work in hospitals or with elderly people?”

American Enterprise Institute compilation 41
Do you strongly support, somewhat support, somewhat oppose, or strongly oppose a national law that would require one
year of national service from all young Americans, with the option of either military or non-military service?
------------------------Asked of college undergraduates----------------------
Strongly Somewhat Somewhat Strongly
support support oppose oppose
Apr. 2003 Harvard IOP 10% 21% 23% 45%
Many pollsters in the United States regularly supply us with their data. This report could not have been
done without their assistance, and we thank them for it. The data in this report come from the archive of
public opinion polls at the American Enterprise Institute and from the Roper Center archive in Storrs,
Connecticut. The Roper Center is the oldest and largest archive of public opinion data in the world. To
learn more about the Roper Center, visit http://roperweb.ropercenter.uconn.edu
For comments or questions
contact Karlyn Bowman at [email protected] or Eleanor O’Neil at [email protected].
Compiled by Karlyn Bowman (Senior Fellow)
Heather Sims (Research Assistant) and
Eleanor O’Neil (Research Assistant)