aee working paper - chiang mai universityagecon-extens.agri.cmu.ac.th/article/jn0lw9p7.pdf · aee...
TRANSCRIPT

1
AEE Working Paper
No 1/2555
Spatial Market Integration of Cassava
Market and Causal Relationship in
Thailand
By Aree Wiboonpongse, Aumpha Peamthongkum and Yaovarate Chaovanapoonphol
January 2012
Department of Agricultural Economics and Agricultural Extension (CMU)
JEL classification: C33, D40, O13, Q13
Keywords: spatial market integration, law of one price, directed acyclic graph, market efficiency,
Keywords: cassava

2
Spatial Market Integration of Cassava Market and Causal Relationship in Thailand
Aree Wiboonpongse Department of Agricultural Economics and Agricultural Extension
Faculty of Agriculture Chiangmai University Chiangmai 50200, Thailand
Email: [email protected]
Aumpha Peamthongkum Highland Research and Development Institute (Public Organization)
Chiangmai 50200, Thailand Email: [email protected]
Yaovarate Chaovanapoonphol
Department of Agricultural Economics and Agricultural Extension Faculty of Agriculture Chiangmai University
Chiangmai 50200, Thailand Email: [email protected]

3
Spatial Market Integration of Cassava Market and Causal Relationship in Thailand Abstract This paper investigated cassava marketing efficiency via spatial market integration using directed acyclic graph (DAG) with Johansen multivariate cointegration procedure to test the law of one price (LOP) for regional cassava markets in Thailand. The empirical evidence indicates that the LOP is satisfied by only some markets even though most cassava markets in the seven provinces are integrated. Results of DAG indicated that the largest production province implying largest market played dominant roles in price transmission. Cassava markets that share the same provincial borders exhibited a significantly higher degree of price linkages in the long run due to cost advantages. The recent growth in production and thus high market concentration evidently worsened market integration. This calls for effective measures for information dissemination and promotion of investment and competition in large production areas. Keywords: spatial market integration, law of one price, directed acyclic graph, market efficiency, cassava.

4
1. Introduction Thailand has been the largest cassava exporting country, with a 70% share of export
quantities for many years. Despite of price instability in the past two decades, and frequent losses incurred to growers, cassava production and export are expected to grow continuously. The problem of price instability called for intervention policies such as pledging policy, and export quotas to cope with price volatility. Theoretically, intervention policies distort market mechanism and thus induces market inefficiency which essentially affect for resources allocation. Studies of market efficiency in the context of price efficiency are common. Researchers adopt the frame work of price transmission along a supply chain and concern with function of agents in each market level as information processors, for example, Vavra and Goodwin (2005); Zhou and Buongiorno (2005); Serra and Goodwin (2003). Another framework in the context of market integration, emphasizing on the spatial dimension and often used to assess effects of price intervention on price and farmers’ income as well as the influence on market efficiency, such as in Ravallion (1986); McNew (1996); Onyuma et al. (2006); Asche et al. (2004); Lohano and Mari (2006) etc. The underlying theory of these frame works is “law of one price” (LOP). Among others, Ardeni (1989); Yang et al. (2000); and Nanang (2000); Liu and Wang (2003) test price efficiency in the context of spatial market integration based on the LOP. If market integration does not exist, these policies are potentially effective, since price levels may respond accordingly. On the contrary, such policies are ineffective if market integration is strong because price levels can be affected marginally. Empirical evidences in Thailand show that the pledging programs could not effectively raise prices of cassava and rice (Pongpoorsakorn, et al. , 2000; Sriboonchitta, 2000).
Spatial (horizontal) market integration studies of Thailand was found in various agricultural product such as pig (Lapboonruang, 2004), rice (Trakulphonnimit, 2002), banana (Visansirikul, 2003), fruit (Issariyathip, 2002), feed corn (Kuntum, 2003), and palm (Kaewchuey, 2007) etc., but not in cassava. Previous studies on cassava market in Thailand focused on price transmission along supply chain of various cassava products include Sittikul (1997); Sanguanchur (2002); Apihakit (2004); Poomprasert (2005) and Punkla (2008). These studies employed cointegration approach based on Engle and Granger framework with Granger causality. To our knowledge, this study is the first attempt to test for spatial market integration of cassava in Thailand. In recent studies, the measurement of pricing efficiency in agricultural commodity markets has overcome methodological flaws due to spurious relationship and heteroscedasticity

5
residuals in the regression. For example, Ravallion (1986) proposed a dynamic model of spatial price differentials, Timmer (1987), suggested the index of market connection (IMC) which based on Ravallion’s model and other approaches, such as Switching Regime Model (Fackler, 1996). A growing body of the spatial market integration literature has emphasized the importance of transfer cost, such that the Parity Bounds Model (PBM) developed by Sexton et al. (1991) and Baulch (1997) explicitly take into account of the non-linear price relationship in spatially distributed markets that is caused by transfer cost.
Most recently researchers use the cointegration approach as the empirical method for investigating a long run equilibrium relationship. If two spatially separated price series are cointegrated, there is a tendency for them to co-move in the long run according to a linear relationship. In the short run, the prices may deviate, as shocks in one market may not be instantaneously transmitted to other markets or due to delays in shipping, however, regional trading opportunities ensure that these divergences from the underlying long run relationship are transitory and not permanent (Rapsomanikis et al. 2003). The recent research works are based on Engle and Granger (1987) method of cointegration, for example, Alexander and Wyeth et al. (1991). Although the Engle and Granger (1987) procedure is easily implemented, it does have several important defectives i.e. the procedure is sensitive to the choice of the variable selected for normalization and this problem is obviously compounded when using three or more variables since any of variables can be selected as an endogenous variable. If there may be more than one cointegrating vector, this method has no systematic procedure for the separate estimation of the multiple cointegrating vectors including other defectives (Enders, 2004: pp.370-372). The Johansen and Juselius (1990) maximum likelihood estimator overcomes the use of two step estimators of Engle and Granger (1987) and can test for the presence of multiple cointegrating vectors. Furthermore, this test allows the researcher to test restricted versions of cointegrating vectors, speed of adjustment parameters and it is possible to verify a theory by testing restrictions on the magnitudes of the estimated coefficients (Enders, 2004). Alternatively, the directed acyclic graph (DAG), a data-determining approach has been adopted to identify directional relationship among markets (Bessler et al. 2003; Awokuse, 2007) This study investigated cassava spatial market integration using DAG with Johansen multivariate cointegration procedure to test the law of one price (LOP) for seven provincial markets of 3 regions of major producing cassava markets. The rest of the paper is organized as follows: next 2 sections describe conceptual framework and description of the data and back ground, sections 4 and 5 report the empirical results and conclusions and implications.

6
2. Conceptual framework Market efficiency has been very popular in both theoretical and empirical research. Market efficiency can be considered in the context of either operational efficiency or price efficiency. For the latter, the approach that uses market integration to measure market efficiency is based on the concept by Bessler and King (1970) that an efficient commodity market will establish prices that are interrelated spatially by transaction cost, intertemporally by storage costs and in terms of form by processing cost. In spatially integrated markets, competition among arbitragers will ensure that a unique equilibrium is achieved where local prices in regional markets differ by no more than transfer cost. Information of spatial market integration, thus, provides indication of competitiveness, the effectiveness of arbitrage, and the efficiency of pricing. In theory, markets are said inefficient if profitable arbitrage opportunities persist. Thus, spatial price determination models suggest that, if two markets are linked by trade in a free market regime, excess demand or supply shocks in one market will have and equal impact on price in both markets and thus these prices move up and down together. This is called the law of one price, it has been the basic for test of market efficiency and market integration (Tomek with Robinson, 2003: 168; Rapsomanikis et al. 2003). Factors that prevent the existence of efficient agricultural markets or decrease market integration degree are poor infrastructure, intervention policies, non-competitive behavior of traders (oligopoly and collusion), and high transfer cost and marketing margin. (Rapsomanikis et al. 2003; He, 2003; Onyuma et al. 2006). Spatial market integration could be investigated via the transmission of price shocks from one regional market to other horizontally related markets. There are three forms in which the efficient market hypothesis is stated: weak form, semi-strong form and strong form. The weak form of the LOP of market efficiency is more commonly observed in the real world than the strong form. This concept for spatial arbitrage relationship between regions X and Y shown in eq.(1), represents the strong form if 02 == βα and represents the weak form when this restriction is removed. The parameter 11 =β indicates perfect transmission of a price change in one market to the second market for both forms. tttt eZPyPx +β+β+α= 21 (1)
where Pxt and Pyt are prices for homogenous goods at time t in markets X and Y, α is transfer costs between markets X and Y and Zt denotes non-stochastic factors. Most of recent works employ cointegration modeling to capture long run price relationship and to avoid problem of spurious relationship due to nonstationarity of prices series (Bessler et al., 2003; Awokuse, 2007). This study adopted the approach outlined by Awokuse (2007) and Bessler et

7
al. (2003) for investigating spatial market integration and causal analysis with directed acyclic graphs (DAG).
To investigate market integration as modeled in equation (1) the procedure of this study takes 5 steps as follow: 1) test for structural change using recursive residual developed by Brown et al. (1975) and Chow test 2) test for seasonal unit roots for each series, using procedure developed by Beaulieu and Miron (1993) under structural change 3) test for Johansen’s multivariate cointegration 4) conduct innovation accounting analysis (impulse response function and forecast error variance decomposition) and 5) investigate of causal relationships among seven markets using directed acyclic graph (DAG). The analysis process in step 1) to 5) employ Eviews 6, and causality test by DAG, uses Tetrad IV. All of variables are in logarithms. It is hypothesized that relative to other markets, contiguous cassava producing provinces engaged in arbitrage should exhibit a higher degree of market integration due to effect of relative lower transportation costs, and better access to information. Econometric formulation for essential tests for Johansen’s cointegration and DAG procedure are briefly presented below.
2.1 Johansen’s cointegration test The main advantage of the Johansen approach in testing for market integration and the law of one price (LOP) is that it allows hypothesis testing on the coefficients of both α and β using likelihood ratio test. The Johansen cointegration test is based on a vector autoregression (VAR) system. Given a price vector Pt, VAR is carried out using eq. (2) and short term adjustment be written in vector error correction form (VEC) as eq. (3) tktkttt PAPAPAP ε++++= −−− ...2211 (2)
ttit
k
iit PPP ε+Π+Δ∑Γ+μ=Δ −−
−
=1
1
1, t = 1,…, T (3)
where ⎥⎦⎤
⎢⎣⎡ ∑−−=Γ
=
i
jjAI
1 and ⎥⎦
⎤⎢⎣⎡ ∑−−=Π
=
k
iiAI
1
tP is (nxn) column vector of m variables, μ is an (nx1) vector of constant terms, Γ and Π represent coefficient matrices, Δ is a difference operator, k denotes the lag length, and
tε is independently and identically distributed (i.i.d.). The coefficient matrix Π is known as the impact matrix, and it contains information about the long run relationships. The following three relevant hypotheses are rank test for number of cointegrating vectors, test of LOP for perfect market and test for weak version of LOP of eq.(1).

8
1) Cointegration rank (r) test Rank of Π , r determines the number of stationary linear combinations of Pt, There are three possibilities: (1) if r = n, the price variables are stationary in level, (2) if r = 0, there exists no linear combination of Pt that are stationary, and (3) 0< r <n, there exists r stationary linear combinations of Pt. A rank of r = n -1 in a multivariate system with n price series would imply that there is only one stochastic trend driving the behavior of prices in the system. Cointegration rank test under hypothesis ':0 αβ=ΠH . There are two alternative tests that used to identify the number of significant cointegrating vector r, the trace test )( traceλ and maximum eigenvalue test )( maxλ as in eq.(4) and (5).
)1ln(Tn
1riTrace λ−Σ−=λ
+=
) (4)
Trace test )( traceλ hypothesis is H0: cointegration vector ≤ r Ha: cointegration vector ≥ r )1ln(Tmax λ−−=λ
) (5)
Maximum eigenvalue test )( maxλ hypothesis is H0: cointegration vector = r Ha: cointegration vector = r+1 2) Test of the law of one price (LOP) Testing for the law of one price (LOP), restrictions 'R can be placed and tested on the parameters in the β matrix under hypothesis 0'R:H0 =β . If rank of the multivariate system is n-1, the LOP test becomes a test of whether the row in the β matrix sum to zero. The hypothesis that the LOP holds for all prices simultaneously is determined by the rank of the system. If r = n (full rank), then the LOP holds for all prices simultaneously. If r < n, then the LOP is rejected for all prices simultaneously, in which case, the second testable hypothesis is that the LOP holds between any two prices (Nanang, 2000) 3) Weak exogeneity test Adjustment parameters are related to the concept of weak exogeneity. If all adjustment parameters for one variable are zero, then this variable is said to be weakly exogenous to the long run parameters in the remaining equations. This implies that the coefficients on the levels of the remaining price series in the system is zero in this particular equation which would mean other price variables are not influencing this variable in the long run. The null hypothesis is that each variable does not respond to shock or disequilibrium in the long run relationship ( 0':H0 =αβ ), the ith row of the Π matrix is zero. That is the ith row of α has its element equal to zero. (Bessler et al., 2003)

9
2.2 Directed acyclic graph (DAG) The majority of past investigations of causal relationships among economic variables use the Granger causality framework that builds on the knowledge that a cause precedes its associated effect thus an effect does not precede its cause. Recently, Spirtes et al. (2000) and Pearl (2000) proposed DAG, which based on a non-time sequence asymmetry in causal relations. DAG represents a conditional independence relationship (for details application of DAG to VAR see Awokuse and Bessler, 2003) as given by the recursive decomposition as eq. (6) Awokuse et al. (2009)
( ) ( )ii
n
in paνΠ=νννν
=Pr,...,,,Pr
1321 (6)
where Pr(.) is the joint probability of variables n321 ,...,,, νννν and pai represents some subsets of the variables that precede (come before in a causal sense) iν in order ( n321 ,...,,, νννν ). DAG employed PC algorithms, that proceeds step wise testing. The process of causal determination begins with a complete undirected graph which shows an undirected edge between variables in the system, then remove edges between variables and the assign causal flows on the remaining edges. Fisher’s z is used to test whether conditional correlations are significantly different from zero, Fisher’s z show as eq. (7) (Bessler, 2004).
[ ] ,)kj,i(1)kj,i(1
ln3kn21n),kj,i(z
⎭⎬⎫
⎩⎨⎧
ρ−ρ+
⎥⎦⎤
⎢⎣⎡ −−=ρ (7)
where n is the number of observations used to estimate the correlations, ),( kjiρ is the population correlation between series i and j conditional on series k (removing the influence of series k on each i and j), and k is the number of variables in k. If i, j, and k are normally distribution of [ ] [ ]nkjirznkjiz ),,(),,( −ρ is standard normal.
MIM, Tetrad and WinMine are alternative software for DAG estimation to identify the causal flow among the variables. Although each package uses a different algorithm, the results are to some extent similar. All three packages are free and easy to use (Haughton, et al., 2006). This study use Tetrad IV which located on the internet at www.phil.cmu.edu/projects/tetrad/ 3. Data and Background The data used for analysis are monthly farm prices during January 1989 - March 2009 obtained from Office of Agricultural Economics (OEA), Ministry of Agriculture and Agricultural Cooperatives (MAAC). Prices were deflated by CPI to reflect real price received by growers. Seven provinces were selected to represent major markets of 3 regions (northeast, east and west) on the basis of their production areas and availability of data. Nakronrachasima (Nak),

10
Chaiyapoom (Cha) and Konkhaen (Kon), are 3 top rank of the northeastern region which rank 1, 3 and 12 of the country. Nak is apparently the largest market both for cassava and processed products of the whole kingdom. Chacheongsao (Cha), Chonburi (Cho) and Rayong (Ray) rank 5, 7 and 10 of the country production representing the eastern region and Kanchanaburi (Kan) represents central-western region as it holds the sixth largest production of the country. The average market absorption of cassava drying place-merchants (merchants who own drying compound and transform cassava to dry chips) ranged from 7,028 rai (1acre=6.25 rai) of production area in Cha to 30,580 rai in Ray. These capacities of absorption can somewhat reflect the local competition in individual provinces. Apparently merchants in Nak are relatively large (absorption capacity = 22,482 rai) and likely to have higher market power. The overall picture of cassava prices in 7 provinces seems to move in concert to each other (Figure 1). However, the average prices, maximum and minimum prices of Nak appeared to lay above all others while all price statistics of Kan were found the least.
“Insert Table I Here”. Historically, cassava was used almost entirely for feed. Only in the past 3 years (2008)
when all economies faced with high visa in oil price, cassava has been shared for bio fuel production. Cassava as raw material for feed still has dominated the total demand since Europe was Thailand’s largest market during 1980’s and 1990’s. Due to the Common Agricultural Policy (CAP policy) and CAP reform (1992), European’s demand for pellets drastically declined and obviously affected prices paid to cassava growers. To reduce risk and restore volume of export, Thailand export markets have been diverted. As the consequent, China recently became the largest market for chip. The Thai-China free trade agreement (October 2003) boosted export of chips which compensated for decline of pellets export to other market). Furthermore, domestic demand for cassava in biofuel has gradually expanded in 2008 . Despite of positive trend in market demand, cassava prices after 1998 on average were relatively lower than the past (Figure 1). As being a major cash crop, frequent market intervention policies were implemented for export expansion and presentation of price falls. More specifically, the pledging policy was employed to reduce price volatility and to maintain desirable farm price levels. In contrast to the past, the most recent income guarantee program (2009) has allowed market mechanism to operate freely while the certain level of farm income has been ensured. Although previous research did not confirm the success of price intervention programs, we employ test for structural change to ensure the presence of a single pattern of

11
price series. The recursive residual test procedure for structural break suggested by Brown et al. (1975) was applied to the price series of Nak (the largest market).
The null hypothesis of no structural change was rejected at .05 and this result was confirmed by Chow test. The existence of structural break appears around January 2003. Hereafter, all prices analyses are applied to 2 sub periods (i.e. 1989: 01 – 2002: 12 and 2003: 01-2009: 06). Before moving to the next section, we applied Beaulieu and Miron (1993) procedure at the known break points. The results indicate existence of non-stationary in all seven series in both sub periods. Thus the seasonal differencing filter is applied to the series.
Figure 1

12
4. Empirical Result
Johansen cointegration test and the LOP test The results of standard rank tests using traceλ (and maxλ ) reveal 6 (and 2) cointegration vectors in sub period 1 and only vector normalized by Ray was selected for further analysis (based on AIC and SIC criteria). For sub period 2, both traceλ and
maxλ indicate existence of only one stable long run equilibrium relation in the series. For sub period 1, the estimation results of cointegrating vector (β ) and adjustment
parameter (α ) after normalization for each period are shown (in Table II) that 4 markets (Kan, Cho, Cha, Nak) determine price in Ray and having long term relationship. As implied by sβ , (0.23 to 1.00) the market exhibit poor to high degree of integration. In sub period 2, most markets are moderately integrated ( sβ range from 0.35 to 0.7). Surprisingly Nak, the largest market did not determine the price in Ray as did in the sub period 1.
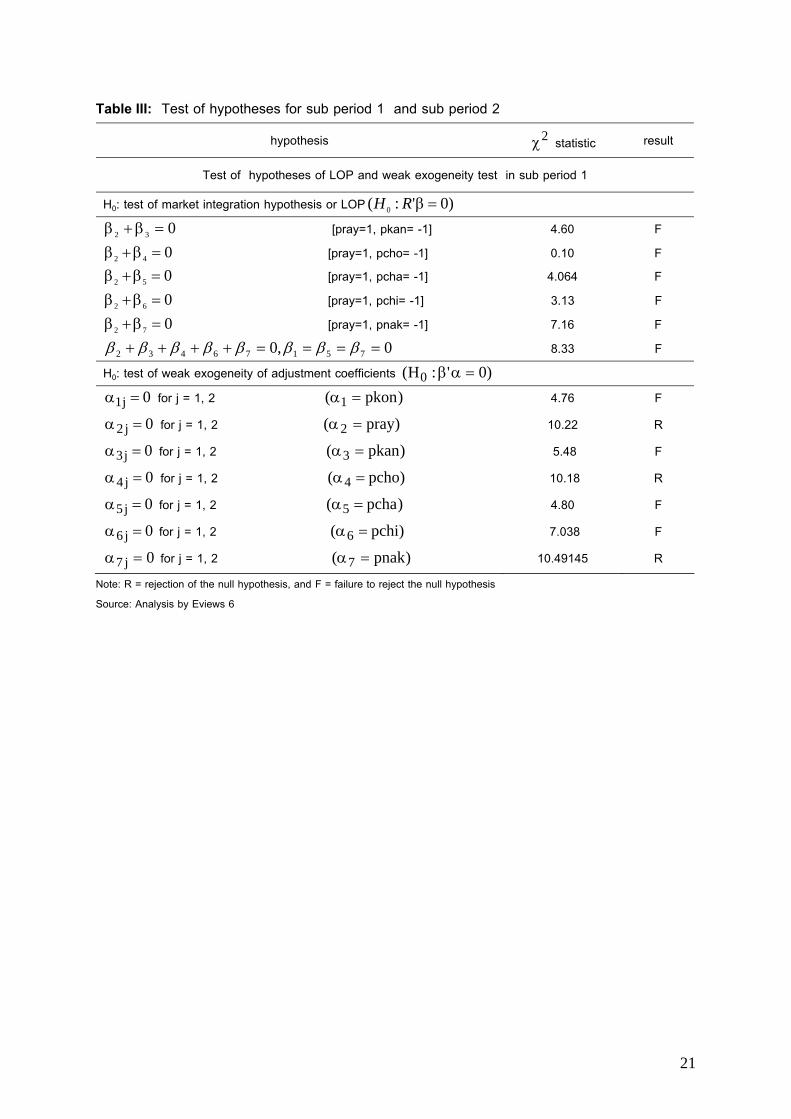
“Insert Table II Here”. The test for the LOP ( )0=αβ′ of cointegration equation in sub period 1 can not be
rejected for all of pairs while sub period 2, the LOP hold for some pairs (pkon-pkan and pkon-pcha) but multivariate test for the LOP, shows that LOP hold for all market except Ray (pray) and Nak market (pnak).
“Insert Table III Here”. Results of testing hypothesis 0':H0 =αβ for weak exogeneity of α in sub period 1 and
2 are summarized in Table III. In sub period 1, 742 ,, ααα are significantly different from zero, indicated that only Ray (high concentrated market) Cho (closet to the port) and Nak (largest market) responded to shock in the long run relationship (cointegrating vector). In sub period 2, only Kon (the smallest market) and Cho market that responded to perturbations in the long run relations.
Result of causality test using directed acyclic graph (DAG) To visualize the dynamic price relationship among 7 provincial markets, the DAG was
employed. Based on innovations from error correction model, the correlation matrices for periods 1 and 2 are presented in Figure 2. The DAG depicts casual flows among the set of markets based on observed correlation.

13
pkon pray pkan pcho pcha pchi pnak
corr sub1 =
⎥⎥⎥⎥⎥⎥⎥⎥⎥
⎦
⎤
⎢⎢⎢⎢⎢⎢⎢⎢⎢
⎣
⎡
00.188.044.053.057.052.050.000.140.053.048.052.044.0
00.141.037.045.040.000.139.086.055.0
00.135.033.000.151.0
00.1
pkon pray pkan pcho pcha pchi pnak
corr sub2 =
⎥⎥⎥⎥⎥⎥⎥⎥⎥
⎦
⎤
⎢⎢⎢⎢⎢⎢⎢⎢⎢
⎣
⎡
00.160.050.040.021.056.047.000.147.033.010.031.070.0
00.176.035.069.033.000.144.059.020.0
00.136.012.000.127.0
00.1
Panel a in Figure 2 shows complete undirected graph. In sub period 1 (panel b), the
general findings indicate integration between cassava markets within the same region (especially, market in contiguous provinces) implied the causal link from a larger to the other smaller markets. In the Northeast region, Nak sends instantaneous price information to Chi (pchi), and Kon (pkon). Similarly to markets in Eastern region showing causal flow of price information Cho (pcho) to Ray (pray) and ambiguous relationship between Ray (pray) and Cha (pcha) in sub period 1. The cross regional appears strongly for Nak and Kan and less from Cho to Kan. In sub period 2 (panel c), in the eastern region, Ray, the highest concentrated market, sent out signals to Cha (the largest market and least concentrated) which in turn signaled price to Cho (smallest market/closet to the port). The causality with in the northeastern markets became stronger in period 2. Furthermore, there exists a close link between northeastern and eastern regions (Nak-Ray).
This analysis revealed the dominant position of the Nakhonratchasrima (the largest cassava producing province) in cassava trade. It was sends instantaneous price information to all other provincial cassava markets in each period, except Cho (pcho) and Cha (pcha). This empirical evidence suggests that markets in contiguous provinces (province that share same border) exhibit instantaneous transmission of price information. Close geographical proximity of cassava markets could be assumed to be raising trade as it relatively lowers transactions costs.

14
PKAN
PNAK PCHA
PCHI PCHO
PKON PRAY
PKAN
PNAK PCHA
PCHI PCHO
PKON PRAY
PKAN
PNAK PCHA
PCHI PCHO
PKON PRAY
PKAN
PNAK PCHA
PCHI PCHO
PKON PRAY
PKAN
PNAK PCHA
PCHI PCHO
PKON PRAY
PKAN
PNAK PCHA
PCHI PCHO
PKON PRAY
PKAN
PNAK PCHA
PCHI PCHO
PKON PRAY
PKAN
PNAK PCHA
PCHI PCHO
PKON PRAY
PKAN
PNAK PCHA
PCHI PCHO
PKON PRAY
PKAN
PNAK PCHA
PCHI PCHO
PKON PRAY
at 5 % level at 10 % level (a) Complete undirected graph (b) DAG (1989:01-2002:12) (c) DAG (2003:01-2009:06)
Figure 2 Causality test by directed acyclic graphs (DAGs) Source: Analyze by Tetrad IV
5. Conclusion and policy implication The empirical evidence indicates existence of structural break around 2003 when export of pellets switched to chips and starch and the free trade agreement between Thailand and China began. The findings reveal cointegrating vectors in periods 1 and 2 can not reject the multivariate test for law of one price in periods 1 and 2. However, the pair wise tests in period 2 can reject H0 of LOP only for 2 out of 6 pairs. Causal direction results from DAG clearly indicate that the largest market (Nak) with relatively high market concentration is the price leader and plays dominant roles in price transmission not only to within the region but possibly to major markets of other regions. The geographical proximity among contiguous provinces and between each province to the main port exhibit significant price links. A possible reason is relative lower transportation costs allow trades of fresh cassava and dry chips among contiguous provincial markets. The recent market structure change has reduced market intervention. The growth of cassava production and business expansion of merchants owning drying places (chip processors) lead to high market concentration and market power. Proximity to the main port no longer has information and cost advantages. It is possible that these advantages were dominated and offset by market power. Generally, spatial market integration analysis has been widely used for assessing the effectiveness of government policies (especially, intervention policies) in developing countries. For this empirical result, intervention policy for cassava market of Thailand (pledging policy) found not to impede market integration. The income guarantee program by itself generates compensation to growers based on prevailing market price and thus the program has no effect on price distortion. Evidently, the concentrated (Ray) and/or large (Nak) markets as well as Cho (close to the main port) responded to price perturbation in period 1 but not in period 2. Only the

15
small markets (Kon and Cho) adapted to respond to price shock in period 2. This further confirms existence of significant role of large markets. To reinforce spatial market integration and pricing efficiency among producing provinces, it require investment promotion for more drying places-merchants (or chip processors) as well as other intermediate processing. The existing information of futures price of chip in the relevant form should be made available widely to growers in all provinces. The government should closely monitor marketing practices of merchants in large markets especially Nak to improve price information distribution and their pricing strategies. Because transportation costs were not available, distance among markets should be served as proxy exogenous variable. Lastly, response to perturbations of each market should be presented to identify direction and magnitude of response such that specific policy implications could be drawn. Reference Alexander, C. and J. Wyeth., (1994), “Cointegration and market integration: an application to
the Indonesian rice market”, Journal of Development Studies, 30, pp. 303-328. Ardeni, P.G., (1989), “Does the law of one price really hold for commodity price?”. American
Journal of Agricultural Economics, 71, pp. 661-669. Asche, F., D.V. Gordon and R. Hannesson., (2004), “Testing for market integration and the law
of one price: the market for whitefish in France”, Marine Resource Economics, 19, pp. 195-210. (online). http://ageconsearch.umn.edu/bitstream/28114/1/19020195.pdf.
Awokuse, T. O., (2007), “Market reform, spatial price dynamics, and China’s rice market integration: a causal analysis with directed acyclic graphs”, Journal of Agricultural and Resource Economics, 32(1), pp. 58-76. (online). http://ageconsearch.umn.edu/
bitstream/8603/1/32010058.pdf. Awokuse, T.O., and D.A. Bessler., (2003), “Vector auto regressions, policy analysis, and
directed acyclic graphs: An application to the U.S. Economy”, Journal of Applied Economics, vol. VI, no. 1, May 2003. pp. 1-24
Awokuse, T.O., A. Chopra. and D.A. Bessler., (2009), “Structural change and international stock market interdependence: evidence from Asian emerging markets”, Economic Modelling, 26, pp. 549-559. (online). www.elsevier.com/locate/econbase, 21 July 2009.
Baulch, B., (1997), “Transfer costs, spatial arbitrage, and testing for food market integration”, American Journal of Agricultural Economics, 79, pp. 477-487.

16
Beaulieu J. J. and J. A. Miron., (1993), “Seasonal unit roots in aggregate U.S. data”, Journal of Econometrics, 55, pp. 305- 328. (online). http://www.nber.org/papers/t0126.pdf
Bressler, R. G. and R. A. King., (1970), Markets, Prices, and Interregional Trade. New York, John Willey and Sons.
Bessler D.A., J. Yang and W. Metha., (2003), “Price dynamics in the international wheat market: modeling with error correction and directed acyclic graphs”, Journal of Regional Science, vol. 43, no. 1, pp. 1-33. (online). http://www.blackwell- synergy.com /doi/abs/10.1111/1467-9787.00287.
Bessler D.A., (2004), “Causality and price discovery: an application of directed acyclic graphs”, Journal of Business, vol. 77, no. 4, pp. 1099-1121. (online). http://www.journals.uchicago.edu/doi/pdf/10.1086/422632.
Brown, R.L, J. Durbin and J.M. Evans., (1975), “Techniques for testing the constancy of regression relationships over time”, Journal of the Royal Statistical Society, Series B, vol. 37, no. 2, pp. 149-192.
Enders, W., (2004), Applied Econometric Time Series, 2nd ed, USA, John Willey and Sons. Engle, R. F. and C.W.J. Granger., (1987), “Cointegration and error-correction: representation,
estimation and testing”, Econometrica, 55, pp. 251-276. (online). http://www.jstor.org/stable/pdfplus/1913236.pdf.
Fackler, P. L., (1996), “Spatial price analysis: a methodological review”, In Proceeding of the NCR-134 Conference on Applied Commodity Price Analysis, Forecasting, and Market Risk Management, Chicago, IL, pp. 122-145. (online).
http://www.farmdoc.uiuc.edu/nccc134/conf_1996/pdf/confp10-96.pdf [January 2008]. Haughton, D., A. Kamis and P. Scholten., (2006), “A review of three directed acyclic graphs software packages”, The American Statistician, vol. 60, no. 3, pp. 272-286. He, F., (2008), “Review study on main models of market integration”, Chinese Journal of Population, Resources and Environment, vol. 6, no. 3, pp. 93-96. (online). www.cjpre.cn/Res/EnMagazine/394.pdf. Trakulphonnimit I., (2002), An Analysis of Price Transmission and Price Relation between
Central Paddy and Bangkok Markets, Master of Science Thesis in Agricultural economics, Kasetsart University.
Kaewchuey, J., (2007), An Analysis of Price Relationships of Thai Oil Palm, Master of Arts Thesis in Agribusiness, Kasetsart University.

17
Johansen, S. and K. Juselius., (1990), “Maximum likelihood estimation and inference on cointegration with application to the demand for money”, Oxford Bulletin of Economics and Statistics, vol. 52, no. 2, pp. 169-210.
Poomprasert, K., (2005), An Analysis of Price Determination of Agricultural Price with Cointegration method: Case Study Rubber, Cassava, and Corn, Master of Economics Thesis, Chiang Mai University.
Sittikul, K., (1997), The Study of Price Behavior and Forecasting of Important Agricultural Commodities: Case Studies on Rice, Rubber, Cassava Products, corn and Black Tiger Shrimp, Master of Science Thesis in Agricultural Economics, Kasetsart University.
Kuntum, K., (2003), An Analysis of Price Movement and Market Integration of Maize in Thailand: A Case Study of Petchabun Province and Nakhon Ratchasima Province, Master of Science Thesis in Agricultural economics, Kasetsart University.
Issariyathip, K., (2002), An Analysis of Fruits Price Integration between Central and Local Markets, Master of Science Thesis in Agricultural economics, Kasetsart University.
Liu, Q. and H. H. Wang., (2003), “Market integration test for Pacific egg markets”, In American Agricultural Economics Association Annual Meeting, Montreal, Canada. (online). ageconsearch.umn.edu/bitstream/21934/1/sp03li06.pdf
Lohano, H. D. and F. M. Mari., (2006), “Testing market integration in regional onion markets of Pakistan: application of error correction model in the presence of stationarity”, International Research Journal of Finance and Economics, 1, pp. 89-87. (Online). http://www.eurojournals.com/IRJFE%201%20-%209%20Lohano.pdf. (June 2009).
McNew, K., (1996), “Spatial market integration: definition, theory, and evidence”, Agricultural and Resource Economics Review, pp. 1-11. (online). http://ageconsearch.umn.edu/bitstream/31646/1/25010001.pdf.
Nanang, D. M., (2000), “A multivariate cointegration test of the law of one price for Canadian softwood lumber markets”, Forest and Policy and Economics, 1, pp. 347-355. (online). www.Elsevier.nl/locate/forpol.
Pongpoorsakorn, N. et al., (2000), Impact Evaluation of Price Intervention Policy in Cassava Market in Crop Year 2539/40, Thailand Development Research Institute
Foundation, Bangkok: Thailand Development Research Institute Foundation.(in Thai) Onyuma, S.O., E. Icart and G. Owuor., (2006), “Testing market integration for fresh pineapples
in Kenya”, In International Association of Agricultural Economist Conference, Gold Coast, Australia (12-18 August). (online). http://purl.umn.edu/25622.

18
Punkla, P., (2008), A Study of Price Transmission on Thai Cassava before and after Asean-China Free Trade Agreement, Master of Science Thesis in Agricultural economics, Kasetsart University.
Pearl, J., (2000), Causality: Models, Reasoning, and Inference, UK, Cambridge University Press.
Rapsomanikis, G., D. Hallam. and P. Conforti., (2003), “Market integration and price transmission in selected food and cash crop markets of developing countries: review and applications”, Commodity Market Review 2003-2004, (online). http://www.fao.org/docrep/006/y5117E/y5117e06.htm. (7 March 2008).
Ravallion, M., (1986), “Testing Market Integration”, American Journal of Agricultural Economics, 68, pp. 102-109. (online). http://www.jstor.org/pss/1241654.
Visansirikul, R., (2003), An Analysis of Kluai Namwa Price Integration among Regional Wholesale Markets. Master of Science Thesis in Agricultural economics, Kasetsart University.
Sanguanchur, S., (2002), Market Structure and Price Behaviors of Cassava Products: An Implication for Thailand Futures Trading, Master of Economics Thesis, Thammasart University.
Serra, T. and B.K. Goodwin., (2003), “Price transmission and asymmetric adjustment in the Spanish dairy sector”, Applied Economics, vol. 35, no. 18, pp. 1889-1899.
Sexton, R. J., C.L. Kling, and H.F. Carman., (1991), “Market integration, efficiency of arbitrage, and imperfect competition: methodology and application to U.S. Celery”, American Journal of Agricultural Economics, vol. 73, no. 3, pp. 568-580.
Lapboonruang, S., (2004), Farm Price Forecast and Farm Price Integration of Swine, Master of Science Thesis in Agricultural economics, Kasetsart University. Spirtes, P., C. Glymour, and R. Scheines., (2000), Causation, Prediction, and Search,
Cambridge, MA: MIT Press. Apihakit, S., (2004), An Analysis of Cassava Price Transmission of Thailand, Master of Science
Thesis in Agricultural economics, Kasetsart University. Timmer, C.P., (1987), “The corn economy of Indonesia”, Ithaca, Cornell University Press. Vavra, P. and B.K. Goodwin., (2005), “Analysis of price transmission along the food chain.”
OECD Food, Agriculture and Fisheries Working Papers No.3. (online). www.oecd.org/dataoecd/36/55/40459642.pdf. (25 December 2009).
Verbeek, M., (2000), A Guide to Modern Econometrics, John Wiley & Sons Ltd.

19
Yang, J., D.A. Bessler and D.J. Leatham., (2000), “The law of one price: developed and developing country market integration”, Journal of Agricultural and Applied Economics, vol. 32, no. 3, pp. 429-440. (online) ageconsearch.umn.edu/bitstream/15320/1/32030429.pdf (5 June 2009).
Zhou, M. and J. Buongiorno., (2005), “Price transmission between products at different stages of manufacturing in forest industries”, Journal of Forest Economics, 11, pp. 5-19. (online). www.elsevier.de/jfe. (25 December 2009).

20
Appendix Table I: Price statistics and characteristics of the selected provinces
Northeast East West Stat. Nak Chi Kon Cha Cho Ray Kan mean 1,309.4 1,251.4 1,257.4 1,179.5 1,183.3 1,200.5 1,117.4 median 1,256.0 1,204.6 1,197.6 1,091.8 1,134.3 1,124.2 1,071.3 maximum 2,539.3 2,442,6 2,386.4 2,430.5 2,043.5 2,206.2 2,054.3 minimum 677.0 617.6 574.6 654.5 704.8 664.9 563.6 Production area country rank
1 3 12 5 7 10 6
Absorption rank* (rai/merchant)
2 (22,482)
4 (12,469)
3 (20,514)
7 (7,028)
5 (8,619)
1 (30,580)
6 (8,066)
Proximity to pert rank
4 6 7 2 1 3 5
Note * Absorption capacity = total production area ÷ number of merchants.
Table II: Normalized cointegrating vectors (β ) and short run adjustment parameter (α ) from unrestricted cointegration model
Sub period 1 (1989:01-2002:12) Sub period 2 (2003:01-2009:06)
cointegration equation (normalized by Pray) cointegration equation (normalized by Pkon)
variables
β α β α Pkon 0 0.044 1 -1.009***
Pray 1 0.121 0.066 0.552*
Pkan 0.478*** 0.412*** 0.695*** 0.185
Pcho 1.048*** 0.363*** 0.630*** 1.069***
Pcha 0.234*** 0.152 0.711** 0.467*
Pchi 0.095 -0.138 0.352*** -0.140
Pnak 0.737*** -0.223* 0.039 0.193 constant 0.015 - - -
Note: *,**,*** indicates significance at 10% 5% and 1% level Source: Analysis by Eviews 6
21
Table III: Test of hypotheses for sub period 1 and sub period 2
hypothesis 2χ statistic result
Test of hypotheses of LOP and weak exogeneity test in sub period 1
H0: test of market integration hypothesis or LOP )0':( 0 =βRH
032 =β+β [pray=1, pkan= -1] 4.60 F 042 =β+β [pray=1, pcho= -1] 0.10 F 052 =β+β [pray=1, pcha= -1] 4.064 F 062 =β+β [pray=1, pchi= -1] 3.13 F 072 =β+β [pray=1, pnak= -1] 7.16 F
0,0 75176432 ====++++ ββββββββ 8.33 F H0: test of weak exogeneity of adjustment coefficients )0':H( 0 =αβ
0j1 =α for j = 1, 2 )pkon( 1 =α 4.76 F
0j2 =α for j = 1, 2 )pray( 2 =α 10.22 R
0j3 =α for j = 1, 2 )pkan( 3 =α 5.48 F
0j4 =α for j = 1, 2 )pcho( 4 =α 10.18 R
0j5 =α for j = 1, 2 )pcha( 5 =α 4.80 F
0j6 =α for j = 1, 2 )pchi( 6 =α 7.038 F
0j7 =α for j = 1, 2 )pnak( 7 =α 10.49145 R
Note: R = rejection of the null hypothesis, and F = failure to reject the null hypothesis Source: Analysis by Eviews 6

22
Table III: continued
hypothesis 2χ statistic result
Test of hypothesis 0'R:H0 =β and 0':H0 =αβ in sub period 2
H0: test of market integration hypothesis )0'R:H( 0 =β
01311 =β+β [pkon=1, pkan= -1] 2.897311 F 01211 =β+β [pkon=1, pray= -1] 13.66343 R 01411 =β+β [pkon=1, pcho= -1] 17.82320 R 01511 =β+β [pkon=1, pcha= -1] 1.142098 F 01611 =β+β [pkon=1, pchi= -1] 19.33641 R 01711 =β+β [pkon=1, pnak= -1] 17.39124 R
,01615141311 =β+β+β+β+β 01712 =β=β 9.902597 F H0: test of weak exogeneity of adjustment coefficients )0':H( 0 =αβ
0j1 =α for j = 1 )pkon( 1 =α 14.64515 R
0j2 =α for j = 1 )pray( 2 =α 4.321000 F
0j3 =α for j = 1 )pkan( 3 =α 0.559749 F
0j4 =α for j = 1 )pcho( 4 =α 9.918984 R
0j5 =α for j = 1 )pcha( 5 =α 3.807929 F
0j6 =α for j = 1 )pchi( 6 =α 0.184414 F
0j7 =α for j = 1 )pnak( 7 =α 0.447487 F
Note: R = rejection of the null hypothesis, and F = failure to reject the null hypothesis Source: Analysis by Eviews 6