aedes siiq final · the reproduction of the information, recommendations and research produced by...
TRANSCRIPT
Intermonte SIM S.p.A. Milan 20122 (Italy) – Galleria de Cristoforis, 7/8 - phone: +39-02-77115.1 fax: +39-02-77115.300 New York - (USA) - Sales contacts: JPP Eurosecurities, 595 Madison Avenue, 10022 - phone: +1 (212) 521 6718
Italian Research New Coverage Milan, May 24, 2016
AEDES SIIQ Price (Eu):
Target Price (Eu):
OUTPERFORM0.39
0.60
SECTOR: Real Estate
Federico Pezzetti +39-02-77115.268e-mail: [email protected]
Simpler, Healthier, And Ready to Grow A “Historic” real estate company with a revamped look. Aedes was founded in 1905 and
became the first real estate company to float on the Milan Stock Exchange in 1924. In 2008, when the real estate market was hit by the economic crisis, the company found itself in increasing financial difficulties and was forced to take extraordinary measures, including several operations to raise new capital in 2014-2015. The group is now run by a completely new board representing a mostly new controlling shareholders and is pursuing a simpler investment strategy than in the past.
Moving towards a simpler “REIT” business model. Thanks in part to its new status as a SIIQ (the Italian version of REIT), Aedes’s strategy is now focused on the creation and medium to long term retention of an income-bearing portfolio of commercial property, predominantly in the retail arena. The group is building for the future by investing in two portfolios, one income-bearing and the other a development portfolio which it already owns.
Development portfolio: the key source of organic growth. The development property portfolio is composed chiefly of projects for commercial use and the company expects some of these initiatives to turn into income-generating assets. Some initiatives centre around the Serravalle Scrivia “Designer Outlet”, although the key one is represented by a Eu300mn capex retail and entertainment project in Caselle (Turin).
Real estate funds: a market for opportunistic acquisitions. Another pillar of the group’s strategy is the intention to look for acquisition opportunities among real estate funds, (usually trading at a deep discount to face values) with the subsequent goal of assimilating them into the group’s real estate portfolio (a clear example of this strategy is the recent acquisition of the Redwood fund). This also comes on the back of some new options introduced by the Renzi government with the “Unblock Italy” decree.
Knowledgeable management boasting a major success story in retail real estate. CEO Giuseppe Roveda, through the Praga group, was responsible for the development of the Serravalle Designer Outlet in the early 2000’s. This innovative intervention involved the construction of the biggest outlet centre in Europe, and was a major success that radically enhanced the local area’s profile and economic status.
We initiate with an Outperform recommendation and a Eu0.60 target price. Despite the huge progress made over the last couple of years, Aedes SIIQ remains a “work-in-progress” with still a number of weaknesses/risks including low cashflow generation, sub-par dividend distribution and uncertainty around the Caselle development project. Still, we believe that a committed management, an opportunistic approach on income bearing assets, and interesting development opportunities represent an appealing mix at current valuations. The stock is currently trading at a 60% discount to 2016E NAV which represents a significant gap vs the 30% average discount at which trade its main Italian peers Beni Stabili and IGD.
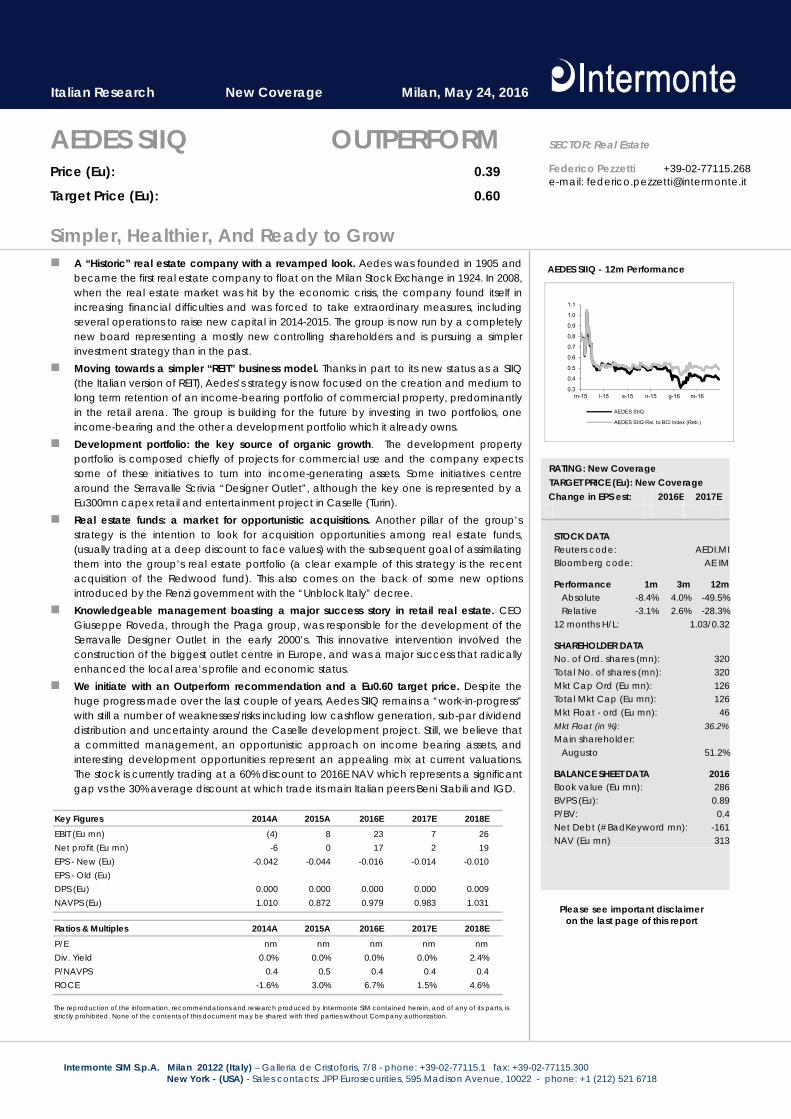
AEDES SIIQ - 12m Performance
0.3
0.4
0.5
0.6
0.7
0.8
0.9
1.0
1.1
m-15 l-15 s-15 n-15 g-16 m-16
AEDES SIIQ
AEDES SIIQ Rel. to BCI Index (Reb.)
RATING: New Coverage
TARGET PRICE (Eu): New Coverage Change in EPS est: 2016E 2017E
STOCK DATAReuters code: AEDI.MIBloomberg code: AE IM
Performance 1m 3m 12m Absolute -8.4% 4.0% -49.5% Relative -3.1% 2.6% -28.3%12 months H/L: 1.03/0.32
SHAREHOLDER DATANo. of Ord. shares (mn): 320Total No. of shares (mn): 320Mkt Cap Ord (Eu mn): 126Total Mkt Cap (Eu mn): 126Mkt Float - ord (Eu mn): 46Mkt Float (in %): 36.2%
Main shareholder: Augusto 51.2%
BALANCE SHEET DATA 2016Book value (Eu mn): 286BVPS (Eu): 0.89P/BV: 0.4Net Debt (#BadKeyword mn): -161NAV (Eu mn) 313
The reproduction of the information, recommendations and research produced by Intermonte SIM contained herein, and of any of its parts, is strictly prohibited. None of the contents of this document may be shared with third parties without Company authorization.
Key Figures 2014A 2015A 2016E 2017E 2018EEBIT (Eu mn) (4) 8 23 7 26Net profit (Eu mn) -6 0 17 2 19EPS - New (Eu) -0.042 -0.044 -0.016 -0.014 -0.010EPS - Old (Eu)DPS (Eu) 0.000 0.000 0.000 0.000 0.009NAVPS (Eu) 1.010 0.872 0.979 0.983 1.031
Ratios & Multiples 2014A 2015A 2016E 2017E 2018EP/E nm nm nm nm nmDiv. Yield 0.0% 0.0% 0.0% 0.0% 2.4%P/NAVPS 0.4 0.5 0.4 0.4 0.4ROCE -1.6% 3.0% 6.7% 1.5% 4.6%
Please see important disclaimer
on the last page of this report

2
AEDES SIIQ - KEY FIGURES 2014A 2015A 2016E 2017E 2018E
Fiscal year end 31/12/2014 31/12/2015 31/12/2016 31/12/2017 31/12/2018
PROFIT & LOSS (Eu mn) Sales 22 32 39 22 25EBITDA (1) 6 17 2 6EBIT (4) 8 23 7 26Financial income (charges) (5) (4) (5) (7) (10)Associates & Others (2) (1) (1) 1 1Pre-tax profit (loss) (13) 2 17 2 19Taxes 6 (1) (0) (0) (0)Tax rate (%) 32.0% 32.0% 32.0% 32.0% 32.0%Minorities & discontinue activities (1) 1 1 1 1Net profit -6 0 17 2 19Total extraordinary items 0 0 0 0 0Ebitda excl. extraordinary items (1) 6 17 2 6Ebit excl. extraordinary items (4) 8 23 7 26Net profit restated (10) (14) (5) (4) (3)
PER SHARE DATA (Eu) Total shares out (mn) - average fd 233 320 320 320 320EPS stated fd 0.217 0.019 0.053 0.002 0.055EPS restated fd -0.042 -0.044 -0.016 -0.014 -0.010BVPS fd 0.000 0.841 0.893 0.898 0.947NAVPS fd 1.010 0.872 0.979 0.983 1.031Dividend per share (ord) 0.000 0.000 0.000 0.000 0.009Dividend pay out ratio (%) 0.0% 0.0% 0.0% 0.0% 16.1%
CASH FLOW (Eu mn) Change in NWC 0 160 0 0 0Capital expenditure 2 2 8 97 96Other cash items 0 0 0 0 0Free cash flow (FCF) (17) (10) (11) (99) (97)Acquisitions, divestments & other 17 38 (54) (15) (10)Dividend 0.0 0.0 0.0 0.0 -3.0Change in Net Financial Position 0 28 (65) (114) (110)
BALANCE SHEET (Eu mn) Total fixed assets 165 325 444 559 683Net working capital 215 56 56 56 56Long term liabilities (110) (95) (96) (97) (98)Net capital employed 270 286 403 517 641Net financial position (124) (96) (161) (275) (385)Group equity 239 275 291 292 307Minorities 5 6 6 5 5Net equity 234 269 286 287 303
NAV DATA (Eu mn) Properties and other assets - Book value 298 321 419 534 658Properties and other assets - Market value 298 321 419 534 658NAV 235 279 313 314 330
RATIOS(%) EBITDA margin* nm 19.9% 44.5% 9.4% 23.3%EBIT margin* nm 26.1% 59.5% 31.7% 106.4%Gearing - Debt/equity 52.0% 34.8% 55.2% 94.0% 125.3%Interest cover on EBIT nm 2.0 4.9 1.0 2.8Debt/Ebitda nm 15.00 9.36 134.10 66.58Capex as % sales 7.8% 5.6% 19.4% 444.5% 386.0%ROCE* -1.6% 3.0% 6.7% 1.5% 4.6%ROE* -5.4% 0.0% 6.0% 0.5% 6.3%
GROWTH RATES (%) Sales nm 44.2% 20.1% -43.6% 14.3%EBITDA* nm nm 168.6% -88.1% 182.2%EBIT* nm nm 174.1% -70.0% 283.8%Net profit nm nm 57419.4% -90.8% 1127.0%EPS restated nm nm nm nm nm
* Excluding extraordinary items
Source: Intermonte SIM estimates

3
Index
Executive Summary page 4
Company Overview page 6
Portfolio Description and Statistics page 12
Italian Market Fundamentals page 19
Group Financials & Estimates page 23
Valuation page 29
Appendix I page 32
Appendix II page 33
Appendix III page 35

4
Executive Summary A “Historic” real estate company with a revamped look. Aedes was founded in 1905 and became the first real estate company to float on the Milan Stock Exchange in 1924. In 2008, when the real estate market was hit by the economic crisis, the company found itself in increasing financial difficulties and was forced to take extraordinary measures, including several operations to raise new capital in 2014-2015. The group is now run by a completely new board representing a mostly new controlling shareholders and is pursuing a simpler investment strategy than in the past. Moving towards a simpler “REIT” business model. Thanks in part to its new status as a SIIQ (the Italian version of REIT), Aedes’s strategy is now focused on the creation and medium to long term retention of an income-bearing portfolio of commercial property, predominantly in the retail arena. The group is building for the future by investing in two portfolios, one income-bearing and the other a development portfolio which it already owns. On the one hand it will purchase new rented properties to compete with the performance of European REITs, while on the other it will develop a new generation of shopping and leisure centres through a development pipeline, with the aim of eventually transferring them to the income-bearing portfolio controlled by Aedes SIIQ. A real estate portfolio focused on retail properties... At the end of 2015 Aedes SIIQ had a real estate portfolio with a “pro-quota” GAV (i.e. including its stakes in real estate funds and joint ventures) of Eu412mn. Around 47% of this was represented by the rented portfolio with another 30% coming from development assets (the “develop to be rented” part of the portfolio) and the remaining 23% being represented by the trading portfolio. Retail represents the largest category, accounting for some 50% of the total, while office properties represent some 24% of the total “pro-quota” portfolio. … and concentrated in northern Italy. From a geographical standpoint the portfolio is heavily concentrated in the richest regions of northern Italy. In particular, Piedmont and Lombardy are the two key regions where over 80% of Aedes’s total pro-forma assets are located. The city that stands out most in the company’s portfolio is Milan, where almost 30% of the total asset value is concentrated. Other key locations are Serravalle and Caselle (near Turin), both in the north-west region of Piedmont. Income-bearing portfolio: room to work on vacancy rates but limited reversionary potential. Within the rented portfolio there is potential to improve vacancy rates, which currently stand at 13% for the fully consolidated portfolio. On the other hand reversionary potential is limited: when looking at the entire pro-quota portfolio the market yield of 7.7% compares to a passing yield at full occupancy of 7.3%, suggesting 5% reversionary potential on average. Development portfolio: the key source of organic growth. The development property portfolio is composed chiefly of projects for commercial use. The company expects some of these initiatives to turn into income-generating assets and financial leverage is on the whole much lower than in the rest of the portfolio, at 20%. A number of the development initiatives centre around the Serravalle Scrivia “Designer Outlet”, although the key initiative is represented by a Eu300mn capex retail and entertainment project in Caselle (next to Turin airport). Real estate funds: a market for opportunistic acquisitions. Another pillar of the group’s strategy is the intention to look for acquisition opportunities among real estate funds (usually trading at a deep discount to face values) with the subsequent goal of assimilating them into the group’s real estate portfolio (a clear example of this strategy is the recent acquisition of the Redwood fund). This also comes on the back of some new options introduced by the Renzi government with the “Unblock Italy” decree, which addressed the situation of numerous real estate funds approaching maturity by trying to create new exit strategies for funds’ shareholders. Knowledgeable management boasting a major success story in retail real estate. CEO Giuseppe Roveda, through the Praga group, was responsible for the development of the Serravalle Designer Outlet in the early 2000’s. This innovative intervention involved the construction of the biggest outlet centre in Europe, and was a major success that radically enhanced the local area’s profile and economic status. Valuation at deep discount to Net Asset Value. Aedes SIIQ stock is currently trading at a 60% discount to 2016E NAV. Despite part of this discount could be related to the uncertainties over the group’s development projects (particularly the one in Caselle which is at a much earlier stage) as well as its sub-optimal cost base (which can be leveraged with a much larger portfolio), this still represents a significant gap vs the 30% average discount at which its main Italian peers Beni Stabili and IGD are trading, especially considering the lower LTV of Aedes SIIQ.

5
We initiate coverage with an Outperform recommendation and set a target price of Eu0.60ps (52% upside to current prices). As Aedes SIIQ is only now starting to build up its real estate portfolio (especially with reference to the income-bearing part), the current and short term cashflow picture is still burdened by a cost base that is compatible with a much larger portfolio. For this reason, when assessing the valuation of the company we have tended to exclude methodologies based on cashflow as we feel these would be overly penalising. We believe that the most appropriate methodology is one based on a sum-of-the-parts approach and we set a target price of Eu0.60 while also running a bear and a bull case scenario (with fair values, respectively, of Eu0.41 and Eu0.85). We start our coverage with an Outperform recommendation on the stock. Main weaknesses/risks. Despite the huge progress made by the company over the last couple of years, we highlight a number of key weaknesses and risks: Low WALT of the portfolio. The rented portfolio (included Redwood) has a weighted
average lease term (WALT) of just 2.6 years exposing it to potential further vacancy; Trading portfolio mostly vacant. Around 20% of GAV is represented by the trading
portfolio, a fairly diverse mix of mostly vacant assets which might be difficult to sell on the market;
Low cashflow generation. Due to the fact that the rented portfolio represents less
than 50% of total pro-quota GAV and that the cost base is consistent with that of a much larger asset base, cashflow generation currently remains negative, and will only show significant improvements in the next few years.
The Caselle project is not without risks: while there is very high visibility on execution
of the company’s development projects around the Serravalle Designer Outlet, the Caselle project represents a more uncertain bet, with a much higher risk/reward profile;
Sub-par dividend distribution: the low cashflow generation means that the group is
not currently distributing any dividends; it will probably take a few years for dividend yields to come close to sector averages;
Capital structure: despite the low initial LTV at the group level (35% at the pro-quota
level in 2015), the development of even the first phase of a large project such as Caselle might force the company to raise fresh resources.
6
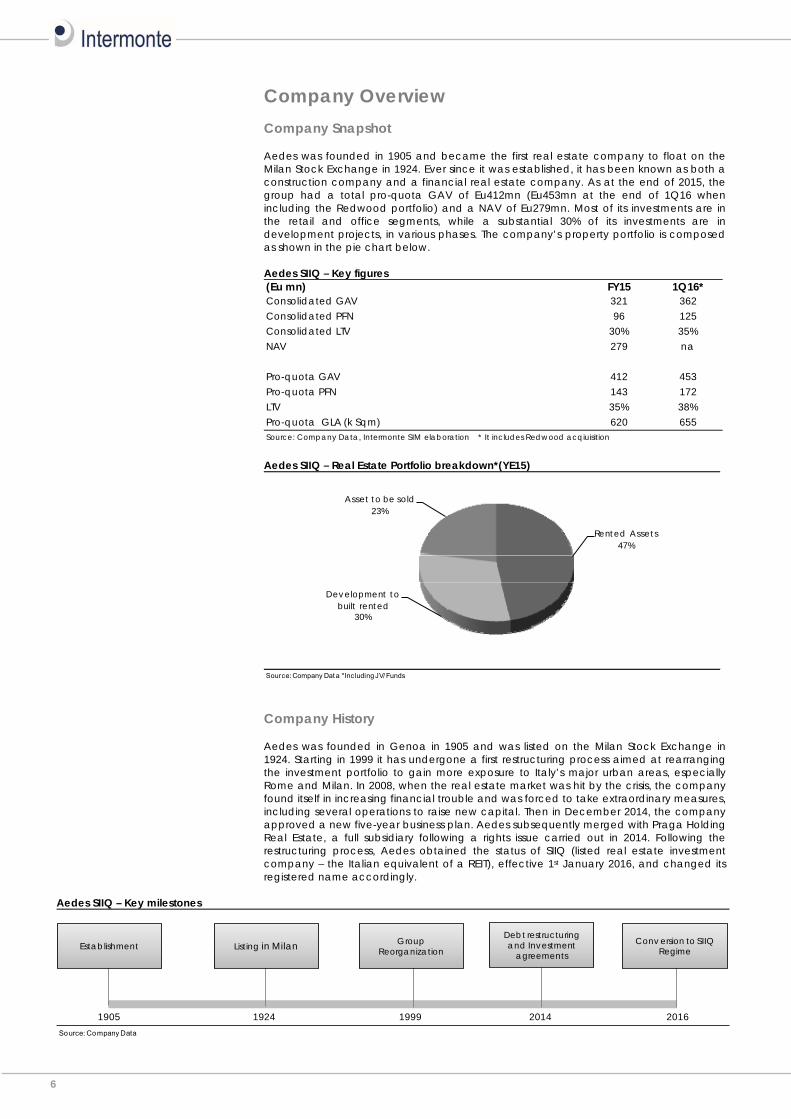
Company Overview Company Snapshot Aedes was founded in 1905 and became the first real estate company to float on the Milan Stock Exchange in 1924. Ever since it was established, it has been known as both a construction company and a financial real estate company. As at the end of 2015, the group had a total pro-quota GAV of Eu412mn (Eu453mn at the end of 1Q16 when including the Redwood portfolio) and a NAV of Eu279mn. Most of its investments are in the retail and office segments, while a substantial 30% of its investments are in development projects, in various phases. The company’s property portfolio is composed as shown in the pie chart below. Aedes SIIQ – Key figures (Eu mn) FY15 1Q16*Consolidated GAV 321 362Consolidated PFN 96 125Consolidated LTV 30% 35%NAV 279 na
Pro-quota GAV 412 453Pro-quota PFN 143 172LTV 35% 38%Pro-quota GLA (k Sqm) 620 655Source: Company Data, Intermonte SIM elaboration * It includes Redwood acqiuisition Aedes SIIQ – Real Estate Portfolio breakdown*(YE15)
Source: Company Dat a *Including JV/ Funds
Rented Assets47%
Development to built rented
30%
Asset to be sold23%
Company History Aedes was founded in Genoa in 1905 and was listed on the Milan Stock Exchange in 1924. Starting in 1999 it has undergone a first restructuring process aimed at rearranging the investment portfolio to gain more exposure to Italy’s major urban areas, especially Rome and Milan. In 2008, when the real estate market was hit by the crisis, the company found itself in increasing financial trouble and was forced to take extraordinary measures, including several operations to raise new capital. Then in December 2014, the company approved a new five-year business plan. Aedes subsequently merged with Praga Holding Real Estate, a full subsidiary following a rights issue carried out in 2014. Following the restructuring process, Aedes obtained the status of SIIQ (listed real estate investment company – the Italian equivalent of a REIT), effective 1st January 2016, and changed its registered name accordingly.
Aedes SIIQ – Key milestones
Source: Company Data
sssssssss2014 20161905 1924 eeeee 1999
Establishment Listing in Milan GroupReorganization
Debt restructuringand Investment
agreementsConv ersion to SIIQ
Regime

7
The 2014-2015 restructuring process… In 2013, in the wake of the financial crisis, Aedes found itself in an extremely critical financial condition, with equity of just Eu28mn against a net debt of Eu430mn. In the 2014-2015 the group embarked upon a long, in-depth restructuring process involving an investment agreement that encompassed various share issues and a debt restructuring agreement. Below is a brief summary of this process, which led to the creation of the current capital and corporate governance structures. Debt restructuring agreement. Aedes signed an agreement that restructured its debt exposure to creditor banks. Specifically, the agreement stipulated. 1. The sale of property and investments in companies owning property to one of the
creditor banks in exchange for a Eu167mn reduction in the bank debt. 2. Assumption by Aedes of all of the group’s unsecured credit, comprised of two
mortgages and Eu92mn of debt relating to group companies. 3. Transfer to a real estate fund (fondo Leopardi), managed by Aedes SGR, of property
and stakes in real estate companies that do not fit in with the new real estate strategy. The assets transferred have a NAV of Eu54.6mn. The majority of the stakes in these property funds were transferred to creditor banks, in exchange for the cancellation of Eu41mn in debt.
4. Eu47.5mn cash rights issue, without option rights, reserved for Aedes’s creditor banks to be paid through the conversion of the outstanding loans receivable from the group.
5. Aedes released from the guarantees it provided. Investment agreement. In conjunction with the restructuring agreement, Aedes signed a further agreement in order to grant the group the necessary resources to complete its restructuring. Specifically, this agreement involved: 1. Eu40mn share issue (at Eu0.46ps), without option rights, reserved for a NewCo
(Augusto SpA) owned by Tiepolo, Prarosa, Agarpa and SATOR. Augusto subscribed to this rights issue using the proceeds from its own rights issue, which in turn was subscribed by Sator and Tiepolo for Eu20mn each.
2. Eu92mn share issue (at Eu0.805ps) with payment in kind, without option rights, reserved for Augusto to be paid through the transfer of the entire capital of Praga Holding Real Estate. This share issue was subscribed by Augusto through the transfer by Tiepolo, Prarosa, Agarp, Praviola and Itinera of the entire share capital of Praga Holding Real Estate.
3. Eu49mn share issue (Eu2.30ps) with payment in kind, without option rights, reserved to the group’s banking creditors, paid through the conversion of the outstanding loans issued to Aedes.
4. Eu40mn cash rights issue (Eu0.46ps) with options for Aedes shareholders, who were awarded Warrants. Eu20mn of this issue was underwritten by Augusto shareholders and ViBa, an Aedes shareholder.
5. Eu20mn share issue (strike Eu0.69ps, maturity 07/07/2020) to serve the Warrants, with a ratio of 1 newly issued share for every 3 Warrants (max 28,985,512 shares).
… and the new ownership structure Ownership. Following the restructuring that was launched in 2014, Aedes now has a solid majority owner in Augusto SpA with over 51.2% of the share capital; Augusto is followed by ViBa with 7.3% and Itinera with 5.6%. The remaining 36% or so of the share capital is free float. Along with the rights issues, the company also issued about 87mn warrants that expire in 2020; if all of these are exercised (at one new share for every three warrants), then about 29mn new shares would be issued (ca. 9% of the NOSH). The warrants may be exercised at any time, at a strike price of Eu0.69. Aedes SIIQ – Shareholders Structure
Source: Company data
Aedes ownership Augusto ownership
Tiepolo37%
Prarosa31%
Arepo AD30%
Agarp2%August
o51.20%
ViBa7.31%
Itinera5.30%
Market36.02%

8
Here is a brief description of the group’s main shareholders: Augusto. Aedes’s leading stakeholder with 51.2%, Augusto is governed by a
shareholders’ agreement between its four stakeholders, Arepo AD (Arpe’s Sator Fund), Tiepolo (Amenduni family, noted for its steel manufacturing business), Prarosa and Agarp (both controlled by Aedes CEO Mr. Roveda). Augusto has three classes of shares (A, B and C), assigned to Prarosa, Tiepolo and Arepo AD, respectively. Arepo AD is in turn owned by Luxembourg-based fund Sator, owned by notable Italian businessman Matteo Arpe. Major corporate decisions concerning Augusto or Aedes must be approved by a majority of every share class, effectively giving each of the leading stakeholders veto power. Furthermore, the stakeholders partaking in the agreement cannot sell Augusto shares before 2019. In that year, each stakeholder will be allowed to remove its stake from the agreement and/or sell shares. Because of this setup, no single stakeholder has control of either Augusto or, consequently, of Aedes.
ViBa. A company belonging to the Amenduni family’s industrial group. The Amenduni
family is noted for its steel manufacturing business. Itinera. A company of the ASTM motorway/construction group, Itinera is indirectly
controlled by the Gavio family and does construction business in major works projects. Aedes SIIQ – Ownership Chain
Source: Company Data
Sator
Arepo AD PrarosaTiepolo
Augusto
100%*
37.5%30.6%30.1%
Agarp
1.86%
AEDES
51.2%
Shareholder agreement
Amenduni Family
Mr. Roveda
ViBa (Amenduni It inera (Gavio Family)
5.3%7.31%
Management and governance Management Team The current management team oversaw the restructuring and is now committed to turning the company around. Here are brief profiles of the top executives: Carlo Puri Negri, Chairman. Mr. Puri Negri has been Chairman of both Aedes and its
top stakeholder Augusto since December 2014. He has held upper management positions in various Italian manufacturing and financial companies over the course of his career since 2002, and held various roles in the Pirelli group for 21 years starting in 1988. He is also a member of Harvard University’s International Real Estate Advisory Board.
Giuseppe Roveda, CEO. Roveda has been Aedes’s chief executive since April 2012.
He is also CEO of both Augusto and its leading stakeholder Prarosa. From 2000 to 2014, Roveda was CEO of Praga Holding Real Estate SpA, which was controlling stakeholder in 12 different real estate investment companies, two construction services management companies and two agriculture companies.

9
Gabriele Cerminara, CFO. Chief financial officer Cerminara also manages the group’s equity interests. He is on the boards of several companies within the group and on the advisory committees of real estate funds in which Aedes SIIQ owns stakes. In the past, he gained experience in the telecommunications sector, in the corporate finance department of banks and in auditing for financial companies.
Conflicts of interest. The Aedes group has adopted a procedure for carrying out transactions with associated parties. The key point of the procedure is that prior approval must be given by the Board of Directors for any transactions with associated parties. The definition of associated parties includes all members of the Board of Directors, as well as members of the Board of Statutory Auditors and executives with strategic roles. It also includes all controlling shareholders, both on an individual and combined basis, and those with a stake large enough to allow them to exercise significant influence on the company. Transactions that are relevant for this procedure are broken down into those of lesser and greater magnitude. Normal procedures are applied for smaller transactions that fall under the former case, whereas for the latter case special procedures are used to guarantee that they comply with rules governing transactions with associated parties. According to the rules set by Italian authorities, significant transactions with associated parties are those for which any of the following indices exceeds 5%: Countervalue index; the ratio between the countervalue of the transaction and the
overall shareholders’ equity booked in the most recently filed financial statements. Asset index; the ratio between the total assets of the object of the transaction and
the total assets of the company on the most recently published balance sheet; Liability index; the ratio between the total liabilities of the object of the acquired
entity and the total liabilities of the company on the most recently published balance sheet.
Other transactions that fall under this definition are those with a listed holding company or with associated parties for which any of these indices exceeds 2.5%. The company also plans to introduce an internal audit committee to monitor transactions with associated parties, to be populated by independent Directors. No committee members can have any connection to the transactions scrutinised. If any connection exists, the member in question must be replaced by other independent members without a connection to the transaction Group Strategy Towards a traditional REIT business model in the medium term. Aedes’s strategy is focused on the creation and medium to long term retention of an income-bearing portfolio of commercial property, predominantly in the retail arena, with limited recourse to debt. The portfolio should allow the generation of significant cashflow under the SIIQ model. Aedes is building for the future by further investing in two portfolios, one income-bearing and the other a development portfolio which it already owns. On the one hand it will purchase new rented properties to compete with the performance of European REITs, while on the other it will develop a new generation of shopping and leisure centres through a development pipeline, with the aim of eventually transferring them to the income-bearing portfolio controlled by Aedes SIIQ (hence benefiting from the corporate tax exemption of the SIIQ regime, see Appendix for details).
Aedes SIIQ – Real estate portfolio*: breakdown by use
Source: Company Data *Including JV/Funds
YE'15 YE'19
Assets to be sold5%
Dev elopment Assets25%Rented Assets
70%
Assets to be sold23%
Dev elopment Assets30%
Rented Assets47%
Please note that at the EGM, the shareholders of Aedes SIIQ approved through a majority vote to change Article 21 of the company’s articles of association by creating a statutory reserve to which a portion of annual net earnings (about 3%) will be allocated; the goal

10
of this reserve is to cover annual debt repayments/amortisations and to support the group’s development and growth. This change gives rise to withdrawal rights for shareholders that did not vote in favour of it. Those exercising their rights will have their shares repurchased at a price equivalent to the average for the previous six months, which currently stands at Eu0.43 per share. The new reserve will be created if and only if the amount of withdrawals exercised does not exceed Eu2mn. The company’s property portfolio target beyond the 2019 business plan horizon is for around 80% of its properties to be income-bearing. The latest indications from the company (which are expected to be updated soon) suggest that the group aims to reach a total value for its portfolio of around Eu1.0bn. Aedes plans to do this through: 1) an investment of about Eu200mn in new development projects, which should add about Eu100mn to the portfolio value; 2) the turnover of around Eu150mn worth of assets currently in its portfolio; 3) further re-leverage, bringing LTV to 60%, and thus raising the value of its managed real estate assets to about Eu1bn. The company has nevertheless announced that it intends to provide a business plan update by the end of 3Q16, so the chart below only represents a broad indication of the potential development of the portfolio.
Aedes SIIQ – Expected asset portfolio value trend (Eu mn)
Source: Company Data
426
200 -150 150100
700
300
1000
0
200
400
600
800
1,000
1,200
PortfolioYE'15
Capex Sales Purchase FvAdjusted
PortfolioYE'19E
Releverage Portfoliotarget
LTV 60%
LTV 40%
The table below also shows the key targets from the latest business plan. Once again, it is important to stress that management is working on an update to the plan and some of the targets could therefore be amended (especially EBIT), partly due to the revised timing of development projects (the potential gains from the Caselle project, for example, may well shift by a couple of years).
Aedes SIIQ – Latest business plan targets (to be updated)
(Eu mn) BP Actual BP Intermonte BP Intermonte BP Intermonte BP Intermonte
Ebit 10-12 10 40-45 23 40-45 7 75-80 26 75-80 55
Equity 250-280 275 280-310 313 300-330 314 350-380 330 410-440 369Source: Company data .
2019E2015A 2016E 2017E 2018E
Internally managed group, services only internally focused. Aedes also provides asset management, administration and financing services to companies within the group. Still, it’s important to stress that going forward Aedes SIIQ only wants to focus on property investments, and that services will purely be a tool used to enhance the value of its own real estate portfolio. The companies it offers these services to are: Praga Real Estate: a property services company that is mainly involved in organising
and developing master plans and project management. It also draws up and monitors subsidised building projects, coordinates and implements building permits, oversees commercial authorisation processes and environmental impact assessments, and carries out technical and facilities management.
Praga Construction. This subsidiary predominantly carries out general contracting
services, almost exclusively for other group companies. Aedes Real Estate SGR. The company specialises in the foundation, development and
management of closed-end mutual real estate investment funds, both for the retail market and reserved for qualified investors. As at YE15 the SGR managed four real estate funds (Investietico, Dante Retail, Petrarca and Leopardi), whose combined net asset value was Eu451mn, down Eu41mn from the end of 2014 due to reduced market values of some properties held by those funds. On 11th May, Aedes SIIQ announced that it has signed a contract with Sator Immobiliare SGR for the sale of all the shares held by the former in Aedes Real Estate SGR (95% of the capital). The sale of the fund management business, foreseen in the 2014-19 business plan, is a further

11
step towards the property company model that the Aedes Group adopted when it signed up to the SIIQ regime, which allows the direct management of proprietary assets but not fund management on behalf of third parties. The company should bring in around Eu7.0mn for 95% of the SGR, net of value of the units in the Investietico fund owned by the SGR itself. The contract also stipulates that Aedes receive a preliminary distribution of items of the SGR’s shareholders’ equity amounting to Eu5.5mn, therefore bringing the price of the deal to Eu1.5mn. Moreover, Aedes will receive all of the proceeds from the liquidation of the Investietico fund for an estimated pro-quota value of around Eu2.5mn (Eu2.6mn for all of the units owned by the SGR). Please note that the asset management firm closed 2015 with net income of Eu1.3mn.
Real estate funds: taking advantage of the “Unblock Italy” decree. The acquisition of real estate funds – subsequently to be incorporated in the group’s real estate portfolio - is part of the Aedes group’s SIIQ strategy. It comes on the back of some new options introduced by the Renzi government with the “Unblock Italy” decree, which addressed the issue of real estate funds coming to maturity by trying to create new exit strategies for funds’ shareholders. In summary, the government introduced the two following options:
Listed funds. For listed funds it is possible to transfer units in exchange for shares in the SIIQ,
with exemption from stamp duty / land registry tax at the time of transfer. Moreover, the transfer is not considered to be an act that realises the potential capital gains encapsulated in the fund.
Institutional funds. For these type of funds there is also the possibility to liquidate the shares
of the funds in kind, i.e. by keeping hold of the real estate assets (this is what Aedes is doing with the recently acquired Redwood fund).

12
Portfolio description and statistics RE portfolio: concentrated in northern Italy yet well diversified Aedes’s real estate portfolio at the end of 2015. As at the end of 2015, following the comprehensive restructuring implemented over the last couple of years, Aedes SIIQ boosts a real estate portfolio concentrated in northern Italy, mostly in the regions of Lombardy and Piedmont. In terms of use classes, the portfolio is well diversified. When sizing up how big this portfolio is, it is important to stress that the group reports three different types of figures: 1) the value of the “consolidated” portfolio, which is the number reported on the balance sheet), 2) the “pro-quota” value of the consolidated portfolio, or the balance sheet number minus the portion pertaining to minorities, and 3) the total pro-quota portfolio value, or the pro-quota consolidated value plus the value of Aedes’s stakes in other funds and joint ventures. Key data for the company’s portfolio are as follows: Consolidated portfolio. At the end of 2015 Aedes SIIQ had a consolidated portfolio
GAV of Eu321mn and a NAV of Eu169mn (47.4% LTV). This represents the balance sheet figure and includes all proprietary assets as well as the real estate fund in which Aedes has a controlling stake (the Petrarca fund, in which Aedes owns 65%). When excluding minorities, GAV comes to Eu298mn and NAV Eu162mn, for an LTV ratio of 45.6%.
Total portfolio including JVs and stakes in funds. The group also has a number of
equity interests of 50% or less in other real estate funds and joint ventures. Overall, at the end of 2015 these funds and JVs had a pro-quota GAV of Eu114mn and a NAV of Eu51mn (45% LTV). When adding these to the consolidated assets, Aedes’s total pro-quota portfolio reaches a GAV of Eu412mn and a NAV of Eu214mn (48.2% LTV). The funds are Dante (33% stake, focused on the retail segment in north-central Italy), Leopardi (24.4% stake, retail and office segments in northern and southern Italy), and Investietico (1.9% stake, care homes and office properties). The JV holds assets relating to “phase 6” of the Serravalle Outlet project.
Three main clusters. The company divides its portfolio into three clusters, as follows: Rented assets. at the end of 2015 this portion consisted of 9 consolidated properties
with a GAV of Eu131.5mn and a NAV of Eu54.6mn, although when including funds and JVs the total respective values came to Eu193.5mn (47% of the total) and Eu78.2mn (37% of the total). This is the cash-generating part of the portfolio, and according to the business plan, the company is aiming to increase the weight of this cluster to 80%.
Development assets. Most of these are consolidated assets and represent the
company’s “internal” growth driver. These assets are fully concentrated in the Piedmont region and as at the end of 2015 the total pro-quota GAV was Eu126mn (30% of the total portfolio value) and NAV was Eu100mn (47% of the total).
Aedes SIIQ Portfolio (YE15): breakdown by cluster
Source: Aedes SIIQ, Intermonte SIM elaboration
Total Rented Portfolio
44%Total
Development Assets37%
Total Trading
19%
Consolidated (pro-quota)
Total Rented Portfolio
47%
Total Develop
ment Assets30%
Total Trading
23%
Total (pro-quota)
Aedes SIIQ Portfolio (YE15): breakdown by use
Source: Aedes SIIQ, Intermonte SIM elaboration
Total Retail47%
Total Office33%
Total Other20%
Consolidated (pro-quota)
Total Retail52%Total
Office24%
Total Other24%
Total (pro-quota)

13
A
edes
SIIQ
: Con
solid
ated
por
tfolio
(FY2
015)
(Eu
mn)
GA
VN
AV
GA
V %
of
Tota
lLT
VG
LA (s
qm)
Valu
e (E
u/sq
m)
Pass
ing
Yiel
dM
arke
t Yi
eld
Rent
Rent
/sqm
Occ
up.
Reta
il Re
nted
31.2
17.2
10%
45.0
%17
,048
1,83
07.
1%7.
1%2,
221
130
-O
ffice
Ren
ted
99.1
37.1
33%
62.6
%50
,934
1,94
65.
5%6.
3%5,
486
175
-O
ther
Ren
ted
1.2
0.4
0%66
.7%
1,50
679
77.
5%9.
2%90
60-
Tota
l Ren
ted
Portf
olio
131.
554
.644
%58
.5%
69,4
881,
892
5.9%
6.5%
7,79
715
686
.9%
Reta
il d
evel
op
men
t10
9.1
83.8
37%
23.3
%O
ffice
dev
elo
pmen
t0.
70.
70%
0.0%
Oth
er d
evel
op
men
t0.
00.
0na
naTo
tal D
evel
opm
ent A
sset
s10
9.8
84.4
37%
23.1
%
Tra
ding
Ren
ted
30.8
13.0
10%
57.9
%Tr
adi
ng L
and
26.3
10.3
9%60
.9%
Tota
l Tra
ding
57.1
23.2
19%
59.3
%To
tal (
pro-
quot
a)29
8.4
162.
310
0%45
.6%
Tota
l Re
tail
140.
310
0.9
47%
28.1
%To
tal O
ffice
99.8
37.7
33%
62.2
%To
tal O
the
r58
.323
.620
%59
.4%
Min
orit
ies
22.9
6.8
Tota
l (in
clud
ing
min
oriti
es)
321.
316
9.1
47.4
%
Sour
ce: C
ompa
ny d
ata,
Inte
rmon
te S
IM e
labo
ratio
n
Aed
es S
IIQ: T
otal
por
tfolio
"pro
-quo
ta" i
nclu
ding
fund
s &
JV (F
Y201
5)
(Eu
mn)
Fund
s &
JV
GA
Vas
% o
f fu
nds
& JV
as %
of
tota
l GA
VFu
nds
& JV
N
AV
Tota
l GA
V Pr
o-qu
ota
% o
f to
tal
Tota
l NA
V Pr
o-qu
ota
% o
f to
tal
Tota
l LTV
GLA
(sqm
)Va
lue
(Eu/
sqm
)Pa
ssin
g Yi
eld
Mar
ket
Yiel
dRe
ntRe
nt/s
qmO
ccup
ancy
Reta
il Re
nted
56.5
50%
14%
20.0
87.7
37.1
57.7
%56
,481
1,55
36.
8%7.
8%6,
006
119
-O
ffice
Ren
ted
1.6
1%0%
1.2
100.
738
.262
.0%
52,3
131,
924
6.4%
7.6%
6,42
219
7-
Oth
er R
ente
d3.
93%
1%2.
55.
12.
944
.0%
4,30
31,
185
6.4%
8.0%
329
80-
Tota
l Ren
ted
Portf
olio
62.0
54%
15%
23.6
193.
546
.9%
78.2
36.6
%59
.6%
113,
097
1,71
16.
6%7.
7%12
,757
147
90.5
%
Reta
il d
evel
op
men
t16
.014
%4%
16.0
125.
199
.720
.3%
Offi
ce d
evel
opm
ent
0.0
0%0%
0.0
0.7
0.7
0.0%
Oth
er d
evel
op
men
t0.
00%
0%0.
00.
00.
0na
Tota
l Dev
elop
men
t Ass
ets
16.0
14%
4%16
.012
5.8
30.5
%10
0.4
47.0
%20
.2%
288,
337
436
Tra
ding
Ren
ted
15.6
14%
4%10
.246
.423
.250
.1%
33,7
311,
376
Tra
ding
La
nd20
.418
%5%
1.6
46.7
11.9
74.6
%21
8,97
521
3To
tal T
radi
ng36
.032
%9%
11.8
93.1
22.6
%35
.016
.4%
62.4
%25
2,70
636
9To
tal
114.
010
0%28
%51
.441
2.4
213.
748
.2%
654,
140
630
Tota
l Re
tail
72.5
36.0
212.
951
.6%
136.
935
.7%
344,
818
617
Tota
l Offi
ce1.
61.
210
1.3
24.6
%38
.961
.6%
52,3
131,
937
Tota
l Oth
er
39.9
14.3
98.2
23.8
%37
.961
.4%
257,
009
382
Sour
ce: C
ompa
ny d
ata,
Inte
rmon
te S
IM e
labo
ratio
n

14
Trading assets. This is the smallest cluster, composed of properties that the company intends to sell in the near term . The YE 2015 GAV (total pro-quota) of this cluster was Eu93mn (23% of the total) and its NAV was Eu35mn (16% of the total).
Property classes by use. To analyse the portfolio’s assets based on their use, we can categorise them as follows: Retail properties. This is the largest category, accounting for some 50% of the total
both on a consolidated basis and also when adding in funds and joint ventures. The retail assets included in the rented portfolio are scattered throughout Italy and are mostly shops and medium-sized shopping centers. Among the largest assets are a building in Catania and one near Alba (Piedmont). However, the biggest retail assets are actually in the development portfolio: the Serravalle Outlet extension project and land in Caselle.
Office properties. This category represents some 33% of consolidated assets and 24%
of the total “pro-quota” portfolio. Virtually all of these assets are included in the rented portfolio and all of the major ones are located in or around Milan.
Other assets. These are all the properties in the company’s trading portfolio plus those
that cannot be categorised as either retail or office (mainly residential and healthcare properties). Among the largest assets in this class are: 1) a residential property in Milan; 2) a development area in Via Rubattino, Milan; 3) a retail property in Serravalle Scrivia; 4) a property in Cannes (France) that is in the process of being sold.
Geographical breakdown. From a geographical standpoint the portfolio is heavily concentrated in the richest regions of norther Italy. In particular, Piedmont and Lombardy are the two key regions where over 80% of Aedes’s total pro-forma assets are located. The city that stands out most in the company’s portfolio is Milan, with almost 30% of the total asset value concentrated there. Other key locations are Serravalle and Caselle, both in the north-west region of Piedmont. Aedes SIIQ (YE15): Geographical portfolio breakdown (pro-forma including JVs and funds)
Source: Aedes SIIQ, Intermonte SIM elaboration
Lombardia
38%Piedmont
44%
Sicily5%
Other13%
Milano28%
Serravalle (Alessand
ria)20%
Caselle (Turin)15%
Other37%
Main tenants. The portfolio is also relatively well diversified in terms of tenants, with the largest (information provider and rating agency Cerved) accounting for 22% of total rents and the top five tenants accounting for about 73% of total rents. Besides Cerved, other key tenants include companies such as COIN/Oviesse, NCTM Lawers, BP Property Management, and GS/Esselunga. Aedes SIIQ: Weight of main tenants (YE15), excluding development projects)
Source: Company data, Intermonte SIM elaboration
0.0%
5.0%
10.0%
15.0%
20.0%
25.0%
30.0%
Cerved COIN/Oviesse NCTMLawyers
BP PropertyMgmt
GS/Esselunga Other
Lease expiry profile. The lease expiry profile is relatively short as the weighted average lease term (WALT) stands at just 2.6 years (this includes the Redwood portfolio acquired in 1Q16 which has a WALT of about 3 years). Around 50% of total rents are potentially expiring within

15
three years, based on the first potential break-off point, with another 28% in 2019 and the remaining 24% after that. Aedes SIIQ: Average WAULT: 2.6 years* (first expiry)
Source: Company data, Intermonte SIM elaboration * Inc. Redwood
0.0%
5.0%
10.0%
15.0%
20.0%
25.0%
30.0%
35.0%
2016 2017 2018 2019 after
Income-bearing portfolio: room to work on vacancy rates …. While on the one hand rents have largely stabilised, on the other hand there is potential to improve vacancy rates, which stand at 13% for the fully consolidated portfolio. These vacancies are mostly concentrated in two assets that form part of the Petrarca fund: 1) an office building in Cinisello Balsamo (Milan) with a 92% vacancy rate and a fair value of Eu14.5mn (100%) or just Eu550/m2 (which should make it relatively easy to find new tenants); 2) an office building (the Colleoni office centre) in Agrate Brianza (Monza) with a vacancy rate of 48% and a fair value of Eu18.5mn (100%). … although reversionary potential is limited. There is limited reversionary potential in Aedes’s SIIQ portfolio. Specifically, when looking at the fully consolidated part of the income-bearing portfolio there is slight negative reversionary potential as the 6.5% market yield is lower than the passing yield at full occupancy (6.8%, considering that the vacancy rate stands at 13%). The situation improves slightly when looking at the entire pro-quota portfolio: here the market yield of 7.7% compares to a passing yield at full occupancy of 7.3% suggesting an average 5% reversionary potential. Real estate funds and joint ventures. As mentioned earlier, Aedes’s real estate portfolio contains not just directly owned properties, but also numerous properties held indirectly through stakes in real estate funds. As at 31st December 2015, the company was manager of four different real estate funds, one created for public sector savings and three reserved for qualified institutional investors. Petrarca (fully consolidated): founded in November 2006, this fund specialises in the office
segment and has five residual properties and Eu61.3mn in total assets. Aedes’s stake in Petrarca is 65%, so its pro-quota GAV was Eu38mn at the end of 2015 and its pro-quota NAV was Eu10mn. The other two investors in the fund are IVG Logistic Holding and IMF Italy Office Fund (both German).
Aedes SIIQ: Non-consolidated funds and joint ventures
(Eu mn)Funds & JV
GAVas % of
funds & JVas % of
total GAVFunds & JV
NAVLTV Total GAV
Pro-quota
Retail Rented 56.5 50% 14% 20.0 65% 87.7Office Rented 1.6 1% 0% 1.2 25% 100.7Other Rented 3.9 3% 1% 2.5 37% 5.1Total Rented Portfolio 62.0 54% 15% 23.6 62% 193.5
Retail development 16.0 14% 4% 16.0 0% 125.1Office development 0.0 0% 0% 0.0 0.7Other development 0.0 0% 0% 0.0 0.0Total Development Assets 16.0 14% 4% 16.0 0% 125.8
Trading Rented 15.6 14% 4% 10.2 35% 46.4Trading Land 20.4 18% 5% 1.6 92% 46.7Total Trading 36.0 32% 9% 11.8 67% 93.1Total 114.0 100% 28% 51.4 55% 412.4
Total Retail 72.5 36.0 212.9Total Office 1.6 1.2 101.3Total Other 39.9 14.3 98.2
Source: Company data, Intermonte SIM elaboration Dante Retail (equity participation): established in July 2005, this fund focuses on the retail
segment. Its tenants include supermarket chains Carrefour (ex Billa) and Esselunga. The

16
residual portfolio contains 22 properties (full occupancy) with a total asset value of about Eu140.5mn. Aedes owns 33.33% of this fund through the vehicle Efir S.à r.l. At the end of 2015, the pro-quota GAV was Eu43.5mn while the pro-quota NAV was Eu18.5mn. Two French institutional investors, Caisse Depots et Consignations and the pension fund UMR, own equal stakes to Aedes (also invested through Efir S.à r.l.), while the fund, which matures in 2022, is managed by Aedes SGR.
Leopardi (equity participation): this fund is effectively the distressed assets fund carved out
of Aedes’s old portfolio in the debt restructuring and recapitalisation process (please note that assets were transferred to the fund only after their fair values were adjusted to market prices). This fund has diversified investments in the residential, tertiary, hotel, industrial and commercial segments of the real estate market, as well as in land earmarked for development. As at 31st December 2015, Leopardi owned 20 buildings or portions of buildings plus majority stakes in companies that owned real estate. The fund’s total asset value was about Eu73.9mn, while the total value of all properties held directly or indirectly was Eu172.8mn. Aedes owns 24.4% of the fund’s quotas, so its pro-quota GAV was Eu15.6mn at the end of 2015 and its pro-quota NAV was Eu3mn (or Eu10.7mn including non-consolidated equity stakes). Leopardi’s other stakeholders are A, B and C. The fund is managed by Aedes SGR and it matures in 2022.
Investietico (equity participation): this is a fund listed on the Italian Stock Exchange that
invests mainly in healthcare facilities and offices. Its residual portfolio consisted in 11 buildings and a total asset value of Eu174.8mn. Aedes owns 2% of the fund through Aedes Real Estate SGR. At the end of 2015, the pro-quota GAV was Eu2.9mn and pro-quota NAV was Eu2.2mn. The fund is managed by Aedes SGR and it matures in 2018.
2016 acquisitions: the Redwood portfolio. In March 2016 Aedes SIIQ purchased 100% of the Redwood real estate fund. The acquisition went through in two stages: 1) the purchase of 70% of the fund at a price of Eu16.4mn; 2) the acquisition of financial receivables which had the remaining 30% of the fund as collateral for Eu13.6mn. The upshot of these two deals was that Aedes SIIQ took ownership of 100% of the units in the fund for a total price of Eu30mn, of which Eu25mn for the real estate and trading licences and Eu5mn for the cash position. Based on existing rental contracts (Eu3.6mn), the overall price corresponded to a gross entry yield of 15%. The fund owns 18 retail properties located in various parts of Italy (Unieuro, Metro, etc.) and 9 trading licences held through Redwood S.r.l., a vehicle company controlled in its entirety by the fund itself. The portfolio has a weighted average lease term of three years or slightly higher than the rest of the portfolio.
Redwood portfolio: Key data
City Region GLA (sqm)Avg. Purchase Price (Eu mn)
FV/Sqm (Eu)
OccupancyRent
(Eu mn)Rent/Sqm
(Eu) *Yield
Lamezia Terme (CZ) Calabria 2,814La Spezia Liguria 3,514Brescia Lombardia 1,869Brescia Lombardia 3,460
Rosà (VI) Veneto 2,870Roma Lazio 4,075
Tavagnacco (UD) Friuli-Venezia G. 4,200Trezzano S.N. (MI) Lombardia 10,380
S. Giovanni Teatino (CH) Abruzzo 3,015Castagnito (Cn) Piemonte 3,000
Genola (CN) Piemonte 3,100Genola (CN) Piemonte 2,202Saluzzo (CN) Piemonte 1,914
Castagnito (Cn) Piemonte 1,075Caleppio di Settala (MI) Lombardia 1,950
Bra (CN) Piemonte 1,637Acqui Terme (AL) Piemonte 790
Bassano del Grappa Veneto 4,464
Total 56,329 25 444 73.7% 3.6 87 14.4%Source: Company data, Intermonte SIM elabotation * Rent/sqm calculated on rented space

17
Development portfolio: the organic growth option The development property portfolio is composed chiefly of projects for commercial use. The company expects some of these initiatives to turn into income-generating assets. Financial leverage is on the whole much lower than in the rest of the portfolio, at 20.2%. New financing deals are expected to be reached for the key initiatives in order to ensure that the construction costs can be sustained. Serravalle Designer Outlet: a success story. A number of Aedes’s development initiatives centre around the Serravalle Scrivia “Designer Outlet”. The Serravalle Designer Outlet is the largest outlet in Europe. It was opened in 2001 and managed by UK company McArthur Glen, which together with Giuseppe Roveda’s Praga group subsequently developed the complex, opening the Serravalle Retail Park and the Serravalle shopping centre. Indeed, the project was the first building block in the major requalification of the local area between Serravalle Scrivia and Novi Ligure, a process that continues to this day with other major construction works in progress. The Designer Outlet now covers a total of 45,000m2, and hosts more than 180 stores selling over 300 designer brands. It offers a unique shopping experience to over 4mn annual visitors thanks to the modern services connected to the on-site commercial activities. It is located around one hour from Milan and an hour and a half from Genoa, in Serravalle Scrivia (AL), Piedmont, and can be easily reached from both these cities and Turin, as it has its own junction on the A7 Milan-Genoa motorway and is on the Turin-Genoa railway line. Serravalle Outlet Village – Phase 6 (Pragasei S.r.l.). On 9th June 2015, Aedes Group formed a strategic partnership with major global investment company TH Real Estate and McArthur Glen, a company that runs 20 designer outlets in Europe, five of which in Italy, to begin the executive phase of development at Serravalle Outlet Village. On land owned by Pragasei S.r.l. (50.1% owned by Aedes), 10,577m2 of commercial space will be built. Funding for this project is fully ensured by the cash TH Real Estate is to transfer once works reach an advanced stage, while Aedes’s portion of the funding was allocated when the partnership was established. The residual cost will be covered by a mid/long term loan to be disbursed by Credit Agricole.
Development for rents assets: Serravalle Outlet and Retail Park
Source: Company data * Of which Praga Business Praga total GLA 4,361 sqm
The letting process began in June 2015 and agreements have already been reached to let about 61% of the commercial space, while negotiations are in a final phase for a further 18%. Rents already agreed amount to about Eu630 per square metre plus a variable fee based on revenue. These preliminary agreements will be converted into full leases soon before the shopping centre opens, in accordance with standard market practice. Based on the construction progress made so far, the company estimates that Phase 6 of Serravalle Outlet Village will be inaugurated in late September or early October this year. Serravalle Designer Outlet – Phase 5. Parallel to Phase 6, Phase 5 of the Serravalle Designer Outlet also got underway. In this project, about 2,800m2 of commercial space will be built on proprietary land that belongs to the company that owns Serravalle Outlet, a business partner of Aedes in Pragasei S.r.l. The business agreement between Aedes and TH Real

18
Estate to expand the Serravalle shopping centre foresees increasing the total number of stores to 260 and total retail space to 51,500 square metres. Once the investments have been made, Serravalle will solidify its standing as the biggest luxury outlet in Europe and one of the top fashion destinations on the continent. Serravalle Outlet Village – Phase 7. This represents an extension of Serravalle outlet village Phase 6 and covers an area of around 10,000 sqm of which 50% owned by a subsidiary of Aedes SIIQ. The development plan has been approved and the environmental screening was completed with favourable outcome. The application for full planning permission has been presented. Serravalle Outlet and Caselle geographical position
Source: Intermonte SIM elaboration Caselle Torinese. This project is being put forward by Satac, a SIINQ of Aedes SIIQ. About Eu300mn will be required to build this shopping centre near the Turin airport; it will include a food court, sport facilities (a gym and other establishments), entertainment (a cinema, bowling alley, an adventure land, etc), as well as fashion and design retailers. Road access to the area will be completely overhauled, including a connection between the airport and the shopping village. Management expects to split the project into three phases. Works on phase one are scheduled to start in 2017 (with the site to open at the beginning of 2019) and will relate to around 50k sqm and account for some 40% of the overall investment (i.e. around Eu120mn). JL Lasalle has won the contract for the sale of retail spaces while Aedes is having discussions with two entertainment sector leaders (one of them would run the project’s leisure anchor).
Development for rents assets: Caselle Desiner Village
Source: Company data
19
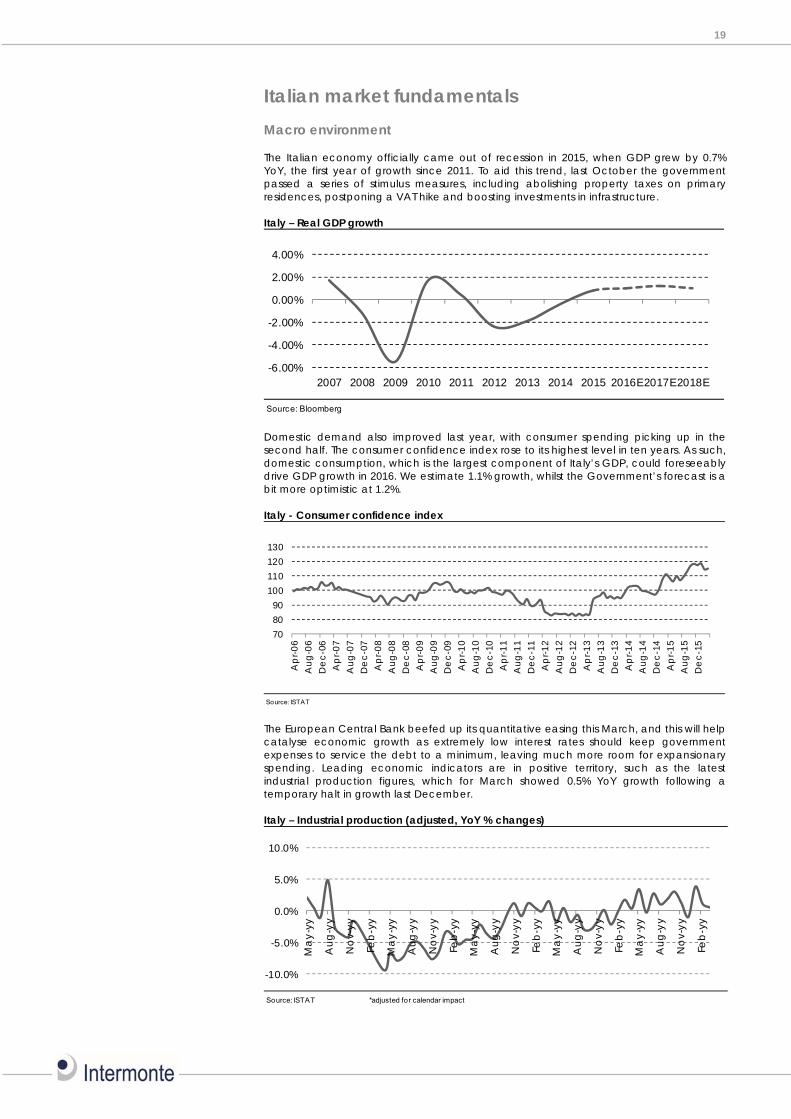
Italian market fundamentals Macro environment The Italian economy officially came out of recession in 2015, when GDP grew by 0.7% YoY, the first year of growth since 2011. To aid this trend, last October the government passed a series of stimulus measures, including abolishing property taxes on primary residences, postponing a VAT hike and boosting investments in infrastructure. Italy – Real GDP growth
Source: Bloomberg
-6.00%
-4.00%
-2.00%
0.00%
2.00%
4.00%
2007 2008 2009 2010 2011 2012 2013 2014 2015 2016E 2017E 2018E
Domestic demand also improved last year, with consumer spending picking up in the second half. The consumer confidence index rose to its highest level in ten years. As such, domestic consumption, which is the largest component of Italy’s GDP, could foreseeably drive GDP growth in 2016. We estimate 1.1% growth, whilst the Government’s forecast is a bit more optimistic at 1.2%. Italy - Consumer confidence index
Source: ISTAT
708090
100110120130
Ap
r-06
Aug
-06
De
c-06
Ap
r-07
Aug
-07
De
c-07
Ap
r-08
Aug
-08
De
c-08
Ap
r-09
Aug
-09
De
c-09
Ap
r-10
Aug
-10
De
c-10
Ap
r-11
Aug
-11
De
c-11
Ap
r-12
Aug
-12
De
c-12
Ap
r-13
Aug
-13
De
c-13
Ap
r-14
Aug
-14
De
c-14
Ap
r-15
Aug
-15
De
c-15
The European Central Bank beefed up its quantitative easing this March, and this will help catalyse economic growth as extremely low interest rates should keep government expenses to service the debt to a minimum, leaving much more room for expansionary spending. Leading economic indicators are in positive territory, such as the latest industrial production figures, which for March showed 0.5% YoY growth following a temporary halt in growth last December. Italy – Industrial production (adjusted, YoY % changes)
Source: ISTAT *adjusted for calendar impact
-10.0%
-5.0%
0.0%
5.0%
10.0%
Ma
y-yy
Aug
-yy
No
v-yy
Feb
-yy
Ma
y-yy
Aug
-yy
No
v-yy
Feb
-yy
Ma
y-yy
Aug
-yy
No
v-yy
Feb
-yy
Ma
y-yy
Aug
-yy
No
v-yy
Feb
-yy
Ma
y-yy
Aug
-yy
No
v-yy
Feb
-yy
20
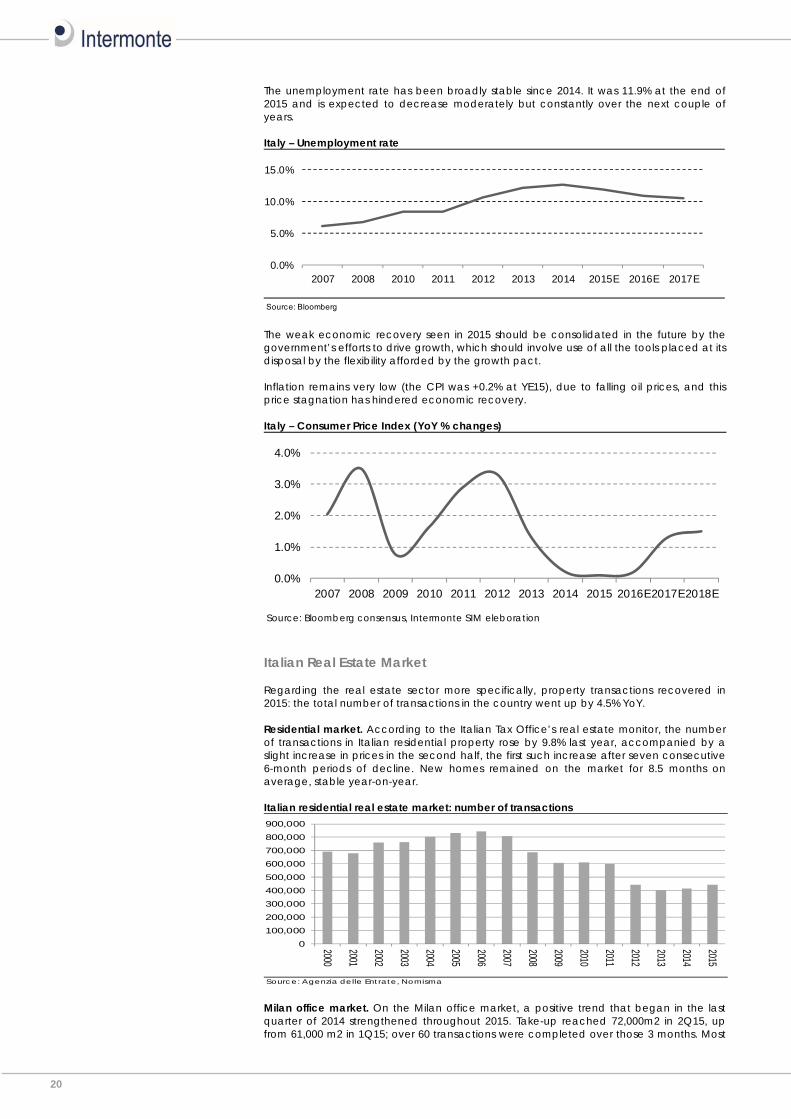
The unemployment rate has been broadly stable since 2014. It was 11.9% at the end of 2015 and is expected to decrease moderately but constantly over the next couple of years. Italy – Unemployment rate
Source: Bloomberg
0.0%
5.0%
10.0%
15.0%
2007 2008 2010 2011 2012 2013 2014 2015E 2016E 2017E
The weak economic recovery seen in 2015 should be consolidated in the future by the government’s efforts to drive growth, which should involve use of all the tools placed at its disposal by the flexibility afforded by the growth pact. Inflation remains very low (the CPI was +0.2% at YE15), due to falling oil prices, and this price stagnation has hindered economic recovery. Italy – Consumer Price Index (YoY % changes)
Source: Bloomberg consensus, Intermonte SIM eleboration
0.0%
1.0%
2.0%
3.0%
4.0%
2007 2008 2009 2010 2011 2012 2013 2014 2015 2016E2017E2018E
Italian Real Estate Market Regarding the real estate sector more specifically, property transactions recovered in 2015: the total number of transactions in the country went up by 4.5% YoY. Residential market. According to the Italian Tax Office’s real estate monitor, the number of transactions in Italian residential property rose by 9.8% last year, accompanied by a slight increase in prices in the second half, the first such increase after seven consecutive 6-month periods of decline. New homes remained on the market for 8.5 months on average, stable year-on-year. Italian residential real estate market: number of transactions
Source: Agenzia delle Entrate, Nomisma
0100,000200,000300,000400,000500,000600,000700,000800,000900,000
2000
2001
2002
2003
2004
2005
2006
2007
2008
2009
2010
2011
2012
2013
2014
2015
Milan office market. On the Milan office market, a positive trend that began in the last quarter of 2014 strengthened throughout 2015. Take-up reached 72,000m2 in 2Q15, up from 61,000 m2 in 1Q15; over 60 transactions were completed over those 3 months. Most

21
of this growth came from the financial sector, which accounted for over 25% of the new leases. Moreover, most of the transactions were small in scale; only five were large-scale deals. According to CBRE estimates, over 370,000 offices were rented out in Milan, a 34% YoY increase. Rental prices remained broadly stable, going up slightly only in high quality offices in central business districts (CBDs), where supply is scarce. Annual rent rates averaged about Eu200/m2 in outlying areas and Eu480/m2 in CBDs. Vacancy rates held rather stable, at about 12.5% in Milan, or 12.8% including the city’s suburbs. Italian residential real estate market: number of transactions
Source: Agenzia delle Entrate
-40%
-25%
-10%
5%
20%
0
25,000
50,000
75,000
100,000
125,000
150,000
175,000
200,000
1Q082Q083Q084Q081Q092Q093Q094Q091Q102Q103Q104Q101Q112Q113Q114Q111Q122Q123Q124Q121Q132Q133Q134Q131Q142Q143Q144Q141Q152Q153Q154Q15
Transactions Change YoY
Milan office market: prime office yields (%) 1Q15 2Q15 3Q15 4Q15 10YH 10YLMilan CBD 4.8 4.8 4.5 4.5 5.3 4.0
Milan Periphery 7.0 7.0 6.8 6.5 7.5 5.0
Source: C&W Milan office Market: prime office rents
Source: DTZ, JLL
0100200300400500600
2004 2005 2006 2007 2008 2009 2010 2011 2012 2013 2014 2015
CBD Centre-out of CBD Periphery
Factory Outlets in Italy. The Designer Outlet market in Italy developed much later than in the rest of the world. The first such outlet, the “Fifty Factory Store” in Saronno (VA), was opened in 1995. As things stand, however, Italy is one of the leading countries in the world in terms of the number of open outlet stores. The success of this formula can be explained by the ability of outlets to understand market sectors left uncovered by other formats, benefiting both manufacturers and consumers. In more detail, factory outlets are complex out-of-town shopping centres, which bring together a range of mono-brand stores with a specific commercial offer. This normally involves attractive brands being sold at lower prices than are on offer at traditional town centre retailers. Out-of-town outlet centres generally cover over 10,000m2, and are located close to major roads. These areas must also provide various services in addition to the commercial offers from the outlet stores. The key feature of the centres is the size of the discount to retail prices, which on average comes in at 30-70%. The main actors involved in the construction of outlets are: 1) real estate investors; 2) management companies; and 3) retailers. Investment activity. Investments in Italian real estate rose by 55% in 2015, pushed up by a few major transactions in Milan. Italy’s second largest city in fact accounted for 54% of investments made in the country thanks to three large deals, namely: 1) the Porta Nuova project, purchased by the Qatar Investment Authority for Eu900mn; 2) the purchase of Torre Isozaki by Allianz for Eu367mn; and 3) the sale of Palazzo Broggi, in Piazza Cordusio, to Fosun for Eu345mn. Analysing individual market segments in more detail, one notices that investors were most keen on offices, where investment volumes rose by 139% YoY. On the contrary, residential segment investments collapsed by 44%. These figures highlight how investors have

22
regained interest in the Italian real estate market. Investors are most attracted to ‘core’ assets where supply is scarce. The market is therefore concentrating on properties that can be adapted to tenant and investor demand. In addition to a dearth of good quality properties, there are not a lot of properties worth over Eu100mn on the Italian market. Italian real estate market: investment activity by segment (Eu mn)
Source: BNP Paribas Real Estate, Intermonte SIM eleboration
0
1,000
2,000
3,000
4,000
5,000
6,000
7,000
8,000
2006
2007
2008
2009
2010
2011
2012
2013
2014
2015
Mixed/Other Retail Offices
Specifically regarding Italy’s two leading urban markets, Rome and Milan, the former seems to have returned to the average investment volume level seen in the past decade, although that level is below Milan’s, where the economic recovery is in full swing. Furthermore, the Milan property market is generally considered more liquid than the Rome market.

23
Group Financials & Estimates Group Financials As described earlier, over the past few years the group has gone through an intense process of restructuring and the company’s financials today are very different from what they looked like just a couple of years ago. For this reason, we have limited our ‘historical’ analysis to 2014 and 2015 only. Income statement. In 2015 Aedes earned a net profit and key indicators improved from 2014 after adjusting for non-recurring expenses connected with the 2014 restructuring. 2015 net profit was Eu5.2mn with a non-recurring effect of Eu1.7mn, whereas the net profit of Eu50.5mn achieved in 2014 included a non-recurring gain of Eu73.9mn linked to the restructuring. Gross rents came to Eu7.4mn in 2015, down from Eu10.7mn in 2014 owing to the disposal of some non-core properties to the Leopardi fund. A substantial portion of revenues come from services provided, amounting to Eu13.9mn in 2015 thanks to heightened activity at subsidiary Praga Construction S.r.l. (Eu6.6mn), related to Phase 6 of the Serravalle Outlet Village project as well as a Carrefour shopping centre development project in the town of Nichelino. Aedes SIIQ - Income Statement (Eu mn) 2014A 2015AGross rents 10.7 7.4
direct costs -4.3 -2.4
Net Rents 6.4 5.0Margin on rents 60% 68%
Rev enues from sales 17.1 10.3
Rev enues from serv ices 7.9 13.9
Disposal of participations 4.4 3.8
Other rev enues 2.2 6.7
Gross Revenues 42.4 42.1Net Revenues 22.3 32.1Labour cost -4.7 -5.8
Other costs -9.4 -10.9
Costs for serv ices -10.7 -14.5
Capitalised expenses 1.2 5.5
EBITDA -1.4 6.4Margin on Net rev enues -6.2% 19.9%
Net rev aluation/D&A -2.8 2.0
EBIT -23.1 7.4Financial charges -5.5 -4.3
Income from equity inv estments -1.7 -1.1
Other items 73.9 3.9
Pre tax Profit before minorities 43.6 6.9Total taxes 6.2 -0.9
Tax rate ns -12%
Net result before minorities 49.8 6.1
Minorities -0.7 1.0
Assets held for sale 0.0 0.0
Net Result 50.5 5.1Funds From Operations -10.4 -13.1Source: Company data, Intermonte SIM elaboration Revenues from disposals of properties came down to Eu10mn in 2015 (from Eu17mn in 2014), although the operating margin from such sales increased from Eu1.4mn in 2014 to Eu2.7mn. Other revenue rose from Eu2.2mn to Eu6.7mn, thanks to a Eu3.8mn revaluation of the Petrarca fund based on an expert independent appraisal by Cushman & Wakefield after the company’s acquisition of 50% of the fund’s quotas. With regard to cost items, as well as general expenses they also include the cost of services, including those related to the general contracting activity of subsidiary Praga Construction. In 2015, personnel costs amounted to Eu4mn (or Eu5.8mn when including pension costs) and the cost of executive remuneration amounted to Eu1.9mn. Please note that at the end of 2015

24
the group had a total headcount of 74, around 25 of which were working at the SGR and in other non-core activities. No major write-downs were taken in 2015, in contrast with 2014, when Eu8.2mn in impairments were booked on receivables due from companies sold, another Eu6.2mn on other receivables and Eu1.8mn on goodwill for the equity stake in Aedes Real Estate SGR S.p.A. In 2015, the fair value of real estate investments was actually raised by Eu2.0mn overall (Eu6.0mn in write-ups minus Eu4.0mn in write-downs); by comparison, net value adjustments in 2014 were negative to the tune of Eu2.8mn. In 2015, there were Eu0.9mn write-downs on inventories down from 4.2mn in the previous year. Income from associate companies and joint ventures was in the red to the tune of Eu1.1mn last year, an improvement from the Eu1.7mn loss in 2014. Below the EBIT line, the company had registered a huge one-off gain of Eu74mn due to the debt restructuring and recapitalisation operations, while in 2015, this item was limited to a Eu1.7mn gain (not related to the restructuring). Net financial charges, including fair value adjustments on derivatives used to hedge interest rate risk, came to Eu4.3mn in 2015, down from Eu5.5mn in 2014. This item was the result of Eu0.9mn in gains minus Eu5.3mn in losses. Taxes incurred amounted to Eu0.8mn in 2015, whereas the company had benefited from negative taxes to the tune of Eu6.2mn in 2014. The 2015 figure was the difference between Eu2.6mn in charges (including the exit tax to adjust property values to standard values used for companies in the SIIQ system) and a Eu1.8mn positive entry from deferred taxes. It should be underlined that the group has Eu206mn in carried forward losses, despite which it has not booked any deferred tax assets for losses, other than for a minimal amount (roughly Eu1mn). Balance sheet. The group had Eu326mn in capital assets at the end of 2015, up from Eu165mn a year before, mainly due to higher real estate investments and other tangible assets, which went from Eu106mn to Eu270mn after development assets were reclassified from ‘inventories’ to ‘tangible fixed assets’. More specifically, in keeping with the group’s strategic guidelines, real estate development assets held by subsidiaries under the SIINQ (non-listed real estate investment company) regime were reclassified as at 31st December 2015, and will now be included with property investments. This reclassification did not per se imply any increase in value, as even though they are accounted at fair value in accordance with IAS 40, the group’s accounting policy for properties in the development phase is to use the cost criteria until the related fair value appraisal becomes reliable enough for it to be valued as such on a continuous basis. Other capital assets include equity stakes in associate companies and joint ventures, amounting to Eu53mn as at the end of last year. Net working capital stood at Eu55mn, well below the Eu215mn registered at the end of 2014. This is because inventories fell from Eu188mn to Eu54mn owing to the reclassification of development assets described above. Also, inventories pertaining to Praganove S.r.l. and Pragasei S.r.l. (amounting to Eu25mn) were deconsolidated. Gross debt went from Eu156mn to Eu164mn in 2015. Debt subject to variable interest rates made up 69.6% of the total, down from 100% in 2014, after Aedes signed an interest rate collar contract in November 2015 with a 0% strike rate for the floor and a 1% rate for the cap. The notional amount on this loan contract is Eu50mn and the loan is due to be repaid in full in December 2020. As at 31st December 2015, the average residual loan duration was 2.4 years, but some extensions of short term loans concluded in the first few months of 2016 have brought that average duration up to 3 years, as was the case in 2014. The group ended 2015 with a net debt position of Eu95mn, thanks to gross cash and cash equivalents of Eu68mn. After adding the holding company’s cash and equivalents, the group’s consolidated loan to value (LTV) ratio was 30%, significantly lower than the consolidated real estate portfolio’s LTV ratio of 47%. Aedes SIIQ: Balance Sheet (Eu mn) 2014A 2015AFixed assets 165 326
Working capital 215 56
Invested capital 380 382Group sharehold. equity 239 275Other 17 11
Net debt 124 96
Total Liabilities 380 382Source: Company data

25
1Q 2016 Results 1Q16 results up thanks to higher rents and a write-up of the Redwood portfolio. Aedes SIIQ reported a good set of 1Q16 results, up sharply year-on-year. Gross revenue came in at Eu27mn, much higher than the Eu10.4mn in 1Q15. This increase came thanks to a greater contribution from rent income, which grew from Eu1.4mn to Eu2.6mn mainly as a consequence of the 3Q15 consolidation of the Petrarca fund. Including rents from the Redwood portfolio, which was purchased at the end of 1Q16, total rent income would have been Eu3.4mn. Yet the factor that brought revenue up most of all was higher other income (Eu16.5mn vs. Eu0.7mn in 1Q15), due to a write-up of the Redwood portfolio above the acquisition price. Total costs came to Eu11.4mn, up from Eu8.5mn in 1Q15; this increase is entirely attributable to general contractor costs, which were more than offset by higher corresponding revenues. EBITDA was Eu15.7mn in 1Q16, well above the Eu1.9mn seen in 1Q15, while EBIT was Eu15.6mn (vs. Eu1.5mn) and pre-tax profit was €14.2mn (vs. €0.3mn a year ago). Aedes SIIQ: 1Q16 Profit & Loss (Eu mn) 1Q15A 1Q16AGross rents 1.4 2.6
direct costs -0.5 -0.7
Net Rents 1.0 1.9Margin on rents 68% 73%
Rev enues from sales 4.3 0.5
Rev enues from serv ices 7.9 7.6
Disposal of participations 2.2 0.0
Other rev enues 0.7 16.5
Gross Revenues 16.4 27.1EBITDA 1.9 15.7Net rev aluation/D&A 0.0 -0.3
EBIT 0.0 15.5Financial charges -1.2 -1.4
Income from equity inv estments 0.0 0.1
Other items -0.4 0.0
Pre tax Profit before minorities 0.3 14.2Total taxes na na
Net result before minorities 0.3 14.2
Minorities 0.2 0.1
Assets held for sale 0.0 0.0
Net Result 0.1 14.1Source: Company data, Intermonte SIM elaboration On the balance sheet, shareholders’ equity closed the quarter at Eu289mn, compared to Eu275mn at the end of 2015. Net debt stood at Eu125mn, up from Eu96mn at the end of last year, chiefly as a result of the Redwood fund acquisition. Aedes SIIQ - Invested capital (Eu mn) 1Q15A 1Q16AGroup shareholders equity 275 289
Other 11 11
Net debt 96 125
Invested Capital 382 425Source: Company data

26
Group Estimates (2016-2019E) Rental income and other revenues. On a like-for-like basis we expect rents to grow at a CAGR of around 7% over the next four years (based on annualised Eu13.6mn of rents in 2015 which includes the Redwood portfolio). Our underlying assumptions are as follows: 1) a relatively subdued inflationary environment (2016-2019 average of +1.4%); 2) reduction of vacancy rates particularly at the Petrarca fund (from 42% to around 25%) and Redwood (from 26% to 13%) funds; 3) limited reversionary potential within the outstanding contracts. When including acquisitions/disposals and the first phase of the Caselle development project, on the other hand, we foresee gross rents to move from Eu13.6mn in 2015 to Eu41mn in 2019 thanks to around Eu130mn of acquisitions made at an average yield of 7.5% (and despite some Eu40mn of disposals that we have assumed will come from vacant assets in the trading portfolio) and thanks to some Eu15mn of rents coming from the Caselle retail park (9.5% yield on cost, slightly below the company’s double-digit assumption). For net rents we have calculated a margin of 82% on new gross rents. As far as services are concerned we have assumed a decreasing contribution from Praga Construction’s projects in Serravalle and also excluded the contribution of the SGR from 2H 2016 onwards following the agreement to sell the company to Sator. Aedes SIIQ: Profit & Loss Estimates (Eu mn) 2014A 2015A 2016E 2017E 2018E 2019EGross rents 10.7 7.4 14.5 18.1 23.7 40.7
direct costs -4.3 -2.4 -3.6 -4.4 -5.4 -7.9
Net Rents 6.4 5.0 10.9 13.8 18.4 32.8Margin on rents 60% 68% 75% 76% 77% 81%
Rev enues from sales 17.1 10.3 10.0 10.0 10.0 10.0
direct sales costs -15.8 -7.6 -10.0 -10.0 -10.0 -10.0
Net Sales Margin 1.4 2.7 0.0 0.0 0.0 0.0
Rev enues from serv ices 7.9 13.9 11.2 8.0 6.5 4.0
Disposal of participations 4.4 3.8 0.0 0.0 0.0 0.0
Other rev enues 2.2 6.7 16.5 0.0 0.0 0.0
Gross Revenues 42.4 42.1 52.2 36.1 40.2 54.7Net Revenues 22.3 32.1 38.6 21.8 24.9 36.8Labour cost -4.7 -5.8 -5.9 -6.0 -6.0 -6.1
Other cost -9.4 -10.9 -11.0 -100.0 -99.8 -5.8
Costs for serv ices -10.7 -14.5 -10.5 -8.8 -7.3 -4.9
Capitalised expenses 1.2 5.5 6.0 95.0 94.0 0.0
EBITDA -1.4 6.4 17.2 2.0 5.8 20.0Margin on Net rev enues -6.2% 19.9% 44.5% 9.4% 23.3% 54.3%
Net rev aluation/D&A -2.8 2.0 5.8 4.8 20.7 35.1
EBIT -23.1 7.4 23.0 6.9 26.5 55.0Financial charges -5.5 -4.3 -4.7 -6.7 -9.5 -10.9
Income from equity inv estments -1.7 -1.1 -0.5 1.0 1.2 1.6
Other items 73.9 3.9 0.0 0.0 0.0 0.0
Pre tax Profit before minorities 43.6 6.9 17.8 1.2 18.1 45.7Total taxes 6.2 -0.9 -0.2 -0.2 -0.2 -0.2
Tax rate ns -12% -1% -16% -1% 0%
Net result before minorities 49.8 6.1 17.6 1.0 17.9 45.5
Minorities -0.7 1.0 0.5 0.5 0.5 0.5
Assets held for sale 0.0 0.0 0.0 0.0 0.0 0.0
Net Result 50.5 5.1 17.1 0.5 17.4 45.0Funds From Operations -9.7 -14.0 -5.3 -4.3 -3.2 9.9Source: Intermonte SIM estimates based on company data Operating costs. Excluding services, we have assumed a cost base of some Eu10-11mn per year, down on 2015 numbers as we assume a lower impact from fees related to professional services. The capitalised expenses relate to CAPEX made on work in progress assets and have no net impact on the cost base nor EBITDA. Taxation. The group has applied to the SIIQ regime, which will be enforced with effect from 2016. The entry tax was already paid in 2015, so from this year the company’s activities that fall under the regime will be fully exempt from IRES and IRAP taxation (please see Appendix II for details on the SIIQ regime). At the moment the main activities that fall outside the SIIQ regime (apart from the services companies, which are not eligible) include the Petrarca

27
fund (in order to benefit from the SIIQ regime the controlling stake would need to be at least 95% vs. the current 65%) and the Redwood fund, although the latter will soon be closed down and its assets moved into the “tax exempt” portfolio. Please note that thanks to Eu206mn of carried forward losses we estimate substantially no taxes over the next few years. Development projects. The group is currently mainly involved in the development of the so called “phase 6” of the Serravalle Outlet, a 10,600m2 extension of the existing outlet, which is expected to be completed before the end of 2016. Please note that as Aedes SIIQ controls 50.1% of the JV responsible for the project, it is not fully consolidated but only booked at equity. In our estimates we have also included the first phase of the Caselle project. We have assumed that this first phase will involve around 85,000m2 (of which 10,000m2 relating to the entertainment component and the remainder to commercial developments) with a CAPEX commitment of roughly Eu160mn. We have also assumed that this phase will be completed in 2018 and that it will yield around Eu15mn of gross rental income as of 2019. Aedes SIIQ: Balance Sheet Estimates (Eu mn) 2014A 2015A 2016E 2017E 2018E 2019EFixed assets 165 326 419 534 658 704
Working capital 215 56 55 54 52 51
Inv ested capital 380 382 474 587 711 754
Group sharehold. equity 239 275 286 287 303 342Other 17 11 27 25 23 20
Net debt 124 96 161 275 385 392
Total Liabilities 380 382 474 587 711 754Source: Intermonte SIM estimates based on company data Portfolio valuations. We have assumed that the overall portfolio will see a revaluation of around 1.4% per year over the next 4 years, representing a premium of some 0.5% over the 75% inflation indexation (this means that we assume only a very slight compression of rental yields). On top of this we have incorporated the write-up in the value of specific assets such as the Redwood fund (Eu16.1mn that were already booked in 1Q16), as well as the some of the phases of the Serravalle development. Leverage and financing. In addition to the development CAPEX for phase 1 of the Caselle project, our model also includes around Eu130mn for acquisitions in the 2016-19 period (including the purchase of the Redwood fund), partly offset by Eu40mn of disposals. These assumptions should drive the group’s loan to value ratio to around 56-58%. As for the group’s financing, we have assumed that the average duration will be extended to around 5-6 years, with a cost of debt of below 3% (i.e. close to current levels). Cashflow. According to our estimates the group’s funds from operations (effectively cashflow from operations), should go from around Eu-14mn in 2015 to a positive figure of around Eu10.0mn in 2019 (ex SGR). As a result of development investments, however, we estimate that the free cashflow will track a negative trend in the 2016-18 period, driving the consolidated LTV from 30% in 2015 to c55% in 2018-19. Aedes RES SIIQ: Cash Flow Estimates (Eu mn) 2014A 2015A 2016E 2017E 2018E 2019ENet fin position beg of year 430 -124 -96 -161 -275 -385Net income 50.5 5.1 17.1 0.5 17.4 45.0
Write downs/(ups) -1.4 -2.9 -5.8 -4.8 -20.7 -35.1
Cash flow from operations 49.1 2.2 11.2 -4.3 -3.2 9.9Change in working capital 17.9 -1.5 0.9 1.1 1.3 1.6Operating cash flow 49.1 0.7 12.1 -3.2 -1.9 11.5Inv estments n.a. -40 -94 -132 -126 -32Free cash flow n.a. -39 -81 -135 -128 -21Div idends 0.0 0.0 0.0 0.0 -3.0 -7.0Other mov ements n.a. 67 17 21 21 20Cash flow n.a. 28 -65 -114 -110 -7Net fin position end of year * -124 -96 -161 -275 -385 -392Source: Intermonte SIM estimates based on company data * 2015 change in WC is adj. for accounting change Dividends. We have assumed that Aedes SIIQ will not pay any dividends on results for 2016 and 2017, but that will start paying out from 2018 onwards. For 2018 we expect the payout to be around Eu3.0mn, rising to around Eu7.0mn in 2019 thanks to the first time contribution of the rents from phase one of the Caselle project.

28
NAV trends. For the 2016-2019 period we estimate overall NAVps growth of over 30%, a 7.3% CAGR. This growth is mainly attributable to two factors: 1) the reassessment of survey values for the Redwood portfolio in 2016; 2) a write-up of the value of Caselle “phase 1” in 2019; 3) an acceleration in valuation growth as of 2018, thanks in part to our assumptions for inflation to pick up (from 0.2% in 2016 to 1.75% in 2019). Aedes RES SIIQ: NNNAV evolution
2014 2015 2016E 2017E 2018E 2019E
Property mkt value as of BoP 317 298 321 419 534 658market revaluation (LFL) -0.9% 0.5% 0.6% 1.2% 1.8% 1.9%Property Assets Mft Value EoP 298 321 419 534 658 704Net debt (124) (96) (161) (275) (385) (392)Other assets & liabilities 59 54 55 56 56 57 Gross NAV 233 279 313 314 330 368Taxes on revaluation of assets (2) 0 0 0 0 0NNAV 235 279 313 314 330 368MtM derivatives 0 0 0 0 0 0MtM borrowings 0 0 0 0 0 0Other 0 0 0 0 0 1NNNAV 235 279 313 314 330 369YoY n.a. 18.5% 12.3% 0.5% 4.8% 12.1%LTV 42% 30% 38% 51% 58% 56%LTV (inc Funds & JVs) 37% 26% 34% 47% 54% 52%Source: Intermonte SIM estimates based on company data
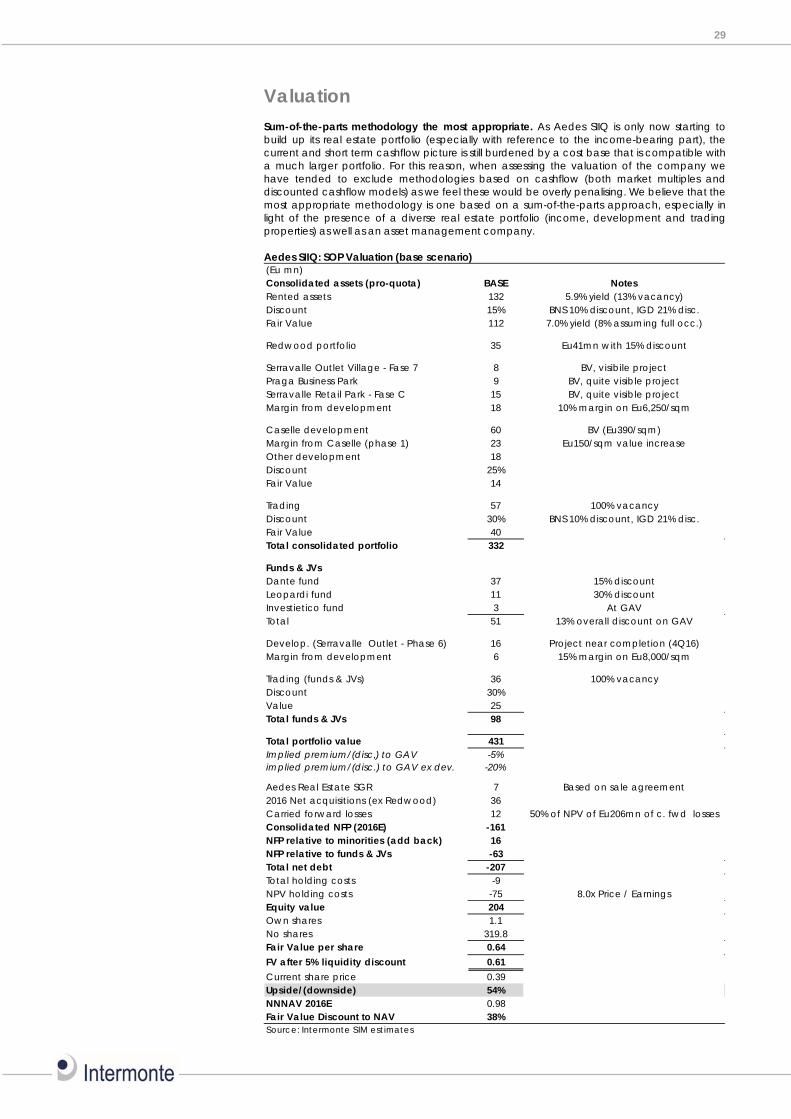
29
Valuation Sum-of-the-parts methodology the most appropriate. As Aedes SIIQ is only now starting to build up its real estate portfolio (especially with reference to the income-bearing part), the current and short term cashflow picture is still burdened by a cost base that is compatible with a much larger portfolio. For this reason, when assessing the valuation of the company we have tended to exclude methodologies based on cashflow (both market multiples and discounted cashflow models) as we feel these would be overly penalising. We believe that the most appropriate methodology is one based on a sum-of-the-parts approach, especially in light of the presence of a diverse real estate portfolio (income, development and trading properties) as well as an asset management company. Aedes SIIQ: SOP Valuation (base scenario) (Eu mn)Consolidated assets (pro-quota) BASE NotesRented assets 132 5.9% yield (13% vacancy)Discount 15% BNS 10% discount, IGD 21% disc.Fair Value 112 7.0% yield (8% assuming full occ.)
Redwood portfolio 35 Eu41mn with 15% discount
Serravalle Outlet Village - Fase 7 8 BV, visibile projectPraga Business Park 9 BV, quite visible projectSerravalle Retail Park - Fase C 15 BV, quite visible projectMargin from development 18 10% margin on Eu6,250/sqm
Caselle development 60 BV (Eu390/sqm)Margin from Caselle (phase 1) 23 Eu150/sqm value increaseOther development 18Discount 25%Fair Value 14
Trading 57 100% vacancyDiscount 30% BNS 10% discount, IGD 21% disc.Fair Value 40Total consolidated portfolio 332
Funds & JVsDante fund 37 15% discountLeopardi fund 11 30% discountInvestietico fund 3 At GAVTotal 51 13% overall discount on GAV
Develop. (Serravalle Outlet - Phase 6) 16 Project near completion (4Q16)Margin from development 6 15% margin on Eu8,000/sqm
Trading (funds & JVs) 36 100% vacancyDiscount 30%Value 25Total funds & JVs 98
Total portfolio value 431Implied premium/(disc,) to GAV -5%implied premium/(disc.) to GAV ex dev. -20%
Aedes Real Estate SGR 7 Based on sale agreement2016 Net acquisitions (ex Redwood) 36Carried forward losses 12 50% of NPV of Eu206mn of c. fwd lossesConsolidated NFP (2016E) -161NFP relative to minorities (add back) 16NFP relative to funds & JVs -63Total net debt -207Total holding costs -9NPV holding costs -75 8.0x Price / EarningsEquity value 204Own shares 1.1No shares 319.8Fair Value per share 0.64FV after 5% liquidity discount 0.61Current share price 0.39Upside/(downside) 54%NNNAV 2016E 0.98Fair Value Discount to NAV 38%Source: Intermonte SIM estimates

30
The above table shows the details of our SOP in a base case scenario. We have built our valuation by starting from a fair value of real assets (both consolidated as well as funds & JV). For the income and trading portfolio, this has been done by applying a discount to the reported gross asset values after comparing the quality of the portfolio with that of other Italian SIIQs. For the development portfolio, we have added a development margin for the most visible/important projects or applied a “market” discount for the less visible ones. This has led to an asset value of Eu431mn (including the recently acquired Redwood portfolio) which represents a 20% discount to GAV ex-development and a 5% discount to overall GAV. Aedes SIIQ: SOP Valuation in different scenarios (Eu mn)Consolidated assets (pro-quota) BASE BEAR BULLRented assets 132 132 132Discount 15% 20% 10%Fair Value 112 105 118
Redwood portfolio 35 33 37
Serravalle Outlet Village - Fase 7 8 8 8Praga Business Park 9 9 9Serravalle Retail Park - Fase C 15 15 15Margin from development 18 0 18
Caselle development 60 48 60Margin from Caselle (phase 1) 23 15 75Other development 18 18 18Discount 25% 30% 20%Fair Value 14 13 15
Trading 57 57 57Discount 30% 35% 25%Fair Value 40 37 43Total consolidated portfolio 332 282 397
Funds & JVsDante fund 37 35 39Leopardi fund 11 10 12Investietico fund 3 3 3Total 51 48 54
Develop. (Serravalle Outlet - Phase 6) 16 16 16Margin from development 6 6 6
Trading (funds & JVs) 36 36 36Discount 30% 35% 25%Value 25 23 27Total funds & JVs 98 93 103
Total portfolio value 431 376 500Implied premium/(disc,) to GAV -5% -17% 10%implied premium/(disc.) to GAV ex development -20% -25% -15%
Aedes Real Estate SGR 7 7 72016 Net acquisitions (ex Redwood) 36 36 36Carried forward losses 12 0 25Consolidated NFP (2016E) -161 -161 -161NFP relative to minorities (add back) 16 16 16NFP relative to funds & JVs -63 -63 -63Total net debt -207 -207 -207Total holding costs -9 -9 -9NPV holding costs -75 -75 -75Equity value 204 137 286Own shares 1.1 1.1 1.1No shares 319.8 319.8 319.8Fair value per share 0.64 0.43 0.90FV after 5% liquidity discount 0.61 0.41 0.85Current share price 0.39 0.39 0.39Upside/(downside) 54% 4% 116%NNNAV 2016E 0.98 0.98 0.98Fair Value Discount to NAV 38% 58% 13%Source: Intermonte SIM estimates We have then added the value of the SGR and the other acquisitions expected to be made during the year, as in the SOP we use 2016E net debt. As a final step, we have also given a

31
conservative Eu12mn value to the Eu206mn of carried forward losses which are not included in the group’s accounts. Please note that the consolidated net debt figure is then adjusted for the net debt included in the funds & JVs and the amounts associated with minorities. The last step is to subtract the NPV of overhead costs that we obtain by applying an 8.0x P/E multiple. Our fair value reflects this valuation after applying a 5% liquidity discount. Valuation in bear and bull scenarios. We have adjusted the assumptions underpinning our SOP valuation to reflect both a more cautious and a more bullish scenario. In the bear case scenario, we have worked on the following assumptions: 1) a higher discount to rented assets (20% vs 15%), 2) a discount to all development assets a part from phase 6 of Serravalle and lower margins from the projects (once again with the exception of Serravalle phase 6); 3) a slightly higher discount on non-consolidated rented assets; 4) no value for the carried forward losses. This results in a Eu376mn valuation for the portfolio, which corresponds to a 25% discount to GAV ex-development and a 17% discount to overall GAV. In the bull case we have worked on the following assumptions: 1) a lower discount to rented assets (10%, or broadly in line with Beni Stabili’s implied market valuation), 2) the same margins as in the base case for the Serravalle development projects, but a higher margin from Caselle (here we assumed a 15% margin on the development of the entire project assuming a rent of Eu250/sqm and a 7.5% yield); 3) slightly more generous valuation for non-consolidated assets; 4) a higher value for the carried forward losses. This results in a Eu500mn valuation for the portfolio which corresponds to a 15% discount to GAV ex-development and a 10% premium to overall GAV. As we have already said, a comparison of Aedes’s valuation based on multiples is made more complicated by the following considerations: 1) recurring earnings and funds from operations are depressed by the relatively high cost base; 2) the P/NAV multiple is also negatively affected by the disproportionally large NPV of the cost base; 3) the dividend yield will only gradually increase to a level that is closer to the market average. The table below shows the key multiples for Aedes and its main Italian peers.
Italian Real Estate - Valuation Multiple Price P/NAV P/NAV P/NAV P/NAV P/GAV P/GAV P/GAV P/GAV DY DY DY DY
2015 2016 2017 2018 2015 2016 2017 2018 2015 2016 2017 2018
Aedes SIIQ 0.39 0.45 0.40 0.40 0.38 0.66 0.63 0.63 0.62 0.0% 0.0% 0.0% 2.4%BNS SIIQ 0.64 0.84 0.83 0.80 0.76 0.92 0.91 0.90 0.88 3.8% 3.8% 3.9% 4.1%IGD SIIQ 0.78 0.63 0.59 0.56 0.52 0.81 0.79 0.77 0.75 5.1% 5.4% 6.1% 6.7%
Avg BNS/IGD 0.73 0.71 0.68 0.64 0.86 0.85 0.84 0.82 4.5% 4.6% 5.0% 5.4%
Aedes disc. (absolute) -55% -60% -60% -62% -34% -37% -37% -38% na na na naDiscount vs BNS/IGD -38% -43% -41% -40% -23% -26% -25% -24% na na na naSource: Companies data, Intermonte SIM estimates

32
Appendix I: Status of Development Projects
ASSET SPV LOCATION INTENDED USE
PLANNED DEVELOPMENT AREA
(m2)DEVELOPMENT STATUS
Serravalle Outlet Village - Phase 7
Pragaundici SIINQ S.p.A
Serravalle S (AL) Retail/ Industrial 4,510
Development plan approvedOutline planning permission grantedAssociated development plan agreedTrading licences obtainedEnvironmental screening completed with favourable outcomeApplication for full planning permission presented
Serrvalle Retail Park Phase C
Novipraga SIINQ S.p.A.
Serravalle S (AL) / Novi Ligure (AL)
Retail/ Small business 19,035
Development plan approvedOutline planning permission grantedAssociated development plan agreed with Town Councils of Serravalle and Novi LigureTrading licences obtainedEnvironmental screening completed with favourable outcomeApplication presented for full planning permission for preparatory work
Roera Retail Park - Phase C
Pragatre SIINQ S.p.A
S. Vittoria d'Alba (CN)
Retail 6,400
Development plan approvedOutline planning permission grantedAssociated development plan agreedTrading licences obtainedEnvironmental screening completed with favourable outcomeApplication for full planning permission presented (close to being granted)
Castellazzo Design Center
Pragaquattro Center SIINQ S.p.A.
Castellazzo B. (AL) / Borgoratto A. (AL)
Retail 94,409
Development plan approvedOutline planning permission grantedAssociated development plan agreedTrading licences obtainedEnvironmental screening completed with favourable outcomeChanges currently being drafted to project masterplan
Caselle Designer Village
Satac SIINQ S.p.A.
Caselle T (TO) Retail 153,000
Development plan approvedOutline planning permission grantedTrading licences obtainedIn December 2014, an Outline Agreement was approved and signed by the Region of Piedmont, the Province of Turin and the Council of Caselle Torinese, the content of which was incorporated in the Local Development plan throuh Alteration no. 7 dated November 2015; as a result an update to the outline planning permission is being drafted.On 29th December 2015 a request was presented to start the environmental screening process in accordance with article 10, para 1 of Regional Law no. 40 dated 14th December 1998 "Dispositions relating to environmental compatibility and evaluation procedures" and article 20 of Legislative Decree 152/2006 for the "Caselle Shopping & Leisure Village"shopping centre
Praga Business Park
Cascina Praga SINIQ S.p.A.
Serravalle S. (AL)
Retail 2,785
Development plan approvedOutline planning permission grantedAssociated development plan agreedTrading licences obtained
TOTAL 280,139 Source: Company data

33
Appendix II: The SIIQ Regime The SIIQ regime governs real estate investment companies that are listed on regulated markets in the EU and EEA, and was introduced into Italian legislation with Law 296/2007 (article 1, paragraphs 119-141) and subsequent enabling legislation (Law no. 174 dated 7th September 2007). Decree Law no. 133 dated 12th September 2014, the so-called “Unblock Italy” decree, came into force on 13th September 2014 and was converted into Law no. 164 dated 11th November 2014 (hereafter DL), published in the Official Gazette on the same day and coming into force on 12th November 2014. As part of this legislation, significant changes were introduced to the SIIQ rules (article 20 of the DL) in order to make the use of the SIIQ regime more appealing, and to enable SIIQ and real estate investment funds to be complementary instruments in certain instances. The main SIIQ regime requirements No stakeholders can directly or indirectly possess more than 60% of ordinary voting rights or
rights to redistribution of earnings. The DL also states that if extraordinary transactions in the company or on capital markets were to lead to this requirement no longer being met, then the SIIQ special regime would be suspended until compliance was restored. The above-mentioned requirement must be verified within the two financial years after the company exercised the option, and the exemption from IRES and IRAP taxation will be applied from the beginning of the fiscal period in which it is confirmed that the requirements have been met. Key requirements include:
At least 25% of shares must be owned by parties that did not possess voting rights or rights
to redistribution of earnings in excess of 2% at the time of the exercise of the Option. For the purposes of the DL, however, this requirement does not apply to companies that were already listed;
The company’s predominant activity must be property rental. This will be considered to be the predominant activity if within three years of exercising the Option: o At least 80% of the assets are made up from rented properties or financial investments
in other SIIQ (or SIINQ) or qualified real estate funds; o At least 80% of the positive components on the income statement are made up of
revenues deriving from rental activity or dividends coming from the rental activity carried out by SIIQ or SIINQ or qualified real estate funds or capital gains from the sale of property that had previously been rented out.
Each financial year, the company is obliged to distribute dividends to shareholders equal to at least 70% of its net profit, and within two years must distribute 50% of net capital gains realised on properties that had previously been rented out, investments in other SIIQ or SIINQ and investments in qualified real estate funds. As a result of the DL, these capital gains are exempt from IRES and IRAP taxation.
European REIT/SIIQ regimes: Key rules
Germany Netherlands France Italy
Denomination REIT FBI SIIC SIIQMin. eligibility criteria 75% of rev enues in
rental property85% of rev enues in
rental property80% in rental
property + rev enues from RE
Min. free float 15% n.a. 15% 25%Max. holding by dominant sharehold 10% 45% 60% 60%Max. stake for free-float shareholders 3% n.a. 2% 2%Max. lev erage allowed LTV 55% LTV 60% n.a. n.a.Distribution of recurrent earnings 90% 100% 95% 70%Distribution of capital gains 50% n.a. 60% 50%Taxation on SIIQ/REIT capital gains 0% 0% 0% 0%Exit tax (on cap. gains) 50% of CG Normal rate on CG 16.5% of CG 20% of CGTaxation on other rev enues 0% 0% Normal tax rate Normal tax rateSource: Intermonte SIM elaboration
Real estate funds nearing maturity and the SIIQ regime The “Unblock Italy” regulations combine with the DL on Competition (DL 91/2014 converted from L116/ 2014 with regard to the extension of the duration of listed real estate funds), favour the transformation of Italian real estate funds that are in liquidation mode into SIIQs. Indeed, as an alternative to liquidating its assets, a real estate fund now has the opportunity to convert the equity of those holding units in the fund into shares in a SIIQ. This can happen in one of two ways:
34
A) Transfer of quotas. The DL allows and encourages a real estate fund nearing maturity to confer its properties into a SIIQ instead of liquidating them, and receiving in exchange shares in the SIIQ proportionally which may be transferred to holders of units in the funds. Specifically, the DL establishes that: for fiscal purposes, if the SIIQ shares allocated to fund unit holders are given the same
value as the units, then this exchange does not constitute a capital gain; although the transaction is exempt from VAT, it is also considered insignificant for
deductibility calculations; the conferral of properties, the majority of which are rented out, from a real estate fund
nearing maturity to a SIIQ, is exempt from VAT but subject to a flat transaction and cadastral registry tax of €200;
the fund conferring the properties is not required to make a public takeover offer on the SIIQ, as long as shares are allocated to its unit holders within 30 days after the properties are transferred.
B) Transfer of properties. The DL states that conferral of properties, the majority of which are rented out, from a real estate fund nearing maturity to a SIIQ, is exempt from VAT but subject a flat transaction and cadastral registry tax of Eu200. Foreign Investors It is worth noting what the DL specifies regarding investments in SIIQs by foreign investors. Companies with registered offices in other EU and/or European Economic Area member states that conduct regular operations in Italy, and whose predominant business is real estate rental through equity interests in unlisted real estate investment companies (SIINQs), may qualify for SIIQ status. Such companies are subject to a flat substitute corporate income tax of 20% of the income they obtain from property rentals. For companies not residing in the EU or EEA, the DL specifies that international treaties intended to avoid double taxation on income from dividends apply. Beyond the SIIQ system – intended for the real estate market in general – article 23 of the DL establishes that wherever the annual rent on non-residential property amounts to over €150,000, contract clauses may be drawn up and agreed freely by the parties involved, without abiding by the restrictions that would normally be imposed under the rent legislation in force.

35
Appendix III: Profiles of Peers Beni Stabili is the leading property player in the Italian Real Estate market with total assets of 3.9bn euro. The assets portfolio is situated in key locations of North and Central Italy's major cities and consists mainly of offices. The group pursues the appreciation of assets to increase profitability and create value. Beni Stabili is listed on the Milan and Paris Stock Exchanges and belongs to the Foncière des Régions group, a leading real estate player in Europe who owns and manages an 18bn euro portfolio located in the most attractive metropolitan cities of France, Germany and Italy. Beni Stabili operates under the SIIQ regime. Immobiliare Grande Distribuzione. Listed on the Italian Stock Exchange in 2005 and SIIQ since 2008, thanks to the significant investment program realized, IGD is today one of the main Italian company in the retail segment of the real estate sector: it owns a property portfolio valued at Eu2.08 billion as at 31 December 2015, spread in 11 Italian regions. IGD is also present in Romania, where it owns 100% of Winmarkt, a chain of 14 shopping centers.

36
DISCLAIMER (for more details go to http://intermonte.it/ disclosures.asp) IMPORTANT DISCLOSURES The reproduction of the information, recommendations and research produced by Intermonte SIM contained herein and of any its parts is strictly prohibited. None of the contents of this document may be shared with third parties without authorisation from Intermonte. This report is directed exclusively at market professional and other institutional investors (Institutions)and is not for distribution to person other than “Institution” (“Non-Institution”), who should not rely on this material. Moreover, any investment or service to which this report may relate will not be made available to Non-Institution. The information and data in this report have been obtained from sources which we believe to be reliable, although the accuracy of these cannot be guaranteed by the Intermonte. In the event that there be any doubt as to their reliability, this will be clearly indicated. The main purpose of the report is to offer up-to-date and accurate information in accordance with regulations in force covering “recommendations” and is not intended nor should it be construed as a solicitation to buy or sell securities. This disclaimer is constantly updated on Intermonte’s website www.intermonte.it under DISCLOSURES. Valuations and recommendations can be found in the text of the most recent research and/or reports on the companies in question.
ANALYST CERTIFICATION For each company mentioned in this report the respective research analyst hereby certifies that all of the views expressed in this research report accurately reflect the analyst’s personal views about any or all of the subject issuer (s) or securities. The analyst (s) also certify that no part of their compensation was, is or will be directly or indirectly related to the specific recommendation or view in this report. The analyst (s) responsible for preparing this research report receive(s) compensation that is based upon various factors, including Intermonte’s total profits, a portion of which is generated by Intermonte’s corporate finance activities, although this is minimal in comparison to that generated by brokerage activities. Intermonte’s internal procedures and codes of conduct are aimed to ensure the impartiality of its financial analysts. The exchange of information between the Corporate Finance sector and the Research Department is prohibited, as is the exchange of information between the latter and the proprietary equity desk in order to prevent conflicts of interest when recommendations are made.
GUIDE TO FUNDAMENTAL RESEARCH Reports on all companies listed on the S&PMIB40 Index, most of those on the MIDEX Index and the main small caps (regular coverage) are published at least once per quarter to comment on results and important newsflow. A draft copy of each report may be sent to the subject company for its information (without target price and/or recommendations), but unless expressly stated in the text of the report, no changes are made before it is published. Explanation of our ratings system: BUY: stock expected to outperform the market by over 25% over a 12 month period; OUTPERFORM: stock expected to outperform the market by between 10% and 25% over a 12 month period; NEUTRAL: stock performance expected at between +10% and – 10% compared to the market over a 12 month period ; UNDERPERFORM: stock expected to underperform the market by between –10% and -25% over a 12 month period; SELL: stock expected to underperform the market by over 25% over a 12 month period. The stock price indicated is the reference price on the day prior to the publication of the report. CURRENT INVESTMENT RESEARCH RATING DISTRIBUTIONS Intermonte SIM is authorised by CONSOB to provide investment services and is listed at n° 246 in the register of brokerage firms. As at 31 March 2016 Intermonte’s Research Department covered 149 companies. Intermonte’s distribution of stock ratings is as follows: BUY: 19.46% OUTPERFORM: 42.95% NEUTRAL: 31.11% UNDERPERFORM: 0.0% SELL: 0.0% The distribution of stock ratings for companies which have received corporate finance services from Intermonte in the last 12 months (45 in total) is as follows: BUY: 22.22% OUTPERFORM: 46.67% NEUTRAL: 18.42% UNDERPERFORM: 0.00% SELL: 0.00% CONFLICT OF INTEREST In order to disclose its possible conflicts of interest Intermonte SIM states that: o within the last year, Intermonte SIM managed or co-managed/is managing or is co-managing (see companies indicated in bold type) an Institutional Offering and/or managed or co-managed/is
managing or is co-managing (see companies indicated in bold type) an offering with firm commitment underwriting of the securities of the following Companies: Aeroporto di Bologna, Banca Ifis, Banca Carige, Banca Sistema, Banca Popolare di Sondrio, Cattolica Assicurazioni, Fincantieri, La Doria, MPS, Tamburi Investment Partners, Tecnoinvestimenti
o Intermonte SIM is Specialist and/or Corporate Broker and/or Sponsor and/or Broker in charge of the share buy back activity of the following Companies: Aedes, Aeroporto di Bologna, Ascopiave, B&C Speakers, Banca Ifis, Banca Sistema, Banzai, Be, Bolzoni, BOMI, Carraro, Cattolica Assicurazioni, Cementir, Credito Valtellinese, Datalogic, DeA capital, DigiTouch, Digital bros, EL.En, Emak, ERG, Ferrovie Nord Milano, Fintel Energia Group, Gefran, GreenItaly1, GO Internet, IGD, Il Sole 24 Ore, IWB, Kinexia, Lucisano Media Group, LU VE, Mondo TV, QF Alpha Immobiliare, QF Beta Immobiliare, Recordati, Reno de Medici, Reply, Retelit, Saes Getters, Servizi Italia, Sesa, SITI – B&T Group S.p.A., Snai, Tamburi Investment Partners, Tesmec, TBS Group, Tecnoinvestimenti, Ternienergia, TXT e-solutions, Vittoria Assicurazioni.
o Intermonte SIM acted as Global Coordinator in the GreenItaly1 IPO on the AIM Italia market and will receive a success fee if a business combination is approved by the shareholders. o Intermonte SIM SpA and its subsidiaries do not hold a stake equal to or over 1% of common equity securities and/or warrants of any of the aforementioned subject companies, with the exception of:
GreenItaly1. o Intermonte SIM SpA has provided in the last 12 months / provides / may provide investment banking services to the following companies: Aedes, Conafi, Bolzoni, CNRC/Marco Polo Industrial Holding (on
Pirelli shares),Hitachi (on Ansaldo STS shares), Kinexia, Prelios, RCS, Seat Pagine Gialle, IPO Challenger/IWB. Intermonte SIM SpA may provide investment banking services to RCS MediaGroup, also in connection with the share exchange offer promoted by Cairo Communication. DETAILS ON STOCKS RECOMMENDATION
Stock NAME AEDES SIIQ
Current Recomm: OUTPERFORM Previous Recomm: na
Current Target (Eu): 0.60 Previous Target (Eu): na
Current Price (Eu): 0.39 Previous Price (Eu): na
Date of report: 24/05/2016 Date of last report: na
© Copyright 2010 by Intermonte SIM - All rights reserved It is a violation of national and international copyright laws to reproduce all or part of this publication by email, xerography, facsimile or any other means. The Copyright laws impose heavy liability for such infringement. The Reports of Intermonte SIM are provided to its clients only. If you are not a client of Intermonte SIM and receive emailed, faxed or copied versions of the reports from a source other than Intermonte SIM you are violating the Copyright Laws. This document is not for attribution in any publication, and you should not disseminate, distribute or copy this e-mail without the explicit written consent of Intermonte SIM. INTERMONTE will take legal action against anybody transmitting/publishing its Research products without its express authorization. INTERMONTE Sim strongly believes its research product on Italian equities is a value added product and deserves to be adequately paid . Intermonte Sim sales representatives can be contacted to discuss terms and conditions to be supplied the INTERMONTE research product.
INTERMONTE SIM is MIFID compliant - for our Best Execution Policy please check our Website www.intermonte.it/mifid Further information is available