aec management solutions, inc. - codewriters...
TRANSCRIPT

AEC Management Solutions, Inc. 183 Higgins Road Matawan, NJ 07747
Matawan 732-705-5098 San Francisco 415-462-0840 www.aecmanagementsolutions.com
Pathway to Profit Seminar™
Society for Design Administration American Institute of Architects
October 2, 2008
Akron, Ohio

AEC Management Solutions, Inc. 183 Higgins Road Matawan, NJ 07747
Matawan 732-705-5098 San Francisco 415-462-0840 www.aecmanagementsolutions.com
Herbert M. Cannon President Herb Cannon is one of the nations leading experts in the management of A/E firms. With over 25 years of “hands on” experience in the A/E Industry, Herb has held top management positions in a number of high profile firms. Prior to founding AEC Management Solutions, Inc., he held senior executive positions at Robert A.M. Stern Architects, Ehrenkrantz Eckstut & Kuhn Architects, Burns & Roe Engineering. Mr. Cannon has served these organizations in a variety of executive roles including Chief Operating Officer, Chief Financial Officer and Director of Project Management. Throughout his 25-year career he recognized that design professionals create an extraordinary value for their clients. To a large extent the extraordinary value these design professionals create is not rewarded with a fair economic return. Herb founded AEC Management Solutions in 2000 with the simple goal helping A/E firms of all sizes earn and keep the money they deserve. To achieve this goal, he conducts numerous seminars and workshops throughout North America on Strategic Planning, Mergers and Acquisitions, Incentive Compensation, Project Management, Ownership Transition, Financial Management and Firm Valuation. He helps firms to develop and implement strategic plans, incentive compensation programs and project management systems that dramatically improve profitability. He provides consulting services on valuation and ownership transition issues to facilitate a smooth transition to the next generation of owners. Through his extensive contacts in the A/E industry and professional organizations, he also assists firms in identifying potential merger and acquisition candidates. Herb is an accomplished speaker, speaking to hundreds of A/E professionals each year at seminars and professional association events. He has been a featured speaker for the American Institute of Architects, Society for Marketing Professional Services, Society for Design Administration, NSPE Chief Financial Officer Roundtable, NSPE Principals Forum, Axium Software, American Society for Heating Refrigeration and Air Conditioning Engineers, Ontario Association of Architects, Texas Council of Engineering Companies Leadership Forum and is a guest lecturer at New York University. Herb is the publisher of AEC Managing Partner, a monthly newsletter for the design professional. He also has a long-term consulting relationship with Robert A.M. Stern Architects, a 265-person architecture firm in New York City, acting as the part-time CFO and Director of Project Management.

AEC Management Solutions, Inc. 183 Higgins Road Matawan, NJ 07747
Matawan 732-705-5098 San Francisco 415-462-0840 www.aecmanagementsolutions.com
AEC Management Solutions, Inc. Company Profile
At AEC Management Solutions, Inc., we recognize that architects, engineers and related industry professionals create extraordinary value through their creative efforts. To a large extent, the extraordinary value these design professionals create is not rewarded with a fair economic return. Our simple goal is to help these design professionals earn and keep the money they deserve.
In order to achieve this goal we provide a variety of seminars and consulting services on:
• Strategic Planning • Incentive Compensation • Project Management • Financial Management • Cash Flow and Collections • Ownership Transition • Valuation Services • Management Audits • Marketing
Whether it is customized seminars, workshops or consulting solutions, you can be assured that only top level instructors and consultants will be provided. All of our consultants are exclusive to the A/E industry and have 15 to 25+ years of experience working with many of the country’s top A/E firms. They are licensed professionals and have held top-level positions such as Chief Executive Officer, President, Chief Operating Officer, Director of Project Management, Chief Financial Officer, Director of Marketing and Director of Information Technology.
By tapping into our decades of knowledge and experience, you can jump start your companies performance and avoid years of costly mistakes figuring it out on your own. Whether your needs are strategic or tactical, long or immediate, we look forward to helping you solve your problem – so you can start earning the money you deserve.
Contact Information: Herbert M. Cannon AEC Management Solutions, Inc. 183 Higgins Road Matawan, NJ 07747 732.705.5098 [email protected] www.aecmanagementsolutions.com

AEC Management Solutions, Inc. 183 Higgins Road Matawan, NJ 07747
Matawan 732-705-5098 San Francisco 415-462-0840 www.aecmanagementsolutions.com
Herbert M. Cannon 2007 Speaking Engagements SMPS Southern Region Conference January 25th San Antonio Strategic Planning Axium Webinar February 8th Project Management for 20%+ Profit Pathway to Profit Seminar™ March 15-16 New York 2-day Seminar on Achieving a 20%+ Profit
NSPE – Principals Forum February 23rd Tampa Top Ten Ways to Connect and Communicate with your Employees
Pathway to Profit Seminar™ April 12-13 Chicago 2-day Seminar on Achieving a 20%+ Profit
SMPS Philadelphia April 18th Incentive Compensation Society for Design Administration National Convention May 4th San Antonio Administrator’s Survival Guide to the A/E Industry Axium Webinar May 10th Incentive Compensation Deltek Convention May 16 – 18 Las Vegas Session #1 Secrets of Creating a 20%+ Profit Machine Session #2 Incentive Compensation
Pathway to Profit Seminar™ June 7-8 Portland 2-day Seminar on Achieving a 20%+ Profit
Pathway to Profit Seminar™ June 21-22 Las Vegas 2-day Seminar on Achieving a 20%+ Profit
NSPE National Convention July 26-27 Denver Secrets of Creating a 20%+ Profit Machine SDA Webinar August 16th 2007 Incentive Compensation Texas Council of Engineering Companies August 23rd San Antonio Business Management Skills SDA Western States Conference September 28th Orange County, CA Incentive Compensation

AEC Management Solutions, Inc. 183 Higgins Road Matawan, NJ 07747
Matawan 732-705-5098 San Francisco 415-462-0840 www.aecmanagementsolutions.com
Axium Software National Convention October 18 – 20 Portland Keynote Address
2006 and Prior Speaking Engagements Build Business National Convention Incentive Compensation - 1 Hour Presentation, August 2006 Society for Design Administration National Convention Incentive Compensation – 1.5 Hour Presentation June 2006 Axium Software National Convention Incentive Compensation – 1.5 Hour Presentation October 2006 Axium Software Webinar Maximize Productivity – A Principal’s Guide – 1 Hour Presentation August 2006 American Society of Heating Refrigeration and Air Conditioning Engineers – Houston The Seven Habits of Highly Ineffective Engineering Firms – 1 Hour Presentation September 2006 Project Management – A Profit Perspective – 1 Hour Presentation September 2006 National Society of Professional Engineers CFO Roundtable Incentive Compensation – 1 Hour Presentation, May 2005 Texas Council of Engineering Companies Incentive Compensation - 3 Hour Presentation November 6 & 7, 2004 American Institute of Architects – Jersey Shore Chapter Incentive Compensation - 1 Hour Presentation, March 2005 Kansas Council of Engineering Companies Incentive Compensation – Full Day Presentation, October 2004 Society for Marketing Professional Services – NY Chapter Developing a Business Plan – 3 Hour Presentation, November 2005 Society for Marketing Professional Services – NJ Chapter Strategic Planning Techniques – An emphasis on Marketing – 1 ½ Hour Presentation, November 2005 American Institute of Architects – NY Chapter Marketing Committee Giving Away the Store – 2 Hour Panel March 2001 Texas Council of Engineering Companies Leadership Forum Business Management Skills - 4 Hour Presentation Annual Event 2001 - 2006 New York University Guest Lecturer on Public Speaking – 1 Hour Presentation Bi-Annual Event 2002-2006

AEC Management Solutions, Inc. 183 Higgins Road Matawan, NJ 07747
Matawan 732-705-5098 San Francisco 415-462-0840 www.aecmanagementsolutions.com
Singer Nelson Chalmers Ownership Transition and Valuing Your Design Firm - 3 Hour Presentation 2004-2006 Institute for Classical Architecture and Classical America Profit by Design: Successful Management for the Architectural Firm - Full Day April 2005 American Society of Heating Refrigeration and Air Conditioning Engineers Improving Cash Flow – 1 Hour Presentation February 2003 Ownership Transition – 1 Hour Presentation March 2004 PSMJ Resources Financial Management Bootcamp 2 day Seminars 2000 - 2003 Project Management Bootcamp 2 day Seminars 2000 - 2003 Principals Bootcamp 2 day Seminars 2000 – 2003 Annual Software Summit 2 day event 2001 CEO Ownership Transition Roundtable 3 day Annual Event 2000-2003

AEC Management Solutions, Inc. 183 Higgins Road Matawan, NJ 07747
Matawan 732-705-5098 San Francisco 415-462-0840 www.aecmanagementsolutions.com
References Rob Buford Robert A.M. Stern Architects 460 West 34th St. New York, NY 10001 212.967.5100 Joeseph Tomaino Tomaino Tomaino Iamello & Associates 136 Brighton Avenue Deal, NJ 07723 732.531.2282 Kenneth Camp KDC Architects and Engineers 7442 South Tucson Way Centennial, CO 80112 303.750.6999 Jeffrey Venezia NJ K-12 Architects 104 Bayard St. New Brunswick, NJ 08901 732.296-6545 Steve Stagner Texas Council of Engineering Companies 1001 Congress Austin, Texas 78701 512.474.1474 Kevin Newman Bucher Willis Ratliff 601 Shelley Drive Tyler, TX 75701 903.581.7844 Charles Becht Becht Engineering 22 Church St. Liberty Corner, NJ 07938 908.580.1119
Rolf Kielman Truex Cullins and Partners 209 Battery St. Burlington, VT 05401 802.658.2775 Wally Gordon Deems Lewis McKinley 12 Gough St. San Francisco, CA 94103 415.255.1811 Scott Gaudineer Flewelling and Moody 141 South Lake Avenue Pasadena, CA 91101 626.449.6787 Paul Stoller Atelier Ten 45 East 20th St. New York, NY 10003 212.254.4500 Peter Biber The Biber Partnership 422 Morris Avenue Summit, NJ 07901 908.273.8877 Fred Shen Shen Milsom Wilke 417 5th Avenue New York, NY 10016 212.725.6800
Sharyn Yorio Sustainable Marketing 170 Kinnelon Road Kinnelon, NJ 07405 973.492.1040

1
Pathway to Profit™
2-Day Seminarfor 20%+ Profit
AEC Management Solutions, Inc.
Who is Here Today
NamePositionCompany Name, LocationSpecialty & Size
The Next 2 Days
LogisticsParticipationNetworkingReinforcement New Ideas

2
Gross Fees 27,622,778$ Other Income 55,239 Reimbursables & Directs (10,011,033) Net Revenues 17,666,985$ A
Minimum Profit% 20.0% BProfit Increase 3,533,397$ AxB
What Do We Mean by20%+ Profit?
Elements of a 20%+ Profit
Understanding the financial fundamentalsTimely & accurate project informationStrategic PlanningCommunicationsCash flowProject managementIncentive compensation
The Core Secret of 20%+ Profit
Stop Admiring the Problem!

3
The Core Secret of 20%+ Profit
Start Taking Action!
Pathway to Profit™
Financial Fundamentalsfor 20%+ Profit
AEC Management Solutions, Inc.
Elements of a 20%+ Profit
Understanding the Financial FundamentalsProduce Timely & Accurate Project InformationStrategic PlanningCommunicationsCash FlowProject ManagementIncentive Compensation

4
Definitions
Utilization Rate – the percentage of staff dollars or hours charged to projectsNet Multiplier – net revenues divided by direct labor dollarsOverhead Rate – indirect expenses divided by direct labor dollars
Definitions
Net Revenues – total revenue less all non-labor direct expenses (Consultants, Project Travel, Postage…)Direct Labor – labor dollars charged to client projectsIndirect Labor – labor dollars not charged to client projects
Key Indicators
Utilization:
Direct Labor $ Total Labor $
Net Multiplier: Net Revenues $ Direct Labor $
Overhead Rate:
Total Indirect Expenses Total Direct Labor $
Accounts Receivable In Days:
Accounts Receivable (Annual Sales/365 days)
Backlog in Days Uncompleted Work under Contact (Annual Sales/365 days)

5
AssetsCash in Bank 1,500,000$ Accounts Receivable 4,300,000 Other Current Assets 200,000 Total Current Assets 6,000,000
Furniture Fixtures & Equipment (Net) 2,600,000 Investments 250,000 Total Fixed Assets 2,850,000
Total Assets 8,850,000$ +
LiabilitiesAccounts Payable 1,800,000$ Retainers 500,000 Total Current Liabilities 2,300,000
Loans Payable 1,900,000 Total Liabilities 4,200,000 -
CapitalCommon Stock 10,000$ Retained Earnings 2,938,267 Current Years Profit 1,701,733 Total Capital 4,650,000 =
Total Liablilities & Capital 8,850,000$
San Antonio EngineersBalance Sheet
December 31, 2006
San Antonio EngineersIncome Statement
12 Months Ended December 31, 2006
Gross Fees 27,622,778$ Other Income 55,239 Reimbursables & Directs 10,469,001
Net Revenues 17,209,017 ADirect Labor Expense 5,833,565 BGross Profit 11,375,452
Overhead 9,673,719 COperating Profit 1,701,733$ D
Overhead SummaryIndirect Labor 3,679,200$ ETotal Overhead 9,673,719$
Overhead Rate 165.8% (C/B)Net Multiplier 2.95 (A/B)Utilization 61.3% (+B/(B+E))Profit% 9.9% (+D/A)
Key Statistic
Utilization RateAverage A/E Firm • 61.3% Utilization Rate
Top Performing A/E Firm• 70.0% Utilization Rate

6
Increased Utilization in a10-person Firm
Assumptions:Assumptions:$45,000 Salary, 10 Employees, 8.7% Increase in Utilization$45,000 Salary, 10 Employees, 8.7% Increase in Utilization
Difference in Direct Labor =Difference in Direct Labor = $ 39,150$ 39,150Net Multiplier =Net Multiplier = 2.902.90Total increase in profits = $113,535Total increase in profits = $113,535
Increased Utilization Scenarios
20 Employees $ 227,07030 Employees $ 340,60540 Employees $ 454,14050 Employees $ 567,67560 Employees $ 681,21070 Employees $ 794,74580 Employees $ 908,28090 Employees $1,021,815100 Employees $1,135,350
12 Months Ended December 31, 2006
Gross Fees 27,622,778$ Other Income 55,239 Reimbursables & Directs 10,011,033
Net Revenues 19,643,861 ADirect Labor Expense 6,658,936 BGross Profit 12,984,925
Overhead 8,848,349 COperating Profit 4,136,576$ D
Overhead SummaryIndirect Labor 2,853,830$ ETotal Overhead 8,848,349$
Overhead Rate 132.9% (C/B)Net Multiplier 2.95 (A/B)Utilization 70.0% (+B/(B+E))Profit% 21.1% (+D/A)Profit Increase 2,434,843$
San Antonio EngineersIncome Statement with Increased Utilization

7
Ideas to Increase Utilization
1.
2.
3.
4.
5.
6.
7.
Key Statistic
Net MultiplierAverage A/E Firm • 2.90 Net Multiplier
Top Performing A/E Firm• 3.25 Net Multiplier
Impact of Multiplier Differences In a 10-person Firm
Assumptions:$45,000 Salary, 10 Employees, 61.3% Utilization
Direct Labor $275,850
Revenue Achieved with a 2.90 Multiplier $799,965Revenue Achieved with a 3.25 Multiplier $896,513Total Increase in Revenue $ 96,548
8
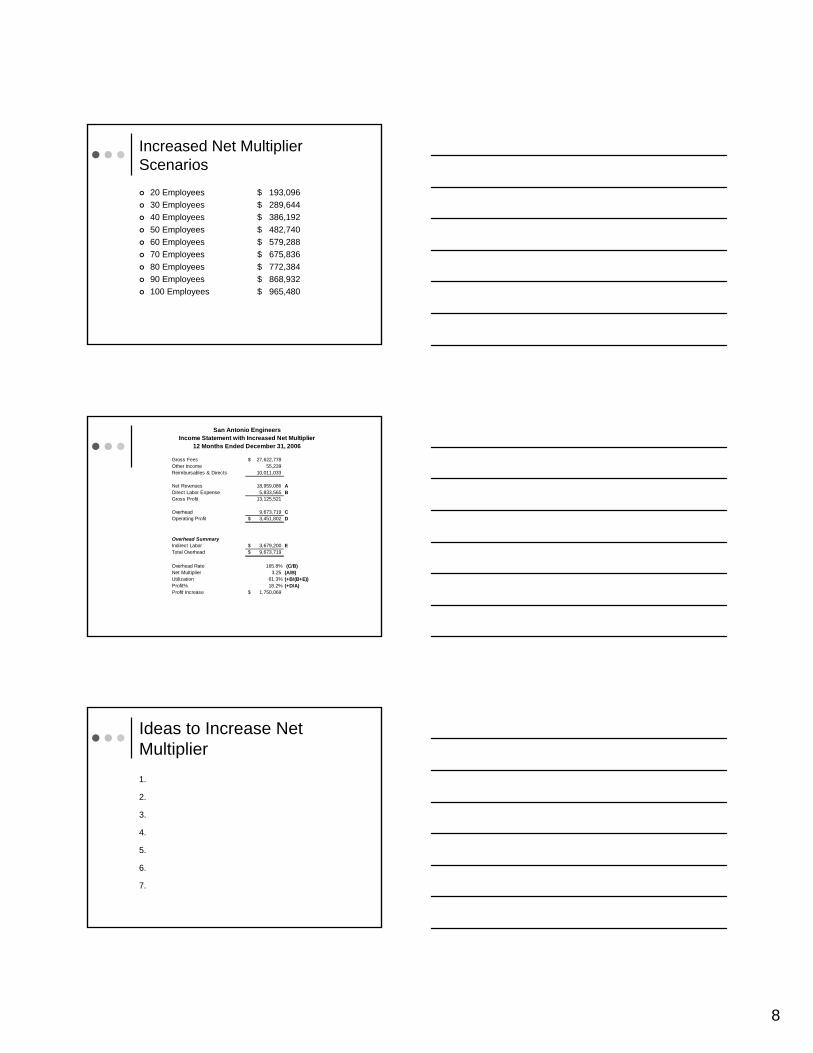
Increased Net Multiplier Scenarios
20 Employees $ 193,09630 Employees $ 289,64440 Employees $ 386,19250 Employees $ 482,74060 Employees $ 579,28870 Employees $ 675,83680 Employees $ 772,38490 Employees $ 868,932100 Employees $ 965,480
12 Months Ended December 31, 2006
Gross Fees 27,622,778$ Other Income 55,239 Reimbursables & Directs 10,011,033
Net Revenues 18,959,086 ADirect Labor Expense 5,833,565 BGross Profit 13,125,521
Overhead 9,673,719 COperating Profit 3,451,802$ D
Overhead SummaryIndirect Labor 3,679,200$ ETotal Overhead 9,673,719$
Overhead Rate 165.8% (C/B)Net Multiplier 3.25 (A/B)Utilization 61.3% (+B/(B+E))Profit% 18.2% (+D/A)Profit Increase 1,750,069$
San Antonio EngineersIncome Statement with Increased Net Multiplier
Ideas to Increase Net Multiplier1.
2.
3.
4.
5.
6.
7.

9
12 Months Ended December 31, 2006
Gross Fees 27,622,778$ Other Income 55,239 Reimbursables & Directs 10,011,033
Net Revenues 21,641,542 ADirect Labor Expense 6,658,936 BGross Profit 14,982,606
Overhead 8,848,349 COperating Profit 6,134,257$ D
Overhead SummaryIndirect Labor 2,853,830$ ETotal Overhead 8,848,349$
Overhead Rate 132.9% (C/B)Net Multiplier 3.25 (A/B)Utilization 70.0% (+B/(B+E))Profit% 28.3% (+D/A)Profit Increase 4,432,524$
San Antonio EngineersIncome Statement with Increased Net Multiplier & Utilization
Income Low HighOriginal Company 1,701,733$ 6,806,932$ 8,508,666$ Increased Utilization 4,136,576 16,546,305 20,682,882 Increased Net Multiplier 3,451,802 13,807,208 17,259,011 Increased Utilization & Net Multiplier 6,134,257 24,537,028 30,671,286
San Antonio EngineersRule of Thumb Valuation Implications
December 31, 2006
Valuation Range
Pathway to Profit™
Strategic Planningfor 20%+ Profit
AEC Management Solutions, Inc.

10
Elements of a 20%+ Profit
Understanding the financial fundamentalsTimely & accurate project informationStrategic PlanningCommunicationsCash flowProject managementIncentive compensation
Why Strategic Planning?
Raises the bar of expectationsCreates a common vision for all employeesDerails the Wishful Thinking™SyndromeCreates commitment and accountabilityEnables ordinary people to do extraordinary things
Strategic Plan or Business Plan?
Strategic PlanEstablished businessesHelp build competitive advantageCommunicates to staffPrioritizes financesAction OrientedIdea & Goal Oriented
Business PlanNew businessesDefines business purposePlans operational needsCritical for financingAssesses opportunitiesProvides structure to ideas

11
Successful Planning Retreats
Limited number of participantsHeld offsite (No distractions)PreparationOutside facilitatorOpen communicationFocus on the big pictureAction oriented
Strategic Planning Key Elements
Where are we now?Where are we going?How will we get there?
Where are We Now?
BenchmarkingEmployee SurveysEmployee InterviewsSWOT Analysis
StrengthsWeaknessesOpportunitiesThreats

12
Strengths, Weaknesses, Opportunities, and Threats AnalysisStrengths My Company Competitor 1 Competitor 2 Competitor 3What are your business advantages?What are your core competencies?Where are you making the most money?What are you doing well?WeaknessesWhat areas are you avoiding?Where do you lack resources?What are you doing poorly?Where are you losing money?What needs improvement?OpportunitiesAny beneficial trends?Niches that competitors are missing?New technologies?New needs of customers?ThreatsObstacles to overcome?Aggressive competitors?Successful competitors?Negative economic conditions?Government regulation?Changing business climate?Vulnerabilities?
Where are We Going?
MissionGoal SettingCapitalize on StrengthsFix the WeaknessesCapitalize on OpportunitiesRecognize and Avoid the Threats
Goal Setting
Where do we want to be in 3 yearsMarkets served
• Services• Geographic area• Client type
RevenuesProfitsEmployees

13
Achieving our Goals
MarketingProject DeliveryFinancesOrganizational StructureInformation TechnologyHuman ResourcesOwnership Transition
Action items from Planning Retreat on October 15-16, 2007Action Needed Owner Due Date
Contact Axium Software to arrange a Demonstration of their Portfolio Software H Cannon 12.16.07
Get competitive proposals for in-house Project Management Training R. Titsch 12.28.07
Prepare a detailed plan for the financial turnaround of Houston Office. Goal of profitability by April 30, 2008 R.Titsch 11.30.07
Investigate the need for upgrade of IT Infrastructure and make recommendations to the executive committee D.Laun 1.08.08
Pathway to Profit™
Communicationsfor 20%+ Profit
AEC Management Solutions, Inc.

14
Elements of a 20%+ Profit
Understanding the Financial FundamentalsProduce Timely & Accurate Project InformationStrategic PlanningCommunicationsCash FlowProject ManagementIncentive Compensation
Internal Communications
Divergence of OpinionOwners/Management think there is good communication with employeesOwners/Management think there is poor communication within management groupEmployees think there is poor communication at all levelsLack of communication is the #1 complaint
What I have discovered
People want to feelConnectedPart of a Team
They want to knowWhat is the vision for the firmHow can they fit inHow can they help achieve that visionWhat’s in it for me

15
Human Resources AuditOutside Facilitator with Industry ExperienceSurveyReportIn-Person InterviewsFinal Report and Recommendations
More about the survey
Completed on-lineCombination of Question types
Multiple choice rankingsOpen-Ended Questions
Compare Management Responses to Rank & File
Management always has a rosier view of communicationStaff views lack of communication as the lack of a plan
Ranking Your Staff
1. Hold a mock draft2. If you had to start all over which
employees would you keep?3. Who are the first ones chosen4. Who are the last ones chosen5. Actually write it down

16
1
2
3
4
Ranking Your Staff
Core Group
Leaders
Top Performers
On the Bubble
Who is in Your Core Group?
What qualities do the bring?Can do attitudeWillingness to do whatever it takesTalentLeadershipMarketingIdentityFollowing
Should they be Owners?
Who are Your Leaders?
What qualities do the bring?Can they eventually become part of your core group?Client followingWho views them as leadersCan the become part of your core group and how?

17
Who are Your Top Performers?
Compare to their peer groupCan be at any level of the companyTechnical SkillsDesign SkillsMarketing SkillsCan they become a leader?
Who is on the Bubble?
What can they improve?Can they improve and can we help them?What feedback can we give them?What training or motivation can we provide?Should we help with a transition?
Who is on the Bubble?
Why are they not a top performer?What can they improve?Can they improve and can we help them?What feedback can we give them?What training or motivation can we provide?

18
Annual Review
Hold it on TimeHold it on TimeHold it on Time
Don’t put the burden on the employee to make it happenIf we are communicating throughout the year, the review is easy
Monthly E-Mail Newsletter
State of the FirmNew Projects
How we wonBrief overviewProject Team
PromotionsAwardsMilestones
Monthly E-Mail Newsletter
Individual RecognitionTeam RecognitionExpansion PlansUpcoming Events

19
Quarterly Meeting for Staff
Owners can talk about any topic they choose
Firm HistoryNew initiativesQ & A
Others can give a talkMarketingAdministration
Retreat Activities
Quarterly ½ day or full dayTheme Based
Improved CommunicationExpand into new marketsOpen new officesOffer new services
A facilitator would help the process
Project Related Communication
New project e-mail announcement to the entire firmBulletin Board PostingsIn-house presentations
Improves presentation skillsElectronic Photo Gallery

20
In-House Seminars/Training
All Attendees hear the same informationTechnology ToolsAchieving a 20%+ ProfitProject ManagementClient CommunicationsCollections
Do Something Just For Fun
BarbecueSponsor Team SportsActivities that include familiesMuseum ToursBaseball Games
Pathway to Profit™
Cash Flow & Collectionsfor 20%+ Profit
AEC Management Solutions, Inc.

21
Elements of a 20%+ Profit
Understanding the Financial FundamentalsProduce Timely & Accurate Project InformationStrategic PlanningCommunicationsCash Flow & CollectionsProject ManagementIncentive Compensation
Key Indicators
Utilization:
Direct Labor $ Total Labor $
Net Multiplier: Net Revenues $ Direct Labor $
Overhead Rate:
Total Indirect Expenses Total Direct Labor $
Accounts Receivable In Days:
Accounts Receivable $ (Annual Sales/365 days)
Backlog in Days Uncompleted Work under Contact (Annual Sales/365 days)
Annual Sales 1,000,000$ 5,000,000$ 10,000,000$ Sales Per Day 2,740$ 13,699$ 27,397$
Days A/R Additional Additional Additional Outstanding Cash Flow Cash Flow Cash Flow
120 Baseline Baseline Baseline115 13,699$ 68,493$ 136,986$ 110 27,397$ 136,986$ 273,973$ 105 41,096$ 205,479$ 410,959$ 100 54,795$ 273,973$ 547,945$ 95 68,493$ 342,466$ 684,932$ 90 82,192$ 410,959$ 821,918$ 85 95,890$ 479,452$ 958,904$ 80 109,589$ 547,945$ 1,095,890$ 75 123,288$ 616,438$ 1,232,877$ 70 136,986$ 684,932$ 1,369,863$ 65 150,685$ 753,425$ 1,506,849$ 60 164,384$ 821,918$ 1,643,836$
How Much Money do you Want?

22
Month 1 Month 2 Month 3 Month 4 Month 5 Month 6Invoices 20,000$ 20,000$ 20,000$ 20,000$ 20,000$ 20,000$ Reimbursables & Directs 2,000 2,000 2,000 2,000 2,000 2,000 Net Revenue 18,000 18,000 18,000 18,000 18,000 18,000
Direct Labor 6,000 6,000 6,000 6,000 6,000 6,000 Gross Profit 12,000 12,000 12,000 12,000 12,000 12,000
Overhead 8,400 8,400 8,400 8,400 8,400 8,400 Profit 3,600$ 3,600$ 3,600$ 3,600$ 3,600$ 3,600$
Monthly Disbursements 16,400$ 16,400$ 16,400$ 16,400$ 16,400$ 16,400$ Colledtions at 60 Days 20,000 20,000 20,000 20,000 Monthly Cash Flow (16,400) (16,400) 3,600 3,600 3,600 3,600 Culmulative Cash Flow (16,400)$ (32,800)$ (29,200)$ (25,600)$ (22,000)$ (18,400)$
Collections at 90 days 20,000 20,000 20,000 Monthly Disbursements 16,400 16,400 16,400 16,400 16,400 16,400 Monthly Cash Flow (16,400) (16,400) (16,400) 3,600 3,600 3,600 Culmulative Cash Flow (16,400)$ (32,800)$ (49,200)$ (45,600)$ (42,000)$ (38,400)$
Cash Flow with 20% Profit60 and 90 Day Collection Periods
10,000,000$ Annual Sales365 Days in the Year
27,397$ Average Sales per Day
2,602,740$ Outstanding Receivables684,932$ Work In Progress (WIP)
3,287,671$ Total Work Completed and not Paid
95 Outstanding Receivables Measured in Days25 Outstanding WIP Measured in Days
120 Total Days of Work Completed and not Paid
500,000$ Profit at 5% of Annual Sales6.58 Years of Profit in Work Completed and Not Collected
1,000,000$ Profit at 10% of Annual Sales3.29 Years of Profit in Work Completed and Not Collected
1,500,000$ Profit at 15% of Annual Sales2.19 Years of Profit in Work Completed and Not Collected
2,000,000$ Profit at 20% of Annual Sales1.64 Years of Profit in Work Completed and Not Collected
How Much Profit Are You Owed?
Collection Process
Proposal/ContractKick-off MeetingInvoicingFollow-up for Payment

23
Ideas for Proposal/Contract
1.
2.
3.
4.
5.
6.
7.
Ideas for Start-up Meeting
1.
2.
3.
4.
5.
6.
7.
Ideas for Invoicing

24
Ideas for Payment Follow-up
Pathway to Profit™
Project Managementfor 20%+ Profit
AEC Management Solutions, Inc.
Elements of a 20%+ Profit
Understanding the Financial FundamentalsProduce Timely & Accurate Project InformationStrategic PlanningCommunicationsCash FlowProject ManagementIncentive Compensation

25
Proposal/Contract Language
FeesDeliverablesSchedulesMeetingsClient Responsibilities
Fees
Don’t be afraid to ask what you are worthYou can always lower your feeMost clients do not leave over priceTie the fee to specific assumptions
Construction CostMeetingsProgram
Fees
Escalation clauses for hourly servicesDo not give a fixed fee for an unknown quantity of work
ApprovalsUndefined Program
Proposal/Contract termination dateProject Suspension Fee

26
Deliverables
Include a Drawing ListInclude a Responsibility Matrix
ClientConsultant (You)Other Consultants
What is not includedSurveysApprovals
Schedules
Schedule by PhaseCalendar DatesNumber of weeks or monthsLonger/Shorter schedule will result in fee increaseClient approval schedule
Meetings
Limit the number and frequency of meetings
Explicitly state the number of meetingsQuote a flat rate for additional meetings
Attend only the portion of the meeting that requires your participation

27
Meetings
Limit the number of attendeesSubstitute the proactive weekly report
Client Responsibilities
Designated Point of ContactProvide all of the needed informationTimely decisionsKeep up with their paper-work
ContractsChange ordersPayments
Bottom-Up BudgetingProposed Fee
Contingency
Project Expenses
Billing Rate
Estimated Hours
Deliverables/Task List

28
Top-Down BudgetingProposed Fee
Contingency
Project Expenses
Billing Rate
Estimated Hours
Deliverables/Task List
Circular BudgetingMaximum Fee
Contingency
Project Expenses
Billing Rate
Estimated Hours
What Can We Deliver?
Budgeting Reality Check
Percentage of Construction CostDesign Dollars per S.FPrevious ProjectsHours Per Drawing x Billing RateDollars Per Drawing

29
Client Communications
Be Proactive – Not ReactiveYou initiate most of the communication
Regular ScheduleAs far in advance as reasonably possibleTelephone call that you initiateRegular e-mail status reports
Status Report
Every week for active projects
Every 2-weeks to 1 month for less active projects
Status Report
Project Activity since last meetingMeetings attendedMilestone submissionsNew information Receive
Upcoming EventsMeetingsMilestone submissions

30
Status Report
Schedule IssuesIssues that may impact schedule
Client IssuesInformation needed from clientDecisions needed from client
Business IssuesApprovals neededAccounts Receivable
Project Progress Report

31
How Hard is this Job?
Staff
ConsultantsInterestGroups
Partners
Client
Project Manager
Project Business Reviews
Little or no preparation needed by project managerAccounting prepares the financial informationThe Project Manager, Partner in Charge, Controller, Managing Partner attend the MeetingFrequency is every two weeks
Same day of the weekSame time of the dayPut it in your calendar 1 year in advance
Project Business Reviews
At the meeting we reviewPercent Complete vs. Percent SpentOut of Scope WorkStaffingScheduleInvoicingAccounts Receivable

32
Percent Complete Vs. Percent Spent
Project as a whole or by phaseIf there is a variance, find out whyDevelop an action plan (who, what, when) to turn things aroundReview the action plan at next meeting
Out of Scope Work?
If yes, ask to see the contract so we can adjust budget.If no signed contract, ask what action the project manager intends to takeAsk when they intend to take actionAdd to the action list
Is Project on Schedule
If not why?Is the schedule delay beyond our control?What does the contract say about the schedule?How do we intend to notify the client that we need to be paid for our added time due to delaysAdd the intended action to the action list

33
Staffing?
What is the current level of project staffing?How long will we maintain this level?How can we adjust staffing to bring in line with budget?When will we adjust the staffing?Add to the action list
Accounts Receivable
Invoices over 45 days oldI ask the project manager to contact the client
Invoices over 60 days oldWhy hasn’t the client paid?What reason did the client give for not paying?
Invoicing
For projects invoiced as a percentage of completion
What percentage of completion will we be invoicing at month endIf near month end I will ask accounting to prepare the invoice
For hourly projectsHow much do you estimate we will invoice this month?

34
Accounts Receivable
Project Review Action List
Fee is 302k.35 weeks to go – 6 hours per week. Must keep involvement to a minimum.
Partner – Will put in claim for delays by Feb. 9th. $30 - $40k
60% CDHMCDeville Company3032.02
30% Complete DD & 36% Spent. Need DD decisions to be made. PM will submit a revised work plan by 2/12 to get us back on track
Will call consultants to submit their invoices
30% DDGFMUniversity Hall Basic Services
3022.02
RemarksInvoicingManagerProject NameProject #
Pathway to Profit™
Incentive Compensationfor 20%+ Profit
AEC Management Solutions, Inc.

35
Elements of a 20%+ Profit
Understanding the Financial FundamentalsProduce Timely & Accurate Project InformationStrategic PlanningCommunicationsCash Flow & CollectionsProject ManagementIncentive Compensation
The Big Question
Why Have Incentive Compensation?
Typical Reasons for Incentive Compensation
Lack of Firm-Wide ProfitabilityWide Disparity of Profits Between Partners Offices or Project ManagersSome are Consistently ProfitableSome are Consistently Losing MoneySome are In-BetweenAs a Whole there is Dissatisfaction With Financial Results

36
Pre-Requisites to an Effective Incentive Compensation Program
Confidence in Financial InformationTimely and Accurate Financial ReportingConfidence in Financial/Project Management SoftwareOpen Communication Between the PartnersRegular Project Financial Reviews Where Open Communication is EncouragedConfidence in Accounting Personnel
Issues Addressed
Bad DebtBilling RatesWorking Without ContractsAmbiguous Contract Language on FeesNot Getting Paid for Additional WorkLack of Real Incentive at the Partner LevelLack of Accountability at All Levels of CompanyInexperienced Project Managers
Big Picture
Differentiate Contribution as an Employee vs. Benefits of being an OwnerOwnership Provides a Return on Investment Such as an Increase in Capital Account or DividendEmployee Contribution is Rewarded with Salary, Benefits and Incentive Bonus

37
Benefits of Ownership
TitlePrestigePerksReturn on InvestmentInfluence on Direction of CompanyMore Control Over Career
Benefits of Employment
SalaryAnnual Increases in Salary on MeritBenefitsNo Risk of Investment
Successful Incentive Plans
Everyone Must Understand What Results are RewardedEconomic Contributions Receive Economic RewardsNon-Economic Efforts Receive Non-Economic Rewards100% Objective CriteriaConsistent Reinforcement of Rewarded ResultsRewards Must be Significant

38
Successful Incentive Plans-2
Should Encourage Recruitment & RetentionSimple to AdministerDoes not Encourage Counter Productive BehaviorOpportunity Exists for all Key Personnel to Earn an IncentiveDon’t Make it a Stealth PlanMake Sure Quality of Design is not CompromisedDon’t Limit the Incentive Amount!
Incentive Compensation Does Not Reward
EffortLong HoursSeniorityHow Much We Like YouHow Badly You Need the MoneyNon-Economic Contributions to the CompanyMeeting Minimum Performance Standards
Incentive Compensation Does Reward
Positive Economic ResultsProfitabilityIncreasing Value for the Stockholders

39
Distributing the Profits
Suggested Distribution for Initial Calculations
1/3 Stays in the Company to Fuel Growth1/3 Distributed to Partners as an Incentive1/3 Goes to Employees as a Bonus
Distribution of Profits
Company Profits
1/3 to RetainedEarnings
1/3 PartnersIncentive
1/3 to EmployeeIncentive Pool
Profit Pools
PartnerPool
Non-RevenuePartner Pool
RevenuePartner Pool
Rewarded forExceeding Target Profit
Rewarded on Pct.Of Relative Profit

40
Partners Incentive Pool
Non-Revenue Partners Not responsible for Revenue Producing Projects
Revenue PartnersResponsible for Revenue Producing Projects
Non-Revenue Partners
Responsible for Creating an Environment that Provides the Greatest Opportunity for the Long-Term Financial Success of the CompanyThey are Rewarded on the Basis of Firm-Wide ProfitsMinimum Profitability Standard Must be Exceeded Before a Bonus Distribution is Made
Non-Revenue Partner
A Minimum Expectation of Profit Percentage is Established
• We call this percentage the target profit• To the extent that profits exceed the
target profit, the non-revenue partner (typically the managing partner) receives a percentage of the excess.
• This percentage should be substantial• 50% for example

41
Non-Revenue Partner
Company Profits
Deduct Target Profit
Multiply Excess Profit by NR Partner Participation %
Revenue Partners
Rewarded on the Basis of Their Profit Centers Results as it Relates to the Firm-Wide Profit
• Partner A has a $20,000 profit• Partner B has a $50,000 profit• Partner C has a $30,000 profit
Therefore• Partner A is entitled to 20% of the revenue
partner profit pool• Partner B is entitled to 50% of the revenue
partner profit pool• Partner C is entitled to 30% of the revenue
partner profit pool
Revenue Partners
RevenuePartner
Pool
Partner A$20,000 Profit
Partner B$50,000 Profit
Partner C$30,000 Profit
20% of Profit Pool 50% of Profit Pool 30% of Profit Pool

42
Revenue Partners
In Making this Calculation Profit Center Losses are Ignored
• Partner A has a $30,000 profit• Partner B has a $70,000 profit• Partner C has a $50,000 loss
Therefore:• Partner A is entitled to 30% of the
revenue partner profit pool• Partner B is entitled to 70% of the
revenue partner profit pool• Partner C does not participate in the
distribution
Revenue Partners
RevenuePartner
Pool
Partner A$30,000 Profit
Partner B$70,000 Profit
Partner C$50,000 Loss
30% of Profit Pool 70% of Profit Pool Participates asEmployee
Revenue Partners
A Partner’s Bonus Will Not be Less Than They Would Earn as an Employee

43
Add Additional Modules as Needed
Project Manager Plan• Handle the same as the partner level plan• Establish a bonus pool• Project Managers compete for distributions
based upon their relative profitability
Location Based Plan• Handle the same as the non-revenue partner
level plan• Establish a target profit• Reward the person in charge of the office for
exceeding the target profit
Employee Bonus Pool
Divided into Sub-Pools for Employee CategoriesSenior AssociateAssociates & Project ManagersAll Other EmployeesWithin these Pools, Bonuses are Distributed According to Relative Salaries Earned During the Quarter
Employee Profit PoolsExample # 1
Employee Pool
Senior Staff Pool Project Managers Technical & Administrative Staff
Rewarded on Basis ofRelative Salaries
Rewarded on Basis ofRelative Salaries
Rewarded on Basis ofRelative Salaries

44
Employee Profit PoolsExample # 2
Employee Pool
Senior Staff Pool Project Managers Technical & Administrative Staff
Rewarded on SameBasis as Non-Rev.
Partner
Rewarded on SameBasis as
Revenue Partner
Rewarded on Basis ofRelative Salaries
Benefits of Incentive Plans
Employee RecruitmentEmployee RetentionEmployee MoraleGolden Handcuffs (Well Maybe Silver)Increased Contributions to Retirement Plan
What to Expect
Increased ProfitsIncreased Net MultiplierReduction of Unpaid Out of Scope ServicesIncreased RevenuePossible Change in Overhead

45
Rules to Live by
Company Must be Profitable Year to Date Before any Distributions are MadeIndividual Profit Centers Must be Profitable Year to Date Before any Distributions are Made to the PartnerAny Accounts Receivable Over 120 Days is Considered a Bad Debt for Purposes of the Incentive Bonus Plan
Rules to Live by
Collection of Accounts Receivable Over 120 Days Counts as Revenue in the Period it is CollectedIncentive Distributions are Made by the End of the Following QuarterEmployee Must be with Company when Bonus is Distributed
FAQ
Won’t This Cause Competition Among the Partners?Won’t this Cause Competition Among the Project Managers?Won’t This Cause Competition Among the Employees?Won’t Some Employees Leave the Company?

46
FAQ
What about Partners that don’t Manage Projects –but Make a Significant Contribution to the Company?Aren’t Some Markets/Clients Inherently Less Profitable?What about Project Managers that are Stuck with Lousy Clients, Contracts, Projects, Staff, Contractors, Associate Architects…..?
Implementation
Review Seminar Materials and Philosophy with Partners & Get Their Buy-InClean-up Your Financial ReportingStart Project Financial/Business ReviewsCalculate What Distributions Would Look Like Based Upon Past PerformanceStart Implementation at the Highest Level of Company
AEC Managrment Solutions, Inc.138
Implementation
Fine-Tune System to Meet Your Individual NeedsAfter Success at the Partner Level, Implement other levels of Accountability (Project Managers)Remember to Reward Economic Results With
Economic Rewards

47
Profit by Design Series
Incentive Compensation
Real World Examples© AEC Management Solutions, Inc.
All rights reserved. No part of this presentation may be reproduced or used in any form without the express written permission of the publisher
Company Profile # 1
Full Service Firm offering a range of Engineering and Architectural ServicesMultiple Offices (More than 5)Located Across Midwest and SouthEmployees 200+Ownership is Widely Dispersed with No One Person Owning More than 15%Profits were Historically 8% of Net Revenues
Challenges
Change the Firm Culture to Rewarding Results Rather that EffortProvide a Real Opportunity for Employees to Earn Significant Financial RewardsConvince a Majority of Shareholder’s to Approve the Plan

48
Incentive Pool
Non-Revenue PrincipalsNot responsible for Revenue Producing Projects
Revenue EmployeesResponsible for Revenue Producing Projects
Non-Revenue Principals
Responsible for Creating an Environment that Provides the Greatest Opportunity for the Long-Term Financial Success of the CompanyThey are Rewarded on the Basis of Firm-Wide ProfitsMinimum Profitability Standard Must be Exceeded Before a Bonus Distribution is Made
Non-Revenue Principals - 2
A Minimum Expectation of Profit Percentage is Established
• We call this percentage the target profit• To the extent that profits exceed the
target profit, the non-revenue employees receive a percentage of the excess.
• This percentage should be substantial

49
Distributing the Profits
1st 5% of Net Profit Stays in the Company to Fuel GrowthBalance of Profits is Divided into Pools
Non-Revenue Principals Office ManagersDiscipline LeadersProject ManagersEmployees
Distributing the Profits
Non-Revenue Partners receive 20% of profit in excess of 5%The remaining profit is then divided into equal pools of 25% each for
Office Managers (OM)Discipline Leaders (DL)Project Managers (PM)Employees (NT for non-titled)
Distributing the Profits
Each employee in the OM, DL, PM categories compete for their share of the profit distribution –Based upon Relative Profits

50
Profit Pools
Company Profits
1st 5% ProfitRemains in Company
Non-RevenuePrincipal Pool
Revenue Employee Profit Pool
Profit Pools
NR PrincipalsReceives 20% of Profit
In Excess of Target
CEO
55%
COO
35%
CFO
10%
Profit Pools
RevenueEmployees
Office Managers25% of ProfitDistribution
Discipline Leaders25% of ProfitDistribution
Project Managers25% of ProfitDistribution
Non-Titled25% of ProfitDistribution

51
Revenue Employees
Rewarded on the Basis of Their Profit Groups Results as it Relates to the Firm-Wide Profit
• Office Manager A has a $20,000 profit• Office Manager B has a $50,000 profit• Office Manager C has a $30,000 profit
Therefore• OM A is entitled to 20% of the Office Manager
profit pool• OM B is entitled to 50% of the Office Manager
profit pool• OM C is entitled to 30% of the Office Manager
profit pool
Revenue Employees
In Making this Calculation Profit Center Losses are Ignored
• Office Manager A has a $30,000 profit• Office Manager B has a $70,000 profit• Office Manager C has a $50,000 loss
Therefore:• OM A is entitled to 30% of the OM profit pool• OM B is entitled to 70% of the OM profit pool• OM C does not participate in the distribution
Revenue Employee
The Discipline Leader and Project Managers will compete for their share of the Incentive Distribution on the same basis as the Office Managers
An Non-Revenue Employee, Office Manager, Discipline Leaders or Project Managers Distribution, Will Not be Less Than They Would Earn as an Employee

52
Office Manager Profit PoolExample # 1
Office Managers
Office Mgr. A Office Mgr. B Office Mgr. C
$20,000 Profit $50,000 Profit $30,000 Profit
20% of Profit Pool 50% of Profit Pool 30% of Profit Pool
Office Manager Profit PoolExample # 2
Office Managers
Office Mgr. A Office Mgr. B Office Mgr. C
$30,000 Profit $70,000 Profit $50,000 Loss
30% of Profit Pool 70% of Profit Pool Participates as Employee
Employee Bonus Pool
Bonuses are Divided According to Relative Salaries Earned During the Quarter

53
Spot Bonuses
In order to recognize contributions to the company – that cannot be easily quantified, a spot bonus program was also adoptedExamples – Taking over a problem project, Helping to turn around an under performing office, landing a major new clientSpot bonuses are at the sole discretion of the Board of Directors
Rules to Live by
Company Must be Profitable Year to Date Before any Distributions are MadeIndividual OM, DL & PM Must be Profitable Year to Date Before any Distributions are Made to the PartnerAny Accounts Receivable Over 120 Days is Considered a Bad Debt for Purposes of the Incentive Bonus Plan
Rules to Live by
Collection of Accounts Receivable Over 120 Days Counts as Revenue in the Period it is CollectedIncentive Distributions are Made by the End of the Following QuarterEmployee Must be with Company when Bonus is Distributed

54
Results
The first quarter that this program was adopted, profits doubled when compared to the prior yearProfits rose from 8% of net revenues to 16% of net revenuesThe second quarter profits exceeded 20% of net revenues.
Company Profile #2
Architecture Firm serving a wide range of markets both domestic and internationalOne office175 EmployeesOwnership is somewhat dispersed.2 employees own a controlling interestProfits were historically low – less than 5% of net revenues
Challenges - 2
Differentiate Contribution as an Employee vs. Benefits of being an Owner
Convincing the majority owners to receive profits less than their percentage of ownership

55
Distribution of Profits
Company Profits
1/3 to RetainedEarnings
1/3 PartnersIncentive
1/3 to EmployeeIncentive Pool
Profit Pools
PartnerPool
Non-RevenuePartner Pool
RevenuePartner Pool
Rewarded forExceeding Target Profit
Rewarded on Pct.Of Relative Profit
Non-Revenue Partner
Company Profits
Deduct Target Profit
Multiply Excess Profit by NR Partner Participation %

56
Revenue Partners
RevenuePartner
Pool
Partner A$20,000 Profit
Partner B$50,000 Profit
Partner C$30,000 Profit
20% of Profit Pool 50% of Profit Pool 30% of Profit Pool
Revenue Partners
RevenuePartner
Pool
Partner A$30,000 Profit
Partner B$70,000 Profit
Partner C$50,000 Loss
30% of Profit Pool 70% of Profit Pool Participates asEmployee
Employee Profit PoolsExample # 1
Employee Pool
Senior Associates Associates &Project Managers
Technical & Administrative Staff
Rewarded on Basis ofRelative Salaries
Rewarded on Basis ofRelative Salaries
Rewarded on Basis ofRelative Salaries
Sr. AssociateAverage is
2 X Associate
Associate IncentiveAverage is
2 X Technical
Technical Incentive Average is
½ Associates

57
Results
The first quarter this program was implemented the profits increased to 16% of net revenuePlan has been in place for 4 years and annual profits have been well in excess of 20% of net revenuesBad Debt has virtually been eliminatedEvery Partner is now profitable
Results
Quarterly bonuses in excess of $100,000 to individual partners is now routineQuarterly bonuses to technical, associates and senior associates have been as high as $2,000, $4,000 and $8,000 respectivelyRetained profits in the company have enabled them to invest in the best equipment and software.
Taking Action
Review the materialsDecide which 3 actions would produce the most immediate benefitDecide on who is responsible and set a deadlineImplement those ideasRepeat the process

58
Contact Information
Herbert M. CannonAEC Management Solutions, Inc.183 Higgins RoadMatawan, NJ 07747
Phone: 732-705-5098
E-Mail: [email protected]
Subscribe to our free e-mail newsletterwww.aecmanagementsolutions.com