advisory board presentation d materials
TRANSCRIPT

AIM XLIX | December 9, 2019
ADVISORY BOARD PRESENTATIONDISCUSSION MATERIALS

Analyst Introductions
2
Geoff Allman
Waste Management, Kimberly-Clark
Katie Brown
Facebook, Spotify
James Campion
Dollar General, Inseego
Carson Collins
Crown Holdings, Stryker
Carter Collins
Microsoft, Qualys
John Cresson
NextEra Energy, Stamps.com
Dan Delfico
Booking Holdings, Stitch Fix
Matthew Herzog
The Blackstone Group, Mastercard
Jimmy Hunter
Abiomed, Trupanion
Kyle Hyland
Kinder Morgan, CVS Health
Cameron Kaupp
A.O. Smith, CarMax
Michael Kusznerko
Diamondback Energy, Aerojet Rocketdyne
Patrick Lacy
XPO Logistics, Tyson Foods
Charlie McDonough
Palo Alto Networks, Halliburton
Annie McVeigh
EchoStar, Lululemon Athletica
Sean O’Brien
Caterpillar, TJX Companies
Luke Reilly
InterDigital, Teladoc Health
Sam Rocheford
Constellation Brands, Costco Wholesale
Lauren Weetman
Alphabet, GTT Communications
Ben Shepard
Comerica, Zillow
David Seo
Intercontinental Exchange, Micron Technology

3
I. COURSE OVERVIEW
II. ECONOMIC OUTLOOK
III. SECURITY ANALYSIS
IV. PORTFOLIO PERFORMANCE
V. AIM XLIX REVIEW
VI. CONCLUDING REMARKS
A. Course Fundamentals
B. Investment Philosophy & Policies
C. Analyst Responsibilities

4
Course Fundamentals
Course Objectives
• Blend traditional academic objectives with the practical
experience of hands-on investment management
• Provide thorough grounding in the practice of portfolio
management
Methodology
• AIM XLIX inherited a ~$16.8 million portfolio handed over by the previous class
• Each analyst covers an existing portfolio stock
• Analysts pitch a new stock of their choice to be considered for addition to the portfolio
• Finally, the class votes on the composition of the new portfolio based on each analyst's final recommendation on the ~40 stocks
Source: AIM Syllabus – Fall 2019.
Analyst Selection
• Students submit a resume, transcript and essay detailing their
desires and qualifications to participate in the course
• Analysts are selected based on academic performance,
professional experience and other relevant criteria
• Emphasis on rigorous individual security evaluation and
selection
5
Investment Philosophy and Policies
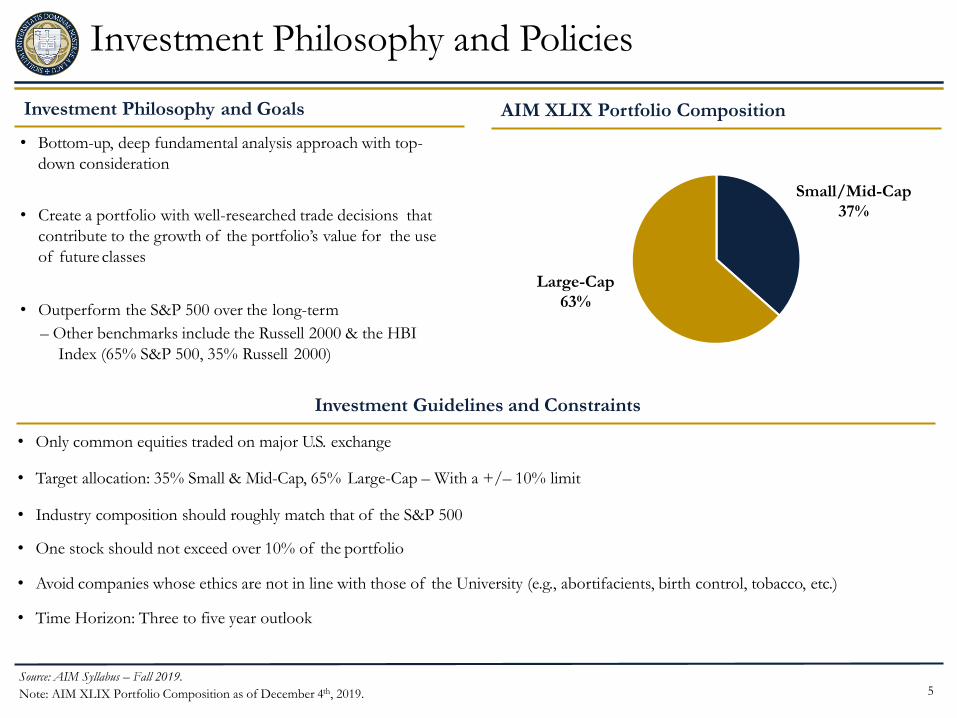
Investment Philosophy and Goals
• Bottom-up, deep fundamental analysis approach with top-
down consideration
• Create a portfolio with well-researched trade decisions that
contribute to the growth of the portfolio’s value for the use
of future classes
• Time Horizon: Three to five year outlook
• Only common equities traded on major U.S. exchange
• Avoid companies whose ethics are not in line with those of the University (e.g., abortifacients, birth control, tobacco, etc.)
• Target allocation: 35% Small & Mid-Cap, 65% Large-Cap – With a +/– 10% limit
• One stock should not exceed over 10% of the portfolio
• Outperform the S&P 500 over the long-term
– Other benchmarks include the Russell 2000 & the HBI
Index (65% S&P 500, 35% Russell 2000)
Source: AIM Syllabus – Fall 2019.
Note: AIM XLIX Portfolio Composition as of December 4th, 2019.
AIM XLIX Portfolio Composition
Large-Cap
63%
Small/Mid-Cap
37%
Investment Guidelines and Constraints
• Industry composition should roughly match that of the S&P 500

6
Analyst Responsibilities
Individual Responsibilities Analyst Reports
• In-depth research and coverage of two stocks and
effective communication of findings to peers
• Completion of various analyst reports and group projects
• Staying informed on the markets / stocks in the portfolio
• Company Background
• Fundamental Analysis
• Earnings Forecast
• Cost of CapitalForecast
• Valuation
• Technical Analysis
• Industry / Sector Analysis
• Economic Analysis
• Portfolio Performance
• Newsletter
• A student is assigned as “CIO” for each class
– CIO responsibilities include a market update and
organization of the class period
AIM XLIX Portfolio Composition
AIM XLIX
Additions 46%
Inherited Portfolio
54%
Source: AIM Syllabus – Fall 2019.
Note: AIM XLIX Portfolio Composition as of December 4th, 2019.
Group Projects

7
I. COURSE OVERVIEW
II. ECONOMIC OUTLOOK
III. SECURITY ANALYSIS
IV. PORTFOLIO PERFORMANCE
V. AIM XLIX REVIEW
VI. CONCLUDING REMARKS
A. Economic Indicators
B. Political Environment
C. Domestic Considerations
D. International Considerations
E. Outlook and Implications

8
Q3 2019 U.S. GDP Breakdown
Source: U.S. Bureau of Economic Analysis and Washington Post.
Note: GDP growth statistics reflect nominal year-over-year figures.
Major Category Q1 2019 Q2 2019 Q3 2019
Overall Growth 3.1% 2.0% 1.9%
Consumption +0.8% +3.0% +1.9%
Investment +1.1% (1.1%) (0.3%)
Trade +0.7% (0.7%) (0.1%)
Government +0.5% +0.8% +0.4%
Consumption Investment Net Exports Gov. Spending
• Price driven decrease
in consumption
growth despite
increasing confidence
• Driven by vehicle and
long-lasting good
spending
• Significant decrease
in non-residential
investment spending
due to rising global
uncertainty
• Driven by negative
growth on structures
and equipment
• Significant trade war
and exchange rate
factors
• U.S. imports of goods
hit by Chinese tariffs
were down 26% in the
first half of 2019
• Increasing federal
government
expenditures
• Increasing military
spend and budget
proposals
Contribution Drivers
GDP Contributions Highlight Underlying Weaknesses

9
U.S. Interest Rates
Source: Federal Reserve, Wall Street Journal and New York Times.
5-Year Historical Federal Funds Rate
The Fed has recently sought to sustain a 10-year expansion with precautionary rate cuts
- -
0.5%
1.0%
1.5%
2.0%
2.5%
3.0%
Oct-14 Apr-15 Oct-15 Apr-16 Oct-16 Apr-17 Oct-17 Apr-18 Oct-18 Apr-19 Oct-19
Recent Fed Activity Fed Outlook
Date Change (bp) Level (%)
Sept. 2018 25 2.00% - 2.25%
Dec. 2018 25 2.25% - 2.50%
Aug. 2019 (25) 2.00% - 2.25%
Sept. 2019 (25) 1.75% - 2.00%
Oct. 2019 (25) 1.50% - 1.75%
• The Fed has lowered interest rates three times in the latter
half of 2019, yet does not plan to cut rates in the near future
• Despite a relatively solid economy, the Fed cited a number of
risks following its October meeting
– Ongoing trade disputes
– Weak global growth due to the strong USD
– Signs of slowing domestic growth
• Low inflationary environment lends credence to current low
interest rate levels
1.75%
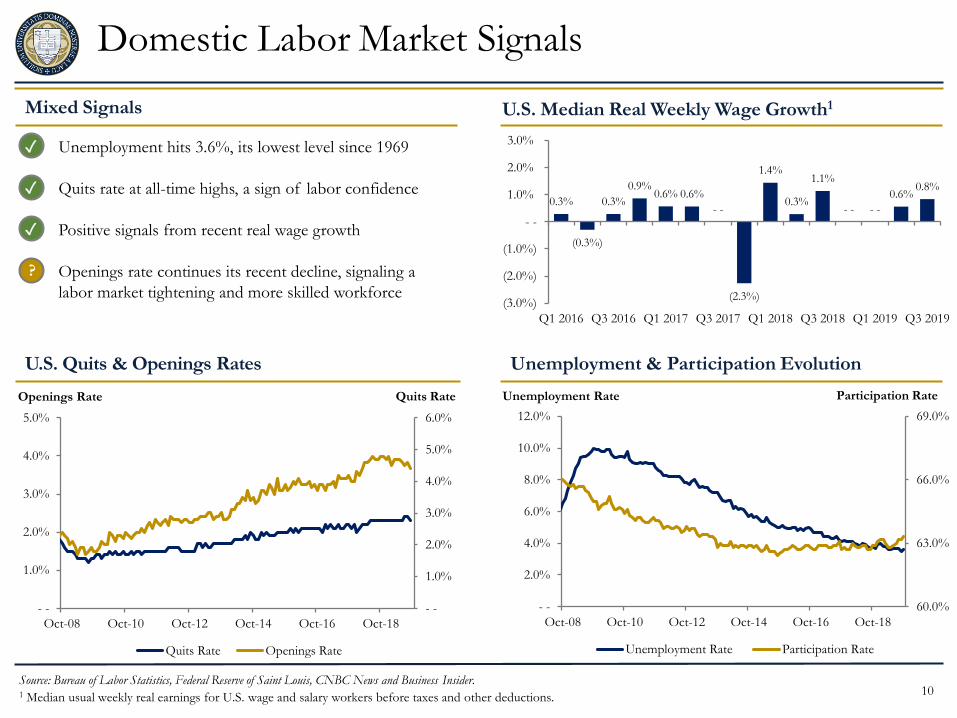
• Unemployment hits 3.6%, its lowest level since 1969
• Quits rate at all-time highs, a sign of labor confidence
• Positive signals from recent real wage growth
• Openings rate continues its recent decline, signaling a
labor market tightening and more skilled workforce
Domestic Labor Market Signals
Source: Bureau of Labor Statistics, Federal Reserve of Saint Louis, CNBC News and Business Insider.1 Median usual weekly real earnings for U.S. wage and salary workers before taxes and other deductions.
U.S. Quits & Openings Rates Unemployment & Participation Evolution
Mixed Signals
Unemployment Rate Participation RateOpenings Rate Quits Rate
U.S. Median Real Weekly Wage Growth1
✓
✓
10
- -
1.0%
2.0%
3.0%
4.0%
5.0%
6.0%
- -
1.0%
2.0%
3.0%
4.0%
5.0%
Oct-08 Oct-10 Oct-12 Oct-14 Oct-16 Oct-18
Quits Rate Openings Rate
60.0%
63.0%
66.0%
69.0%
- -
2.0%
4.0%
6.0%
8.0%
10.0%
12.0%
Oct-08 Oct-10 Oct-12 Oct-14 Oct-16 Oct-18
Unemployment Rate Participation Rate
0.3%
(0.3%)
0.3%
0.9%0.6% 0.6%
- -
(2.3%)
1.4%
0.3%
1.1%
- - - -
0.6%0.8%
(3.0%)
(2.0%)
(1.0%)
- -
1.0%
2.0%
3.0%
Q1 2016 Q3 2016 Q1 2017 Q3 2017 Q1 2018 Q3 2018 Q1 2019 Q3 2019
✓
?

11
U.S. Housing Starts
Increases in U.S. housing starts signals consumers’ confidence in continued economic expansion
U.S. Housing Starts1
Source: Federal Reserve, Wall Street Journal and Reuters.1 Units in thousands.
Housings Starts Imply Runway for Spending Volume of Construction Permits Increases
11
- -
200
400
600
800
1,000
1,200
1,400
1,600
2009 2010 2011 2012 2013 2014 2015 2016 2017 2018 2019
• Housing starts hit a 12-year high in 2019, signifying that
consumers remain confident in the U.S. economy
• Growth in housing starts was propelled by the construction
of both single and multi-family housing projects
– Suggests that the current low interest rate environment
has incentivized spending
• Permits for impending home constructions rose to levels last
seen in 2007
– Pending approval, this increase in submitted permits will
lead to more residential projects within fiscal years 2020
and 2021
1,314

12
- -
5.0%
10.0%
15.0%
20.0%
25.0%
30.0%
35.0%
40.0%
2009 2010 2011 2012 2013 2014 2015 2016 2017 2018 2019 2020
Domestic Considerations
Source: S&P Capital IQ, Wall Street Journal, New York Times and New York Federal Reserve.
U.S. Recession Probability Index Climbs Consumer Confidence Index Remains High
Current economic indicators generate ambiguity regarding future trends
Negative Considerations Positive Considerations
Low Market Volatility
12
94
95
96
97
98
99
100
101
102
2009 2010 2011 2012 2013 2014 2015 2016 2017 2018 2019
Drop in Consumer-Goods Imports
• U.S. Imports of goods such as cellphones, toys and apparel
fell sharply in September
• Imports sank 1.7% from August, led by a 4.4% drop in
imports of consumer goods and a 3.4% drop in imports of
vehicles and auto parts
• Signals impact of newest round of trade tariffs and slowing
consumer spending
• The Chicago Board of Trade’s volatility index (VIX) has
trended downwards over the course of the past six months
– Despite trade-war related fears, low volatility implies
optimism within the U.S. equity markets
• Despite a mild spike in volatility to start December, the
volatility index hit a six-month low during the month of
November
29.0%
100.9

13
27.0%
22.0%
18.0%
8.0%
- -
5.0%
10.0%
15.0%
20.0%
25.0%
30.0%
Joe Biden Elizabeth Warren Bernie Sanders Pete Buttigieg
Political Environment
Trump Continues to Drive Political Uncertainty
Leading Candidates Propose Reforms Democratic Presidential Candidate Polls1
Warren’s national
polling has increased
2% in the past month
Current democrat party candidates propose transformational
legislation for the healthcare and financial services industries
• Stop Wall Street Looting Act (Warren)
• Medicare for All (Sanders)
• Government Run Insurance Option (Biden)
Political environment remains frothy as presidential candidates propose new legislation and President Trump continues to face scrutiny
Source: New York Times and Wall Street Journal. 1 National polling from New York Times as of 12/3/19.

14
Global Manufacturing Slowdown
Source: AIM / 2019, Company Filings and ISM Manufacturing Report.
ISM Manufacturing Index
Consecutive quarters of contraction in global production threatens a number of our portfolio companies and the global economy
5-Year Trade-Weighted US Dollar Index Selected Portfolio Company Exposure
30
35
40
45
50
55
60
65
70
2005 2006 2007 2008 2009 2010 2011 2012 2013 2014 2015 2016 2017 2018 2019
Dealer inventories in the U.S.
declined in Q3
EPS contracted in Q3 for the first
time since 2017
Catalysts in aluminum can production
have offset falling global production
trends100
105
110
115
120
125
130
$135
Nov-14 Nov-15 Nov-16 Nov-17 Nov-18 Nov-19
$130.4
49.1
Nov-19
15
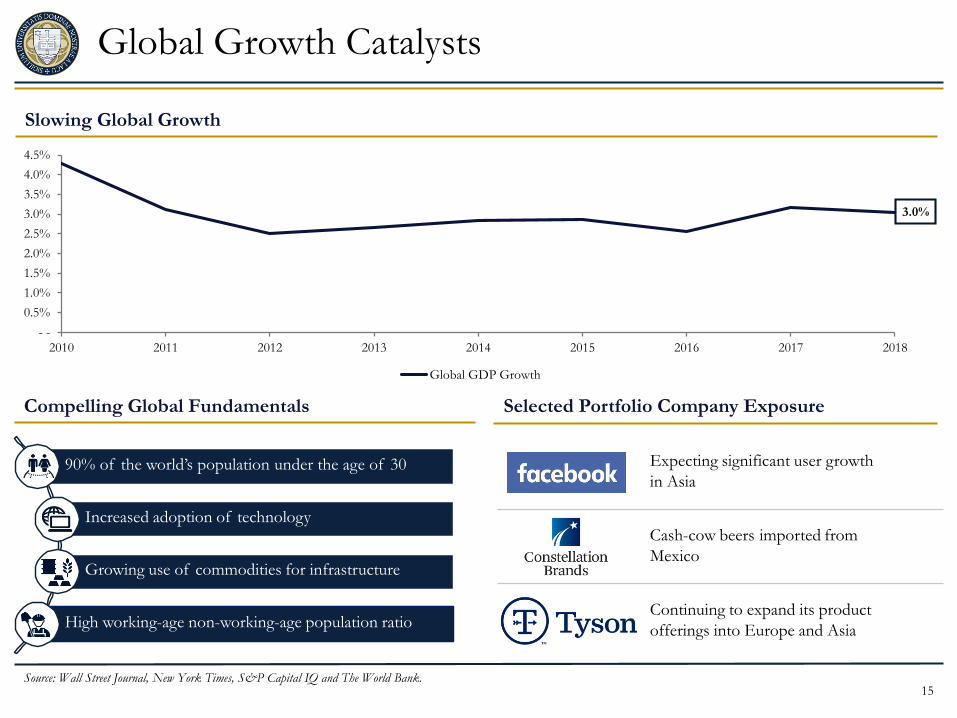
Global Growth Catalysts
Compelling Global Fundamentals
Slowing Global Growth
Selected Portfolio Company Exposure
90% of the world’s population under the age of 30
Increased adoption of technology
Growing use of commodities for infrastructure
High working-age non-working-age population ratio
Expecting significant user growth
in Asia
Cash-cow beers imported from
Mexico
Continuing to expand its product
offerings into Europe and Asia
Source: Wall Street Journal, New York Times, S&P Capital IQ and The World Bank.
- -
0.5%
1.0%
1.5%
2.0%
2.5%
3.0%
3.5%
4.0%
4.5%
2010 2011 2012 2013 2014 2015 2016 2017 2018
Global GDP Growth
3.0%

Summary Outlook
16
While recessionary cases were factored into our models, investment decisions were made based on the fundamentals of the businesses rather than attempting to time a recession
Domestic Takeaways
• Consumer confidence remains high despite being late in the cycle
• Low unemployment and a high quits rate are driving a strong labor market
• Growth in housing starts signals continued runway for spending
• Decreased consumption could drive an inability to meet inflation targets
Global Takeaways
• Contraction in global production and a strong U.S. dollar represent threats to the global economy
• Slowing global growth is offset by compelling fundamentals in emerging markets
x
✓
?
✓
✓
x
Source: AIM / 2019.

17
I. COURSE OVERVIEW
II. ECONOMIC OUTLOOK
III. SECURITY ANALYSIS
IV. PORTFOLIO PERFORMANCE
V. AIM XLIX REVIEW
VI. CONCLUDING REMARKS
18
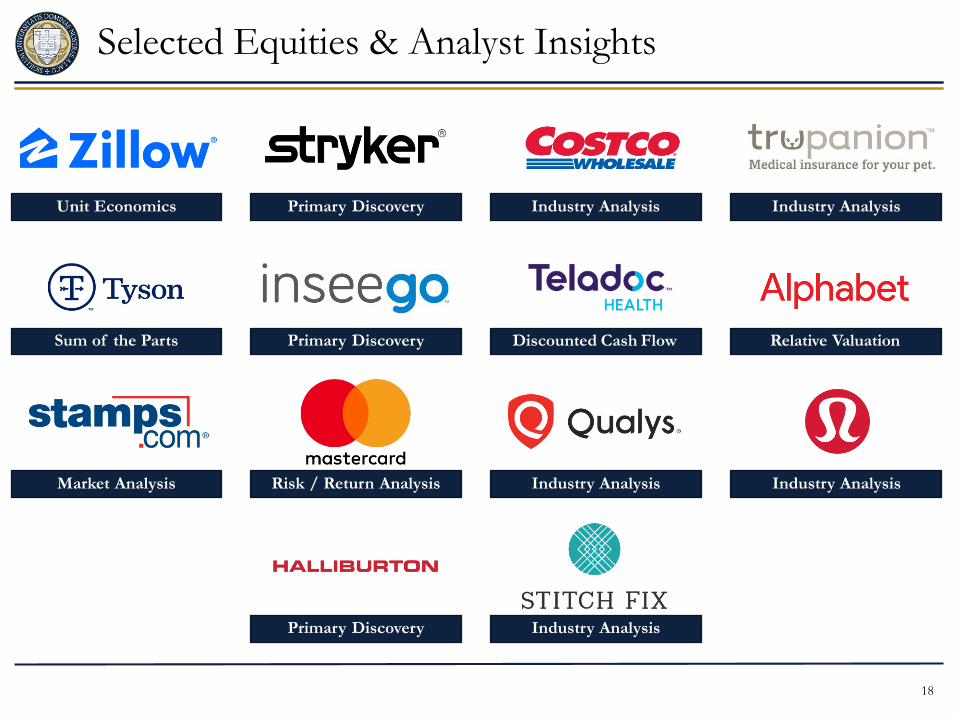
Selected Equities & Analyst Insights
Industry AnalysisPrimary DiscoveryUnit Economics Industry Analysis
Sum of the Parts Discounted Cash Flow Relative Valuation
Risk / Return Analysis Industry AnalysisMarket Analysis Industry Analysis
Primary Discovery
Primary Discovery
Industry Analysis

19
10
20
30
40
50
$60
Nov-18 Jan-19 Mar-19 Apr-19 Jun-19 Jul-19 Sep-19 Nov-19
Zillow Group (NASDAQ: ZG)
Source: AIM / Shepard 2019, Company Filings and S&P Capital IQ.
Company Overview Selected Financial Data
Share Price (as of November 22, 2019) $40.62
Equity / Enterprise Value $8.13 / $8.26 bn
LTM EPS ($1.12)
2019E P / E N / M
2019E EV / EBITDA N / M
Dividend Yield N / M
One-Year Share Price Performance
38.9%
• Zillow Group (NASDAQ: ZG) was founded in 2004 by
current CEO Richard Bratton
• Historically an online platform business connecting online real
estate traffic with brokers to facilitate transactions until 2018
– Receive ~70% of all online real estate search traffic
• Zillow 2.0 is a business transformation initiative that now
enables Zillow to buy and sell homes
– Value added to consumers: liquidity and convenience

20
Zillow % of FV
Home Fair Value $300,000 100.0%
Discount to Purchase Price ($3,000) 1.0%
Purchase Price $297,000 99.0%
Service Fee $17,820 6.0%
Renovation Premium $8,910 3.0%
Revenue to Zillow $326,730 108.9%
Less Purchase Price ($297,000) (99.0%)
Less Renovation Costs ($5,940) 2.0%
Less Agent Commissions ($8,910) 3.0%
Less Interest Expense ($2,970) 1.0%
Less Closing Costs ($4,455) 1.5%
Profit / Home $7,455 2.5%
Seller Leads $1,485 0.5%
Mortgage Origination $891 0.3%
Total Profit / Home $9,831 3.3%
Implied ROIC (15% equity & 3.0x turnover) 65.5%
Unit Economics
Source: AIM / Shepard 2019, Company Filings and S&P Capital IQ.20
Target 2% at scale
Can increase in
light of broker fees
Mgt. targets 1.5%
Annualized ROIC
21
Final Valuation & Recommendation
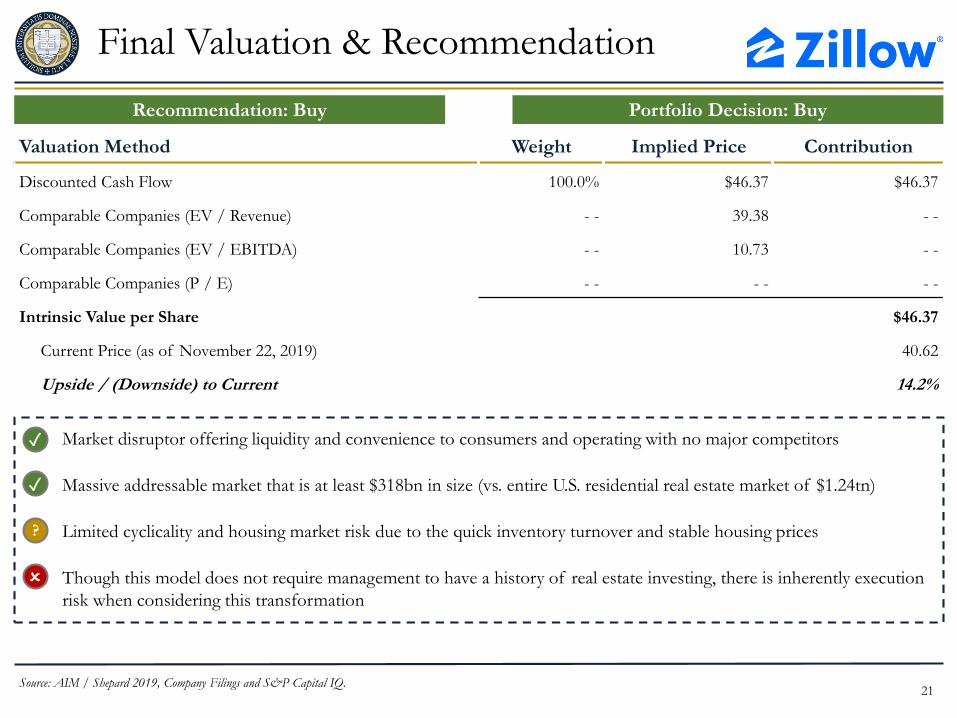
Valuation Method Weight Implied Price Contribution
Discounted Cash Flow 100.0% $46.37 $46.37
Comparable Companies (EV / Revenue) - - 39.38 - -
Comparable Companies (EV / EBITDA) - - 10.73 - -
Comparable Companies (P / E) - - - - - -
Intrinsic Value per Share $46.37
Current Price (as of November 22, 2019) 40.62
Upside / (Downside) to Current 14.2%
Recommendation: Buy Portfolio Decision: Buy
Source: AIM / Shepard 2019, Company Filings and S&P Capital IQ.
• Market disruptor offering liquidity and convenience to consumers and operating with no major competitors
• Massive addressable market that is at least $318bn in size (vs. entire U.S. residential real estate market of $1.24tn)
• Limited cyclicality and housing market risk due to the quick inventory turnover and stable housing prices
• Though this model does not require management to have a history of real estate investing, there is inherently execution
risk when considering this transformation
✓
✓
?
🗴

22
100
130
160
190
220
$250
Nov-18 Jan-19 Mar-19 Apr-19 Jun-19 Aug-19 Sep-19 Nov-19
Stryker Corporation (NYSE: SYK)
Source: AIM / Collins 2019, Company Filings and S&P Capital IQ.
Company Overview Selected Financial Data
Share Price (as of November 22, 2019) $201.59
Equity / Enterprise Value $75.81 / $82.21 bn
LTM EPS $6.98
2019E P / E 22.4x
2019E EV / EBITDA 19.8x
Dividend Yield 1.0%
One-Year Share Price Performance
22.9%
• Stryker Corporation (NYSE:SYK) was founded in 1946
– Headquarters: Kalamazoo, MI
– CEO: Kevin Lobo (7 years)
• Global leader in surgical equipment technology and implants
– Operating Segments: Orthopaedics, MedSurg,
Neurotechnology & Spine
• 2018 Revenue: $13,601mm

23
Primary Discovery
Background
Key Takeaways
• Dr. Anthony Delfico
• Orthopedic Surgeon, Ridgewood
Orthopedic Group
Source: AIM / Collins 2019.
• Dr. Daniel Murphy
• Orthopedic Surgeon, Tampa
Orthopedic & Sports Medicine
• Bill Kennedy
• Portfolio Manager, Fidelity
Investments
Superior
Technology
International
Opportunity
Superior
Sales Force
Industry
Trends
• Increasing number of private
hospitals in emerging markets
creates opportunity to expand
sales channels
• Stryker organizes its sales force
more efficiently than
competitors
• Sales force is key in placing
products with doctors
• Hospitals are increasingly relying
on a single med-tech vendor
• Product longevity is paramount
for adoption by doctors
• Stryker produces the best robot
technology
• Strong advertising campaign has
helped drive sales

24
Final Valuation & Recommendation
Valuation Method Weight Implied Price Contribution
Discounted Cash Flow 80.0% $226.52 $181.21
Dividend Discount Model 20.0% 241.67 48.33
Comparable Companies (EV / Revenue) - - 201.56 - -
Comparable Companies (P / E) - - 227.98 - -
Intrinsic Value per Share $229.55
Current Price (as of November 22, 2019) 201.59
Upside / (Downside) to Current 13.9%
Recommendation: Buy Portfolio Decision: Buy
Source: AIM / Collins 2019, Company Filings and S&P Capital IQ.
• Organic growth is driven through superior product development, international market expansion and a superior sales force
• Management team has proven their ability to effectively source and integrate acquisition targets to increase access to new markets
and product lines
• A consistent growing dividend, as well as a share repurchase program demonstrates management is actively returning capital to its
shareholders
• The healthcare industry is subject to large amounts of regulation risk which can alter the fundamentals of the industry
• As the company continues to pursue acquisitions to drive growth, leverage ratios will continue to increase
✓
?
🗴
✓
✓

25
Costco Wholesale (NASDAQ: COST)
Source: AIM / Rocheford 2019, Company Filings and S&P Capital IQ.
Note: Fiscal year concludes on August 31.
Company Overview Selected Financial Data
Share Price (as of November 22, 2019) $299.31
Equity / Enterprise Value $131.58 / $129.33 bn
LTM Diluted EPS $8.26
FY2020E P / E 34.5x
FY2020E EV / EBITDA 20.9x
Dividend Yield 0.9%
One-Year Share Price Performance
36.3%
• Largest membership-only global warehouse operator
– 782 facilities located primarily across U.S. and Canada
– Segments includes fresh foods, sundries, appliances, apparel
and ancillary businesses
▪ Gas stations, food courts, optical services, etc.
• Net income driven by membership fees amidst low-cost
buying atmosphere
– Fees constitute 75% of operating profit
– 53.9mn paying members
▪ 39.0% of which are executive members
170
210
250
290
$330
Nov-18 Jan-19 Mar-19 Apr-19 Jun-19 Aug-19 Sep-19 Nov-19

26
Competitive Landscape
Source: AIM / Rocheford 2019, Company Filings and S&P Capital IQ.
Industry Overview Membership Fee Structure
Yearly Membership Fee Growth
$60
$45$55
$120
$100$110
- -
20
40
60
80
100
120
$140
Costco Wholesale Sam's Club BJ's Wholesale
Standard Premium
(10.0%)
(5.0%)
- -
5.0%
10.0%
15.0%
2014 2015 2016 2017 2018
Costco Wholesale Sam's Club BJ's Wholesale
• Consists of firms offering wide selection of low-cost products
– Achieved through bulk packaging efforts and strong
supplier relationships
• Costco’s low-cost competitive advantage stems from:
– Low relative SKU count
▪ Leads to industry-leading inventory turnover
– Strong private label branding (Kirkland Signature)
▪ Drives industry-leading 91.0% annual membership
renewal rate
▪ ~20-30% profit margins on Kirkland Signature products

27
• Unique, low-cost buying atmosphere generates sustained store traffic and revenue growth
• Loyal member base and Kirkland Signature brand create stability within competitive industry
• Ample runway for new store openings domestically and internationally, especially Asia
• Favorable initial reception from Chinese consumers subject to change as store count grows
• Positive future growth prospects have driven share price to a historical high
Final Valuation & Recommendation
Valuation Method Weight Implied Price Contribution
Discounted Cash Flow 100.0% $336.86 $336.86
Comparable Companies (P / B) - - 247.57 - -
Comparable Companies (EV / EBITDA) - - 219.98 - -
Comparable Companies (P / E) - - 274.79 - -
Intrinsic Value per Share $336.86
Current Price (as of November 22, 2019) 299.31
Upside / (Downside) to Current 12.5%
Recommendation: Buy Portfolio Decision: Buy
Source: AIM / Rocheford 2019, Company Filings and S&P Capital IQ.
✓
✓
?
✓
🗴
28
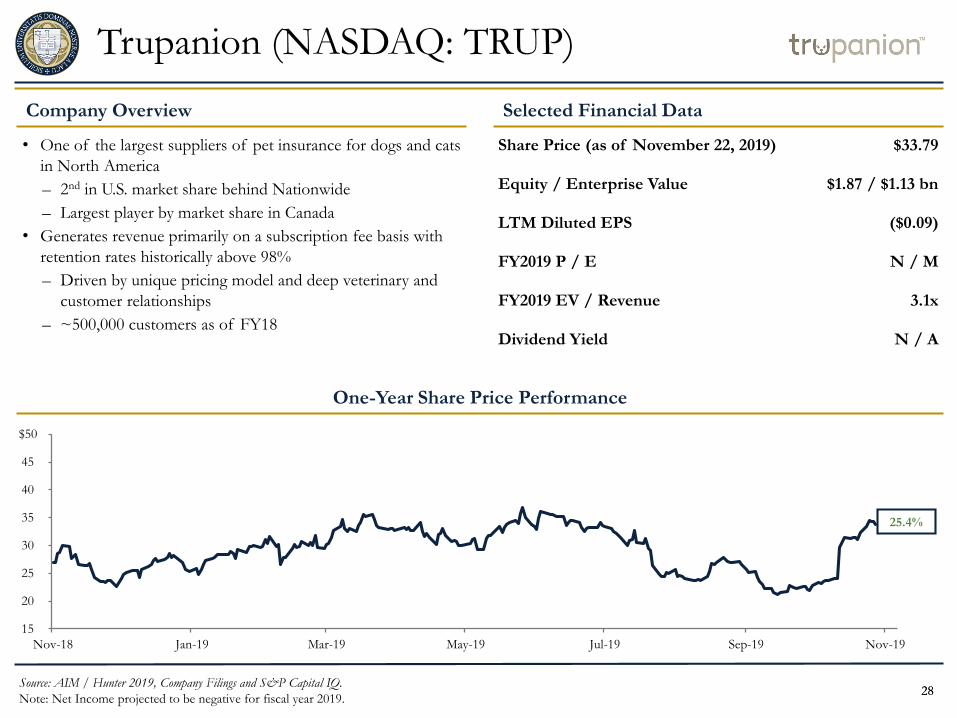
Trupanion (NASDAQ: TRUP)
Source: AIM / Hunter 2019, Company Filings and S&P Capital IQ.
Note: Net Income projected to be negative for fiscal year 2019.28
Company Overview Selected Financial Data
Share Price (as of November 22, 2019) $33.79
Equity / Enterprise Value $1.87 / $1.13 bn
LTM Diluted EPS ($0.09)
FY2019 P / E N / M
FY2019 EV / Revenue 3.1x
Dividend Yield N / A
One-Year Share Price Performance
25.4%
• One of the largest suppliers of pet insurance for dogs and cats
in North America
– 2nd in U.S. market share behind Nationwide
– Largest player by market share in Canada
• Generates revenue primarily on a subscription fee basis with
retention rates historically above 98%
– Driven by unique pricing model and deep veterinary and
customer relationships
– ~500,000 customers as of FY18
15
20
25
30
35
40
45
$50
Nov-18 Jan-19 Mar-19 May-19 Jul-19 Sep-19 Nov-19

29
Industry Analysis
29
U.S. Pet Insurance Revenue and Growth
Source: AIM / Hunter 2019, Company Filings, Bloomberg and S&P Capital IQ.
1.0% 2.0%5.0% 5.0%
8.0%
14.0%
25.0%
40.0%
- -
5.0%
10.0%
15.0%
20.0%
25.0%
30.0%
35.0%
40.0%
45.0%
U.S. Canada France Denmark Netherlands Norway U.K. Sweden
Current Pet Insurance Penetration Levels
0.0%
5.0%
10.0%
15.0%
20.0%
25.0%
- -
500
1,000
1,500
2,000
$2,500
2014 2015 2016 2017 2018 2019 2020E 2021E 2022E 2023E 2024E
Revenue (USD millions) Revenue Growth(USD mm)

30
Final Valuation & Recommendation
30
Valuation Method Weight Implied Price Contribution
Discounted Cash Flow 100.0% $44.99 $44.99
Comparable Companies (P / E) - - N / M - -
Comparable Companies (EV / EBITDA) - - 3.61 - -
Comparable Companies (EV / Revenue) - - 43.76 - -
Intrinsic Value per Share $44.99
Current Price (as of November 22, 2019) 33.79
Upside / (Downside) to Current 33.2%
Recommendation: Buy Portfolio Decision: Buy
Source: AIM / Hunter 2019, Company Filings and S&P Capital IQ.
Highly competitive market with the potential for large insurance companies to enter
Deep veterinary and customer relationships driven off of its unique pricing model, sales force, and Trupanion Express
software drive high retention and referral rates
Largest player in Canada and second largest player in the United States in a large and underpenetrated market with decades of
growth ahead
✓
✓
🗴

31
40
50
60
70
80
90
$100
Nov-18 Jan-19 Mar-19 Apr-19 Jun-19 Jul-19 Sep-19 Nov-19
Tyson Foods, Inc. (NYSE: TSN)
Company Overview Selected Financial Data
Share Price (as of November 22, 2019) $86.36
Equity / Enterprise Value $31.56 / $43.15 bn
LTM EPS $5.57
2020E P / E 13.6x
2020E EV / Revenue 1.0x
Dividend Yield 1.7%
One-Year Share Price Performance
46.7%
• One of the world’s largest food companies and a recognized
leader in protein products
– Headquartered in Springdale, AR
– ~122,000 employees at more than 300 facilities worldwide
• Four main segments: Beef, Pork, Chicken, and Prepared Foods
• Distribution Channels: Consumer, Foodservice, Industrial
Food Processing, and International Export
Source: AIM / Lacy 2019, Company Filings and S&P Capital IQ.
32
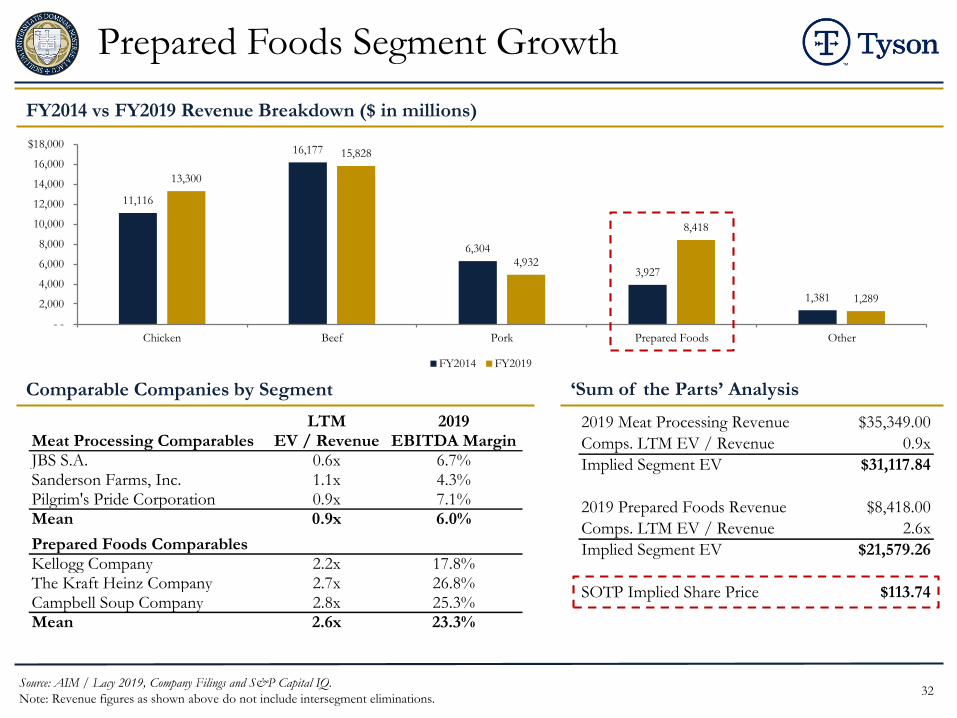
Prepared Foods Segment Growth
FY2014 vs FY2019 Revenue Breakdown ($ in millions)
Source: AIM / Lacy 2019, Company Filings and S&P Capital IQ.
Note: Revenue figures as shown above do not include intersegment eliminations.
Comparable Companies by Segment ‘Sum of the Parts’ Analysis
11,116
16,177
6,304
3,927
1,381
13,300
15,828
4,932
8,418
1,289
- -
2,000
4,000
6,000
8,000
10,000
12,000
14,000
16,000
$18,000
Chicken Beef Pork Prepared Foods Other
FY2014 FY2019
LTM 2019Meat Processing Comparables EV / Revenue EBITDA MarginJBS S.A. 0.6x 6.7%Sanderson Farms, Inc. 1.1x 4.3%Pilgrim's Pride Corporation 0.9x 7.1%Mean 0.9x 6.0%
Prepared Foods ComparablesKellogg Company 2.2x 17.8%The Kraft Heinz Company 2.7x 26.8%Campbell Soup Company 2.8x 25.3%Mean 2.6x 23.3%
2019 Meat Processing Revenue $35,349.00
Comps. LTM EV / Revenue 0.9x
Implied Segment EV $31,117.84
2019 Prepared Foods Revenue $8,418.00
Comps. LTM EV / Revenue 2.6x
Implied Segment EV $21,579.26
SOTP Implied Share Price $113.74

33
Recommendation: Buy
Final Valuation & Recommendation
Valuation Method Weight Implied Price Contribution
Discounted Cash Flow 80.0% $103.87 $83.10
Comparable Companies (P / E) 5.0% 103.33 5.17
Comparable Companies (EV / EBITDA) 5.0% 92.98 4.65
SOTP Analysis 10.0% 113.74 11.37
Intrinsic Value per Share $104.29
Current Price (as of November 22, 2019) 86.36
Upside / (Downside) to Current 20.8%
Portfolio Decision: Buy
• Prepared Foods segment sales growth will continue to drive margin expansion
• Well positioned for capitalization on growing international protein consumption
• Portfolio diversity and scale grant a significant competitive advantage
• An escalation of international trade tensions could negatively impact Tyson’s growth opportunities
✓
✓
?
Source: AIM / Lacy 2019, Company Filings and S&P Capital IQ.
✓

34
Inseego Corporation (NASDAQ: INSG)
Source: AIM / Campion 2019, Company Filings and S&P Capital IQ.
Note: Inseego’s earnings are expected to be negative for 2019E.
Company Overview Selected Financial Data
Share Price (as of November 22, 2019) $5.05
Equity / Enterprise Value $545 / $590 mm
LTM EPS ($0.38)
2019E P / E N / M
2019E EV / EBITDA 61.1x
Dividend Yield N / A
One-Year Share Price Performance
45.3%
• Formerly known as Novatel Wireless
– Roll-up of ~$220mm of acquisitions from 2010 to 2015
• Two core business segments:
– IoT & Mobile Solutions – 4G and 5G products for large
enterprise verticals, service providers, and SMBs globally
– Telematics & Asset Tracking – offers asset management
and monitoring solutions to customers across 50 countries
• Verizon has historically accounted for ~50% of revenue
3
4
5
6
$7
Nov-18 Jan-19 Mar-19 Apr-19 Jun-19 Aug-19 Sep-19 Nov-19
35
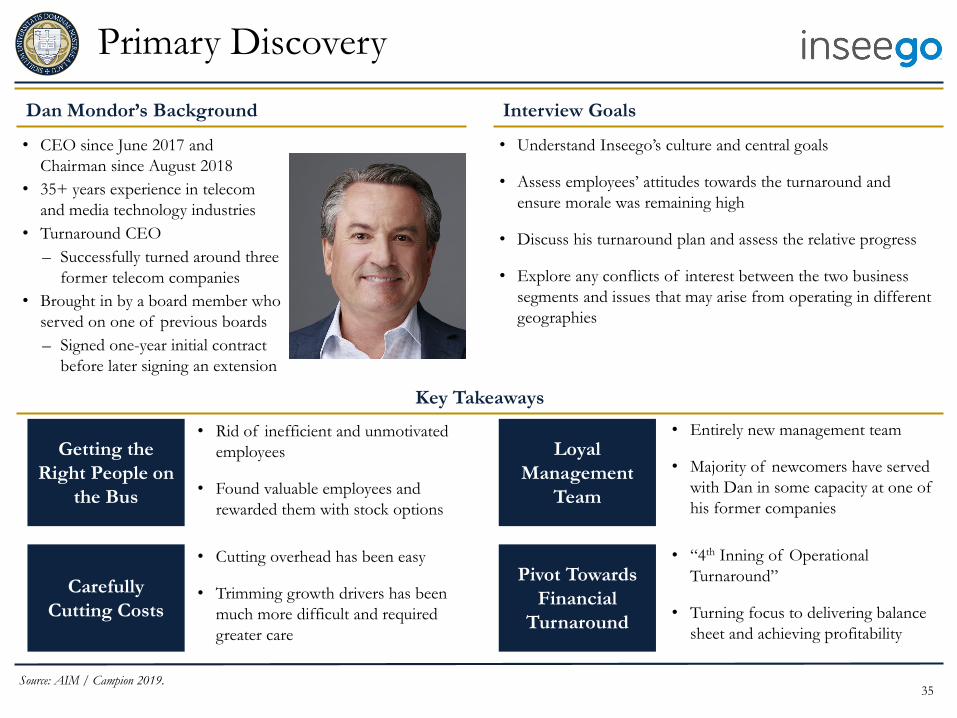
Primary Discovery
Dan Mondor’s Background Interview Goals
Key Takeaways
• CEO since June 2017 and
Chairman since August 2018
• 35+ years experience in telecom
and media technology industries
• Turnaround CEO
– Successfully turned around three
former telecom companies
• Brought in by a board member who
served on one of previous boards
– Signed one-year initial contract
before later signing an extension
Source: AIM / Campion 2019.
• Cutting overhead has been easy
• Trimming growth drivers has been
much more difficult and required
greater care
Getting the
Right People on
the Bus
Carefully
Cutting Costs
Loyal
Management
Team
Pivot Towards
Financial
Turnaround
• Rid of inefficient and unmotivated
employees
• Found valuable employees and
rewarded them with stock options
• “4th Inning of Operational
Turnaround”
• Turning focus to delivering balance
sheet and achieving profitability
• Entirely new management team
• Majority of newcomers have served
with Dan in some capacity at one of
his former companies
• Understand Inseego’s culture and central goals
• Assess employees’ attitudes towards the turnaround and
ensure morale was remaining high
• Discuss his turnaround plan and assess the relative progress
• Explore any conflicts of interest between the two business
segments and issues that may arise from operating in different
geographies
36
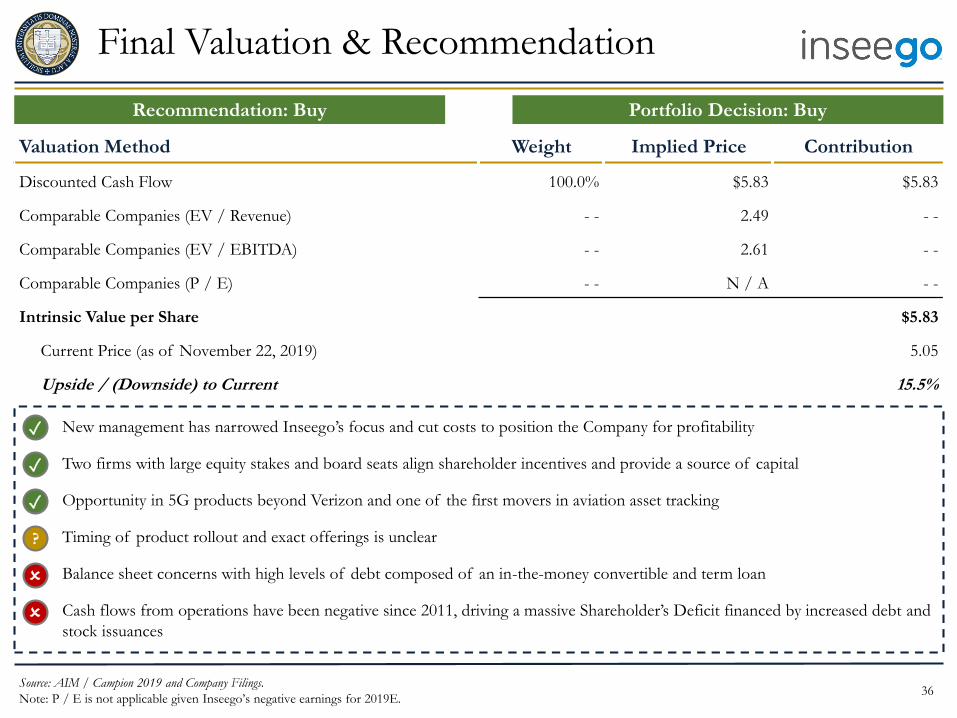
Final Valuation & Recommendation
Valuation Method Weight Implied Price Contribution
Discounted Cash Flow 100.0% $5.83 $5.83
Comparable Companies (EV / Revenue) - - 2.49 - -
Comparable Companies (EV / EBITDA) - - 2.61 - -
Comparable Companies (P / E) - - N / A - -
Intrinsic Value per Share $5.83
Current Price (as of November 22, 2019) 5.05
Upside / (Downside) to Current 15.5%
Recommendation: Buy Portfolio Decision: Buy
Source: AIM / Campion 2019 and Company Filings.
Note: P / E is not applicable given Inseego’s negative earnings for 2019E.
• New management has narrowed Inseego’s focus and cut costs to position the Company for profitability
• Two firms with large equity stakes and board seats align shareholder incentives and provide a source of capital
• Opportunity in 5G products beyond Verizon and one of the first movers in aviation asset tracking
• Timing of product rollout and exact offerings is unclear
• Balance sheet concerns with high levels of debt composed of an in-the-money convertible and term loan
• Cash flows from operations have been negative since 2011, driving a massive Shareholder’s Deficit financed by increased debt and
stock issuances
✓
✓
?
🗴
🗴
✓
37
40
55
70
$85
Nov-18 Jan-19 Mar-19 Apr-19 Jun-19 Jul-19 Sep-19 Nov-19
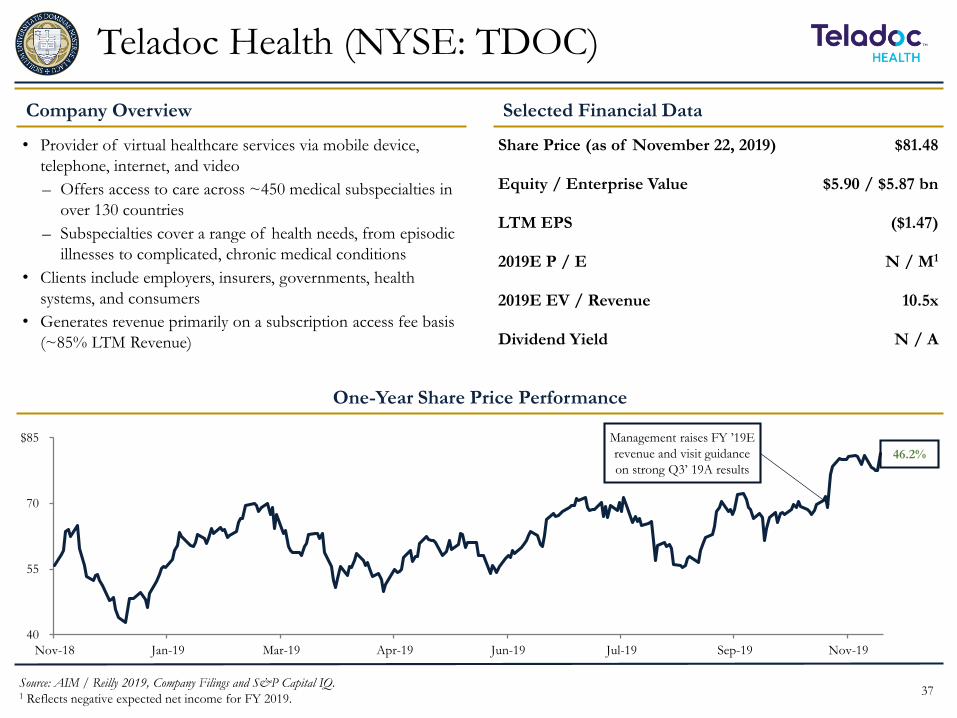
Teladoc Health (NYSE: TDOC)
Company Overview Selected Financial Data
Share Price (as of November 22, 2019) $81.48
Equity / Enterprise Value $5.90 / $5.87 bn
LTM EPS ($1.47)
2019E P / E N / M1
2019E EV / Revenue 10.5x
Dividend Yield N / A
One-Year Share Price Performance
46.2%
• Provider of virtual healthcare services via mobile device,
telephone, internet, and video
– Offers access to care across ~450 medical subspecialties in
over 130 countries
– Subspecialties cover a range of health needs, from episodic
illnesses to complicated, chronic medical conditions
• Clients include employers, insurers, governments, health
systems, and consumers
• Generates revenue primarily on a subscription access fee basis
(~85% LTM Revenue)
Source: AIM / Reilly 2019, Company Filings and S&P Capital IQ.1 Reflects negative expected net income for FY 2019.
Management raises FY ’19E
revenue and visit guidance
on strong Q3’ 19A results

38
Discounted Cash Flow Analysis
Source: AIM / Reilly 2019, Company Filings and S&P Capital IQ.
Base Scenario
• Competitive pressures limit pricing power
• Weak consumer sentiment softens pace of adoption relative to
“Bull Scenario”
• Growth in membership base remains robust
-200
- -
200
400
600
$800
2019E 2021E 2023E 2025E 2027E 2029E
Base Bull
Bull Scenario
• Teladoc remains the market leader and continues to
significantly grow subscription memberships and increase
pricing
• Investments in R&D and client acquisition generate significant
future scalability and operating leverage
FCF to the Firm ($ in mm)
’18A – ’29E Revenue CAGR: ~18%
Weight in DCF Analysis: 50%
’18A – ’29E Revenue CAGR: ~21%
Weight in DCF Analysis: 40%
39
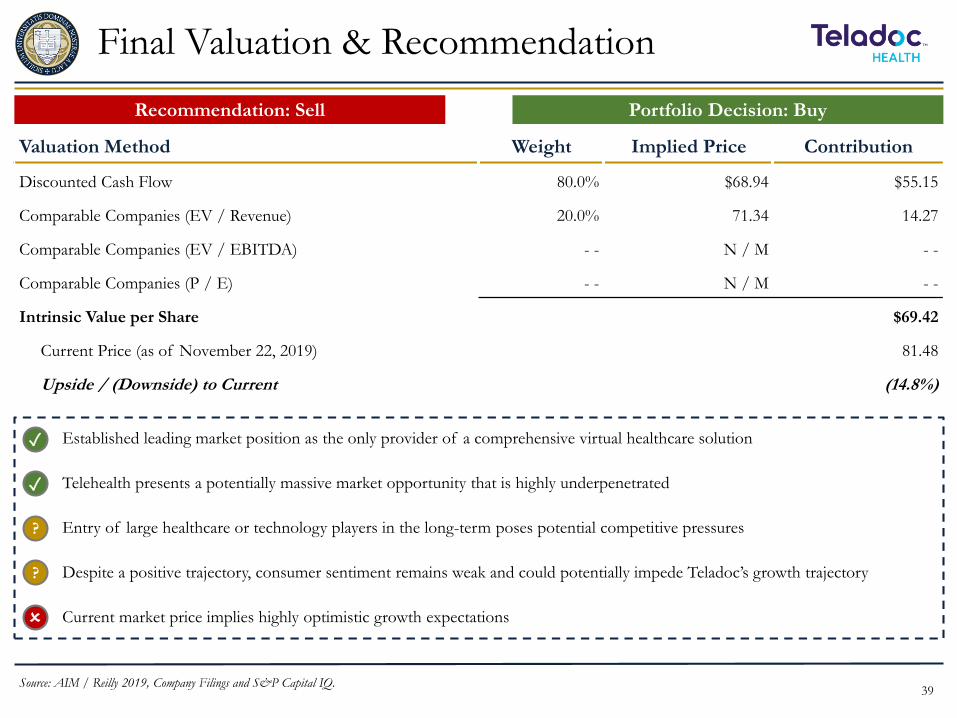
Recommendation: Sell
Final Valuation & Recommendation
Valuation Method Weight Implied Price Contribution
Discounted Cash Flow 80.0% $68.94 $55.15
Comparable Companies (EV / Revenue) 20.0% 71.34 14.27
Comparable Companies (EV / EBITDA) - - N / M - -
Comparable Companies (P / E) - - N / M - -
Intrinsic Value per Share $69.42
Current Price (as of November 22, 2019) 81.48
Upside / (Downside) to Current (14.8%)
Portfolio Decision: Buy
• Established leading market position as the only provider of a comprehensive virtual healthcare solution
• Telehealth presents a potentially massive market opportunity that is highly underpenetrated
• Entry of large healthcare or technology players in the long-term poses potential competitive pressures
• Despite a positive trajectory, consumer sentiment remains weak and could potentially impede Teladoc’s growth trajectory
• Current market price implies highly optimistic growth expectations
✓
✓
?
?
🗴
Source: AIM / Reilly 2019, Company Filings and S&P Capital IQ.

40
Alphabet (NASDAQ: GOOG)
Source: AIM / Weetman 2019, Company Filings and S&P Capital IQ.40
Company Overview Selected Financial Data
Share Price (as of November 22, 2019) $1,295
Equity / Enterprise Value $904 / $796 bn
LTM EPS $46.60
2019E P / E 39.6x
2019E EV / EBITDA 14.6x
Dividend Yield N / A
One-Year Share Price Performance
24.8%
• U.S.-based multinational conglomerate providing internet
related services and products
– Google Properties: Ad revenues from Search, Gmail
YouTube, Maps, etc.
– Network Members’ Properties: AdMob, AdSense,
Google Ad Manager
– Other Revenues: Google cloud offerings, Google Play,
and hardware
– Other Bets: “Moonshot” companies and internal growth /
venture firms
950
1,050
1,150
1,250
$1,350
Nov-18 Jan-19 Mar-19 Apr-19 Jun-19 Jul-19 Sep-19 Nov-19
41
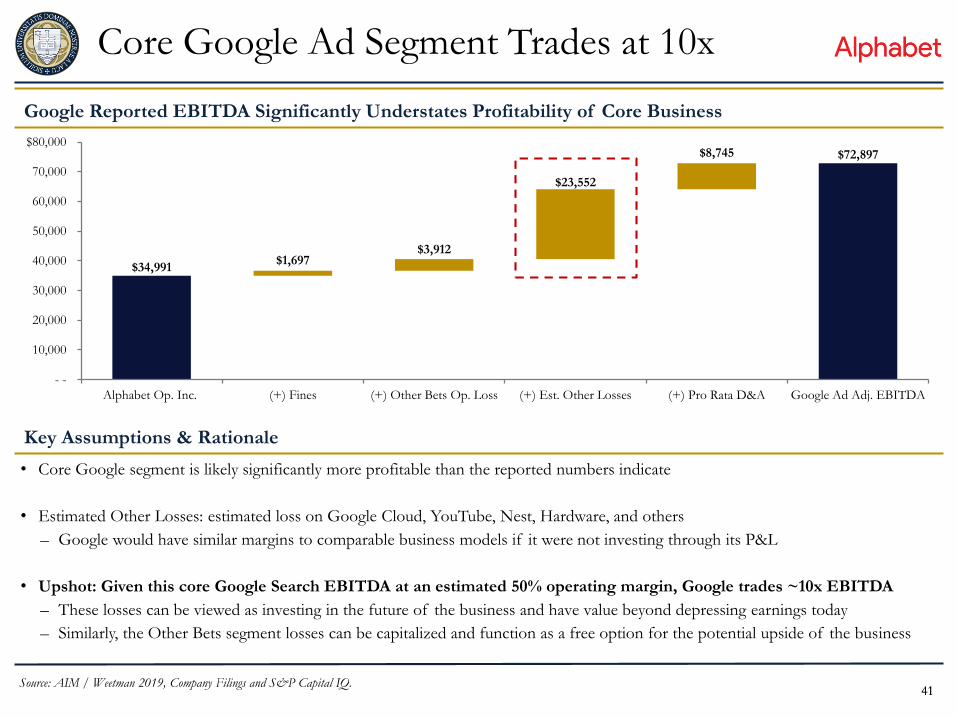
$34,991
$72,897
$1,697 $3,912
$23,552
$8,745
- -
10,000
20,000
30,000
40,000
50,000
60,000
70,000
$80,000
Alphabet Op. Inc. (+) Fines (+) Other Bets Op. Loss (+) Est. Other Losses (+) Pro Rata D&A Google Ad Adj. EBITDA
Core Google Ad Segment Trades at 10x
41
Google Reported EBITDA Significantly Understates Profitability of Core Business
Key Assumptions & Rationale
• Core Google segment is likely significantly more profitable than the reported numbers indicate
• Estimated Other Losses: estimated loss on Google Cloud, YouTube, Nest, Hardware, and others
– Google would have similar margins to comparable business models if it were not investing through its P&L
• Upshot: Given this core Google Search EBITDA at an estimated 50% operating margin, Google trades ~10x EBITDA
– These losses can be viewed as investing in the future of the business and have value beyond depressing earnings today
– Similarly, the Other Bets segment losses can be capitalized and function as a free option for the potential upside of the business
Source: AIM / Weetman 2019, Company Filings and S&P Capital IQ.

42
Final Valuation & Recommendation
42
Valuation Method Weight Implied Price Contribution
Discounted Cash Flow 80% $1,469 $1,175
Comparable Companies (EV / Revenue) - - 1,222 - -
Comparable Companies (EV / EBITDA) 20% 1,552 310
Comparable Companies (P / E) - - 1,333 - -
Intrinsic Value per Share $1,485
Current Price (as of November 22, 2019) 1,295
Upside / (Downside) to Current 14.6%
Recommendation: Buy Portfolio Decision: Buy
Source: AIM / Weetman 2019, Company Filings and S&P Capital IQ.
• Market fundamentally misunderstands regulation risk – regulation will not impact core Google properties, but the ad supply chain.
Additionally, the timeline on potential regulation far exceeds potential investment horizon
• Other Bets segments represents a free option for potential upside, especially given Alphabet’s strong history as an operator
• Core Ad business demands a low multiple of ~10x and Alphabet as a whole trades significantly below peers
• Possibility for continued EU / DOJ fines, but risk mitigated by large cash balance / strong cash flow generation
• Tail risk of comprehensive antitrust regulation driven by 2020 election outcome
✓
✓
?
🗴
✓
43
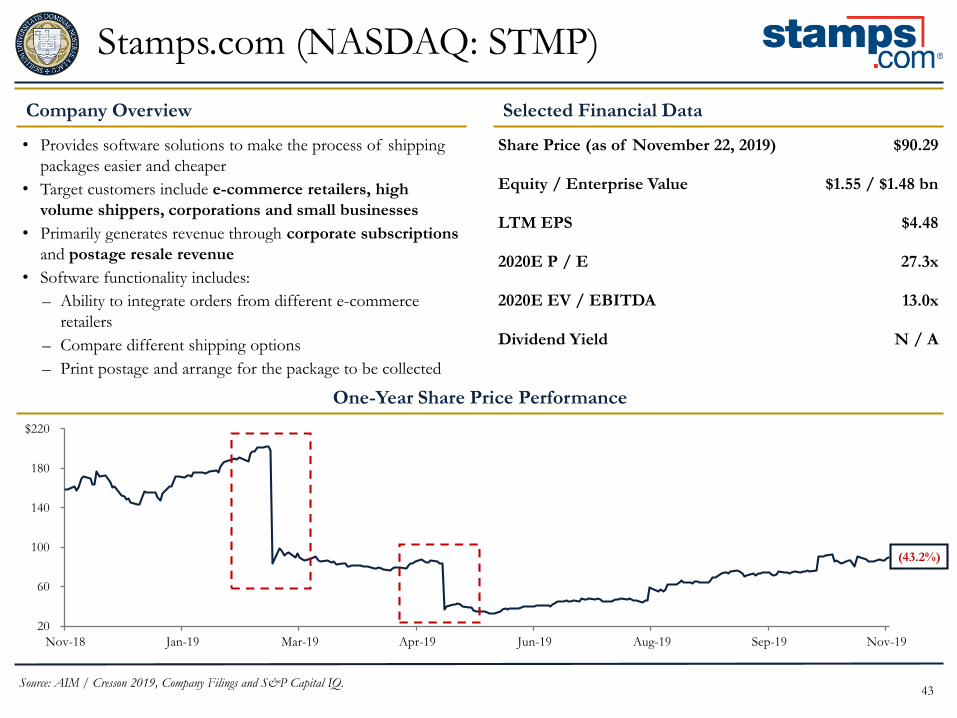
Stamps.com (NASDAQ: STMP)
Source: AIM / Cresson 2019, Company Filings and S&P Capital IQ.
Company Overview Selected Financial Data
Share Price (as of November 22, 2019) $90.29
Equity / Enterprise Value $1.55 / $1.48 bn
LTM EPS $4.48
2020E P / E 27.3x
2020E EV / EBITDA 13.0x
Dividend Yield N / A
One-Year Share Price Performance
(43.2%)
• Provides software solutions to make the process of shipping
packages easier and cheaper
• Target customers include e-commerce retailers, high
volume shippers, corporations and small businesses
• Primarily generates revenue through corporate subscriptions
and postage resale revenue
• Software functionality includes:
– Ability to integrate orders from different e-commerce
retailers
– Compare different shipping options
– Print postage and arrange for the package to be collected
20
60
100
140
180
$220
Nov-18 Jan-19 Mar-19 Apr-19 Jun-19 Aug-19 Sep-19 Nov-19
44
170 205 216 219 230 248 266 277 284 28789
98 10454109
210294
353409
471527 580 626
- -
200
400
600
800
$1,000
2016 2017 2018 2019E 2020E 2021E 2022E 2023E 2024E 2025E
Subscription Revenue Commission Revenue Postage Reselling Revenue
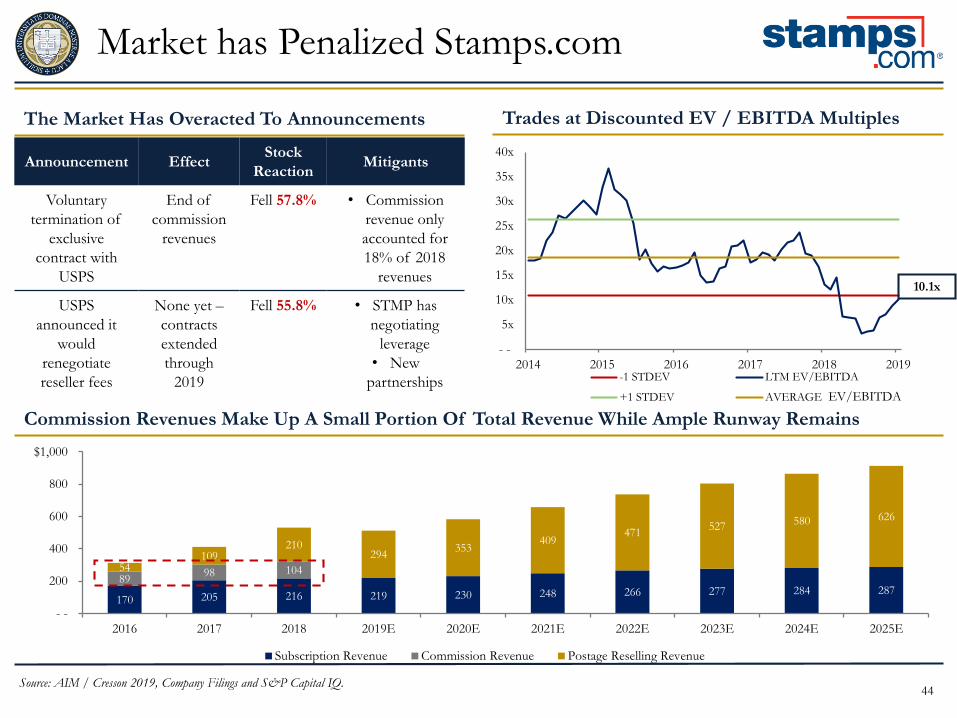
Market has Penalized Stamps.com
Source: AIM / Cresson 2019, Company Filings and S&P Capital IQ.
The Market Has Overacted To Announcements Trades at Discounted EV / EBITDA Multiples
Commission Revenues Make Up A Small Portion Of Total Revenue While Ample Runway Remains
Announcement EffectStock
ReactionMitigants
Voluntary
termination of
exclusive
contract with
USPS
End of
commission
revenues
Fell 57.8% • Commission
revenue only
accounted for
18% of 2018
revenues
USPS
announced it
would
renegotiate
reseller fees
None yet –
contracts
extended
through
2019
Fell 55.8% • STMP has
negotiating
leverage
• New
partnerships
- -
5x
10x
15x
20x
25x
30x
35x
40x
2014 2015 2016 2017 2018 2019-1 STDEV LTM EV/EBITDA
+1 STDEV AVERAGE
10.1x
EV/EBITDA
45
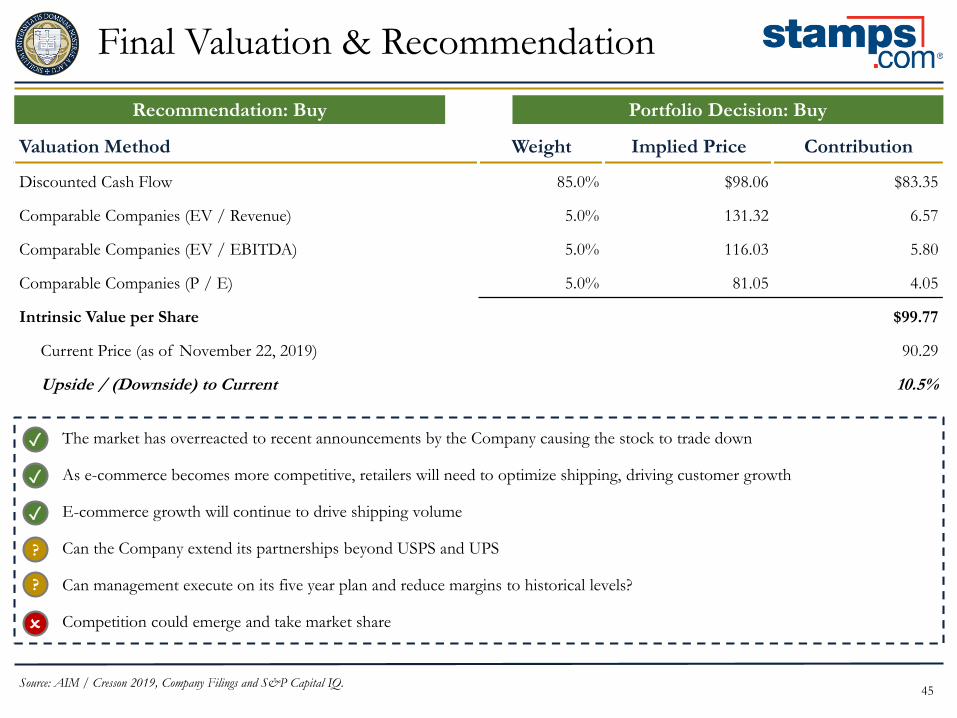
Final Valuation & Recommendation
Valuation Method Weight Implied Price Contribution
Discounted Cash Flow 85.0% $98.06 $83.35
Comparable Companies (EV / Revenue) 5.0% 131.32 6.57
Comparable Companies (EV / EBITDA) 5.0% 116.03 5.80
Comparable Companies (P / E) 5.0% 81.05 4.05
Intrinsic Value per Share $99.77
Current Price (as of November 22, 2019) 90.29
Upside / (Downside) to Current 10.5%
Recommendation: Buy Portfolio Decision: Buy
Source: AIM / Cresson 2019, Company Filings and S&P Capital IQ.
• The market has overreacted to recent announcements by the Company causing the stock to trade down
• As e-commerce becomes more competitive, retailers will need to optimize shipping, driving customer growth
• E-commerce growth will continue to drive shipping volume
• Can the Company extend its partnerships beyond USPS and UPS
• Can management execute on its five year plan and reduce margins to historical levels?
• Competition could emerge and take market share
✓
✓
?
🗴
✓
?

46
170
210
250
290
$330
Nov-18 Jan-19 Mar-19 Apr-19 Jun-19 Jul-19 Sep-19 Nov-19
Mastercard (NYSE: MA)
Source: AIM / Herzog 2019, Company Filings and S&P Capital IQ.
Company Overview Selected Financial Data
Share Price (as of November 22, 2019) $282.57
Equity / Enterprise Value $285.07 / $287.54 bn
LTM EPS $7.40
FY 2020E P / E 32.9x
FY 2020E EV / EBITDA 25.1x
Dividend Yield 0.5%
One-Year Share Price Performance
• Mastercard operates a multi-rail domestic and cross-border
payment network that allows participants in the four-party
system to use electronic payment forms
• Revenue is comprised of assessments on domestic and cross-
border transactions, transaction switching and services
• Fee structure amounts to a royalty on global economic activity
and the transition to non-cash transactions
54.7%
Preliminary Thesis: As a critical enabler of the secular shift to
non-cash payments, Mastercard is positioned to be a winner of
the global digitization of payments
47
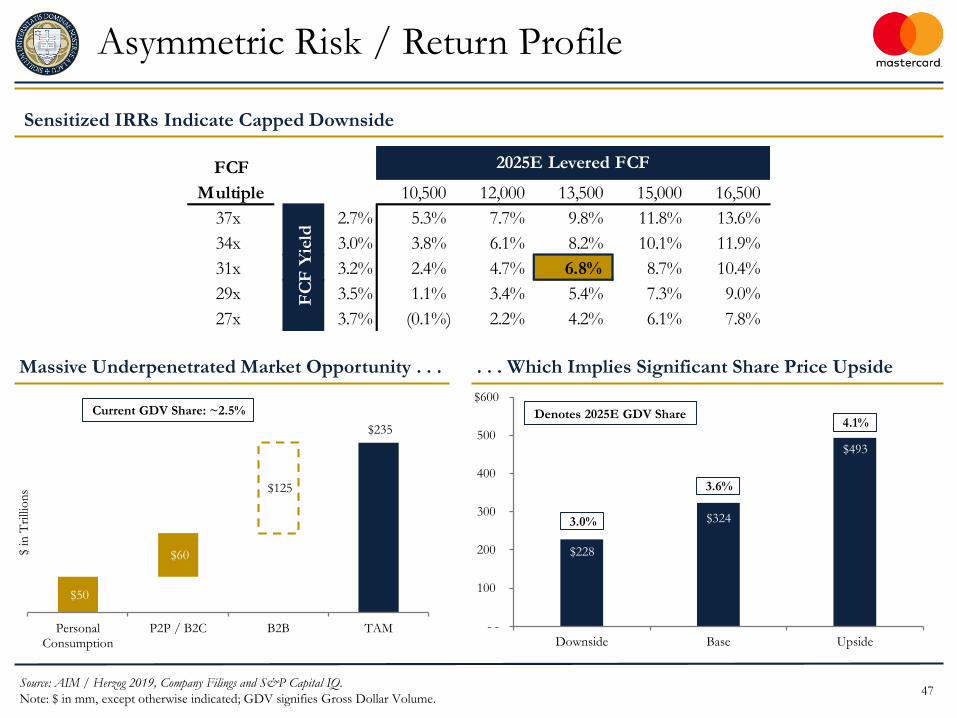
FCF
Multiple 6.8% 10,500 12,000 13,500 15,000 16,500
37x 2.7% 5.3% 7.7% 9.8% 11.8% 13.6%
34x 3.0% 3.8% 6.1% 8.2% 10.1% 11.9%
31x 3.2% 2.4% 4.7% 6.8% 8.7% 10.4%
29x 3.5% 1.1% 3.4% 5.4% 7.3% 9.0%
27x 3.7% (0.1%) 2.2% 4.2% 6.1% 7.8%
2025E Levered FCF
FC
F Y
ield
$228
$324
$493
- -
100
200
300
400
500
$600
Downside Base Upside
3.0%
3.6%
4.1%Denotes 2025E GDV Share
Asymmetric Risk / Return Profile
Sensitized IRRs Indicate Capped Downside
Source: AIM / Herzog 2019, Company Filings and S&P Capital IQ.
Note: $ in mm, except otherwise indicated; GDV signifies Gross Dollar Volume.
Massive Underpenetrated Market Opportunity . . . . . . Which Implies Significant Share Price Upside
$50
$235
$60
$125
PersonalConsumption
P2P / B2C B2B TAM
$ in
Tri
llio
ns
Current GDV Share: ~2.5%

48
Final Valuation & Recommendation
Valuation Method Weight Implied Price Contribution
Discounted Cash Flow – PGR 80.0% $335.79 $268.63
Comparable Companies (P / E) 10.0% 282.52 28.25
Discounted Cash Flow – Multiples Method 5.0% 330.29 16.51
Comparable Companies (EV / EBIT) 5.0% 293.61 14.68
Intrinsic Value per Share $328.08
Current Price (as of November 22, 2019) 282.57
Upside / (Downside) to Current 16.1%
Recommendation: Buy Portfolio Decision: Buy
Source: AIM / Herzog 2019, Company Filings and S&P Capital IQ.
• Duopoly structure creates pricing power and makes Mastercard indispensable to customers
• Network scale creates a wide moat that contributes superior unit economics
• Management has consistently shown an ability to allocate capital effectively toward expanding payment capabilities
• Few extrinsic threats from disruptors looking to bypass card networks
• Blockchain could provide a distant existential threat but is unlikely to be adopted at scale
• Intensified competition from Visa in Europe, Alipay in non-Chinese Asia
✓
✓
?
✓
✓
🗴

49
60
70
80
90
100
$110
Nov-18 Jan-19 Mar-19 Apr-19 Jun-19 Aug-19 Sep-19 Nov-19
Qualys, Inc. (NASDAQ: QLYS)
Company Overview Selected Financial Data
Share Price (as of November 22, 2019) $86.25
Equity / Enterprise Value $3.34 / $3.08 bn
LTM EPS $1.52
2019E P / E 38.0x
2019E EV / Revenue 9.6x
Dividend Yield N / A
One-Year Share Price Performance
9.5%
• Delivers security and compliance solutions via the cloud
– Serves 12,200+ customers in over 130 countries
– Offers 19 integrated apps
• SaaS model, primarily with renewable annual subscriptions
• Retention rates amongst customers with…
– Two products: 91%
– Three products: 97%
– Four products: 99%
Source: AIM / Collins 2019, Company Filings and S&P Capital IQ.
Q4’ 18 results beat
estimates but management
lowered Q1’ 19E guidance

50
Increased Security and Compliance
Spending
Data Breaches
Cloud Migration
IT Spending
Favorable Industry Trends
Public Cloud Services Market ($ in bn)
Recent Data Breaches
Source: AIM / Collins 2019 and Gartner.
Prime Positioning
- -
50
100
150
200
250
300
350
$400

51
Recommendation: Buy
Final Valuation & Recommendation
Valuation Method Weight Implied Price Contribution
Discounted Cash Flow (Base) 40.0% $98.69 $39.48
Discounted Cash Flow (Upside) 30.0% 122.40 36.72
Discounted Cash Flow (Downside) 30.0% 80.57 24.17
Comparable Companies (EV / Revenue) (EV / EBITDA) (P / E) - - - - - -
Intrinsic Value per Share $100.37
Current Price (as of November 22, 2019) 86.25
Upside / (Downside) to Current 16.4%
Portfolio Decision: Buy
• Established market leader as the top provider of Vulnerability Management (VM) solutions
• Favorable trends in IT/cloud spending and heightened awareness for security as a result of large-scale data breaches
• Sticky customer base and high visibility of future revenues from subscription model
• Uncertainty surrounding success of new product offerings
• 75% of current revenue stems from VM solutions
✓
✓
?
🗴
Source: AIM / Collins 2019, Company Filings and S&P Capital IQ.
✓

52
Lululemon Athletica Inc. (NASDAQ: LULU)
Source: AIM / McVeigh 2019, Company Filings and S&P Capital IQ.
Company Overview Selected Financial Data
Share Price (as of November 22, 2019) $219.90
Equity / Enterprise Value $28.65 / $28.72 bn
LTM EPS $4.05
2019E P / E 40.6x
2019E EV / EBITDA 25.3x
Dividend Yield N / A
One-Year Share Price Performance
77.7%
• Lululemon Athletica is a designer, distributor, and retailer of
healthy lifestyle inspired athletic apparel and accessories
– Headquarters: Vancouver, Canada
– CEO: Calvin McDonald
• Operates 460 stores in 15 different countries
– 77.4% of retail locations are in North America
• Generates revenue through two main distribution channels:
– Company-operated stores (64.7% of 2018 revenue)
– Direct-to-Consumer (DTC) (26.1% of 2018 revenue)
100
120
140
160
180
200
220
$240
Nov-18 Jan-19 Mar-19 Apr-19 Jun-19 Aug-19 Sep-19 Nov-19

53
Industry Analysis
7.4% 8.6%
10.4% 12.2%
14.1%
16.1%
18.1%
20.0%
22.0%
- -
5.0%
10.0%
15.0%
20.0%
25.0%
2015 2016 2017 2018 2019 2020E 2021E 2022E 2023E
e-Commerce as % of Total Retail Sales
Favorable Industry Trends Lead to New Opportunities
Source: AIM / McVeigh 2019, Company Filings and eMarketer.
Consumers are Increasingly Shopping Online Positioned to Capitalize on a Shifting Environment
Store remodels to enhance
in-store experience
Increase brand awareness
through partnerships and
ambassador program
• Strong economy benefits consumer spending
• E-Commerce continues to gain a larger portion of retail sales as mobile reshapes the landscape of customer engagement
• Investment in distribution network and digital capabilities leads to better margins
• Retail experiences becoming commonplace as a new way to attract consumers
• Increased consumer focus on healthy living and expansion of boutique fitness has led to the growth in popularity of athleisure
54
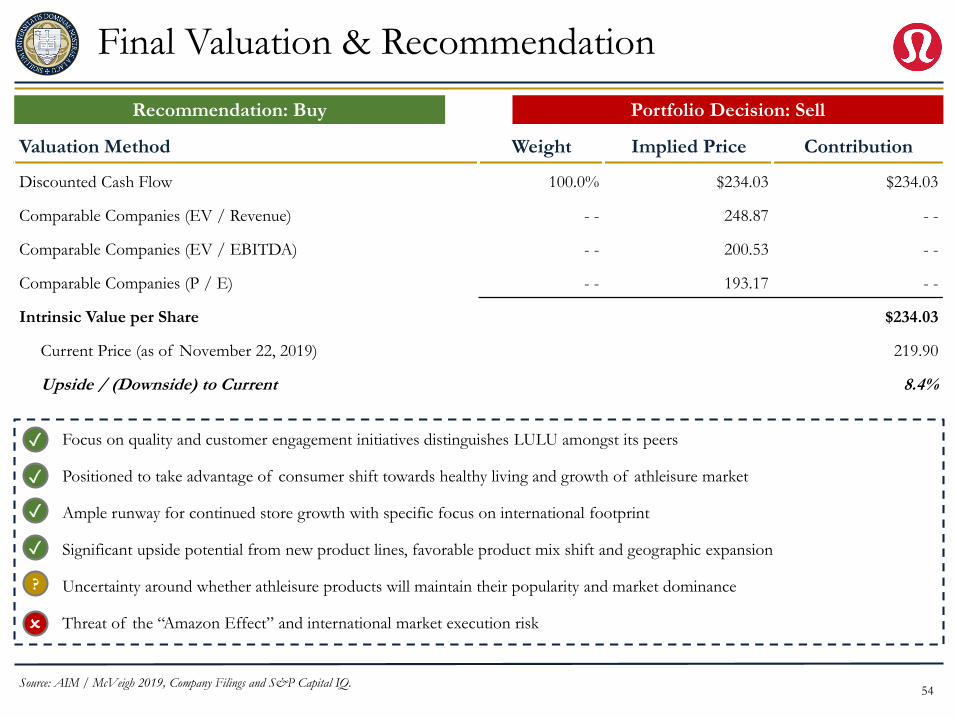
Final Valuation & Recommendation
Valuation Method Weight Implied Price Contribution
Discounted Cash Flow 100.0% $234.03 $234.03
Comparable Companies (EV / Revenue) - - 248.87 - -
Comparable Companies (EV / EBITDA) - - 200.53 - -
Comparable Companies (P / E) - - 193.17 - -
Intrinsic Value per Share $234.03
Current Price (as of November 22, 2019) 219.90
Upside / (Downside) to Current 8.4%
Recommendation: Buy Portfolio Decision: Sell
Source: AIM / McVeigh 2019, Company Filings and S&P Capital IQ.
• Focus on quality and customer engagement initiatives distinguishes LULU amongst its peers
• Positioned to take advantage of consumer shift towards healthy living and growth of athleisure market
• Ample runway for continued store growth with specific focus on international footprint
• Significant upside potential from new product lines, favorable product mix shift and geographic expansion
• Uncertainty around whether athleisure products will maintain their popularity and market dominance
• Threat of the “Amazon Effect” and international market execution risk
✓
✓
?
🗴
✓
✓

55
15
20
25
30
$35
Nov-18 Jan-19 Mar-19 Apr-19 Jun-19 Jul-19 Sep-19 Nov-19
Share Price (as of November 22, 2019) $20.99
Equity / Enterprise Value $18.43 / $28.33 bn
LTM EPS $1.36
FY 2019E P / E 17.2x
FY 2019E EV / EBITDA 7.7x
Dividend Yield 3.4%
Halliburton Company (NYSE: HAL)
Company Overview Selected Financial Data
One-Year Share Price Performance
(31.6%)
• One of the world’s largest providers of oilfield services and
equipment to exploration and production (E&P) companies
• Operates through its Drilling and Evaluation and
Completion and Production segments
• Approximately 60% of revenue was derived from the North
American market in FY 2018
– Market-leading position within North American shale
– Significantly greater percentage of revenue comes from
North America relative to peers like Schlumberger and
Baker Hughes
Source: AIM / McDonough 2019, Company Filings and S&P Capital IQ.

56
Primary Discovery
Les Alexander’s Background Interview Goals
Key Takeaways
• Partner at Jefferson Capital Partners
– Energy PE and mezzanine fund
• Adjunct Professor at Tulane
University
• 15 years of investment banking
experience at Scotia Howard Weil
– Responsible for $7 billion of
transactions related to public
and private energy companies
Source: AIM / McDonough 2019, McKinsey Global Supply and Demand Outlook.
• To confirm my belief that a prolonged period of depressed
E&P activity in North America would create a supply
imbalance in the oil markets
• To better understand how trade war tensions and a global
economic slowdown would impact the worldwide demand for
oil
• To determine whether renewable energy resources will present
a significant and meaningful threat to oil demand over the next
five years
Lack of
Returns
Robust
Demand
Supply
Imbalance
Renewable
Past 2035
• E&Ps have not generated
strong returns for their investors
• Now a greater focus on
capital discipline
• Global demand for oil has
not declined once in the last
30 years
• Need drastic global slowdown
• Prolonged period of
reduced North American
drilling will create an
imbalance within a year
• Renewables cost structure is
not anticipated to become
economical until after 2035
• Only minor demand effect

57
Recommendation: Buy
Final Valuation & Recommendation
Valuation Method Weight Implied Price Contribution
Discounted Cash Flow 100.0% $28.33 $28.33
Comparable Companies (P / Book) - - 21.78 - -
Comparable Companies (EV / EBITDA) - - 18.75 - -
Comparable Companies (P / E) - - 21.24 - -
Intrinsic Value per Share $28.33
Current Price (as of November 22, 2019) 20.99
Upside / (Downside) to Current 35.0%
Portfolio Decision: Buy
• Halliburton’s leading market position and best-in-class reputation within North American shale has allowed the Company to
consistently increase its revenue per rig by winning contracts over competitors
• Depressed E&P activity has punished the stock price in the short-term; however, a prolonged period of reduced supply should
benefit Halliburton over the long-run
• Should renewables economic cost structure decline drastically, demand for oil and gas will be negatively impacted
• The Company’s biggest threat is a global economic slowdown—if global demand for oil decreases then the entire rebound
narrative is pushed back even further
✓
✓
?
🗴
Source: AIM / McDonough 2019, Company Filings and S&P Capital IQ.
Note: 0% weighting was given to relative valuation because of anticipated depressed financial performance through 2020.

58
15
20
25
30
35
$40
Nov-18 Jan-19 Mar-19 Apr-19 Jun-19 Jul-19 Sep-19 Nov-19
Stitch Fix, Inc. (NASDAQ: SFIX)
Source: AIM / Delfico 2019, Company Filings and S&P Capital IQ.
Company Overview Selected Financial Data
Share Price (as of November 22, 2019) $22.58
Equity / Enterprise Value $2.29 / $1.98 bn
LTM EPS $0.36
FY 2020E P / E N / M
FY 2020E EV / EBITDA 72.8x
Dividend Yield N / A
One-Year Share Price Performance
(10.8%)
• Stitch Fix, Inc. is an online apparel retail and styling service
founded in 2011 by current CEO, Katrina Lake
• Uses a combination of data analytics and personal stylists to
create a “Fix” that matches your style profile
• SFIX has grown from just a handful of friends and family at
inception to 3.2mm active clients today
– Operations based solely in the U.S. until May of this year
(expanded into UK)
– Six apparel categories: Women’s (main revenue driver),
Petite, Maternity, Men’s, Plus, and Kids
59
- -
10.0%
20.0%
30.0%
40.0%
50.0%
- -
100
200
300
400
500
600
700
$800
2014A 2015A 2016A 2017A 2018A 2019A 2020E 2021E 2022E 2023E 2024E 2025E 2026E 2027E 2028E 2029E
Total Apparel, Footwear, and Accessories Market Size e-Commerce Portion of Total Market Implied Total e-Commerce Penetration Rate
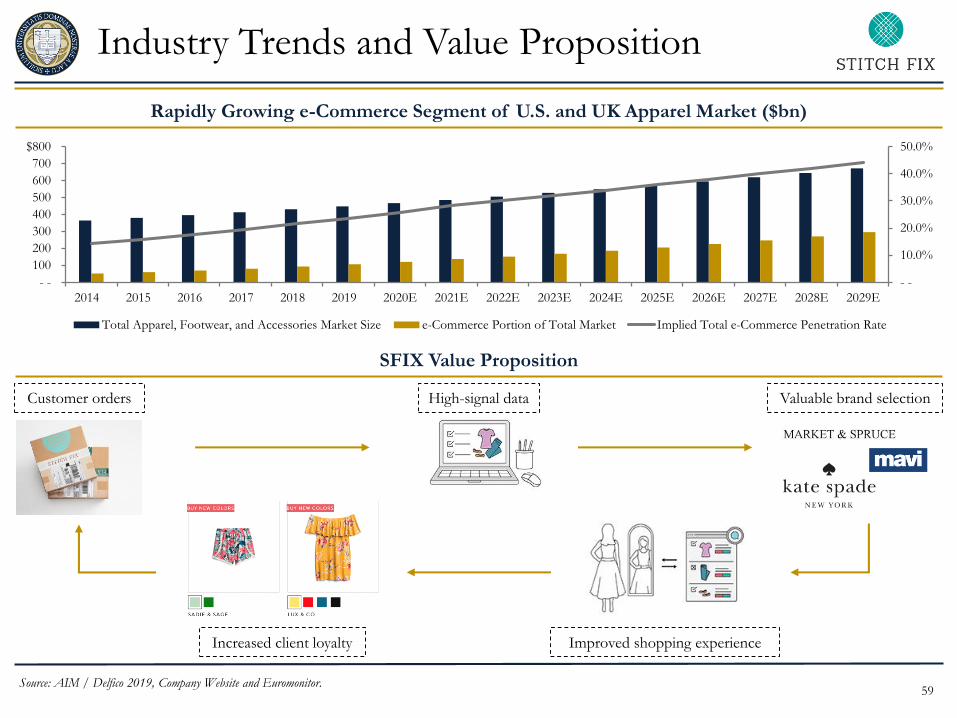
Industry Trends and Value Proposition
Rapidly Growing e-Commerce Segment of U.S. and UK Apparel Market ($bn)
SFIX Value Proposition
Customer orders High-signal data Valuable brand selection
Improved shopping experienceIncreased client loyalty
Source: AIM / Delfico 2019, Company Website and Euromonitor.

60
Final Valuation & Recommendation
Valuation Method Weight Implied Price Contribution
Discounted Cash Flow 100.0% $25.69 $25.69
Comparable Companies (EV / Revenue) - - 30.34 - -
Comparable Companies (EV / EBITDA) - - 5.82 - -
Comparable Companies (P / E) - - 2.52 - -
Intrinsic Value per Share $25.69
Current Price (as of November 22, 2019) 22.58
Upside / (Downside) to Current 13.8%
Recommendation: Buy Portfolio Decision: Buy
Source: AIM / Delfico 2019, Company Filings and S&P Capital IQ.
• Market disruptor in a growing apparel industry that is undergoing a structural shift toward e-Commerce offerings (positioned
perfectly to capitalize on tailwinds)
• Potential for sustained revenue growth through both international expansion and new product development
• Superior operational efficiencies allow for significant margin expansion going forward
• Operating in a highly competitive industry (Department stores, specialty retailers, similar e-Commerce platforms, etc.)
✓
✓
🗴
✓

61
I. COURSE OVERVIEW
II. ECONOMIC OUTLOOK
III. SECURITY ANALYSIS
IV. PORTFOLIO PERFORMANCE
V. AIM XLIX REVIEW
VI. CONCLUDING REMARKS
A. Benchmark Analysis
B. Current Landscape
C. Risk-Adjusted Returns
D. Attribution Analysis
E. Considerations and Recommendations

62
Performance Benchmark – Since AIM Inception
Source: BNY Mellon.Note: HBI refers to Hank Blended Index. All market data herein as of October 31, 2019.
AIM
$12.19
HBI
$7.49
S&P 500
$7.50
Russell 2000
$6.80
- -
1
2
3
4
5
6
7
8
9
10
11
12
$13
1996 1997 1998 1999 2000 2001 2002 2003 2004 2005 2006 2007 2008 2009 2010 2011 2012 2013 2014 2015 2016 2017 2018 2019
AIM S&P 500 Russell 2000 HBI
63
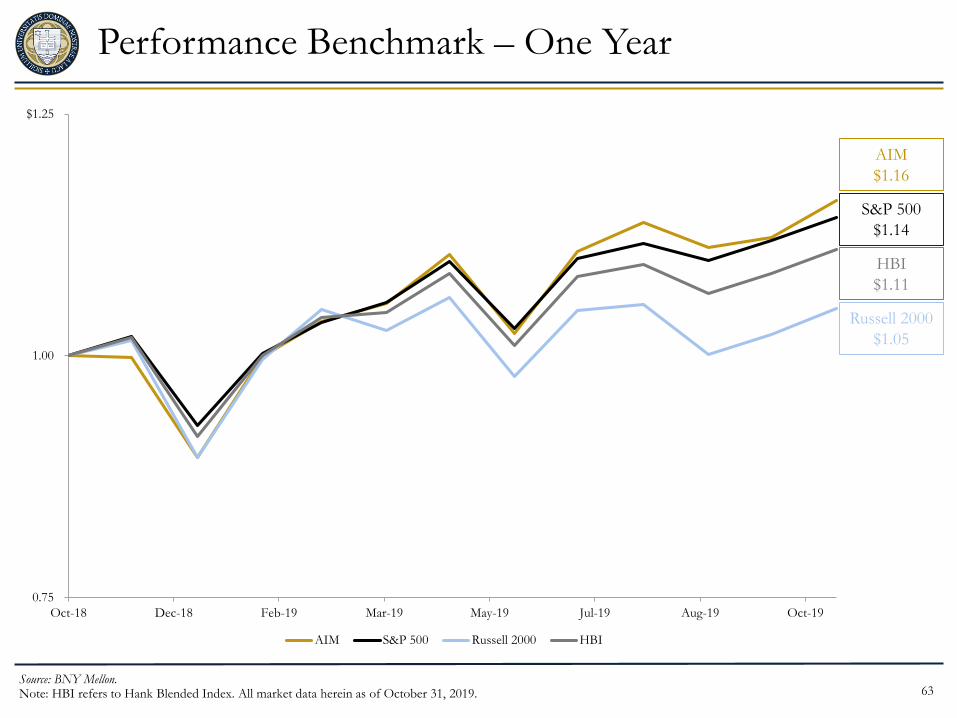
Performance Benchmark – One Year
Source: BNY Mellon.Note: HBI refers to Hank Blended Index. All market data herein as of October 31, 2019.
AIM
$1.16
HBI
$1.11
S&P 500
$1.14
Russell 2000
$1.05
0.75
1.00
$1.25
Oct-18 Dec-18 Feb-19 Mar-19 May-19 Jul-19 Aug-19 Oct-19
AIM S&P 500 Russell 2000 HBI

64
Best / Worst Performers
Top 5 Performers (HPR / LTM)
Bottom 5 Performers (HPR / LTM)
Crown Holdings
CCK
LTM: 56.3%
FB
LTM: 50.9%
Palo Alto Networks
PANW
LTM: 48.4%
Blackstone
BX
HPR(1): 31.4%
CVS Health
CVS
HPR(1): 43.6%
Abiomed
ABMD
HPR(1): (30.3)%
InterDigital
IDCC
HPR(1): (16.6)%
Constellation Brands
STZ
LTM: (6.0)%
Comerica
CMA
LTM: (10.8)%
Source: BNY Mellon and S&P Capital IQ. Note: All market data herein as of November 22, 2019.(1) Holding Period Return (HPR) as of April 22, 2019.
Diamondback Energy
FANG
HPR(1): (32.3)%
65
12.0% 12.0%
8.0%
16.0%
12.0%
20.0%
16.0%
4.0%
16.0%
24.0%
4.0%
12.0%12.0% 12.0%
16.0%
4.0%
10.2%
17.5%
5.0%
13.1%
14.2%
12.2%
21.5%
3.3% 3.1%
- -
5.0%
10.0%
15.0%
20.0%
25.0%
30.0%
Comm. Services Consumer Energy Financials Health Care Industrials IT Utilities Real Estate
AIM XLVIII AIM XLIX S&P 500
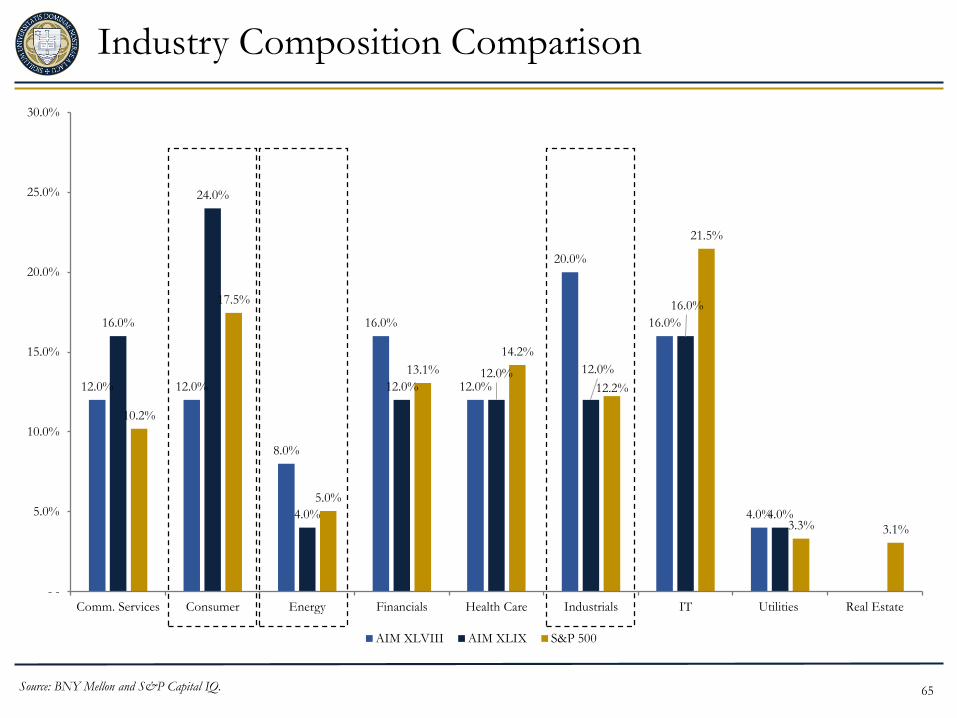
Industry Composition Comparison
Source: BNY Mellon and S&P Capital IQ.

66
0.0% 0.1%
(0.1%)
(0.6%)
0.1%
1.5%
0.1%
(0.3%) (0.2%) (0.2%)
(0.0%)
(0.3%)
2.3%
(0.2%)
0.8%
(0.2%)
1.0%
0.2%
(0.9%)
3.2%
- -
0.7%
(0.3%)
2.4%
(0.4%)
0.2%
(0.1%)
2.4%
0.3%
(1.2%)
3.0%
(0.2%)
0.7%
(2.0%)
(1.0%)
- -
1.0%
2.0%
3.0%
4.0%
Allocation Selection Net Management
YTD Attribution Analysis
Net Management Effect: 6.92%
Source: BNY Mellon.Note: All market data herein as of October 31, 2019.
67
0.4
0.6
0.8
1.0
1.2
1.4
1.6
1998 2000 2002 2004 2006 2008 2010 2012 2014 2016 2018
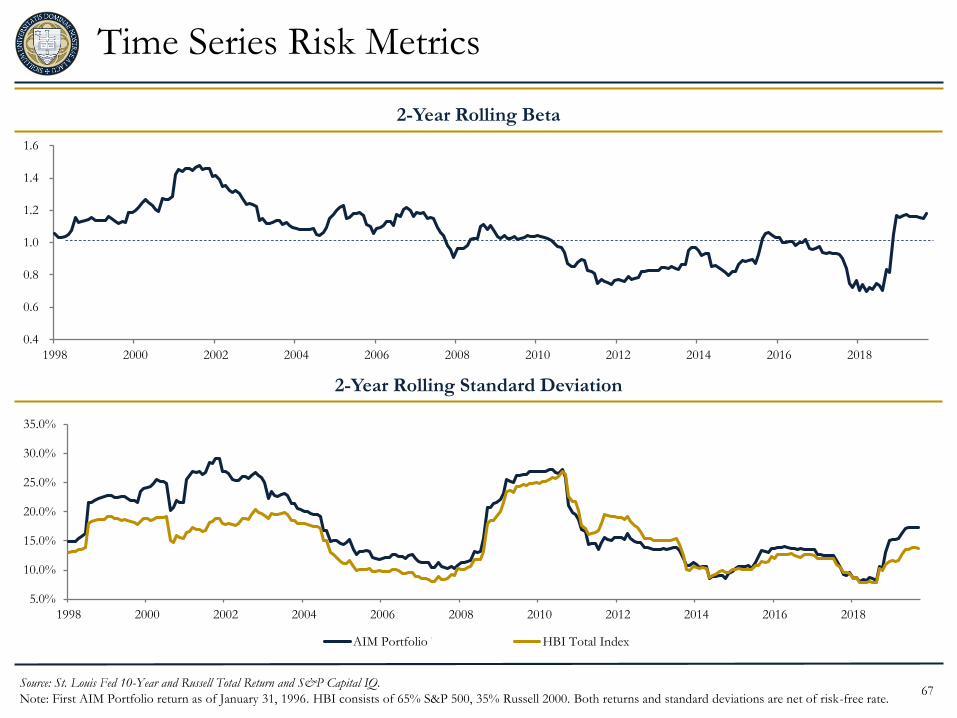
Time Series Risk Metrics
Source: St. Louis Fed 10-Year and Russell Total Return and S&P Capital IQ.
Note: First AIM Portfolio return as of January 31, 1996. HBI consists of 65% S&P 500, 35% Russell 2000. Both returns and standard deviations are net of risk-free rate.
2-Year Rolling Beta
2-Year Rolling Standard Deviation
5.0%
10.0%
15.0%
20.0%
25.0%
30.0%
35.0%
1998 2000 2002 2004 2006 2008 2010 2012 2014 2016 2018
AIM Portfolio Total Index HBI Total Index

68
Risk-Adjusted Return Metrics
2-Year Rolling Sharpe Ratio
2-Year Rolling Treynor Ratio
(1.5)
(0.5)
0.5
1.5
2.5
3.5
1998 2000 2002 2004 2006 2008 2010 2012 2014 2016 2018
AIM Portfolio HBI Total Index
(0.3)
(0.1)
0.1
0.3
0.5
1998 2000 2002 2004 2006 2008 2010 2012 2014 2016 2018
AIM Portfolio HBI Total Index
Source: St. Louis Fed 10-Year and Russell Total Return and S&P Capital IQ.
Note: First AIM Portfolio return as of January 31, 1996. HBI consists of 65% S&P 500, 35% Russell 2000. Both returns and standard deviations are net of risk-free rate.
69
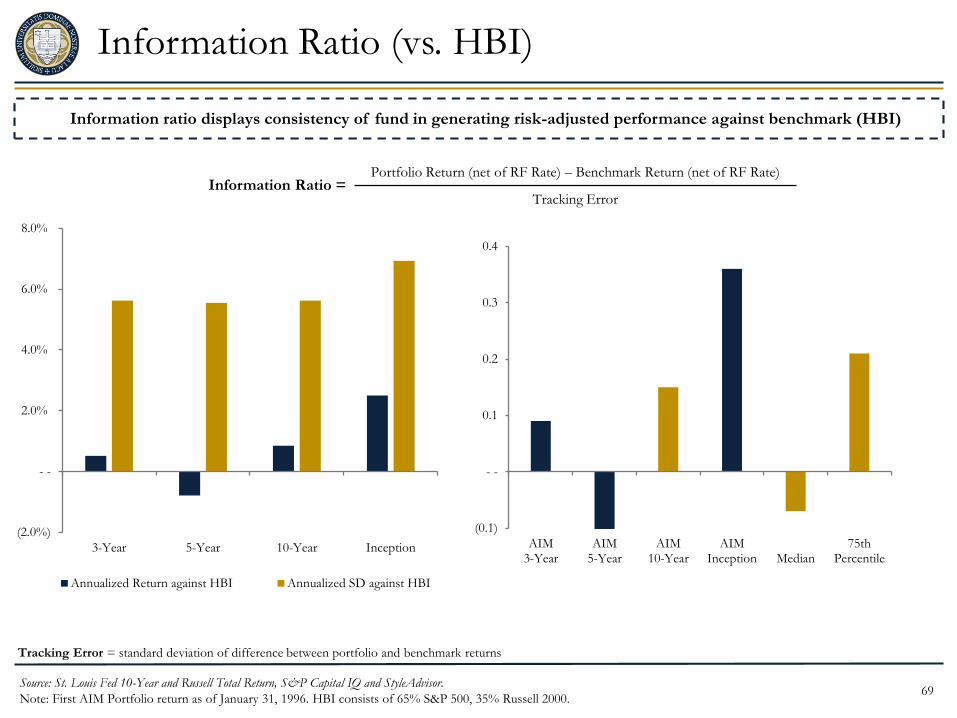
Information Ratio (vs. HBI)
Source: St. Louis Fed 10-Year and Russell Total Return, S&P Capital IQ and StyleAdvisor.
Note: First AIM Portfolio return as of January 31, 1996. HBI consists of 65% S&P 500, 35% Russell 2000.
(2.0%)
- -
2.0%
4.0%
6.0%
8.0%
3-Year 5-Year 10-Year Inception
Annualized Return against HBI Annualized SD against HBI
Information ratio displays consistency of fund in generating risk-adjusted performance against benchmark (HBI)
Tracking Error = standard deviation of difference between portfolio and benchmark returns
Portfolio Return (net of RF Rate) – Benchmark Return (net of RF Rate)
Tracking ErrorInformation Ratio =
(0.1)
- -
0.1
0.2
0.3
0.4
AIM3-Year
AIM5-Year
AIM10-Year
AIMInception Median
75thPercentile

70
5-Year Rolling Alpha
Source: BNY Mellon and S&P Capital IQ.
Note: Based on historical monthly return data as of November 22, 2019.
Alpha calculated as a risk-adjusted performance which measures excess return over that predicted by the CAPM
(0.4%)
(0.2%)
- -
0.2%
0.4%
0.6%
0.8%
2001 2002 2003 2004 2005 2006 2007 2008 2009 2010 2011 2012 2013 2014 2015 2016 2017 2018 2019

71
Final Portfolio Decisions
13 Stocks
Kept in
the
Inherited
AIM
XLIX
Portfolio
12 Stocks
Sold
from the
Inherited
AIM
XLIX
Portfolio
11 Stocks
Added to
Portfolio
by AIM
XLIX
6 Other
Stocks
Evaluated
by AIM
XLIX
Source: BNY Mellon and S&P Capital IQ.
Note: All market data herein as of December 4, 2019.
Inherited Portfolio AIM XLIX Evaluated Stocks
Company YTD Performance Company YTD Performance
Alphabet Inc. 24.7% Costco Wholesale Corp. 45.7%
Constellation Brands 20.6% Halliburton Company (20.7%)
Crown Holdings, Inc. 74.9% Inseego Corp. 34.2%
CVS Health Corp. 3.8% Mastercard, Inc. 46.5%
EchoStar Corp. 7.4% Qualys, Inc. 13.4%
Facebook, Inc. 48.5% Stitch Fix, Inc. 35.8%
Intercontinental Exchange, Inc. 21.0% Stamps.com, Inc. (44.3%)
Microsoft Corp. 42.3% Teladoc Health, Inc. 62.1%
NextEra Energy 32.1% The TJX Companies, Inc. 31.1%
Stryker Corp. 30.9% Tyson Foods, Inc. 53.7%
Trupanion (5.7%) Zillow Group, Inc. 28.5%
Waste Management 24.5%
XPO Logistics 44.0%
A.O. Smith Corp. 19.1% Aerojet Rocketdyne Holdings, Inc. 23.1%
Abiomed, Inc. (32.2%) CarMax, Inc. 52.1%
Booking Holdings 16.6% GTT Communications, Inc. (65.9%)
Caterpillar, Inc. 15.6% Kimberly-Clark Corp. 13.5%
Comerica, Inc. 2.0% Lululemon Athletica, Inc. 61.6%
Diamondback Energy, Inc. (2.5%) Spotify Technology S.A. 35.8%
Dollar General Corp. 46.4%
InterDigital, Inc. (11.3%)
Kinder Morgan 33.7%
Micron Technology, Inc. 56.3%
PaloAlto Networks Inc. 24.2%
The Blackstone Group 78.3%

72
I. COURSE OVERVIEW
II. ECONOMIC OUTLOOK
III. SECURITY ANALYSIS
IV. PORTFOLIO PERFORMANCE
V. AIM XLIX REVIEW
VI. CONCLUDING REMARKS
A. New York Trip
B. Acknowledgements
C. Advisory Board Panel Discussion

73
New York Trip and Class Speakers
Greenlea Lane Capital
Blackstone Infrastructure
• Sean Klimczak
• Private equity, alternative
investment firm
Brigade Capital Management
• Doug Pardon
• Long-short credit, distressed debt,
and leveraged equities manager
• Josh Tarasoff
• Long-only equity
investment firm
Spruce House Capital
• Zach Sternberg & Ben Stein
• Long-only equity investment partners
Bregal Sagemount
• Gene Yoon
• Growth-focused private capital
firm
JMX Capital
• Jan Mohr
• Long-only equity investment firm

Acknowledgements
Thank you for all of your guidance and support
AIM Advisory Board
Shelley Huff
Ben Grefenstette
Colin Jones
Nathan Baumgartner
Notre Dame Investment Office
Mike Cook
Frank Reilly
Jason Reed
Scott Malpass
Jon Carr
Shane Corwin
Joe Shuppig
74