advisory board meeting fall 2013 - university of … · advisory board meeting – fall 2013...
TRANSCRIPT

Advisory Board Meeting – Fall 2013
December 2, 2013
Figures in millions USD (NYSE/NASDAQ-listed) or CAD (TSX-listed) except for share price or as noted
Agenda
2
Fall 2013 Student Team
Overview
Portfolio
Sell Recommendations
Hold Recommendations
Buy Recommendations
Future Initiatives
Macro Outlook
Portfolio Today
Click to edit Master title style
FALL 2013 TEAM
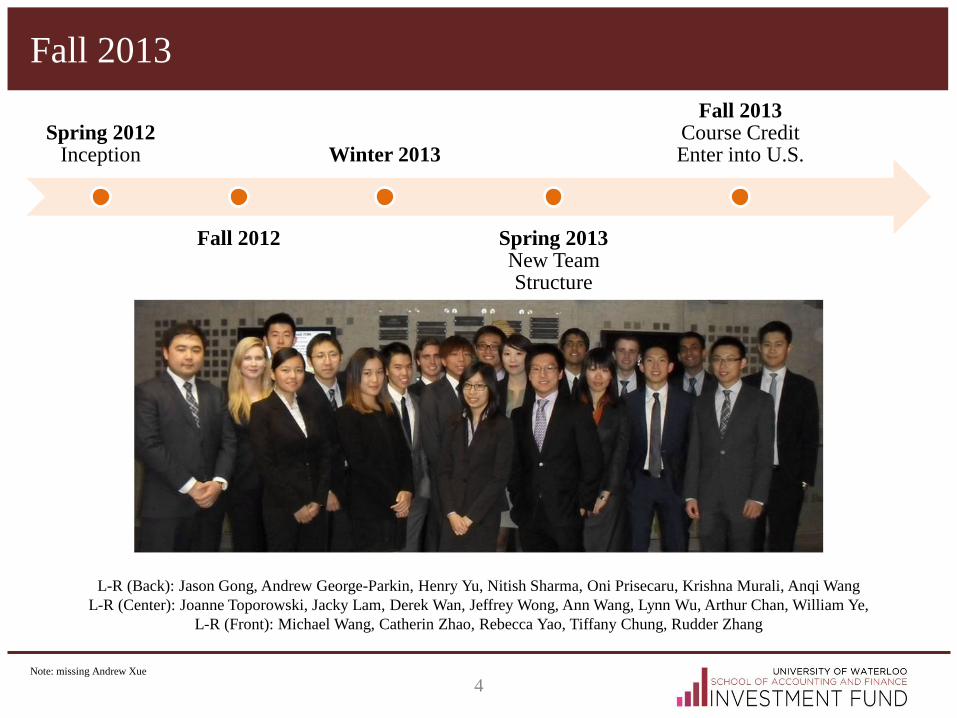
Fall 2013
4
Spring 2012 Inception
Fall 2012
Winter 2013
Spring 2013 New Team Structure
Fall 2013 Course Credit Enter into U.S.
L-R (Back): Jason Gong, Andrew George-Parkin, Henry Yu, Nitish Sharma, Oni Prisecaru, Krishna Murali, Anqi Wang
L-R (Center): Joanne Toporowski, Jacky Lam, Derek Wan, Jeffrey Wong, Ann Wang, Lynn Wu, Arthur Chan, William Ye,
L-R (Front): Michael Wang, Catherin Zhao, Rebecca Yao, Tiffany Chung, Rudder Zhang
Note: missing Andrew Xue
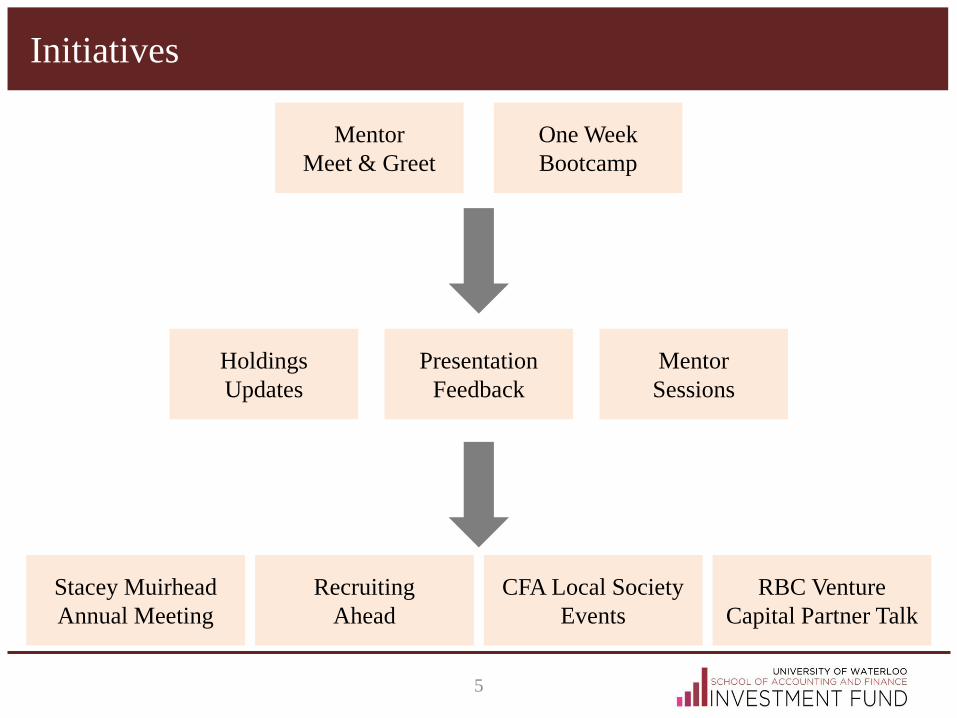
Initiatives
5
One Week
Bootcamp
Mentor
Meet & Greet
Presentation
Feedback
Holdings
Updates
Mentor
Sessions
Recruiting
Ahead
Stacey Muirhead
Annual Meeting
CFA Local Society
Events
RBC Venture
Capital Partner Talk

Click to edit Master title style
OVERVIEW

The Fund
7
Purpose
Objective
“To provide students with an investment management experience in an
institutional setting. Specifically, it will provide students hands-on-
training in equity valuation and portfolio management with guidance
from industry experts and with supervision by finance faculty.”
“To generate long-term growth of the Fund’s assets. The Fund will invest
in a broadly diversified portfolio of mid-to-large capitalization stocks of
Canadian1 issuers that may provide capital gains or income.”
1 The Fund is opening up to all North American issuers this term 2 A mix of S&P/TSX and S&P 500 going forward due to U.S stocks
Benchmark S&P / TSX Total Return Index2
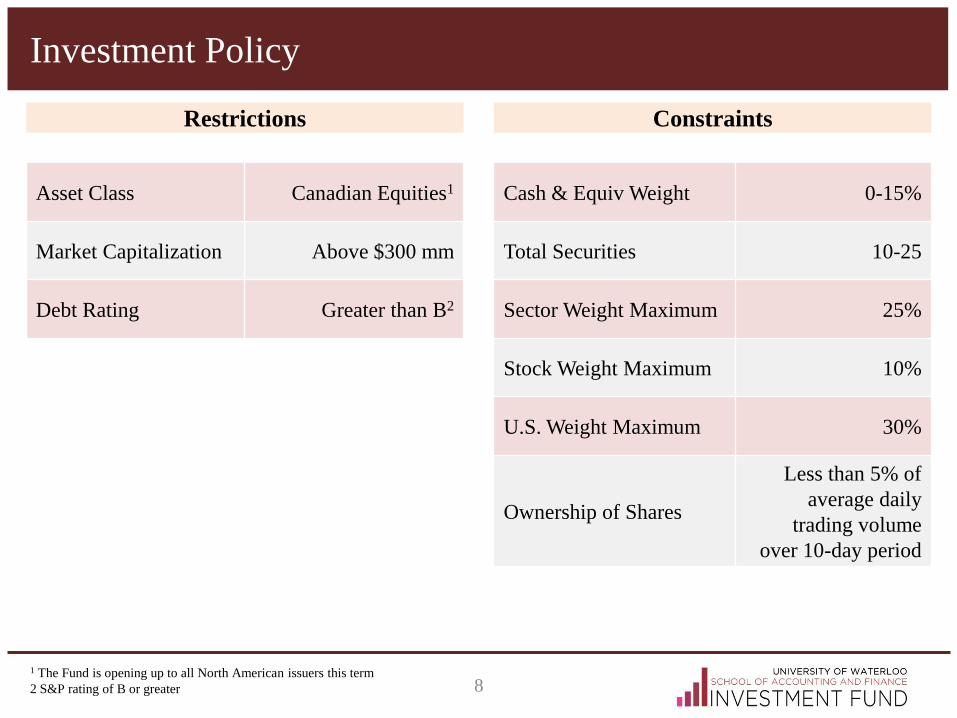
Investment Policy
8
Restrictions Constraints
Asset Class Canadian Equities1
Market Capitalization Above $300 mm
Debt Rating Greater than B2
Cash & Equiv Weight 0-15%
Total Securities 10-25
Sector Weight Maximum 25%
Stock Weight Maximum 10%
U.S. Weight Maximum 30%
Ownership of Shares
Less than 5% of
average daily
trading volume
over 10-day period
1 The Fund is opening up to all North American issuers this term
2 S&P rating of B or greater
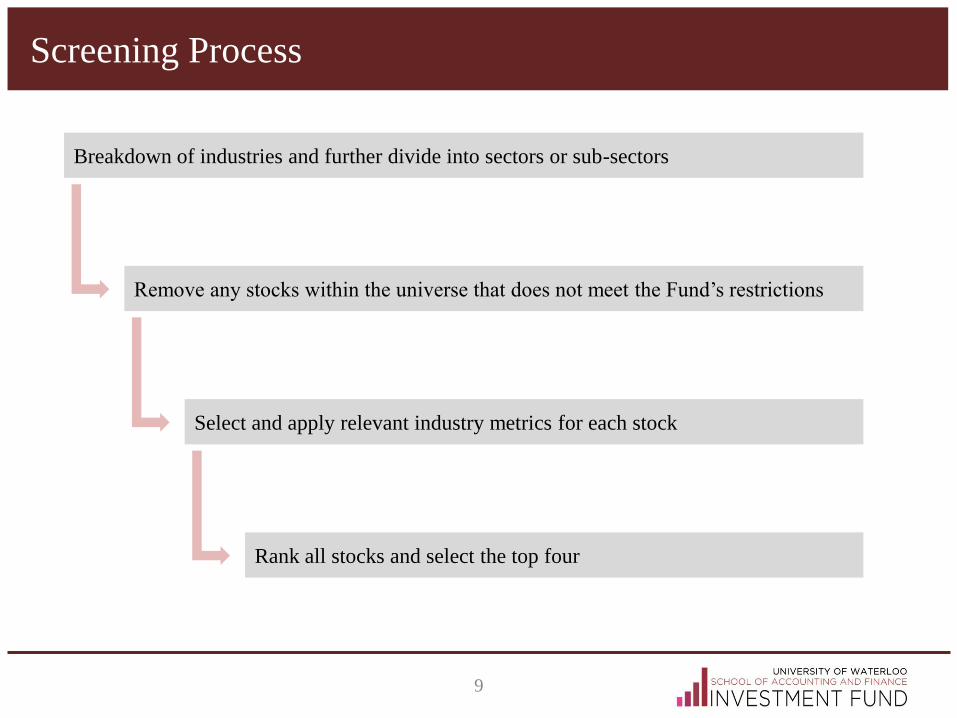
Screening Process
9
Breakdown of industries and further divide into sectors or sub-sectors
Select and apply relevant industry metrics for each stock
Remove any stocks within the universe that does not meet the Fund’s restrictions
Rank all stocks and select the top four

Click to edit Master title style
PORTFOLIO & MACRO
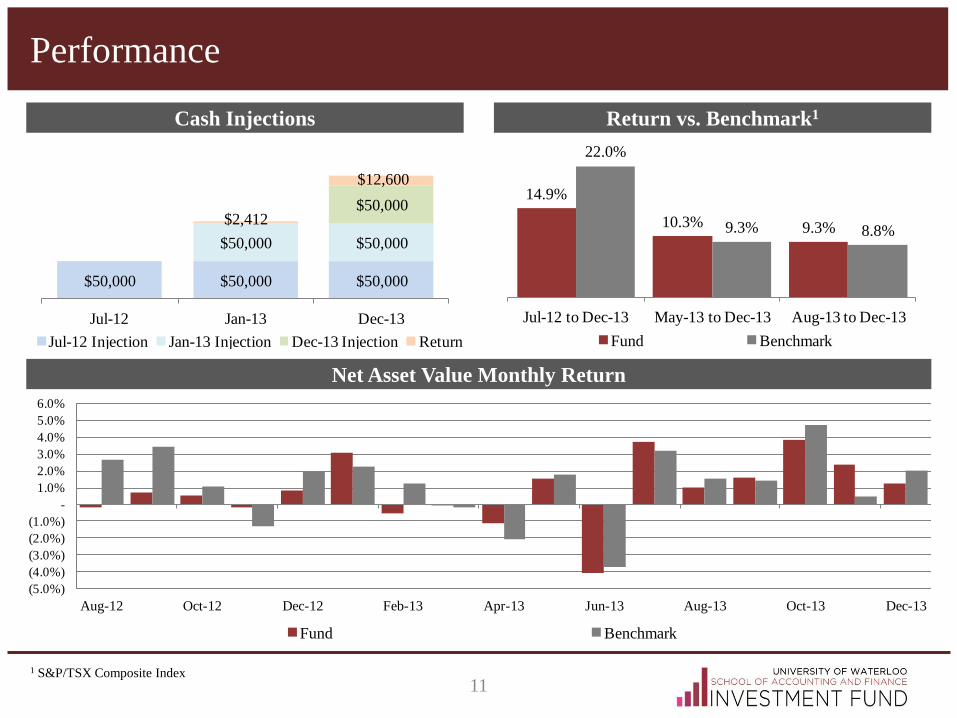
Performance
11
Net Asset Value Monthly Return
Cash Injections Return vs. Benchmark1
$50,000 $50,000 $50,000
$50,000 $50,000
$50,000$2,412
$12,600
Jul-12 Jan-13 Dec-13
Jul-12 Injection Jan-13 Injection Dec-13 Injection Return
1 S&P/TSX Composite Index
14.9%
10.3% 9.3%
22.0%
9.3% 8.8%
Jul-12 to Dec-13 May-13 to Dec-13 Aug-13 to Dec-13
Fund Benchmark
(5.0%)
(4.0%)
(3.0%)
(2.0%)
(1.0%)
-
1.0%
2.0%
3.0%
4.0%
5.0%
6.0%
Aug-12 Oct-12 Dec-12 Feb-13 Apr-13 Jun-13 Aug-13 Oct-13 Dec-13
Fund Benchmark
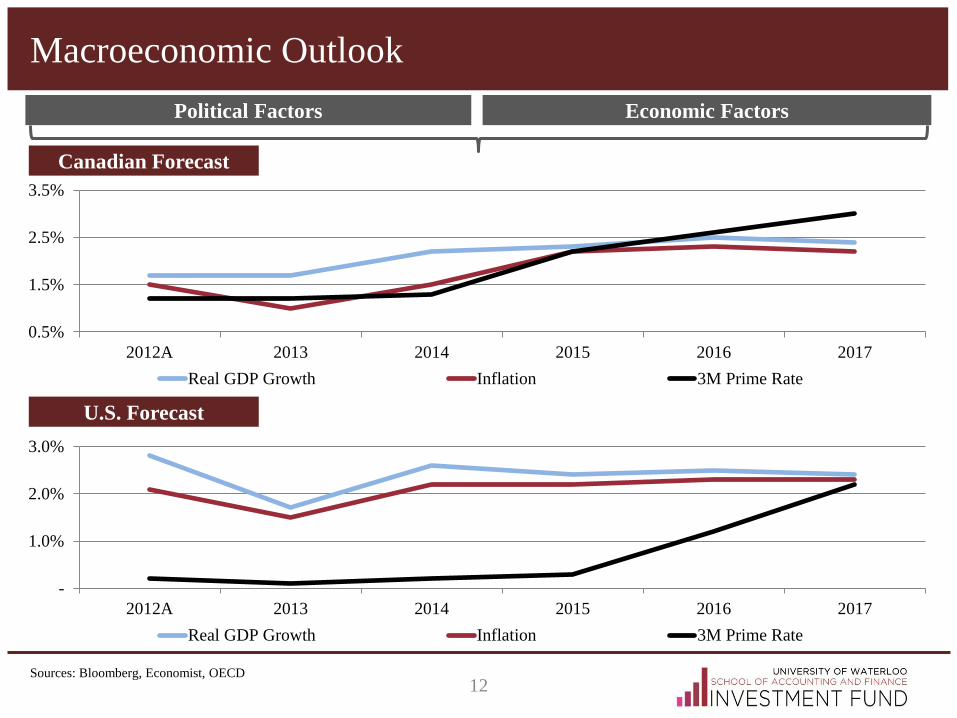
Macroeconomic Outlook
12
Political Factors Economic Factors
U.S. Forecast
Sources: Bloomberg, Economist, OECD
0.5%
1.5%
2.5%
3.5%
2012A 2013 2014 2015 2016 2017
Real GDP Growth Inflation 3M Prime Rate
-
1.0%
2.0%
3.0%
2012A 2013 2014 2015 2016 2017
Real GDP Growth Inflation 3M Prime Rate
Canadian Forecast
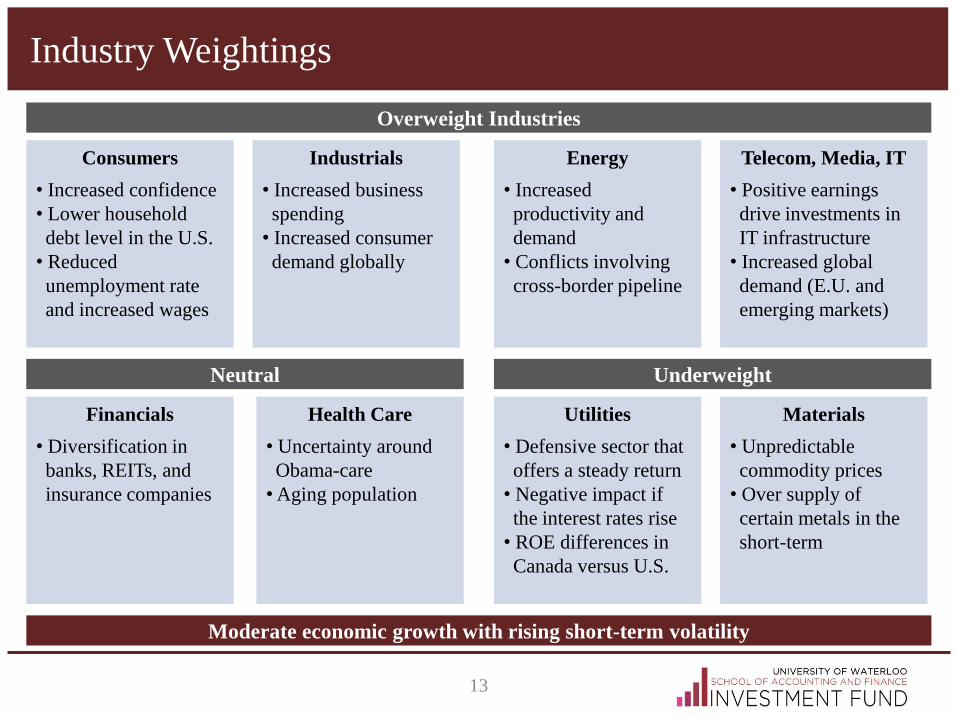
Industry Weightings
13
Overweight Industries
Consumers
• Increased confidence
• Lower household
debt level in the U.S.
• Reduced
unemployment rate
and increased wages
Neutral Underweight
Industrials
• Increased business
spending
• Increased consumer
demand globally
Energy
• Increased
productivity and
demand
• Conflicts involving
cross-border pipeline
Telecom, Media, IT
• Positive earnings
drive investments in
IT infrastructure
• Increased global
demand (E.U. and
emerging markets)
Financials
• Diversification in
banks, REITs, and
insurance companies
Utilities
• Defensive sector that
offers a steady return
• Negative impact if
the interest rates rise
• ROE differences in
Canada versus U.S.
Materials
• Unpredictable
commodity prices
• Over supply of
certain metals in the
short-term
Moderate economic growth with rising short-term volatility
Health Care
• Uncertainty around
Obama-care
• Aging population

Click to edit Master title style
SELL RECOMMENDATIONS

-
1
2
3
4
5
6
(40%)
(30%)
(20%)
(10%)
-
10%
20%
Aug-13 Sep-13 Oct-13 Nov-13
Volu
me
(mm
)
Ret
urn
MRE Volume MRE Return Sector Return
Martinrea International (TSX:MRE)
15
Stock Performance
Events Sell Rationale
A B
C
A
B
C
Aug 7, 2013 – Martinrea International announced
Q2 results slightly below expectations
Sept 27, 2013 – Ex Vice Chairman, Natale Rea
sues Martinrea on fraudulent management
Nov 7, 2013 – Martinrea International announced
Q3 results in line with expectations
Governance issues with respect to management as
current CEO was highly involved with alleged activity
Lower expected growth if Rea is successful in taking
over Martinrea given existing management expertise
High uncertainty with respect to timing and cost on
resolution of lawsuit
Nov 22, 2013 – Rea responds to counterclaim with
specific alleged magnitude of fraud D
D
1
1 S&P/TSX Composite Auto Parts & Equipment Index
Market Cap $750
Beta 0.94
Debt/Equity 47.3%
S&P Rating NR
Cost Value $4,953
Sold Value $3,773
Capital Gains (23.6%)
Dividend 0.3%

-
1
2
3
(10%)
(5%)
-
5%
Aug-13 Sep-13 Oct-13 Nov-13
Volu
me
(mm
)
Ret
urn
FTS Volume FTS Return Sector Return
Fortis (TSX:FTS)
16
Stock Performance
Events Sell Rationale
A
B
A
B Nov 1, 2013 – Q3 Earnings below expectations
with year-over-year decline of ROE due to
regulatory changes and continued issues from CH
Group
Continued issues integrating CH Group acquisition (i.e.
not capitalizing on higher allowed ROE within U.S.)
Revenue growth expected to be curbed significantly
limiting value with a target price of $31.75 (upside 2.4%)
Macro outlook moderately positive, underweight yield
stocks
Aug 1, 2013 – Q2 Earnings significantly below
expectations due to implementation issues with
respect to CH Group post-acquisition integration as
significant credits offered to U.S. customers
1
1 Dow Jones Canada Select Utility Index
Note: FTS is still in the portfolio with a limit sell of $31.75 GTC Dec 30, 2013
Market Cap $6,617
Beta 0.52
Debt/Equity 96.2%
S&P Rating A-
Cost Value $8,879
Sold Value $8,414
Capital Gains (5.2%)
Dividend 3.4%
-
1
2
3
(10%)
-
10%
20%
Aug-13 Sep-13 Oct-13 Nov-13
Volu
me
(mm
)
Ret
urn
NA Volume NA Return Sector Return
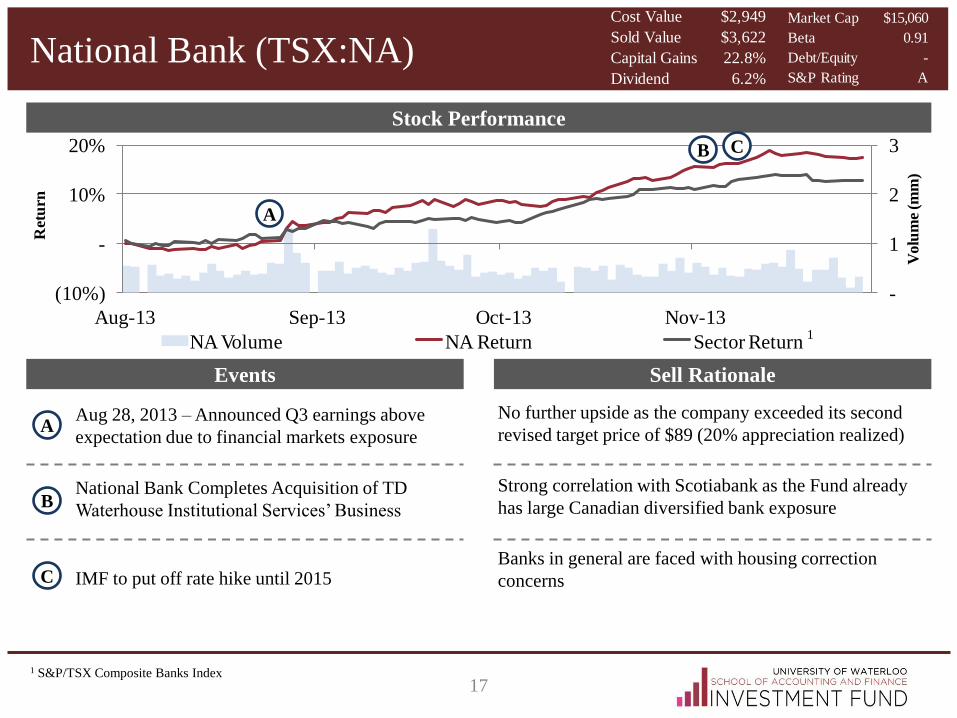
National Bank (TSX:NA)
17
Stock Performance
Events Sell Rationale
A
B National Bank Completes Acquisition of TD
Waterhouse Institutional Services’ Business
No further upside as the company exceeded its second
revised target price of $89 (20% appreciation realized)
Strong correlation with Scotiabank as the Fund already
has large Canadian diversified bank exposure
Banks in general are faced with housing correction
concerns
Aug 28, 2013 – Announced Q3 earnings above
expectation due to financial markets exposure
A
B
IMF to put off rate hike until 2015 C
C
1
1 S&P/TSX Composite Banks Index
Market Cap $15,060
Beta 0.91
Debt/Equity -
S&P Rating A
Cost Value $2,949
Sold Value $3,622
Capital Gains 22.8%
Dividend 6.2%
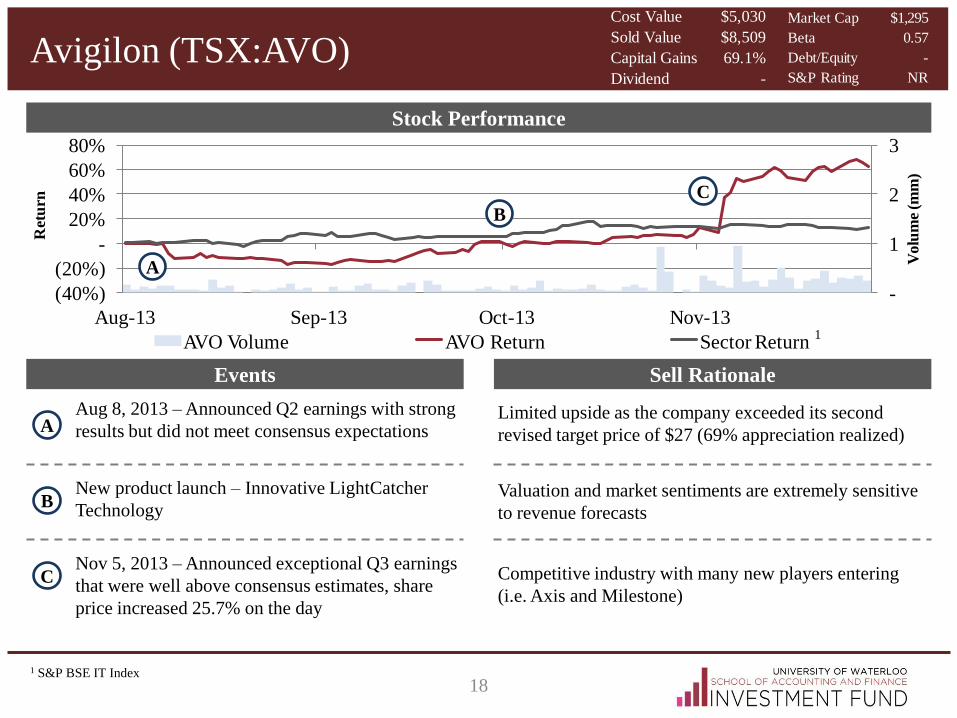
Avigilon (TSX:AVO)
18
Stock Performance
Events Sell Rationale
A
B New product launch – Innovative LightCatcher
Technology
Limited upside as the company exceeded its second
revised target price of $27 (69% appreciation realized)
Valuation and market sentiments are extremely sensitive
to revenue forecasts
Competitive industry with many new players entering
(i.e. Axis and Milestone)
Aug 8, 2013 – Announced Q2 earnings with strong
results but did not meet consensus expectations
Nov 5, 2013 – Announced exceptional Q3 earnings
that were well above consensus estimates, share
price increased 25.7% on the day
C
-
1
2
3
(40%)
(20%)
-
20%
40%
60%
80%
Aug-13 Sep-13 Oct-13 Nov-13
Volu
me
(mm
)
Ret
urn
AVO Volume AVO Return Sector Return1
1 S&P BSE IT Index
A
C
Market Cap $1,295
Beta 0.57
Debt/Equity -
S&P Rating NR
Cost Value $5,030
Sold Value $8,509
Capital Gains 69.1%
Dividend -
B

Baytex Energy (TSX:BTE)
19
Stock Performance
Events Sell Rationale
A
B Oct 2013 – Widening WSC-WTI differential where
WCS declined 12% but WTI declined 5.4% in
October
Significant production growth built into current price,
limited upside with high risk of not meeting targets
Sustainability of dividend reliant on realizing production
growth and WTI/WCS spread
History of earnings misses except in periods of
significant derivative gains of asset sales
Aug 30, 2013 – Baytex reaffirms production
outlook for year at 56k to 58k BOE/D
Reached updated target price which represents capital
gains of 4.1% and dividends of 1.6%
Oct 30, 2013 – Baytex reported above expected Q3
earnings results
C
-
1
2
3
4
5
(15%)
(10%)
(5%)
-
5%
10%
Aug-13 Sep-13 Oct-13 Nov-13
Volu
me
(mm
)
Ret
urn
BTE Volume BTE Return Sector Return1
1 S&P TSX Composite Oil and Gas Exploration Index
C
A
Market Cap $5,329
Beta 1.65
Debt/Equity 10.4%
S&P Rating BB
Cost Value $5,583
Sold Value $5,814
Capital Gains 4.1%
Dividend 1.6%
B
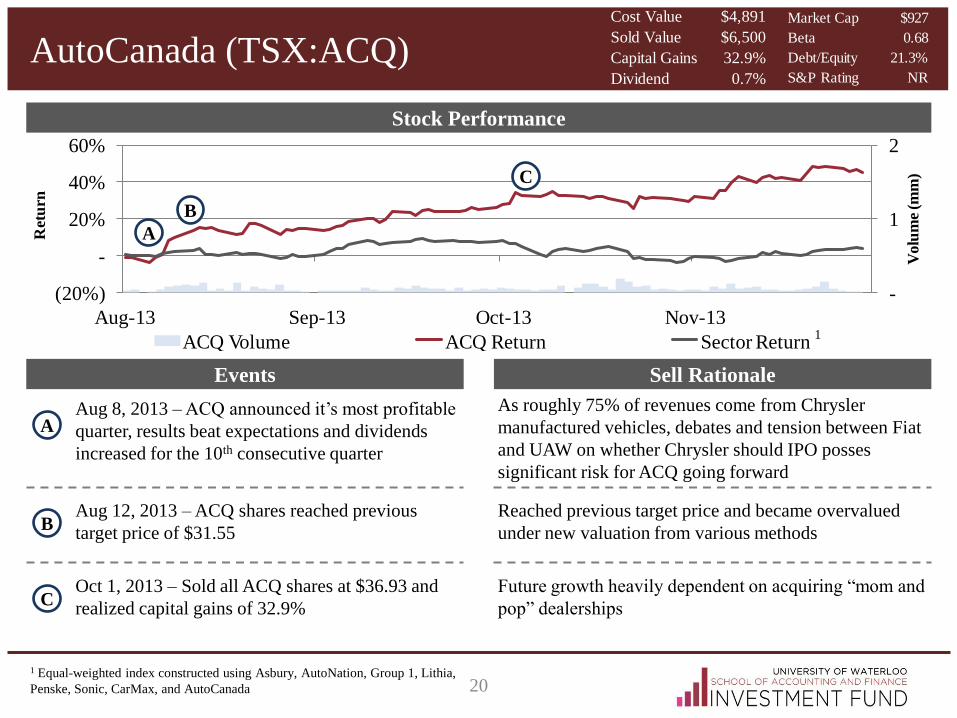
AutoCanada (TSX:ACQ)
20
Stock Performance
Events Sell Rationale
-
1
2
(20%)
-
20%
40%
60%
Aug-13 Sep-13 Oct-13 Nov-13
Volu
me
(mm
)
Ret
urn
ACQ Volume ACQ Return Sector Return1
1 Equal-weighted index constructed using Asbury, AutoNation, Group 1, Lithia,
Penske, Sonic, CarMax, and AutoCanada
A
B
C
A
B Aug 12, 2013 – ACQ shares reached previous
target price of $31.55
Aug 8, 2013 – ACQ announced it’s most profitable
quarter, results beat expectations and dividends
increased for the 10th consecutive quarter
Oct 1, 2013 – Sold all ACQ shares at $36.93 and
realized capital gains of 32.9% C
As roughly 75% of revenues come from Chrysler
manufactured vehicles, debates and tension between Fiat
and UAW on whether Chrysler should IPO posses
significant risk for ACQ going forward
Reached previous target price and became overvalued
under new valuation from various methods
Future growth heavily dependent on acquiring “mom and
pop” dealerships
Market Cap $927
Beta 0.68
Debt/Equity 21.3%
S&P Rating NR
Cost Value $4,891
Sold Value $6,500
Capital Gains 32.9%
Dividend 0.7%

Click to edit Master title style
HOLD RECOMMENDATIONS

Hold Recommendations
22

Click to edit Master title style
BUY RECOMMENDATIONS

AGCO (NYSE:AGCO)
24
Valuation
Company Overview Share Performance
Drivers & Risks
Manufacturer and distributor of agricultural equipments and parts
Revenue by Geography Revenue by Segment
N.A.
26%
S.A.
19%
EM
EA
51%
APJ
5%
EMEA51%
Drivers
Risks
Russian joint-venture to capitalize on growing market
Progress on 2015 goal of 10% operating margins
Strategic partnership in India
Increasing storage and consumption
High correlation with row crop prices
Dependent on size and nature of government subsidies
Acquisitions have negatively impacted margins
Country risk – expected to have operations in Russia
Financing heavily dependent on partner, Radobank
Base Bear Bull
WACC 8.6% 8.6% 8.6%
Revenue CAGR 7.3% 4.3% 7.9%
Exit Multiple 5.5x 5.5x 5.5x
Perpetuity Growth 2.0% 2.0% 2.0%
Implied Share Price $68.34 $54.48 $85.77
Weighting 80% 10% 10%
Target price $68.70
Current Price $58.28
Upside 17.9%
-
2
4
6
8
(80%)
(40%)
-
40%
80%
2008 2009 2010 2011 2012 2013
Vo
lum
e (m
m)
Ret
urn
AGCO Volume AGCO Return Sector Return1
1 SPDR Industrial Sector Select Index
Market Cap $5,674
Beta 1.27
Debt/Equity 8.9%
S&P Rating BBB-
Parts
13%
Mac
hinar
y …
Othe
r
14% Tractors
59%
Other
14%
Machi-
nery
14%

Alaska Air Group (NYSE:ALK)
25
Valuation
Company Overview Share Performance
Drivers & Risks
Legacy airline company operating primarily in the U.S.
Revenue by Segment Financials
Drivers
Risks
Mai
nline
76%
Regi
onal
16%
Hori
zon
7%
Mainline
76%
Horizon
7%Regional
16%
UAL merger opens East Coast slots due to Department of
Justice settlement on anti-trust lawsuit
Improving margins generated by year-over-year
decreases in cost per available seat mile
CEO transition – William Ayers expected to step down in
early 2014
Significant decreases in hedge profile for fuel
Salaries and wages continue to rise with industry
Delta Airlines expanding into core route offerings
-
2
4
6
8
(200%)
-
200%
400%
600%
2008 2009 2010 2011 2012 2013
Vo
lum
e (m
m)
Ret
urn
Alaska Volume Alaska Return Sector Return1
1 NYSE ARCA Airline Index
DCF EV/EBITDA P/E
WACC 7.6%
Revenue CAGR 6.2%
Exit Multiple 5.5x
Terminal Growth 2.5%
Multiple 5.9x 20.7x
Share Price $86.81 $88.07 $140.00
Weighting 85.0% 7.5% 7.5%
Target Price $91.00
Current Price $77.74
Upside 17.1%
Market Cap $5,402
Beta 1.05
Debt/Equity -
S&P Rating BB
Enterprise Value $4,902
52 Week Range $42.05-$78.53
EV/EBITDA 5.6x
P/E 11.7x
Beta 5Y 0.96
Revenue CAGR 5Y 6.20%

Dundee REIT (TSX:D.UN)
26
Valuation
Company Overview Share Performance
Drivers & Risks
One of the largest Canadian REITs renting office buildings
Gross Leasable Area (24mm Sq. Ft)
Drivers
Risks
High quality portfolio
Consistently above average occupancy rates
Stable dividend yield
Lease rollover
Oversupply of office property
Increase in interest rate
Calgary
16%Ottawa
5%
Montreal
4%GTA
39%
KW
4%
Edmonton
6%
Other
26%
-
1
2
3
4
(100%)
(50%)
-
50%
100%
2008 2009 2010 2011 2012 2013
Vo
lum
e (m
m)
Ret
urn
Dundee Volume Dundee Return Sector Return1
1 iShares S&P TSX Capped REIT Index
Net Asset Value P/FFO P/AFFO
Capitalization Rate 6.9%
Multiple 11.9x 12.9x
Share Price $33.75 $31.76 $31.76
Weighting 50% 25% 25%
Target Price $33.49
Purchased Price $28.00
Upside 19.6%
Dividend Yield 7.8%
Market Cap $3,035
Beta 0.37
Debt/Equity 90.8%
S&P Rating BBB-

ProAssurance (NYSE:PRA)
27
Valuation
Company Overview Share Performance
Drivers & Risks
Medical Malpractice Insurer operating in the U.S.
Drivers
Risks
Diversified insurer with a low combined ratio
Tort reform and legal developments
History of successful acquisition growth
Consolidation in the Industry
Unpredictability of Reserve Developments
Decrease in interest rates
Physicians
78%
Healthcare
5%
Legal
3%
Other
14%
Premiums by Segment ($554 mm)
-
1
2
3
4
5
(100%)
(50%)
-
50%
100%
150%
2008 2009 2010 2011 2012 2013
Vo
lum
e (m
m)
Ret
urn
ProAssurance Volume ProAssurance Return Sector Return
DCF P/TBV P/BV P/E
Cost of Equity 7.2%
Terminal Growth 1.0%
Multiple 1.4x 1.2x 15.0x
Share Price $57.67 $53.30 $46.16 $49.01
Weighting 50% 17% 17% 17%
Target Price $53.58
Current Price $48.08
Upside 11.44%
Dividend Yield 2.10%
Market Cap $2,965
Beta 0.49
Debt/Equity 0.2%
S&P Rating BBB+
11.4%
1
1 iShares Dow Jones U.S. Insurance Index ETF
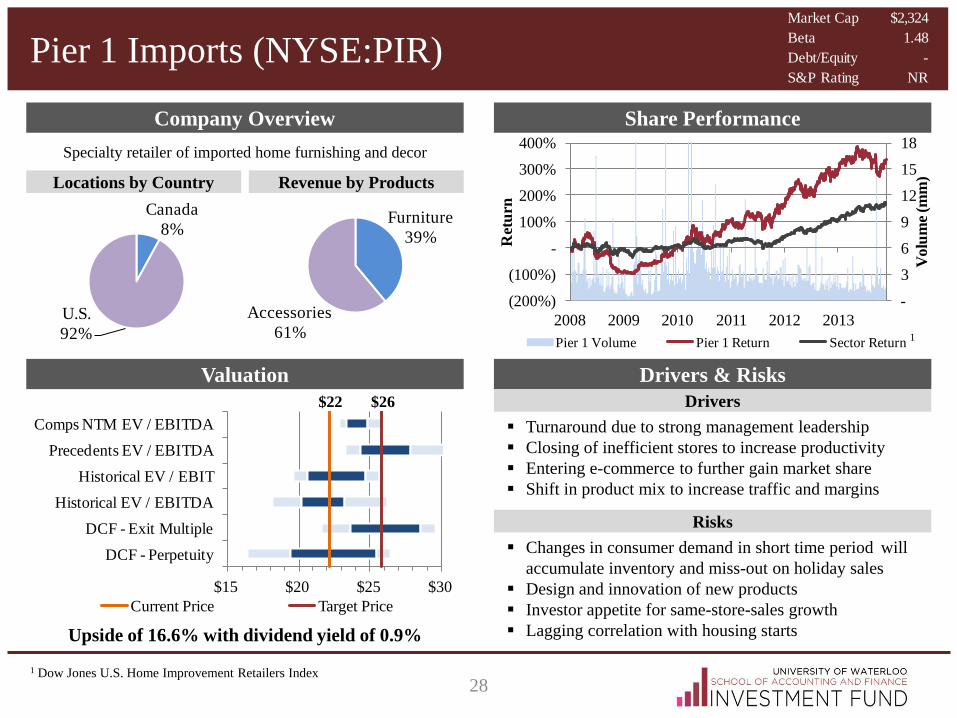
Pier 1 Imports (NYSE:PIR)
28
-
3
6
9
12
15
18
(200%)
(100%)
-
100%
200%
300%
400%
2008 2009 2010 2011 2012 2013
Vo
lum
e (m
m)
Ret
urn
Pier 1 Volume Pier 1 Return Sector Return
Valuation
Company Overview Share Performance
Drivers & Risks
Specialty retailer of imported home furnishing and decor
Drivers
Risks
Turnaround due to strong management leadership
Closing of inefficient stores to increase productivity
Entering e-commerce to further gain market share
Shift in product mix to increase traffic and margins
Changes in consumer demand in short time period will
accumulate inventory and miss-out on holiday sales
Design and innovation of new products
Investor appetite for same-store-sales growth
Lagging correlation with housing starts
1
1 Dow Jones U.S. Home Improvement Retailers Index
U.S.
92%
Canada
8%
Locations by Country Revenue by Products
$22 $26
$15 $20 $25 $30
DCF - Perpetuity
DCF - Exit Multiple
Historical EV / EBITDA
Historical EV / EBIT
Precedents EV / EBITDA
Comps NTM EV / EBITDA
Current Price Target Price
Upside of 16.6% with dividend yield of 0.9%
Furniture
39%
Accessories
61%
Market Cap $2,324
Beta 1.48
Debt/Equity -
S&P Rating NR

Cogeco Cable (TSX:CCA)
29
Valuation Drivers & Risks
11th largest hybrid fiber coaxial cable operator in North America
Ownership Breakdown Revenue by Products
Drivers
Risks
Strong organic and acquisition growth in the industry
Exclusive partnerships will lead to competitive advantage
Effective cost management to steadily increase margins
Unique ownership structure and solid management team
Competitive industry with rapid technological
developments (i.e. over-the-top content)
Regulation changes in Canada and the U.S.
Switch from landline to mobile telephony
Incremental increases in integration cost
Company Overview Share Performance
1
1 S&P Global Telecom Index
-
1
2
3
4
5
(60%)
(40%)
(20%)
-
20%
40%
2008 2009 2010 2011 2012 2013
Vo
lum
e (m
m)
Ret
urn
Cogeco Volume Cogeco Return Sector Return
Cabl
e
U.…
Cable
Canada
72%
Cable
U.S.
16%
Services
12%
Market Cap $2,339
Beta 0.58
Debt/Equity 97.3%
S&P Rating BB+
Major DCF Assumptions (100% DCF Value)
5-year revenue CAGR 5.5%
5-year EBITDA CAGR 5.0%
WACC 5.9%
Terminal Multiple 5.5x
Target price $54.00
Current Price $47.88
Upside 12.8%
Dividend Yield 2.2%
Letk
o
Br…
Othe
r
18%Cogeco
32%
Other
14%
Letko
Brosseau
10%Rogers
40%

Click to edit Master title style
OTHER STOCK PITCHES

Other Stock Pitches
31

Click to edit Master title style
PORTFOLIO TODAY

Portfolio Today (December 2, 2013)
33
Limit Sell
Sell Fortis at $31.75 ($31.15 as of Nov 29, 2013)
U.S. Stocks
Currently awaiting approval on W8-BEN form to purchase
U.S. listed stocks. High likelihood of trade execution
Alaska Air Group
AGCO
ProAssurance
Pier 1 Imports
Ticker Name Shares Price Value Return
AGU Agrium 50 $95.61 $4,781 (4.1%)
AX.UN Artis REIT 350 $14.40 $5,040 1.7%
BNS Scotiabank 124 $65.21 $8,086 18.5%
BDI Black Diamond 239 $29.50 $7,051 44.3%
CCO Cameco 238 $21.54 $5,127 2.9%
CPX Capital Power 453 $20.90 $9,468 0.7%
CCA Cogeco Cable 105 $48.04 $5,044 0.2%
D.UN Dundee REIT 180 $28.00 $5,040 (0.1%)
FTS Fortis 265 $31.15 $8,255 (2.8%)
G Goldcorp 240 $23.65 $5,676 (34.1%)
NA National Bank 54 $92.46 $4,993 21.6%
SU Suncor Energy 260 $36.42 $9,469 17.9%
VRX Valeant 53 $114.46 $6,066 21.4%
Market Value $84,096
Cash $27,064
Total Portfolio $111,160
AGU4.3%
AX.UN4.5%
BNS7.3%
BDI6.3%
CCO4.6%
CPX8.5%
CCA4.5%
D.UN4.5%
FTS7.4%
G5.1%
NA4.5%
SU8.5%
VRX5.5%
Cash24.3%
Unexecuted Trades
Portfolio Breakdown
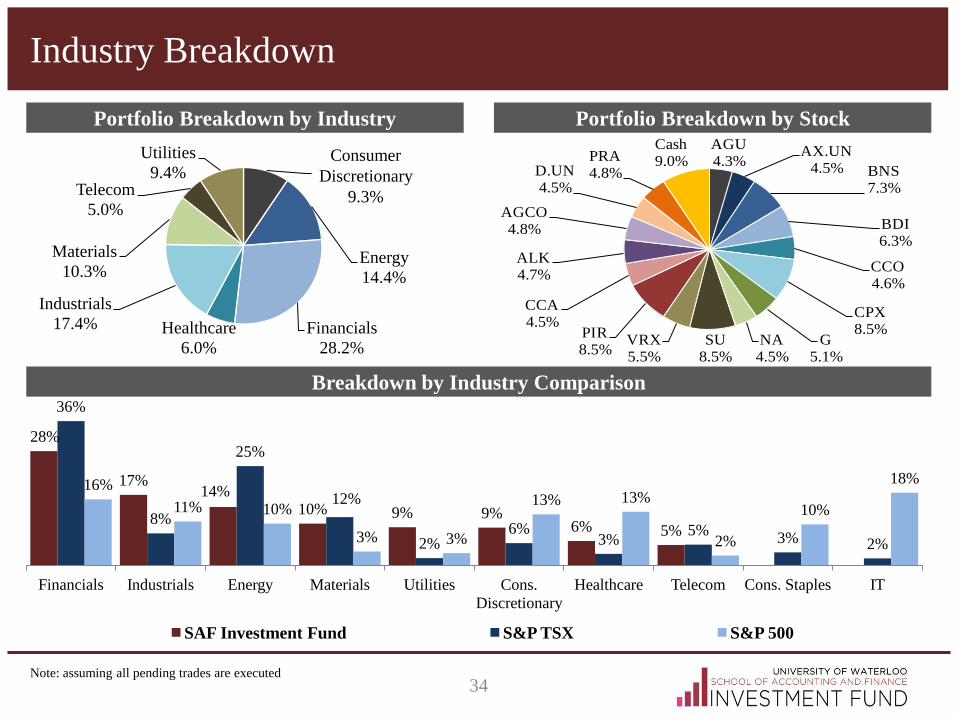
Industry Breakdown
34 Note: assuming all pending trades are executed
AGU4.3%
AX.UN4.5% BNS
7.3%
BDI6.3%
CCO4.6%
CPX8.5%
G5.1%
NA4.5%
SU8.5%
VRX5.5%
PIR8.5%
CCA4.5%
ALK4.7%
AGCO4.8%
D.UN4.5%
PRA4.8%
Cash9.0%
28%
17% 14%
10% 9% 9% 6% 5%
36%
8%
25%
12%
2% 6%
3% 5%
3% 2%
16%
11% 10%
3% 3%
13% 13%
2%
10%
18%
Financials Industrials Energy Materials Utilities Cons.
Discretionary
Healthcare Telecom Cons. Staples IT
SAF Investment Fund S&P TSX S&P 500
Consumer
Discretion
ary
9.3%
Energy
14.4%
Financials
28.2%
Healthcare
6.0%
Industrials
17.4%
Materials
10.3%
Telecom
5.0%
Utilities
9.4% Consumer
Discretionary
9.3%
Portfolio Breakdown by Industry Portfolio Breakdown by Stock
Breakdown by Industry Comparison
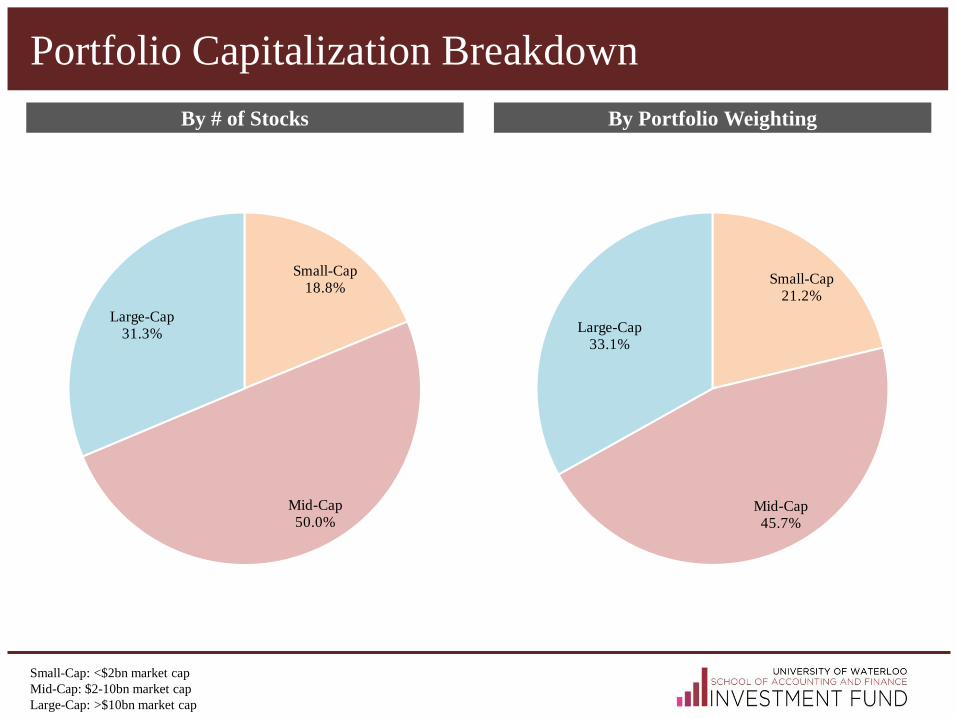
Portfolio Capitalization Breakdown
By # of Stocks By Portfolio Weighting
Small-Cap18.8%
Mid-Cap50.0%
Large-Cap31.3%
Small-Cap21.2%
Mid-Cap45.7%
Large-Cap33.1%
Small-Cap: <$2bn market cap
Mid-Cap: $2-10bn market cap
Large-Cap: >$10bn market cap

Portfolio Breakdown by Sub-sector
Versus S&P / TSX Versus S&P 500
Sub-Sector Index Fund
Oil, Gas and Consumable Fuels 24.0% 14.4%
Commercial Banks 20.3% 13.0%
Real Estate Investment Trusts (REITs) 2.2% 9.9%
Independent Power Producers and
Energy Traders 0.6% 9.4%
Specialty Retail 0.1% 9.4%
Commercial Services and Supplies 0.4% 6.9%
Pharmaceuticals 2.1% 6.1%
IT Services 0.8% 5.6%
Insurance 8.6% 5.3%
Machinery 0.1% 5.3%
Airlines 0.3% 5.2%
Media 3.2% 5.0%
Chemicals 2.7% 4.7%
Sub-Sector Index Fund
Oil, Gas and Consumable Fuels 8.2% 14.4%
Commercial Banks 2.8% 13.0%
Real Estate Investment Trusts (REITs) 1.9% 9.9%
Independent Power Producers and
Energy Traders 0.1% 9.4%
Specialty Retail 2.3% 9.4%
Commercial Services and Supplies 0.5% 6.9%
Pharmaceuticals 5.7% 6.1%
IT Services 3.8% 5.6%
Insurance 3.0% 5.3%
Machinery 1.7% 5.3%
Airlines 0.2% 5.2%
Media 3.7% 5.0%
Chemicals 2.5% 4.7%

Risk & Return
Note: assuming Fortis is sold and U.S. stocks are purchased
Beta 1.10
Variance 5.5%
Expected Return 11.0%
Sharpe 0.35
NA & BNS 0.66
SU & CCO 0.57
AGCO & AGU 0.53
SU & AGU 0.51
Canadian
Equities
74.9%
U.S.
Equities
25.1%
Total Return Breakdown by Listing Country
Correlation Analysis
Cumulative NAV Return
(5.0%)
-
5.0%
10.0%
15.0%
20.0%
25.0%
Jul-12 Sep-12 Nov-12 Jan-13 Mar-13 May-13 Jul-13 Sep-13 Nov-13
Fund Benchmark

Pipeline of Initiatives
38
Factor Analysis Analyst Sector
Allocation Executive Transition
Capital IQ Templates Alerts

Industry Mentors
39
Mike Williams Jin Li
Dan Lavric Lu Jiang
Niall Glynn Aly Hadibhai
Ohad Lederer
Kevin Huynh
Simon Kwan
David Middleton
Dorena Tu
Meng Wang
Ian Gutwinski Derek Chu
Ray Wan Joey Zhang
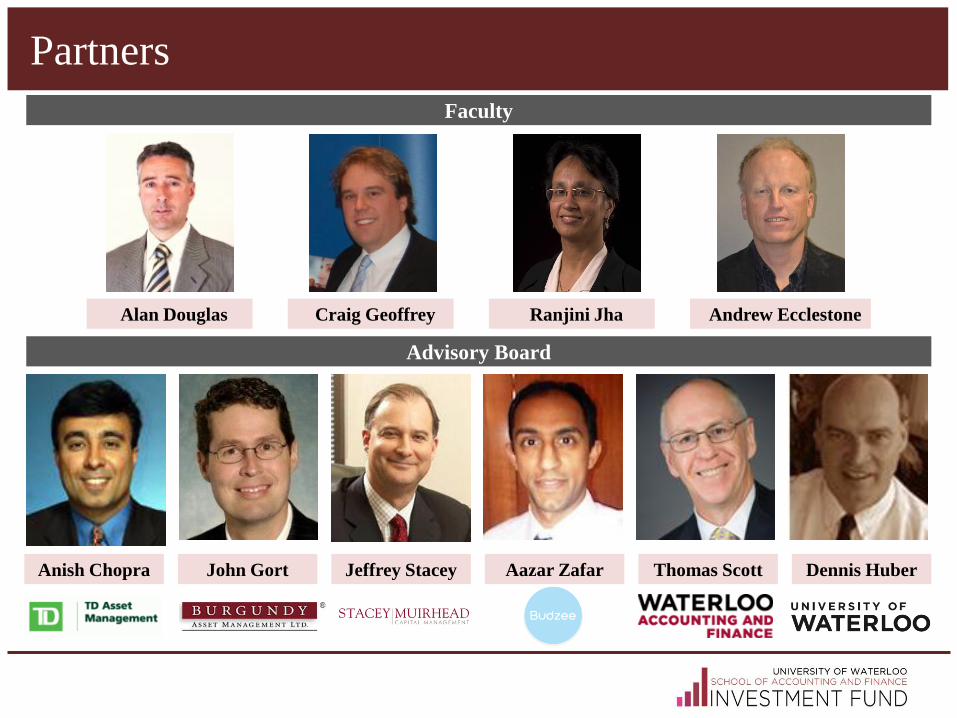
Partners
Faculty
Alan Douglas Craig Geoffrey Ranjini Jha Andrew Ecclestone
Advisory Board
Anish Chopra John Gort Jeffrey Stacey Aazar Zafar Thomas Scott Dennis Huber
Final Questions

Click to edit Master title style
APPENDIX
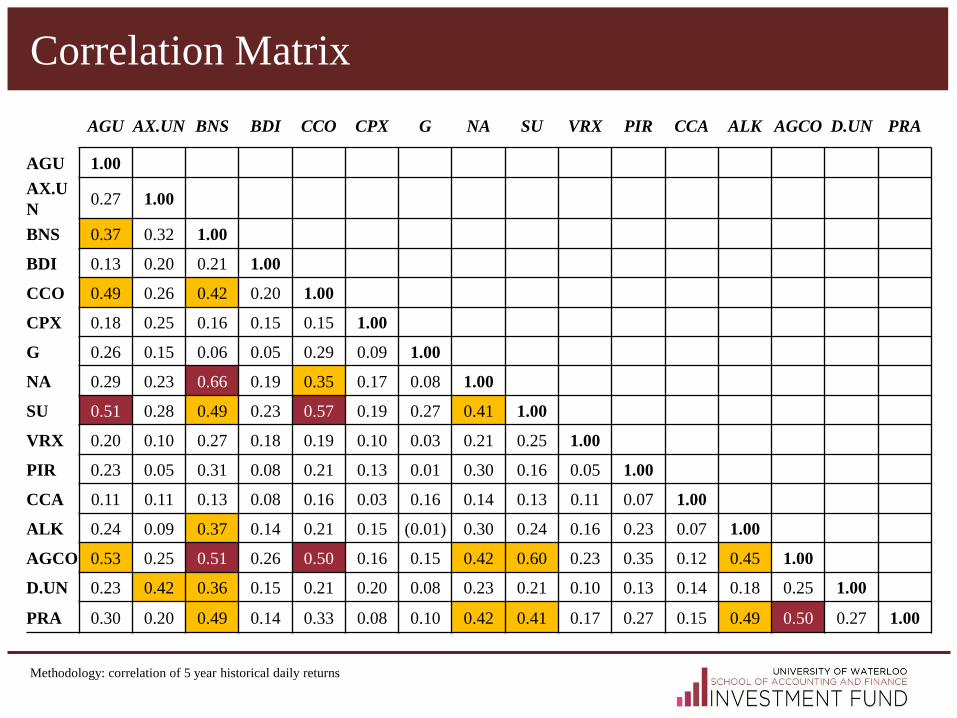
Correlation Matrix
AGU AX.UN BNS BDI CCO CPX G NA SU VRX PIR CCA ALK AGCO D.UN PRA
AGU 1.00
AX.U
N 0.27 1.00
BNS 0.37 0.32 1.00
BDI 0.13 0.20 0.21 1.00
CCO 0.49 0.26 0.42 0.20 1.00
CPX 0.18 0.25 0.16 0.15 0.15 1.00
G 0.26 0.15 0.06 0.05 0.29 0.09 1.00
NA 0.29 0.23 0.66 0.19 0.35 0.17 0.08 1.00
SU 0.51 0.28 0.49 0.23 0.57 0.19 0.27 0.41 1.00
VRX 0.20 0.10 0.27 0.18 0.19 0.10 0.03 0.21 0.25 1.00
PIR 0.23 0.05 0.31 0.08 0.21 0.13 0.01 0.30 0.16 0.05 1.00
CCA 0.11 0.11 0.13 0.08 0.16 0.03 0.16 0.14 0.13 0.11 0.07 1.00
ALK 0.24 0.09 0.37 0.14 0.21 0.15 (0.01) 0.30 0.24 0.16 0.23 0.07 1.00
AGCO 0.53 0.25 0.51 0.26 0.50 0.16 0.15 0.42 0.60 0.23 0.35 0.12 0.45 1.00
D.UN 0.23 0.42 0.36 0.15 0.21 0.20 0.08 0.23 0.21 0.10 0.13 0.14 0.18 0.25 1.00
PRA 0.30 0.20 0.49 0.14 0.33 0.08 0.10 0.42 0.41 0.17 0.27 0.15 0.49 0.50 0.27 1.00
Methodology: correlation of 5 year historical daily returns
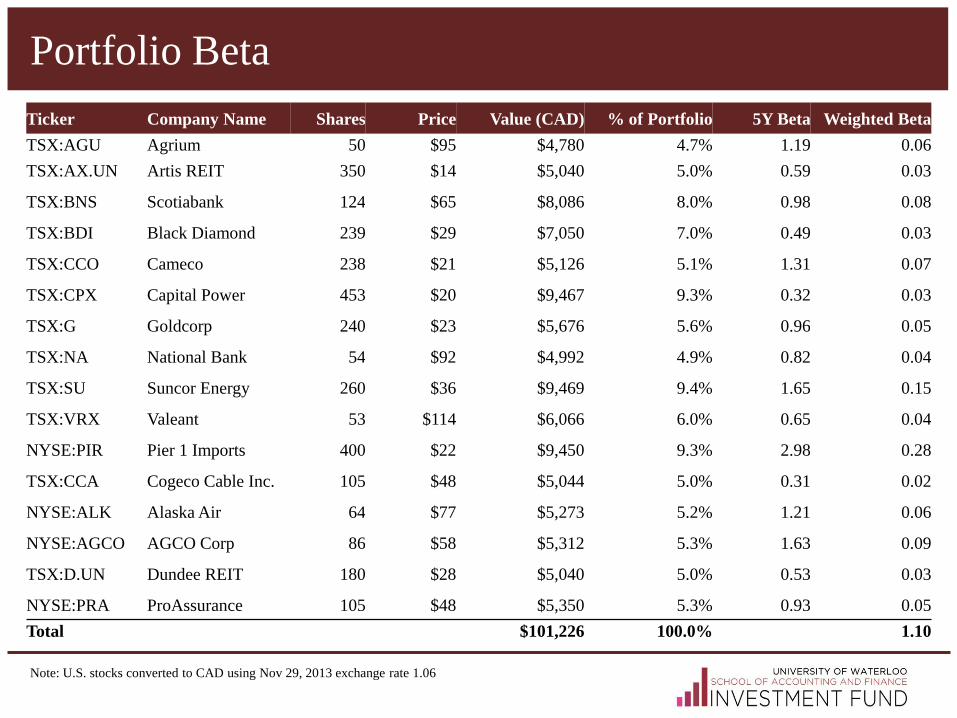
Portfolio Beta
Note: U.S. stocks converted to CAD using Nov 29, 2013 exchange rate 1.06
Ticker Company Name Shares Price Value (CAD) % of Portfolio 5Y Beta Weighted Beta
TSX:AGU Agrium 50 $95 $4,780 4.7% 1.19 0.06
TSX:AX.UN Artis REIT 350 $14 $5,040 5.0% 0.59 0.03
TSX:BNS Scotiabank 124 $65 $8,086 8.0% 0.98 0.08
TSX:BDI Black Diamond 239 $29 $7,050 7.0% 0.49 0.03
TSX:CCO Cameco 238 $21 $5,126 5.1% 1.31 0.07
TSX:CPX Capital Power 453 $20 $9,467 9.3% 0.32 0.03
TSX:G Goldcorp 240 $23 $5,676 5.6% 0.96 0.05
TSX:NA National Bank 54 $92 $4,992 4.9% 0.82 0.04
TSX:SU Suncor Energy 260 $36 $9,469 9.4% 1.65 0.15
TSX:VRX Valeant 53 $114 $6,066 6.0% 0.65 0.04
NYSE:PIR Pier 1 Imports 400 $22 $9,450 9.3% 2.98 0.28
TSX:CCA Cogeco Cable Inc. 105 $48 $5,044 5.0% 0.31 0.02
NYSE:ALK Alaska Air 64 $77 $5,273 5.2% 1.21 0.06
NYSE:AGCO AGCO Corp 86 $58 $5,312 5.3% 1.63 0.09
TSX:D.UN Dundee REIT 180 $28 $5,040 5.0% 0.53 0.03
NYSE:PRA ProAssurance 105 $48 $5,350 5.3% 0.93 0.05
Total $101,226 100.0% 1.10