advice letter 4136-e subject: implementation of southern ......advice 4136-e (u 338-e) - 5 -...
TRANSCRIPT

STATE OF CALIFORNIA GAVIN NEWSOM, Governor
PUBLIC UTILITIES COMMISSION
505 VAN NESS AVENUE
SAN FRANCISCO, CA 94102-3298
February 6, 2020
Advice Letter 4136-E
Gary A. Stern
Director, State Regulatory Operations
Southern California Edison Company
8631 Rush Street
Rosemead, CA 91770
SUBJECT: Implementation of Southern California Edison Company's 2020
Authorized Cost of Capital in Compliance with Decision 19-12-056
Dear Mr. Stern:
Advice Letter 4136-E is effective as of January 1, 2020.
Sincerely,
Edward Randolph
Deputy Executive Director for Energy and Climate Policy/
Director, Energy Division

P.O. Box 800 8631 Rush Street Rosemead, California 91770 (626) 302-9645 Fax (626) 302-6396
Gary A. Stern, Ph.D. Managing Director, State Regulatory Operations
December 26, 2019
ADVICE 4136-E (U 338-E)
PUBLIC UTILITIES COMMISSION OF THE STATE OF CALIFORNIA ENERGY DIVISION
SUBJECT: Implementation of Southern California Edison Company’s 2020 Authorized Cost of Capital in Compliance with Decision 19-12-056
In compliance with California Public Utilities Commission (Commission or CPUC) Decision (D.)19-12-056, Decision on Test Year 2020 Cost of Capital For Major Energy Utilities, (Cost of Capital Decision), Southern California Edison Company (SCE) hereby submits the following update to its revenue requirement and changes to the associated tariffs. The revised tariff sheets are listed on Attachment A and are attached hereto.
PURPOSE
The purpose of this advice letter is to update SCE’s 2020 revenue requirement in compliance with Ordering Paragraph (OP) 8 of the Cost of Capital Decision.1 SCE also updates the associated tariffs (i.e., Preliminary Statements) in accordance with the Cost of Capital Decision.
1 OP 8 of the Cost of Capital Decision requires the SCE, Pacific Gas and Electric Company,
and San Diego Gas & Electric Company to “implement the revenue requirement changes authorized by this decision in their respective end-of-the-year consolidated revenue requirement Tier 1 advice letter filings, also referred to as Annual Electric True-Ups or Annual Gas True-Ups, for effective dates no earlier than January 1, 2020.” As described in SCE’s Opening Comments on the 2020 Cost of Capital Proposed Decision, it takes approximately five weeks to conduct the necessary testing and system updates in order to implement a rate change. Accordingly, although SCE will be submitting an advice letter (this instant advice letter) by January 1, 2020 to reflect the revised revenue requirement reflecting the final Cost of Capital Decision, SCE will not reflect these changes in rates until April 2020 when it removes the 2018 Energy Resource Recover Account (ERRA) undercollection per D.19-01-045.

ADVICE 4136-E (U 338-E) - 2 - December 26, 2019
BACKGROUND
SCE filed its 2020 cost of capital application, A.19-04-014, on April 22, 2019. On December 19, 2019, the Commission approved D.19-12-056 establishing SCE’s 2020 authorized rate of return on rate base at 7.68 percent.2 This advice letter updates the 2020 CPUC-jurisdictional General Rate Case (GRC) Authorized Base Revenue Requirement (ABRR) and the GRC authorized revenue requirement for the Pole Loading and Deteriorated Poles Program. In this advice letter, SCE also updates the 2020 revenue requirements for the Charge Ready Phase 1 Pilot, the Transportation Electrification Portfolio Priority Review and Standard Review projects, and the Aliso Canyon Utility Owned Energy Storage systems.
2020 CPUC-JURISDICTIONAL REVENUE REQUIREMENTS
SCE has calculated its 2020 ABRR using the 7.68 percent rate of return adopted in D.19-12-056. Table 1 below shows SCE’s functionalized 2020 ABRR to be effective on January 1, 2020. As shown in Table 1, the revised 2020 ABRR is $5.898 billion.3 Beginning on January 1, 2020, SCE will recover this ABRR through the operation of the Base Revenue Requirement Balancing Account (BRRBA), the New System Generation Balancing Account (NSGBA) and the Portfolio Allocation Balancing Account (PABA).
2 D.19-12-056, OP 1, p. 54. 3 SCE submitted Advice 4103-E on November 5, 2019, implementing a 2020 Post-Test Year
revenue requirement of $5,859.714 million.
TABLE 12020 GRC Adopted Revenue Requirement - Functionalized
Thousands of DollarsLine No. Item Distribution
New System Generation Generation Total
1. Base Revenues 5,143,140 56,963 697,419 5,897,522
2. Expenses:3. Operation & Maintenance 1,492,925 13,580 328,287 1,834,7914. Depreciation 1,570,925 15,062 173,143 1,759,1305. Taxes 449,797 11,051 36,871 497,7196. Revenue Credits (156,702) – (1,963) (158,666)7. Total Expenses 3,356,943 39,693 536,338 3,932,975
8. Net Operating Revenue 1,786,197 17,270 161,081 1,964,547
9. Rate Base 23,781,514 224,887 2,097,623 26,104,024
10. Rate of Return 7.51% 7.68% 7.68% 7.53%
ADVICE 4136-E (U 338-E) - 3 - December 26, 2019
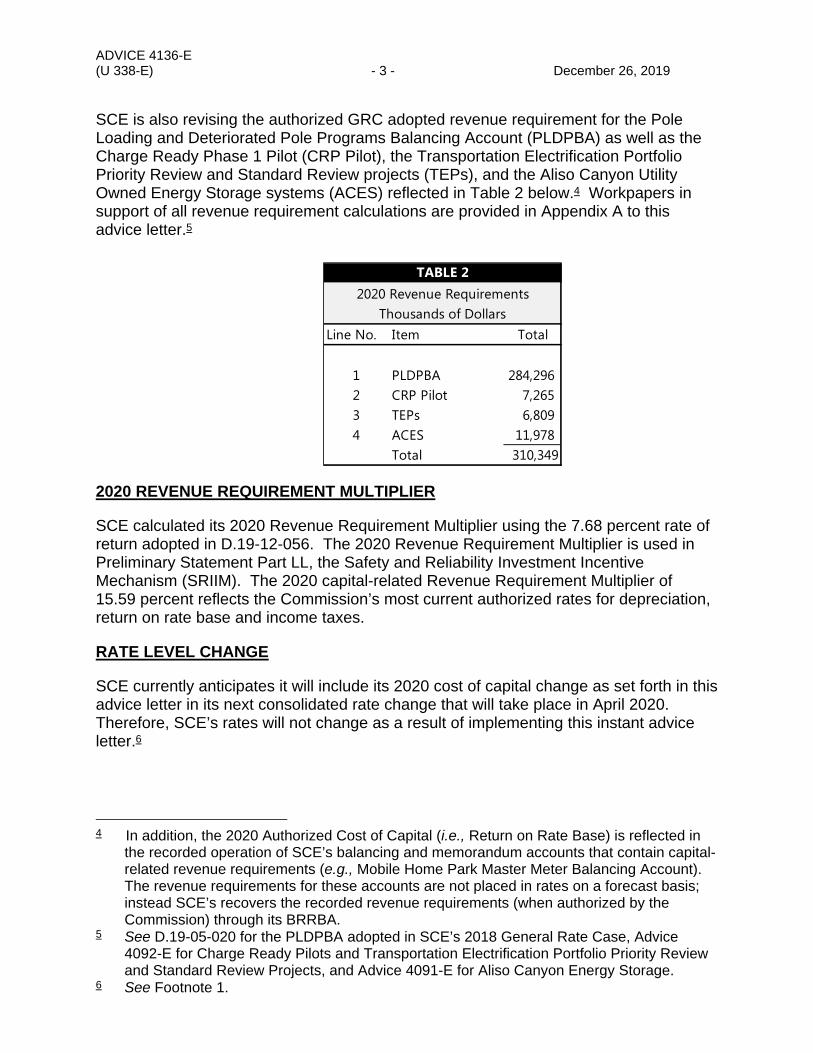
SCE is also revising the authorized GRC adopted revenue requirement for the Pole Loading and Deteriorated Pole Programs Balancing Account (PLDPBA) as well as the Charge Ready Phase 1 Pilot (CRP Pilot), the Transportation Electrification Portfolio Priority Review and Standard Review projects (TEPs), and the Aliso Canyon Utility Owned Energy Storage systems (ACES) reflected in Table 2 below.4 Workpapers in support of all revenue requirement calculations are provided in Appendix A to this advice letter.5
2020 REVENUE REQUIREMENT MULTIPLIER
SCE calculated its 2020 Revenue Requirement Multiplier using the 7.68 percent rate of return adopted in D.19-12-056. The 2020 Revenue Requirement Multiplier is used in Preliminary Statement Part LL, the Safety and Reliability Investment Incentive Mechanism (SRIIM). The 2020 capital-related Revenue Requirement Multiplier of 15.59 percent reflects the Commission’s most current authorized rates for depreciation, return on rate base and income taxes.
RATE LEVEL CHANGE
SCE currently anticipates it will include its 2020 cost of capital change as set forth in this advice letter in its next consolidated rate change that will take place in April 2020. Therefore, SCE’s rates will not change as a result of implementing this instant advice letter.6
4 In addition, the 2020 Authorized Cost of Capital (i.e., Return on Rate Base) is reflected in
the recorded operation of SCE’s balancing and memorandum accounts that contain capital-related revenue requirements (e.g., Mobile Home Park Master Meter Balancing Account). The revenue requirements for these accounts are not placed in rates on a forecast basis; instead SCE’s recovers the recorded revenue requirements (when authorized by the Commission) through its BRRBA.
5 See D.19-05-020 for the PLDPBA adopted in SCE’s 2018 General Rate Case, Advice 4092-E for Charge Ready Pilots and Transportation Electrification Portfolio Priority Review and Standard Review Projects, and Advice 4091-E for Aliso Canyon Energy Storage.
6 See Footnote 1.
Line No. Item Total
1 PLDPBA 284,2962 CRP Pilot 7,2653 TEPs 6,8094 ACES 11,978
Total 310,349
TABLE 22020 Revenue Requirements
Thousands of Dollars

ADVICE 4136-E (U 338-E) - 4 - December 26, 2019
PROPOSED TARIFF CHANGES In accordance with the Cost of Capital Decision, SCE modifies the following tariffs to implement the authorized 2020 Cost of Capital:
1. Preliminary Statement Part YY, BRRBA, to reflect the updated GRC distribution revenue requirement;
2. Preliminary Statement Part WW, PABA, to reflect the updated Utility Owned Generation (UOG) revenue requirement;
3. Preliminary Statement Part RR, NSGBA, to reflect the updated New System Generation (i.e., peakers) revenue requirement;
4. Preliminary Statement Part J, PLDPBA, to reflect the updated Pole Loading and Deteriorated Poles Program revenue requirement;
5. Preliminary Statement Part LL, SRIIM, to reflect the updated revenue requirement multiplier; and
6. Preliminary Statement Part CCC, Cost of Capital Mechanism; to reflect the authorized cost of capital components.
This advice letter will not increase any rate or charge, cause the withdrawal of service, or conflict with any other schedule or rule. TIER DESIGNATION
Pursuant to OP 8 of D.19-12-056, this advice letter is submitted with a Tier 1 designation.
EFFECTIVE DATE
In accordance with D.19-12-056, the changes submitted in this advice letter will become effective on January 1, 2020.
NOTICE
Anyone wishing to protest this advice letter may do so by letter via U.S. Mail, facsimile, or electronically, any of which must be received no later than 20 days after the date of this advice letter. Protests should be submitted to:
CPUC, Energy Division Attention: Tariff Unit 505 Van Ness Avenue, 4th Floor San Francisco, California 94102 Facsimile: (415) 703-2200 E-mail: [email protected]
Copies of protests should also be mailed to the attention of the Director, Energy Division, Room 4004, at the address shown above.

ADVICE 4136-E (U 338-E) - 5 - December 26, 2019
The protest and all other correspondence regarding this advice letter should also be sent by letter and transmitted via facsimile or electronically to the attention of:
Gary A. Stern, Ph.D. Managing Director, State Regulatory Operations Southern California Edison Company 8631 Rush Street Rosemead, California 91770
Telephone: (626) 302-9645 Facsimile: (626) 302-6396 E-mail: [email protected] Laura Genao Managing Director, State Regulatory Affairs c/o Karyn Gansecki Southern California Edison Company 601 Van Ness Avenue, Suite 2030 San Francisco, California 94102 Facsimile: (415) 929-5544 E-mail: [email protected]
There are no restrictions on who may submit a protest, but the protest shall set forth specifically the grounds upon which it is based and must be received by the deadline shown above.
In accordance with General Rule 4 of General Order (GO) 96-B, SCE is serving copies of this advice letter to the interested parties shown on the attached GO 96-B and A.19-04-014 service lists. Address change requests to the GO 96-B service list should be directed by electronic mail to [email protected] or at (626) 302-3719. For changes to all other service lists, please contact the CPUC’s Process Office at (415) 703-2021 or by electronic mail at [email protected].

ADVICE 4136-E (U 338-E) - 6 - December 26, 2019
Further, in accordance with Public Utilities Code Section 491, notice to the public is hereby given by submitting and keeping the advice letter at SCE’s corporate headquarters. To view other SCE advice letters submitted with the CPUC, log on to SCE’s web site at https://www.sce.com/wps/portal/home/regulatory/advice-letters.
For questions, please contact Shiela Linao at (626) 302-4506 or by electronic mail at [email protected] or Douglas Tessler at (626) 302-1108 or by electronic mail at [email protected].
Southern California Edison Company
/s/ Gary A. Stern Gary A. Stern, Ph.D.
GAS:sl:cm Enclosures

ADVICE LETTER S U M M A R YENERGY UTILITY
Company name/CPUC Utility No.:
Utility type:Phone #:
EXPLANATION OF UTILITY TYPE
ELC GAS
PLC HEAT
MUST BE COMPLETED BY UTILITY (Attach additional pages as needed)
Advice Letter (AL) #:
WATERE-mail: E-mail Disposition Notice to:
Contact Person:
ELC = ElectricPLC = Pipeline
GAS = GasHEAT = Heat WATER = Water
(Date Submitted / Received Stamp by CPUC)
Subject of AL:
Tier Designation:
Keywords (choose from CPUC listing):AL Type: Monthly Quarterly Annual One-Time Other:If AL submitted in compliance with a Commission order, indicate relevant Decision/Resolution #:
Does AL replace a withdrawn or rejected AL? If so, identify the prior AL:
Summarize differences between the AL and the prior withdrawn or rejected AL:
Confidential treatment requested? Yes NoIf yes, specification of confidential information:Confidential information will be made available to appropriate parties who execute a nondisclosure agreement. Name and contact information to request nondisclosure agreement/access to confidential information:
Resolution required? Yes No
Requested effective date: No. of tariff sheets:
Estimated system annual revenue effect (%):
Estimated system average rate effect (%):
When rates are affected by AL, include attachment in AL showing average rate effects on customer classes (residential, small commercial, large C/I, agricultural, lighting).
Tariff schedules affected:
Service affected and changes proposed1:
Pending advice letters that revise the same tariff sheets:
1Discuss in AL if more space is needed.

CPUC, Energy DivisionAttention: Tariff Unit505 Van Ness AvenueSan Francisco, CA 94102 Email: [email protected]
Protests and all other correspondence regarding this AL are due no later than 20 days after the date of this submittal, unless otherwise authorized by the Commission, and shall be sent to:
Name:Title:Utility Name:Address:City:State:Telephone (xxx) xxx-xxxx:Facsimile (xxx) xxx-xxxx:Email:
Name:Title:Utility Name:Address:City:State:Telephone (xxx) xxx-xxxx: Facsimile (xxx) xxx-xxxx:Email:
Zip:
Zip:

ENERGY Advice Letter Keywords
Affiliate Direct Access Preliminary StatementAgreements Disconnect Service ProcurementAgriculture ECAC / Energy Cost Adjustment Qualifying FacilityAvoided Cost EOR / Enhanced Oil Recovery RebatesBalancing Account Energy Charge RefundsBaseline Energy Efficiency ReliabilityBilingual Establish Service Re-MAT/Bio-MATBillings Expand Service Area Revenue AllocationBioenergy Forms Rule 21Brokerage Fees Franchise Fee / User Tax RulesCARE G.O. 131-D Section 851CPUC Reimbursement Fee GRC / General Rate Case Self GenerationCapacity Hazardous Waste Service Area MapCogeneration Increase Rates Service OutageCompliance Interruptible Service SolarConditions of Service Interutility Transportation Standby ServiceConnection LIEE / Low-Income Energy Efficiency StorageConservation LIRA / Low-Income Ratepayer Assistance Street LightsConsolidate Tariffs Late Payment Charge SurchargesContracts Line Extensions TariffsCore Memorandum Account TaxesCredit Metered Energy Efficiency Text ChangesCurtailable Service Metering TransformerCustomer Charge Mobile Home Parks Transition CostCustomer Owned Generation Name Change Transmission LinesDecrease Rates Non-Core Transportation ElectrificationDemand Charge Non-firm Service Contracts Transportation RatesDemand Side Fund Nuclear UndergroundingDemand Side Management Oil Pipelines Voltage DiscountDemand Side Response PBR / Performance Based Ratemaking Wind PowerDeposits Portfolio Withdrawal of ServiceDepreciation Power Lines
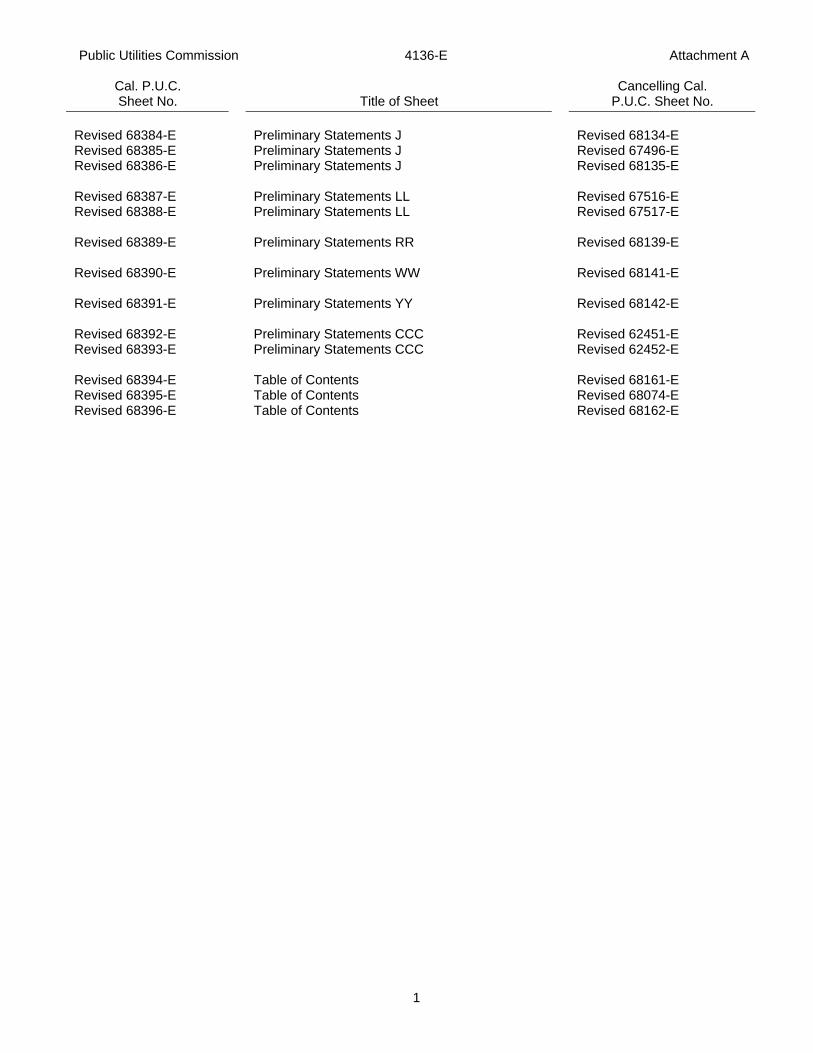
Public Utilities Commission 4136-E Attachment A
Cal. P.U.C. Sheet No. Title of Sheet
Cancelling Cal. P.U.C. Sheet No.
1
Revised 68384-E Preliminary Statements J Revised 68134-E Revised 68385-E Preliminary Statements J Revised 67496-E Revised 68386-E Preliminary Statements J Revised 68135-E Revised 68387-E Preliminary Statements LL Revised 67516-E Revised 68388-E Preliminary Statements LL Revised 67517-E Revised 68389-E Preliminary Statements RR Revised 68139-E Revised 68390-E Preliminary Statements WW Revised 68141-E Revised 68391-E Preliminary Statements YY Revised 68142-E Revised 68392-E Preliminary Statements CCC Revised 62451-E Revised 68393-E Preliminary Statements CCC Revised 62452-E Revised 68394-E Table of Contents Revised 68161-E Revised 68395-E Table of Contents Revised 68074-E Revised 68396-E Table of Contents Revised 68162-E

Southern California Edison Revised Cal. PUC Sheet No. 68384-E Rosemead, California (U 338-E) Cancelling Revised Cal. PUC Sheet No. 68134-E
PRELIMINARY STATEMENT Sheet 1
(Continued) (To be inserted by utility) Issued by (To be inserted by Cal. PUC) Advice 4136-E Carla Peterman Date Submitted Dec 26, 2019 Decision 19-12-056 Senior Vice President Effective Jan 1, 2020 1C13 Resolution
J. Pole Loading and Deteriorated Pole Programs Balancing Account
1. Purpose:
SCE’s Pole Programs are comprised of the Pole Loading Program and the Deteriorated Pole Program. The purpose of the two-way Pole Loading and Deteriorated Pole Balancing Account (PLDPBA) is to record the difference between: (1) recorded Capital-related revenue requirements for the Pole Loading and the Deteriorated Pole programs, (2) Operating Expenses for the Pole Loading Program, and (3) the Authorized Pole Programs Revenue Requirement as adopted in Decision (D.)19-05-020. All entries in the PLDPBA will be recorded on a CPUC-jurisdictional basis. Pursuant to D.19-05-020, the level of expenditures to be recovered in the PLDPBA in 2018, 2019, and 2020 is capped at 15% above authorized levels. The PLDPBA shall remain open until the Internal Revenue Service (IRS) and California Franchise Tax Board (CFTB) audit periods for tax years 2015-2017 and 2018-2020 are closed statutorily.
2. Definitions:
a. Authorized Pole Programs Revenue Requirement
The authorized Pole Programs Revenue Requirement is the amount adopted by the Commission in SCE’s 2018 General Rate Case D.19-05-020 as updated by the implementation of D.19-12-056, the decision that adopted SCE’s 2020 cost of capital. The post test year revenue requirement amounts shall be set forth in the Post Test Year (PTYR) Ratemaking advice letter submitted annually to the Commission by December 1.
$000 Effective Date Annual Authorized Revenue Requirement1
January 1, 2015 $ (59,146) January 1, 2016 $ 8,769 January 1, 2017 $ 36,025 January 1, 2018 $186,066 January 1, 2019 $230,029 January 1, 2020 $284,296
1.The authorized amount includes Franchise Fees & Uncollectibles (FF&U) expenses.
(T) | (T) (T)

Southern California Edison Revised Cal. PUC Sheet No. 68385-E Rosemead, California (U 338-E) Cancelling Revised Cal. PUC Sheet No. 67496-E
PRELIMINARY STATEMENT Sheet 3
(Continued)
(Continued) (To be inserted by utility) Issued by (To be inserted by Cal. PUC) Advice 4136-E Carla Peterman Date Submitted Dec 26, 2019 Decision 19-12-056 Senior Vice President Effective Jan 1, 2020 3C13 Resolution
J. Pole Loading and Deteriorated Pole Programs Balancing Account (Continued)
2. Definitions: (Continued)
d. The Interest Rate shall be one-twelfth of the Federal Reserve three-month Commercial Paper Rate – Non-Financial, from Federal Reserve Statistical Release H.15 (expressed as an annual rate). If in any month a non-financial rate is not published, SCE shall use the Federal Reserve three-month Commercial Paper Rate – Financial.
e. Monthly Distribution Percentages The Monthly Distribution Percentages (MDPs) applicable to the PLDPBA
authorized funding levels shall be the distribution MDPs included in Preliminary Statement YY, Base Revenue Requirement Balancing Account (BRRBA).
f. Rate of Return on Rate Base The rate of return on SCE’s rate base shall be the currently authorized rate of
return adopted in D.19-12-056.
3. Operation of the PLDPBA:
Entries in the PLDPBA shall be made on a monthly basis as follows: a. Debit entry equal to recorded capital-related revenue requirement; b. Plus: debit entry equal to recorded Operating Expenses; c. Less: Authorized Pole Programs Revenue Requirement less a provision for
Franchise Fees & Uncollectibles (FF&U) based on the FF&U rate adopted in D.19-05-020, multiplied by the distribution MDP found in the BRRBA Preliminary Statement;
d. Equals: the monthly (Over)/Under Collection.
Interest shall accrue monthly to the PLDPBA by applying the Interest Rate to the average of the beginning of month and end of month balance in the PLDPBA.
(T)

Southern California Edison Revised Cal. PUC Sheet No. 68386-E Rosemead, California (U 338-E) Cancelling Revised Cal. PUC Sheet No. 68135-E
PRELIMINARY STATEMENT Sheet 4
(Continued)
(Continued) (To be inserted by utility) Issued by (To be inserted by Cal. PUC) Advice 4136-E Carla Peterman Date Submitted Dec 26, 2019 Decision 19-12-056 Senior Vice President Effective Jan 1, 2020 4C13 Resolution
J. Pole Loading and Deteriorated Pole Programs Balancing Account (Continued)
4. Tracking Account:
The PLDPBA tracking account sets forth the authorized O&M (Pole Loading only) and capital expenditures (Pole Loading and Deteriorated Poles) for 2018, 2019 and 2020. SCE may only recover the annual revenue requirements associated with up to 15% above the authorized O&M and capital expenditure amounts in 2018, 2019 and 2020 as set forth in the table below. To determine the authorized capital expenditures for 2018, 2019, and 2020, SCE shall escalate the 2018 authorized capital expenditure amount by 2.49% per year consistent with the authorized Post Test Year ratemaking mechanism’s escalation of capital additions by 2.49% per year.
PLDPBA 2018 GRC Authorized CPUC Jurisdictional
Nominal $000 2018 2019 2020 O&M 28,106 28,745 29,253 Deteriorated Poles 165,614 169,737 173,964 Pole Loading 182,716 187,265 191,928
Capital Expenditures 348,330 357,002 365,892
5. Disposition:
SCE shall transfer on an annual basis any (over)/undercollection in the PLDPBA to the distribution subaccount in the Base Revenue Requirement Balancing Account as of December 31st to be returned to or recovered from customers. If an undercollection is determined, SCE may only recover the annual revenue requirements associated with up to 15% above the authorized O&M and capital expenditure amounts for 2018, 2019, and 2020 adopted in D.19-05-020.
(T) (P) | | (P)

Southern California Edison Revised Cal. PUC Sheet No. 68387-E Rosemead, California (U 338-E) Cancelling Revised Cal. PUC Sheet No. 67516-E
PRELIMINARY STATEMENT Sheet 7
(Continued)
(Continued) (To be inserted by utility) Issued by (To be inserted by Cal. PUC) Advice 4136-E Carla Peterman Date Submitted Dec 26, 2019 Decision 19-12-056 Senior Vice President Effective Jan 1, 2020 7C11 Resolution
LL. Safety and Reliability Investment Incentive Mechanism (SRIIM) (Continued)
2. Definitions (Continued) i. Interest Rate
The Interest Rate shall be the most recent annual interest rate on three month Financial or Non-financial Commercial Paper rate (prime, three months) published monthly in the Federal Reserve Statistical Release H.15, whichever is available on the first day of the month.
j. CPUC Jurisdictional Factor
The distribution O&M-related CPUC jurisdictional factor reflected in D.19-05-020 is 99.29 percent.
k. Revenue Requirement Multiplier
The Revenue Requirement Multiplier shall reflect SCE’s most current Commission-authorized factors that are used in calculating a capital-related revenue requirement including depreciation rates, rate of return on rate base, and income tax rates. For 2018 and 2019, the annual Revenue Requirement Multiplier shall be set at 15.45 percent. For 2020, the annual Revenue Requirement Multiplier shall be set at 15.59 percent.
l. Effective Date
The effective date of SRIIM is January 1, 2018.
3. Determining a Capital Related SRIIM Base Revenue Requirement Reduction Amount
If a calculation of 2018 – 2020 SRIIM Capital Additions base revenue requirement reduction amount is necessary, that is if a Capital Additions cumulative shortfall exists, the base revenue requirement reduction amount shall be determined as follows:
a. The 2018 – 2020 recorded adjusted SRIIM Capital Additions cumulative shortfall
shall be allocated to each month during the period January 1, 2018 through December 31, 2020 evenly after it has been CPUC jurisdictionalized by applying the applicable distribution capital-related CPUC Jurisdictional Factor;
b. A monthly revenue requirement balance shall be determined for each month during
the period January 1, 2018 through December 31, 2020 by multiplying the monthly cumulative difference between the authorized and the adjusted recorded SRIIM Capital Additions by the applicable monthly Revenue Requirement Multiplier;
If SCE’s recorded 2018-2020 Capital Additions exceed authorized levels, SCE shall
not recover from customers any additional base revenue requirement associated with its recorded 2018-2020 Capital Additions;
(T) | (T) (L)

Southern California Edison Revised Cal. PUC Sheet No. 68388-E Rosemead, California (U 338-E) Cancelling Revised Cal. PUC Sheet No. 67517-E
PRELIMINARY STATEMENT Sheet 8
(Continued)
(To be inserted by utility) Issued by (To be inserted by Cal. PUC) Advice 4136-E Carla Peterman Date Submitted Dec 26, 2019 Decision 19-12-056 Senior Vice President Effective Jan 1, 2020 8C11 Resolution
LL. Safety and Reliability Investment Incentive Mechanism (SRIIM) (Continued) 3. Determining a Capital Related SRIIM Base …(Continued)
c. Monthly interest shall be added by applying the Interest Rate to the average of the beginning and ending monthly revenue requirement balances;
d. The Distribution-related revenue requirement shall be credited to the Distribution
Sub-account of the BRRBA to be returned to customers.
4. Determining SRIIM Employee Target Related Revenue Reduction Amount
If a calculation of the 2018 – 2020 SRIIM Employee Target positions reduction is necessary, that is the SRIIM Employee Target cumulative shortfall exists, the reduction amount shall be determined as follows: a. If SRIIM Employee Target net shortfall in positions is less than 50, multiply the
shortfall by $20,000. b. If SRIIM Employee Target net shortfall in positions is greater than 50, multiply the
difference between 50 and the amount greater than 50 by $80,000, plus $1,000,000.
c. The amount determined in (a) or (b) above shall be allocated each month during
the period January 1, 2018 through December 31, 2020 evenly. d. The monthly revenue requirement amount shall be CPUC jurisdictionalized by
applying the distribution O&M CPUC jurisdictional factor. e. Monthly interest shall be added by applying the Interest Rate to the average of the
beginning and ending monthly revenue requirement balances;
5. SRIIM Report By April 2021, SCE shall submit an advice letter to the Commission that reports SCE’s adjusted recorded SRIIM capital additions for calendar years 2018 through 2020 and includes support for the calculation of a base revenue requirement reduction amount (if any). The advice letter will include all necessary information and supporting workpapers for the Commission to review and approve SCE’s post test year SRIIM Capital Additions rate recovery. The advice letter will also include the recorded number of SRIIM Employee Target positions for calendar years 2018 through 2020 and shall include the SRIIM SCE Employee Target and include support for the calculation of a reduction amount (if any). If an employee shortfall develops in the fourth quarter of 2020, SCE will have the first quarter of 2021 to address the shortfall. SCE will inform the Commission by letter if it intends to utilize the timing modification. SCE will also include all necessary information and supporting workpapers for the Commission to review and approve.
(T) (L) | | | (L)

Southern California Edison Revised Cal. PUC Sheet No. 68389-E Rosemead, California (U 338-E) Cancelling Revised Cal. PUC Sheet No. 68139-E
PRELIMINARY STATEMENT Sheet 1
(Continued) (To be inserted by utility) Issued by (To be inserted by Cal. PUC) Advice 4136-E Carla Peterman Date Submitted Dec 26, 2019 Decision 19-12-056 Senior Vice President Effective Jan 1, 2020 1C11 Resolution
RR. NEW SYSTEM GENERATION BALANCING ACCOUNT (NSGBA)
The purpose of the New System Generation Balancing Account (NSGBA) is to record the benefits and costs of Power Purchase Agreements (PPAs) and SCE owned peaker generation unit associated with new generation resources pursuant to D. 07-09-044, D.06-07-029, and D.09-03-031, and the Sutter PPA pursuant to Resolution E-4471. Sub-accounts shall be established in the NSGBA for each PPA associated with a new generation resource. 1. Definitions:
a. Authorized Peaker Generation Revenue Requirement
2009 APGRR ($000): $63,643 Effective: January 1, 2009: 2010 APGRR ($000) $66,348 Effective January 1, 2010 2011 APGRR ($000) $69,234 Effective January 1, 2011 2012 APGRR ($000) $64,593 Effective January 1, 2012* 2013 APGRR ($000) $58,736 Effective January 1, 2013* 2014 APGRR ($000) $61,070 Effective January 1, 2014* 2014 APGRR ($000) $76,337 Effective July 1, 2014* 2015 APGRR ($000) $57,905 Effective January 1, 2015 2016 APGRR ($000) $57,635 Effective January 1, 2016 2017 APGRR ($000) $56,525 Effective January 1, 2017 2018 APGRR ($000) $56,938 Effective January 1, 2018
2019 APGRR ($000) $56,639 Effective January 1, 2019
2020 APGRR ($000) $56,963
Effective January 1, 2020
(T) (T)
*Revenue requirements before revision in August 2014 were $64,730 thousand for 2012, $58,838 thousand for 2013 and $ 61,054 thousand for 1/1/2014 and $76,318 thousand for 7/1/2014.

Southern California Edison Revised Cal. PUC Sheet No. 68390-E Rosemead, California (U 338-E) Cancelling Revised Cal. PUC Sheet No. 68141-E
PRELIMINARY STATEMENT Sheet 4
(Continued)
(Continued) (To be inserted by utility) Issued by (To be inserted by Cal. PUC) Advice 4136-E Carla Peterman Date Submitted Dec 26, 2019 Decision 19-12-056 Senior Vice President Effective Jan 1, 2020 4C13 Resolution
WW. Portfolio Allocation Balancing Account (PABA) (Continued)
2. Definitions: (Continued)
g. Authorized Generation Base Revenue Requirement: The Authorized
Generation Base Revenue Requirement (AGBRR) is the most current Commission GRC-authorized Generation-related base revenue requirement.The current AGBRR is listed below:
Year AGBRR ($000) Decision 2019 2020
$665.880 $697.419
D.19-05-020 D.19-12-056
(T) (T)
Southern California Edison Revised Cal. PUC Sheet No. 68391-E Rosemead, California (U 338-E) Cancelling Revised Cal. PUC Sheet No. 68142-E
PRELIMINARY STATEMENT Sheet 1
(Continued) (To be inserted by utility) Issued by (To be inserted by Cal. PUC) Advice 4136-E Carla Peterman Date Submitted Dec 26, 2019 Decision 19-12-056 Senior Vice President Effective Jan 1, 2020 1C13 Resolution
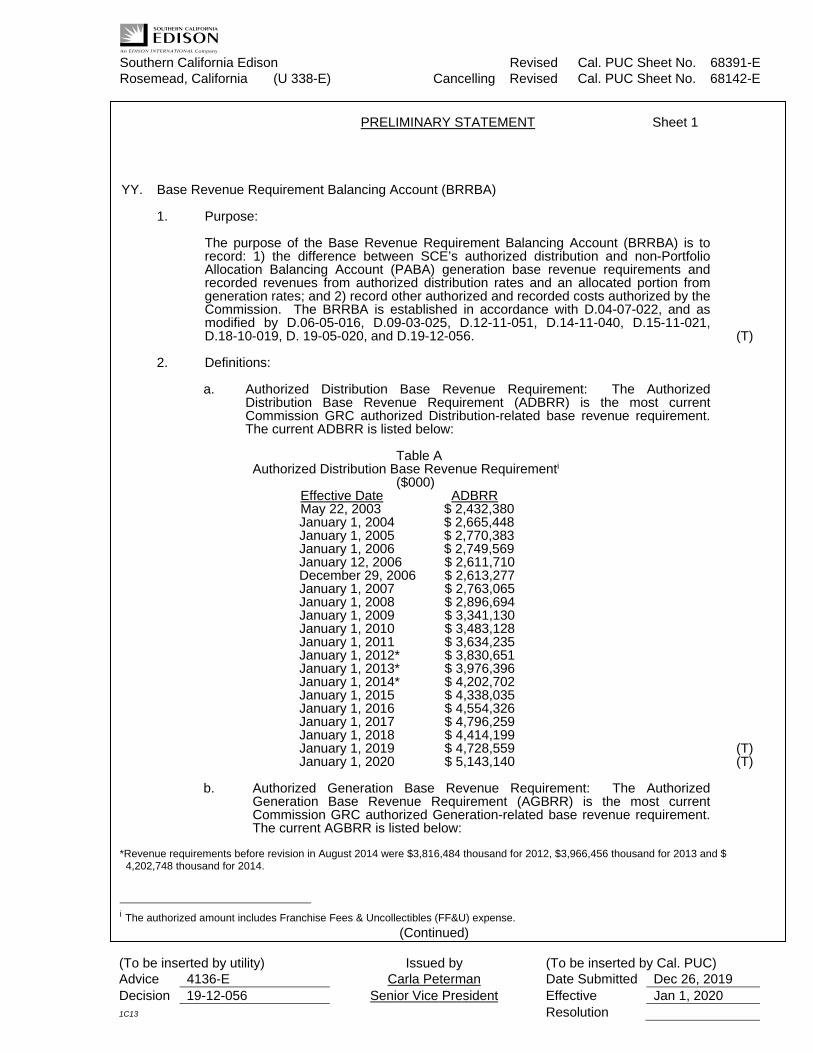
YY. Base Revenue Requirement Balancing Account (BRRBA)
1. Purpose: The purpose of the Base Revenue Requirement Balancing Account (BRRBA) is to record: 1) the difference between SCE’s authorized distribution and non-Portfolio Allocation Balancing Account (PABA) generation base revenue requirements and recorded revenues from authorized distribution rates and an allocated portion from generation rates; and 2) record other authorized and recorded costs authorized by the Commission. The BRRBA is established in accordance with D.04-07-022, and as modified by D.06-05-016, D.09-03-025, D.12-11-051, D.14-11-040, D.15-11-021, D.18-10-019, D. 19-05-020, and D.19-12-056.
2. Definitions:
a. Authorized Distribution Base Revenue Requirement: The Authorized Distribution Base Revenue Requirement (ADBRR) is the most current Commission GRC authorized Distribution-related base revenue requirement. The current ADBRR is listed below:
Table A Authorized Distribution Base Revenue Requirementi ($000)
Effective Date ADBRR May 22, 2003 $ 2,432,380 January 1, 2004 $ 2,665,448 January 1, 2005 $ 2,770,383 January 1, 2006 $ 2,749,569 January 12, 2006 $ 2,611,710 December 29, 2006 $ 2,613,277 January 1, 2007 $ 2,763,065 January 1, 2008 $ 2,896,694 January 1, 2009 $ 3,341,130 January 1, 2010 $ 3,483,128 January 1, 2011 $ 3,634,235 January 1, 2012* $ 3,830,651 January 1, 2013* $ 3,976,396 January 1, 2014* $ 4,202,702 January 1, 2015 $ 4,338,035 January 1, 2016 $ 4,554,326 January 1, 2017 $ 4,796,259 January 1, 2018 $ 4,414,199 January 1, 2019 $ 4,728,559 January 1, 2020 $ 5,143,140
b. Authorized Generation Base Revenue Requirement: The Authorized Generation Base Revenue Requirement (AGBRR) is the most current Commission GRC authorized Generation-related base revenue requirement. The current AGBRR is listed below:
(T)
(T) (T)
*Revenue requirements before revision in August 2014 were $3,816,484 thousand for 2012, $3,966,456 thousand for 2013 and $
4,202,748 thousand for 2014.
i The authorized amount includes Franchise Fees & Uncollectibles (FF&U) expense.

Southern California Edison Revised Cal. PUC Sheet No. 68392-E Rosemead, California (U 338-E) Cancelling Revised Cal. PUC Sheet No. 62451-E
PRELIMINARY STATEMENT Sheet 1
(Continued) (To be inserted by utility) Issued by (To be inserted by Cal. PUC) Advice 4136-E Carla Peterman Date Submitted Dec 26, 2019 Decision 19-12-056 Senior Vice President Effective Jan 1, 2020 1C13 Resolution
CCC. COST OF CAPITAL MECHANISM (CCM) 1. Purpose.
The purpose of the Cost of Capital Mechanism (CCM) is to adjust SCE’s authorized cost of capital (return on equity, preferred stock and long-term debt rates) for changes in interest rates between cost of capital applications pursuant to Decision (D.) 08-05-035, D.13-03-015, D.16-02-019, D.17-07-005, and D.19-12-056.
2. Applicability.
The CCM was established by D.08-05-035 effective May 29, 2008 and will be effective until terminated by further action of the Commission.
3. Definitions. a. Authorized Return on Equity
The authorized return on equity for 2013 is 10.45 percent as approved in D.12-12-034. The Authorized Return on Equity shall be equal to the preceding year’s authorized Return on Equity adjusted by the Return on Equity Adjustment as described in Section 4 below. A Cost of Capital adjustment has not been necessary for 2014 through 2017. D.17-07-005 approved the Authorized Return on Equity at 10.30 percent for 2018 and it remained the same for 2019. D.19-12-056 approved the Authorized Return on Equity at 10.30 percent for 2020. Table A sets forth the Authorized Return on Equity.
(T) (T) | (T)
Table A
Authorized Return on Equity
Year Authorized Return on Equity 2013 10.45 percent 2014 10.45 percent 2015 10.45 percent 2016 10.45 percent 2017 10.45 percent 2018 2019 2020
10.30 percent10.30 percent 10.30 percent
(T) (N)
b. Interest Rate Index The interest rate index is the 12-month average of the Moody’s Long-Term
Bond Yield for Baa Utilities ending in September. Should SCE’s Standard & Poor’s or Moody’s corporate credit rating/issuer credit rating change, the interest rate index will be modified in the next cost of capital application as directed by D.13-03-015.
c. Trigger Value The initial trigger value shall be 5.00 percent, as established by D.13-03-015.
The trigger value will be modified as necessary by the operation of this mechanism.
Table BTrigger Value
Year Trigger Value 2013 5.00 percent

Southern California Edison Revised Cal. PUC Sheet No. 68393-E Rosemead, California (U 338-E) Cancelling Revised Cal. PUC Sheet No. 62452-E
PRELIMINARY STATEMENT Sheet 2
(Continued)
(Continued) (To be inserted by utility) Issued by (To be inserted by Cal. PUC) Advice 4136-E Carla Peterman Date Submitted Dec 26, 2019 Decision 19-12-056 Senior Vice President Effective Jan 1, 2020 2C13 Resolution
CCC. COST OF CAPITAL MECHANISM (CCM) (Continued): 3. Definitions. (Continued)
d. Authorized long-term debt and preferred stock costs. A Cost of Capital adjustment has not been necessary for 2014, 2015, 2016 and 2017; therefore, preferred stock and long-term debt costs have remained at 5.79 percent and at 5.49 percent for those years. D.17-07-005 reset the authorized preferred stock and long-term debt cost beginning in test year 2018 through 2019 at 5.82 percent and 4.98 percent respectively. D.19-12-056 authorized the preferred stock and long-term debt at 5.70 percent and 4.74 percent respectively.
The cost of long-term reset reflects actual August 2017 month-end embedded
cost and forecasted interest rates for variable long-term debt and new long-term debt expected to be issued in the remainder of 2017 and all of 2018.
The cost of preferred stock reset reflects actual August 2017 month-end
embedded cost and forecasted dividend rates for preferred stock expected to be issued in the remainder of 2017 and all of 2018.
(T) (T) (T) | (T)
Table C
Authorized Preferred Stock and Long-term Debt Rates
Year Authorized Preferred Stock Authorized Long-Term Debt 2013 5.79 percent 5.49 percent 2014 5.79 percent 5.49 percent 2015 5.79 percent 5.49 percent 2016 5.79 percent 5.49 percent 2017 5.79 percent 5.49 percent 2018 2019 2020
5.82 percent 5.82 percent 5.70 percent
4.98 percent 4.98 percent (T) 4.74 percent (N)

Southern California Edison Revised Cal. PUC Sheet No. 68394-E Rosemead, California (U 338-E) Cancelling Revised Cal. PUC Sheet No. 68161-E
TABLE OF CONTENTS Sheet 1
(Continued) (To be inserted by utility) Issued by (To be inserted by Cal. PUC) Advice 4136-E Carla Peterman Date Submitted Dec 26, 2019 Decision 19-12-056 Senior Vice President Effective Jan 1, 2020 1H12 Resolution
Cal. P.U.C. Sheet No.
TITLE PAGE ............................................................................................................................. 11431-E TABLE OF CONTENTS - RATE SCHEDULES .... 68394-68395-68396-67869-67870-67871-67872-E ........................................................................................................... 68013-68014-68015-E TABLE OF CONTENTS - LIST OF CONTRACTS AND DEVIATIONS ................................... 68015-E TABLE OF CONTENTS - RULES ................................................................................. 68373-64043-E TABLE OF CONTENTS-INDEX OF COMMUNITIES, MAPS, BOUNDARY DESCRIPTIONS 62213-E TABLE OF CONTENTS - SAMPLE FORMS.. .................. 62213-64447-61576-67878-67879-61631-E
........................................................................................................... 67880-67881-63296-E
PRELIMINARY STATEMENT:
A. Territory Served ......................................................................................................... 22909-E B. Description of Service ................................................................................................ 22909-E C. Procedure to Obtain Service ..................................................................................... 22909-E D. Establishment of Credit and Deposits ....................................................................... 22909-E E. General .......................................................................... 45178-45179-45180-53818-45182-E F. Symbols ..................................................................................................................... 45182-E G. Gross Revenue Sharing Mechanism ....... 26584-26585-26586-26587-27195-27196-54092-E
.................................................................................................. 51717-53819-27200-27201-E H. Baseline Service ........................................................... 52027-52028-52029-52030-52031-E I. Charge Ready Program Balancing Account ........................................ 68156-68157-68158-E J. Pole Loading and Deteriorated Pole Program Balancing Account ....... 68384-67495-68385-E ......................................................................................................................... 68386-67498-E K. Nuclear Decommissioning Adjustment Mechanism ........................................ 36582-57779-E L. Purchase Agreement Administrative Costs Balancing Account ........... 55207-51922-55208-E M. Income Tax Component of Contributions ....................................................... 58419-58420-E N. Memorandum Accounts .... 21344-67638-67412-58221-49492-61165-61166-61167-53821-E
........ 50418-42841-61168-64869-64870-44950-44951-44952-44953-42849-42850-42851-E ........ 65677-65678-55623-61171-42856-61172-61173-52033-50419-55048-61174-42863-E ........ 42864-67639-67640-51235-45920-51236-61175-50209-42872-42873-50421-46539-E ........ 42876-42877-42878-42879-42880-42881-42882-54534-53371-56253-44959-42887-E ........ 53321-53322-61176-52551-52552-49928-56235-56236-56237-55144-55145-44029-E
........ 53016-57156-57157-51163-51164-51165-51166-67414-51168-51169-51170-51171-E ................................ 51244-55806-56393-56394-56395-56396-56397-56398-56399-58978E O. California Alternate Rates for Energy (CARE) Adjustment Clause ................. 34705-41902-E .................................................................................................. 36472-38847-56788-68186-E P. Tree Mortality Non-Bypassable Charge Balancing Account………...65929-65930-65931-E
(T) (T)
Southern California Edison Revised Cal. PUC Sheet No. 68395-E Rosemead, California (U 338-E) Cancelling Revised Cal. PUC Sheet No. 68074-E
TABLE OF CONTENTS Sheet 2
(Continued)
(Continued) (To be inserted by utility) Issued by (To be inserted by Cal. PUC) Advice 4136-E Carla Peterman Date Submitted Dec 26, 2019 Decision 19-12-056 Senior Vice President Effective Jan 1, 2020 2H12 Resolution
Cal. P.U.C. Sheet No.
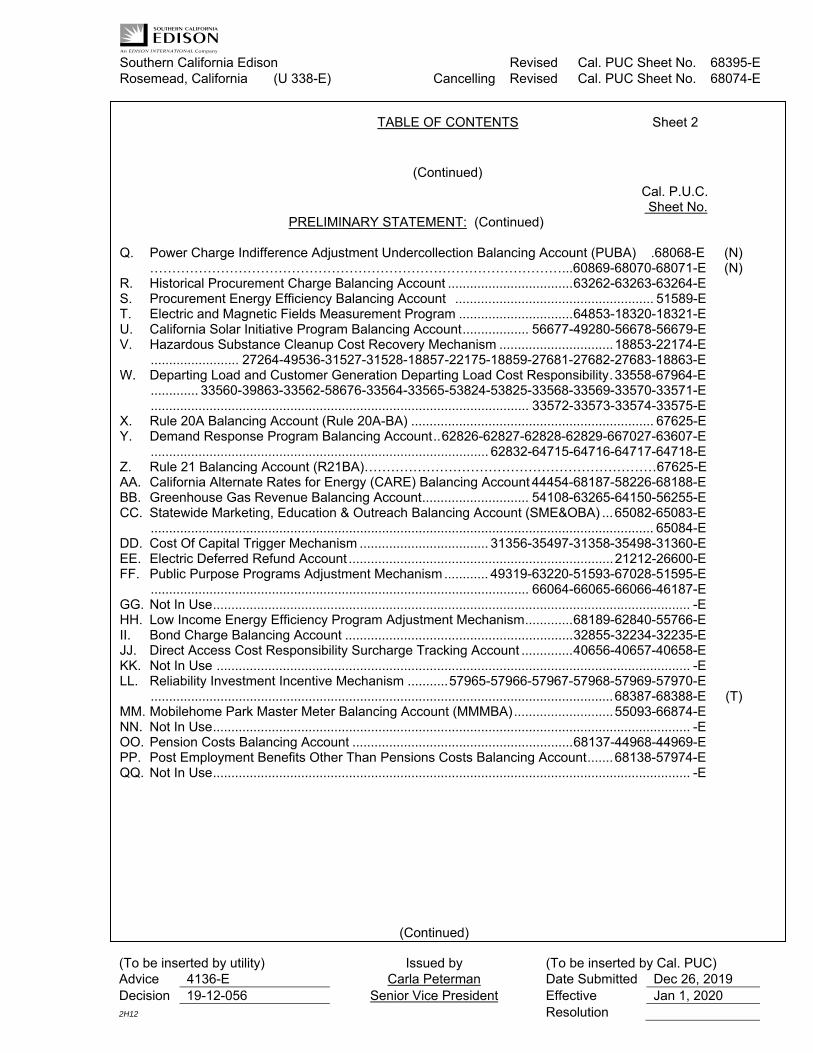
PRELIMINARY STATEMENT: (Continued) Q. Power Charge Indifference Adjustment Undercollection Balancing Account (PUBA) .68068-E
…………………………………………………………………………………...60869-68070-68071-E R. Historical Procurement Charge Balancing Account .................................. 63262-63263-63264-E S. Procurement Energy Efficiency Balancing Account ...................................................... 51589-E T. Electric and Magnetic Fields Measurement Program ............................... 64853-18320-18321-E U. California Solar Initiative Program Balancing Account .................. 56677-49280-56678-56679-E V. Hazardous Substance Cleanup Cost Recovery Mechanism ............................... 18853-22174-E ........................ 27264-49536-31527-31528-18857-22175-18859-27681-27682-27683-18863-E W. Departing Load and Customer Generation Departing Load Cost Responsibility . 33558-67964-E ............. 33560-39863-33562-58676-33564-33565-53824-53825-33568-33569-33570-33571-E ....................................................................................................... 33572-33573-33574-33575-E X. Rule 20A Balancing Account (Rule 20A-BA) .................................................................. 67625-E Y. Demand Response Program Balancing Account .. 62826-62827-62828-62829-667027-63607-E ............................................................................................ 62832-64715-64716-64717-64718-E Z. Rule 21 Balancing Account (R21BA)…………………………………………………………67625-E AA. California Alternate Rates for Energy (CARE) Balancing Account 44454-68187-58226-68188-E BB. Greenhouse Gas Revenue Balancing Account ............................. 54108-63265-64150-56255-E CC. Statewide Marketing, Education & Outreach Balancing Account (SME&OBA) ... 65082-65083-E ......................................................................................................................................... 65084-E DD. Cost Of Capital Trigger Mechanism ................................... 31356-35497-31358-35498-31360-E EE. Electric Deferred Refund Account ........................................................................ 21212-26600-E FF. Public Purpose Programs Adjustment Mechanism ............ 49319-63220-51593-67028-51595-E ....................................................................................................... 66064-66065-66066-46187-E GG. Not In Use .................................................................................................................................. -E HH. Low Income Energy Efficiency Program Adjustment Mechanism ............. 68189-62840-55766-E II. Bond Charge Balancing Account .............................................................. 32855-32234-32235-E JJ. Direct Access Cost Responsibility Surcharge Tracking Account .............. 40656-40657-40658-E KK. Not In Use ................................................................................................................................. -E LL. Reliability Investment Incentive Mechanism ........... 57965-57966-57967-57968-57969-57970-E .............................................................................................................................. 68387-68388-E MM. Mobilehome Park Master Meter Balancing Account (MMMBA) ........................... 55093-66874-E NN. Not In Use .................................................................................................................................. -E OO. Pension Costs Balancing Account ............................................................ 68137-44968-44969-E PP. Post Employment Benefits Other Than Pensions Costs Balancing Account ....... 68138-57974-E QQ. Not In Use .................................................................................................................................. -E
(N) (N) (T)

Southern California Edison Revised Cal. PUC Sheet No. 68396-E Rosemead, California (U 338-E) Cancelling Revised Cal. PUC Sheet No. 68162-E
TABLE OF CONTENTS Sheet 3
(Continued)
(Continued) (To be inserted by utility) Issued by (To be inserted by Cal. PUC) Advice 4136-E Carla Peterman Date Submitted Dec 26, 2019 Decision 19-12-056 Senior Vice President Effective Jan 1, 2020 3C11 Resolution
Cal. P.U.C. Sheet No.
PRELIMINARY STATEMENT: (Continued) RR. New System Generation Balancing Account ................................ 68389-57976-64244-64245-E SS. Not In Use .................................................................................................................................. -E ................................................................................................................................................... -E TT. Not In Use .................................................................................................................................. -E UU. Not In Use .................................................................................................................................. -E VV. Medical Programs Balancing Account ....................................................... 68140-57978-44979-E WW. Portfolio Allocation Balancing Account…………….65241-65242-67029-68390-65245-67030-E …………………………………………………………………………………………65247-65248-65249-E XX. Low Carbon Fuel Standard Revenue Balancing Account .................................... 56447-56448-E YY. Base Revenue Requirement Balancing Account .......................... 68391-65251-54112-51724-E .................................... 65252-65253-65254-65255-66067-68159-68160-57984-58088-57986-E ZZ. Energy Resource Recovery Account .......... 65259-65260-65261-65262-66628-65264-65265-E ................................................................................. 66629-68072-65903-55221-56259-55223-E AAA. Post Test Year Ratemaking Mechanism. ................................................ 57988-60665-57990-E BBB. Not In Use ................................................................................................................................ -E CCC. Cost of Capital Mechanism ...................................................................... 68392-68393-62453-E DDD. 2010-2012 On Bill Financing Balancing Account .......................................................... 55859-E EEE Not in Use ................................................................................................................................ -E FFF Electric Program Investment Charge Balancing Account-California Energy Commission .......... ............................................................................................................................ 50176-50177-E GGG Electric Program Investment Charge Balancing Account-Southern California Edison ............... ............................................................................................................................ 50178-50179-E HHH Electric Program Investment Charge Balancing Account-California Public Utilities Commission ....................................................................................................................................... 50180-E III New Solar Homes Partnership(NSHP) Program Balancing Account (NSHPPBA)……..59581-E JJJ Aliso Canyon Demand Response Program Balancing Account (ACDRPBA)…..59847-59848-E ……………………………………………………………………………………...…...59849-59850-E RRR Integrated Distributed Energy Resources Shareholder Incentive Award Balancing Account (iDERSIABA)……………………………………………………………………………...……61284-E LLL Integrated Distributed Energy Resources Contract Costs Balancing Account (iDERCCBA)…… ……………………………………………………………………………………….………….61285-E MMM Distributed Resources Plan Demonstration Balancing Account (DRPDBA)……61982-61983-E NNN Transportation Electrification Portfolio Balancing Account (TEPBA)…….64055-64056-64057-E ………………………………………………………………………………………….64058-64059-E OOO Aliso Canyon Energy Storage Balancing Account (ACESBA)…………………....64073-64074-E PPP Disadvantaged Communities-Green Tariff Balancing Account (DACGTBA)……64152-64153-E VVV Community Solar Green Tariff Balancing Account (CSGTBA)……………………64154-64155-E WWW Disadvantaged Communities - Single-family Solar Homes Balancing Account (DACSASHBA) …………………………………………………………………………………………..64733-64734-E XXX Statewide Energy Efficiency Balancing Account (SWEEBA)……………………………..64854-E ZZZ Net Energy Metering Measurement and Evaluation Balancing Account (NEMMEBA)…65128-E
(T) (T) (T) (T)

Appendix ACOC Workpapers

2018 GRC2020 Functionalized Revenue Requirement

Southern California Edison
2018 GRC
2020 Results of Operations
$ in Thousands
2020
Line Item Total CPUC Generation Peakers Distribution
With Adjustments
1. Total Operating Revenues 5,897,522 697,419 56,963 5,143,140
2. Operating Expenses:
3. Production
4. Steam 6,251 6,251 – –
5. Nuclear 76,747 76,747 – –
6. Hydro 41,446 41,446 – –
7. Other 81,962 74,511 7,451 –
8. Total Production O&M 206,406 198,955 7,451 –
9. Transmission 91,023 – – 91,023
10. Distribution 497,023 – – 497,023
11. Customer Accounts 155,395 – – 155,395
12. Uncollectibles 12,528 1,472 120 10,936
13. Customer Service & Information 21,277 1,597 – 19,680
14. Administrative & General 601,946 81,870 4,658 515,418
15. Franchise Requirements 54,293 6,377 521 47,395
16. Revenue Credits (158,666) (1,963) – (156,702)
17. Total O&M 1,481,225 288,307 12,750 1,180,168
18. Escalation 194,900 38,016 830 156,054
19. Depreciation 1,759,130 173,143 15,062 1,570,925
20. Taxes Other Than On Income
21. Property Taxes 295,684 22,651 3,393 269,640
22. Payroll Taxes & Misc 64,198 9,178 50 54,970
23. Taxes Based On Income 137,837 5,042 7,608 125,187
24. Total Taxes 497,719 36,871 11,051 449,797
25. Total Operating Expenses 3,932,975 536,338 39,693 3,356,943
26. Net Operating Revenue 1,964,547 161,081 17,270 1,786,197
27. Rate Base 26,104,024 2,097,623 224,887 23,781,514
28. Rate Of Return 7.53% 7.68% 7.68% 7.51%

2018 GRCSummary of Earnings

SOUTHERN CALIFORNIA EDISON
TEST YEAR 2018 GENERAL RATE CASE
N-T-G MULTIPLIER
ESTIMATED REVENUE REQUIREMENTS
Line Recorded Forecast Forecast Forecast Forecast Forecast
No. Description 2015 2016 2017 2018 2019 2020
1. Revenues 1.0000 1.0000 1.0000 1.0000 1.0000 1.0000
2. Uncollectibles Tax Rate 0.00238 0.00238 0.00238 0.00211 0.00211 0.00211
3. Uncollectibles Amount Applied 1.0000 1.0000 1.0000 1.0000 1.0000 1.0000 ________ ________ ________ ________ ________ ________
4. Uncollectibles Juris. 0.0024 0.0024 0.0024 0.0021 0.0021 0.0021
5. Subtotal 0.9976 0.9976 0.9976 0.9979 0.9979 0.9979
6. Franchise Fees Tax Rate 0.009095 0.009095 0.009095 0.009144 0.009144 0.009144
7. Franchise Fees Amount Applied 1.0000 1.0000 1.0000 1.0000 1.0000 1.0000 ________ ________ ________ ________ ________ ________
8. Franchise Fees Juris. 0.0091 0.0091 0.0091 0.0091 0.0091 0.0091
9. Subtotal 0.9885250 0.9885 0.9885 0.9887460 0.9887460 0.9887460
10. Arizona/New Mexico/D.C. Income Tax Rates 0.000269738 0.000269738 0.000269738 0 0 0
11. Other State I.T. Amount Applied 0.9885 0.9885 0.9885 0.9887 0.9887 0.9887 ________ ________ ________ ________ ________ ________
12. Other State I.T. Juris. 0.0003 0.0003 0.0003 0.0000 0.0000 0.0000
13. Subtotal 0.9883 0.9883 0.9883 0.9887 0.9887 0.9887
14. S. I. T. Rate 0.0884 0.0884 0.0884 0.0884 0.0884 0.0884
15. S. I. T. Amount Applied 0.9885 0.9885 0.9885 0.9887 0.9887 0.9887 ________ ________ ________ ________ ________ ________
16. S. I. T. Juris. 0.0874 0.0874 0.0874 0.0874 0.0874 0.0874
17. Subtotal 0.9009 0.9009 0.9009 0.9013 0.9013 0.9013
18. Federal Income Tax 0.35 0.35 0.35 0.21 0.21 0.21
19. Federal Income Tax Amount Applied 0.9883 0.9883 0.9883 0.9887 0.9887 0.9887 ________ ________ ________ ________ ________ ________
20. Federal Income Tax Juris. 0.3459 0.3459 0.3459 0.2076 0.2076 0.2076
21. Net Operating Revenues 0.5550 0.5550 0.5550 0.6937 0.6937 0.6937
22. Uncollectible and Franchise Fees Factor 1.011608 1.011608 1.011608 1.011382 1.011382 1.011382
23. N-T-G MULTIPLIER 1.8019 1.8019 1.8019 1.4415 1.4415 1.4415

SOUTHERN CALIFORNIA EDISON
TEST YEAR 2018 GENERAL RATE CASE
RATE OF RETURN
ESTIMATED REVENUE REQUIREMENTS
Line Recorded Forecast Forecast Forecast Forecast Forecast
No. Description 2015 2016 2017 2018 2019 2020
24. Cost Factor
25. Long-Term Debt 5.49% 5.49% 5.49% 4.98% 4.98% 4.74%
26. Preferred Stock 5.79% 5.79% 5.79% 5.82% 5.82% 5.70%
27. Equity 10.45% 10.45% 10.45% 10.30% 10.30% 10.30%
28. Capitalization Ratios
29. Long-Term Debt 43.00% 43.00% 43.00% 43.00% 43.00% 43.00%
30. Preferred Stock 9.00% 9.00% 9.00% 9.00% 9.00% 5.00%
31. Equity 48.00% 48.00% 48.00% 48.00% 48.00% 52.00%
32. Weighted Cost
33. Long-Term Debt 2.36% 2.36% 2.36% 2.14% 2.14% 2.04%
34. Preferred Stock 0.52% 0.52% 0.52% 0.52% 0.52% 0.29%
35. Equity 5.02% 5.02% 5.02% 4.94% 4.94% 5.36%
36. Return on Rate Base 7.90% 7.90% 7.90% 7.61% 7.61% 7.68%

SOUTHERN CALIFORNIA EDISON
TEST YEAR 2018 GENERAL RATE CASE
TAXES - OTHER
ESTIMATED REVENUE REQUIREMENTS
(Thousands of Dollars)
Line Recorded Forecast Forecast Forecast Forecast Forecast
No. Description 2015 2016 2017 2018 2019 2020
37. Ad Valorem Taxes
38. Jurisdictional Factor 100.000% 100.000% 100.000% 100.000% 100.000% 100.000%
39. Ad Valorem Taxes 262,960 278,383 298,131 318,647 338,736 363,479
40. Ad Valorem Taxes Jurisdictionalized 262,960 278,383 298,131 318,647 338,736 363,479 ________ ________ ________ ________ ________ ________
41. Total Ad Valorem Taxes 262,960 278,383 298,131 318,647 338,736 363,479
42. Total Ad Valorem Taxes Juris. 262,960 278,383 298,131 318,647 338,736 363,479
43. Payroll Taxes
44. Federal Insurance Contribution Act (FICA) 66,100 64,872 66,769 56,486 58,139 60,488
45. FICA Jurisdictionalized 66,100 64,872 66,769 56,486 58,139 60,488
46. Federal Unemployment Tax Act 365 352 347 286 284 284
47. Federal Unemployment Tax Act Juris. 365 352 347 286 284 284
48. State Unemployment Tax Act 3,831 3,693 3,633 2,993 2,980 2,981
49. State Unemployment Tax Act Juris. 3,831 3,693 3,633 2,993 2,980 2,981 ________ ________ ________ ________ ________ ________
50. Total Payroll Taxes 70,296 68,917 70,749 59,765 61,403 63,753
51. Total Payroll Taxes Juris. 70,296 68,917 70,749 59,765 61,403 63,753
52. Misc. Taxes
53. Federal - All Other 4,145 4,566 4,699 4,842 5,001 5,180
54. Federal - All Other Juris. 4,145 4,566 4,699 4,842 5,001 5,180 ________ ________ ________ ________ ________ ________
55. Total Miscellaneous Taxes 4,145 4,566 4,699 4,842 5,001 5,180
56. Total Miscellaneous Taxes Juris. 4,145 4,566 4,699 4,842 5,001 5,180
57. ITC Amortization on CTC Property (613) (613) (612) (594) (583) (571)
58. ITC Amortization on CTC Property Juris. (613) (613) (612) (594) (583) (571)
________ ________ ________ ________ ________ ________
59. ARAM Expense on CTC Property 0 0 0 0 0 0
60. ARAM Expense on CTC Property Juris. 0 0 0 0 0 0
61. Total Taxes Other Than Income 336,788 351,253 372,967 382,660 404,557 431,841
62. Total Taxes Other Than Income Juris. 336,788 351,253 372,967 382,660 404,557 431,841

SOUTHERN CALIFORNIA EDISON
TEST YEAR 2018 GENERAL RATE CASE
INCOME TAX ADJUSTMENTS
ESTIMATED REVENUE REQUIREMENTS
(Thousands of Dollars)
Line Recorded Forecast Forecast Forecast Forecast Forecast
No. Description 2015 2016 2017 2018 2019 2020
63. California Income Tax Adjustments
64. Fed and State Inc. Tax Adjust. Juris. Fac. 100.000% 100.000% 100.000% 100.000% 100.000% 100.000%
65. Tax Depreciation 1,446,567 1,555,700 1,586,173 1,654,015 1,683,686 1,726,673
66. Tax Depreciation Juris. 1,446,567 1,555,700 1,586,173 1,654,015 1,683,686 1,726,673
67. Interest On Long-Term Debt 529,728 581,476 627,032 604,485 648,874 660,650
68. Interest On Long-Term Debt Juris. 529,728 581,476 627,032 604,485 648,874 660,650
69. Interest On Accumulated Deferred ITC (2,805) (2,506) (2,284) (1,878) (1,693) (1,442)
70. Interest On Accum. Deferred ITC Juris. (2,805) (2,506) (2,284) (1,878) (1,693) (1,442)
71. Uniform Capitalization 130,147 115,429 126,404 176,026 184,048 195,423
72. Uniform Capitalization Juris. 130,147 115,429 126,404 176,026 184,048 195,423
73. Capitalized Software 10,319 20,919 26,313 33,440 30,885 23,419
74. Capitalized Software Juris 10,319 20,919 26,313 33,440 30,885 23,419
75. Ad Valorem Lien Date Adjustment 8,226 7,196 12,552 7,964 12,123 12,623
76. Ad Valorem Lien Date Adjustment Juris. 8,226 7,196 12,552 7,964 12,123 12,623
77. Percentage Repair Allowance 0 0 0 0 0 0
78. Percentage Repair Allowance Juris 0 0 0 0 0 0
79. Removal Costs 517,650 440,121 407,211 465,885 528,736 482,167
80. Removal Costs Juris 517,650 440,121 407,211 465,885 528,736 482,167
81. Amortization of Land Rights 0 0 0 0 0 0
82. Amortization of Land Rights Juris. 0 0 0 0 0 0
83. Salvage Warehouse Expense 0 0 0 0 0 0
84. Salvage Warehouse Expense Juris 0 0 0 0 0 0
85. CIAC Revenues (186,558) (198,935) (210,771) (255,342) (283,343) (292,732)
86. CIAC Revenues Juris (186,558) (198,935) (210,771) (255,342) (283,343) (292,732)
87. Non Deductible Meals (2,060) (2,070) (2,132) (2,102) (2,177) (2,219)
88. Non Deductible Meals Juris (2,060) (2,070) (2,132) (2,102) (2,177) (2,219)
89. Excess Compensation 3,291 3,398 3,489 3,587 3,696 3,825
90. Excess Compensation Juris 3,291 3,398 3,489 3,587 3,696 3,825
91. ESOP Dividends 0 0 0 0 0 0
92. ESOP Dividends Juris 0 0 0 0 0 0
93. Leased Vehicles 0 0 0 0 0 0
94. Leased Vehicles Juris 0 0 0 0 0 0
95. Repair Deduction 937,828 963,449 994,448 986,375 1,008,059 987,503
96. Repair Deduction - Juirs 937,828 963,449 994,448 986,375 1,008,059 987,503 ________ ________ ________ ________ ________ ________
95. Total CCFT Adjustments 3,392,333 3,484,178 3,568,435 3,672,455 3,812,893 3,795,889
96. Total CCFT Adjustments Juris. 3,392,333 3,484,178 3,568,435 3,672,455 3,812,893 3,795,889

SOUTHERN CALIFORNIA EDISON
TEST YEAR 2018 GENERAL RATE CASE
INCOME TAX ADJUSTMENTS
ESTIMATED REVENUE REQUIREMENTS
(Thousands of Dollars)
Line Recorded Forecast Forecast Forecast Forecast Forecast
No. Description 2015 2016 2017 2018 2019 2020
97. Federal Income Tax Adjustments
98. Tax Depreciation 2,132,995 1,995,799 1,954,091 1,511,029 1,476,338 1,460,056
99. Tax Depreciation Juris. 2,132,995 1,995,799 1,954,091 1,511,029 1,476,338 1,460,056
100. Interest On Long-Term Debt 529,728 581,476 627,032 604,485 648,874 660,650
101. Interest On Long-Term Debt Juris. 529,728 581,476 627,032 604,485 648,874 660,650
102. Uniform Capitalization 130,147 115,429 126,404 176,026 184,048 195,423
103. Uniform Capitalization Juris. 130,147 115,429 126,404 176,026 184,048 195,423
104. Capitalized Software 10,319 20,919 26,313 33,440 30,885 23,419
105. Capitalized Software Juris 10,319 20,919 26,313 33,440 30,885 23,419
106. Ad Valorem Lien Date Adjustment 8,226 7,196 12,552 7,964 12,123 12,623
107. Ad Valorem Lien Date Adjustment Juris. 8,226 7,196 12,552 7,964 12,123 12,623
108. 0 0 0 0 0 0
109. 0 0 0 0 0 0
110. Repair Deduction 937,828 963,449 994,448 986,375 1,008,059 987,503
111. Repair Deduction Juris 937,828 963,449 994,448 986,375 1,008,059 987,503
112. Removal Costs 517,650 440,121 407,211 465,885 528,736 482,167
113. Removal Costs Juris 517,650 440,121 407,211 465,885 528,736 482,167
114. Amortization of Land Rights 0 0 0 0 0 0
115. Amortization of Land Rights Juris. 0 0 0 0 0 0
116. Salvage Warehouse Expense 0 0 0 0 0 0
117. Salvage Warehouse Expense Juris 0 0 0 0 0 0
118. CIAC Revenues (185,136) (197,513) (209,461) (254,302) (282,659) (292,393)
119. CIAC Revenues Juris (185,136) (197,513) (209,461) (254,302) (282,659) (292,393)
120. Non Deductible Meals (2,060) (2,070) (2,132) (2,102) (2,177) (2,219)
121. Non Deductible Meals Juris (2,060) (2,070) (2,132) (2,102) (2,177) (2,219)
122. Excess Compensation 3,291 3,398 3,489 3,587 3,696 3,825
123. Excess Compensation Juris 3,291 3,398 3,489 3,587 3,696 3,825
124. Leased Vehicles 0 0 0 0 0 0
125. Leased Vehicles Juris 0 0 0 0 0 0
126. ESOP Dividends 0 0 0 0 0 0
127. ESOP Dividends Juris 0 0 0 0 0 0
128. Preferred Dividend Deduction 0 809 809 1,348 1,348 1,348
129. Preferred Dividend Deduction Juris 0 809 809 1,348 1,348 1,348
130. Section 199 Manufacturer's Deduction 0 3,603 16,754 0 0 0
131. Section 199 Manufacturer's Deduction - Juris 0 3,603 16,754 0 0 0
132. Medicare D 0 0 0 0 0 0
133. Total FIT Adjustments 4,082,988 3,932,617 3,957,509 3,533,736 3,609,270 3,532,401
134. Total FIT Adjustments Juris. 4,082,988 3,932,617 3,957,509 3,533,736 3,609,270 3,532,401

SOUTHERN CALIFORNIA EDISON
TEST YEAR 2018 GENERAL RATE CASE
ESTIMATED REVENUE REQUIREMENTS
TAXES - INCOME ($000)
Line Recorded Forecast Forecast Forecast Forecast Forecast
No. Description 2015 2016 2017 2018 2019 2020
135. California Corporation Franchise Tax
136. Fed Inc. Tax Jurisdictional Factor 100.000% 100.000% 100.000% 100.000% 100.000% 100.000%
137. Operating Revenues 6,080,010 6,214,538 6,597,528 6,129,374 6,495,766 6,989,162
138. Operating Revenues Juris. 6,080,010 6,214,538 6,597,528 6,129,374 6,495,766 6,989,162
139. Operating Expenses 1,794,805 1,844,936 1,858,559 1,671,947 1,718,099 1,770,395
140. Operating Expenses Juris. 1,794,805 1,844,936 1,858,559 1,671,947 1,718,099 1,770,395
141. Taxes Other Than Income 336,788 351,253 372,967 382,660 404,557 431,841
142. Taxes Other Than Income Juris. 336,788 351,253 372,967 382,660 404,557 431,841 ________ ________ ________ ________ ________ ________
143. Subtotal Expenses 2,131,593 2,196,190 2,231,526 2,054,607 2,122,656 2,202,236
144. Subtotal Expenses Juris. 2,131,593 2,196,190 2,231,526 2,054,607 2,122,656 2,202,236
145. Income Tax Adjustments 3,392,333 3,484,178 3,568,435 3,672,455 3,812,893 3,795,889
146. Income Tax Adjustments Juris. 3,392,333 3,484,178 3,568,435 3,672,455 3,812,893 3,795,889
147. California Taxable Income 556,084 534,170 797,566 402,312 560,217 991,037
148. California Taxable Income Juris. 556,084 534,170 797,566 402,312 560,217 991,037
149. CCFT Tax Rate 8.8400% 8.8400% 8.8400% 8.8400% 8.8400% 8.8400%
150. CCFT 49,158 47,221 70,505 35,564 49,523 87,608
151. CCFT Juris. 49,158 47,221 70,505 35,564 49,523 87,608
152. California Alternate Minimum Tax 0 0 0 0 0 0
153. California Alternate Minimum Tax Juris 0 0 0 0 0 0
154. Arizona Income Tax Rate 0.0270% 0.0270% 0.0270% 0.0000% 0.0000% 0.0000%
155. New Mexico Income Tax Rate 0.0000% 0.0000% 0.0000% 0.0000% 0.0000% 0.0000%
156. Arizona Income Tax 150 144 215 0 0 0
157. Arizona Income Tax Juris. 150 144 215 0 0 0
158. New Mexico Income Tax 0 0 0 0 0 0
159. New Mexico Income Tax Juris. 0 0 0 0 0 0
160. Total Other State State Income Taxes 150 144 215 0 0 0
161. Total Other State Income Taxes Juris. 150 144 215 0 0 0
162. Total State Income Taxes 49,308 47,365 70,720 35,564 49,523 87,608
163. Total State Income Taxes Juris. 49,308 47,365 70,720 35,564 49,523 87,608

SOUTHERN CALIFORNIA EDISON
TEST YEAR 2018 GENERAL RATE CASE
ESTIMATED REVENUE REQUIREMENTS
TAXES - INCOME ($000)
Line Recorded Forecast Forecast Forecast Forecast Forecast
No. Description 2015 2016 2017 2018 2019 2020
164. Federal Income Tax
165. Operating Revenues 6,080,010 6,214,538 6,597,528 6,129,374 6,495,766 6,989,162
166. Operating Revenues Juris. 6,080,010 6,214,538 6,597,528 6,129,374 6,495,766 6,989,162
167. Operating Expenses 1,794,805 1,844,936 1,858,559 1,671,947 1,718,099 1,770,395
168. Operating Expenses Juris. 1,794,805 1,844,936 1,858,559 1,671,947 1,718,099 1,770,395
169. Taxes Other Than Income 336,788 351,253 372,967 382,660 404,557 431,841
170. Taxes Other Than Income 336,788 351,253 372,967 382,660 404,557 431,841
171. Total State Income Taxes 49,308 47,365 70,720 35,564 49,523 87,608
172. Total State Income Taxes Juris. 49,308 47,365 70,720 35,564 49,523 87,608
173. Less: Current Year's CCFT 49,158 47,221 70,505 35,564 49,523 87,608
174. Less: Current Year's CCFT Juris. 49,158 47,221 70,505 35,564 49,523 87,608
175. Plus: Prior Year's CCFT 83,455 49,158 47,221 70,505 35,564 49,523
176. Plus: Prior Year's CCFT Juris. 83,455 49,158 47,221 70,505 35,564 49,523 ________ ________ ________ ________ ________ ________
177. Subtotal - Expenses 2,215,198 2,245,492 2,278,962 2,125,112 2,158,220 2,251,759
178. Subtotal Juris. 2,215,198 2,245,492 2,278,962 2,125,112 2,158,220 2,251,759
179. Income Tax Adjustments (Sch M) 4,082,988 3,932,617 3,957,509 3,533,736 3,609,270 3,532,401
180. Income Tax Adjustments Juris. 4,082,988 3,932,617 3,957,509 3,533,736 3,609,270 3,532,401
181. Federal Taxable Income (218,176) 36,429 361,057 470,527 728,276 1,205,002
182. Federal Taxable Income Juris. (218,176) 36,429 361,057 470,527 728,276 1,205,002
183. FIT Tax Rate 35% 35% 35% 21% 21% 21%
184. Federal Income Tax (76,362) 12,750 126,370 98,811 152,938 253,050
185. Federal Income Tax Juris. (76,362) 12,750 126,370 98,811 152,938 253,050
186. Federal Alternative Income Tax 0 0 0 0 0 0
187. Federal Alternative Income Tax 0 0 0 0 0 0
188. Taxes Deferred-current (Plant) 403,125 296,751 259,239 3,080 (5,974) (24,747)
189. Taxes Deferred-current Juris. (Plant) 403,125 296,751 259,239 3,080 (5,974) (24,747)
190. Taxes Deferred-current (AFUDC Debt) 0 0 0 0 0 0
191. Taxes Deferred (AFUDC Debt) Juris. 0 0 0 0 0 0
192. Taxes Deferred-current (Cap. Int.) 0 0 0 0 0 0
193. Taxes Deferred (Cap. Int.) Juris. 0 0 0 0 0 0
194. Contributions in Aid of Construction (20,632) (21,006) (21,194) (36,984) (44,128) (48,366)
195. Contributions in Aid of Construction Juris (20,632) (21,006) (21,194) (36,984) (44,128) (48,366)
196. Investment Tax Credit Amortization (7,968) (9,878) (9,685) (9,791) (9,456) (9,098)
197. Investment Tax Credit Amort. Juris. (7,968) (9,878) (9,685) (9,791) (9,456) (9,098)
198. Accrued Vacation 1,341 1,385 1,422 2,835 2,865 2,901
199. Accrued Vacation Juris 1,341 1,385 1,422 2,835 2,865 2,901
200. Total Federal Income Taxes 299,505 280,002 356,153 57,950 96,246 173,740
201. Total Federal Income Taxes Juris. 299,505 280,002 356,153 57,950 96,246 173,740
202. Total Taxes-Income (State and Fed) 348,813 327,367 426,873 93,514 145,769 261,348
203. Total Taxes-Income (State and Fed) Juris. 348,813 327,367 426,873 93,514 145,769 261,348
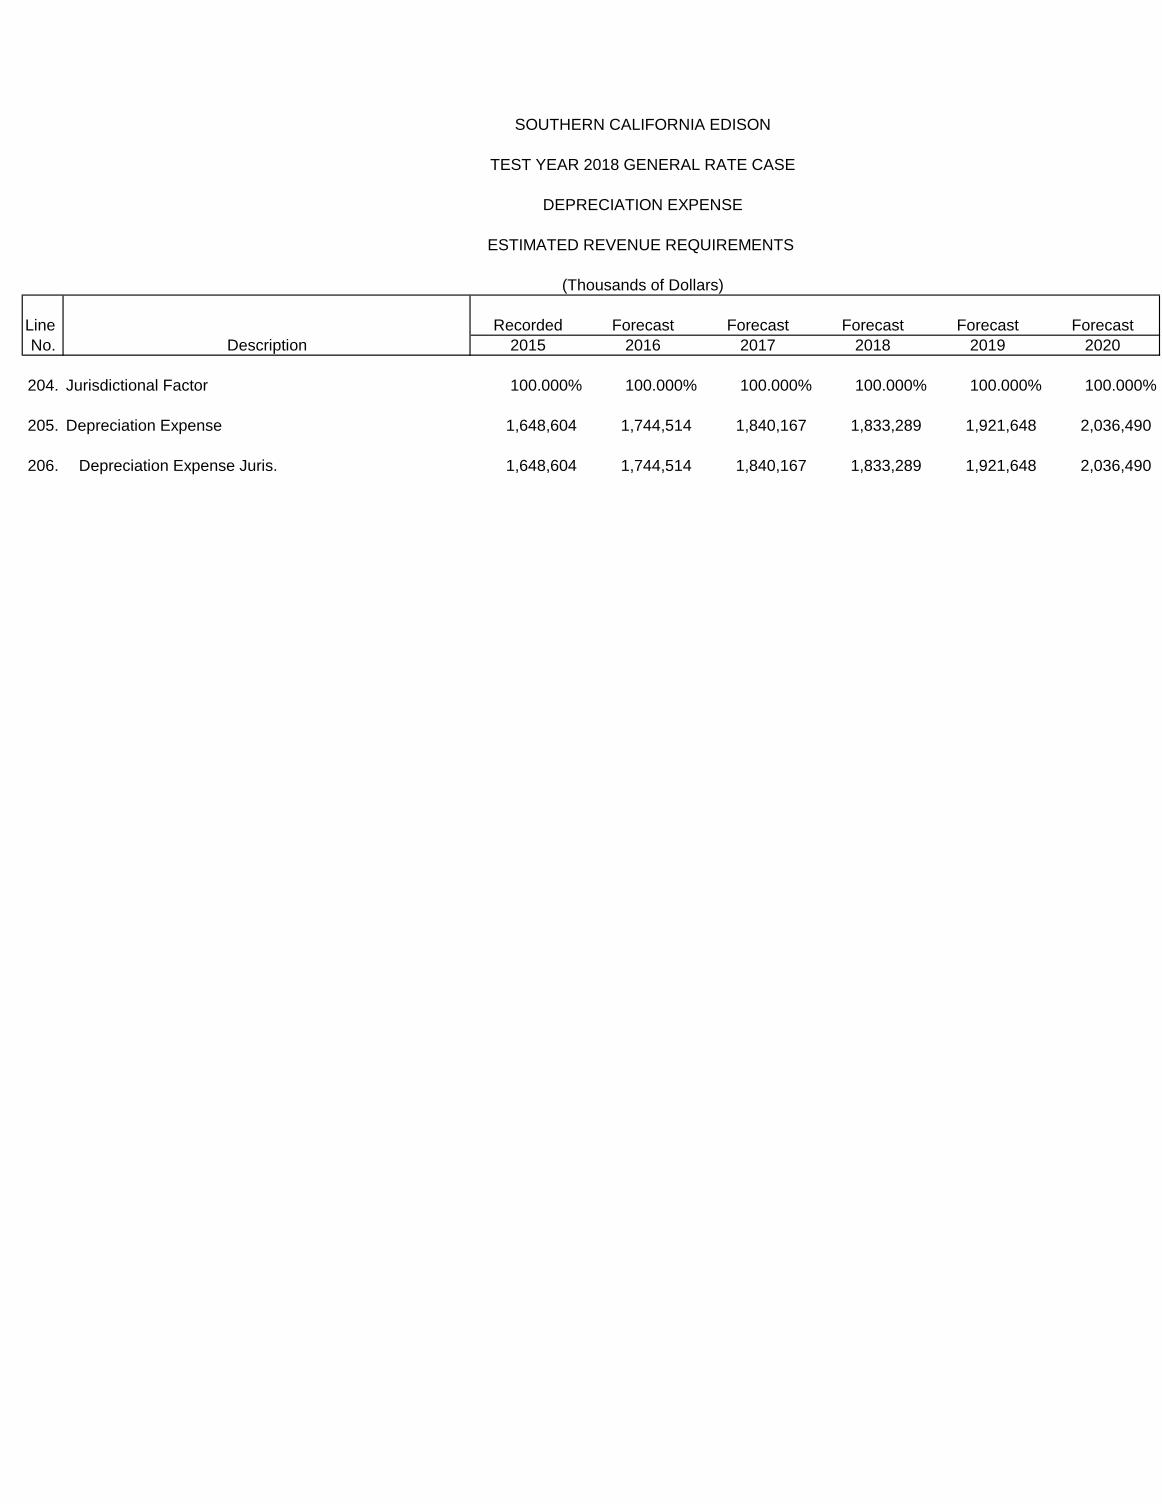
SOUTHERN CALIFORNIA EDISON
TEST YEAR 2018 GENERAL RATE CASE
DEPRECIATION EXPENSE
ESTIMATED REVENUE REQUIREMENTS
(Thousands of Dollars)
Line Recorded Forecast Forecast Forecast Forecast Forecast
No. Description 2015 2016 2017 2018 2019 2020
204. Jurisdictional Factor 100.000% 100.000% 100.000% 100.000% 100.000% 100.000%
205. Depreciation Expense 1,648,604 1,744,514 1,840,167 1,833,289 1,921,648 2,036,490
206. Depreciation Expense Juris. 1,648,604 1,744,514 1,840,167 1,833,289 1,921,648 2,036,490
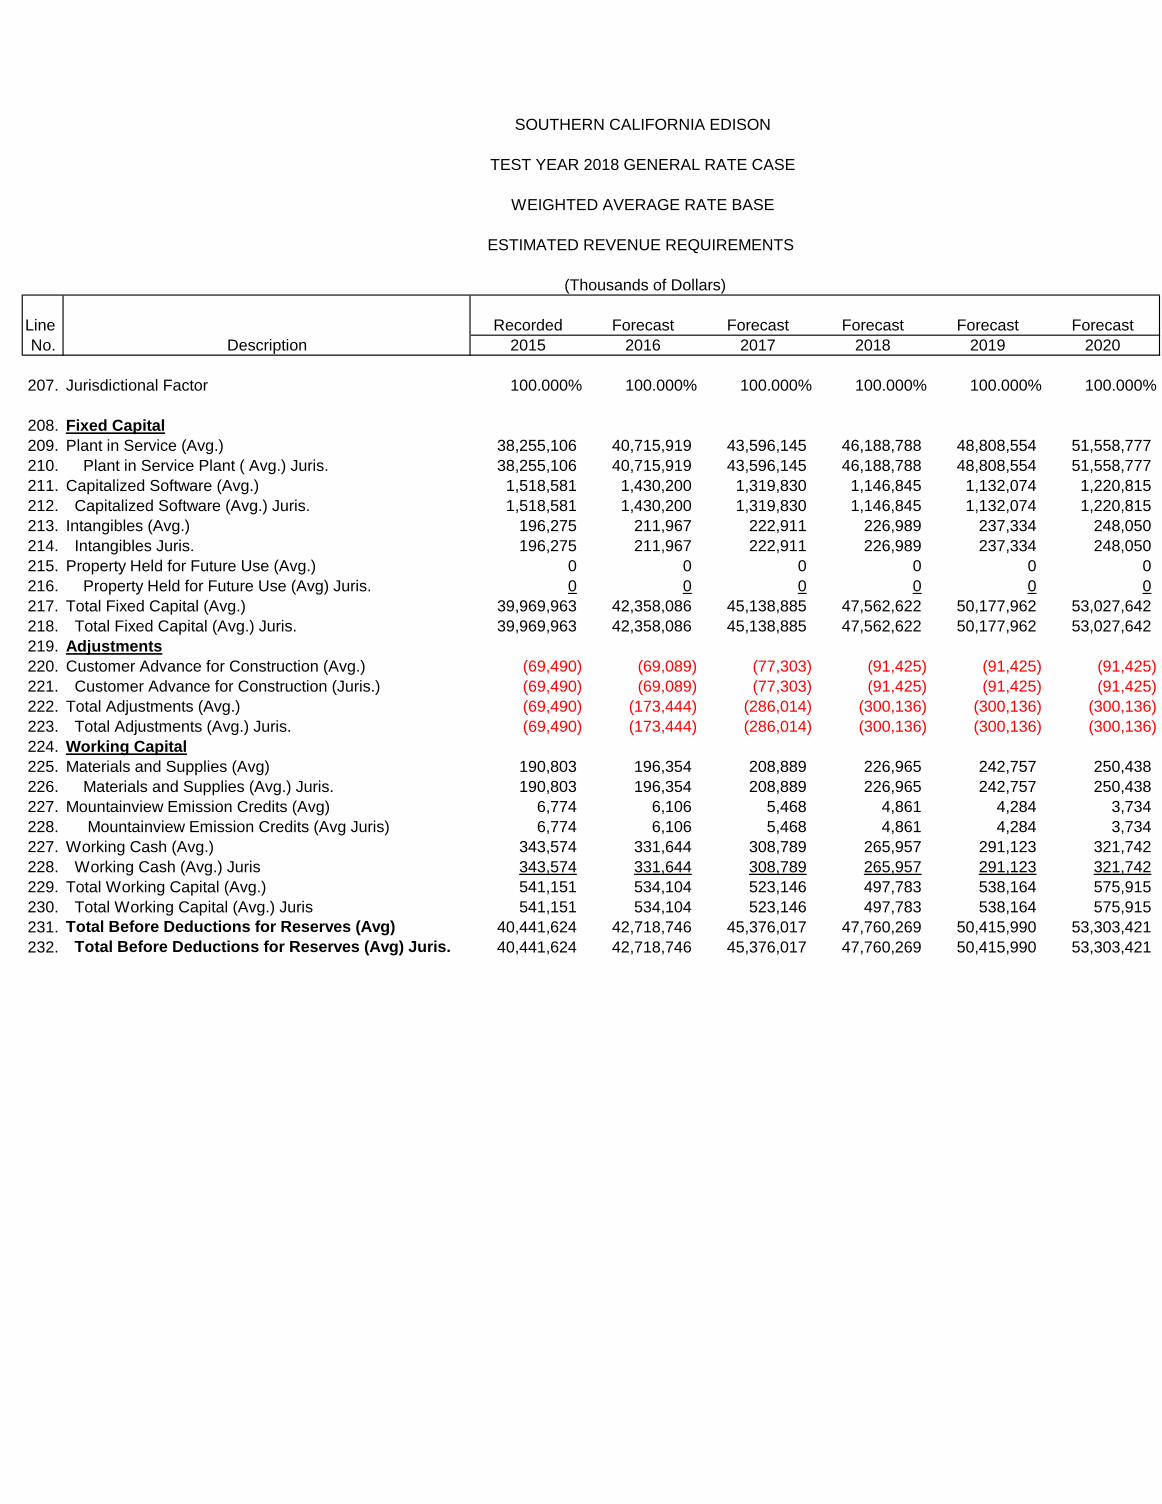
SOUTHERN CALIFORNIA EDISON
TEST YEAR 2018 GENERAL RATE CASE
WEIGHTED AVERAGE RATE BASE
ESTIMATED REVENUE REQUIREMENTS
(Thousands of Dollars)
Line Recorded Forecast Forecast Forecast Forecast Forecast
No. Description 2015 2016 2017 2018 2019 2020
207. Jurisdictional Factor 100.000% 100.000% 100.000% 100.000% 100.000% 100.000%
208. Fixed Capital
209. Plant in Service (Avg.) 38,255,106 40,715,919 43,596,145 46,188,788 48,808,554 51,558,777
210. Plant in Service Plant ( Avg.) Juris. 38,255,106 40,715,919 43,596,145 46,188,788 48,808,554 51,558,777
211. Capitalized Software (Avg.) 1,518,581 1,430,200 1,319,830 1,146,845 1,132,074 1,220,815
212. Capitalized Software (Avg.) Juris. 1,518,581 1,430,200 1,319,830 1,146,845 1,132,074 1,220,815
213. Intangibles (Avg.) 196,275 211,967 222,911 226,989 237,334 248,050
214. Intangibles Juris. 196,275 211,967 222,911 226,989 237,334 248,050
215. Property Held for Future Use (Avg.) 0 0 0 0 0 0
216. Property Held for Future Use (Avg) Juris. 0 0 0 0 0 0
217. Total Fixed Capital (Avg.) 39,969,963 42,358,086 45,138,885 47,562,622 50,177,962 53,027,642
218. Total Fixed Capital (Avg.) Juris. 39,969,963 42,358,086 45,138,885 47,562,622 50,177,962 53,027,642
219. Adjustments
220. Customer Advance for Construction (Avg.) (69,490) (69,089) (77,303) (91,425) (91,425) (91,425)
221. Customer Advance for Construction (Juris.) (69,490) (69,089) (77,303) (91,425) (91,425) (91,425)
222. Total Adjustments (Avg.) (69,490) (173,444) (286,014) (300,136) (300,136) (300,136)
223. Total Adjustments (Avg.) Juris. (69,490) (173,444) (286,014) (300,136) (300,136) (300,136)
224. Working Capital
225. Materials and Supplies (Avg) 190,803 196,354 208,889 226,965 242,757 250,438
226. Materials and Supplies (Avg.) Juris. 190,803 196,354 208,889 226,965 242,757 250,438
227. Mountainview Emission Credits (Avg) 6,774 6,106 5,468 4,861 4,284 3,734
228. Mountainview Emission Credits (Avg Juris) 6,774 6,106 5,468 4,861 4,284 3,734
227. Working Cash (Avg.) 343,574 331,644 308,789 265,957 291,123 321,742
228. Working Cash (Avg.) Juris 343,574 331,644 308,789 265,957 291,123 321,742
229. Total Working Capital (Avg.) 541,151 534,104 523,146 497,783 538,164 575,915
230. Total Working Capital (Avg.) Juris 541,151 534,104 523,146 497,783 538,164 575,915
231. Total Before Deductions for Reserves (Avg) 40,441,624 42,718,746 45,376,017 47,760,269 50,415,990 53,303,421
232. Total Before Deductions for Reserves (Avg) Juris. 40,441,624 42,718,746 45,376,017 47,760,269 50,415,990 53,303,421
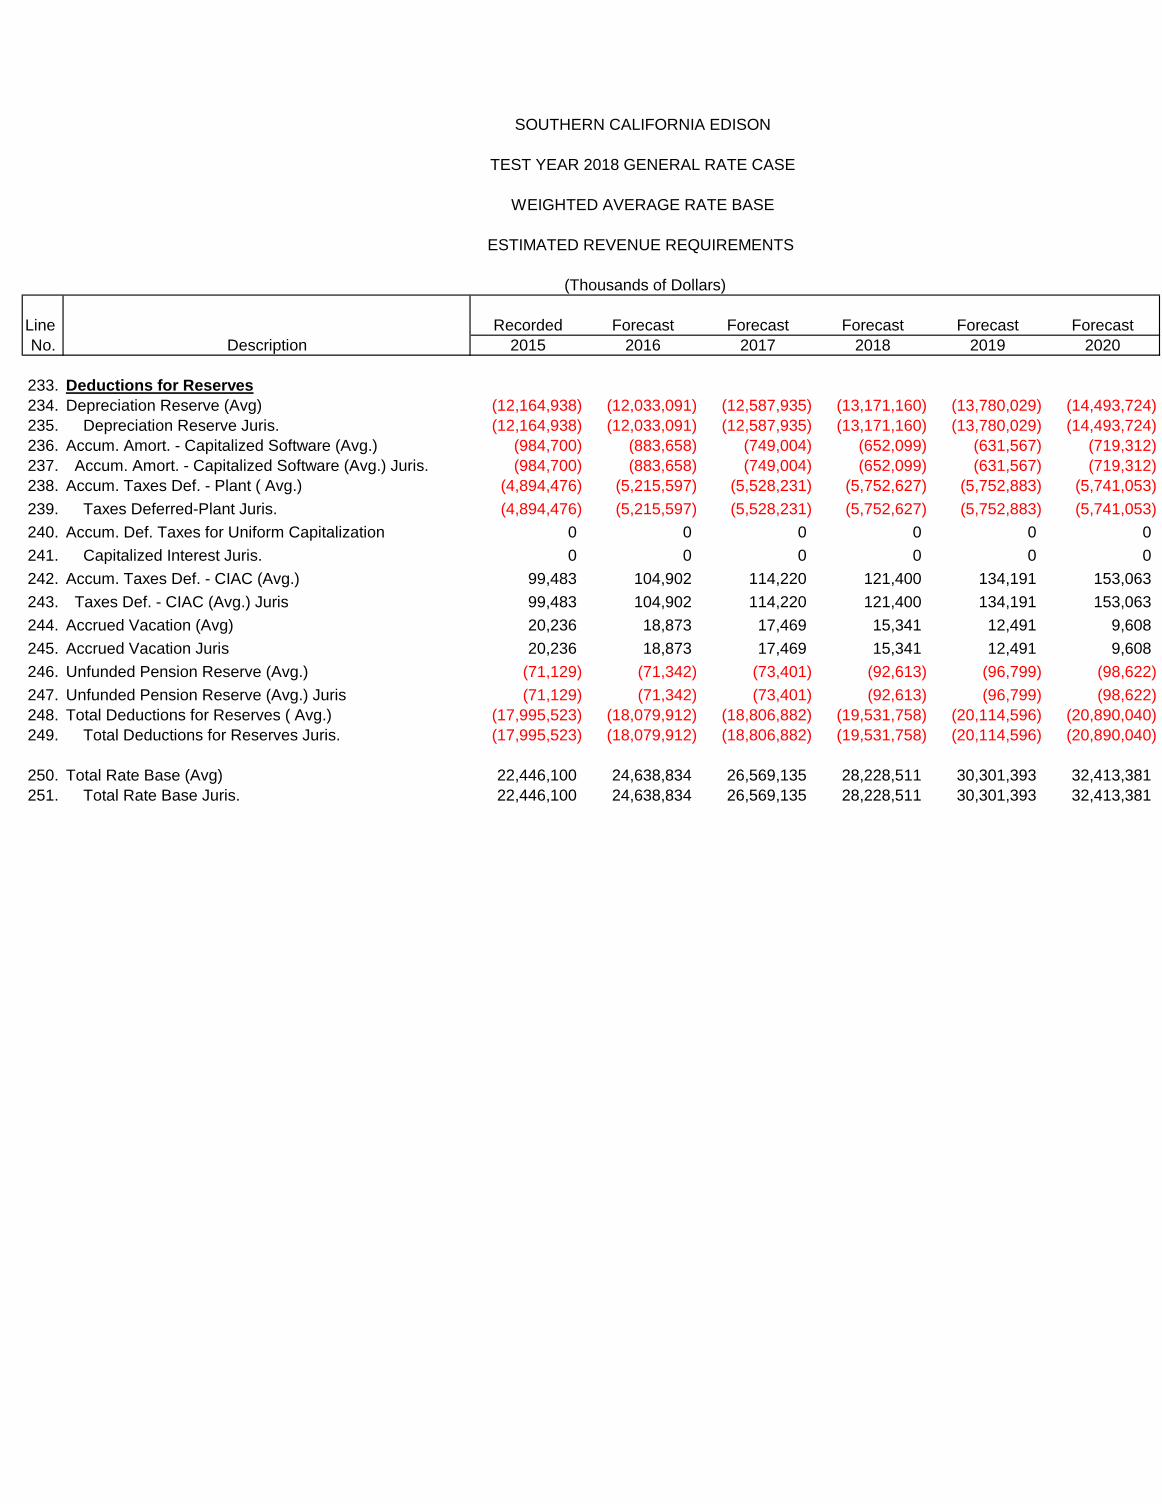
SOUTHERN CALIFORNIA EDISON
TEST YEAR 2018 GENERAL RATE CASE
WEIGHTED AVERAGE RATE BASE
ESTIMATED REVENUE REQUIREMENTS
(Thousands of Dollars)
Line Recorded Forecast Forecast Forecast Forecast Forecast
No. Description 2015 2016 2017 2018 2019 2020
233. Deductions for Reserves
234. Depreciation Reserve (Avg) (12,164,938) (12,033,091) (12,587,935) (13,171,160) (13,780,029) (14,493,724)
235. Depreciation Reserve Juris. (12,164,938) (12,033,091) (12,587,935) (13,171,160) (13,780,029) (14,493,724)
236. Accum. Amort. - Capitalized Software (Avg.) (984,700) (883,658) (749,004) (652,099) (631,567) (719,312)
237. Accum. Amort. - Capitalized Software (Avg.) Juris. (984,700) (883,658) (749,004) (652,099) (631,567) (719,312)
238. Accum. Taxes Def. - Plant ( Avg.) (4,894,476) (5,215,597) (5,528,231) (5,752,627) (5,752,883) (5,741,053)
239. Taxes Deferred-Plant Juris. (4,894,476) (5,215,597) (5,528,231) (5,752,627) (5,752,883) (5,741,053)
240. Accum. Def. Taxes for Uniform Capitalization 0 0 0 0 0 0
241. Capitalized Interest Juris. 0 0 0 0 0 0
242. Accum. Taxes Def. - CIAC (Avg.) 99,483 104,902 114,220 121,400 134,191 153,063
243. Taxes Def. - CIAC (Avg.) Juris 99,483 104,902 114,220 121,400 134,191 153,063
244. Accrued Vacation (Avg) 20,236 18,873 17,469 15,341 12,491 9,608
245. Accrued Vacation Juris 20,236 18,873 17,469 15,341 12,491 9,608
246. Unfunded Pension Reserve (Avg.) (71,129) (71,342) (73,401) (92,613) (96,799) (98,622)
247. Unfunded Pension Reserve (Avg.) Juris (71,129) (71,342) (73,401) (92,613) (96,799) (98,622)
248. Total Deductions for Reserves ( Avg.) (17,995,523) (18,079,912) (18,806,882) (19,531,758) (20,114,596) (20,890,040)
249. Total Deductions for Reserves Juris. (17,995,523) (18,079,912) (18,806,882) (19,531,758) (20,114,596) (20,890,040)
250. Total Rate Base (Avg) 22,446,100 24,638,834 26,569,135 28,228,511 30,301,393 32,413,381
251. Total Rate Base Juris. 22,446,100 24,638,834 26,569,135 28,228,511 30,301,393 32,413,381

SOUTHERN CALIFORNIA EDISON
TEST YEAR 2018 GENERAL RATE CASE
SUMMARY OF EARNINGS
ESTIMATED REVENUE REQUIREMENTS
(Thousands of Dollars)
Line Recorded Forecast Forecast Forecast Forecast Forecast
No. Description 2015 2016 2017 2018 2019 2020
252. Operating Revenues
253. Electric Revenues 6,080,010 6,214,538 6,597,528 6,129,374 6,495,766 6,989,162
254. Jurisdictional Factor 100.000% 100.000% 100.000% 100.000% 100.000% 100.000%
255. Total Operating Revenues Juris. 6,080,010 6,214,538 6,597,528 6,129,374 6,495,766 6,989,162
256. Operating Expenses
257. Escalation 0 32,502 70,031 101,525 155,882 206,919
258. Generation - Steam 7,338 7,444 7,124 6,251 6,251 6,251
259. Generation - Nuclear 79,681 76,747 76,747 76,747 76,747 76,747
260. Generation - Hydro 43,827 45,444 42,445 41,446 41,446 41,446
261. Generation - Other 78,825 80,993 79,346 81,962 81,962 81,962
262. Transmission 160,731 168,302 172,982 172,285 172,285 172,285
263. Distribution 527,573 545,035 540,807 500,556 500,556 500,556
264. Customer Accounts 165,163 158,223 152,669 155,395 155,395 155,395
265. Customer Service and Information 23,327 20,638 21,074 21,277 21,277 21,277
266. Total O&M Expenses 1,086,465 1,135,328 1,163,225 1,157,444 1,211,801 1,262,838
267. O&M Jurisdictional Factor 100.000% 100.000% 100.000% 100.000% 100.000% 100.000%
268. O&M Expenses Juris. 1,086,465 1,135,328 1,163,225 1,157,444 1,211,801 1,262,838
269. Administrative and General 860,385 841,489 827,878 647,654 641,390 640,984
270. Total A&G Expenses 860,385 841,489 827,878 647,654 641,390 640,984
271. A & G Jurisdictional Factor 100.000% 100.000% 100.000% 100.000% 100.000% 100.000%
272. Administrative & General Juris. 860,385 841,489 827,878 647,654 641,390 640,984
273. Revenue Credits 214,563 203,192 208,251 202,131 208,196 212,083
274. Other 0 0 0 0 0 0
275. Uncollectibles 11,755 14,791 15,702 12,933 13,706 14,747
276. Franchise Requirements - Total System 50,763 56,521 60,005 56,047 59,397 63,909
277. Franchise Requirements - CPUC Juris. 50,763 56,521 60,005 56,047 59,397 63,909
278. Subtotal - System 1,794,805 1,844,936 1,858,559 1,671,947 1,718,099 1,770,395
279. Subtotal Juris. 1,794,805 1,844,936 1,858,559 1,671,947 1,718,099 1,770,395

SOUTHERN CALIFORNIA EDISON
TEST YEAR 2018 GENERAL RATE CASE
SUMMARY OF EARNINGS
ESTIMATED REVENUE REQUIREMENTS
(Thousands of Dollars)
Line Recorded Forecast Forecast Forecast Forecast Forecast
No. Description 2015 2016 2017 2018 2019 2020
280. Depreciation - System 1,648,604 1,744,514 1,840,167 1,833,289 1,921,648 2,036,490
281. Depreciation Juris. 1,648,604 1,744,514 1,840,167 1,833,289 1,921,648 2,036,490
282. Taxes Other Than On Income - System 336,788 351,253 372,967 382,660 404,557 431,841
283. Taxes Other Than On Income Juris. 336,788 351,253 372,967 382,660 404,557 431,841
284. Taxes Based On Income - System 348,813 327,367 426,873 93,514 145,769 261,348
285. Taxes Based On Income Juris. 348,813 327,367 426,873 93,514 145,769 261,348
286. Total Taxes - System 685,601 678,620 799,840 476,174 550,326 693,188
287. Total Taxes Juris. 685,601 678,620 799,840 476,174 550,326 693,188
288. Total Operating Expenses - System 4,129,010 4,268,070 4,498,566 3,981,410 4,190,073 4,500,074
289. Total Operating Expenses Juris. 4,129,010 4,268,070 4,498,566 3,981,410 4,190,073 4,500,074
290. Net Operating Revenue - System 1,951,000 1,946,468 2,098,962 2,147,964 2,305,694 2,489,088
291. Net Operating Revenue Juris. 1,951,000 1,946,468 2,098,962 2,147,964 2,305,694 2,489,088
292. Rate Base - System (Average)-System 22,446,100 24,638,834 26,569,135 28,228,511 30,301,393 32,413,381
293. Rate Base Juris. 22,446,100 24,638,834 26,569,135 28,228,511 30,301,393 32,413,381
294. Rate of Return-System 8.69% 7.90% 7.90% 7.61% 7.61% 7.68%
295. Rate of Return Juris. 8.69% 7.90% 7.90% 7.61% 7.61% 7.68%

Preliminary Statements2018 GRC Authorized Amounts

SCE 2018 GRC
Authorized Prelimary Statements
$ in Thousands
2018 2019 2020
Total Total Total Total Total Total
Preliminary Company Company CPUC Company Company CPUC Company Company CPUC
Statements Mechanism 2015$ 2018$ 2018$ 2015$ 2019$ 2019$ 2015$ 2020$ 2020$
N Short-Term Incentive Program (Total Authorized) 70,181 76,500 74,763 69,877 78,484 77,037 69,877 81,212 79,712
Distribution
T&D 27,912 30,425 30,210 27,912 31,350 31,129 27,912 32,439 32,210
CSBU 13,400 14,607 14,607 13,400 15,051 15,051 13,400 15,574 15,574
A&G 19,847 21,634 20,111 19,584 21,996 20,770 19,584 22,761 21,490
Total Distribution STIP 61,159 66,666 64,928 60,896 68,397 66,950 60,896 70,774 69,274
Less Capitalization (27,827) (30,333) (29,542) (27,708) (31,121) (30,462) (27,708) (32,202) (31,520)
Total Distribution (Net of Capitalization) 33,332 36,333 35,386 33,188 37,276 36,488 33,188 38,572 37,754
(947)
Generation
Generation 5,925 6,459 6,459 5,925 6,655 6,655 5,925 6,886 6,886
A&G 3,097 3,376 3,376 3,056 3,432 3,432 3,056 3,552 3,552
Total Generation 9,022 9,835 9,835 8,981 10,087 10,087 8,981 10,438 10,438
Less Capitalization (4,105) (4,475) (4,475) (4,086) (4,590) (4,590) (4,086) (4,749) (4,749)
Total Generation (Net of Capitalization) 4,917 5,360 5,360 4,895 5,497 5,497 4,895 5,689 5,689
Total STIP (Net of Capitalization) 38,249 41,693 40,746 38,083 42,773 41,985 38,083 44,261 43,443
Checks – – –
OO Pension (Service | Total Authorized) 121,567 121,567 114,163 121,414 114,020 121,414 114,020
Pension (Non-Service | Total Authorized) (63,826) (63,826) (59,939) (63,696) (59,817) (63,696) (59,817)
Distribution (Service | Net of Capitalization) 105,156 105,156 97,752 105,024 97,630 105,024 97,630
Less Capitalization (47,846) (47,846) (44,477) (47,786) (44,422) (47,786) (44,422)
Total Distribution (Service | Net of Capitalization) 57,310 57,310 53,275 57,238 53,208 57,238 53,208
Total Distribution (Non-Service) (55,210) (55,210) (51,848) (55,098) (51,742) (55,098) (51,742)
Total Distribution (Service + Non-Service | Net of Capitalization) 2,100 2,100 1,427 2,140 1,466 2,140 1,466
Generation (Service | Net of Capitalization) 16,411 16,411 16,411 16,390 16,390 16,390 16,390
Less Capitalization (7,467) (7,467) (7,467) (7,457) (7,457) (7,457) (7,457)
Total Generation (Service | Net of Capitalization) 8,944 8,944 8,944 8,933 8,933 8,933 8,933
Total Generation (Non-Service) (8,616) (8,616) (8,091) (8,599) (8,075) (8,599) (8,075)
Total Generation (Service + Non-Service | Net of Capitalization) 328 328 853 334 858 334 858
Total Pension (Net of Capitalization) 2,428 2,428 2,280 2,474 2,324 2,474 2,324
Checks – – –
PP PBOPs (Service | Total Authorized) 31,480 31,480 29,563 33,626 31,578 35,920 33,732
PBOPs (Non-Service | Total Authorized) (27,630) (27,630) (25,947) (29,557) (27,757) (31,619) (29,693)
Distribution (Service | Net of Capitalization) 27,230 27,230 25,313 29,087 27,039 31,071 28,883
Less Capitalization (12,390) (12,390) (11,517) (13,235) (12,303) (14,137) (13,142)
Total Distribution (Service | Net of Capitalization) 14,840 14,840 13,796 15,852 14,736 16,934 15,741
Total Distribution (Non-Service) (23,900) (23,900) (22,444) (25,567) (24,010) (27,351) (25,685)
Total Distribution (Service + Non-Service | Net of Capitalization) (9,060) (9,060) (8,648) (9,715) (9,274) (10,417) (9,944)
Generation (Service | Net of Capitalization) 4,250 4,250 4,250 4,539 4,539 4,849 4,849
Less Capitalization (1,934) (1,934) (1,934) (2,065) (2,065) (2,206) (2,206)
Total Generation (Service | Net of Capitalization) 2,316 2,316 2,316 2,474 2,474 2,643 2,643
Total Generation (Non-Service) (3,730) (3,730) (3,503) (3,990) (3,747) (4,268) (4,008)
Total Generation (Service + Non-Service | Net of Capitalization) (1,414) (1,414) (1,187) (1,516) (1,273) (1,625) (1,365)
Total PBOP (Service + Non-Service | Net of Capitalization) (10,474) (10,474) (9,835) (11,231) (10,547) (12,042) (11,309)
Checks – – (1)
VV Medical Programs Balancing Account
Dental 14,467 14,467 13,586 15,021 14,106 15,652 14,699
Medical 106,534 106,534 100,046 113,588 106,670 121,539 114,137
Vision 3,313 3,313 3,111 3,400 3,193 3,502 3,289
Total Medical 124,314 124,314 116,743 132,009 123,969 140,693 132,125
Distribution 107,533 107,533 99,961 114,189 106,149 121,700 113,132
Less Capitalization (48,928) (48,928) (45,482) (51,956) (48,298) (55,374) (51,475)
Total Distribution (Net of Capitalization) 58,605 58,605 54,479 62,233 57,851 66,326 61,657
Generation 16,781 16,781 16,781 17,820 17,820 18,993 18,993
Less Capitalization (7,635) (7,635) (7,635) (8,108) (8,108) (8,642) (8,642)
Total Generation (Net of Capitalization) 9,146 9,146 9,146 9,712 9,712 10,351 10,351
Total Medical (Net of Capitalization) 67,751 67,751 63,625 71,945 67,563 76,677 72,008
Checks (1) – –
J Pole Loading Program BA
O&M: Transmission - 566 & 571.125 2,850 2,887 1,525 2,850 2,941 1,554 2,850 2,984 1,577
O&M: Distribution - 583 & 593.125 26,257 26,770 26,581 26,257 27,385 27,191 26,257 27,874 27,677
FF&U 2,112 2,094 2,607 2,589 3,218 3,199
Depreciation 74,153 74,153 88,277 88,277 102,629 102,629
Taxes (55,489) (55,489) (51,243) (51,243) (38,236) (38,236)
Return 137,202 137,202 161,661 161,661 187,450 187,450
Total Pole Loading 29,107 187,635 186,066 29,107 231,628 230,029 29,107 285,919 284,296
TOTAL O&M 124,922 130,070 135,720TOTAL O&M AND CAPITAL 282,882 331,354 390,762

2018 GRC
Summary of EarningsPole Loading & Detoriated Poles Program Balancing Account

SOUTHERN CALIFORNIA EDISON
TEST YEAR 2018 GENERAL RATE CASE
POLE LOADING PROGRAM (PLP)
N-T-G MULTIPLIER
ESTIMATED REVENUE REQUIREMENTS
Line Recorded Forecast Forecast Forecast Forecast Forecast
No. Description 2015 2016 2017 2018 2019 2020
1. Revenues 1.0000 1.0000 1.0000 1.0000 1.0000 1.0000
2. Uncollectibles Tax Rate 0.00238 0.00238 0.00238 0.00211 0.00211 0.00211
3. Uncollectibles Amount Applied 1.0000 1.0000 1.0000 1.0000 1.0000 1.0000 ________ ________ ________ ________ ________ ________
4. Uncollectibles Juris. 0.0024 0.0024 0.0024 0.0021 0.0021 0.0021
5. Subtotal 0.9976 0.9976 0.9976 0.9979 0.9979 0.9979
6. Franchise Fees Tax Rate 0.009095 0.009095 0.009095 0.009144 0.009144 0.009144
7. Franchise Fees Amount Applied 1.0000 1.0000 1.0000 1.0000 1.0000 1.0000 ________ ________ ________ ________ ________ ________
8. Franchise Fees Juris. 0.0091 0.0091 0.0091 0.0091 0.0091 0.0091
9. Subtotal 0.9885 0.9885 0.9885 0.9887 0.9887 0.9887
10. Arizona/New Mexico/D.C. Income Tax Rates 0.000269738 0.000269738 0.000269738 0.000000 0.000000 0.000000
11. Other State I.T. Amount Applied 0.9885 0.9885 0.9885 0.9887 0.9887 0.9887 ________ ________ ________ ________ ________ ________
12. Other State I.T. Juris. 0.0003 0.0003 0.0003 0.0000 0.0000 0.0000
13. Subtotal 0.9883 0.9883 0.9883 0.9887 0.9887 0.9887
14. S. I. T. Rate 0.0884 0.0884 0.0884 0.0884 0.0884 0.0884
15. S. I. T. Amount Applied 0.9885 0.9885 0.9885 0.9887 0.9887 0.9887 ________ ________ ________ ________ ________ ________
16. S. I. T. Juris. 0.0874 0.0874 0.0874 0.0874 0.0874 0.0874
17. Subtotal 0.9009 0.9009 0.9009 0.9013 0.9013 0.9013
18. Federal Income Tax 0.35 0.35 0.35 0.21 0.21 0.21
19. Federal Income Tax Amount Applied 0.9883 0.9883 0.9883 0.9887 0.9887 0.9887 ________ ________ ________ ________ ________ ________
20. Federal Income Tax Juris. 0.3459 0.3459 0.3459 0.2076 0.2076 0.2076
21. Net Operating Revenues 0.5550 0.5550 0.5550 0.6937 0.6937 0.6937
22. Uncollectible and Franchise Fees Factor 1.011608 1.011608 1.011608 1.011382 1.011382 1.011382
23. N-T-G MULTIPLIER 1.8019 1.8019 1.8019 1.4415 1.4415 1.4415

SOUTHERN CALIFORNIA EDISON
TEST YEAR 2018 GENERAL RATE CASE
POLE LOADING PROGRAM (PLP)
RATE OF RETURN
ESTIMATED REVENUE REQUIREMENTS
Line Recorded Forecast Forecast Forecast Forecast Forecast
No. Description 2015 2016 2017 2018 2019 2020
1. Cost Factor
2. Long-Term Debt 5.49% 5.49% 5.49% 4.98% 4.98% 4.74%
3. Preferred Stock 5.79% 5.79% 5.79% 5.82% 5.82% 5.70%
4. Equity 10.45% 10.45% 10.45% 10.30% 10.30% 10.30%
5. Capitalization Ratios
6. Long-Term Debt 43.00% 43.00% 43.00% 43.00% 43.00% 43.00%
7. Preferred Stock 9.00% 9.00% 9.00% 9.00% 9.00% 5.00%
8. Equity 48.00% 48.00% 48.00% 48.00% 48.00% 52.00%
9. Weighted Cost
10. Long-Term Debt 2.36% 2.36% 2.36% 2.14% 2.14% 2.04%
11. Preferred Stock 0.52% 0.52% 0.52% 0.52% 0.52% 0.29%
12. Equity 5.02% 5.02% 5.02% 4.94% 4.94% 5.36%
13. Return on Rate Base 7.90% 7.90% 7.90% 7.61% 7.61% 7.68%

SOUTHERN CALIFORNIA EDISON
TEST YEAR 2018 GENERAL RATE CASE
POLE LOADING PROGRAM (PLP)
TAXES - OTHER
ESTIMATED REVENUE REQUIREMENTS
(Thousands of Dollars)
Line Recorded Forecast Forecast Forecast Forecast Forecast
No. Description 2015 2016 2017 2018 2019 2020
1. Jurisdictional Factor 100.000% 100.000% 100.000% 100.000% 100.000% 100.000%
2. Ad Valorem Taxes 4,831 4,831 12,533 17,790 22,300 26,559
3. Ad Valorem Taxes Jurisdictionalized 4,831 4,831 12,533 17,790 22,300 26,559 ________ ________ ________ ________ ________ ________
4. Total Ad Valorem Taxes 4,831 4,831 12,533 17,790 22,300 26,559
5. Total Ad Valorem Taxes Juris. 4,831 4,831 12,533 17,790 22,300 26,559
6. Payroll Taxes
7. Federal Insurance Contribution Act (FICA) 634 635 684 137 137 137
8. FICA Jurisdictionalized 634 635 684 137 137 137
9. Federal Unemployment Tax Act 0 0 0 0 0 0
10. Federal Unemployment Tax Act Juris. 0 0 0 0 0 0
11. State Unemployment Tax Act 0 0 0 0 0 0
12. State Unemployment Tax Act Juris. 0 0 0 0 0 0 ________ ________ ________ ________ ________ ________
13. Total Payroll Taxes 634 635 684 137 137 137
14. Total Payroll Taxes Juris. 634 635 684 137 137 137
10. Total Taxes Other Than Income 5,465 5,466 13,217 17,927 22,437 26,696
11. Total Taxes Other Than Income Juris. 5,465 5,466 13,217 17,927 22,437 26,696

SOUTHERN CALIFORNIA EDISON
TEST YEAR 2018 GENERAL RATE CASE
POLE LOADING PROGRAM (PLP)
INCOME TAX ADJUSTMENTS
ESTIMATED REVENUE REQUIREMENTS
(Thousands of Dollars)
Line Recorded Forecast Forecast Forecast Forecast Forecast
No. Description 2015 2016 2017 2018 2019 2020
1. California Income Tax Adjustments
2. Fed and State Inc. Tax Adjust. Juris. Fac. 100.000% 100.000% 100.000% 100.000% 100.000% 100.000%
3. Tax Depreciation 11,022 15,820 15,552 15,394 14,839 13,751
4. Tax Depreciation Juris. 11,022 15,820 15,552 15,394 14,839 13,751
5. Interest On Long-Term Debt 15,701 25,206 34,750 38,612 45,495 49,753
6. Interest On Long-Term Debt Juris. 15,701 25,206 34,750 38,612 45,495 49,753
7. Interest On Accumulated Deferred ITC 0 0 0 0 0 0
8. Interest On Accum. Deferred ITC Juris. 0 0 0 0 0 0
9. Uniform Capitalization 0 0 0 0 0 0
10. Uniform Capitalization Juris. 0 0 0 0 0 0
11. Capitalized Software 0 0 0 0 0 0
12. Capitalized Software Juris 0 0 0 0 0 0
13. Ad Valorem Lien Date Adjustment 4,830 4,830 2,873 2,383 2,127 2,133
14. Ad Valorem Lien Date Adjustment Juris. 4,830 4,830 2,873 2,383 2,127 2,133
15. Percentage Repair Allowance 0 0 0 0 0 0
16. Percentage Repair Allowance Juris 0 0 0 0 0 0
17. Removal Costs 168,333 130,307 100,300 100,814 105,924 106,312
18. Removal Costs Juris 168,333 130,307 100,300 100,814 105,924 106,312
19. Amortization of Land Rights 0 0 0 0 0 0
20. Amortization of Land Rights Juris. 0 0 0 0 0 0
21. Salvage Warehouse Expense 0 0 0 0 0 0
22. Salvage Warehouse Expense Juris 0 0 0 0 0 0
23. CIAC Revenues 0 0 0 0 0 0
24. CIAC Revenues Juris 0 0 0 0 0 0
25. Non Deductible Meals 0 0 0 0 0 0
26. Non Deductible Meals Juris 0 0 0 0 0 0
27. Repair Deduction 244,173 298,532 312,481 279,325 297,652 311,191
28. Repair Deduction - Juirs 244,173 298,532 312,481 279,325 297,652 311,191
29. Leased Vehicles 0 0 0 0 0 0
30. Leased Vehicles Juris 0 0 0 0 0 0 ________ ________ ________ ________ ________ ________
31. Total CCFT Adjustments 444,059 474,695 465,955 436,528 466,038 483,139
32. Total CCFT Adjustments Juris. 444,059 474,695 465,955 436,528 466,038 483,139

SOUTHERN CALIFORNIA EDISON
TEST YEAR 2018 GENERAL RATE CASE
POLE LOADING PROGRAM (PLP)
INCOME TAX ADJUSTMENTS
ESTIMATED REVENUE REQUIREMENTS
(Thousands of Dollars)
Line Recorded Forecast Forecast Forecast Forecast Forecast
No. Description 2015 2016 2017 2018 2019 2020
1. Federal Income Tax Adjustments
2. Tax Depreciation 85,047 8,948 9,651 9,776 9,460 8,632
3. Tax Depreciation Juris. 85,047 8,948 9,651 9,776 9,460 8,632
4. Interest On Long-Term Debt 15,701 25,206 34,750 38,612 45,495 49,753
5. Interest On Long-Term Debt Juris. 15,701 25,206 34,750 38,612 45,495 49,753
6. Uniform Capitalization 0 0 0 0 0 0
7. Uniform Capitalization Juris. 0 0 0 0 0 0
8. Capitalized Software 0 0 0 0 0 0
9. Capitalized Software Juris 0 0 0 0 0 0
10. Ad Valorem Lien Date Adjustment 4,830 4,830 2,873 2,383 2,127 2,133
11. Ad Valorem Lien Date Adjustment Juris. 4,830 4,830 2,873 2,383 2,127 2,133
12. Percentage Repair Allowance 0 0 0 0 0 0
13. Percentage Repair Allowance Juris 0 0 0 0 0 0
14. Removal Costs 168,333 130,307 100,300 100,814 105,924 106,312
15. Removal Costs Juris 168,333 130,307 100,300 100,814 105,924 106,312
16. Amortization of Land Rights 0 0 0 0 0 0
17. Amortization of Land Rights Juris. 0 0 0 0 0 0
18. Salvage Warehouse Expense 0 0 0 0 0 0
19. Salvage Warehouse Expense Juris 0 0 0 0 0 0
20. CIAC Revenues 0 0 0 0 0 0
21. CIAC Revenues Juris 0 0 0 0 0 0
22. Non Deductible Meals 0 0 0 0 0 0
23. Non Deductible Meals Juris 0 0 0 0 0 0
24. Excess Compensation 0 0 0 0 0 0
25. Excess Compensation Juris 0 0 0 0 0 0
26. Leased Vehicles 0 0 0 0 0 0
27. Leased Vehicles Juris 0 0 0 0 0 0
28. Repair Deduction 244,173 298,532 312,481 279,325 297,652 311,191
29. Repair Deduction - Juirs 244,173 298,532 312,481 279,325 297,652 311,191 ________ ________ ________ ________ ________ ________
30. Total FIT Adjustments 518,084 467,824 460,054 430,911 460,658 478,020
31. Total FIT Adjustments Juris. 518,084 467,824 460,054 430,911 460,658 478,020
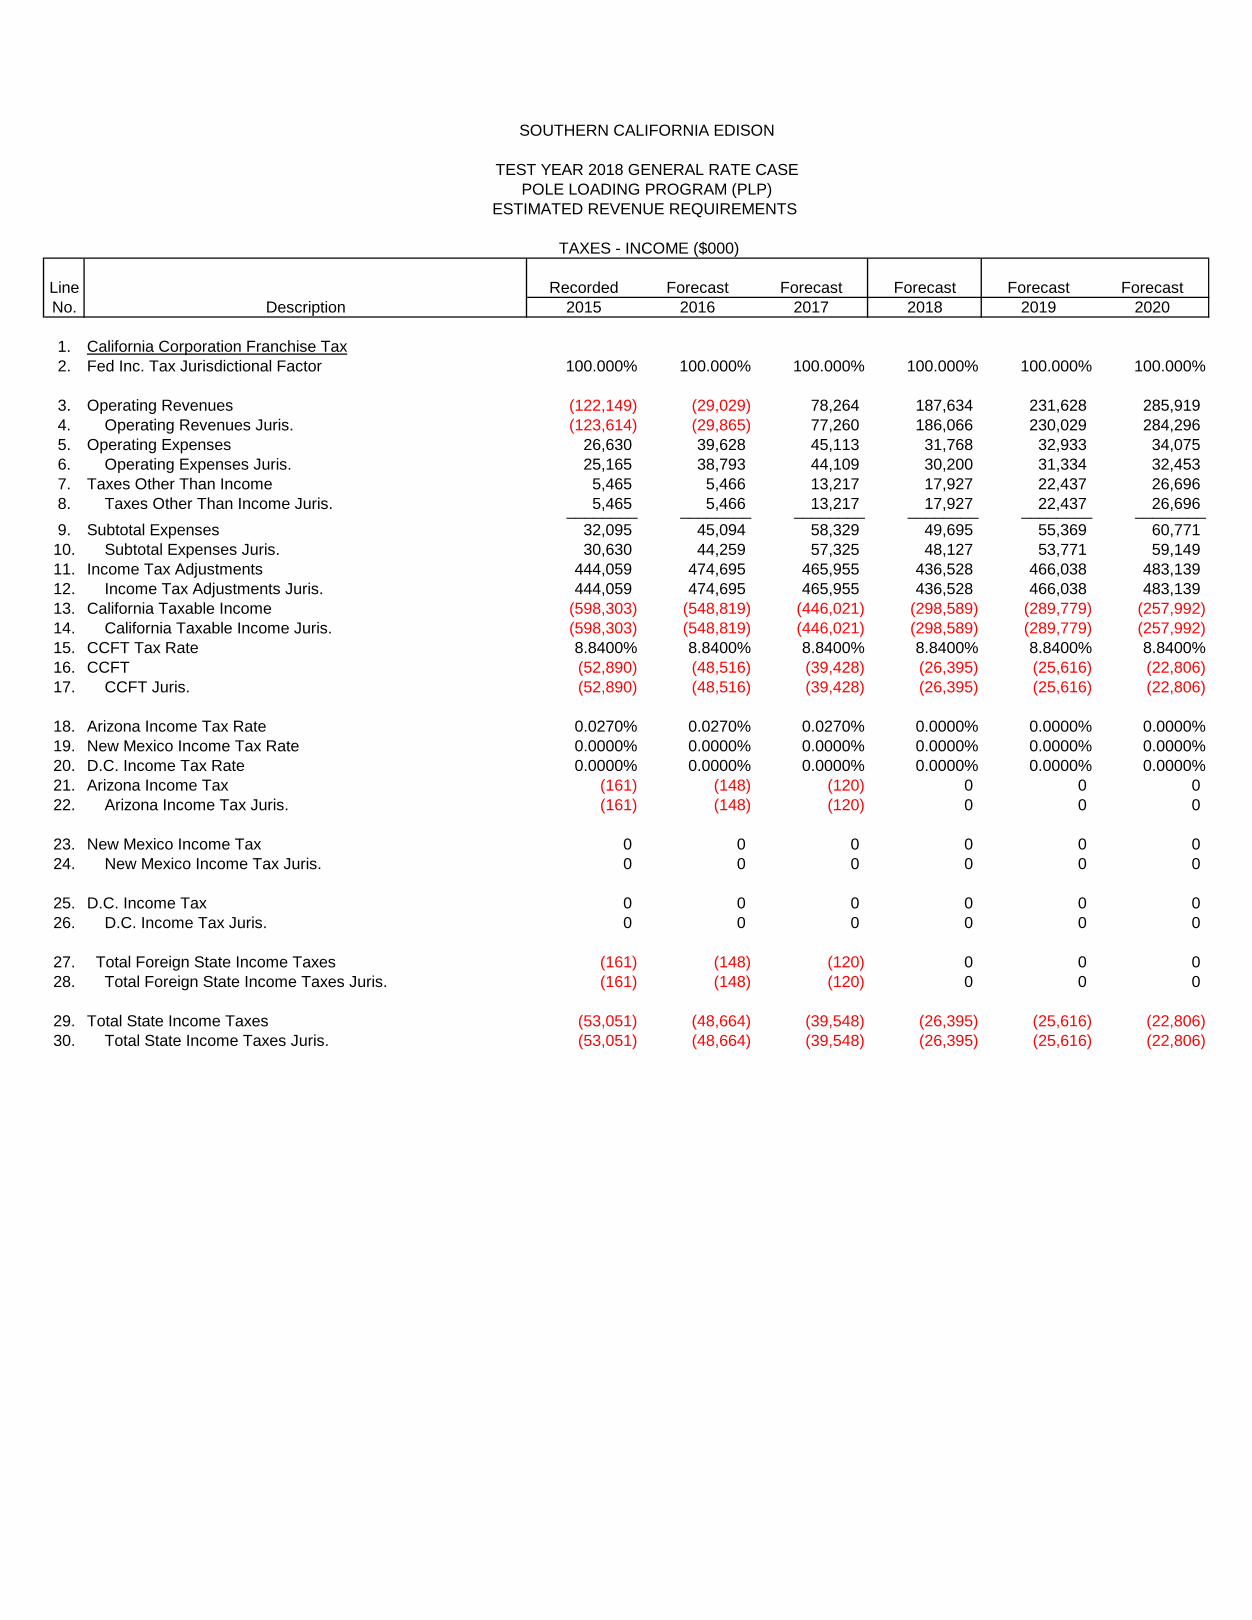
SOUTHERN CALIFORNIA EDISON
TEST YEAR 2018 GENERAL RATE CASE
POLE LOADING PROGRAM (PLP)
ESTIMATED REVENUE REQUIREMENTS
TAXES - INCOME ($000)
Line Recorded Forecast Forecast Forecast Forecast Forecast
No. Description 2015 2016 2017 2018 2019 2020
1. California Corporation Franchise Tax
2. Fed Inc. Tax Jurisdictional Factor 100.000% 100.000% 100.000% 100.000% 100.000% 100.000%
3. Operating Revenues (122,149) (29,029) 78,264 187,634 231,628 285,919
4. Operating Revenues Juris. (123,614) (29,865) 77,260 186,066 230,029 284,296
5. Operating Expenses 26,630 39,628 45,113 31,768 32,933 34,075
6. Operating Expenses Juris. 25,165 38,793 44,109 30,200 31,334 32,453
7. Taxes Other Than Income 5,465 5,466 13,217 17,927 22,437 26,696
8. Taxes Other Than Income Juris. 5,465 5,466 13,217 17,927 22,437 26,696 ________ ________ ________ ________ ________ ________
9. Subtotal Expenses 32,095 45,094 58,329 49,695 55,369 60,771
10. Subtotal Expenses Juris. 30,630 44,259 57,325 48,127 53,771 59,149
11. Income Tax Adjustments 444,059 474,695 465,955 436,528 466,038 483,139
12. Income Tax Adjustments Juris. 444,059 474,695 465,955 436,528 466,038 483,139
13. California Taxable Income (598,303) (548,819) (446,021) (298,589) (289,779) (257,992)
14. California Taxable Income Juris. (598,303) (548,819) (446,021) (298,589) (289,779) (257,992)
15. CCFT Tax Rate 8.8400% 8.8400% 8.8400% 8.8400% 8.8400% 8.8400%
16. CCFT (52,890) (48,516) (39,428) (26,395) (25,616) (22,806)
17. CCFT Juris. (52,890) (48,516) (39,428) (26,395) (25,616) (22,806)
18. Arizona Income Tax Rate 0.0270% 0.0270% 0.0270% 0.0000% 0.0000% 0.0000%
19. New Mexico Income Tax Rate 0.0000% 0.0000% 0.0000% 0.0000% 0.0000% 0.0000%
20. D.C. Income Tax Rate 0.0000% 0.0000% 0.0000% 0.0000% 0.0000% 0.0000%
21. Arizona Income Tax (161) (148) (120) 0 0 0
22. Arizona Income Tax Juris. (161) (148) (120) 0 0 0
23. New Mexico Income Tax 0 0 0 0 0 0
24. New Mexico Income Tax Juris. 0 0 0 0 0 0
25. D.C. Income Tax 0 0 0 0 0 0
26. D.C. Income Tax Juris. 0 0 0 0 0 0
27. Total Foreign State Income Taxes (161) (148) (120) 0 0 0
28. Total Foreign State Income Taxes Juris. (161) (148) (120) 0 0 0
29. Total State Income Taxes (53,051) (48,664) (39,548) (26,395) (25,616) (22,806)
30. Total State Income Taxes Juris. (53,051) (48,664) (39,548) (26,395) (25,616) (22,806)
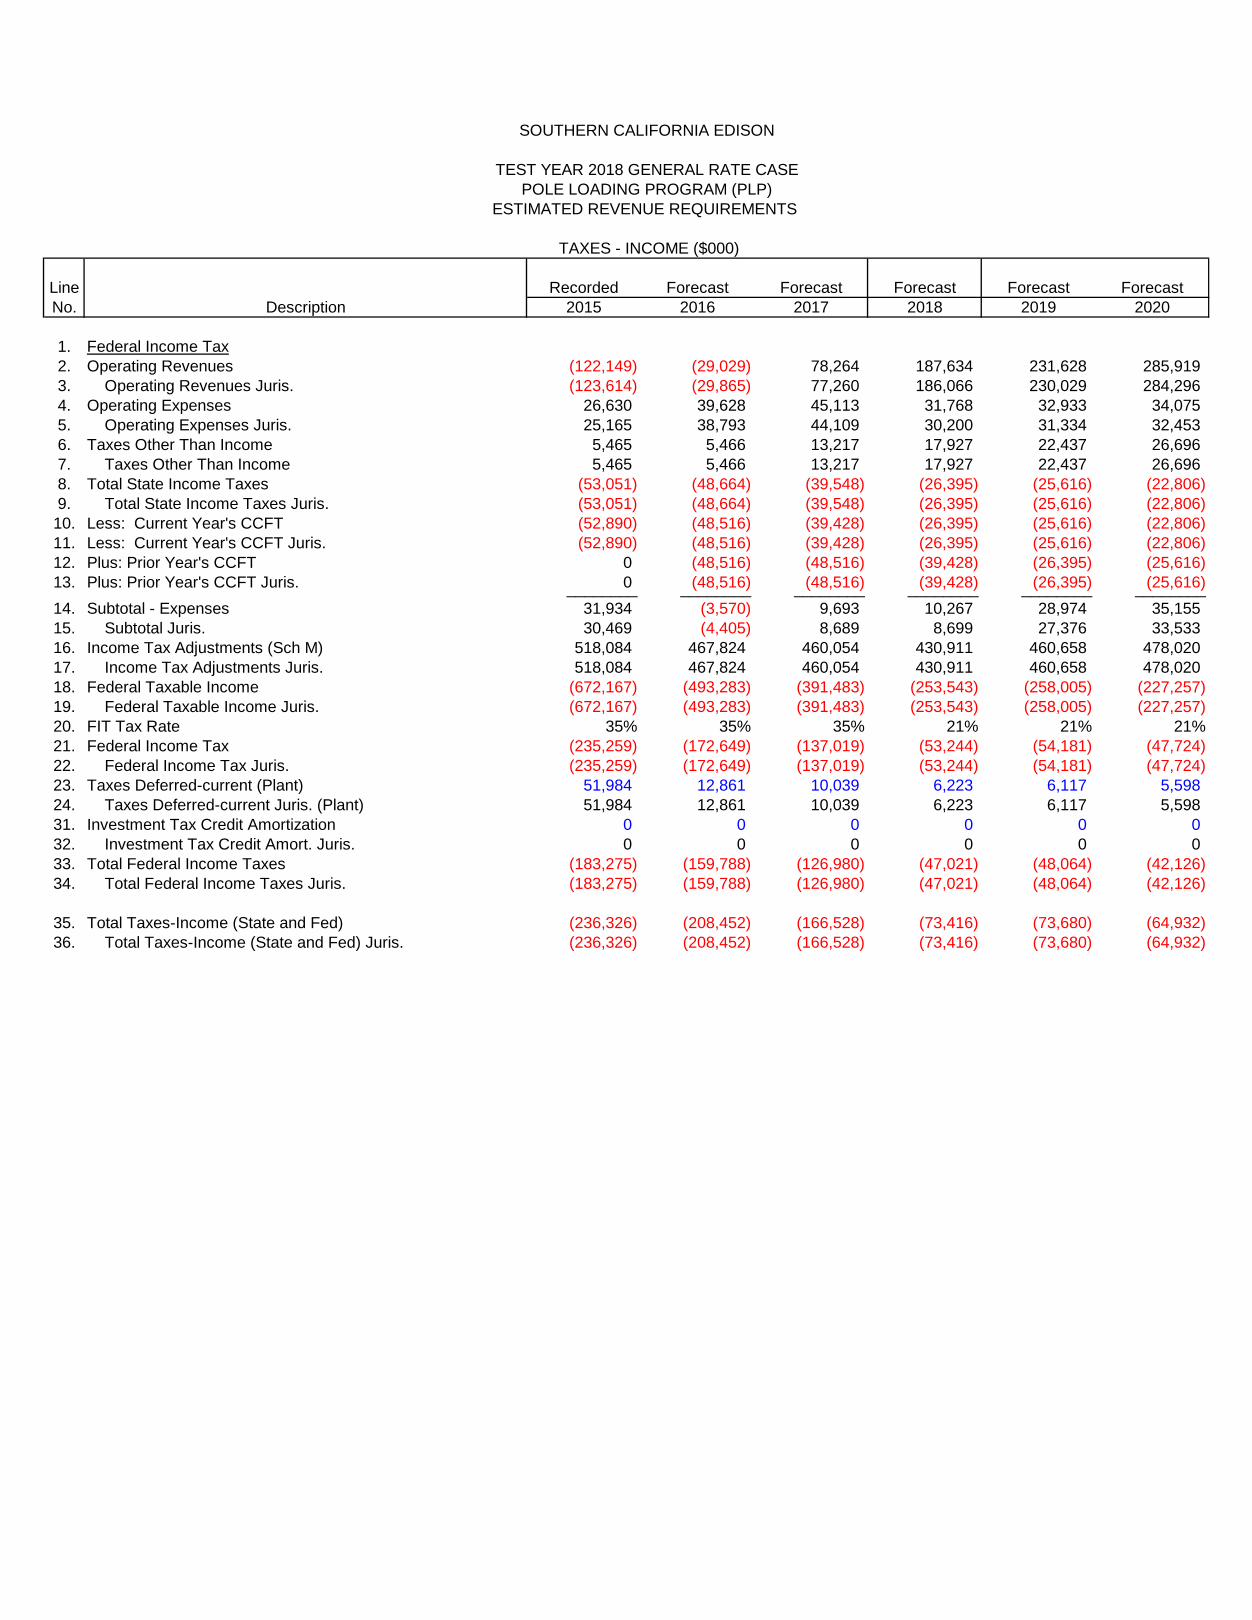
SOUTHERN CALIFORNIA EDISON
TEST YEAR 2018 GENERAL RATE CASE
POLE LOADING PROGRAM (PLP)
ESTIMATED REVENUE REQUIREMENTS
TAXES - INCOME ($000)
Line Recorded Forecast Forecast Forecast Forecast Forecast
No. Description 2015 2016 2017 2018 2019 2020
1. Federal Income Tax
2. Operating Revenues (122,149) (29,029) 78,264 187,634 231,628 285,919
3. Operating Revenues Juris. (123,614) (29,865) 77,260 186,066 230,029 284,296
4. Operating Expenses 26,630 39,628 45,113 31,768 32,933 34,075
5. Operating Expenses Juris. 25,165 38,793 44,109 30,200 31,334 32,453
6. Taxes Other Than Income 5,465 5,466 13,217 17,927 22,437 26,696
7. Taxes Other Than Income 5,465 5,466 13,217 17,927 22,437 26,696
8. Total State Income Taxes (53,051) (48,664) (39,548) (26,395) (25,616) (22,806)
9. Total State Income Taxes Juris. (53,051) (48,664) (39,548) (26,395) (25,616) (22,806)
10. Less: Current Year's CCFT (52,890) (48,516) (39,428) (26,395) (25,616) (22,806)
11. Less: Current Year's CCFT Juris. (52,890) (48,516) (39,428) (26,395) (25,616) (22,806)
12. Plus: Prior Year's CCFT 0 (48,516) (48,516) (39,428) (26,395) (25,616)
13. Plus: Prior Year's CCFT Juris. 0 (48,516) (48,516) (39,428) (26,395) (25,616) ________ ________ ________ ________ ________ ________
14. Subtotal - Expenses 31,934 (3,570) 9,693 10,267 28,974 35,155
15. Subtotal Juris. 30,469 (4,405) 8,689 8,699 27,376 33,533
16. Income Tax Adjustments (Sch M) 518,084 467,824 460,054 430,911 460,658 478,020
17. Income Tax Adjustments Juris. 518,084 467,824 460,054 430,911 460,658 478,020
18. Federal Taxable Income (672,167) (493,283) (391,483) (253,543) (258,005) (227,257)
19. Federal Taxable Income Juris. (672,167) (493,283) (391,483) (253,543) (258,005) (227,257)
20. FIT Tax Rate 35% 35% 35% 21% 21% 21%
21. Federal Income Tax (235,259) (172,649) (137,019) (53,244) (54,181) (47,724)
22. Federal Income Tax Juris. (235,259) (172,649) (137,019) (53,244) (54,181) (47,724)
23. Taxes Deferred-current (Plant) 51,984 12,861 10,039 6,223 6,117 5,598
24. Taxes Deferred-current Juris. (Plant) 51,984 12,861 10,039 6,223 6,117 5,598
31. Investment Tax Credit Amortization 0 0 0 0 0 0
32. Investment Tax Credit Amort. Juris. 0 0 0 0 0 0
33. Total Federal Income Taxes (183,275) (159,788) (126,980) (47,021) (48,064) (42,126)
34. Total Federal Income Taxes Juris. (183,275) (159,788) (126,980) (47,021) (48,064) (42,126)
35. Total Taxes-Income (State and Fed) (236,326) (208,452) (166,528) (73,416) (73,680) (64,932)
36. Total Taxes-Income (State and Fed) Juris. (236,326) (208,452) (166,528) (73,416) (73,680) (64,932)

SOUTHERN CALIFORNIA EDISON
TEST YEAR 2018 GENERAL RATE CASE
POLE LOADING PROGRAM (PLP)
DEPRECIATION EXPENSE
ESTIMATED REVENUE REQUIREMENTS
(Thousands of Dollars)
Line Recorded Forecast Forecast Forecast Forecast Forecast
No. Description 2015 2016 2017 2018 2019 2020
1. Jurisdictional Factor 100.000% 100.000% 100.000% 100.000% 100.000% 100.000%
2. Depreciation Expense 29,522 49,954 70,140 74,153 88,277 102,629
3. Depreciation Expense Juris. 29,522 49,954 70,140 74,153 88,277 102,629

SOUTHERN CALIFORNIA EDISON
TEST YEAR 2018 GENERAL RATE CASE
POLE LOADING PROGRAM (PLP)
WEIGHTED AVERAGE RATE BASE
ESTIMATED REVENUE REQUIREMENTS
(Thousands of Dollars)
Line Recorded Forecast Forecast Forecast Forecast Forecast
No. Description 2015 2016 2017 2018 2019 2020
1. Jurisdictional Factor 100.000% 100.000% 100.000% 100.000% 100.000% 100.000%
2. Fixed Capital
3. Plant in Service (Avg.) 485,432 857,229 1,200,764 1,497,464 1,787,804 2,083,042
4. Plant in Service Plant ( Avg.) Juris. 485,432 857,229 1,200,764 1,497,464 1,787,804 2,083,042
5. Property Held for Future Use (Avg.) 0 0 0 0 0 0
6. Property Held for Future Use (Avg) Juris. 0 0 0 0 0 0
7. Total Fixed Capital (Avg.) 485,432 857,229 1,200,764 1,497,464 1,787,804 2,083,042
8. Total Fixed Capital (Avg.) Juris. 485,432 857,229 1,200,764 1,497,464 1,787,804 2,083,042
9. Adjustments
10. General Plant (Avg.) 0 0 0 0 0 0
11. General Plant (Avg.) Juris. 0 0 0 0 0 0
12. Mountainview Emmissions (Avg.) 0 0 0 0 0 0
13. Mountianviw Emmissions Juris. 0 0 0 0 0 0
14. Customer Advance for Construction (Avg.) 0 0 0 0 0 0
15. Customer Advance for Construction (Juris.) 0 0 0 0 0 0
16. Total Adjustments (Avg.) 0 0 0 0 0 0
17. Total Adjustments (Avg.) Juris. 0 0 0 0 0 0
18. Working Capital
19. Materials and Supplies (Avg) 0 0 0 0 0 0
20. Materials and Supplies (Avg.) Juris. 0 0 0 0 0 0
21. Working Cash (Avg.) 0 0 0 0 0 0
22. Working Cash (Avg.) Juris 0 0 0 0 0 0
23. Total Working Capital (Avg.) 0 0 0 0 0 0
24. Total Working Capital (Avg.) Juris 0 0 0 0 0 0
25. Total Before Deductions for Reserves (Avg) 485,432 857,229 1,200,764 1,497,464 1,787,804 2,083,042
26. Total Before Deductions for Reserves (Avg) Juris. 485,432 857,229 1,200,764 1,497,464 1,787,804 2,083,042
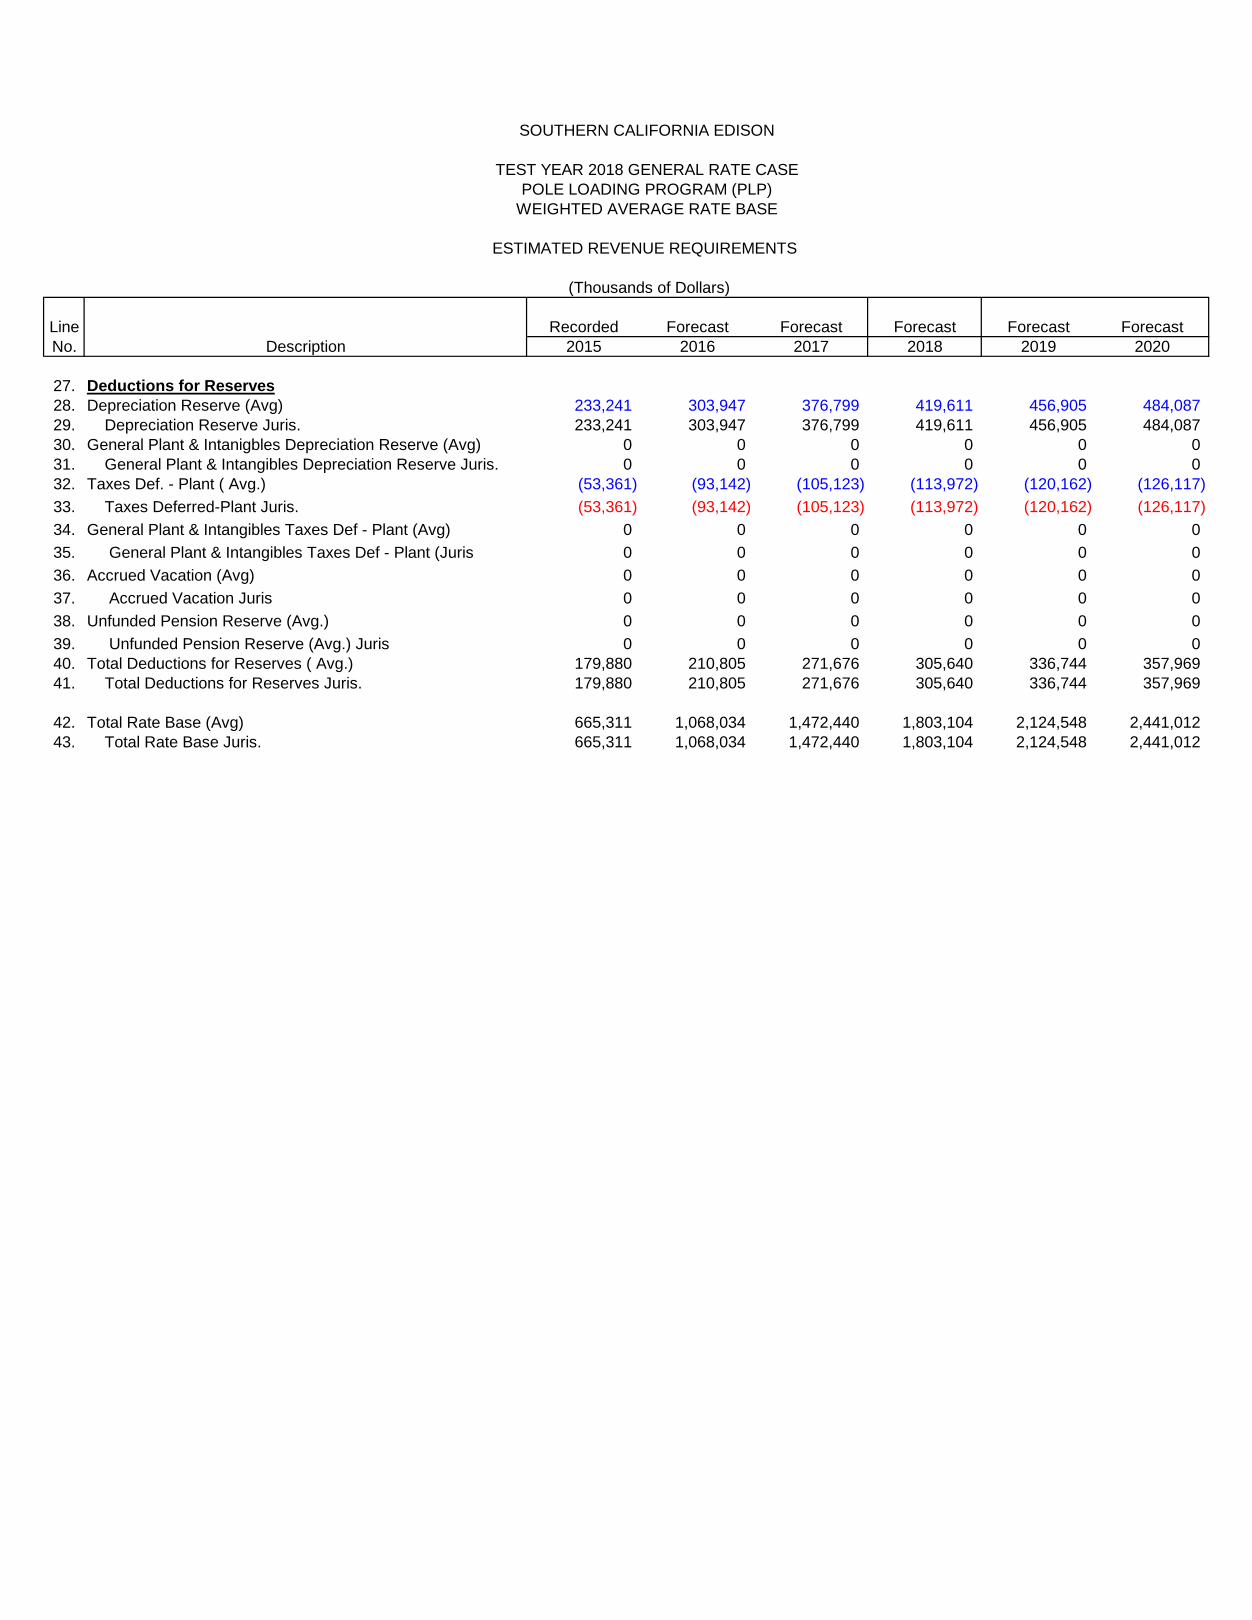
SOUTHERN CALIFORNIA EDISON
TEST YEAR 2018 GENERAL RATE CASE
POLE LOADING PROGRAM (PLP)
WEIGHTED AVERAGE RATE BASE
ESTIMATED REVENUE REQUIREMENTS
(Thousands of Dollars)
Line Recorded Forecast Forecast Forecast Forecast Forecast
No. Description 2015 2016 2017 2018 2019 2020
27. Deductions for Reserves
28. Depreciation Reserve (Avg) 233,241 303,947 376,799 419,611 456,905 484,087
29. Depreciation Reserve Juris. 233,241 303,947 376,799 419,611 456,905 484,087
30. General Plant & Intanigbles Depreciation Reserve (Avg) 0 0 0 0 0 0
31. General Plant & Intangibles Depreciation Reserve Juris. 0 0 0 0 0 0
32. Taxes Def. - Plant ( Avg.) (53,361) (93,142) (105,123) (113,972) (120,162) (126,117)
33. Taxes Deferred-Plant Juris. (53,361) (93,142) (105,123) (113,972) (120,162) (126,117)
34. General Plant & Intangibles Taxes Def - Plant (Avg) 0 0 0 0 0 0
35. General Plant & Intangibles Taxes Def - Plant (Juris 0 0 0 0 0 0
36. Accrued Vacation (Avg) 0 0 0 0 0 0
37. Accrued Vacation Juris 0 0 0 0 0 0
38. Unfunded Pension Reserve (Avg.) 0 0 0 0 0 0
39. Unfunded Pension Reserve (Avg.) Juris 0 0 0 0 0 0
40. Total Deductions for Reserves ( Avg.) 179,880 210,805 271,676 305,640 336,744 357,969
41. Total Deductions for Reserves Juris. 179,880 210,805 271,676 305,640 336,744 357,969
42. Total Rate Base (Avg) 665,311 1,068,034 1,472,440 1,803,104 2,124,548 2,441,012
43. Total Rate Base Juris. 665,311 1,068,034 1,472,440 1,803,104 2,124,548 2,441,012
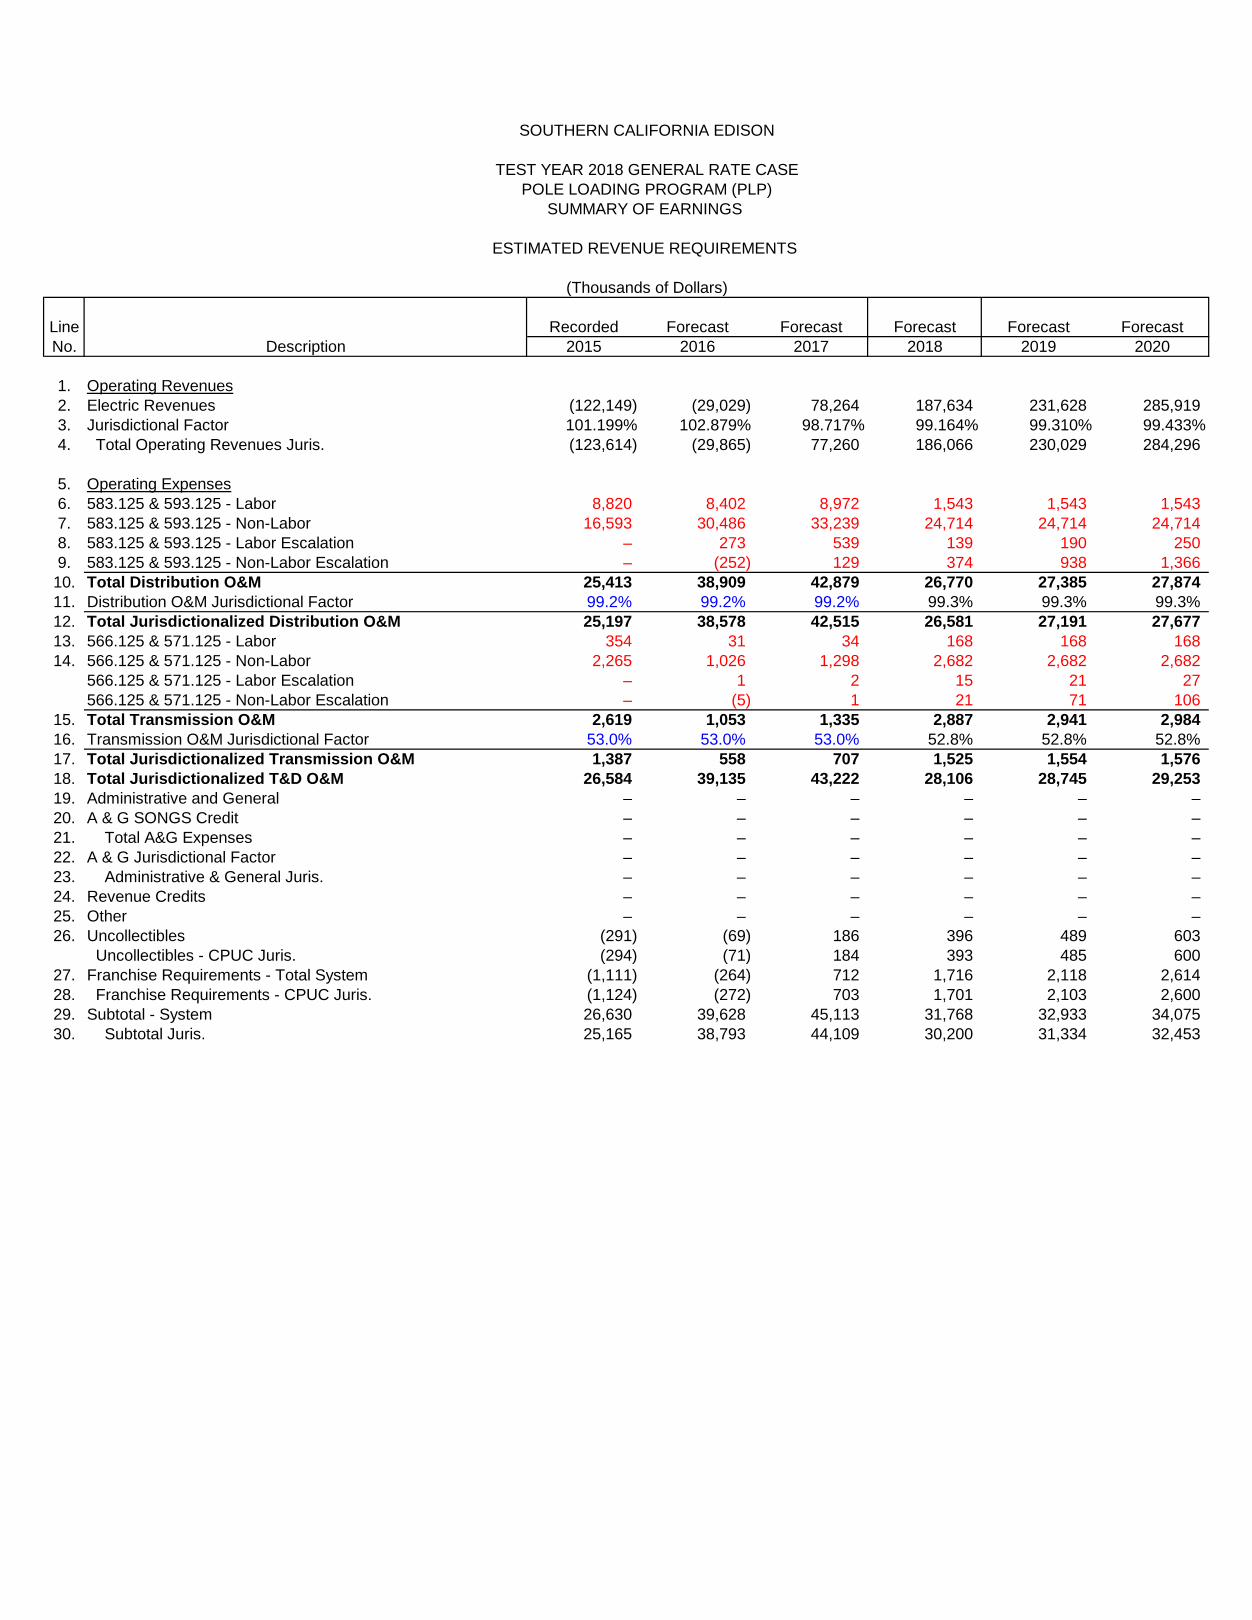
SOUTHERN CALIFORNIA EDISON
TEST YEAR 2018 GENERAL RATE CASE
POLE LOADING PROGRAM (PLP)
SUMMARY OF EARNINGS
ESTIMATED REVENUE REQUIREMENTS
(Thousands of Dollars)
Line Recorded Forecast Forecast Forecast Forecast Forecast
No. Description 2015 2016 2017 2018 2019 2020
1. Operating Revenues
2. Electric Revenues (122,149) (29,029) 78,264 187,634 231,628 285,919
3. Jurisdictional Factor 101.199% 102.879% 98.717% 99.164% 99.310% 99.433%
4. Total Operating Revenues Juris. (123,614) (29,865) 77,260 186,066 230,029 284,296
5. Operating Expenses
6. 583.125 & 593.125 - Labor 8,820 8,402 8,972 1,543 1,543 1,543
7. 583.125 & 593.125 - Non-Labor 16,593 30,486 33,239 24,714 24,714 24,714
8. 583.125 & 593.125 - Labor Escalation – 273 539 139 190 250
9. 583.125 & 593.125 - Non-Labor Escalation – (252) 129 374 938 1,366
10. Total Distribution O&M 25,413 38,909 42,879 26,770 27,385 27,874
11. Distribution O&M Jurisdictional Factor 99.2% 99.2% 99.2% 99.3% 99.3% 99.3%
12. Total Jurisdictionalized Distribution O&M 25,197 38,578 42,515 26,581 27,191 27,677
13. 566.125 & 571.125 - Labor 354 31 34 168 168 168
14. 566.125 & 571.125 - Non-Labor 2,265 1,026 1,298 2,682 2,682 2,682
566.125 & 571.125 - Labor Escalation – 1 2 15 21 27
566.125 & 571.125 - Non-Labor Escalation – (5) 1 21 71 106
15. Total Transmission O&M 2,619 1,053 1,335 2,887 2,941 2,984
16. Transmission O&M Jurisdictional Factor 53.0% 53.0% 53.0% 52.8% 52.8% 52.8%
17. Total Jurisdictionalized Transmission O&M 1,387 558 707 1,525 1,554 1,576
18. Total Jurisdictionalized T&D O&M 26,584 39,135 43,222 28,106 28,745 29,253
19. Administrative and General – – – – – –
20. A & G SONGS Credit – – – – – –
21. Total A&G Expenses – – – – – –
22. A & G Jurisdictional Factor – – – – – –
23. Administrative & General Juris. – – – – – –
24. Revenue Credits – – – – – –
25. Other – – – – – –
26. Uncollectibles (291) (69) 186 396 489 603
Uncollectibles - CPUC Juris. (294) (71) 184 393 485 600
27. Franchise Requirements - Total System (1,111) (264) 712 1,716 2,118 2,614
28. Franchise Requirements - CPUC Juris. (1,124) (272) 703 1,701 2,103 2,600
29. Subtotal - System 26,630 39,628 45,113 31,768 32,933 34,075
30. Subtotal Juris. 25,165 38,793 44,109 30,200 31,334 32,453

SOUTHERN CALIFORNIA EDISON
TEST YEAR 2018 GENERAL RATE CASE
POLE LOADING PROGRAM (PLP)
SUMMARY OF EARNINGS
ESTIMATED REVENUE REQUIREMENTS
(Thousands of Dollars)
Line Recorded Forecast Forecast Forecast Forecast Forecast
No. Description 2015 2016 2017 2018 2019 2020
1. Depreciation - System 29,522 49,954 70,140 74,153 88,277 102,629
2. Depreciation Juris. 29,522 49,954 70,140 74,153 88,277 102,629
3. Taxes Other Than On Income - System 5,465 5,466 13,217 17,927 22,437 26,696
4. Taxes Other Than On Income Juris. 5,465 5,466 13,217 17,927 22,437 26,696
5. Taxes Based On Income - System (236,326) (208,452) (166,528) (73,416) (73,680) (64,932)
6. Taxes Based On Income Juris. (236,326) (208,452) (166,528) (73,416) (73,680) (64,932)
7. Total Taxes - System (230,861) (202,986) (153,311) (55,489) (51,243) (38,236)
8. Total Taxes Juris. (230,861) (202,986) (153,311) (55,489) (51,243) (38,236)
9. Total Operating Expenses - System (174,708) (113,404) (38,059) 50,433 69,967 98,469
10. Total Operating Expenses Juris. (176,173) (114,240) (39,063) 48,864 68,368 96,846
11. Net Operating Revenue - System 52,560 84,375 116,323 137,202 161,661 187,450
12. Net Operating Revenue Juris. 52,560 84,375 116,323 137,202 161,661 187,450
13. Rate Base - System (Average)-System 665,311 1,068,034 1,472,440 1,803,104 2,124,548 2,441,012
14. Rate Base Juris. 665,311 1,068,034 1,472,440 1,803,104 2,124,548 2,441,012
15. Rate of Return-System 7.90% 7.90% 7.90% 7.61% 7.61% 7.68%
16. Rate of Return Juris. 7.90% 7.90% 7.90% 7.61% 7.61% 7.68%

Charge Ready Summary of Earnings
andResults of Operations

Southern California Edison
2020 COC Update to AL 4092-E
Charge Ready Summary of Earnings
$ in Thousands
Summary of Earnings
2018 2019 2020
Operating Revenues 2,700 4,043 7,265
Operating Expenses
O&M 1,197 2,163 5,023
Uncollectibles 6 9 15
Franchise Requirements 25 37 66
Total Operating Expenses 1,228 2,209 5,105
Depreciation 431 524 613
Property Taxes 124 150 173
Payroll Taxes 18 59 83
Taxes Based on Income 164 213 252
Total Taxes 306 422 509
Total Operating Expenses and Taxes 1,964 3,154 6,227
Net Operating Revenue 736 889 1,039
Rate Base (Weighted Average) 9,666 11,679 13,526
Rate of Return 7.61% 7.61% 7.68%

Southern California Edison
2020 COC Update to AL 4092-E
Charge Ready Results of Operations
$ in Thousands
1 Net to Gross Multiplier
2018 2019 2020
Revenues 1.00000 1.00000 1.00000
Uncollectibles Tax Multiplier
Tax Rate 0.2110% 0.2110% 0.2110%
Jurisdictional Factor 1.00000 1.00000 1.00000
Tax Rate (Jurisdictionalized) 0.2110% 0.2110% 0.2110%
Uncollectibles Tax Multiplier 0.99789 0.99789 0.99789
Franchise Fees Tax Multiplier
Tax Rate 0.9144% 0.9144% 0.9144%
Jurisdictional Factor 1.00000 1.00000 1.00000
Tax Rate (Jurisdictionalized) 0.9144% 0.9144% 0.9144%
Franchise Fees Tax Multiplier 0.98875 0.98875 0.98875
Other State(s) Income Tax Multiplier
Tax Rate – – –
Jurisdictional Factor 1.00000 1.00000 1.00000
Tax Rate (Jurisdictionalized) – – –
Other State(s) Income Tax Multiplier 0.98875 0.98875 0.98875
State Income Tax Multiplier
Tax Rate 8.8400% 8.8400% 8.8400%
Jurisdictional Factor 0.98875 0.98875 0.98875
Tax Rate (Jurisdictionalized) 8.7405% 8.7405% 8.7405%
State Income Tax Multiplier 0.90134 0.90134 0.90134
Federal Income Tax Multiplier
Tax Rate 21.0000% 21.0000% 21.0000%
Jurisdictional Factor 0.98875 0.98875 0.98875
Tax Rate (Jurisdictionalized) 20.7637% 20.7637% 20.7637%
Federal Income Tax Multiplier 0.69370 0.69370 0.69370
Uncollectibles and Franchise Fees Multiplier 1.01138 1.01138 1.01138
Net to Gross Multiplier 1.44154 1.44154 1.44154

2 Rate of Return
2018 2019 2020
Cost Factors
Long-Term Debt 4.98% 4.98% 4.74%
Preferred Stock 5.82% 5.82% 5.70%
Equity 10.30% 10.30% 10.30%
Capitalization Ratios
Long-Term Debt 43.00% 43.00% 43.00%
Preferred Stock 9.00% 9.00% 5.00%
Equity 48.00% 48.00% 52.00%
Weighted Costs
Long-Term Debt 2.14% 2.14% 2.04%
Preferred Stock 0.52% 0.52% 0.29%
Equity 4.94% 4.94% 5.36%
Return on Rate Base 7.61% 7.61% 7.68%
3 Taxes - Other Than on Income
2018 2019 2020
Ad Valorem Taxes
California 124 150 173
Total Ad Valorem Taxes 124 150 173
Payroll Taxes
Federal Insurance Contribution Act (FICA) 18 59 83
Federal Unemployment Tax Act (FUTA) – – –
State Unemployment Tax Act (SUTA) – – –
Total Payroll Taxes 18 59 83
Total Taxes - Other Than Income 142 209 257

4 Taxes - Income Tax Adjustments
2018 2019 2020
State Income Tax Adjustments
Tax Depreciation 762 879 984
UNICAP
Interest On Long-Term Debt 207 250 276
(Gain)/Loss on Retirement – – –
Cost of Removal - Net of Salvage
Regulatory Asset – – –
Ad Valorem Lien Date Adjustment 24 2 22
Total California Income Tax Adjustments 993 1,131 1,281
Federal Income Tax Adjustments
Tax Depreciation 506 656 791
UNICAP
Interest On Long-Term Debt 207 250 276
(Gain)/Loss on Retirement – – –
Cost of Removal - Net of Salvage
Regulatory Asset – – –
Ad Valorem Lien Date Adjustment 24 2 22
Total Federal Income Tax Adjustments 737 908 1,088
5 Taxes - State Income Taxes
2018 2019 2020
Operating Revenues 2,700 4,043 7,265
Operating Expenses 1,228 2,209 5,105
Taxes - Other Than Income 142 209 257
State Income Tax Adjustments 993 1,131 1,281
Taxable Income 337 494 623
California Corporate Franchise Tax Rate 8.840% 8.840% 8.840%
California Tax Expense/(Benefit) 30 44 55
Arizona Income Tax Rate – – –
Arizona Tax Expense/(Benefit) – – –
New Mexico Income Tax Rate – – –
New Mexico Tax Expense/(Benefit) – – –
State Income Tax Expense/(Benefit) 30 44 55

6 Taxes - Federal Income Taxes
2018 2019 2020
Operating Revenues 2,700 4,043 7,265
Operating Expenses 1,228 2,209 5,105
Taxes - Other Than Income 142 209 257
State Income Taxes 30 44 55
Federal Income Tax Adjustments 737 908 1,088
Federal Taxable Income 563 673 761
California Corporate Franchise Tax Rate 21.00% 21.00% 21.00%
California Tax Expense/(Benefit) 118 141 160
Deferred Tax Expense 16 28 37
Federal Income Tax Expense/(Benefit) 134 169 197
7 Rate Base (End of Year)
2018 2019 2020
Fixed Capital
Gross Investment 13,857 14,682 18,751
Total Fixed Capital 13,857 14,682 18,751
Deductions for Reserves
Depreciation Reserve 608 1,131 1,745
Accumulated Deferred Taxes 1,707 1,735 1,773
Total Deductions for Reserves 2,315 2,867 3,517
Total Rate Base 11,541 11,815 15,234
8 Rate Base (Weighted Average)
2018 2019 2020
Fixed Capital
Gross Investment 11,757 14,269 16,717
Total Fixed Capital 11,757 14,269 16,717
Deductions for Reserves
Depreciation Reserve 392 870 1,438
Accumulated Deferred Taxes 1,699 1,720 1,753
Total Deductions for Reserves 2,091 2,590 3,191
Total Rate Base 9,666 11,679 13,526

9 Summary of Earnings
2018 2019 2020
Operating Revenues 2,700 4,043 7,265
Operating Expenses
O&M 1,197 2,163 5,023
Uncollectibles 6 9 15
Franchise Requirements 25 37 66
Total Operating Expenses 1,228 2,209 5,105
Depreciation 431 524 613
Property Taxes 124 150 173
Payroll Taxes 18 59 83
Taxes Based on Income 164 213 252
Total Taxes 306 422 509
Total Operating Expenses and Taxes 1,964 3,154 6,227
Net Operating Revenue 736 889 1,039
Rate Base (Weighted Average) 9,666 11,679 13,526
Rate of Return 7.61% 7.61% 7.68%
Transportation and Electrification
Summary of Earningsand
PRP & SRP
Results of Operations

Southern California Edison
2020 COC Update to AL 4092-E
TE PRP Summary of Earnings
$ in Thousands
Summary of Earnings
2018 2019 2020
Operating Revenues 1,095 3,139 735
Operating Expenses
O&M 1,016 2,698 –
Uncollectibles 3 7 2
Franchise Requirements 10 29 7
Total Operating Expenses 1,029 2,734 8
Depreciation 10 107 194
Property Taxes – 3 38
Payroll Taxes 4 16 –
Taxes Based on Income 11 53 88
Total Taxes 15 72 126
Total Operating Expenses and Taxes 1,054 2,913 328
Net Operating Revenue 41 226 406
Rate Base (Weighted Average) 542 2,975 5,290
Rate of Return 7.61% 7.61% 7.68%

Southern California Edison
2020 COC Update to AL 4092-E
TE PRP Results of Operations
$ in Thousands
1 Net to Gross Multiplier
2018 2019 2020
Revenues 1.00000 1.00000 1.00000
Uncollectibles Tax Multiplier
Tax Rate 0.2380% 0.2380% 0.2110%
Jurisdictional Factor 1.00000 1.00000 1.00000
Tax Rate (Jurisdictionalized) 0.2380% 0.2380% 0.2110%
Uncollectibles Tax Multiplier 0.99762 0.99762 0.99789
Franchise Fees Tax Multiplier
Tax Rate 0.9144% 0.9144% 0.9144%
Jurisdictional Factor 1.00000 1.00000 1.00000
Tax Rate (Jurisdictionalized) 0.9144% 0.9144% 0.9144%
Franchise Fees Tax Multiplier 0.98848 0.98848 0.98875
Other State(s) Income Tax Multiplier
Tax Rate 0.0270% 0.0270% –
Jurisdictional Factor 1.00000 1.00000 1.00000
Tax Rate (Jurisdictionalized) 0.0270% 0.0270% –
Other State(s) Income Tax Multiplier 0.98821 0.98821 0.98875
State Income Tax Multiplier
Tax Rate 8.8400% 8.8400% 8.8400%
Jurisdictional Factor 0.98848 0.98848 0.98875
Tax Rate (Jurisdictionalized) 8.7381% 8.7381% 8.7405%
State Income Tax Multiplier 0.90082 0.90082 0.90134
Federal Income Tax Multiplier
Tax Rate 21.0000% 21.0000% 21.0000%
Jurisdictional Factor 0.98821 0.98821 0.98875
Tax Rate (Jurisdictionalized) 20.7523% 20.7523% 20.7637%
Federal Income Tax Multiplier 0.69330 0.69330 0.69370
Uncollectibles and Franchise Fees Multiplier 1.01166 1.01166 1.01138
Net to Gross Multiplier 1.44237 1.44237 1.44154

2 Rate of Return
2018 2019 2020
Cost Factors
Long-Term Debt 4.98% 4.98% 4.74%
Preferred Stock 5.82% 5.82% 5.70%
Equity 10.30% 10.30% 10.30%
Capitalization Ratios
Long-Term Debt 43.00% 43.00% 43.00%
Preferred Stock 9.00% 9.00% 5.00%
Equity 48.00% 48.00% 52.00%
Weighted Costs
Long-Term Debt 2.14% 2.14% 2.04%
Preferred Stock 0.52% 0.52% 0.29%
Equity 4.94% 4.94% 5.36%
Return on Rate Base 7.61% 7.61% 7.68%
3 Taxes - Other Than on Income
2018 2019 2020
Ad Valorem Taxes
California – 3 38
Total Ad Valorem Taxes – 3 38
Payroll Taxes
Federal Insurance Contribution Act (FICA) 4 16 –
Federal Unemployment Tax Act (FUTA) – – –
State Unemployment Tax Act (SUTA) – – –
Total Payroll Taxes 4 16 –
Total Taxes - Other Than Income 4 20 38

4 Taxes - Income Tax Adjustments
2018 2019 2020
State Income Tax Adjustments
Tax Depreciation 18 202 355
UNICAP
Interest On Long-Term Debt 12 64 108
(Gain)/Loss on Retirement – – –
Cost of Removal - Net of Salvage
Regulatory Asset – – –
Ad Valorem Lien Date Adjustment – 3 31
Total California Income Tax Adjustments 30 269 494
Federal Income Tax Adjustments
Tax Depreciation 21 227 397
UNICAP
Interest On Long-Term Debt 12 64 108
(Gain)/Loss on Retirement – – –
Cost of Removal - Net of Salvage
Regulatory Asset – – –
Ad Valorem Lien Date Adjustment – 3 31
Total Federal Income Tax Adjustments 32 294 536
5 Taxes - State Income Taxes
2018 2019 2020
Operating Revenues 1,095 3,139 735
Operating Expenses 1,029 2,734 8
Taxes - Other Than Income 4 20 38
State Income Tax Adjustments 30 269 494
Taxable Income 32 117 194
California Corporate Franchise Tax Rate 8.840% 8.840% 8.840%
California Tax Expense/(Benefit) 3 10 17
Arizona Income Tax Rate – – –
Arizona Tax Expense/(Benefit) – – –
New Mexico Income Tax Rate – – –
New Mexico Tax Expense/(Benefit) – – –
State Income Tax Expense/(Benefit) 3 10 17
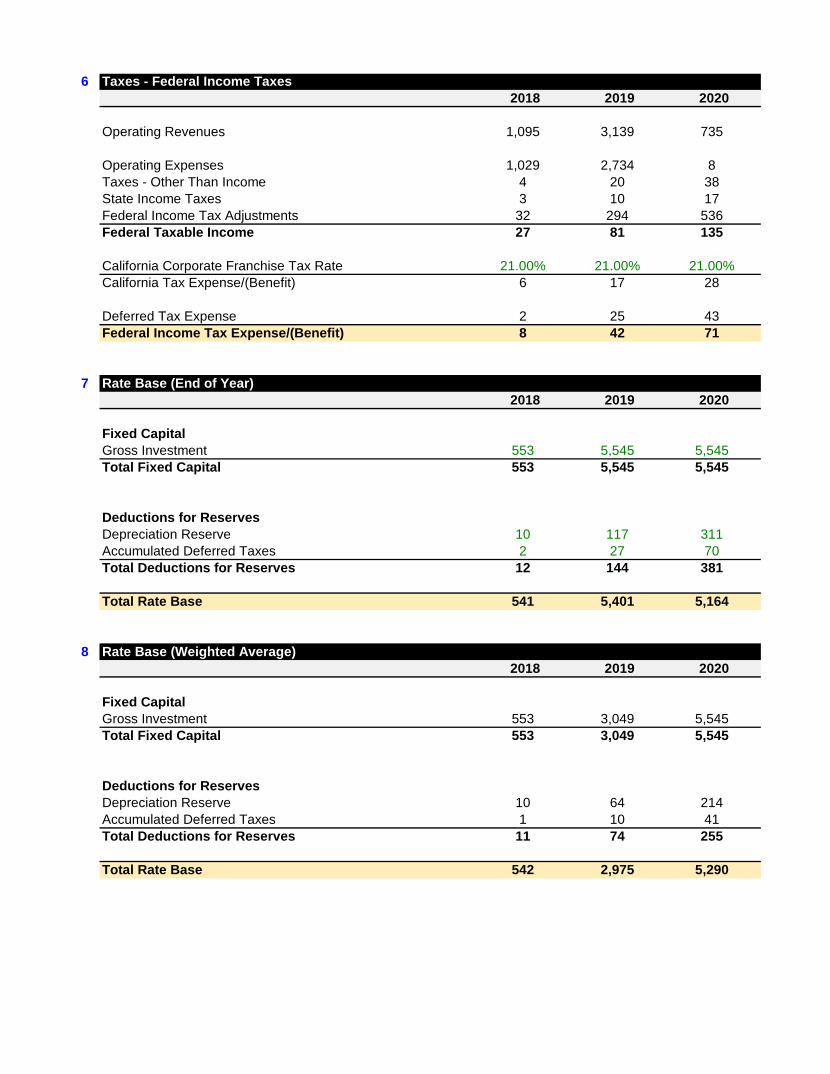
6 Taxes - Federal Income Taxes
2018 2019 2020
Operating Revenues 1,095 3,139 735
Operating Expenses 1,029 2,734 8
Taxes - Other Than Income 4 20 38
State Income Taxes 3 10 17
Federal Income Tax Adjustments 32 294 536
Federal Taxable Income 27 81 135
California Corporate Franchise Tax Rate 21.00% 21.00% 21.00%
California Tax Expense/(Benefit) 6 17 28
Deferred Tax Expense 2 25 43
Federal Income Tax Expense/(Benefit) 8 42 71
7 Rate Base (End of Year)
2018 2019 2020
Fixed Capital
Gross Investment 553 5,545 5,545
Total Fixed Capital 553 5,545 5,545
Deductions for Reserves
Depreciation Reserve 10 117 311
Accumulated Deferred Taxes 2 27 70
Total Deductions for Reserves 12 144 381
Total Rate Base 541 5,401 5,164
8 Rate Base (Weighted Average)
2018 2019 2020
Fixed Capital
Gross Investment 553 3,049 5,545
Total Fixed Capital 553 3,049 5,545
Deductions for Reserves
Depreciation Reserve 10 64 214
Accumulated Deferred Taxes 1 10 41
Total Deductions for Reserves 11 74 255
Total Rate Base 542 2,975 5,290

9 Summary of Earnings
2018 2019 2020
Operating Revenues 1,095 3,139 735
Operating Expenses
O&M 1,016 2,698 –
Uncollectibles 3 7 2
Franchise Requirements 10 29 7
Total Operating Expenses 1,029 2,734 8
Depreciation 10 107 194
Property Taxes – 3 38
Payroll Taxes 4 16 –
Taxes Based on Income 11 53 88
Total Taxes 15 72 126
Total Operating Expenses and Taxes 1,054 2,913 328
Net Operating Revenue 41 226 406
Rate Base (Weighted Average) 542 2,975 5,290
Rate of Return 7.61% 7.61% 7.68%

Southern California Edison
2020 COC Update to AL 4092-E
TE SRP Summary of Earnings
$ in Thousands
Summary of Earnings
2018 2019 2020
Operating Revenues 23 1,880 6,074
Operating Expenses
O&M 22 1,711 5,474
Uncollectibles 0 4 13
Franchise Requirements 0 17 56
Total Operating Expenses 22 1,733 5,542
Depreciation – 23 126
Property Taxes – – 8
Payroll Taxes 1 63 70
Taxes Based on Income – 12 62
Total Taxes 1 75 141
Total Operating Expenses and Taxes 23 1,831 5,809
Net Operating Revenue – 49 265
Rate Base (Weighted Average) – 645 3,449
Rate of Return – 7.61% 7.68%

Southern California Edison
2020 COC Update to AL 4092-E
TE SRP Results of Operations
$ in Thousands
1 Net to Gross Multiplier
2018 2019 2020
Revenues 1.00000 1.00000 1.00000
Uncollectibles Tax Multiplier
Tax Rate 0.2380% 0.2380% 0.2110%
Jurisdictional Factor 1.00000 1.00000 1.00000
Tax Rate (Jurisdictionalized) 0.2380% 0.2380% 0.2110%
Uncollectibles Tax Multiplier 0.99762 0.99762 0.99789
Franchise Fees Tax Multiplier
Tax Rate 0.9144% 0.9144% 0.9144%
Jurisdictional Factor 1.00000 1.00000 1.00000
Tax Rate (Jurisdictionalized) 0.9144% 0.9144% 0.9144%
Franchise Fees Tax Multiplier 0.98848 0.98848 0.98875
Other State(s) Income Tax Multiplier
Tax Rate 0.0270% 0.0270% –
Jurisdictional Factor 1.00000 1.00000 1.00000
Tax Rate (Jurisdictionalized) 0.0270% 0.0270% –
Other State(s) Income Tax Multiplier 0.98821 0.98821 0.98875
State Income Tax Multiplier
Tax Rate 8.8400% 8.8400% 8.8400%
Jurisdictional Factor 0.98848 0.98848 0.98875
Tax Rate (Jurisdictionalized) 8.7381% 8.7381% 8.7405%
State Income Tax Multiplier 0.90082 0.90082 0.90134
Federal Income Tax Multiplier
Tax Rate 21.0000% 21.0000% 21.0000%
Jurisdictional Factor 0.98821 0.98821 0.98875
Tax Rate (Jurisdictionalized) 20.7523% 20.7523% 20.7637%
Federal Income Tax Multiplier 0.69330 0.69330 0.69370
Uncollectibles and Franchise Fees Multiplier 1.01166 1.01166 1.01138
Net to Gross Multiplier 1.44237 1.44237 1.44154
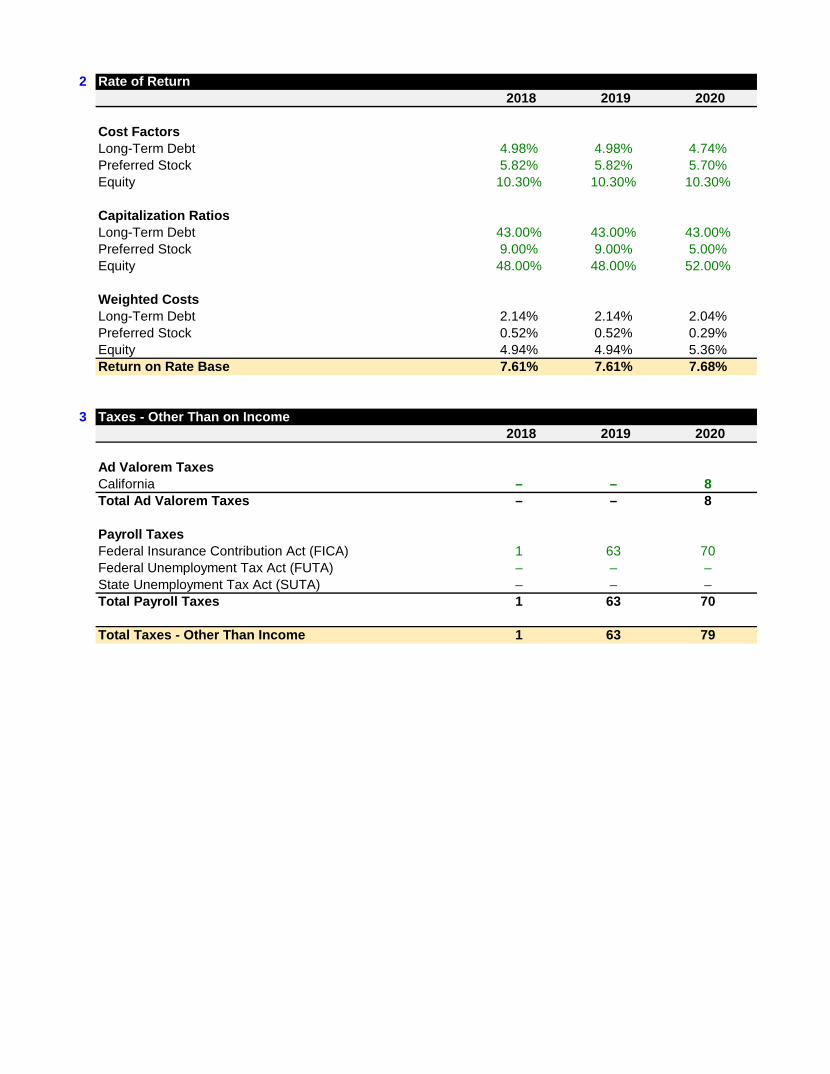
2 Rate of Return
2018 2019 2020
Cost Factors
Long-Term Debt 4.98% 4.98% 4.74%
Preferred Stock 5.82% 5.82% 5.70%
Equity 10.30% 10.30% 10.30%
Capitalization Ratios
Long-Term Debt 43.00% 43.00% 43.00%
Preferred Stock 9.00% 9.00% 5.00%
Equity 48.00% 48.00% 52.00%
Weighted Costs
Long-Term Debt 2.14% 2.14% 2.04%
Preferred Stock 0.52% 0.52% 0.29%
Equity 4.94% 4.94% 5.36%
Return on Rate Base 7.61% 7.61% 7.68%
3 Taxes - Other Than on Income
2018 2019 2020
Ad Valorem Taxes
California – – 8
Total Ad Valorem Taxes – – 8
Payroll Taxes
Federal Insurance Contribution Act (FICA) 1 63 70
Federal Unemployment Tax Act (FUTA) – – –
State Unemployment Tax Act (SUTA) – – –
Total Payroll Taxes 1 63 70
Total Taxes - Other Than Income 1 63 79
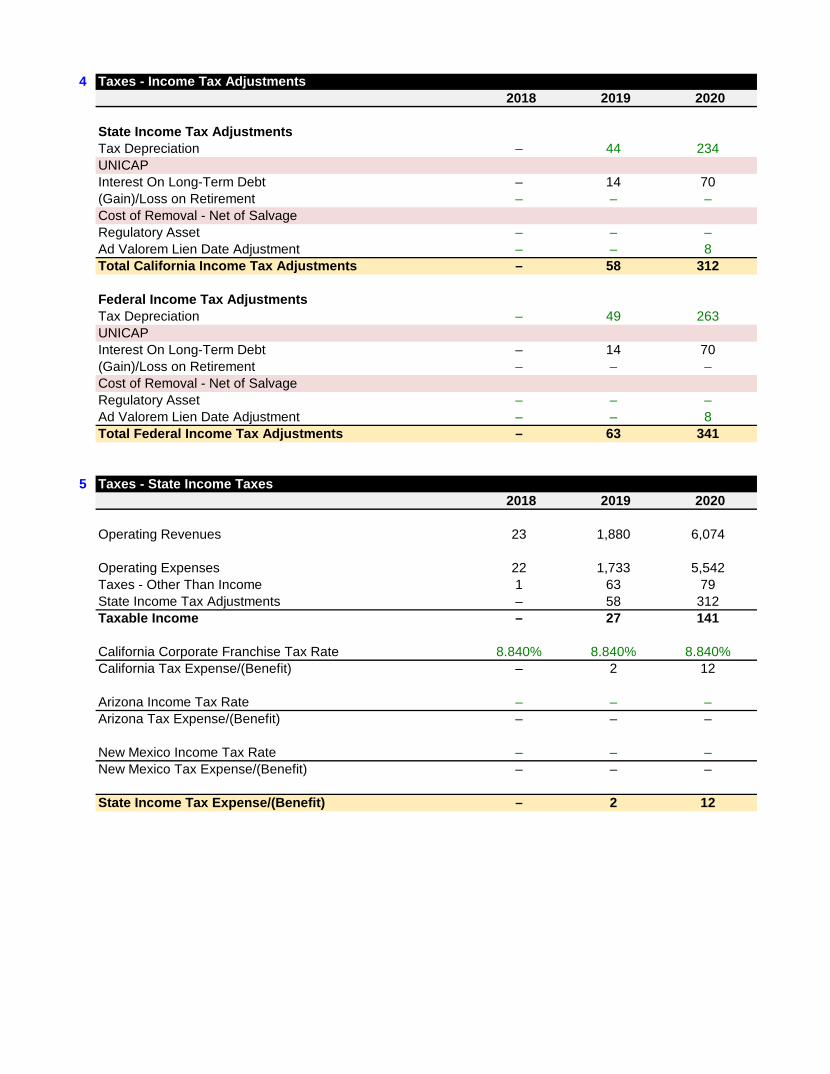
4 Taxes - Income Tax Adjustments
2018 2019 2020
State Income Tax Adjustments
Tax Depreciation – 44 234
UNICAP
Interest On Long-Term Debt – 14 70
(Gain)/Loss on Retirement – – –
Cost of Removal - Net of Salvage
Regulatory Asset – – –
Ad Valorem Lien Date Adjustment – – 8
Total California Income Tax Adjustments – 58 312
Federal Income Tax Adjustments
Tax Depreciation – 49 263
UNICAP
Interest On Long-Term Debt – 14 70
(Gain)/Loss on Retirement – – –
Cost of Removal - Net of Salvage
Regulatory Asset – – –
Ad Valorem Lien Date Adjustment – – 8
Total Federal Income Tax Adjustments – 63 341
5 Taxes - State Income Taxes
2018 2019 2020
Operating Revenues 23 1,880 6,074
Operating Expenses 22 1,733 5,542
Taxes - Other Than Income 1 63 79
State Income Tax Adjustments – 58 312
Taxable Income – 27 141
California Corporate Franchise Tax Rate 8.840% 8.840% 8.840%
California Tax Expense/(Benefit) – 2 12
Arizona Income Tax Rate – – –
Arizona Tax Expense/(Benefit) – – –
New Mexico Income Tax Rate – – –
New Mexico Tax Expense/(Benefit) – – –
State Income Tax Expense/(Benefit) – 2 12

6 Taxes - Federal Income Taxes
2018 2019 2020
Operating Revenues 23 1,880 6,074
Operating Expenses 22 1,733 5,542
Taxes - Other Than Income 1 63 79
State Income Taxes – 2 12
Federal Income Tax Adjustments – 63 341
Federal Taxable Income – 19 100
California Corporate Franchise Tax Rate 21.00% 21.00% 21.00%
California Tax Expense/(Benefit) – 4 21
Deferred Tax Expense – 5 29
Federal Income Tax Expense/(Benefit) – 9 50
7 Rate Base (End of Year)
2018 2019 2020
Fixed Capital
Gross Investment – 1,317 5,783
Total Fixed Capital – 1,317 5,783
Deductions for Reserves
Depreciation Reserve – 23 150
Accumulated Deferred Taxes – 5 34
Total Deductions for Reserves – 29 184
Total Rate Base – 1,288 5,599
8 Rate Base (Weighted Average)
2018 2019 2020
Fixed Capital
Gross Investment – 658 3,550
Total Fixed Capital – 658 3,550
Deductions for Reserves
Depreciation Reserve – 12 87
Accumulated Deferred Taxes – 2 14
Total Deductions for Reserves – 13 101
Total Rate Base – 645 3,449

9 Summary of Earnings
2018 2019 2020
Operating Revenues 23 1,880 6,074
Operating Expenses
O&M 22 1,711 5,474
Uncollectibles 0 4 13
Franchise Requirements 0 17 56
Total Operating Expenses 22 1,733 5,542
Depreciation – 23 126
Property Taxes – – 8
Payroll Taxes 1 63 70
Taxes Based on Income – 12 62
Total Taxes 1 75 141
Total Operating Expenses and Taxes 23 1,831 5,809
Net Operating Revenue – 49 265
Rate Base (Weighted Average) – 645 3,449
Rate of Return – 7.61% 7.68%

Transportation and ElectrificationPRP & SRP Consolidated
Summary of Earnings

Southern California Edison
2020 COC Update to AL 4092-E
TE PRP & SRP Consolidated Summary of Earnings
$ in Thousands
Summary of Earnings
2018 2019 2020
Operating Revenues 1,118 5,019 6,809
Operating Expenses
O&M 1,038 4,409 5,474
Uncollectibles 3 12 14
Franchise Requirements 10 46 62
Total Operating Expenses 1,051 4,466 5,551
Depreciation 10 130 320
Property Taxes – 3 46
Payroll Taxes 5 79 70
Taxes Based on Income 11 64 150
Total Taxes 16 147 267
Total Operating Expenses and Taxes 1,077 4,744 6,138
Net Operating Revenue 41 275 671
Rate Base (Weighted Average) 542 3,620 8,739
Rate of Return 7.61% 7.61% 7.68%

Aliso Canyon Energy StorageSummary of Earnings
andResults of Operations

Southern California Edison
2020 COC Update to AL 4091-E
Aliso Canyon Energy Storage Summary of Earnings
$ in Thousands
Summary of Earnings
2018 2019 2020
Operating Revenues 13,408 14,211 11,978
Operating Expenses
O&M 563 2,386 1,171
Uncollectibles 28 30 25
Franchise Requirements 123 130 110
Total Operating Expenses 713 2,546 1,306
Depreciation 6,501 6,322 6,130
Property Taxes 691 588 488
Payroll Taxes – – –
Taxes Based on Income 1,404 1,263 1,130
Total Taxes 2,094 1,852 1,618
Total Operating Expenses and Taxes 9,309 10,720 9,054
Net Operating Revenue 4,099 3,491 2,924
Rate Base (Weighted Average) 53,868 45,882 38,073
Rate of Return 7.61% 7.61% 7.68%

Southern California Edison
2020 COC Update to AL 4091-E
Aliso Canyon Energy Storage Results of Operations
$ in Thousands
1 Net to Gross Multiplier
2018 2019 2020
Revenues 1.00000 1.00000 1.00000
Uncollectibles Tax Multiplier
Tax Rate 0.2110% 0.2110% 0.2110%
Jurisdictional Factor 1.00000 1.00000 1.00000
Tax Rate (Jurisdictionalized) 0.2110% 0.2110% 0.2110%
Uncollectibles Tax Multiplier 0.99789 0.99789 0.99789
Franchise Fees Tax Multiplier
Tax Rate 0.9144% 0.9144% 0.9144%
Jurisdictional Factor 1.00000 1.00000 1.00000
Tax Rate (Jurisdictionalized) 0.9144% 0.9144% 0.9144%
Franchise Fees Tax Multiplier 0.98875 0.98875 0.98875
Other State(s) Income Tax Multiplier
Tax Rate – – –
Jurisdictional Factor 1.00000 1.00000 1.00000
Tax Rate (Jurisdictionalized) – – –
Other State(s) Income Tax Multiplier 0.98875 0.98875 0.98875
State Income Tax Multiplier
Tax Rate 8.8400% 8.8400% 8.8400%
Jurisdictional Factor 0.98875 0.98875 0.98875
Tax Rate (Jurisdictionalized) 8.7405% 8.7405% 8.7405%
State Income Tax Multiplier 0.90134 0.90134 0.90134
Federal Income Tax Multiplier
Tax Rate 21.0000% 21.0000% 21.0000%
Jurisdictional Factor 0.98875 0.98875 0.98875
Tax Rate (Jurisdictionalized) 20.7637% 20.7637% 20.7637%
Federal Income Tax Multiplier 0.69370 0.69370 0.69370
Uncollectibles and Franchise Fees Multiplier 1.01138 1.01138 1.01138
Net to Gross Multiplier 1.44154 1.44154 1.44154

2 Rate of Return
2018 2019 2020
Cost Factors
Long-Term Debt 4.98% 4.98% 4.74%
Preferred Stock 5.82% 5.82% 5.70%
Equity 10.30% 10.30% 10.30%
Capitalization Ratios
Long-Term Debt 43.00% 43.00% 43.00%
Preferred Stock 9.00% 9.00% 5.00%
Equity 48.00% 48.00% 52.00%
Weighted Costs
Long-Term Debt 2.14% 2.14% 2.04%
Preferred Stock 0.52% 0.52% 0.29%
Equity 4.94% 4.94% 5.36%
Return on Rate Base 7.61% 7.61% 7.68%
3 Taxes - Other Than on Income
2018 2019 2020
Ad Valorem Taxes
California 691 588 488
Total Ad Valorem Taxes 691 588 488
Payroll Taxes
Federal Insurance Contribution Act (FICA) – – –
Federal Unemployment Tax Act (FUTA) – – –
State Unemployment Tax Act (SUTA) – – –
Total Payroll Taxes – – –
Total Taxes - Other Than Income 691 588 488

4 Taxes - Income Tax Adjustments
2018 2019 2020
State Income Tax Adjustments
Tax Depreciation 3,984 3,599 3,231
UNICAP
Interest On Long-Term Debt 1,154 983 776
(Gain)/Loss on Retirement – – –
Cost of Removal - Net of Salvage
Regulatory Asset – – –
Ad Valorem Lien Date Adjustment (39) (63) (37)
Total California Income Tax Adjustments 5,098 4,518 3,971
Federal Income Tax Adjustments
Tax Depreciation 5,720 4,971 4,283
UNICAP
Interest On Long-Term Debt 1,154 983 776
(Gain)/Loss on Retirement – – –
Cost of Removal - Net of Salvage
Regulatory Asset – – –
Ad Valorem Lien Date Adjustment (39) (63) (37)
Total Federal Income Tax Adjustments 6,834 5,890 5,022
5 Taxes - State Income Taxes
2018 2019 2020
Operating Revenues 13,408 14,211 11,978
Operating Expenses 713 2,546 1,306
Taxes - Other Than Income 691 588 488
State Income Tax Adjustments 5,098 4,518 3,971
Taxable Income 6,905 6,558 6,213
California Corporate Franchise Tax Rate 8.840% 8.840% 8.840%
California Tax Expense/(Benefit) 610 580 549
Arizona Income Tax Rate – – –
Arizona Tax Expense/(Benefit) – – –
New Mexico Income Tax Rate – – –
New Mexico Tax Expense/(Benefit) – – –
State Income Tax Expense/(Benefit) 610 580 549

6 Taxes - Federal Income Taxes
2018 2019 2020
Operating Revenues 13,408 14,211 11,978
Operating Expenses 713 2,546 1,306
Taxes - Other Than Income 691 588 488
State Income Taxes 610 580 549
Federal Income Tax Adjustments 6,834 5,890 5,022
Federal Taxable Income 4,559 4,606 4,612
California Corporate Franchise Tax Rate 21.00% 21.00% 21.00%
California Tax Expense/(Benefit) 957 967 969
Deferred Tax Expense (164) (284) (388)
Federal Income Tax Expense/(Benefit) 793 684 581
7 Rate Base (End of Year)
2018 2019 2020
Fixed Capital
Gross Investment 65,131 61,302 61,302
Total Fixed Capital 65,131 61,302 61,302
Deductions for Reserves
Depreciation Reserve 14,553 20,875 27,005
Accumulated Deferred Taxes (248) (532) (920)
Total Deductions for Reserves 14,305 20,343 26,085
Total Rate Base 50,826 40,959 35,217
8 Rate Base (Weighted Average)
2018 2019 2020
Fixed Capital
Gross Investment 65,010 63,217 61,302
Total Fixed Capital 65,010 63,217 61,302
Deductions for Reserves
Depreciation Reserve 11,302 17,714 23,940
Accumulated Deferred Taxes (160) (379) (710)
Total Deductions for Reserves 11,143 17,335 23,229
Total Rate Base 53,868 45,882 38,073

9 Summary of Earnings
2018 2019 2020
Operating Revenues 13,408 14,211 11,978
Operating Expenses
O&M 563 2,386 1,171
Uncollectibles 28 30 25
Franchise Requirements 123 130 110
Total Operating Expenses 713 2,546 1,306
Depreciation 6,501 6,322 6,130
Property Taxes 691 588 488
Payroll Taxes – – –
Taxes Based on Income 1,404 1,263 1,130
Total Taxes 2,094 1,852 1,618
Total Operating Expenses and Taxes 9,309 10,720 9,054
Net Operating Revenue 4,099 3,491 2,924
Rate Base (Weighted Average) 53,868 45,882 38,073
Rate of Return 7.61% 7.61% 7.68%

2018 GRCRevenue Requirement Multiplier
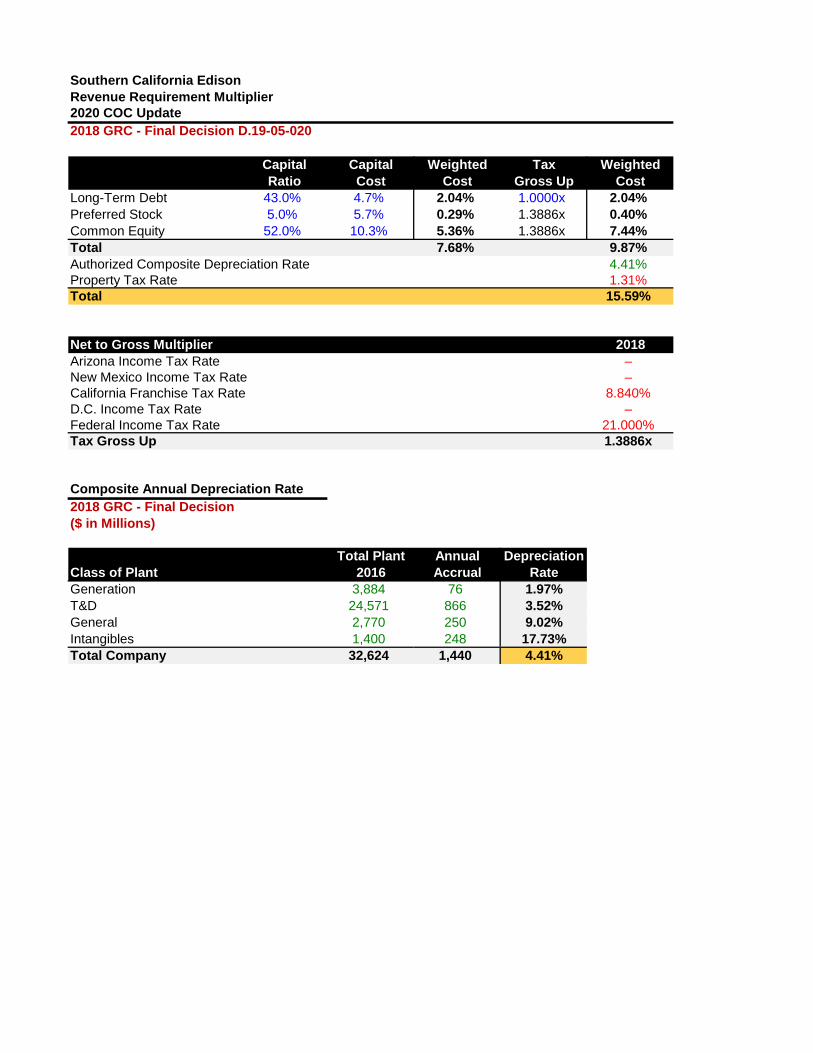
Southern California Edison
Revenue Requirement Multiplier
2020 COC Update
2018 GRC - Final Decision D.19-05-020
Capital Capital Weighted Tax Weighted
Ratio Cost Cost Gross Up Cost
Long-Term Debt 43.0% 4.7% 2.04% 1.0000x 2.04%
Preferred Stock 5.0% 5.7% 0.29% 1.3886x 0.40%
Common Equity 52.0% 10.3% 5.36% 1.3886x 7.44%
Total 7.68% 9.87%
Authorized Composite Depreciation Rate 4.41%
Property Tax Rate 1.31%
Total 15.59%
Net to Gross Multiplier 2018
Arizona Income Tax Rate –
New Mexico Income Tax Rate –
California Franchise Tax Rate 8.840%
D.C. Income Tax Rate –
Federal Income Tax Rate 21.000%
Tax Gross Up 1.3886x
Composite Annual Depreciation Rate
2018 GRC - Final Decision
($ in Millions)
Total Plant Annual Depreciation
Class of Plant 2016 Accrual Rate
Generation 3,884 76 1.97%
T&D 24,571 866 3.52%
General 2,770 250 9.02%
Intangibles 1,400 248 17.73%
Total Company 32,624 1,440 4.41%