advertising & audiences - nielsen · pdf fileadvertising & audiences report copright...
TRANSCRIPT

1ADVERTISING & AUDIENCES REPORT Copyright © 2014 The Nielsen Company
A D V E R T I S I N G& A U D I E N C E S STATE OF THE MEDIAMAY 2014

2 ADVERTISING & AUDIENCES REPORT
3ADVERTISING & AUDIENCES REPORT Copyright © 2014 The Nielsen Company
S H I F T S I N T H E M E D I A L A N D S C A P EHOW ADVERTISERS CAN CAPITALIZE ON CHANGES IN THE MEDIA MARKETPLACEThe advertising landscape is evolving at an unprecedented rate,
influenced largely by two factors: media fragmentation and population
shifts. Changes in the population are creating a younger, more diverse,
more tech-savvy consumer base. Identifying how to reach them has
become more complicated due to an exploding number of viewing
options.
Media fragmentation, oft-perceived as a hindrance, is emerging as
one of the industry’s greatest opportunities. The ever-increasing range
of media channels available for viewer consumption has allowed
marketers to connect with consumers in new ways and opened the
minds of intended audiences to embracing new mediums for receiving
information about goods and services.
As accountability from the largest global advertisers is becoming
increasingly important, marketers and media planners seek ways to
optimize advertising efforts in a way that yields return on investment
through measurable, quantifiable results that align directly with overall
business objectives. While massive amounts of data are available,
sorting through it all in a straightforward, easy-to-understand way that
provides specific, ad-performance based insights is the true challenge.
Fortunately, data measurement solutions exist to optimize reach and
resonance to garner the greatest reaction. These “three Rs”—reach,
resonance, and reaction—as a marketing effectiveness framework are a
simple yet powerful and, most importantly, proven way to understand
advertising performance. In order to achieve maximum effectiveness,
advertisers need to optimize and measure audience delivery, brand lift
and sales impact with common metrics across screens.

4 ADVERTISING & AUDIENCES REPORT
5ADVERTISING & AUDIENCES REPORT Copyright © 2014 The Nielsen Company
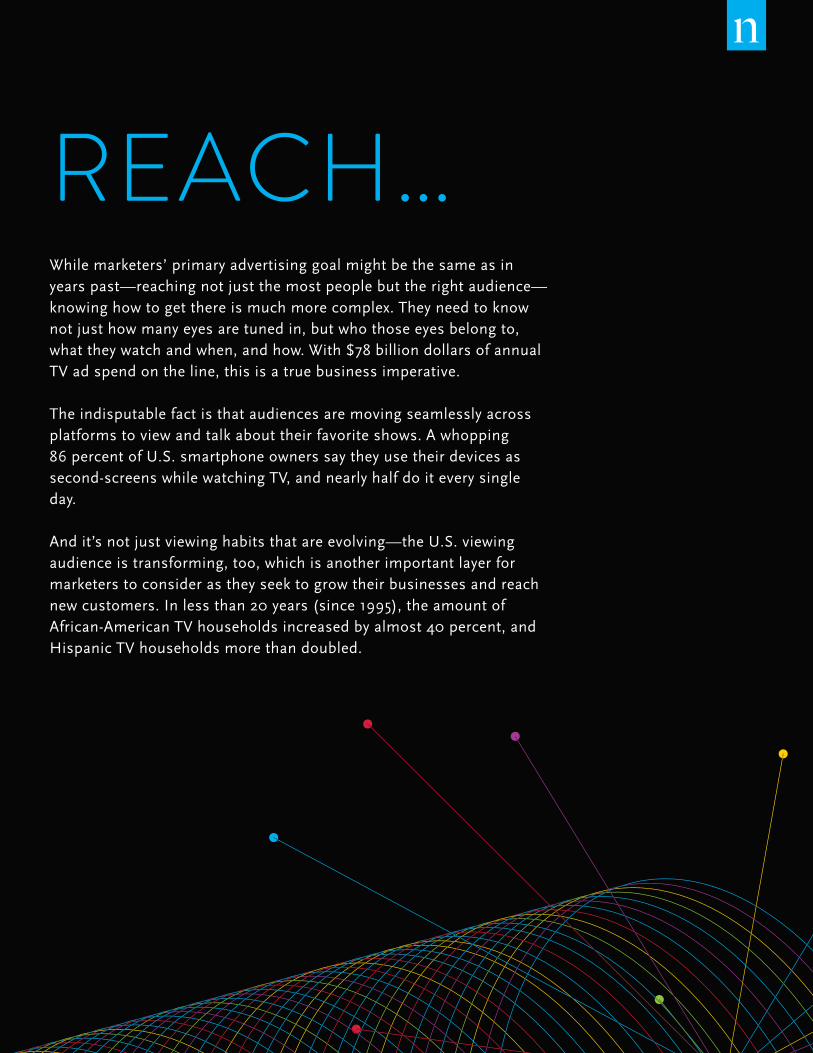
REACH…While marketers’ primary advertising goal might be the same as in years past—reaching not just the most people but the right audience—knowing how to get there is much more complex. They need to know not just how many eyes are tuned in, but who those eyes belong to, what they watch and when, and how. With $78 billion dollars of annual TV ad spend on the line, this is a true business imperative.
The indisputable fact is that audiences are moving seamlessly across platforms to view and talk about their favorite shows. A whopping 86 percent of U.S. smartphone owners say they use their devices as second-screens while watching TV, and nearly half do it every single day.
And it’s not just viewing habits that are evolving—the U.S. viewing audience is transforming, too, which is another important layer for marketers to consider as they seek to grow their businesses and reach new customers. In less than 20 years (since 1995), the amount of African-American TV households increased by almost 40 percent, and Hispanic TV households more than doubled.
6 ADVERTISING & AUDIENCES REPORT
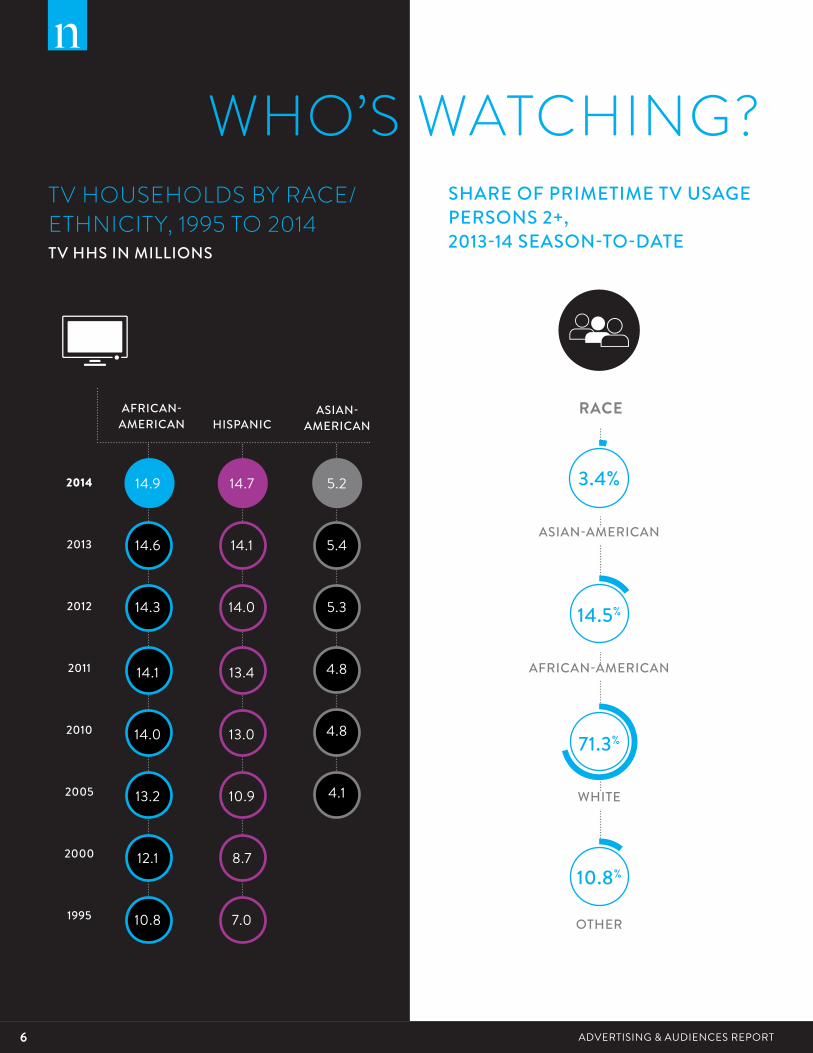
TV HOUSEHOLDS BY RACE/ETHNICITY, 1995 TO 2014TV HHS IN MILLIONS
SHARE OF PRIMETIME TV USAGE PERSONS 2+, 2013-14 SEASON-TO-DATE
AFRICAN-AMERICAN HISPANIC
ASIAN-AMERICAN
RACE
ASIAN-AMERICAN
3.4%
14.5%
10.8%
71.3%
AFRICAN-AMERICAN
OTHER
WHITE
2014
2013
2012
2011
2010
2005
2000
1995
14.9
14.6
14.3
14.1
14.0
13.2
12.1
10.8
14.7
14.1
14.0
13.4
13.0
10.9
8.7
7.0
5.2
5.4
5.3
4.8
4.8
4.1
WHO’S WATCHING?
7ADVERTISING & AUDIENCES REPORT Copyright © 2014 The Nielsen Company
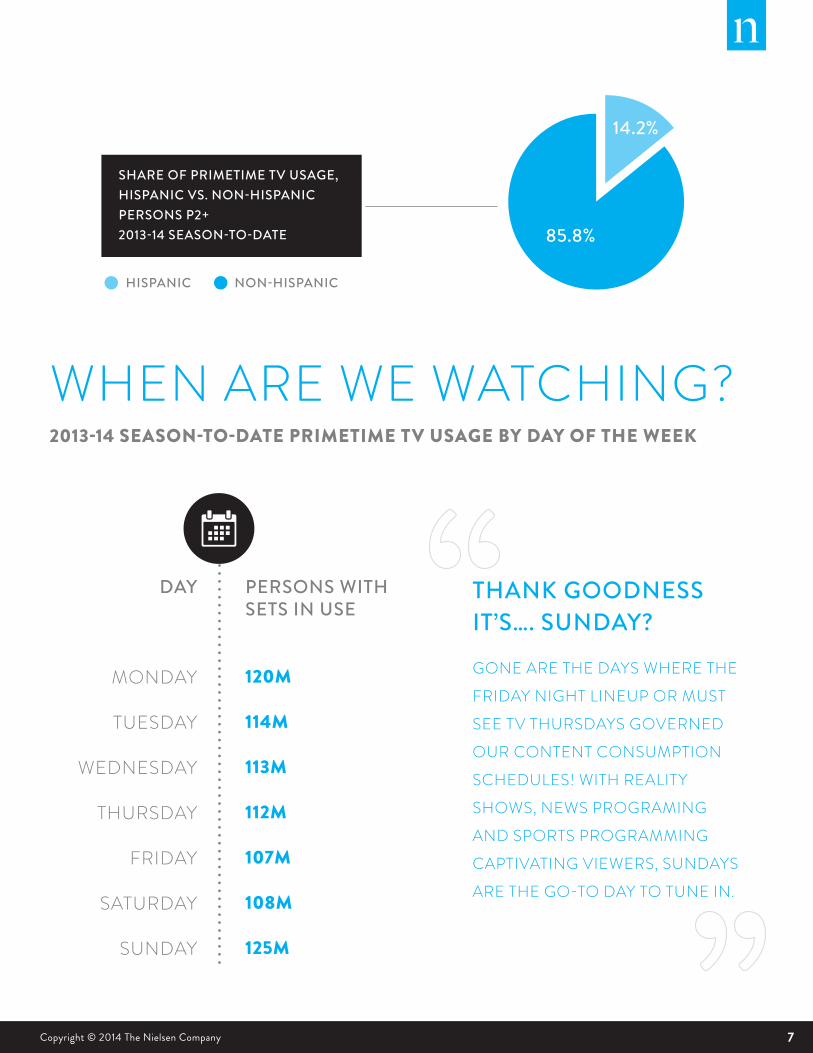
SHARE OF PRIMETIME TV USAGE, HISPANIC VS. NON-HISPANIC PERSONS P2+2013-14 SEASON-TO-DATE
2013-14 SEASON-TO-DATE PRIMETIME TV USAGE BY DAY OF THE WEEK
DAY
MONDAY
TUESDAY
WEDNESDAY
THURSDAY
FRIDAY
SATURDAY
SUNDAY
PERSONS WITH SETS IN USE
120M
114M
113M
112M
107M
108M
125M
14.2%
85.8%
HISPANIC NON-HISPANIC
THANK GOODNESS IT’S…. SUNDAY?
GONE ARE THE DAYS WHERE THE
FRIDAY NIGHT LINEUP OR MUST
SEE TV THURSDAYS GOVERNED
OUR CONTENT CONSUMPTION
SCHEDULES! WITH REALITY
SHOWS, NEWS PROGRAMING
AND SPORTS PROGRAMMING
CAPTIVATING VIEWERS, SUNDAYS
ARE THE GO-TO DAY TO TUNE IN.
WHO’S WATCHING?
WHEN ARE WE WATCHING?
8 ADVERTISING & AUDIENCES REPORT
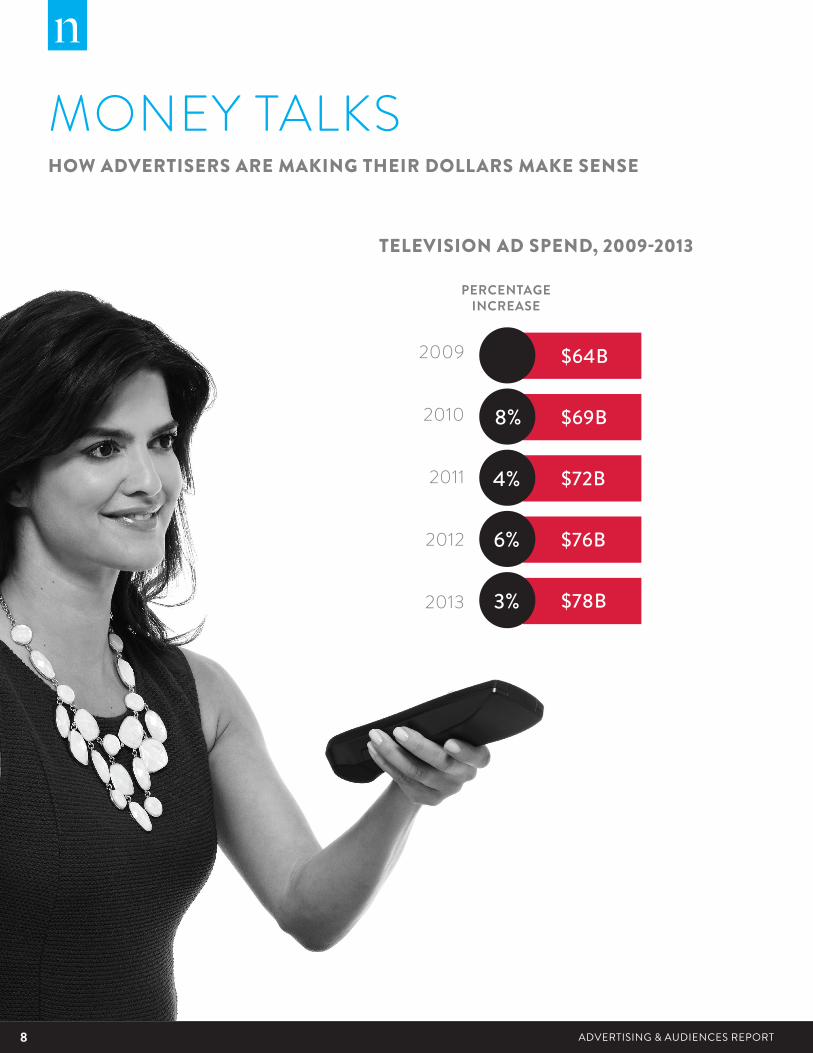
TELEVISION AD SPEND, 2009-2013
PERCENTAGE INCREASE
2009
2010
2011
2012
2013
$64B
$69B
$72B
$76B
$78B
8%
4%
6%
3%
HOW ADVERTISERS ARE MAKING THEIR DOLLARS MAKE SENSE
MONEY TALKS
9ADVERTISING & AUDIENCES REPORT Copyright © 2014 The Nielsen Company
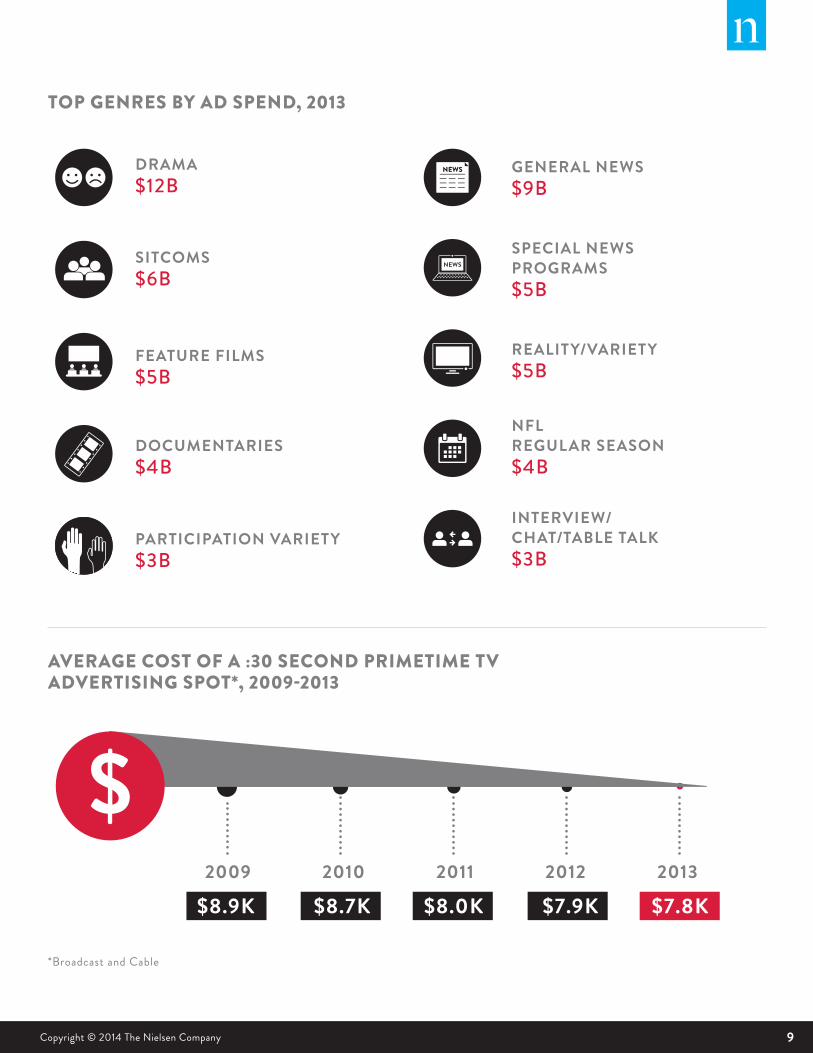
TOP GENRES BY AD SPEND, 2013
AVERAGE COST OF A :30 SECOND PRIMETIME TV ADVERTISING SPOT*, 2009-2013
DRAMA $12B
GENERAL NEWS$9B
SPECIAL NEWS PROGRAMS$5B
REALITY/VARIETY$5B
NFL REGULAR SEASON$4B
INTERVIEW/ CHAT/TABLE TALK$3B
SITCOMS$6B
FEATURE FILMS$5B
DOCUMENTARIES$4B
PARTICIPATION VARIETY$3B
2009 2010 2011 2012 2013
$8.9K $8.7K $8.0K $7.9K $7.8K
*Broadcast and Cable
10 ADVERTISING & AUDIENCES REPORT
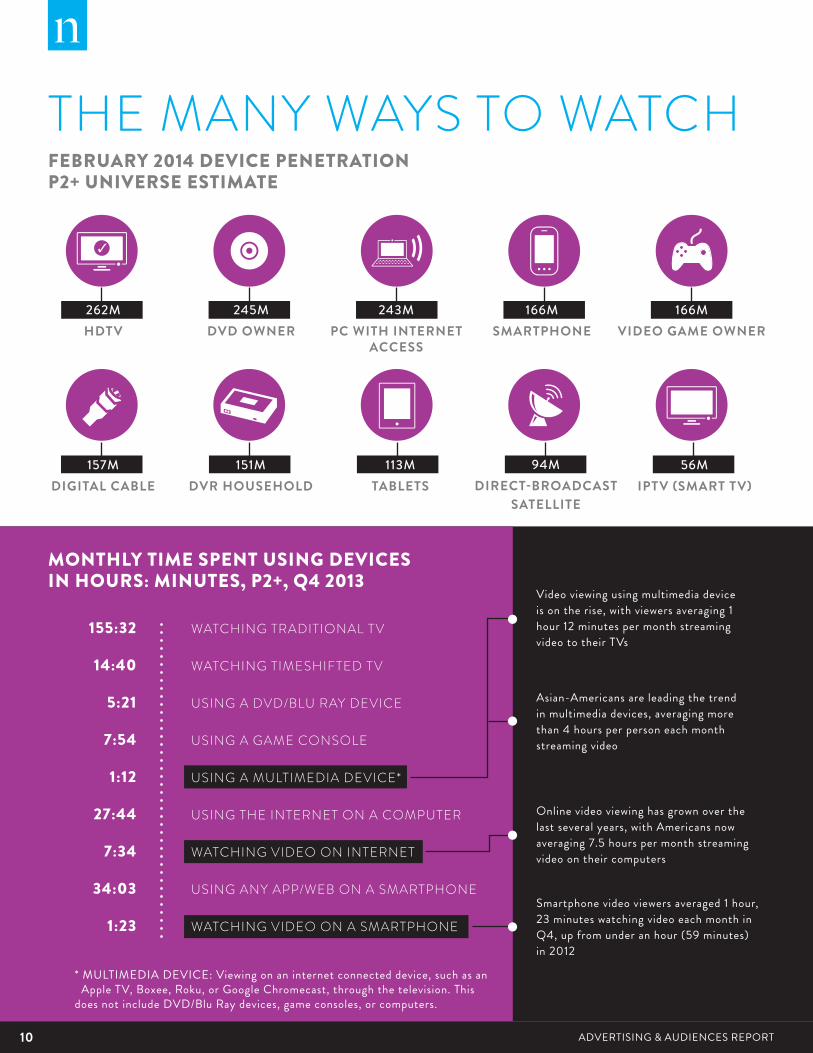
56MIPTV (SMART TV)
157MDIGITAL CABLE
243MPC WITH INTERNET
ACCESS
151MDVR HOUSEHOLD
262MHDTV
245MDVD OWNER
166MVIDEO GAME OWNER
113MTABLETS
94MDIRECT-BROADCAST
SATELLITE
166MSMARTPHONE
FEBRUARY 2014 DEVICE PENETRATIONP2+ UNIVERSE ESTIMATE
MONTHLY TIME SPENT USING DEVICES IN HOURS: MINUTES, P2+, Q4 2013
Asian-Americans are leading the trend in multimedia devices, averaging more than 4 hours per person each month streaming video
Online video viewing has grown over the last several years, with Americans now averaging 7.5 hours per month streaming video on their computers
Smartphone video viewers averaged 1 hour, 23 minutes watching video each month in Q4, up from under an hour (59 minutes) in 2012
* MULTIMEDIA DEVICE: Viewing on an internet connected device, such as an Apple TV, Boxee, Roku, or Google Chromecast, through the television. This does not include DVD/Blu Ray devices, game consoles, or computers.
155:32
14:40
5:21
7:54
1:12
27:44
7:34
34:03
1:23
Video viewing using multimedia device is on the rise, with viewers averaging 1 hour 12 minutes per month streaming video to their TVs
THE MANY WAYS TO WATCH
WATCHING TRADITIONAL TV
WATCHING TIMESHIFTED TV
USING A DVD/BLU RAY DEVICE
USING A GAME CONSOLE
USING A MULTIMEDIA DEVICE*
USING THE INTERNET ON A COMPUTER
WATCHING VIDEO ON INTERNET
USING ANY APP/WEB ON A SMARTPHONE
WATCHING VIDEO ON A SMARTPHONE
11ADVERTISING & AUDIENCES REPORT Copyright © 2014 The Nielsen Company
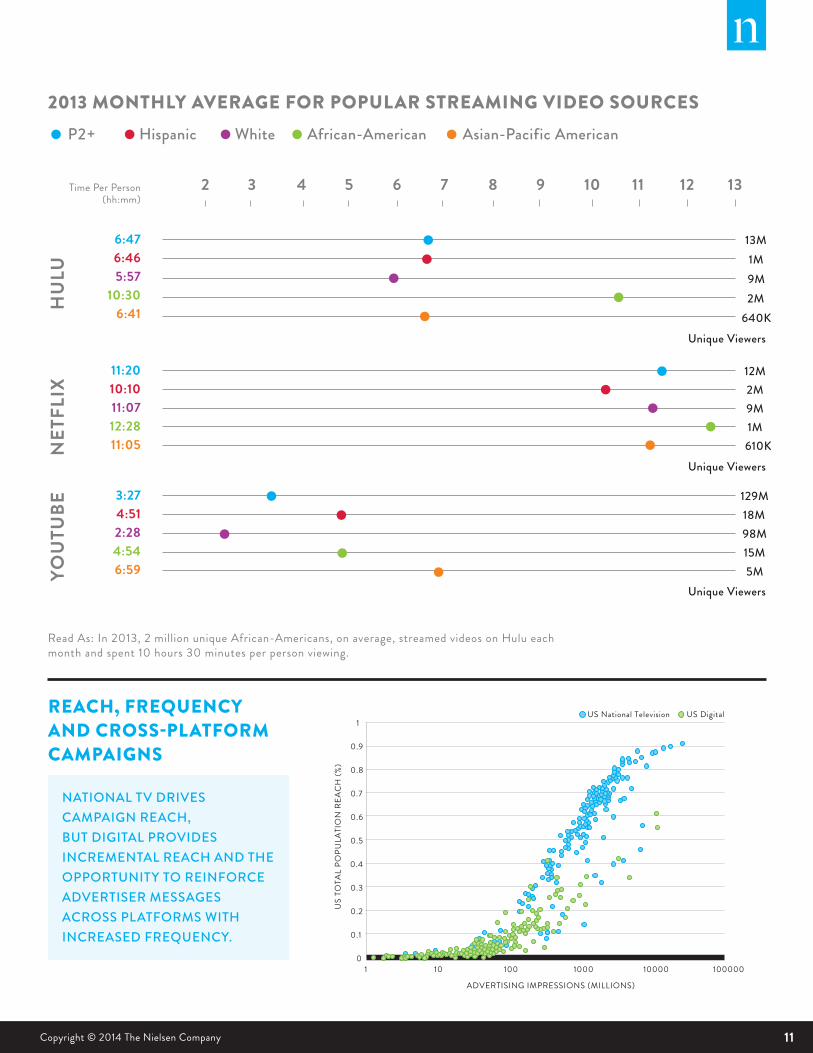
Read As: In 2013, 2 million unique African-Americans, on average, streamed videos on Hulu each month and spent 10 hours 30 minutes per person viewing.
2013 MONTHLY AVERAGE FOR POPULAR STREAMING VIDEO SOURCES
2 3 4 5 6 7 8 9 10 11 12 13
P2+ Hispanic White African-American Asian-Pacific American
Unique Viewers
Unique Viewers
Unique Viewers
Time Per Person (hh:mm)
6:476:465:57
10:306:41
11:2010:1011:0712:2811:05
3:274:512:284:546:59
13M
12M
129M
HU
LUN
ETFL
IXYO
UTU
BE
1M
2M
18M
9M2M
640K
9M1M610K
98M15M5M
0
0.1
0.2
0.3
0.4
0.5
0.6
0.7
0.8
0.9
1
1 10 100 1000 10000 100000
US
TOTA
L PO
PULA
TIO
N R
EAC
H (%
)
ADVERTISING IMPRESSIONS (MILLIONS)
US National Television US Digital
NATIONAL TV DRIVES CAMPAIGN REACH, BUT DIGITAL PROVIDES INCREMENTAL REACH AND THE OPPORTUNITY TO REINFORCE ADVERTISER MESSAGES ACROSS PLATFORMS WITH INCREASED FREQUENCY.
REACH, FREQUENCY AND CROSS-PLATFORM CAMPAIGNS

12 ADVERTISING & AUDIENCES REPORT
13ADVERTISING & AUDIENCES REPORT Copyright © 2014 The Nielsen Company
RESONANCE…With an average of 38 ads airing every minute across national TV, breaking through the clutter is essential. All the many new ways for us to consume media have only added to the number of messages consumers are bombarded with on a daily, even hourly basis. In addition, consumers’ attentions are pulled in different directions thanks to the proliferation of “second screen” devices.
Beyond reaching the right consumers, advertisers are tasked with finding creative ways to stand out in this complex media environment. How do some ads resonate with viewers while thousands of others are readily discarded from our thoughts?
On TV, ad characteristics such as the use of a relatable storyline, a connection through humor or emotion or attention-grabbing sights and sounds, are proven factors for the success quotient. Focusing on creating an entertaining ad first—and educating the consumer second—is a key way to boost memorability and branding. Understanding the impact that factors such as ad characteristics, program engagement, complementary reach and frequency have on an ad’s success is vital—in fact, for every 2 percentage point improvement in a viewer’s program engagement, advertisers can (on average) expect a 1 percentage point improvement in sustained ad memorability.
In the fourth quarter of 2013, time spent streaming online video using computers increased on average to 7 hours 34 minutes per month, up from just 5 hours 54 minutes in 2012. And between 2008 and 2013, the average amount of channels received by viewers increased by 60, but the average amount of channels actually tuned in remained constant at about 17, illustrating that competition for viewers’ attention is growing steeper.
As options for consuming media become more plentiful, and content across the board becomes richer, advertisers have to employ different tactics to ensure that messages hit their mark.
14 ADVERTISING & AUDIENCES REPORT
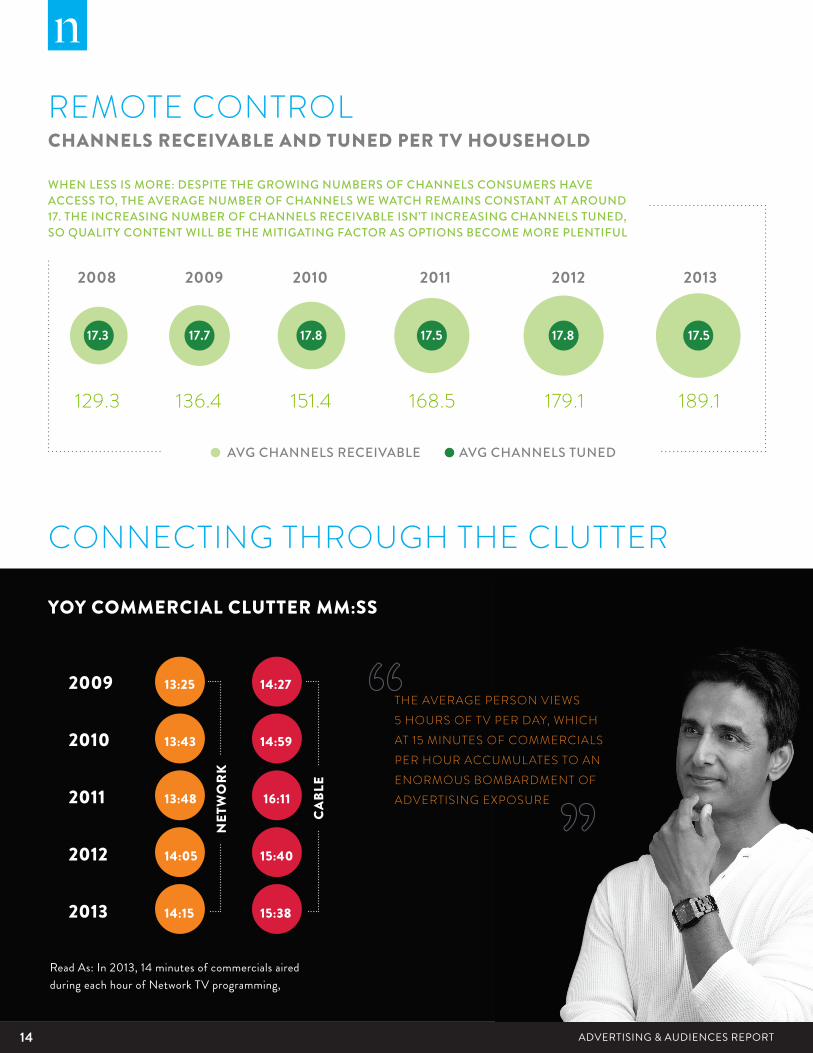
CHANNELS RECEIVABLE AND TUNED PER TV HOUSEHOLD
YOY COMMERCIAL CLUTTER MM:SS
2009 13:25 14:27
2010 13:43 14:59
2011 13:48 16:11
2012 14:05 15:40
2013 14:15 15:38
AVG CHANNELS RECEIVABLE
2008 2009 2010 2011 2012 2013
129.3 136.4 151.4 168.5 179.1 189.1
AVG CHANNELS TUNED
17.3 17.7 17.8 17.5 17.8 17.5
WHEN LESS IS MORE: DESPITE THE GROWING NUMBERS OF CHANNELS CONSUMERS HAVE ACCESS TO, THE AVERAGE NUMBER OF CHANNELS WE WATCH REMAINS CONSTANT AT AROUND 17. THE INCREASING NUMBER OF CHANNELS RECEIVABLE ISN’T INCREASING CHANNELS TUNED, SO QUALITY CONTENT WILL BE THE MITIGATING FACTOR AS OPTIONS BECOME MORE PLENTIFUL
THE AVERAGE PERSON VIEWS 5 HOURS OF TV PER DAY, WHICH AT 15 MINUTES OF COMMERCIALS PER HOUR ACCUMULATES TO AN ENORMOUS BOMBARDMENT OF ADVERTISING EXPOSURE
Read As: In 2013, 14 minutes of commercials aired during each hour of Network TV programming,
CA
BLE
NET
WO
RK
REMOTE CONTROL
CONNECTING THROUGH THE CLUTTER
15ADVERTISING & AUDIENCES REPORT Copyright © 2014 The Nielsen Company
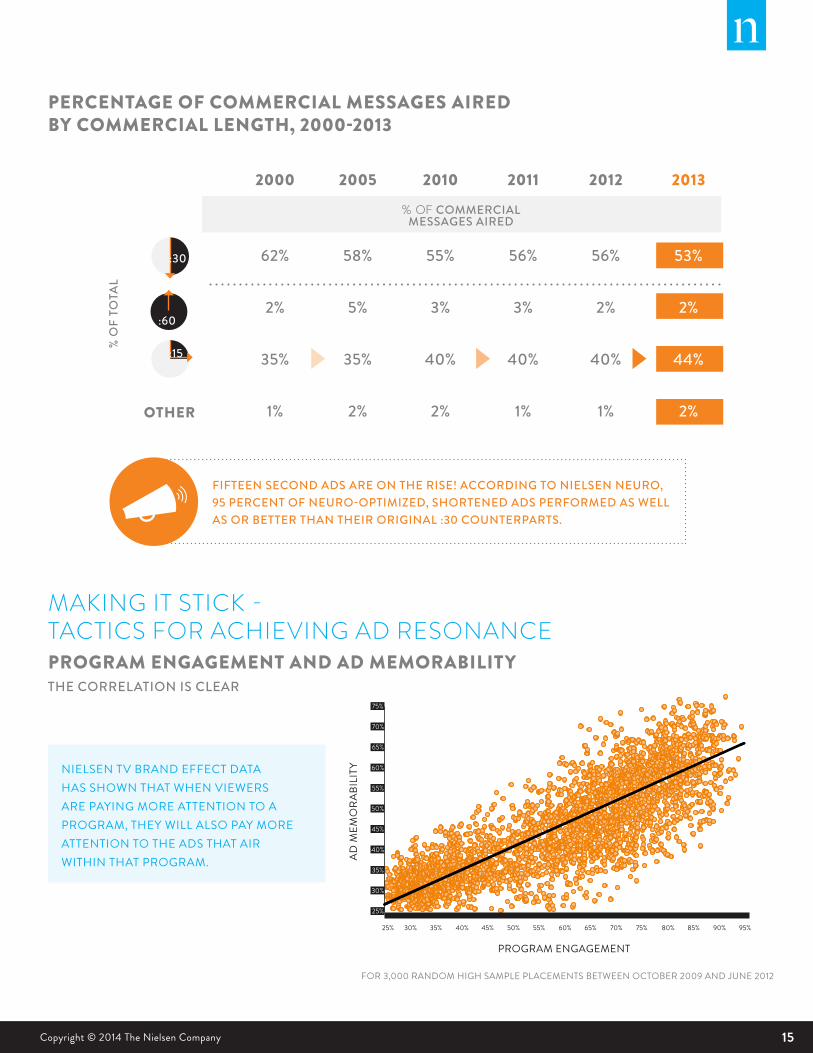
PERCENTAGE OF COMMERCIAL MESSAGES AIRED BY COMMERCIAL LENGTH, 2000-2013
% OF COMMERCIAL MESSAGES AIRED
OTHER
% O
F TO
TAL
:30
:15
:60
FIFTEEN SECOND ADS ARE ON THE RISE! ACCORDING TO NIELSEN NEURO, 95 PERCENT OF NEURO-OPTIMIZED, SHORTENED ADS PERFORMED AS WELL AS OR BETTER THAN THEIR ORIGINAL :30 COUNTERPARTS.
NIELSEN TV BRAND EFFECT DATA HAS SHOWN THAT WHEN VIEWERS ARE PAYING MORE ATTENTION TO A PROGRAM, THEY WILL ALSO PAY MORE ATTENTION TO THE ADS THAT AIR WITHIN THAT PROGRAM.
PROGRAM ENGAGEMENT AND AD MEMORABILITYTHE CORRELATION IS CLEAR
2000
62%
2%
35%
1%
2005
58%
5%
35%
2%
2010
55%
3%
40%
2%
2011
56%
3%
40%
1%
2012
56%
2%
40%
1%
2013
53%
2%
44%
2%
MAKING IT STICK - TACTICS FOR ACHIEVING AD RESONANCE
25%
30%
35%
40%
45%
50%
55%
60%
65%
70%
75%
25% 30% 35% 40% 45% 50% 55% 60% 65% 70% 75% 80% 85% 90% 95%
FOR 3,000 RANDOM HIGH SAMPLE PLACEMENTS BETWEEN OCTOBER 2009 AND JUNE 2012
PROGRAM ENGAGEMENT
AD M
EMO
RABI
LITY
16 ADVERTISING & AUDIENCES REPORT
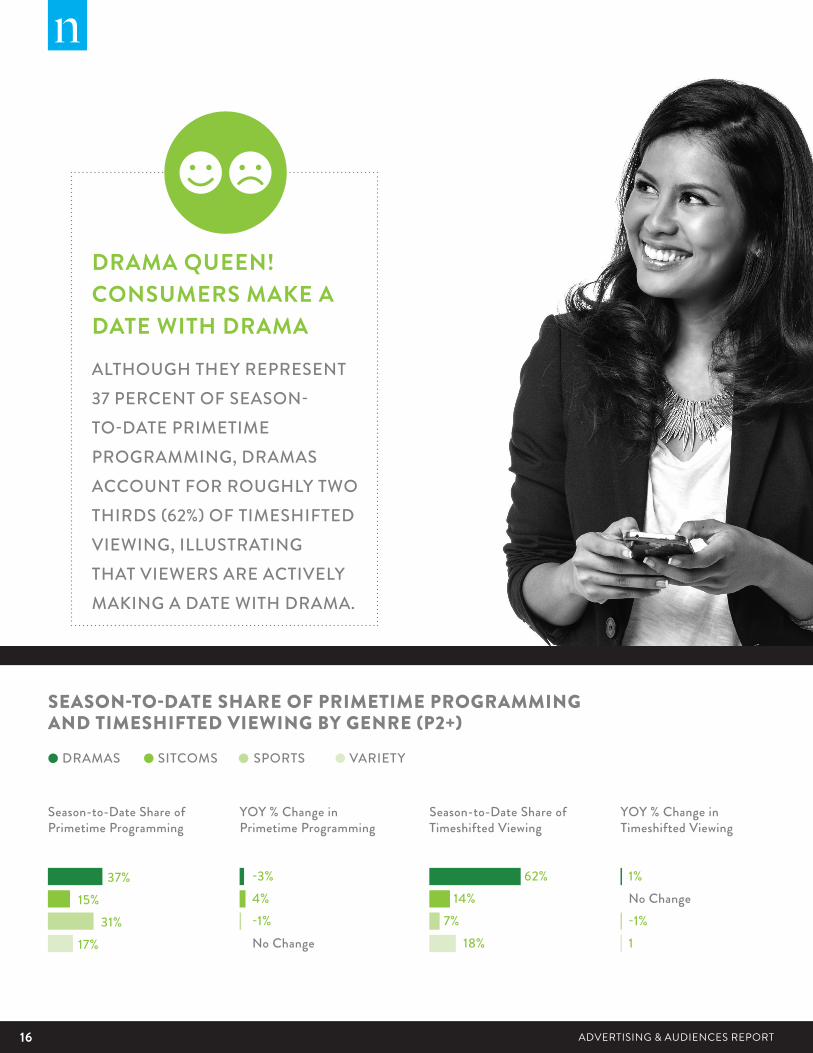
SEASON-TO-DATE SHARE OF PRIMETIME PROGRAMMING AND TIMESHIFTED VIEWING BY GENRE (P2+)
Season-to-Date Share of Primetime Programming
DRAMAS SITCOMS SPORTS VARIETY
YOY % Change in Primetime Programming
Season-to-Date Share of Timeshifted Viewing
YOY % Change in Timeshifted Viewing
37%15% 31%17%
-3%4%-1%No Change
1%No Change-1%1
62% 14%7% 18%
DRAMA QUEEN! CONSUMERS MAKE A DATE WITH DRAMA
ALTHOUGH THEY REPRESENT 37 PERCENT OF SEASON-TO-DATE PRIMETIME PROGRAMMING, DRAMAS ACCOUNT FOR ROUGHLY TWO THIRDS (62%) OF TIMESHIFTED VIEWING, ILLUSTRATING THAT VIEWERS ARE ACTIVELY MAKING A DATE WITH DRAMA.
17ADVERTISING & AUDIENCES REPORT Copyright © 2014 The Nielsen Company
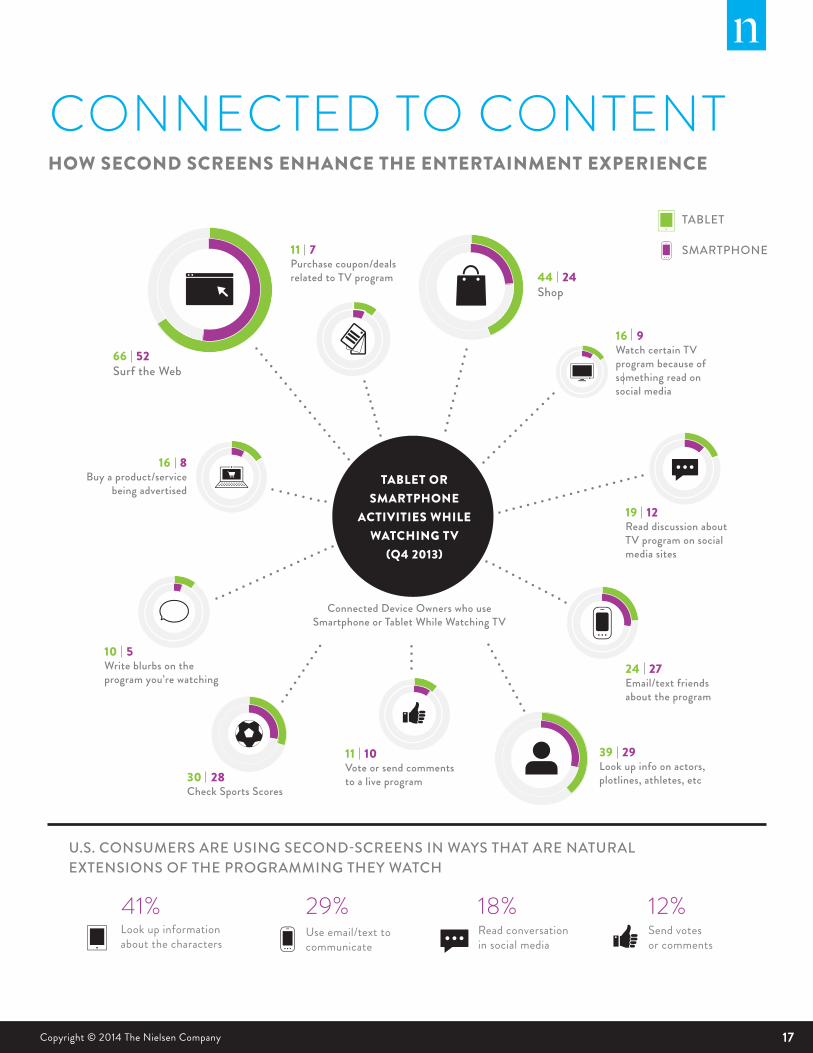
44 24 Shop
66 52Surf the Web
11 7Purchase coupon/deals related to TV program
16 9Watch certain TV program because of something read on social media
19 12Read discussion about TV program on social media sites
24 27Email/text friends about the program
11 10Vote or send comments to a live program30 28
Check Sports Scores
10 5Write blurbs on the program you’re watching
39 29Look up info on actors, plotlines, athletes, etc
16 8Buy a product/service
being advertised
U.S. CONSUMERS ARE USING SECOND-SCREENS IN WAYS THAT ARE NATURAL EXTENSIONS OF THE PROGRAMMING THEY WATCH
TABLET
SMARTPHONE
Look up information about the characters
41% 29% 18% 12%Use email/text to communicate
Read conversation in social media
Send votes or comments
Connected Device Owners who use Smartphone or Tablet While Watching TV
TABLET OR SMARTPHONE
ACTIVITIES WHILE WATCHING TV
(Q4 2013)
HOW SECOND SCREENS ENHANCE THE ENTERTAINMENT EXPERIENCE
CONNECTED TO CONTENT

18 ADVERTISING & AUDIENCES REPORT
19ADVERTISING & AUDIENCES REPORT Copyright © 2014 The Nielsen Company
REACTION.It’s the holy grail of measuring the success of campaigns against actual business objectives. By the end of 2013, U.S. consumers spent $771 billion in the grocery store. Did your ad affect their shopping cart? Roughly one million Americans turn to Twitter to discuss TV on an average day. How does that impact brand perceptions?
Connecting what we watch and how it affects what we buy is the ultimate measure of the impact of an ad. Advertisers and media planners can only truly know if they’ve hit their marks in terms of reaching and resonating with the right audiences if it drives a reaction—whether that be sales, a shift in consumer attitudes, or a desired action such as tuning in to a new show or visiting a website.
With consumers being bombarded with messages, the path to purchase isn’t a straight line anymore. The more we can understand about ad exposure and the decision making process, the better.
20 ADVERTISING & AUDIENCES REPORT
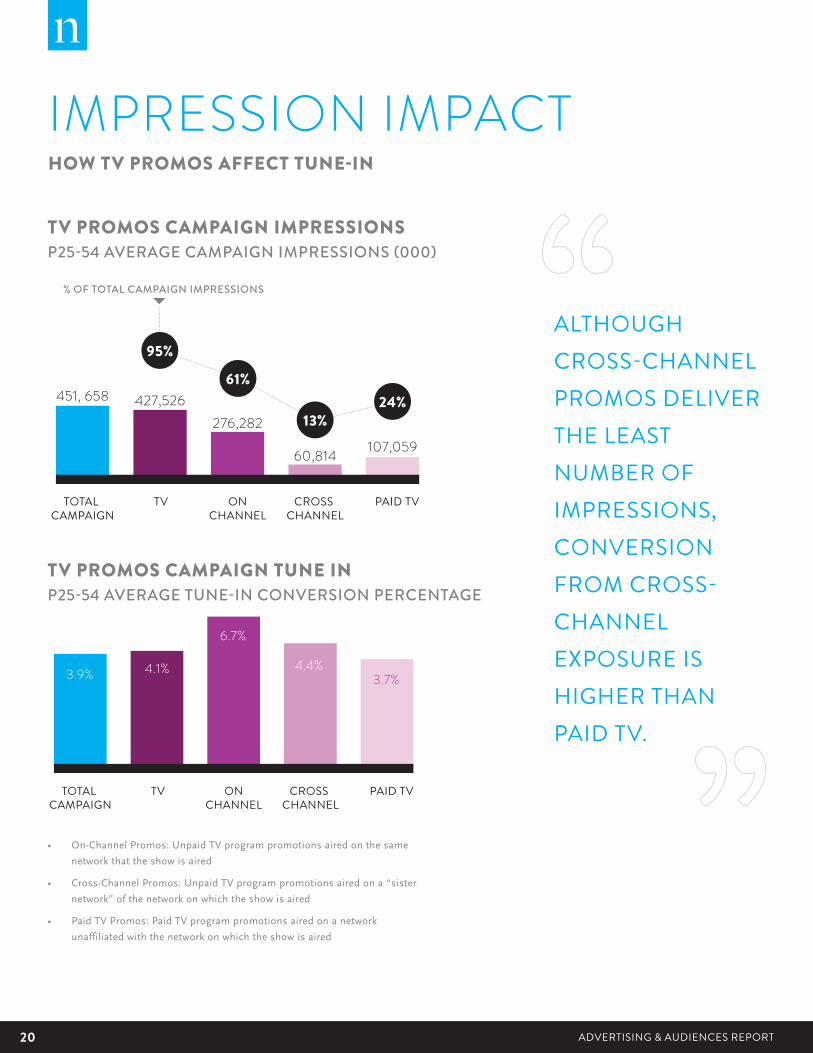
107,059
95%
13%24%
61%
60,814
TOTAL CAMPAIGN
TV ONCHANNEL
CROSS CHANNEL
PAID TV
427,526276,282
451, 658
% OF TOTAL CAMPAIGN IMPRESSIONS
3.7%4.4%
6.7%
4.1%3.9%
TOTAL CAMPAIGN
TV ONCHANNEL
CROSS CHANNEL
PAID TV
TV PROMOS CAMPAIGN IMPRESSIONSP25-54 AVERAGE CAMPAIGN IMPRESSIONS (000)
TV PROMOS CAMPAIGN TUNE INP25-54 AVERAGE TUNE-IN CONVERSION PERCENTAGE
ALTHOUGH CROSS-CHANNEL PROMOS DELIVER THE LEAST NUMBER OF IMPRESSIONS, CONVERSION FROM CROSS-CHANNEL EXPOSURE IS HIGHER THAN PAID TV.
HOW TV PROMOS AFFECT TUNE-IN
IMPRESSION IMPACT
• On-Channel Promos: Unpaid TV program promotions aired on the same
network that the show is aired
• Cross-Channel Promos: Unpaid TV program promotions aired on a “sister
network” of the network on which the show is aired
• Paid TV Promos: Paid TV program promotions aired on a network
unaffiliated with the network on which the show is aired
21ADVERTISING & AUDIENCES REPORT Copyright © 2014 The Nielsen Company
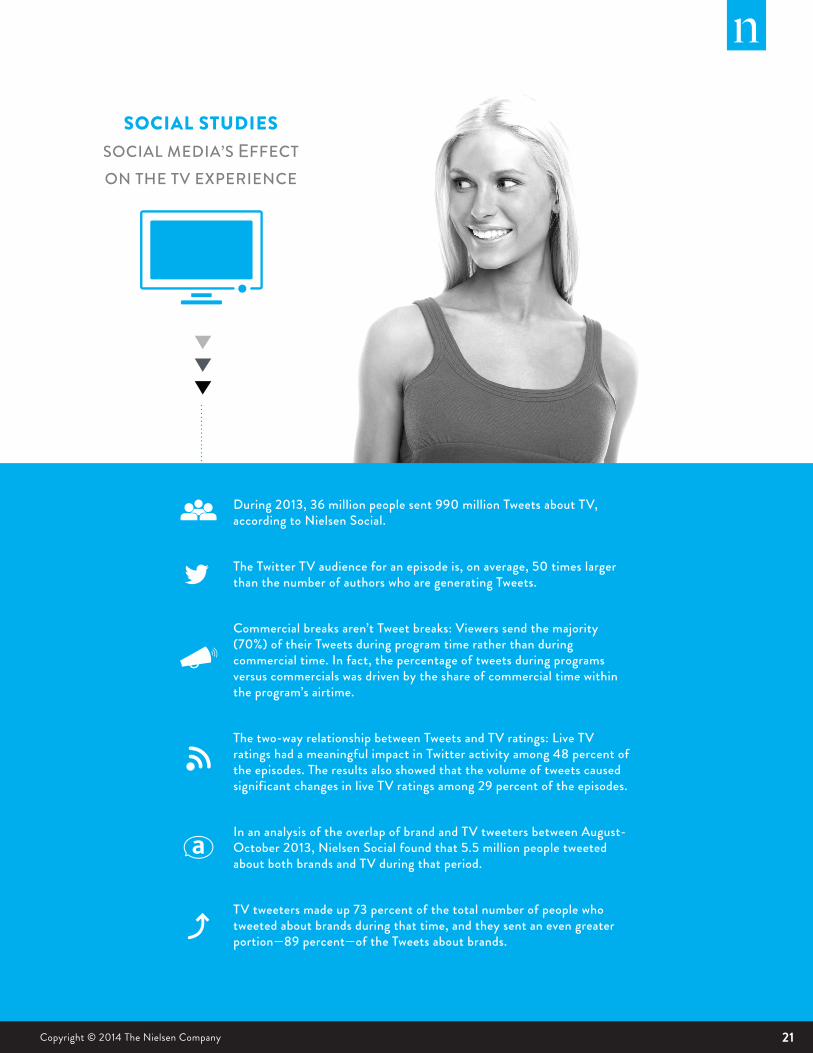
During 2013, 36 million people sent 990 million Tweets about TV, according to Nielsen Social.
The Twitter TV audience for an episode is, on average, 50 times larger than the number of authors who are generating Tweets.
Commercial breaks aren’t Tweet breaks: Viewers send the majority (70%) of their Tweets during program time rather than during commercial time. In fact, the percentage of tweets during programs versus commercials was driven by the share of commercial time within the program’s airtime.
The two-way relationship between Tweets and TV ratings: Live TV ratings had a meaningful impact in Twitter activity among 48 percent of the episodes. The results also showed that the volume of tweets caused significant changes in live TV ratings among 29 percent of the episodes.
In an analysis of the overlap of brand and TV tweeters between August-October 2013, Nielsen Social found that 5.5 million people tweeted about both brands and TV during that period.
TV tweeters made up 73 percent of the total number of people who tweeted about brands during that time, and they sent an even greater portion—89 percent—of the Tweets about brands.
SOCIAL STUDIES SOCIAL MEDIA’S EFFECT ON THE TV EXPERIENCE
22 ADVERTISING & AUDIENCES REPORT
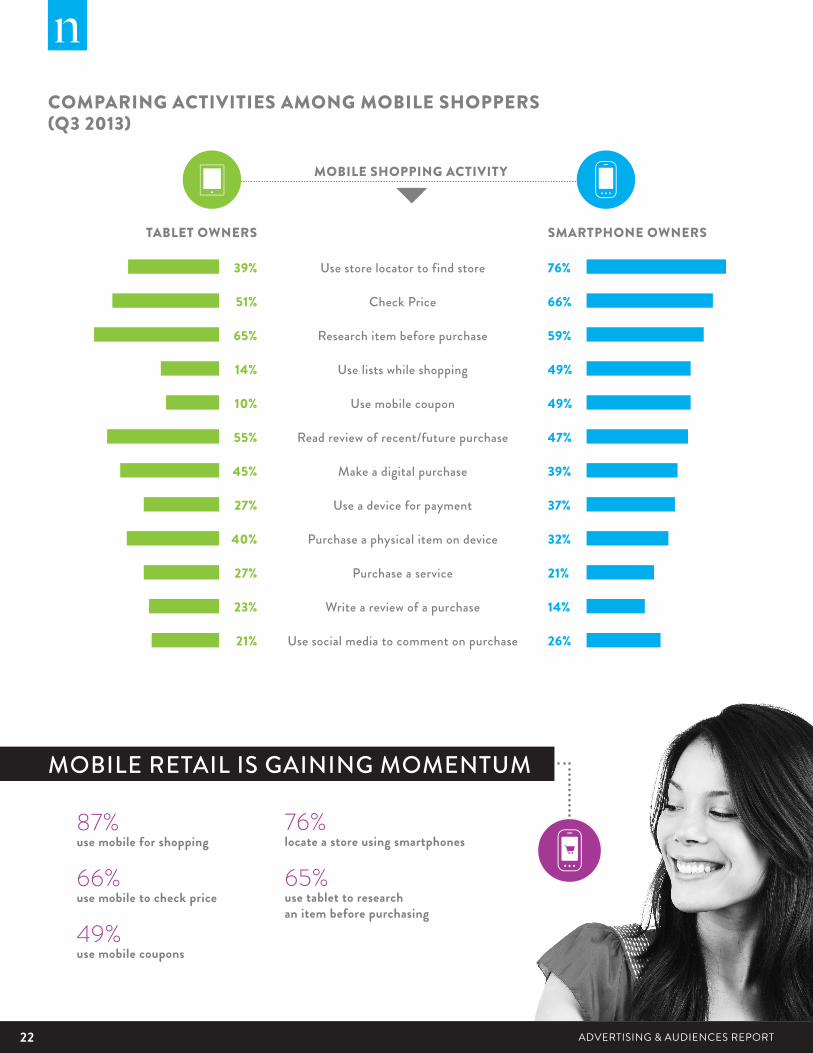
COMPARING ACTIVITIES AMONG MOBILE SHOPPERS (Q3 2013)
TABLET OWNERS SMARTPHONE OWNERS
MOBILE SHOPPING ACTIVITY
Use store locator to find store
Check Price
Research item before purchase
Use lists while shopping
Use mobile coupon
Read review of recent/future purchase
Make a digital purchase
Use a device for payment
Purchase a physical item on device
Purchase a service
Write a review of a purchase
Use social media to comment on purchase
39%
51%
65%
14%
10%
55%
45%
27%
40%
27%
23%
21%
87% use mobile for shopping
66% use mobile to check price
49% use mobile coupons
76% locate a store using smartphones
65% use tablet to research an item before purchasing
76%
66%
59%
49%
49%
47%
39%
37%
32%
21%
14%
26%
MOBILE RETAIL IS GAINING MOMENTUM
23ADVERTISING & AUDIENCES REPORT Copyright © 2014 The Nielsen Company
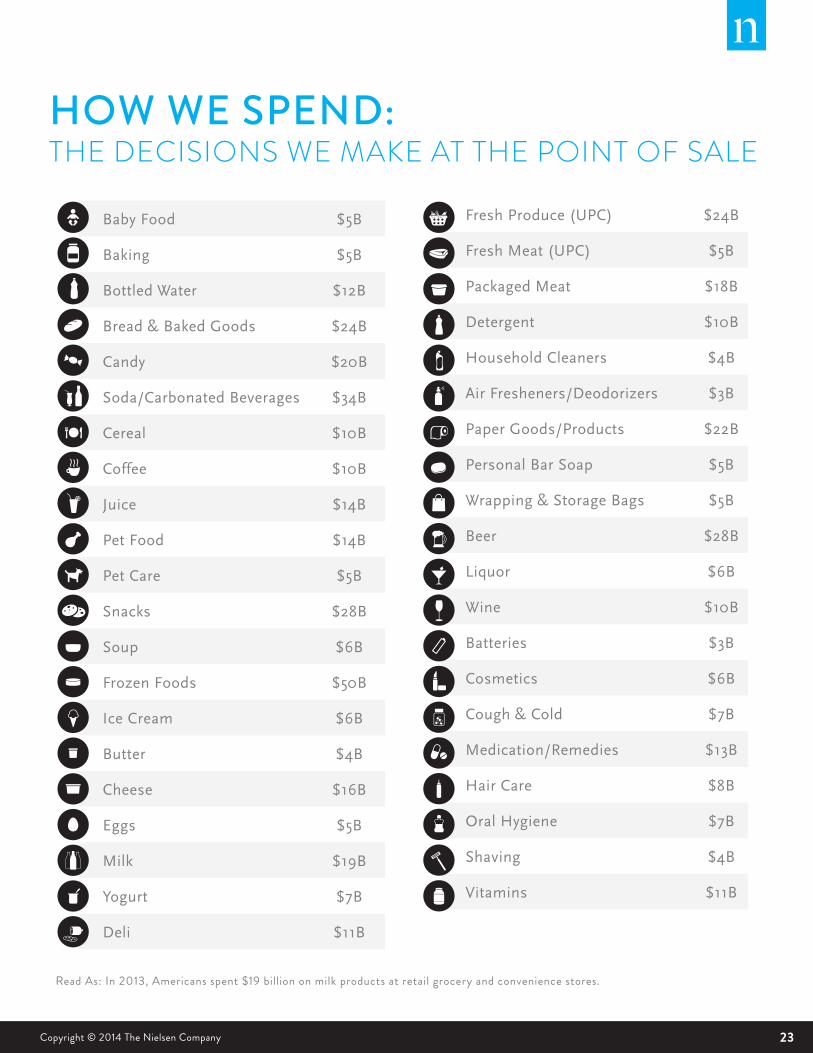
HOW WE SPEND: THE DECISIONS WE MAKE AT THE POINT OF SALE
Baby Food $5B
Baking $5B
Bottled Water $12B
Bread & Baked Goods $24B
Candy $20B
Soda/Carbonated Beverages $34B
Cereal $10B
Coffee $10B
Juice $14B
Pet Food $14B
Pet Care $5B
Snacks $28B
Soup $6B
Frozen Foods $50B
Ice Cream $6B
Butter $4B
Cheese $16B
Eggs $5B
Milk $19B
Yogurt $7B
Deli $11B
Fresh Produce (UPC) $24B
Fresh Meat (UPC) $5B
Packaged Meat $18B
Detergent $10B
Household Cleaners $4B
Air Fresheners/Deodorizers $3B
Paper Goods/Products $22B
Personal Bar Soap $5B
Wrapping & Storage Bags $5B
Beer $28B
Liquor $6B
Wine $10B
Batteries $3B
Cosmetics $6B
Cough & Cold $7B
Medication/Remedies $13B
Hair Care $8B
Oral Hygiene $7B
Shaving $4B
Vitamins $11B
Read As: In 2013, Americans spent $19 billion on milk products at retail grocery and convenience stores.
24 ADVERTISING & AUDIENCES REPORT
CONCLUSIONBy measuring the reach, resonance and reaction of ads across all screens and
advertising models—linear and dynamic digital—the media industry is on the
path to better understanding and increasing the ROI of video ad spend.
The ability to understand the 3Rs is becoming more important every day as
measurement solutions emerge and keep pace with the evolution in media
consumption. With real-time capabilities, performance can be examined,
evaluated and adjusted in-flight, allowing for optimization before ad dollars
are wasted.
Reach. In recent years, the industry has coalesced around a single set of
metrics to compare the reach of a campaign in our complicated
cross-platform world. Solutions like Nielsen Online Campaign Ratings,
which delivers TV-comparable reach measures with unparalleled precision,
have been adopted by advertisers, publishers and agencies, integrated into
core planning and buying tools and programs, and—importantly—used as the
basis for video guarantees. Nielsen Cross-Platform Campaign Ratings takes
this one step further by providing insight into the duplicated and incremental
reach of TV and online campaigns, helping marketers understand who saw
their campaigns online, on TV and on both platforms. The industry is aided by
sharper planning tools—like Nielsen Audience Segments – TV Viewing—that
provide insight into how to reach consumers online based on their offline
viewing habits.
Resonance. Did consumers remember my ad? Did they like it? Solutions
like Nielsen Brand Effect measure the resonance of ads on TV, online and
on mobile devices with market-leading methodologies and vast normative
databases to level-set the industry. Nielsen Neuro, which uses brainwave
analysis to measure message response and emotional engagement, is a
cutting-edge solution for understanding what makes consumers tick at the
most fundamental level.
Reaction. There is endless research into how consumers spend their money
and their time. But very few companies have the ability to connect the two to
demonstrate how ad exposure leads to sales. Nielsen can now measure how
TV or online ad exposure can drive offline sales as well as behavior like social
media activity or additional TV tune-in. Nielsen Buyer Insights combines
Nielsen’s TV or online activity with actual online and offline purchase activity
from anonymized, privacy-protected credit card data. Nielsen Catalina
Solutions helps CPG marketers and media companies measure and improve
advertising performance by accurately linking what consumers watch, see, or
hear (whether on television, the web, in print, or on the radio) with what they
buy.
25ADVERTISING & AUDIENCES REPORT Copyright © 2014 The Nielsen Company
SOURCINGTELEVISION METHODOLOGYTelevision usage statistics come from Nielsen’s national panel of TV
homes. This data was based on a Season-To-Date through January 26,
2014 measurement period and any Year-Over-Year references are based
on comparable measurement periods. Traditional TV includes Live usage
plus any playback within the data stream noted. Metrics for using a DVD/
Blu Ray device and using a game console are based on when those devices
are in use for any purpose, not just for accessing media content. Device
penetration figures are based on February 2014 Universe Estimates.
CHANNELS TUNED ANALYSIS – NPM SAMPLE SOURCE: Nielsen
Custom Data, 08/19/2013 – 08/25/2013 v comparable weeks in the prior
years, Household
SEASON TO DATE SHARE OF PRIMETIME VIEWING: Analysis was based on all National rated Broadcast, Cable and Syndication
programs. SPORTS includes Sporting Events, Sports News, Sports
Commentary and Sports Anthologies.
CHANNELS RECEIVABLE ANALYSIS – NPM SAMPLE SOURCE: Nielsen NPOWER (Custom), 08/19/2013 – 08/25/2013 v comparable weeks
in the prior years, Household
NIELSEN VIDEOCENSUS (2013)Nielsen’s VideoCensus product measures streaming video activity in web
browsers on home and work computers. Using a hybrid methodology,
streaming video activity is projected to be representative for the entire
U.S. population. There are 200,000+ panelists ages 2+ in the U.S. that
participate in the online panel for VideoCensus. The data cited in this
report comes from a monthly average during 2013.
NIELSEN CROSS-PLATFORM REPORT (Q3 2013)A quarterly report compiling measurement from across Nielsen products.
The data included in thisreport are based on users of each medium per
month. Sources include: Traditional TV, Timeshifted TV, DVD, Game
Consoles 07/01/13 - 09/29/13 via Nielsen NPOWER/NPM Panel, Online
07/01/13 - 09/30/13 via Nielsen NetView and Nielsen VideoCensus, Mobile
07/01/13 - 09/30/13 via Nielsen Mobile Video Report/Mobile Insights.
CONNECTED DEVICES REPORT (Q3 2013)The insights from Nielsen’s Mobile Connected Device Report were gathered
from general population sample of 13+ years and with 8,907 respondents
who own a Tablet, e-Reader, Smartphone or Streaming Capable Device.
Device owners were identified from a general population sample as well
as through Nielsen’s Mobile Insights syndicated tracking study. The
respondents completed an online, self-administered survey at the start of
December 2013.
26 ADVERTISING & AUDIENCES REPORT
SOURCING (CONTINUED) NIELSEN SOCIAL (2013)Nielsen Social collects Tweets about TV programs across 250 U.S.
TV networks in real-time. Using data from Twitter’s fire hose, Nielsen
Social ensures comprehensive, accurate collection through automated
and dynamic classifier creation, a rich TV program metadata database,
and human auditing. Nielsen Social collects relevant Tweets from three
hours before, during and three hours after an episode’s initial broadcast,
local time. Unique Audience and Impressions of relevant Tweets are
measured from when the Tweets are sent until the end of the broadcast
day at 5am.
NIELSEN MOBILE SHOPPER REPORT (Q3 2013)The insights from Nielsen’s Mobile Shopper Report were gathered from
general population sample of 18+ years and with 3,032 total respondents
who own either a Tablet or a Smartphone and have done a mobile
shopping activity in the past 30 days. A “Mobile Shopper” is defined as
someone who has done a mobile shopping activity on a Smartphone or
Tablet in the past 30 days. The respondents completed an online,
self-administered survey in September 2013
NIELSEN TV BRAND EFFECT PROGRAM ENGAGEMENT STUDY Program engagement and ad recall was determined by surveying the
Nielsen TV Brand Effect panel the day after they saw the program & ad.
Then logistic models were created to isolate the effects of ad, show and
placement factors (such as ad quality, age of ad, time of day, or genre
of show), along with program engagement itself and five cross effects
between program engagement and other factors. We then removed the
modeled influence of all the non-engagement factors from the ad recall
to measure the linear program engagement effect. Program Engagement
is defined as the percentage of viewers who can recall within 24 hours
the network content they were exposed to during the normal course of
viewing TV.
NIELSEN AD*VIEWSNielsen Ad*Views is a reporting tool that measures US advertising data
for TV, newspapers, magazines, radio, outdoor, cinema, FSI coupon and
Internet display advertising.
NIELSEN CROSS-PLATFORM CAMPAIGN RATINGSThe TV/online reach data came from an analysis of 200 Nielsen
Cross-Platform Campaign Ratings-measured campaigns. This included
all types of online advertising, including video and display.
27ADVERTISING & AUDIENCES REPORT Copyright © 2014 The Nielsen Company
ABOUT NIELSEN Nielsen Holdings N.V. (NYSE: NLSN) is a global information and
measurement company with leading market positions in marketing
and consumer information, television and other media measurement,
online intelligence and mobile measurement. Nielsen has a presence in
approximately 100 countries, with headquarters in New York, USA and
Diemen, the Netherlands.
For more information, visit www.nielsen.com
Copyright © 2014 The Nielsen Company. All rights reserved. Nielsen and
the Nielsen logo are trademarks or registered trademarks of CZT/ACN
Trademarks, L.L.C. Other product and service names are trademarks or
registered trademarks of their respective companies. 14/7607

28 ADVERTISING & AUDIENCES REPORT