adverse scenario for the european insurance and
TRANSCRIPT

|1
Adverse scenario for the European Insurance and
Occupational Pensions Authority’s EU-wide pension fund stress test and for the European Securities and Markets
Authority’s money market fund stress-testing guidelines in 2019
Introduction The European Supervisory Authorities, in cooperation with the European Systemic Risk Board (ESRB), are requested by legislation to use stress tests in order to assess the resilience of financial institutions or market participants to adverse market developments. As part of this cooperation, the ESRB designs scenarios of adverse economic and financial market developments.
The ESRB was asked to provide adverse financial market scenarios for the stress-testing exercises planned by the European Insurance and Occupational Pensions Authority (EIOPA) and the European Securities and Markets Authority (ESMA). Specifically, EIOPA will be undertaking its third stress test for institutions for occupational retirement provision (IORP), while ESMA is developing guidelines for managers of money market funds (MMF) who are required to conduct internal stress tests and report the results to national competent authorities and ESMA.1
The European Central Bank, in collaboration with the ESRB, EIOPA and ESMA, has developed the narrative and has calibrated the adverse scenario for both exercises described in this document,2 which has been approved by the ESRB General Board and transmitted to EIOPA and ESMA.
Designing a single scenario increases the coherence between the stress-testing exercises, allowing for an appropriate response from the institutions and companies included in the scope of the exercises. The risk factors to be considered in this scenario differ between the stress-testing exercises:
• ESMA’s stress-testing guidelines focus on short maturities (between one month and two years), while the EIOPA stress test focuses on long maturities (e.g., five years);
• despite the importance of interest rates for both exercises, the MMF exercise also considers asset liquidity and the IORP exercise also considers equity prices, residential real estate prices and inflation swap rates;
1 Article 28 of the MMF Regulation provides that ESMA shall develop guidelines that establish common reference parameters of the stress test scenarios to be included in the stress tests that managers of MMFs are required to conduct. 2 The scenario presented in this document is not a forecast. It should not be interpreted as either the ESRB’s expectations about future economic and financial developments or any unintended consequences of future monetary policy decisions. It constitutes a severe yet plausible scenario that could arise if a risk environment such as the one explained in the note were to materialise.
21 March 2019 ECB-PUBLIC

|2
The list of risk factors to be considered in each exercise can be found in Annex B.
This document presents the main sources of risk that lead to the adverse scenario and the key features that EIOPA and ESMA consider relevant to the IORP and MMF sectors. The calibration of the scenario has benefited from guidance from EIOPA and ESMA, and from discussions with ESRB member institutions. The methodology underlying the calibration of the financial shocks is based on the same models used in previous stress tests.3 The shocks reported should be interpreted as one-off, instantaneous and permanent shifts in asset prices relative to their end-2018 levels.4
Assumptions about long-term risk premia, which are needed for other components of EIOPA’s stress test, are developed by EIOPA and are not presented in this document. Likewise, assumptions on redemptions which are needed for ESMA’s MMF stress test are developed by ESMA and presented in the separate methodological document. In addition, guidance on applying the scenario is provided by EIOPA and ESMA and is not covered here.
Systemic risks and vulnerabilities addressed by the scenario The scenario reflects the ESRB’s assessment of prevailing sources of systemic risk for the EU financial system:
1. repricing of risk premia in global financial markets; 2. persistent weaknesses in balance sheets of EU banks, insurers and pension schemes; 3. debt sustainability challenges in EU sovereign, corporate and household sectors; 4. vulnerabilities in the EU shadow banking sector and contagion to the financial system.
Narrative and calibration of the scenario The methodology for the scenario calibration is based on a non-parametric application of a multivariate copula model.5 The scenario is the outcome of several simulations based on different triggers that reflect the main sources of financial stability risks, with a special focus on the repricing of some types of assets: swap rates (in the EU, the United States and emerging market economies), government credit spreads and equity prices in the EU and other advanced economies, and bid-ask spreads on government bonds. The calibration sample and probability of the triggering events have been chosen to reflect the main features of the scenario in the calibration and were motivated by the narrative developed jointly with
3 See, for example: https://eiopa.europa.eu/Pages/Financial-stability-and-crisis-prevention/Occupational-Pensions-Stress-Test-2017-
.aspx. 4 For this reason, the severity of the scenario designed for EIOPA and ESMA cannot be directly compared with that of the European Banking Authority (EBA), because in the EBA scenario, the overall impact depends on the accumulation of shocks occurring over three years. In addition, the narrative of the scenario differs from that of the EBA as it is more focused on risk factors linked to the IORP and MMF sectors, even though they are based on the same overall risk assessment process. 5 See the methodological note describing the Financial Shock Simulator.

|3
EIOPA and ESMA. More precisely, the sample chosen for the calibration spans from January 20046 to December 2018 and the probability of the shocks to the triggering variables is below 1% over the horizon of one quarter.
The scenario is assumed to be initiated by an abrupt reversal in global risk premia, which is deemed the most relevant financial stability risk. While the shocks to interest rates are higher on short maturities owing to greater uncertainty and risks to growth caused by political tensions, concerns in the euro area (EA) about growth in the long term (for demographic reasons, for example) would result in lower shocks for long-term maturities. The swap rate curve would shift upwards by 80 basis points in the EA for the one-year maturity and by more than 140 basis points in other major advanced economies (see Charts 1 and 2). The swap rate curve would shift upwards by 25 basis points in the EA for the ten-year maturity and by more than 40 basis points in other major advanced economies (see Charts 1 and 2).
Chart 1: Shock to swap rates (basis points) Chart 2: Distribution of swap rate shocks across different maturities (basis points)
The overall repricing of risk premia would raise concerns about the debt sustainability of some EU Member States, leading to a widening of yield spreads between those government bonds and the equivalent German bonds. On average, ten-year government bond yields in the EU would increase by about 110 basis points, with a range between 29 basis points and 347 basis points under the adverse scenario (see Chart 3). The variance across EU countries is lower on one-year government bond yields, where shocks range from 60 basis points to 213 basis points. Overall, one-year government bond yields in the EU would increase by 130 basis points on average (see Chart 4). Other advanced economies experience a shock of over 155 basis points for one-year government bond yields and of around 143 basis points for ten-year government bond yields (see Chart 5). Government bond yields respond both to the increase in risk-free rates and to the widening of the spreads owing to concerns about debt sustainability. For this reason the distribution of the shocks to government bond yields is bi-modal. 6 The model uses daily data and the majority of time series have sufficient data as of 2004.
0
50
100
150
200
250
300
350
EA UK US EME (LatinAmerica)
EME (Asian)
3M 1Y 10Y
1030507090
110130150170
1M 3M 6M 1Y 2Y 3Y 5Y 7Y 10Y 20Y 30Y
EUR GBP USD

|4
Chart 3: Distribution of shocks to ten-year government bond yields in EU (basis points)
Chart 4: Distribution of shocks to one-year government bond yields in EU (basis points)
Chart 5: Shocks to government bond yields across countries (basis points)
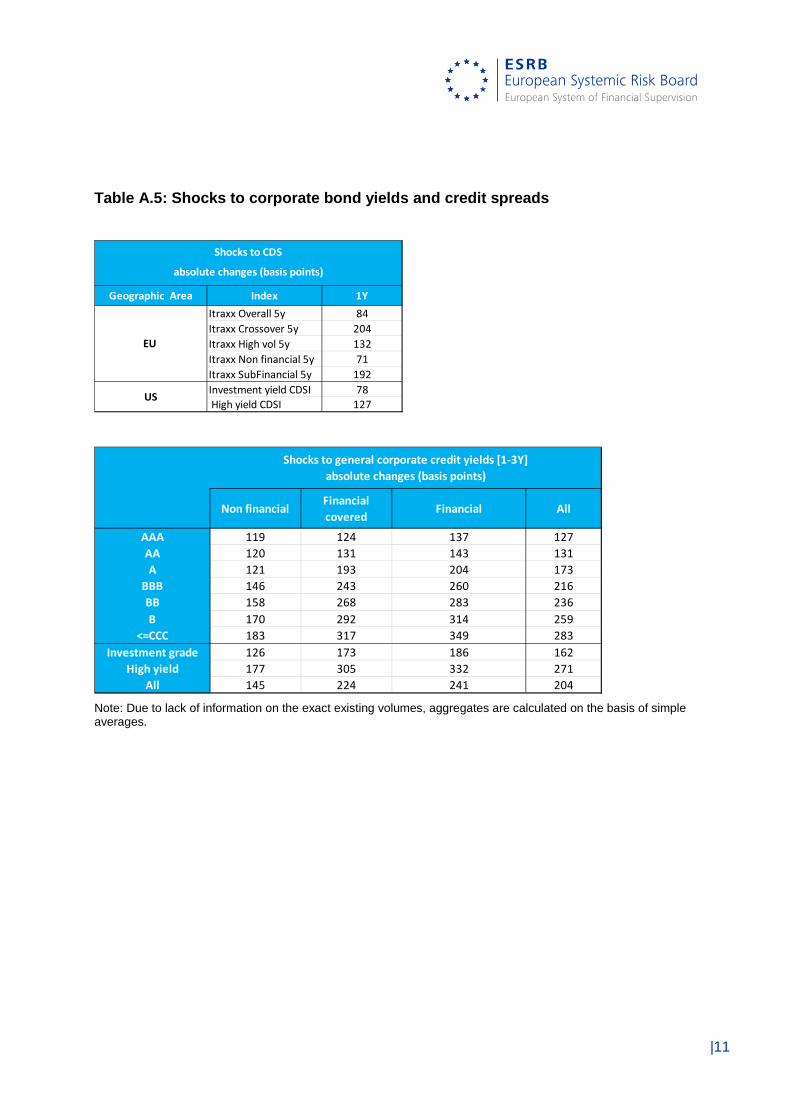
In addition, yields on non-financial corporate and bank debt would increase, following the generalised increase in risk premia (see Chart 6). In the banking sector, shocks to credit spreads would be aggravated by fundamental concerns about prospective mark-to-market losses on fixed-income assets, bringing about an increase of more than 340 basis points for lower-rated financial corporations. AAA-rated non-financial corporate bond yields would also increase by about 120 basis points in the EU, but the impact on credit spreads would be more pronounced for lower-rated issuers, reaching 180 basis points for CCC-rated non-financial corporate bonds.
144.00 194.00 244.00 294.00 344.00 394.00
0
0.2
0.4
0.6
0.8
1
1.2
0123456789
Num
ber o
f cou
ntrie
s
Mean EU
144.00 194.00 244.00 294.00 344.00 394.00
0
0.2
0.4
0.6
0.8
1
1.2
0123456789
Num
ber o
f cou
ntrie
s
Mean EU
050
100150200250300350400450
EA UK US EME
3M 1Y 10Y

|5
Chart 6: Shocks to corporate bond yields in EU (basis points)
The repricing of risk premia would also bring about a substantial drop in equity prices, amplified by a general sell-off of equities by the non-banking sector. Overall, equity prices in the EU would decline by about 39% (see Chart 7). Residential and commercial real estate prices would also decline significantly, by 20% and 31%, respectively, with respect to the baseline at EU level (see Chart 8).
Chart 7: Shocks to equity prices (%)
0
50
100
150
200
250
300
350
400
AAA AA A BBB BB B CCC
Non financial
Financial covered
Financial
-50
-45
-40
-35
-30
-25
-20
-15
-10
-5
0
US
EME
IT ES SK PL LV NL
FR EA PT EU DE BG RO SE SI AT BE CY FI UK
DK CH LT IE LU CZ NO
HR GR
EE HU JP MT

|6
Chart 8: Shocks to residential real estate prices and commercial real estate prices (%)
The value of investments in private equity and hedge funds would fall by between 32% and 50% (see Chart 9). Commodity prices would also decline significantly, between 28% and 47%.
Chart 9: Shocks to other equities (%) Chart 10: Shocks to commodity prices (%)
-50
-45
-40
-35
-30
-25
-20
-15
-10
-5
0BE BG CZ DK DE EE IE GR ES FR HR IT CY LV LT LU HU MT NL AT PL PT RO SI SK FI SE UK EA EU NO IS LI EEA
Residential Commercial
-60
-50
-40
-30
-20
-10
0EU World
Private Equity Hedge Funds
-50-45-40-35-30-25-20-15-10
-50
Gold Commodity global Silver

|7
Annex A Table A.1: Shocks to swap rates
Note: The grey cells show cases in which data are not available.
Geographic Area Country Description 1M 3M 6M 1Y 2Y 3Y 5Y 7Y 10Y 20Y 30YEU Euro area Interest rate swap on the EUR (euro) 53 53 60 80 71 62 45 37 25 20 15EU Bulgaria Interest rate swap on the BGN (Bulgarian lev)EU Croatia Interest rate swap on the HRK (Croatian kuna) 53 53 60 80 71 62 45 37 25 20 15EU Czech Republic Interest rate swap on the CZK (Czech koruna) -4 -4 -4 -5 3 10 26 27 29 27EU Denmark Interest rate swap on the DKK (Danish krone) 53 53 60 80 71 62 45 37 25 20 15EU Hungary Interest rate swap on the HUF (Hungarian forint) 74 74 83 111 119 127 144 141 136 131EU Poland Interest rate swap on the PLN (Polish zloty) 25 25 28 37 53 69 101 98 94 88EU Romania Interest rate swap on the RON (Romanian leu) 153 153 172 229 217 205 180 123 38EU Sweden Interest rate swap on the SEK (Swedish krona) 26 26 30 40 55 70 101 88 68 44EU United Kingdom Interest rate swap on the GBP (British pound) 98 98 110 146 130 115 83 68 46 37 28Rest of Europe Iceland Interest rate swap on the ISK (Icelandic króna)Rest of Europe Norway Interest rate swap on the NOK (Norwegian krone) 20 20 22 30 39 47 65 56 42 45Rest of Europe Russia Interest rate swap on the RUB (Russian ruble) 122 122 137 183 184 185 187 181 173 136Rest of Europe Switzerland Interest rate swap on the CHF (Swiss franc) 31 31 35 46 54 61 76 68 56 34 31Rest of Europe Turkey Interest rate swap on the TRY (Turkish lira) 197 197 221 295 307 320 345 332 314North America Canada Interest rate swap on the CAD (Canadian dollar) 46 46 51 68 70 72 76 67 55 46North America United States Interest rate swap on the USD (US dollar) 93 93 105 140 125 109 79 65 44 35 26Australia and Pacific Australia Interest rate swap on the AUD (Australian dollar) 33 33 37 50 62 74 98 93 85 80Australia and Pacific New Zealand Interest rate swap on the NZD (New Zealand dollar)South and Central America Brazil Interest rate swap on the BRL (Brazilian real)South and Central America Chile Interest rate swap on the CLP (Chilean peso) 206 206 232 309 376 444 578 463 291 266South and Central America Colombia Interest rate swap on the COP (Colombian peso) 162 162 183 243 276 308 373 330 264 495South and Central America Mexico Interest rate swap on the MXN (Mexican peso) 245 245 276 368 360 352 337 366 411Asia China Interest rate swap on the CNY (Chinese yuan) 13 13 14 19 17 15 11 18 28Asia Hong Kong Interest rate swap on the HKD (Hong Kong dollar) 208 208 235 313 320 327 341 325 300Asia India Interest rate swap on the INR (Indian rupee) 263 263 296 395 394 392 389 367 336Asia Japan Interest rate swap on the JPY (Japanese yen) 9 9 10 14 19 25 35 36 36 27Asia Korea Interest rate swap on the KRW (South Korean won) 134 134 150 200 209 217 234 243 255 257Asia Malaysia Interest rate swap on the MYR (Malaysian ringgit) 90 90 101 134 153 173 211 227 251 283Asia Singapore Interest rate swap on the SGD (Singapore dollar) 116 116 130 173 176 179 185 191 199 221Asia Thailand Interest rate swap on the THB (Thai baht) 164 164 184 245 257 269 292 299 310 263Africa South Africa Interest rate swap on the ZAR (South African rand) 10 10 11 14 25 36 57 59 62 64
Shocks to interest rate yieldsabsolute changes (basis points)

|8
Table A.2: Shocks to government bond yields
Note: The weighted averages are based on real GDP and some missing values have been interpolated.
Geographic Area Country 3M 6M 1Y 2Y 3Y 5Y 7Y 10Y 20YEU Austria 65 73 96 91 86 77 73 67 49
EU Belgium 64 72 94 93 93 92 87 81 64EU Bulgaria 62 69 90 89 88 86 90 96 74EU Croatia 56 63 82 75 68 55 47 35 27EU Cyprus 102 115 151 130 109 66 76 91 70EU Czech Republic 113 127 167 160 152 136 123 103 79EU Denmark 66 73 96 88 79 63 52 36 23EU Finland 61 68 89 84 79 69 63 54 42EU France 66 74 96 94 91 86 81 75 59EU Germany 58 65 85 76 67 50 42 30 20EU Greece 120 135 178 185 192 207 202 195 161EU Hungary 143 160 212 240 268 323 333 347 266EU Ireland 109 122 161 155 150 139 133 123 94EU Italy 111 125 165 173 182 200 189 173 163EU Latvia 56 63 82 90 97 112 89 55 42EU Lithuania 62 69 91 95 99 107 96 80 61EU Luxembourg 41 46 60 60 59 58 55 49 38EU Malta 77 86 113 112 112 110 106 101 77EU Netherlands 63 70 92 86 81 70 64 54 34EU Poland 110 123 162 174 187 211 220 233 28EU Portugal 76 85 111 137 163 216 211 205 82EU Romania 76 85 112 119 126 140 115 79 60EU Slovakia 75 83 109 105 100 90 90 89 45EU Slovenia 89 99 130 129 128 127 117 102 78EU Spain 118 132 175 184 193 210 204 193 171EU Sweden 68 76 100 92 84 68 62 54 41EU United Kingdom 135 152 201 210 218 220 192 165 135EA (weighted averages) EA (weighted averages) 78 87 114 113 112 110 103 93 76EU (weighted averages) EU (weighted averages) 89 100 131 132 133 132 122 109 84Advanced economies Switzerland 26 30 41 49 56 71 63 51 29Advanced economies Norway 15 17 25 34 42 60 51 37 28Advanced economies Iceland 26 30 41 49 56 71 63 51 29Advanced economies Liechtenstein 26 30 41 49 56 71 63 51 29EEA (weighted averages) EEA (weighted averages) 86 96 127 128 129 129 119 106 82Advanced economies United States 137 153 201 200 198 196 184 165 132Advanced economies Japan 94 106 141 160 180 219 206 186 120Advanced economies Advanced economies non EU and non US 81 91 122 137 152 182 181 180 128Advanced economies Advanced economies (weighted average) 105 118 155 158 161 165 156 143 110Emerging markets Emerging markets 281 316 421 424 427 433 416 390 211World World 193 217 288 291 294 299 286 266 161
Shocks to government bond yieldsabsolute changes (basis points)

|9
Table A.3: Shocks to equity prices
Note: The weighted averages are based on real GDP.
Geographic Area Country Shock
EU Austria -36EU Belgium -34EU Bulgaria -37EU Cyprus -34EU Croatia -29EU Czech Republic -29EU Denmark -33EU Estonia -26EU Finland -33EU France -40EU Germany -37EU Greece -27EU Hungary -25EU Ireland -30EU Italy -45EU Latvia -40EU Lithuania -32EU Luxembourg -30EU Malta -21EU Netherlands -40EU Poland -41EU Portugal -38EU Romania -37EU Slovakia -41EU Slovenia -36EU Spain -42EU Sweden -36EU United Kingdom -33EA (weighted averages) EA (weighted averages) -39EU (weighted averages) EU (weighted averages) -38Advanced economies Switzerland -32Advanced economies Norway -29Advanced economies United States -47Advanced economies Japan -21Advanced economies Advanced economies non EU and non US -24Advanced economies Advanced economies (weighted average) -39Emerging markets Emerging markets -46
Shocks to equity prices relative changes (%)

|10
Table A.4: Shocks to residential and commercial real estate prices
Note: The weighted averages are based on real GDP.
Geographic Area Residential CommercialEU Austria -25 -35EU Belgium -14 -27EU Bulgaria -26 -35EU Croatia -15 -29EU Cyprus -15 -28EU Czech Republic -35 -42EU Denmark -18 -29EU Estonia -25 -35EU Finland -12 -27EU France -17 -30EU Germany -20 -31EU Greece -6 -23EU Hungary -42 -45EU Ireland -28 -36EU Italy -11 -27EU Latvia -23 -33EU Lithuania -24 -33EU Luxembourg -25 -35EU Malta -21 -32EU Netherlands -25 -35EU Poland -14 -28EU Portugal -22 -32EU Romania -21 -31EU Slovakia -19 -31EU Slovenia -23 -33EU Spain -24 -34EU Sweden -27 -35EU United Kingdom -20 -24EA (weighted averages) EA (weighted averages) -19 -30EU (weighted averages) EU (weighted averages) -20 -30Advanced economies Switzerland -21 -32Advanced economies Norway -30 -45Advanced economies Iceland -20 -30Advanced economies Liechtenstein -21 -32EEA (weighted averages) EEA (weighted averages) -20 -30
Shocks to real estate prices relative changes (%)
|11
Table A.5: Shocks to corporate bond yields and credit spreads
Note: Due to lack of information on the exact existing volumes, aggregates are calculated on the basis of simple averages.
Geographic Area Index 1YItraxx Overall 5y 84Itraxx Crossover 5y 204Itraxx High vol 5y 132Itraxx Non financial 5y 71Itraxx SubFinancial 5y 192Investment yield CDSI 78 High yield CDSI 127
EU
US
Shocks to CDS
absolute changes (basis points)
Non financialFinancial covered
Financial All
AAA 119 124 137 127AA 120 131 143 131A 121 193 204 173
BBB 146 243 260 216BB 158 268 283 236B 170 292 314 259
<=CCC 183 317 349 283Investment grade 126 173 186 162
High yield 177 305 332 271All 145 224 241 204
Shocks to general corporate credit yields [1-3Y]absolute changes (basis points)

|12
Table A.6: Shocks to Residential Mortgage-Backed Securities yields
Note: Due to lack of information on the exact existing volumes, aggregates are calculated on the basis of simple averages. Table A.7: Shocks to other assets
Table A.8: Shocks to inflation swap rates
Geographic Area AAA AA A BBB AllEU 156 176 196 240 192North America 168 192 216 269 211Asia 143 160 176 212 173All 156 176 196 240 192
absolute changes (bps)
Shocks to RMBS
EU -35World -32EU -50World -32EU -38Other -30US -35Gold -28Commodity global -47Silver -43
Commodities
Shocks to other equity prices relative changes (%)
Private Equity
Hedge Funds
REIT
EA US1Y 101 1992Y 58 643Y 44 445Y 37 347Y 32 2910Y 23 2420Y 17 1530Y 18 13
Shocks to inflation swap rate yieldsabsolute changes (basis points)

|13
Table A.9: Shocks to exchange rates [To be published when ESMA publishes its MMF stress-testing guidelines under Article 28 of the MMF Regulation]

|14
Table A.10: Shocks to bid-ask spreads on government bonds [To be published when ESMA publishes its MMF stress-testing guidelines under Article 28 of the MMF Regulation]

|15
Annex B: List of risk factors
Table B.1 List of risk factors to be considered for the ESMA MMF stress-testing guidelines
Swaps Countries Euro area EU countries Rest of Europe US North America Australia and Pacific
South and Central America Asia Africa
Maturities 1M 3M 6M 1Y 2Y
Government bonds Countries Euro area countries EU countries EEA countries
US Japan Other advanced economies
Emerging markets Maturities 3M 6M 1Y 2Y
FX shocks Countries Euro area EU countries Rest of Europe US North America Australia and Pacific
South and Central America Asia Africa
Bid-ask spreads
Countries EU countries Maturities 3M 6M 1Y 2Y
Credit spreads Credit spread indices Itraxx Overall Itraxx crossover Itraxx high vol Itraxx non financial Itraxx sub financial Investment yield CDSI High yield CDSI
Maturities 1Y
Corporate yields Sector Non-financial Financial covered Financial Rating AAA AA BBB BB B CCC

|16
Table B.2 List of risk factors to be considered for the EIOPA IORP stress test Interest rate swaps
Countries: Euro area Maturities: 1Y 2Y 3Y 5Y 7Y 10Y
Inflation swaps Countries Euro area countries Maturities 1Y 2Y 3Y 5Y 7Y 10Y
Government bonds Countries Austria Belgium Bulgaria Cyprus Czech Republic Germany Denmark Spain Finland France Greece Croatia Hungary Ireland Iceland Italy Liechtenstein Lithuania Luxembourg Latvia Malta Netherlands Norway Poland Portugal Romania Sweden
Slovenia Slovakia United Kingdom
United States Other advanced countries
Total advanced countries
Euro area average Europe average Emerging markets
World Maturities 2Y 5Y 10Y
Corporate bonds Sector Non-financial Financial covered Financial Rating AAA AA A BBB BB B
CCC Lower grade Investment
grade High yield All Residential mortgage-backed securities Countries EU countries US Other Real estate investment trust Countries EU countries US Other Equity (listed)
Countries Developed markets (EU, US, other developed)
Emerging markets

|17
Alternative investment Countries Private equity (unlisted) Commodities Hedge funds
Real estate Countries EEA countries