advantech co., ltd. · advantech co., ltd. opinion we have audited the accompanying financial...
TRANSCRIPT

Advantech Co., Ltd. Financial Statements for the Years Ended December 31, 2016 and 2015 and Independent Auditors’ Report

- 1 -
INDEPENDENT AUDITORS’ REPORT
The Board of Directors and the Shareholders
Advantech Co., Ltd.
Opinion
We have audited the accompanying financial statements of Advantech Co., Ltd. (the “Company”),
which comprise the balance sheets as of December 31, 2016 and 2015, and the statements of
comprehensive income, changes in equity and cash flows for the years then ended, and the notes to
the financial statements, including a summary of significant accounting policies.
In our opinion, the accompanying financial statements present fairly, in all material respects, the
financial position of the Company as of December 31, 2016 and 2015, and its financial
performance and its cash flows for the years then ended in accordance with the Regulations
Governing the Preparation of Financial Reports by Securities Issuers.
Basis for Opinion
We conducted our audits in accordance with the Regulations Governing Auditing and Attestation
of Financial Statements by Certified Public Accountants and auditing standards generally accepted
in the Republic of China. Our responsibilities under those standards are further described in the
Auditors’ Responsibilities for the Audit of the Financial Statements section of our report. We are
independent of the Company in accordance with The Norm of Professional Ethics for Certified
Public Accountant of the Republic of China, and we have fulfilled our other ethical responsibilities
in accordance with these requirements. We believe that the audit evidence we have obtained is
sufficient and appropriate to provide a basis for our opinion.
Key Audit Matters
Key audit matters are those matters that, in our professional judgment, were of most significance in
our audit of the financial statements for the year ended December 31, 2016. These matters were
addressed in the context of our audit of the financial statements as a whole, and in forming our
opinion thereon, and we do not provide a separate opinion on these matters.
Key audit matters on the financial statements for the year ended December 31, 2016 were as
follows:
Investments accounted for using the equity method
The Company and its subsidiaries acquired 100% share of B+B SmartWorx, Inc. (B+B) for
NT$3,296,048 thousand in January 4, 2016 and recognized the acquisition as investment accounted
for using the equity method.
- 2 -
The evaluation on fair value of the assets, liabilities, and amount of goodwill as of the date of
acquisition was based on the specialists’ Purchase Price Allocation Report that involved several
financial assumptions and inputs. The judgment of related accounting estimates will affect the
presentation of accounts on the financial statements. After considering that the acquisition was a
significant event and was transacted during the period of financial statements with a material
impact on the financial statements, accuracy of merger transaction of B+B conducted by the
Company was deemed to be a key audit matter.
Our key audit procedures performed in respect of the assets and liabilities as of the date of
acquisition included the following:
1. Tested the acquisition balance sheet prepared by the management and checked the record by
matching against the fair value of the assets and liabilities as of the date of acquisition.
2. Recalculated the value of goodwill recognized in the acquisition balance sheet.
Impairment assessment of investments accounted for using the equity method
The excess of cost of acquisition of investments accounted for using the equity method over the fair
value of investees’ identifiable assets and liability as of the dates of acquisition should be
recognized as goodwill. If there is any indication that goodwill is impaired, the management
should assess if the carrying amount of goodwill is impaired. We have expressed our concerns on
the related risks of impairment assessment on goodwill arising from acquisition of B+B since the
impairment assessment of goodwill is based on the management’s significant judgment that
involved assumptions of the future profitability and costs of equity and debts; the impairment of
goodwill is hence recognized as a critical accounting estimate in Note 5 to the financial statements.
Our key audit procedures performed in respect of the above area included the following:
When evaluating the impairment assessment, we tested the management’s assumptions and inputs
used for testing the impairment for goodwill, including cash flow projections and discount rates.
Responsibilities of Management and Those Charged with Governance for the Financial
Statements
Management is responsible for the preparation and fair presentation of the financial statements in
accordance with the Regulations Governing the Preparation of Financial Reports by Securities
Issuers and for such internal control as management determines is necessary to enable the
preparation of financial statements that are free from material misstatement, whether due to fraud
or error.
In preparing the financial statements, management is responsible for assessing the Company’s
ability to continue as a going concern, disclosing, as applicable, matters related to going concern
and using the going concern basis of accounting unless management either intends to liquidate the
Company or to cease operations, or has no realistic alternative but to do so.
Those charged with governance, including supervisors, are responsible for overseeing the
Company’s financial reporting process.
- 3 -
Auditors’ Responsibilities for the Audit of the Financial Statements
Our objectives are to obtain reasonable assurance about whether the financial statements as a whole
are free from material misstatement, whether due to fraud or error, and to issue an auditors’ report
that includes our opinion. Reasonable assurance is a high level of assurance, but is not a
guarantee that an audit conducted in accordance with auditing standards generally accepted in the
Republic of China will always detect a material misstatement when it exists. Misstatements can
arise from fraud or error and are considered material if, individually or in the aggregate, they could
reasonably be expected to influence the economic decisions of users taken on the basis of these
financial statements.
As part of an audit in accordance with auditing standards generally accepted in the Republic of
China, we exercise professional judgment and maintain professional skepticism throughout the
audit. We also:
1. Identify and assess the risks of material misstatement of the financial statements, whether due
to fraud or error, design and perform audit procedures responsive to those risks, and obtain
audit evidence that is sufficient and appropriate to provide a basis for our opinion. The risk
of not detecting a material misstatement resulting from fraud is higher than for one resulting
from error, as fraud may involve collusion, forgery, intentional omissions, misrepresentations,
or the override of internal control.
2. Obtain an understanding of internal control relevant to the audit in order to design audit
procedures that are appropriate in the circumstances, but not for the purpose of expressing an
opinion on the effectiveness of the Company's internal control.
3. Evaluate the appropriateness of accounting policies used and the reasonableness of accounting
estimates and related disclosures made by management.
4. Conclude on the appropriateness of management’s use of the going concern basis of
accounting and, based on the audit evidence obtained, whether a material uncertainty exists
related to events or conditions that may cast significant doubt on the Company’s ability to
continue as a going concern. If we conclude that a material uncertainty exists, we are
required to draw attention in our auditors’ report to the related disclosures in the financial
statements or, if such disclosures are inadequate, to modify our opinion. Our conclusions are
based on the audit evidence obtained up to the date of our auditors’ report. However, future
events or conditions may cause the Company to cease to continue as a going concern.
5. Evaluate the overall presentation, structure and content of the financial statements, including
the disclosures, and whether the financial statements represent the underlying transactions and
events in a manner that achieves fair presentation.
6. Obtain sufficient and appropriate audit evidence regarding the financial information of entities
or business activities within the Company to express an opinion on the financial statements.
We are responsible for the direction, supervision and performance of the audit. We remain
solely responsible for our audit opinion.
We communicate with those charged with governance regarding, among other matters, the planned
scope and timing of the audit and significant audit findings, including any significant deficiencies
in internal control that we identify during our audit.
We also provide those charged with governance with a statement that we have complied with
relevant ethical requirements regarding independence, and to communicate with them all
relationships and other matters that may reasonably be thought to bear on our independence, and
where applicable, related safeguards.

- 4 -
From the matters communicated with those charged with governance, we determine those matters
that were of most significance in the audit of the financial statements for the year ended December
31, 2016 and are therefore the key audit matters. We describe these matters in our auditors’ report
unless law or regulation precludes public disclosure about the matter or when, in extremely rare
circumstances, we determine that a matter should not be communicated in our report because the
adverse consequences of doing so would reasonably be expected to outweigh the public interest
benefits of such communication.
The engagement partners on the audit resulting in this independent auditors’ report are Meng-Chieh
Chiu and Chin-Hsiang Chen.
Deloitte & Touche
Taipei, Taiwan
Republic of China
March 6, 2017
Notice to Readers
The accompanying financial statements are intended only to present the financial position,
financial performance and cash flows in accordance with accounting principles and practices
generally accepted in the Republic of China and not those of any other jurisdictions. The
standards, procedures and practices to audit such financial statements are those generally applied
in the Republic of China.
For the convenience of readers, the independent auditors’ report and the accompanying financial
statements have been translated into English from the original Chinese version prepared and used
in the Republic of China. If there is any conflict between the English version and the original
Chinese version or any difference in the interpretation of the two versions, the Chinese-language
independent auditors’ report and financial statements shall prevail.

- 5 -
ADVANTECH CO., LTD.
BALANCE SHEETS
DECEMBER 31, 2016 AND 2015
(In Thousands of New Taiwan Dollars)
2016 2015
ASSETS Amount % Amount %
CURRENT ASSETS
Cash and cash equivalents (Notes 4 and 6) $ 2,008,247 6 $ 815,293 3
Financial assets at fair value through profit or loss - current (Notes 4, 7 and 25) 34,348 - 7,391 -
Available-for-sale financial assets - current (Notes 4, 8 and 25) 700,269 2 - -
Notes receivable (Notes 4, 9 and 26) 67,223 - 55,480 -
Trade receivables (Notes 4 and 9) 1,543,604 5 1,135,240 4
Trade receivables from related parties (Notes 4 and 26) 3,908,448 11 3,977,999 13
Other receivables 105,929 - 113,056 -
Other receivables from related parties (Note 26) 19,002 - 15,596 -
Inventories (Notes 4 and 10) 1,935,873 6 1,673,156 5
Other current assets 38,361 - 60,318 -
Total current assets 10,361,304 30 7,853,529 25
NONCURRENT ASSETS
Available-for-sale financial assets - noncurrent (Notes 4, 8 and 25) 1,694,801 5 1,700,814 6
Investments accounted for using the equity method (Notes 4 and 11) 15,208,839 44 13,138,225 42
Property, plant and equipment (Notes 4 and 12) 6,938,084 20 6,278,109 20
Goodwill (Notes 4 and 13) 111,599 - 111,599 -
Other intangible assets (Note 4) 78,321 - 74,049 -
Deferred tax assets (Notes 4 and 18) 136,130 1 114,710 1
Prepayments for business facilities 22,676 - 15,489 -
Prepayment for investments - - 1,968,044 6
Other noncurrent assets 5,661 - 10,837 -
Total noncurrent assets 24,196,111 70 23,411,876 75
TOTAL $ 34,557,415 100 $ 31,265,405 100
LIABILITIES AND EQUITY
CURRENT LIABILITIES
Financial liabilities at fair value through profit or loss - current (Notes 4, 7 and 25) $ 8,845 - $ 6,352 -
Trade payables 1,550,969 4 899,480 3
Trade payables to related parties (Note 26) 2,610,642 8 2,687,130 9
Other payables (Notes 14 and 17) 2,699,374 8 2,255,915 7
Current tax liabilities (Notes 4 and 18) 1,036,650 3 853,769 3
Short-term warranty provision (Note 4) 49,155 - 41,410 -
Other current liabilities 153,992 - 72,312 -
Total current liabilities 8,109,627 23 6,816,368 22
NONCURRENT LIABILITIES
Deferred tax liabilities (Notes 4 and 18) 988,099 3 927,732 3
Net defined benefit liabilities (Notes 4, 15 and 17) 211,170 1 182,172 -
Other noncurrent liabilities 34,937 - 31,632 -
Total noncurrent liabilities 1,234,206 4 1,141,536 3
Total liabilities 9,343,833 27 7,957,904 25
EQUITY
Share capital
Ordinary shares 6,330,741 18 6,318,531 20
Advance receipts for share capital 100 - - -
Total share capital 6,330,841 18 6,318,531 20
Capital surplus 6,058,884 18 5,587,555 18
Retained earnings
Legal reserve 4,473,276 13 3,962,842 13
Unappropriated earnings 8,435,785 24 7,098,449 23
Total retained earnings 12,909,061 37 11,061,291 36
Other equity
Exchange differences on translating foreign operations (197,633) - 271,859 1
Unrealized gains (losses) on available-for-sale financial assets 112,429 - 68,265 -
Total other equity (85,204) - 340,124 1
Total equity 25,213,582 73 23,307,501 75
TOTAL $ 34,557,415 100 $ 31,265,405 100
The accompanying notes are an integral part of the financial statements.
(With Deloitte & Touche audit report dated March 6, 2017)
- 6 -
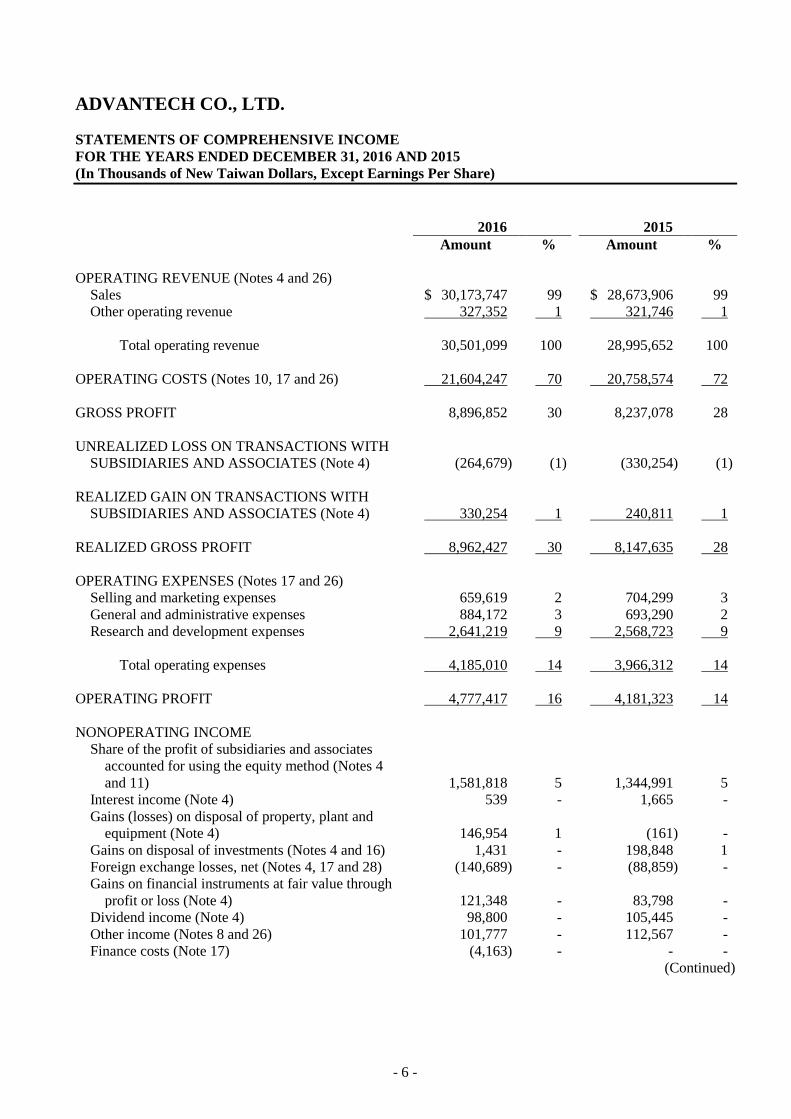
ADVANTECH CO., LTD.
STATEMENTS OF COMPREHENSIVE INCOME
FOR THE YEARS ENDED DECEMBER 31, 2016 AND 2015
(In Thousands of New Taiwan Dollars, Except Earnings Per Share)
2016 2015
Amount % Amount %
OPERATING REVENUE (Notes 4 and 26)
Sales $ 30,173,747 99 $ 28,673,906 99
Other operating revenue 327,352 1 321,746 1
Total operating revenue 30,501,099 100 28,995,652 100
OPERATING COSTS (Notes 10, 17 and 26) 21,604,247 70 20,758,574 72
GROSS PROFIT 8,896,852 30 8,237,078 28
UNREALIZED LOSS ON TRANSACTIONS WITH
SUBSIDIARIES AND ASSOCIATES (Note 4) (264,679) (1) (330,254) (1)
REALIZED GAIN ON TRANSACTIONS WITH
SUBSIDIARIES AND ASSOCIATES (Note 4) 330,254 1 240,811 1
REALIZED GROSS PROFIT 8,962,427 30 8,147,635 28
OPERATING EXPENSES (Notes 17 and 26)
Selling and marketing expenses 659,619 2 704,299 3
General and administrative expenses 884,172 3 693,290 2
Research and development expenses 2,641,219 9 2,568,723 9
Total operating expenses 4,185,010 14 3,966,312 14
OPERATING PROFIT 4,777,417 16 4,181,323 14
NONOPERATING INCOME
Share of the profit of subsidiaries and associates
accounted for using the equity method (Notes 4
and 11) 1,581,818 5 1,344,991 5
Interest income (Note 4) 539 - 1,665 -
Gains (losses) on disposal of property, plant and
equipment (Note 4) 146,954 1 (161) -
Gains on disposal of investments (Notes 4 and 16) 1,431 - 198,848 1
Foreign exchange losses, net (Notes 4, 17 and 28) (140,689) - (88,859) -
Gains on financial instruments at fair value through
profit or loss (Note 4) 121,348 - 83,798 -
Dividend income (Note 4) 98,800 - 105,445 -
Other income (Notes 8 and 26) 101,777 - 112,567 -
Finance costs (Note 17) (4,163) - - -
(Continued)

- 7 -
ADVANTECH CO., LTD.
STATEMENTS OF COMPREHENSIVE INCOME
FOR THE YEARS ENDED DECEMBER 31, 2016 AND 2015
(In Thousands of New Taiwan Dollars, Except Earnings Per Share)
2016 2015
Amount % Amount %
Losses on financial instruments at fair value through
profit or loss (Note 4) $ (41,381) - $ (67,063) -
Other losses (155) - (53) -
Total nonoperating income 1,866,279 6 1,691,178 6
PROFIT BEFORE INCOME TAX 6,643,696 22 5,872,501 20
INCOME TAX EXPENSE (Notes 4 and 18) 976,834 3 768,155 2
NET PROFIT FOR THE YEAR 5,666,862 19 5,104,346 18
OTHER COMPREHENSIVE INCOME
Items that will not be reclassified subsequently to
profit or loss:
Remeasurement of defined benefit plans (Note 15) (31,039) - (18,736) -
Share of the other comprehensive loss of
subsidiaries and associates accounted for using
the equity method (Note 11) 1,479 - (2,683) -
Income tax relating to items that will not be
reclassified subsequently to profit or loss
(Note 18) 5,277 - 3,185 -
(24,283) - (18,234) -
Items that may be reclassified subsequently to profit
or loss:
Exchange differences on translating foreign
operations (Notes 4 and 16) (561,518) (2) (82,566) -
Unrealized gains (losses) on available-for-sale
financial assets (Notes 4 and 16) (5,765) - (557,594) (2)
Share of other comprehensive income (loss) of
subsidiaries and associates accounted for using
the equity method (Notes 4, 11 and 16) 45,794 - 65,031 -
Income tax relating to item that may be
reclassified subsequently to profit or loss
(Notes 4, 16 and 18) 96,161 - 13,620 -
(425,328) (2) (561,509) (2)
Other comprehensive income (loss) for the year,
net of income tax (449,611) (2) (579,743) (2)
TOTAL COMPREHENSIVE INCOME FOR THE
YEAR $ 5,217,251 17 $ 4,524,603 16
(Continued)

- 8 -
ADVANTECH CO., LTD.
STATEMENTS OF COMPREHENSIVE INCOME
FOR THE YEARS ENDED DECEMBER 31, 2016 AND 2015
(In Thousands of New Taiwan Dollars, Except Earnings Per Share)
2016 2015
Amount % Amount %
EARNINGS PER SHARE (Note 19)
Basic $8.96 $8.08
Diluted $8.90 $8.05
The accompanying notes are an integral part of the financial statements.
(With Deloitte & Touche audit report dated March 6, 2017) (Concluded)
- 9 -
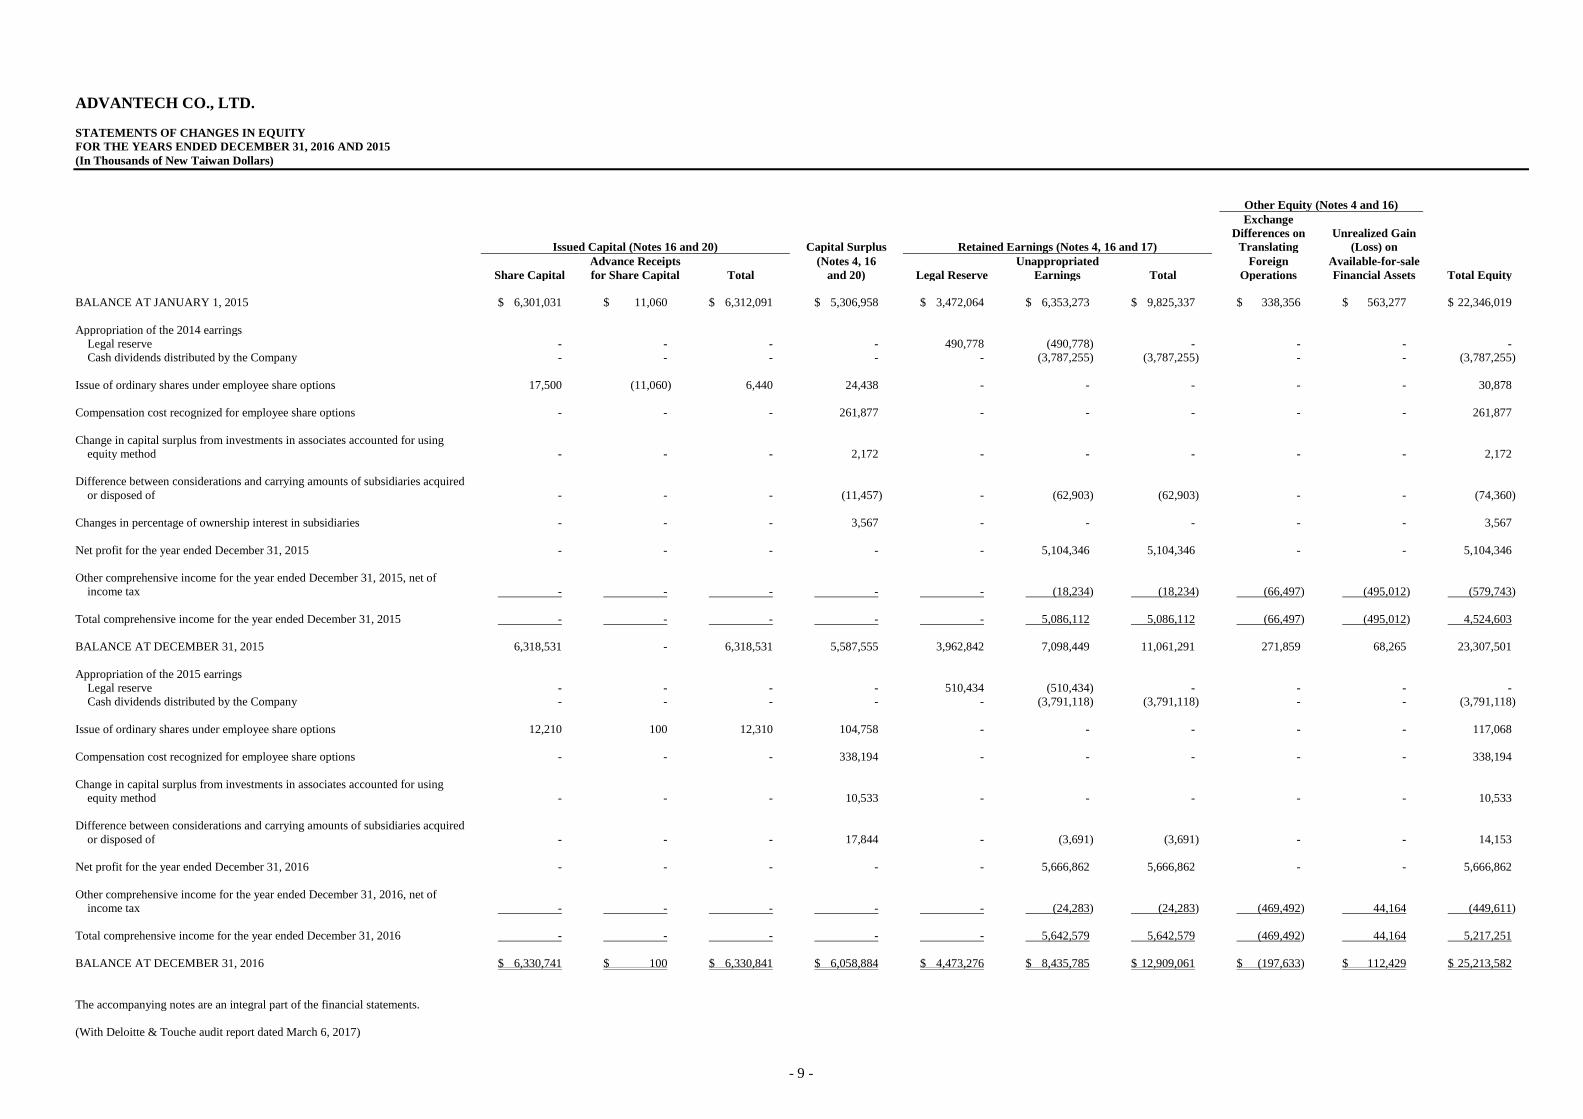
ADVANTECH CO., LTD.
STATEMENTS OF CHANGES IN EQUITY
FOR THE YEARS ENDED DECEMBER 31, 2016 AND 2015
(In Thousands of New Taiwan Dollars)
Other Equity (Notes 4 and 16)
Exchange
Differences on Unrealized Gain
Issued Capital (Notes 16 and 20) Capital Surplus Retained Earnings (Notes 4, 16 and 17) Translating (Loss) on
Advance Receipts (Notes 4, 16 Unappropriated Foreign Available-for-sale
Share Capital for Share Capital Total and 20) Legal Reserve Earnings Total Operations Financial Assets Total Equity
BALANCE AT JANUARY 1, 2015 $ 6,301,031 $ 11,060 $ 6,312,091 $ 5,306,958 $ 3,472,064 $ 6,353,273 $ 9,825,337 $ 338,356 $ 563,277 $ 22,346,019
Appropriation of the 2014 earrings
Legal reserve - - - - 490,778 (490,778) - - - -
Cash dividends distributed by the Company - - - - - (3,787,255) (3,787,255) - - (3,787,255)
Issue of ordinary shares under employee share options 17,500 (11,060) 6,440 24,438 - - - - - 30,878
Compensation cost recognized for employee share options - - - 261,877 - - - - - 261,877
Change in capital surplus from investments in associates accounted for using
equity method - - - 2,172 - - - - - 2,172
Difference between considerations and carrying amounts of subsidiaries acquired
or disposed of - - - (11,457) - (62,903) (62,903) - - (74,360)
Changes in percentage of ownership interest in subsidiaries - - - 3,567 - - - - - 3,567
Net profit for the year ended December 31, 2015 - - - - - 5,104,346 5,104,346 - - 5,104,346
Other comprehensive income for the year ended December 31, 2015, net of
income tax - - - - - (18,234) (18,234) (66,497) (495,012) (579,743)
Total comprehensive income for the year ended December 31, 2015 - - - - - 5,086,112 5,086,112 (66,497) (495,012) 4,524,603
BALANCE AT DECEMBER 31, 2015 6,318,531 - 6,318,531 5,587,555 3,962,842 7,098,449 11,061,291 271,859 68,265 23,307,501
Appropriation of the 2015 earrings
Legal reserve - - - - 510,434 (510,434) - - - -
Cash dividends distributed by the Company - - - - - (3,791,118) (3,791,118) - - (3,791,118)
Issue of ordinary shares under employee share options 12,210 100 12,310 104,758 - - - - - 117,068
Compensation cost recognized for employee share options - - - 338,194 - - - - - 338,194
Change in capital surplus from investments in associates accounted for using
equity method - - - 10,533 - - - - - 10,533
Difference between considerations and carrying amounts of subsidiaries acquired
or disposed of - - - 17,844 - (3,691) (3,691) - - 14,153
Net profit for the year ended December 31, 2016 - - - - - 5,666,862 5,666,862 - - 5,666,862
Other comprehensive income for the year ended December 31, 2016, net of
income tax - - - - - (24,283) (24,283) (469,492) 44,164 (449,611)
Total comprehensive income for the year ended December 31, 2016 - - - - - 5,642,579 5,642,579 (469,492) 44,164 5,217,251
BALANCE AT DECEMBER 31, 2016 $ 6,330,741 $ 100 $ 6,330,841 $ 6,058,884 $ 4,473,276 $ 8,435,785 $ 12,909,061 $ (197,633) $ 112,429 $ 25,213,582
The accompanying notes are an integral part of the financial statements.
(With Deloitte & Touche audit report dated March 6, 2017)

- 10 -
ADVANTECH CO., LTD.
STATEMENTS OF CASH FLOWS
FOR THE YEARS ENDED DECEMBER 31, 2016 AND 2015
(In Thousands of New Taiwan Dollars)
2016 2015
CASH FLOWS FROM OPERATING ACTIVITIES
Income before income tax $ 6,643,696 $ 5,872,501
Adjustments for:
Depreciation expenses 239,135 242,916
Amortization expenses 78,294 74,874
Impairment loss recognized (reversal of impairment loss) of trade
receivables 96 (2,203)
Net gain on financial assets or liabilities at fair value through profit
or loss (79,967) (16,735)
Finance costs 4,163 -
Interest income (539) (1,665)
Dividend income (98,800) (105,445)
Compensation cost of employee share options 338,194 261,877
Share of profit of subsidiaries and associates accounted for using the
equity method (1,581,818) (1,344,991)
Loss (gain) on disposal of property, plant and equipment (146,954) 161
Gain on disposal of investments (1,431) (198,848)
Realized loss (gain) on the transactions with subsidiaries and
associates (65,575) 89,443
Changes in operating assets and liabilities
Financial assets held for trading 55,503 21,877
Notes receivable (11,743) (10,161)
Trade receivables (408,460) (139,295)
Trade receivables to related parties 69,551 36,412
Other receivables 7,127 (26,992)
Other receivables to related parties (3,406) 45
Inventories (262,717) (268,954)
Other current assets 21,957 (8,670)
Other financial assets - 18,650
Trade payables 651,489 121,548
Trade payables to related parties (76,488) 253,194
Other payables 357,649 185,158
Short-term warranty provision 7,745 5,291
Net defined benefit liabilities (2,041) (813)
Other current liabilities 81,680 11,088
Other noncurrent liabilities 3,305 (1,975)
Cash generated from operations 5,819,645 5,068,288
Interest received 539 1,665
Dividend received 98,800 105,445
Interest paid (4,163) -
Income tax paid (653,568) (542,066)
Net cash generated from operating activities 5,261,253 4,633,332
(Continued)

- 11 -
ADVANTECH CO., LTD.
STATEMENTS OF CASH FLOWS
FOR THE YEARS ENDED DECEMBER 31, 2016 AND 2015
(In Thousands of New Taiwan Dollars)
2016 2015
CASH FLOWS FROM INVESTING ACTIVITIES
Purchase of available-for-sale financial assets (4,128,000) (3,710,080)
Proceeds from sale of available-for-sale financial assets 3,429,410 5,754,213
Acquisition of investments accounted for using equity method (293,281) (688,577)
Proceeds from disposal of investments accounted for using the equity
method 336,958 -
Prepayment for investments - (1,968,044)
Proceeds of the capital reduction of investments accounted for using
the equity method 232,330 42,927
Payments for property, plant and equipment (930,598) (1,181,375)
Proceeds from disposal of property, plant and equipment 239,507 294
Decrease in refundable deposits 5,176 187
Payments for intangible assets (76,875) (62,714)
Proceeds from disposal of intangible assets 58 31
Decrease in prepayments for equipment 11,809 14,609
Dividends received from subsidiaries and associates 779,257 687,589
Net cash used in investing activities (394,249) (1,110,940)
CASH FLOWS FROM FINANCING ACTIVITIES
Increase in guarantee deposits received - (119)
Cash dividends paid (3,791,118) (3,787,255)
Exercise of employee share options 117,068 30,878
Net cash used in financing activities (3,674,050) (3,756,496)
NET INCREASE (DECREASE) IN CASH AND CASH
EQUIVALENTS 1,192,954 (234,104)
CASH AND CASH EQUIVALENTS AT THE BEGINNING OF THE
YEAR 815,293 1,049,397
CASH AND CASH EQUIVALENTS AT THE END OF THE YEAR $ 2,008,247 $ 815,293
The accompanying notes are an integral part of the financial statements.
(With Deloitte & Touche audit report dated March 6, 2017) (Concluded)

- 12 -
ADVANTECH CO., LTD.
NOTES TO FINANCIAL STATEMENTS
FOR THE YEARS ENDED DECEMBER 31, 2016 AND 2015
(In Thousands of New Taiwan Dollars, Unless Stated Otherwise)
1. GENERAL INFORMATION
Advantech Co., Ltd. (the “Company”) is a listed company that was established in September 1981. It
manufactures and sells embedded computing boards, industrial automation products, and applied and
industrial computers.
The Company’s shares have been listed on the Taiwan Stock Exchange since December 1999.
To improve the entire operating efficiency of Advantech Co., Ltd. (the “Company”) and its subsidiaries, the
Company’s board of directors resolved on June 30, 2009 to have a short-form merger with Advantech
Investment and Management Service (AIMS). The effective merger date was July 30, 2009. As the
surviving entity, the Company assumed all assets and liabilities of AIMS.
On June 26, 2014, the Company’s board of directors resolved to have a whale-minnow merger with Netstar
Technology Co., Ltd. (“Netstar”) an indirect 95.51%-owned subsidiary through a wholly-owned subsidiary,
Advantech Corporate Investment. The effective merger date was July 27, 2014. As the surviving entity,
the Company assumed all assets and liabilities of Netstar.
The functional currency of the Company is the New Taiwan dollar.
2. APPROVAL OF FINANCIAL STATEMENTS
The financial statements were approved by the board of directors on March 6, 2017.
3. APPLICATION OF NEW, AMENDED AND REVISED STANDARDS AND INTERPRETATIONS
a. Amendments to the Regulations Governing the Preparation of Financial Reports by Securities Issuers
and the International Financial Reporting Standards (IFRS), International Accounting Standards (IAS),
Interpretations of IFRS (IFRIC), and Interpretations of IAS (SIC) endorsed by the FSC for application
starting from 2017
Rule No. 1050050021 and Rule No. 1050026834 issued by the FSC stipulated that starting January 1,
2017, the Company should apply the amendments to the Regulations Governing the Preparation of
Financial Reports by Securities Issuers and the IFRS, IAS, IFRIC and SIC (collectively, the “IFRSs”)
issued by the IASB and endorsed by the FSC for application starting from 2017.
New, Amended or Revised Standards and Interpretations
(the “New IFRSs”)
Effective Date
Announced by IASB (Note 1)
Annual Improvements to IFRSs 2010-2012 Cycle July 1, 2014 (Note 2)
Annual Improvements to IFRSs 2011-2013 Cycle July 1, 2014
Annual Improvements to IFRSs 2012-2014 Cycle January 1, 2016 (Note 3)
Amendments to IFRS 10, IFRS 12 and IAS 28 “Investment Entities:
Applying the Consolidation Exception”
January 1, 2016
(Continued)

- 13 -
New, Amended or Revised Standards and Interpretations
(the “New IFRSs”)
Effective Date
Announced by IASB (Note 1)
Amendment to IFRS 11 “Accounting for Acquisitions of Interests in
Joint Operations”
January 1, 2016
IFRS 14 “Regulatory Deferral Accounts” January 1, 2016
Amendment to IAS 1 “Disclosure Initiative” January 1, 2016
Amendments to IAS 16 and IAS 38 “Clarification of Acceptable
Methods of Depreciation and Amortization”
January 1, 2016
Amendments to IAS 16 and IAS 41 “Agriculture: Bearer Plants” January 1, 2016
Amendment to IAS 19 “Defined Benefit Plans: Employee
Contributions”
July 1, 2014
Amendment to IAS 27 “Equity Method in Separate Financial
Statements”
January 1, 2016
Amendment to IAS 36 “Impairment of Assets: Recoverable Amount
Disclosures for Non-financial Assets”
January 1, 2014
Amendment to IAS 39 “Novation of Derivatives and Continuation of
Hedge Accounting”
January 1, 2014
IFRIC 21 “Levies” January 1, 2014
(Concluded)
Note 1: Unless stated otherwise, the above New or amended IFRSs are effective for annual periods
beginning on or after their respective effective dates.
Note 2: The amendment to IFRS 2 applies to share-based payment transactions with grant date on or
after July 1, 2014; the amendment to IFRS 3 applies to business combinations with acquisition
date on or after July 1, 2014; the amendment to IFRS 13 is effective immediately; the
remaining amendments are effective for annual periods beginning on or after July 1, 2014.
Note 3: The amendment to IFRS 5 is applied prospectively to changes in a method of disposal that
occur in annual periods beginning on or after January 1, 2016; the remaining amendments are
effective for annual periods beginning on or after January 1, 2016.
The initial application in 2017 of the above IFRSs and related amendments to the Regulations
Governing the Preparation of Financial Reports by Securities Issuers would not have any material
impact on the Company’s accounting policies, except for the following:
1) Amendment to IAS 36 “Recoverable Amount Disclosures for Non-financial Assets”
The amendment clarifies that the recoverable amount of an asset or a cash-generating unit is
disclosed only when an impairment loss on the asset has been recognized or reversed during the
period. Furthermore, if the recoverable amount of an item of property, plant and equipment for
which impairment loss has been recognized or reversed is fair value less costs of disposal, the
Company is required to disclose the fair value hierarchy. If the fair value measurements are
categorized within [Level 2/Level 3], the valuation technique and key assumptions used to measure
the fair value are disclosed. The discount rate used is disclosed if such fair value less costs of
disposal is measured by using present value technique. The amendment will be applied
retrospectively.
2) Annual Improvements to IFRSs: 2010-2012 Cycle
Several standards, including IFRS 2 “Share-based Payment”, IFRS 3 “Business Combinations” and
IFRS 8 “Operating Segments” were amended in this annual improvement.

- 14 -
The amended IFRS 2 changes the definitions of “vesting condition” and “market condition” and
adds definitions for “performance condition” and “service condition”. The amendment clarifies
that a performance target can be based on the operations (i.e. a non-market condition) of the
Company or another entity in the same group or the market price of the equity instruments of the
Company or another entity in the same group (i.e. a market condition); that a performance target
can relate either to the performance of the Company as a whole or to some part of it (e.g. a
division); and that the period for achieving a performance condition must not extend beyond the end
of the related service period. In addition, a share market index target is not a performance
condition because it not only reflects the performance of the Company, but also of other entities
outside the Company. The share-based payment arrangements with market conditions, non-market
conditions or non-vesting conditions will be accounted for differently, and the aforementioned
amendment will be applied prospectively to those share-based payments granted on or after January
1, 2017.
IFRS 3 was amended to clarify that contingent consideration should be measured at fair value,
irrespective of whether the contingent consideration is a financial instrument within the scope of
IFRS 9 or IAS 39. Changes in fair value should be recognized in profit or loss. The amendment
will be applied prospectively to business combinations with acquisition date on or after January 1,
2017.
The amended IFRS 8 requires the Company to disclose the judgments made by management in
applying the aggregation criteria to operating segments, including a description of the operating
segments aggregated and the economic indicators assessed in determining whether the operating
segments have “similar economic characteristics”. The amendment also clarifies that a
reconciliation of the total of the reportable segments’ assets to the entity’s assets should only be
provided if the segments’ assets are regularly provided to the chief operating decision-maker. The
judgments made in applying aggregation criteria should be disclosed retrospectively upon initial
application of the amendment in 2017.
When the amended IFRS 13 becomes effective in 2017, the short-term receivables and payables
with no stated interest rate will be measured at their invoice amounts without discounting, if the
effect of not discounting is immaterial.
IAS 24 was amended to clarify that a management entity providing key management personnel
services to the Company is a related party of the Company. Consequently, the Company is
required to disclose as related party transactions the amounts incurred for the service paid or
payable to the management entity for the provision of key management personnel services.
However, disclosure of the components of such compensation is not required.
3) Annual Improvements to IFRSs: 2011-2013 Cycle
Several standards, including IFRS 3 and IFRS 13, were amended in this annual improvement.
IFRS 3 was amended to clarify that IFRS 3 does not apply to the accounting for the formation of all
types of joint arrangements in the financial statements of the joint arrangement itself. The
amendment will be applied prospectively starting from January 1, 2017.
The scope in IFRS 13 of the portfolio exception for measuring the fair value of a group of financial
assets and financial liabilities on a net basis was amended to clarify that it includes all contracts that
are within the scope of, and accounted for in accordance with, IAS 39 or IFRS 9, even those
contracts do not meet the definitions of financial assets or financial liabilities within IAS 32.

- 15 -
4) Amendments to IAS 16 and IAS 38 “Clarification of Acceptable Methods of Depreciation and
Amortization”
The entity should use appropriate depreciation and amortization method to reflect the pattern in
which the future economic benefits of the property, plant and equipment and intangible asset are
expected to be consumed by the entity.
The amended IAS 16 “Property, Plant and Equipment” stipulates that a depreciation method that is
based on revenue that is generated by an activity that includes the use of an asset is not appropriate.
The amended standard does not provide any exception from this requirement.
The amended IAS 38 “Intangible Assets” clarifies that there is a rebuttable presumption that an
amortization method that is based on revenue that is generated by an activity that includes the use of
an intangible asset is not appropriate. This presumption can be overcome only in the following
limited circumstances:
a) In which the intangible asset is expressed as a measure of revenue (for example, the contract
that specifies the entity’s use of the intangible asset will expire upon achievement of a revenue
threshold); or
b) When it can be demonstrated that revenue and the consumption of the economic benefits of the
intangible asset are highly correlated.
5) Amendments to the Regulations Governing the Preparation of Financial Reports by Securities
Issuers
The amendments include additions of several accounting items and requirements for disclosures of
impairment of non-financial assets as a consequence of the IFRSs endorsed by the FSC for
application starting from 2017. In addition, as a result of the post implementation review of IFRSs
in Taiwan, the amendments also include emphasis on certain recognition and measurement
considerations and add requirements for disclosures of related party transactions and goodwill.
The amendments stipulate that other companies or institutions of which the chairman of the board
of directors or president serves as the chairman of the board of directors or the president, or is the
spouse or second immediate family of the chairman of the board of directors or president of the
Company are deemed to have a substantive related party relationship, unless it can be demonstrated
that no control, joint control, or significant influence exists. Furthermore, the amendments require
the disclosure of the names of the related parties and the relationship with whom the Company has
significant transaction. If the transaction or balance with a specific related party is 10% or more of
the Company’s respective total transaction or balance, such transaction should be separately
disclosed by the name of each related party.
The amendments also require additional disclosure if there is a significant difference between the
actual operation after business combination and the expected benefit on acquisition date.
The disclosures of related party transactions and impairment of goodwill will be enhanced when the
above amendments are retrospectively applied in 2017.
As of the date the financial statements were authorized for issue, the Company continues assessing
other possible impacts that application of the aforementioned amendments and the related
amendments to the Regulations Governing the Preparation of Financial Reports by Securities
Issuers will have on the Company’s financial position and financial performance, and will disclose
these other impacts when the assessment is completed.

- 16 -
b. New IFRSs in issue but not yet endorsed by the FSC
The Company has not applied the following IFRSs issued by IASB but not yet endorsed by the FSC.
The FSC announced that IFRS 9 and IFRS 15 will take effect starting January 1, 2018. As of the date
the financial statements were authorized for issue, the FSC has not announced the effective dates of
other new IFRSs.
New IFRSs
Effective Date
Announced by IASB (Note 1)
Annual Improvements to IFRSs 2014-2016 Cycle Note 2
Amendment to IFRS 2 “Classification and Measurement of
Share-based Payment Transactions”
January 1, 2018
Amendments to IFRS 4“Applying IFRS 9 Financial Instruments with
IFRS 4 Insurance Contracts”
January 1, 2018
IFRS 9 “Financial Instruments” January 1, 2018
Amendments to IFRS 9 and IFRS 7 “Mandatory Effective Date of
IFRS 9 and Transition Disclosures”
January 1, 2018
Amendments to IFRS 10 and IAS 28 “Sale or Contribution of Assets
between an Investor and its Associate or Joint Venture”
To be determined by IASB
IFRS 15 “Revenue from Contracts with Customers” January 1, 2018
Amendments to IFRS 15 “Clarifications to IFRS 15 Revenue from
Contracts with Customers”
January 1, 2018
IFRS 16 “Leases” January 1, 2019
Amendment to IAS 7 “Disclosure Initiative” January 1, 2017
Amendments to IAS 12 “Recognition of Deferred Tax Assets for
Unrealized Losses”
January 1, 2017
Amendments to IAS 40 “Transfers of Investment Property” January 1, 2018
IFRIC 22 “Foreign Currency Transactions and Advance
Consideration”
January 1, 2018
Note 1: Unless stated otherwise, the above New IFRSs are effective for annual periods beginning on
or after their respective effective dates.
Note 2: The amendment to IFRS 12 is retrospectively applied for annual periods beginning on or after
January 1, 2017; the amendment to IAS 28 is retrospectively applied for annual periods
beginning on or after January 1, 2018.
1) IFRS 9 “Financial Instruments”
Recognition and measurement of financial assets
With regards to financial assets, all recognized financial assets that are within the scope of IAS 39
“Financial Instruments: Recognition and Measurement” are subsequently measured at amortized
cost or fair value. Under IFRS 9, the requirement for the classification of financial assets is stated
below.
For the Company’s debt instruments that have contractual cash flows that are solely payments of
principal and interest on the principal amount outstanding, their classification and measurement are
as follows:
a) For debt instruments, if they are held within a business model whose objective is to collect the
contractual cash flows, the financial assets are measured at amortized cost and are assessed for
impairment continuously with impairment loss recognized in profit or loss, if any. Interest
revenue is recognized in profit or loss by using the effective interest method;

- 17 -
b) For debt instruments, if they are held within a business model whose objective is achieved by
both the collecting of contractual cash flows and the selling of financial assets, the financial
assets are measured at fair value through other comprehensive income (FVTOCI) and are
assessed for impairment. Interest revenue is recognized in profit or loss by using the effective
interest method, and other gain or loss shall be recognized in other comprehensive income,
except for impairment gains or losses and foreign exchange gains and losses. When the debt
instruments are derecognized or reclassified, the cumulative gain or loss previously recognized
in other comprehensive income is reclassified from equity to profit or loss.
Except for the above, all other financial assets are measured at fair value through profit or loss.
However, the Company may make an irrevocable election to present subsequent changes in the fair
value of an equity investment (that is not held for trading) in other comprehensive income, with
only dividend income generally recognized in profit or loss. No subsequent impairment
assessment is required, and the cumulative gain or loss previously recognized in other
comprehensive income cannot be reclassified from equity to profit or loss.
Impairment of financial assets
IFRS 9 requires impairment loss on financial assets to be recognized by using the “Expected Credit
Losses Model”. The credit loss allowance is required for financial assets measured at amortized
cost, financial assets mandatorily measured at FVTOCI, lease receivables, contract assets arising
from IFRS 15 “Revenue from Contracts with Customers”, certain written loan commitments and
financial guarantee contracts. A loss allowance for the 12-month expected credit losses is required
for a financial asset if its credit risk has not increased significantly since initial recognition. A loss
allowance for full lifetime expected credit losses is required for a financial asset if its credit risk has
increased significantly since initial recognition and is not low. However, a loss allowance for full
lifetime expected credit losses is required for trade receivables that do not constitute a financing
transaction.
For purchased or originated credit-impaired financial assets, the Company takes into account the
expected credit losses on initial recognition in calculating the credit-adjusted effective interest rate.
Subsequently, any changes in expected losses are recognized as a loss allowance with a
corresponding gain or loss recognized in profit or loss.
Transition
Financial instruments that have been derecognized prior to the effective date of IFRS 9 cannot be
reversed to apply IFRS 9 when it becomes effective. Under IFRS 9, the requirements for
classification, measurement and impairment of financial assets are applied retrospectively with the
difference between the previous carrying amount and the carrying amount at the date of initial
application recognized in the current period and restatement of prior periods is not required. The
requirements for general hedge accounting shall be applied prospectively and the accounting for
hedging options shall be applied retrospectively.
2) IFRS 15 “Revenue from Contracts with Customers” and related amendment
IFRS 15 establishes principles for recognizing revenue that apply to all contracts with customers,
and will supersede IAS 18 “Revenue”, IAS 11 “Construction Contracts” and a number of
revenue-related interpretations from January 1, 2018.
When applying IFRS 15, an entity shall recognize revenue by applying the following steps:
Identify the contract with the customer;
Identify the performance obligations in the contract;
Determine the transaction price;

- 18 -
Allocate the transaction price to the performance obligations in the contract; and
Recognize revenue when the entity satisfies a performance obligation.
In identifying performance obligations, IFRS 15 and related amendment require that a good or
service is distinct if it is capable of being distinct (for example, the Company regularly sells it
separately) and the promise to transfer it is distinct within the context of the contract (i.e. the nature
of the promise in the contract is to transfer each of those goods or services individually rather than
to transfer combined items).
When IFRS 15 and related amendment are effective, an entity may elect to apply this Standard
either retrospectively to each prior reporting period presented or retrospectively with the cumulative
effect of initially applying this Standard recognized at the date of initial application.
3) Amendments to IFRS 10 and IAS 28 “Sale or Contribution of Assets between an Investor and its
Associate or Joint Venture”
The amendments stipulated that, when an entity sells or contributes assets that constitute a business
(as defined in IFRS 3) to an associate, the gain or loss resulting from the transaction is recognized in
full. Also, when an entity loses control of a subsidiary that contains a business but retains
significant influence or joint control, the gain or loss resulting from the transaction is recognized in
full.
Conversely, when an entity sells or contributes assets that do not constitute a business to an
associate, the gain or loss resulting from the transaction is recognized only to the extent of the
unrelated investors’ interest in the associate, i.e. the entity’s share of the gain or loss is eliminated.
Also, when an entity loses control of a subsidiary that does not contain a business but retains
significant influence in an associate, the gain or loss resulting from the transaction is recognized
only to the extent of the unrelated investors’ interest in the associate, i.e. the entity’s share of the
gain or loss is eliminated.
4) IFRS 16 “Leases”
IFRS 16 sets out the accounting standards for leases that will supersede IAS 17 and a number of
related interpretations.
Under IFRS 16, if the Company is a lessee, it shall recognize right-of-use assets and lease liabilities
for all leases on the balance sheets except for low-value and short-term leases. The Company may
elect to apply the accounting method similar to the accounting for operating lease under IAS 17 to
the low-value and short-term leases. On the statements of comprehensive income, the Company
should present the depreciation expense charged on the right-of-use asset separately from interest
expense accrued on the lease liability; interest is computed by using effective interest method. On
the statements of cash flows, cash payments for the principal portion of the lease liability are
classified within financing activities; cash payments for interest portion are classified within
operating activities.
The application of IFRS 16 is not expected to have a material impact on the accounting of the
Company as lessor.
When IFRS 16 becomes effective, the Company may elect to apply this Standard either
retrospectively to each prior reporting period presented or retrospectively with the cumulative effect
of the initial application of this Standard recognized at the date of initial application.

- 19 -
5) Amendments to IAS 12 “Recognition of Deferred Tax Assets for Unrealized Losses”
In determining whether to recognize a deferred tax asset, the Company should assess a deductible
temporary difference in combination with all of its other deductible temporary differences, unless
the tax law restricts the utilization of losses as deduction against income of a specific type, in which
case, a deductible temporary difference is assessed in combination only with other deductible
temporary differences of the appropriate type. The amendment also stipulates that, when
determining whether to recognize a deferred tax asset, the estimate of probable future taxable profit
may include some of the Company’s assets for more than their carrying amount if there is sufficient
evidence that it is probable that the Company will achieve the higher amount, and that the estimate
for future taxable profit should exclude tax deductions resulting from the reversal of deductible
temporary differences.
6) Annual Improvements to IFRSs 2014-2016 Cycle
IAS 28 “Investments in Associates and Joint Ventures,” was amended in this annual improvement.
The amendment to IAS 28 clarified that when the Company (non-investment entity) applies the
equity method to account for investment in an associate that is an investment entity, the Company
may elect to retain the fair value of the investment in subsidiaries of the investment entity associate.
The election should be made separately for each investment entity associate, at the later of the date
(a) the investment entity associate is initially recognized, (b) the associate becomes an investment
entity, or (c) the investment entity associate first becomes a parent.
The Company shall apply the aforementioned amendments retrospectively.
7) IFRIC 22 “Foreign Currency Transactions and Advance Consideration”
IAS 21 stipulated that a foreign currency transaction shall be recorded on initial recognition in the
functional currency by applying to the foreign currency amount the spot exchange rate between the
functional currency and the foreign currency at the date of the transaction. IFRIC 22 further
explains that the date of the transaction is the date on which an entity recognizes a non-monetary
asset or non-monetary liability from payment or receipt of advance consideration. If there are
multiple payments or receipts in advance, the entity shall determine the date of the transaction for
each payment or receipt of advance consideration.
The Company shall apply IFRIC 22 either retrospectively or prospectively to all assets, expenses
and income in the scope of the Interpretation initially recognized on or after (a) the beginning of the
reporting period in which the entity first applies IFRIC 22, or (b) the beginning of a prior reporting
period presented as comparative information in the financial statements of the reporting period in
which the entity first applies IFRIC 22.
Except for the above impact, as of the date the financial statements were authorized for issue, the
Company is continuously assessing the possible impact that the application of other standards and
interpretations will have on the Company’s financial position and financial performance, and will
disclose the relevant impact when the assessment is completed.
4. SUMMARY OF SIGNIFICANT ACCOUNTING POLICIES
a. Statement of compliance
The parent company only financial statements have been prepared in accordance with the Regulations
Governing the Preparation of Financial Reports by Securities Issuers.

- 20 -
b. Basis of preparation
The financial statements have been prepared on the historical cost basis except for financial instruments
that are measured at fair values.
The fair value measurements, which are grouped into Levels 1 to 3 based on the degree to which the
fair value measurement inputs are observable and the significance of the inputs to the fair value
measurement in its entirety, are described as follows:
1) Level 1 inputs are quoted prices (unadjusted) in active markets for identical assets or liabilities;
2) Level 2 inputs are inputs other than quoted prices included within Level 1 that are observable for
the asset or liability, either directly (i.e. as prices) or indirectly (i.e. derived from prices); and
3) Level 3 inputs are unobservable inputs for the asset or liability.
When preparing its parent company only financial statements, the Company used equity method to
account for its investment in subsidiaries and associates. In order for the amounts of the net profit for
the year, other comprehensive income for the year and total equity in the parent company only financial
statements to be the same with the amounts attributable to the owner of the Company in its financial
statements, adjustments arising from the differences in accounting treatment between parent company
only basis and consolidated basis were made to investments accounted for by equity method, share of
profit or loss of subsidiaries and associates, share of other comprehensive income of subsidiaries and
associates and related equity items, as appropriate, in the parent company only financial statements.
c. Classification of current and non-current assets and liabilities
Current assets include:
1) Assets held primarily for the purpose of trading;
2) Assets expected to be realized within twelve months after the reporting period; and
3) Cash and cash equivalents unless the asset is restricted from being exchanged or used to settle a
liability for at least twelve months after the reporting period.
Current liabilities include:
1) Liabilities held primarily for the purpose of trading;
2) Liabilities due to be settled within twelve months after the reporting period, even if an agreement to
refinance, or to reschedule payments, on a long-term basis is completed after the reporting period
and before the financial statements are authorized for issue; and
3) Liabilities for which the Company does not have an unconditional right to defer settlement for at
least twelve months after the reporting period. Terms of a liability that could, at the option of the
counterparty, result in its settlement by the issue of equity instruments do not affect its
classification.
Assets and liabilities that are not classified as current are classified as non-current.
d. Business combinations
Acquisitions of businesses are accounted for using the acquisition method. Acquisition-related costs
are generally recognized in profit or loss as incurred.

- 21 -
Goodwill is measured as the excess of the sum of the consideration transferred and the fair value of the
acquirer’s previously held equity interest in the acquiree over the net of the acquisition-date amounts of
the identifiable assets acquired and the liabilities assumed.
e. Foreign currencies
In preparing the Company’s financial statements, transactions in currencies other than the Company’s
functional currency (foreign currencies) are recognized at the rates of exchange prevailing at the dates
of the transactions.
At the end of each reporting period, monetary items denominated in foreign currencies are retranslated
at the rates prevailing at that date. Exchange differences on monetary items arising from settlement or
translation are recognized in profit or loss in the period in which they arise.
Non-monetary items measured at fair value that are denominated in foreign currencies are retranslated
at the rates prevailing at the date when the fair value was determined. Exchange differences arising
from the retranslation of non-monetary items are included in profit or loss for the period except for
exchange differences arising from the retranslation of non-monetary items in respect of which gains and
losses are recognized directly in other comprehensive income, in which cases, the exchange differences
are also recognized directly in other comprehensive income.
Non-monetary items that are measured at historical cost in a foreign currency are not retranslated.
For the purpose of presenting financial statements, the functional currencies of the Company’s foreign
operations (including subsidiaries and associates in other countries that use currency different from the
currency of the Company) are translated into the presentation currency - the New Taiwan dollars as
follows: Assets and liabilities are translated at the exchange rates prevailing at the end of the reporting
period; income and expense items are translated at the average exchange rates for the period. The
resulting currency translation differences are recognized in other comprehensive income.
Goodwill and fair value adjustments on identifiable assets and liabilities acquired arising from the
acquisition of a foreign operation are treated as assets and liabilities of the foreign operation and
translated at the rate of exchange prevailing at the end of each reporting period. Exchange differences
arising are recognized in other comprehensive income.
f. Inventories
Inventories consist of raw materials, supplies, finished goods and work-in-process and are stated at the
lower of cost or net realizable value. Inventory write-downs are made by item, except where it may be
appropriate to group similar or related items. Net realizable value is the estimated selling price of
inventories less all estimated costs of completion and costs necessary to make the sale. Inventories are
recorded at the weighted-average cost on the balance sheet date.
g. Investment in subsidiaries
The Company uses the equity method to account for its investments in subsidiaries.
Subsidiaries are the entities (including structured entities) controlled by the Company.
Under the equity method, an investment in a subsidiary is initially recognized at cost and adjusted
thereafter to recognize the Company’s share of the profit or loss and other comprehensive income of the
subsidiary. The Company also recognizes the changes in the Company’s share of other equity of the
subsidiaries.

- 22 -
Changes in the Company’s ownership interests in subsidiaries that do not result in the Company losing
control of the subsidiaries are equity transactions. The Company recognizes directly in equity any
difference between the carrying amount of the investment and the fair value of the consideration paid or
received.
When the Company’s share of losses of a subsidiary exceeds its interest in that subsidiary (which
includes any carrying amount of the investment accounted for by the equity method and long-term
interests that, in substance, form part of the Company’s net investment in the subsidiary), the Company
continues recognizing its share of further losses.
Any excess of the cost of acquisition over the Company’s share of the net fair value of the identifiable
assets and liabilities of a subsidiary at the date of acquisition is recognized as goodwill, which is
included within the carrying amount of the investment and is not amortized. Any excess of the
Company’s share of the net fair value of the identifiable assets and liabilities over the cost of acquisition
is recognized immediately in profit or loss.
The Company assesses its investment for any impairment by comparing the carrying amount with the
estimated recoverable amount as assessed based on the entire financial statements of the invested
company. Impairment loss is recognized when the carrying amount exceeds the recoverable amount.
If the recoverable amount of the investment subsequently increases, the Company recognizes the
reversal of the impairment loss; the adjusted post-reversal carrying amount should not exceed the
carrying amount that would have been recognized (net of amortization or depreciation) had no
impairment loss been recognized in prior years. An impairment loss recognized on goodwill cannot be
reversed in a subsequent period.
When the Company loses control of a subsidiary, it recognizes the investment retained in the former
subsidiary at its fair value at the date when control is lost. The difference between the fair value of the
retained investment plus any consideration received and the carrying amount of the previous investment
at the date when control is lost is recognized as a gain or loss in profit or loss. Besides, the Company
accounts for all amounts previously recognized in other comprehensive income in relation to that
subsidiary on the same basis as would be required if the Company had directly disposed of the related
assets or liabilities.
Profits and losses resulting from downstream transactions with subsidiaries are eliminated in full.
Profits and losses resulting from upstream with subsidiaries and sidestream transactions between
subsidiaries are recognized in the financial statements only to the extent of interests in the subsidiaries
that are not related to the Company.
h. Investment in associates
An associate is an entity over which the Company has significant influence and that is not a subsidiary.
The Company uses the equity method to account for its investment in associates.
Under the equity method, investments in an associate are initially recognized at cost and adjusted
thereafter to recognize the Company’s share of the profit or loss and other comprehensive income of the
associate. The Company also recognizes the changes in the Company’s share of the equity of
associates attributable to the Company.
Any excess of the cost of acquisition over the Company’s share of the net fair value of the identifiable
assets and liabilities of an associate at the date of acquisition is recognized as goodwill, which is
included within the carrying amount of the investment and is not amortized. Any excess of the
Company’s share of the net fair value of the identifiable assets and liabilities over the cost of
acquisition, after reassessment, is recognized immediately in profit or loss.

- 23 -
When the Company subscribes for additional new shares of the associate at a percentage different from
its existing ownership percentage, the resulting carrying amount of the investment differs from the
amount of the Company’s proportionate interest in the associate. The Company records such a
difference as an adjustment to investments with the corresponding amount charged or credited to capital
surplus - changes in the Company’s share of the equity of associates. If the Company’s ownership
interest is reduced due to the additional subscription of the new shares of associate, the proportionate
amount of the gains or losses previously recognized in other comprehensive income in relation to that
associate is reclassified to profit or loss on the same basis as would be required if the investee had
directly disposed of the related assets or liabilities. When the adjustment should be debited to capital
surplus, but the capital surplus recognized from investments accounted for by the equity method is
insufficient, the shortage is debited to retained earnings.
When the Company’s share of losses of an associate equals or exceeds its interest in that associate
(which includes any carrying amount of the investment accounted for by the equity method and
long-term interests that, in substance, form part of the Company’s net investment in the associate), the
Company discontinues recognizing its share of further losses. Additional losses and liabilities are
recognized only to the extent that the Company has incurred legal obligations, or constructive
obligations, or made payments on behalf of that associate.
The entire carrying amount of the investment (including goodwill) is tested for impairment as a single
asset by comparing its recoverable amount with its carrying amount. Any impairment loss recognized
forms part of the carrying amount of the investment. Any reversal of that impairment loss is
recognized to the extent that the recoverable amount of the investment subsequently increases.
The Company discontinues the use of the equity method from the date on which its investment ceases to
be an associate. Any retained investment is measured at fair value at that date and the fair value is
regarded as its fair value on initial recognition as a financial asset. The difference between the
previous carrying amount of the associate attributable to the retained interest and its fair value is
included in the determination of the gain or loss on disposal of the associate. The Company accounts
for all amounts previously recognized in other comprehensive income in relation to that associate on the
same basis as would be required if that associate had directly disposed of the related assets or liabilities.
When the group-entity transacts with its associate, profits and losses resulting from the transactions
with the associate are recognized in the financial statements only to the extent that interests in the
associate are not related to the Company.
i. Property, plant and equipment
Property, plant and equipment are stated at cost, less accumulated depreciation and accumulated
impairment loss.
Property, plant and equipment in the course of construction are carried at cost, less any recognized
impairment loss. Cost includes professional fees and borrowing costs eligible for capitalization.
Such assets are depreciated and classified to the appropriate categories of property, plant and equipment
when completed and ready for intended use.
Freehold land is not depreciated.
Depreciation on properties, plant and equipment is recognized using the straight-line method. Each
significant part is depreciated separately. The estimated useful lives, residual values and depreciation
methods are reviewed at the end of each reporting period, with the effects of any changes in estimates
accounted for on a prospective basis.
On derecognition of an item of property, plant and equipment, the difference between the sales proceeds
and the carrying amount of the asset and is recognized in profit or loss.

- 24 -
j. Goodwill
Goodwill arising from the acquisition of a business is carried at cost as established at the date of
acquisition of the business less accumulated impairment loss.
For the purposes of impairment testing, goodwill is allocated to each of the Company’s cash-generating
units or groups of cash-generating units (referred to as cash-generating units) that is expected to benefit
from the synergies of the combination.
A cash-generating unit to which goodwill has been allocated is tested for impairment annually, or more
frequently when there is an indication that the unit may be impaired, by comparing its carrying amount,
including the attributed goodwill, with its recoverable amount. However, if the goodwill allocated to a
cash-generating unit was acquired in a business combination during the current annual period, that unit
shall be tested for impairment before the end of the current annual period. If the recoverable amount
of the cash-generating unit is less than its carrying amount, the impairment loss is allocated first to
reduce the carrying amount of any goodwill allocated to the unit and then to the other assets of the unit
pro rata based on the carrying amount of each asset in the unit. Any impairment loss is recognized
directly in profit or loss. An impairment loss recognized for goodwill is not reversed in subsequent
periods.
If goodwill has been allocated to a cash-generating unit and the entity disposes of an operation within
that unit, the goodwill associated with the operation disposed of is included in the carrying amount of
the operation when determining the gain or loss on disposal.
k. Intangible assets
1) Intangible assets acquired separately
Intangible assets with finite useful lives that are acquired separately are initially measured at cost
and subsequently measured at cost less accumulated amortization and accumulated impairment loss.
Amortization is recognized on a straight-line basis. The estimated useful life, residual value, and
amortization method are reviewed at the end of each reporting period, with the effect of any
changes in estimate accounted for on a prospective basis. Intangible assets with indefinite useful
lives that are acquired separately are measured at cost less accumulated impairment loss.
2) Derecognition of intangible assets
On derecognition of an intangible asset, the difference between the net disposal proceeds and the
carrying amount of the asset is recognized in profit or loss.
l. Impairment of tangible and intangible assets other than goodwill
At the end of each reporting period, the Company reviews the carrying amounts of its tangible and
intangible assets, excluding goodwill, to determine whether there is any indication that those assets
have suffered an impairment loss. If any such indication exists, the recoverable amount of the asset is
estimated in order to determine the extent of the impairment loss. When it is not possible to estimate
the recoverable amount of an individual asset, the Company estimates the recoverable amount of the
cash-generating unit to which the asset belongs. Corporate assets are allocated to the individual
cash-generating units on a reasonable and consistent basis of allocation.
The recoverable amount is the higher of fair value less costs to sell and value in use. If the recoverable
amount of an asset or cash-generating unit is estimated to be less than its carrying amount, the carrying
amount of the asset or cash-generating unit is reduced to its recoverable amount, with the resulting
impairment loss recognized in profit or loss.
- 25 -
When an impairment loss is subsequently reversed, the carrying amount of the asset or cash-generating
unit is increased to the revised estimate of its recoverable amount, but only to the extent of the carrying
amount that would have been determined had no impairment loss been recognized for the asset or
cash-generating unit in prior years. A reversal of an impairment loss is recognized in profit or loss.
m. Financial instruments
Financial assets and financial liabilities are recognized when the Company becomes a party to the
contractual provisions of the instruments.
Financial assets and financial liabilities are initially measured at fair value. Transaction costs that are
directly attributable to the acquisition or issue of financial assets and financial liabilities (other than
financial assets and financial liabilities at fair value through profit or loss) are added to or deducted
from the fair value of the financial assets or financial liabilities, as appropriate, on initial recognition.
Transaction costs directly attributable to the acquisition of financial assets or financial liabilities at fair
value through profit or loss are recognized immediately in profit or loss.
1) Financial assets
All regular way purchases or sales of financial assets are recognized and derecognized on a trade
date basis.
a) Measurement category
Financial assets are classified into the following categories: Financial assets at fair value
through profit or loss, available-for-sale financial assets, and loans and receivables.
i. Financial assets at fair value through profit or loss
Financial assets are classified as at fair value through profit or loss when the financial asset
is either held for trading or it is designated as at fair value through profit or loss.
Financial assets at fair value through profit or loss are stated at fair value, with any gains or
losses arising on remeasurement recognized in profit or loss. The net gain or loss
recognized in profit or loss incorporates any dividend or interest earned on the financial
asset. Fair value is determined in the manner described in Note 25.
ii. Available-for-sale financial assets
Available-for-sale financial assets are non-derivatives that are either designated as
available-for-sale or are not classified as loans and receivables, held-to-maturity investments
or financial assets at fair value through profit or loss.
Available-for-sale financial assets are measured at fair value. Changes in the carrying
amounts of available-for-sale monetary financial assets relating to changes in foreign
currency exchange rates, interest income calculated using the effective interest method and
dividends on available-for-sale equity investments are recognized in profit or loss. Other
changes in the carrying amount of available-for-sale financial assets are recognized in other
comprehensive income and will be reclassified to profit or loss when the investment is
disposed of or is determined to be impaired.
Dividends on available-for-sale equity instruments are recognized in profit or loss when the
Company’s right to receive the dividends is established.

- 26 -
iii. Loans and receivables
Loans and receivables (including trade receivables and cash and cash equivalent) are
measured at amortized cost using the effective interest method, less any impairment, except
for short-term receivables when the effect of discounting is immaterial.
Cash equivalent includes time deposits with original maturities within three months from the
date of acquisition, which are highly liquid, readily convertible to a known amount of cash
and are subject to an insignificant risk of changes in value. These cash equivalents are
held for the purpose of meeting short-term cash commitments.
b) Impairment of financial assets
Financial assets, other than those at fair value through profit or loss, are assessed for indicators
of impairment at the end of each reporting period. Financial assets are considered to be
impaired when there is objective evidence, as a result of one or more events that occurred after
the initial recognition of the financial asset, that the estimated future cash flows of the
investment have been affected.
For financial assets carried at amortized cost, such as trade receivables, such assets are assessed
for impairment on a collective basis even if they were assessed not to be impaired individually.
Objective evidence of impairment for a portfolio of receivables could include the Company’s
past experience of collecting payments, an increase in the number of delayed payments in the
portfolio past the average credit period of 90 days, as well as observable changes in national or
local economic conditions that correlate with default on receivables.
For financial assets carried at amortized cost, the amount of the impairment loss recognized is
the difference between the asset’s carrying amount and the present value of estimated future
cash flows, discounted at the financial asset’s original effective interest rate.
For financial assets measured at amortized cost, if, in a subsequent period, the amount of the
impairment loss decreases and the decrease can be related objectively to an event occurring after
the impairment was recognized, the previously recognized impairment loss is reversed through
profit or loss to the extent that the carrying amount of the investment at the date the impairment
is reversed does not exceed what the amortized cost would have been had the impairment not
been recognized.
For available-for-sale equity investments, a significant or prolonged decline in the fair value of
the security below its cost is considered to be objective evidence of impairment.
For all other financial assets, objective evidence of impairment could include significant
financial difficulty of the issuer or counterparty, breach of contract, such as a default or
delinquency in interest or principal payments, it becoming probable that the borrower will enter
bankruptcy or financial re-organization, or the disappearance of an active market for that
financial asset because of financial difficulties.
When an available-for-sale financial asset is considered to be impaired, cumulative gains or
losses previously recognized in other comprehensive income are reclassified to profit or loss in
the period.
In respect of available-for-sale equity securities, impairment loss previously recognized in profit
or loss is not reversed through profit or loss. Any increase in fair value subsequent to an
impairment loss is recognized in other comprehensive income. In respect of available-for-sale
debt securities, the impairment loss is subsequently reversed through profit or loss if an increase
in the fair value of the investment can be objectively related to an event occurring after the
recognition of the impairment loss.

- 27 -
The carrying amount of the financial asset is reduced by the impairment loss directly for all
financial assets with the exception of trade receivables, where the carrying amount is reduced
through the use of an allowance account. When trade receivables are considered uncollectible,
they are written off against the allowance account. Subsequent recoveries of amounts
previously written off are credited against the allowance account. Changes in the carrying
amount of the allowance account are recognized in profit or loss except for uncollectible trade
receivables that are written off against the allowance account.
c) Derecognition of financial assets
The Company derecognizes a financial asset only when the contractual rights to the cash flows
from the asset expire, or when it transfers the financial asset and substantially all the risks and
rewards of ownership of the asset to another party.
On derecognition of a financial asset in its entirety, the difference between the asset’s carrying
amount and the sum of the consideration received and receivable and the cumulative gain or
loss that had been recognized in other comprehensive income is recognized in profit or loss.
2) Equity instruments
Debt and equity instruments issued by the Company are classified as either financial liabilities or as
equity in accordance with the substance of the contractual arrangements and the definitions of a
financial liability and an equity instrument.
Equity instruments issued by the Company are recognized at the proceeds received, net of direct
issue costs.
Repurchase of the Company’s own equity instruments is recognized in and deducted directly from
equity. No gain or loss is recognized in profit or loss on the purchase, sale, issue or cancellation of
the Company’s own equity instruments.
3) Financial liabilities
a) Subsequent measurement
Except the following situation, all the financial liabilities are measured at amortized cost using
the effective interest method:
Financial liabilities at fair value through profit or loss
Financial liabilities are classified as at fair value through profit or loss when the financial
liability is either held for trading or is designated as at fair value through profit or loss.
Financial liabilities held for trading are stated at fair value, with any gain or loss arising on
remeasurement recognized in profit or loss. The net gain or loss recognized in profit or loss
incorporates any interest or dividend paid on the financial liability. Fair value is determined in
the manner described in Note 25.
b) Derecognition of financial liabilities
The difference between the carrying amount of the financial liability derecognized and the
consideration paid, including any non-cash assets transferred or liabilities assumed, is
recognized in profit or loss.

- 28 -
4) Derivative financial instruments
The Company enters into forward contracts to manage its exposure to foreign exchange rate risks.
Derivatives are initially recognized at fair value at the date the derivative contracts are entered into
and are subsequently remeasured to their fair value at the end of each reporting period. The
resulting gain or loss is recognized in profit or loss immediately unless the derivative is designated
and effective as a hedging instrument, in which event the timing of the recognition in profit or loss
depends on the nature of the hedge relationship. When the fair value of derivative financial
instruments is positive, the derivative is recognized as a financial asset; when the fair value of
derivative financial instruments is negative, the derivative is recognized as a financial liability.
n. Provisions
Provisions are measured at the best estimate of the discounted cash flows of the consideration required
to settle the present obligation at the end of the reporting period, taking into account the risks and
uncertainties surrounding the obligation. When a provision is measured using the cash flows
estimated to settle the present obligation, its carrying amount is the present value of those cash flows.
Provisions for the expected cost of warranty obligations are recognized at the date of sale of the relevant
products at the best estimate by the management of the Company of the expenditure required to settle
the Company’s obligation.
o. Revenue recognition
Revenue is measured at the fair value of the consideration received or receivable. Revenue is reduced
for estimated customer returns, rebates and other similar allowances. Allowance for sales returns and
liability for returns are recognized at the time of sale based on the seller’s reliable estimate of future
returns and based on past experience and other relevant factors.
1) Sale of goods
Revenue from the sale of goods is recognized when all the following conditions are satisfied:
a) The Company has transferred to the buyer the significant risks and rewards of ownership of the
goods;
b) The Company retains neither continuing managerial involvement to the degree usually
associated with ownership nor effective control over the goods sold;
c) The amount of revenue can be measured reliably;
d) It is probable that the economic benefits associated with the transaction will flow to the
Company; and
e) The costs incurred or to be incurred in respect of the transaction can be measured reliably.
The Company does not recognize sales revenue on materials delivered to subcontractors because
this delivery does not involve a transfer of risks and rewards of materials ownership.
2) Rendering of services
Service income is recognized when services are provided.
Revenue from a contract to provide services is recognized by reference to the stage of completion of
the contract.

- 29 -
3) Royalties
Royalty revenue is recognized on an accrual basis in accordance with the substance of the relevant
agreement provided that it is probable that the economic benefits will flow to the Company and the
amount of revenue can be measured reliably. Royalties determined on a time basis are recognized
on a straight-line basis over the period of the agreement. Royalty arrangements that are based on
production, sales and other measures are recognized by reference to the underlying arrangement.
4) Dividend and interest income
Dividend income from investments is recognized when the shareholder’s right to receive payment
has been established provided that it is probable that the economic benefits will flow to the
Company and the amount of income can be measured reliably.
Interest income from a financial asset is recognized when it is probable that the economic benefits
will flow to the Company and the amount of income can be measured reliably. Interest income is
accrued on a time basis, by reference to the principal outstanding and at the applicable effective
interest rate.
p. Leasing
Leases are classified as finance leases whenever the terms of the lease transfer substantially all the risks
and rewards of ownership to the lessee. All other leases are classified as operating leases.
1) The Company as lessor
Rental income from operating leases is recognized on a straight-line basis over the term of the
relevant lease. Initial direct costs incurred in negotiating and arranging an operating lease are
added to the carrying amount of the leased asset and amortized on a straight-line basis over the lease
term.
2) The Company as lessee
Operating lease payments are recognized as an expense on a straight-line basis over the lease term.
q. Employee benefits
1) Short-term employee benefits
Liabilities recognized in respect of short-term employee benefits are measured at the undiscounted
amount of the benefits expected to be paid in exchange for the related service.
2) Retirement benefits
Payments to defined contribution retirement benefit plans are recognized as an expense when
employees have rendered service entitling them to the contributions.
Defined benefit costs (including service cost, net interest and remeasurement) under defined benefit
retirement benefit plans are determined using the projected unit credit method. Service cost
(including current service cost, and past service cost) are recognized as employee benefits expense
in the period they occur, or when the plan amendment or curtailment occurs. Remeasurement,
comprising actuarial gains and losses, (the effect of the changes to the asset ceiling) and the return
on plan assets (excluding interest), is recognized in other comprehensive income in the period in
which it occurs. Remeasurement recognized in other comprehensive income is reflected
immediately in retained earnings and will not be reclassified to profit or loss.

- 30 -
Net defined benefit liability (asset) represents the actual deficit (surplus) in the Company’s defined
benefit plan. Any surplus resulting from this calculation is limited to the present value of any
refunds from the plans or reductions in future contributions to the plans.
r. Employee share options
Employee share options granted to employee and others providing similar services.
The fair value at the grant date of the employee share options is expensed on a straight-line basis over
the vesting period, based on the Company’s best estimate of the number of shares or options that are
expected to ultimately vest, with a corresponding increase in capital surplus - employee share options.
It is recognized as an expense in full at the grant date if vesting immediately.
At the end of each reporting period, the Company revises its estimate of the number of employee share
options expected to vest. The impact of the revision of the original estimates is recognized in profit or
loss such that the cumulative expense reflects the revised estimate, with a corresponding adjustment to
the capital surplus - employee share options.
s. Taxation
Income tax expense represents the sum of the tax currently payable and deferred tax.
1) Current tax
According to the Income Tax Law, an additional tax at 10% of unappropriated earnings is provided
for as income tax in the year the shareholders approve to retain the earnings.
Adjustments of prior years’ tax liabilities are added to or deducted from the current year’s tax
provision.
2) Deferred tax
Deferred tax is recognized on temporary differences between the carrying amounts of assets and
liabilities and the corresponding tax bases used in the computation of taxable profit.
Deferred tax liabilities are generally recognized for all taxable temporary differences. Deferred tax
assets are generally recognized for all deductible temporary differences, unused loss carry forward
and unused tax credits for purchases of machinery, equipment and technology, research and
development expenditures, and personnel training expenditures to the extent that it is probable that
taxable profits will be available against which those deductible temporary differences can be
utilized.
Deferred tax liabilities are recognized for taxable temporary differences associated with investments
in subsidiaries and associates, except where the Company is able to control the reversal of the
temporary difference and it is probable that the temporary difference will not reverse in the
foreseeable future. Deferred tax assets arising from deductible temporary differences associated
with such investments and interests are only recognized to the extent that it is probable that there
will be sufficient taxable profits against which to utilize the benefits of the temporary differences
and they are expected to reverse in the foreseeable future.
The carrying amount of deferred tax assets is reviewed at the end of each reporting period and
reduced to the extent that it is no longer probable that sufficient taxable profits will be available to
allow all or part of the asset to be recovered. A previously unrecognized deferred tax asset is also
reviewed at the end of each reporting period and recognized to the extent that it has become
probable that future taxable profit will allow the deferred tax asset to be recovered.

- 31 -
Deferred tax liabilities and assets are measured at the tax rates that are expected to apply in the
period in which the liability is settled or the asset realized, based on tax rates (and tax laws) that
have been enacted or substantively enacted by the end of the reporting period. The measurement
of deferred tax liabilities and assets reflects the tax consequences that would follow from the
manner in which the Company expects, at the end of the reporting period, to recover or settle the
carrying amount of its assets and liabilities.
3) Current and deferred tax for the year
Current and deferred tax are recognized in profit or loss, except when they relate to items that are
recognized in other comprehensive income or directly in equity, in which case, the current and
deferred taxes are also recognized in other comprehensive income or directly in equity, respectively.
5. CRITICAL ACCOUNTING JUDGMENTS AND KEY SOURCES OF ESTIMATION
UNCERTAINTY
In the application of the Company’s accounting policies, management is required to make judgments,
estimates and assumptions about the carrying amounts of assets and liabilities that are not readily apparent
from other sources. The estimates and associated assumptions are based on historical experience and
other factors that are considered relevant. Actual results may differ from these estimates.
The estimates and underlying assumptions are reviewed on an ongoing basis. Revisions to accounting
estimates are recognized in the period in which the estimate is revised if the revision affects only that period
or in the period of the revision and future periods if the revision affects both current and future periods.
Impairment assessment of investments accounted for using the equity method
Determining whether the goodwill included in the investments in subsidiaries is impaired requires an
estimation of the value in use of the cash-generating units which are expected to benefit from the synergies
of the combination and to which the goodwill has been allocated since the acquisition date. The
calculation of the value in use requires management to estimate the future cash flows expected to arise from
the cash-generating units and a suitable discount rate in order to calculate the present value. Where the
actual future cash flows are less than expected, a material impairment loss may arise.
6. CASH AND CASH EQUIVALENTS
December 31
2016 2015
Cash on hand $ 325 $ 325
Checking accounts and demand deposits 2,007,922 814,968
$ 2,008,247 $ 815,293
The market rate intervals of cash in bank at the end of the reporting period were as follows:
December 31
2016 2015
Demand deposits 0.0001%-0.35% 0.001%-0.300%

- 32 -
7. FINANCIAL INSTRUMENTS AT FAIR VALUE THROUGH PROFIT OR LOSS
December 31
2016 2015
Financial assets at held for trading - current
Forward exchange contracts $ 34,348 $ 7,391
Financial liabilities held for trading - current
Forward exchange contracts $ 8,845 $ 6,352
At the end of the reporting period, outstanding forward exchange contracts not under hedge accounting
were as follows:
Currency Maturity Date
Notional Amount
(In Thousands)
December 31, 2016
Sell EUR/NTD 2017.01-2017.05 EUR5,500/NTD192,863
EUR/USD 2017.01-2017.05 EUR8,500/USD9,451
USD/NTD 2017.01-2017.04 USD8,414/NTD266,779
JPY/NTD 2017.01-2017.06 JPY430,000/NTD128,601
RMB/NTD 2017.01-2017.03 RMB83,000/NTD380,318
December 31, 2015
Sell EUR/NTD 2016.01-2016.04 EUR5,000/NTD179,073
EUR/USD 2016.01-2016.04 EUR6,500/USD7,102
USD/NTD 2016.01-2016.02 USD1,499/NTD49,190
JPY/NTD 2016.01-2016.05 JPY200,000/NTD53,236
JPY/USD 2016.01-2016.05 JPY70,000/USD582
RMB/NTD 2016.01-2016.03 RMB64,000/NTD321,201
RMB/USD 2016.01-2016.02 RMB15,000/USD2,323
The Company entered into forward exchange contracts during the years ended December 31, 2016 and
2015 to manage exposures due to exchange rate fluctuations of foreign-currency denominated assets and
liabilities. The Company’s financial hedging strategy is to minimize risks due to market price fluctuations
and cash flows; however, because these contracts did not meet the criteria for hedge effectiveness, they
were not subject to hedge accounting.
8. AVAILABLE-FOR-SALE FINANCIAL ASSETS
December 31
2016 2015
Current
Domestic investments
Mutual funds $ 700,269 $ -
Noncurrent
Domestic investments
Quoted shares $ 1,694,801 $ 1,700,814

- 33 -
For its securities borrowing and lending transactions, the Company placed some of its quoted domestic
stocks, recorded under available-for-sale assets - noncurrent, in a trust at Chinatrust Commercial Bank.
As of December 31, 2016 and 2015, the stocks held in trust amounted to $1,257,600 thousand and
$1,276,400 thousand, respectively. Refer to Table 3 for more information. On the transactions, the
Company recognized gains of $53 thousand and $235 thousand during the years ended December 31, 2016
and 2015, respectively. These gains were recorded under other nonoperating income.
9. NOTES AND TRADE RECEIVABLES
December 31
2016 2015
Notes receivable (include related parties) $ 67,223 $ 55,480
Trade receivable $ 1,560,620 $ 1,156,139
Less: Allowance for impairment loss (17,016) (20,899)
$ 1,543,604 $ 1,135,240
Trade Receivables
The average credit period of sales of goods was from 30 to 90 days. In determining the recoverability of a
trade receivable, the Company considered any change in the credit quality of the trade receivable since the
date credit was initially granted to the end of the reporting period. The Company recognized an allowance
for impairment loss of 100% against all receivables over 1 year because historical experience had been that
receivables that are past due beyond 1 year are not recoverable. Allowance for impairment loss were
recognized against trade receivables between 90 days and 1 year based on estimated irrecoverable amounts
determined by reference to past default experience of the counterparties and an analysis of their current
financial positions.
For the trade receivables balances that were past due at the end of the reporting period, the Company did
not recognize an allowance for impairment loss, because there was not a significant change in credit quality
and the amounts were still considered recoverable. The Company did not hold any collateral or other
credit enhancements for these balances.
The aging of receivables was as follows:
December 31
2016 2015
Not overdue $ 1,404,166 $ 968,470
Overdue
1 to 90 days 140,291 177,970
91 to 360 days 1,873 2,060
Over 360 days 14,290 7,639
$ 1,560,620 $ 1,156,139
The above aging schedule was based on the past due days from end of credit term.

- 34 -
The aging of receivables that were past due but not impaired was as follows:
December 31
2016 2015
1 to 30 days $ 124,761 $ 141,583
31 to 60 days 9,590 12,722
61 to 90 days 5,940 11,681
$ 140,291 $ 165,986
The above aging schedule was based on the past due days from end of credit term.
The movements of the allowance for doubtful trade receivables were as follows:
Individually
Assessed for
Impairment
Collectively
Assessed for
Impairment Total
Balance at January 1, 2015 $ 19,802 $ 3,330 $ 23,132
Less: Impairment losses recognized on
receivables (2,203) - (2,203)
Less: Amounts written off during the year as
uncollectible (30) - (30)
Balance at December 31, 2015 $ 17,569 $ 3,330 $ 20,899
Balance at January 1, 2016 $ 17,569 $ 3,330 $ 20,899
Plus: Impairment losses recognized on
receivables 96 - 96
Less: Amounts written off during the year as
uncollectible (3,979) - (3,979)
Balance at December 31, 2016 $ 13,686 $ 3,330 $ 17,016
The Company recognized impairment losses of $1,432 thousand both on trade receivables as of December
31, 2016 and 2015.
These amounts mainly related to customers that were in liquidation or in severe financial difficulties. The
Company did not hold any collateral over these balances.
10. INVENTORIES
December 31
2016 2015
Finished goods $ 707,014 $ 673,949
Work in process 462,358 351,292
Raw materials 732,715 637,327
Inventories in transit 33,786 10,588
$ 1,935,873 $ 1,673,156
The cost of inventories recognized as cost of goods sold for the years ended December 31, 2016 and 2015
was $21,532,273 thousand and $20,644,285 thousand, respectively.

- 35 -
The costs of inventories were decreased by $89,589 thousand and $107,604 thousand as of December 31,
2016 and 2015, respectively, when stated at the lower of cost or net realizable values.
11. INVESTMENTS ACCOUNTED FOR USING THE EQUITY METHOD
December 31
2016 2015
Investments in subsidiaries $ 14,626,539 $ 12,678,469
Investments in associates 582,300 459,756
$ 15,208,839 $ 13,138,225
a. Investments in subsidiaries
December 31
2016 2015
Unlisted companies
Advantech Automation Corp. (BVI) (AAC (BVI)) $ 4,021,994 $ 3,735,761
Advantech Technology Co., Ltd. (ATC) 3,243,871 3,626,645
Advantech Corporate Investment 1,639,126 1,558,953
Advannixs Corp. (formerly Advansus Corp.) 979,563 999,983
Advantech Europe Holding B.V. (AEUH) 864,191 898,536
Advantech-LNC Technology Co., Ltd. (ALTC) 493,481 516,626
AdvanPOS Technology Co., Ltd. (AdvanPOS) 577,260 358,662
ACA Digital Corp. (ACA) (Note 1) - 319,859
Advantech KR Co., Ltd. (AKR) 228,407 202,503
Advantech Japan Co., Ltd. (AJP) 218,331 179,407
Advantech Co. Singapore Pte, Ltd. (ASG) 72,186 82,906
Advantech iFactory Co., Ltd. (Note 2) - 60,088
Advantech Brasil Ltda. (ABR) 75,531 48,320
Advantech Co. Malaysia Sdn. Bhd. (AMY) 45,752 36,439
Advantech Australia Pty Ltd. (AAU) 34,737 30,171
Advantech Industrial Computing India Private Limited (AIN) 1,663 13,479
Advantech Innovative Design Co., Ltd. 9,633 8,569
Advantech Electronics, S. De R. L. Dec. V. (AMX) 594 1,562
BEMC Holdings Corporation (BEMC) 1,959,805 -
Advantech Intelligent Service (AiST) (Note 3) 160,414 -
$ 14,626,539 $ 12,678,469
Note 1: In 2016, ACA was merged by AdvanPOS and ACA ceased to exist.
Note 2: In 2016, Advantech iFactory Co., Ltd. was liquidated.
Note 3: Due to the adjustment of investment structure, the Company directly acquired 100% share
equity of AiST from Advantech Investment Corporate.

- 36 -
As the end of the reporting period, the Company’s percentage of ownership and voting rights in its
investees were as follows:
December 31
2016 2015
AAC (BVI) 100.00% 100.00%
ATC 100.00% 100.00%
Advantech Corporate Investment 100.00% 100.00%
Advanixs Corporation (formerly Advansus Corp.) 100.00% 100.00%
AEUH 100.00% 100.00%
ALTC (Note 22) 81.17% 89.93%
AdvanPOS (Note 22) 100.00% 100.00%
ACA - 100.00%
AKR 100.00% 100.00%
AJP 100.00% 100.00%
ASG 100.00% 100.00%
Advantech iFactory Co., Ltd. - 100.00%
ABR 80.00% 80.00%
AMY 100.00% 100.00%
AAU 100.00% 100.00%
AIN 99.99% 99.99%
Advantech Innovative Design Co., Ltd. 100.00% 100.00%
AMX 100.00% 100.00%
BEMC (Note 21) 60.00% -
AiST 100.00% -
Refer to Note 26 to the consolidation financial statements of the year ended December 31, 2016 for the
disclosures of the Company’s acquisitions of B+B.
The financial statements used as basis for calculating investments accounted for by the equity method
and the share of profit or loss and other comprehensive income of those investments have been audited,
except those of AIN, AMX, Advantech Innovative Design Co., Ltd. and Advantech iFactory Co., Ltd.
(liquidated in 2016). Management believes there would have been no material impact on the equity
method accounting or the calculation of the share of profit or loss and other comprehensive income had
the financial statements of the above subsidiaries been audited.
The investments in subsidiaries accounted for by the equity method and the share of profit or loss and
other comprehensive income of those investments for the years ended December 31, 2016 and 2015
was based on the subsidiaries’ financial statements audited by the auditors for the same years.
b. Investments in associates
December 31
2016 2015
Listed companies
Axiomtek Co., Ltd. $ 464,155 $ 450,246
Unlisted companies
AIMobile Co., Ltd. (AIMobile) 109,241 -
Jan Hsiang Electronics Co., Ltd. (Jan Hsiang) 8,904 9,510
$ 582,300 $ 459,756
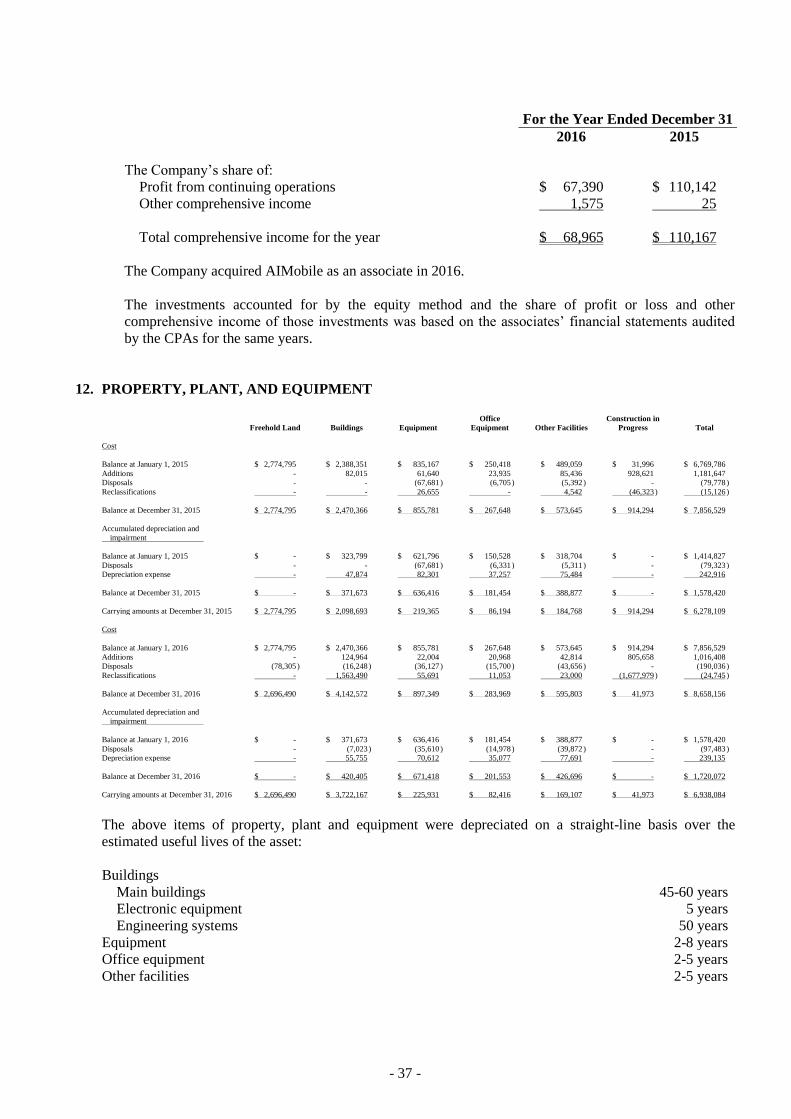
- 37 -
For the Year Ended December 31
2016 2015
The Company’s share of:
Profit from continuing operations $ 67,390 $ 110,142
Other comprehensive income 1,575 25
Total comprehensive income for the year $ 68,965 $ 110,167
The Company acquired AIMobile as an associate in 2016.
The investments accounted for by the equity method and the share of profit or loss and other
comprehensive income of those investments was based on the associates’ financial statements audited
by the CPAs for the same years.
12. PROPERTY, PLANT, AND EQUIPMENT
Freehold Land Buildings Equipment
Office
Equipment Other Facilities
Construction in
Progress Total
Cost
Balance at January 1, 2015 $ 2,774,795 $ 2,388,351 $ 835,167 $ 250,418 $ 489,059 $ 31,996 $ 6,769,786
Additions - 82,015 61,640 23,935 85,436 928,621 1,181,647
Disposals - - (67,681 ) (6,705 ) (5,392 ) - (79,778 )
Reclassifications - - 26,655 - 4,542 (46,323 ) (15,126 )
Balance at December 31, 2015 $ 2,774,795 $ 2,470,366 $ 855,781 $ 267,648 $ 573,645 $ 914,294 $ 7,856,529
Accumulated depreciation and
impairment
Balance at January 1, 2015 $ - $ 323,799 $ 621,796 $ 150,528 $ 318,704 $ - $ 1,414,827
Disposals - - (67,681 ) (6,331 ) (5,311 ) - (79,323 )
Depreciation expense - 47,874 82,301 37,257 75,484 - 242,916
Balance at December 31, 2015 $ - $ 371,673 $ 636,416 $ 181,454 $ 388,877 $ - $ 1,578,420
Carrying amounts at December 31, 2015 $ 2,774,795 $ 2,098,693 $ 219,365 $ 86,194 $ 184,768 $ 914,294 $ 6,278,109
Cost
Balance at January 1, 2016 $ 2,774,795 $ 2,470,366 $ 855,781 $ 267,648 $ 573,645 $ 914,294 $ 7,856,529
Additions - 124,964 22,004 20,968 42,814 805,658 1,016,408
Disposals (78,305 ) (16,248 ) (36,127 ) (15,700 ) (43,656 ) - (190,036 )
Reclassifications - 1,563,490 55,691 11,053 23,000 (1,677,979 ) (24,745 )
Balance at December 31, 2016 $ 2,696,490 $ 4,142,572 $ 897,349 $ 283,969 $ 595,803 $ 41,973 $ 8,658,156
Accumulated depreciation and
impairment
Balance at January 1, 2016 $ - $ 371,673 $ 636,416 $ 181,454 $ 388,877 $ - $ 1,578,420
Disposals - (7,023 ) (35,610 ) (14,978 ) (39,872 ) - (97,483 )
Depreciation expense - 55,755 70,612 35,077 77,691 - 239,135
Balance at December 31, 2016 $ - $ 420,405 $ 671,418 $ 201,553 $ 426,696 $ - $ 1,720,072
Carrying amounts at December 31, 2016 $ 2,696,490 $ 3,722,167 $ 225,931 $ 82,416 $ 169,107 $ 41,973 $ 6,938,084
The above items of property, plant and equipment were depreciated on a straight-line basis over the
estimated useful lives of the asset:
Buildings
Main buildings 45-60 years
Electronic equipment 5 years
Engineering systems 50 years
Equipment 2-8 years
Office equipment 2-5 years
Other facilities 2-5 years

- 38 -
13. GOODWILL
December 31
2016 2015
Cost
Balance at January 1 $ 111,599 $ 111,599
Balance at December 31 $ 111,599 $ 111,599
14. OTHER LIABILITIES
December 31
2016 2015
Other payables
Salaries or bonuses $ 1,840,482 $ 1,753,360
Payable for royalties 179,207 105,186
Payable for annual leave 36,701 25,650
Others (Note) 642,984 371,719
$ 2,699,374 $ 2,255,915
Note: Including construction payables, accruals of litigation, marketing expenses, and freight expenses.
15. RETIREMENT BENEFIT PLANS
a. Defined contribution plans
The Company adopted a pension plan under the Labor Pension Act (“LPA”), which is a state-managed
defined contribution plan. Under the LPA, an entity makes monthly contributions to employees’
individual pension accounts at 6% of monthly salaries and wages.
b. Defined benefit plans
The defined benefit plan adopted by the Company in accordance with the Labor Standards Law is
operated by the government. Pension benefits are calculated on the basis of the length of service and
average monthly salaries of the six months before retirement. The Company contribute amounts equal
to 2% of total monthly salaries and wages to a pension fund administered by the pension fund
monitoring committee. Pension contributions are deposited in the Bank of Taiwan in the committee’s
name. Before the end of each year, the Company assesses the balance in the pension fund. If the
amount of the balance in the pension fund is inadequate to pay retirement benefits for employees who
conform to retirement requirements in the next year, the Company is required to fund the difference in
one appropriation that should be made before the end of March of the next year. The pension fund is
managed by the Bureau of Labor Funds, Ministry of Labor (“the Bureau”); the Company has no right to
influence the investment policy and strategy.

- 39 -
The amounts included in the balance sheets in respect of the Company’s defined benefit plans were as
follows:
December 31
2016 2015
Present value of defined benefit obligation $ 343,036 $ 327,854
Fair value of plan assets (131,866) (145,682)
Deficit 211,170 182,172
Net defined benefit liability $ 211,170 $ 182,172
Movements in net defined benefit liability were as follows:
Present Value
of the Defined
Benefit
Obligation
Fair Value of
the Plan Assets
Net Defined
Benefit
Liability (Asset)
Balance at January 1, 2015 $ 308,456 $ (144,207) $ 164,249
Service cost
Current service cost 2,344 - 2,344
Past service cost 1,340 - 1,340
Net interest expense (income) 5,784 (2,774) 3,010
Recognized in profit or loss 9,468 (2,774) 6,694
Remeasurement
Return on plan assets (excluding amounts
included in net interest) - (1,019) (1,019)
Actuarial (gain) loss - changes in
demographic assumptions 12,031 - 12,031
Actuarial (gain) loss - changes in financial
assumptions 9,903 - 9,903
Actuarial (gain) loss - experience
adjustments (2,179) - (2,179)
Recognized in other comprehensive income 19,755 (1,019) 18,736
Contributions from the employer - (7,507) (7,507)
Benefits paid (9,825) 9,825 -
Balance at December 31, 2015 327,854 (145,682) 182,172
Service cost
Current service cost 2,645 - 2,645
Net interest expense (income) 5,328 (2,429) 2,899
Recognized in profit or loss 7,973 (2,429) 5,544
Remeasurement
Return on plan assets (excluding amounts
included in net interest) - 1,402 1,402
Actuarial (gain) loss - changes in
demographic assumptions 8,515 - 8,515
Actuarial (gain) loss - changes in financial
assumptions 10,487 - 10,487
Actuarial (gain) loss - experience
adjustments 10,635 - 10,635
Recognized in other comprehensive income 29,637 1,402 31,039
Contributions from the employer - (7,585) (7,585)
Benefits paid (22,428) 22,428 -
Balance at December 31, 2016 $ 343,036 $ (131,866) $ 211,170

- 40 -
An analysis by function of the amounts recognized in profit or loss in respect of the defined benefit
plans is as follows:
For the Year Ended December 31
2016 2015
Operating costs $ 1,230 $ 1,075
Selling and marketing expenses 868 838
General and administrative expenses 1,010 2,368
Research and development expenses 1,954 1,963
$ 5,062 $ 6,244
Through the defined benefit plans under the Labor Standards Law, the Company is exposed to the
following risks:
1) Investment risk: The plan assets are invested in domestic/and foreign/equity and debt securities,
bank deposits, etc. The investment is conducted at the discretion of the Bureau or under the
mandated management. However, in accordance with relevant regulations, the return generated by
plan assets should not be below the interest rate for a 2-year time deposit with local banks.
2) Interest risk: A decrease in the bond interest rate will increase the present value of the defined
benefit obligation; however, this will be partially offset by an increase in the return on the plan’s
debt investments.
3) Salary risk: The present value of the defined benefit obligation is calculated by reference to the
future salaries of plan participants. As such, an increase in the salary of the plan participants will
increase the present value of the defined benefit obligation.
The actuarial valuations of the present value of the defined benefit obligation were carried out by
qualified actuaries. The significant assumptions used for the purposes of the actuarial valuations were
as follows:
December 31
2016 2015
Discount rate(s) 1.375% 1.625%
Expected rate(s) of salary increase 3.250% 3.250%
If possible reasonable change in each of the significant actuarial assumptions will occur and all other
assumptions will remain constant, the present value of the defined benefit obligation would
decrease/increase as follows:
December 31
2016 2015
Discount rate(s)
0.25% increase $ (10,694) $ (10,254)
0.25% decrease $ 11,160 $ 10,705
Expected rate(s) of salary increase
0.25% increase $ 10,775 $ 10,360
0.25% decrease $ (10,384) $ (9,980)

- 41 -
The sensitivity analysis presented above may not be representative of the actual change in the present
value of the defined benefit obligation as it is unlikely that the change in assumptions would occur in
isolation of one another as some of the assumptions may be correlated.
December 31
2016 2015
The expected contributions to the plan for the next year $ 7,601 $ 7,563
The average duration of the defined benefit obligation 12.7 years 12.8 years
16. EQUITY
a. Share capital
Ordinary shares
December 31
2016 2015
Number of shares authorized (in thousands) 800,000 800,000
Amount of shares authorized $ 8,000,000 $ 8,000,000
Number of shares issued and fully paid (in thousands) 633,084 631,853
Amount of shares issued and fully paid $ 6,330,841 $ 6,318,531
Fully paid ordinary shares, which have a par value of NT$10, carry one vote per share and carry a right
to dividends.
For the year ended December 31, 2016, the changes in shares are due to employees’ exercise of their
employee share options.
b. Capital surplus
December 31
2016 2015
May be used to offset a deficit, distributed as cash dividends,
or transferred to share capital (1)
Arising from issuance of common shares $ 3,396,888 $ 3,396,888
Arising from conversion of bonds 931,849 931,849
Arising from the difference between consideration received or
paid and the carrying amount of the subsidiaries’ net assets
during actual disposal or acquisition 17,844 -
May be used to offset a deficit only
Arising from changes in percentage of ownership interest in
subsidiaries (2) 4,246 4,246
Arising from employee share options 1,077,084 792,341
Arising from distribution of stock dividends 78,614 78,614
(Continued)
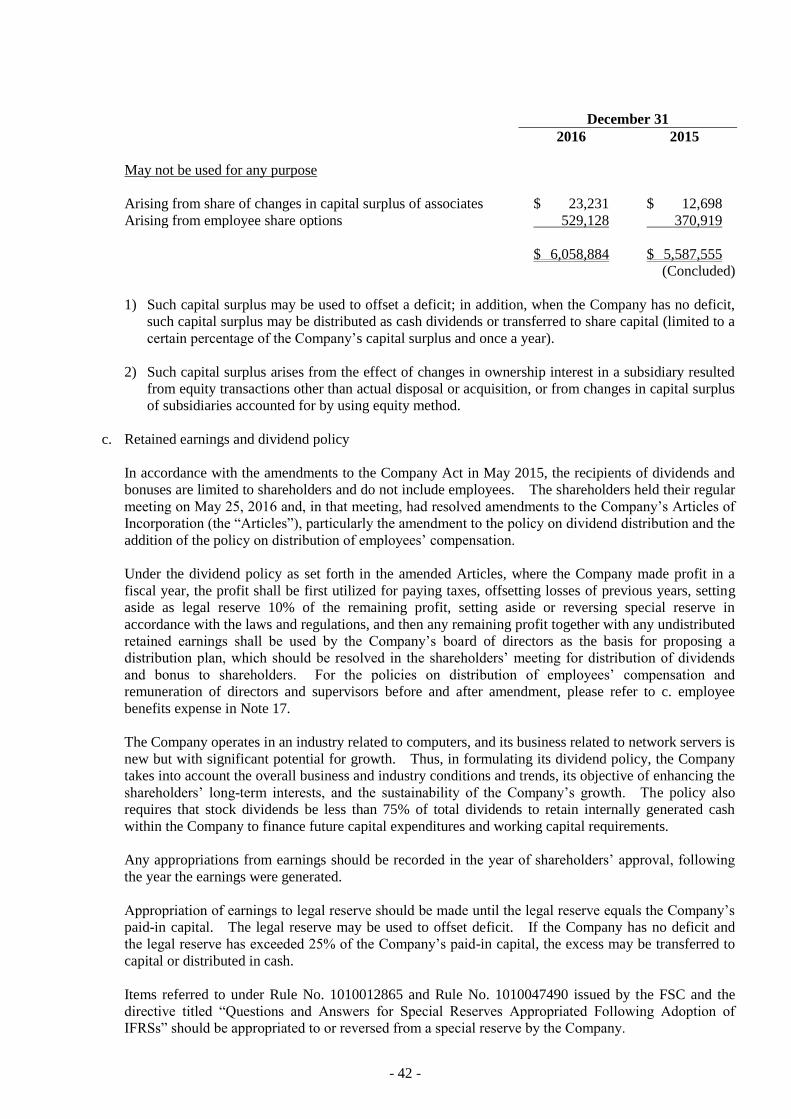
- 42 -
December 31
2016 2015
May not be used for any purpose
Arising from share of changes in capital surplus of associates $ 23,231 $ 12,698
Arising from employee share options 529,128 370,919
$ 6,058,884 $ 5,587,555
(Concluded)
1) Such capital surplus may be used to offset a deficit; in addition, when the Company has no deficit,
such capital surplus may be distributed as cash dividends or transferred to share capital (limited to a
certain percentage of the Company’s capital surplus and once a year).
2) Such capital surplus arises from the effect of changes in ownership interest in a subsidiary resulted
from equity transactions other than actual disposal or acquisition, or from changes in capital surplus
of subsidiaries accounted for by using equity method.
c. Retained earnings and dividend policy
In accordance with the amendments to the Company Act in May 2015, the recipients of dividends and
bonuses are limited to shareholders and do not include employees. The shareholders held their regular
meeting on May 25, 2016 and, in that meeting, had resolved amendments to the Company’s Articles of
Incorporation (the “Articles”), particularly the amendment to the policy on dividend distribution and the
addition of the policy on distribution of employees’ compensation.
Under the dividend policy as set forth in the amended Articles, where the Company made profit in a
fiscal year, the profit shall be first utilized for paying taxes, offsetting losses of previous years, setting
aside as legal reserve 10% of the remaining profit, setting aside or reversing special reserve in
accordance with the laws and regulations, and then any remaining profit together with any undistributed
retained earnings shall be used by the Company’s board of directors as the basis for proposing a
distribution plan, which should be resolved in the shareholders’ meeting for distribution of dividends
and bonus to shareholders. For the policies on distribution of employees’ compensation and
remuneration of directors and supervisors before and after amendment, please refer to c. employee
benefits expense in Note 17.
The Company operates in an industry related to computers, and its business related to network servers is
new but with significant potential for growth. Thus, in formulating its dividend policy, the Company
takes into account the overall business and industry conditions and trends, its objective of enhancing the
shareholders’ long-term interests, and the sustainability of the Company’s growth. The policy also
requires that stock dividends be less than 75% of total dividends to retain internally generated cash
within the Company to finance future capital expenditures and working capital requirements.
Any appropriations from earnings should be recorded in the year of shareholders’ approval, following
the year the earnings were generated.
Appropriation of earnings to legal reserve should be made until the legal reserve equals the Company’s
paid-in capital. The legal reserve may be used to offset deficit. If the Company has no deficit and
the legal reserve has exceeded 25% of the Company’s paid-in capital, the excess may be transferred to
capital or distributed in cash.
Items referred to under Rule No. 1010012865 and Rule No. 1010047490 issued by the FSC and the
directive titled “Questions and Answers for Special Reserves Appropriated Following Adoption of
IFRSs” should be appropriated to or reversed from a special reserve by the Company.

- 43 -
Except for non-ROC resident shareholders, all shareholders receiving the dividends are allowed a tax
credit equal to their proportionate share of the income tax paid by the Company.
The appropriation of earnings, for 2015 and 2014 have been approved in the shareholders’ meetings on
May 25, 2016 and May 28, 2015, respectively, were as follows:
Appropriation of Earnings Dividends Per Share
(NT$)
For the Year Ended
December 31
For the Year Ended
December 31
2015 2014 2015 2014
Legal reserve $ 510,434 $ 490,778 $ - $ -
Cash dividends 3,791,118 3,787,255 6.0 6.0
The appropriations of earnings for 2016 had been proposed by the Company’s board of directors on
March 6, 2017. The appropriations and dividends per share were as follows:
Appropriation
of Earnings
Dividends Per
Share (NT$)
Legal reserve $ 566,686 $ -
Special reserve 85,204 -
Cash dividends 3,988,367 6.3
Share dividends 633,074 1.0
The appropriations of earnings for 2016 are subject to the resolution of the shareholders’ meeting to be
held on May 26, 2017.
d. Other equity items
1) Exchange differences on translating the financial statements of foreign operations
For the Year Ended December 31
2016 2015
Balance at January 1 $ 271,859 $ 338,356
Exchange differences arising on translating the financial
statements of foreign operations (561,518) (82,566)
Related income tax 96,161 13,620
Share of exchange difference of associates accounted for
using the equity method (4,135) 2,449
Balance at December 31 $ (197,633) $ 271,859

- 44 -
2) Unrealized gain or loss from available-for-sale financial assets
For the Year Ended December 31
2016 2015
Balance at January 1 $ 68,265 $ 563,277
Unrealized gain (loss) arising on revaluation of
available-for-sale financial assets (4,334) (358,746)
Cumulative gain reclassified to profit or loss on sale of
available-for-sale financial assets (1,431) (198,848)
Share of unrealized gain (loss) on revaluation of
available-for-sale financial assets of subsidiaries accounted
for using the equity method 49,929 62,582
Balance at December 31 $ 112,429 $ 68,265
17. NET PROFIT AND OTHER COMPREHENSIVE INCOME FROM CONTINUING OPERATIONS
a. Finance costs
For the Year Ended December 31
2016 2015
Interest on loans from related parties $ 3,871 $ -
Interest on short-term bank loans 292 -
$ 4,163 $ -
b. Depreciation and amortization
For the Year Ended December 31
2016 2015
Property, plant and equipment $ 239,135 $ 242,916
Intangible assets 78,294 74,874
$ 317,429 $ 317,790
An analysis of depreciation by function
Operating costs $ 55,527 $ 51,653
Operating expenses 183,608 191,263
$ 239,135 $ 242,916
An analysis of amortization by function
Operating costs $ 277 $ 210
Selling and marketing expenses 13 145
General and administrative expenses 52,694 52,752
Research and development expenses 25,310 21,767
$ 78,294 $ 74,874

- 45 -
c. Employee benefits expense
For the Year Ended December 31
2016 2015
Short-term benefits $ 2,978,334 $ 2,792,674
Post-employment benefits
Defined contribution plans 118,917 115,737
Defined benefit plans (Note 15) 5,062 6,244
123,979 121,981
Share-based payments - equity - settled 338,194 261,877
Other employee benefits 147,018 141,631
Total employee benefits expense $ 3,587,525 $ 3,318,163
An analysis of employee benefits expense by function
Operating costs $ 743,057 $ 685,258
Operating expenses 2,844,468 2,632,905
$ 3,587,525 $ 3,318,163
1) Employees’ compensation and remuneration of directors and supervisors for 2016 and 2015
In compliance with the Company Act as amended in May 2015 and the amended Articles of
Incorporation of the Company approved by the shareholders in their meeting on May 25, 2016, the
Company accrued employees’ compensation at the rates no less than 1% and no higher than 20%,
and remuneration of directors and supervisors at the rates no higher than 1%, of net profit before
income tax, employees’ compensation, and remuneration of directors and supervisors. The
employees’ compensation and remuneration of directors and supervisors for the years ended
December 31, 2016 and 2015 which have been approved by the Company’s board of directors on
March 6, 2017 and March 4, 2016, respectively, were as follows:
For the Year Ended December 31
2016 2015
Cash Cash
Employees’ compensation $ 243,000 $ 200,000
Remuneration of directors and supervisors 12,300 12,000
If there is a change in the amounts after the annual financial statements were authorized for issue,
the differences are recorded as a change in accounting estimate.
There was no difference between the actual amounts of employees’ compensation and remuneration
of directors and supervisors paid and the amounts recognized in the financial statements for the year
ended December 31, 2015.
Information on the employees’ compensation and remuneration of directors and supervisors
resolved by the Company’s board of directors in 2017 and 2016 is available at the Market
Observation Post System website of the Taiwan Stock Exchange.

- 46 -
2) Bonus to employees and remuneration of directors and supervisors for 2014
The bonus to employees and remuneration of directors and supervisors for 2014 which have been
approved in the shareholders’ meeting on May 28, 2015 were as follows:
For the Year
Ended
December 31,
2014
Cash Bonus
Bonus to employees $ 126,000
Remuneration of directors and supervisors 12,000
There was no difference between the amounts of the bonus to employees and the remuneration of
directors and supervisors approved in the shareholders’ meetings on May 28, 2015 and the amounts
recognized in the financial statements for the years ended December 31, 2014.
Information on bonuses to employees and remuneration of directors and supervisors resolved by the
shareholders’ meetings in 2015 is available on the Market Observation Post System website of the
Taiwan Stock Exchange.
d. Gain or loss on foreign currency exchange
For the Year Ended December 31
2016 2015
Foreign exchange gains $ 445,744 $ 603,588
Foreign exchange losses (586,433) (692,447)
$ (140,689) $ (88,859)
18. INCOME TAXES
a. Major components of tax expense recognized in profit or loss
For the Year Ended December 31
2016 2015
Current tax
In respect of the current year $ 738,950 $ 682,972
Income tax on unappropriated earnings 71,661 62,541
Adjustments for prior years 25,838 (77)
836,449 745,436
Deferred tax
In respect of the current year 140,385 23,860
Adjustments for prior years - (1,141)
140,385 22,719
Income tax expense recognized in profit or loss $ 976,834 $ 768,155

- 47 -
A reconciliation of accounting profit and income tax expenses is as follows:
For the Year Ended December 31
2016 2015
Profit before tax $ 6,643,696 $ 5,872,501
Income tax expense calculated at the statutory rate $ 1,129,428 $ 998,325
Tax-exempt income (167,214) (214,892)
Unrecognized deductible temporary differences - (20,742)
Unrecognized investment credits (87,000) (57,000)
Income tax on unappropriated earnings 71,661 62,541
Land value increment tax 4,121 -
Adjustments for prior years’ tax 25,838 (77)
Income tax expense recognized in profit or loss $ 976,834 $ 768,155
The applicable tax rate used above is the corporate tax rate of 17% payable by the Company.
As the status of 2017 appropriations of earnings is uncertain, the potential income tax consequences of
10% income tax rate of 2016 unappropriated earnings are not reliably determinable.
b. Income tax recognized in other comprehensive income
For the Year Ended December 31
2016 2015
Deferred tax
In respect of the current year
Translation of foreign operations $ 96,161 $ 13,620
Remeasurement on defined benefit plan 5,277 3,185
$ 101,438 $ 16,805
c. Current tax assets and liabilities
December 31
2016 2015
Current tax liabilities
Income tax payable $ 1,036,650 $ 853,769

- 48 -
d. Deferred tax assets and liabilities
The movements of deferred tax assets and deferred tax liabilities were as follows:
For the year ended December 31, 2016
Opening
Balance
Recognized in
Profit or Loss
Recognized in
Other
Comprehensive
Income Closing Balance
Deferred tax assets
Temporary differences
Unrealized gross profit $ 56,143 $ (11,147) $ - $ 44,996
Unrealized loss on inventory
write-down 18,293 (3,063) - 15,230
Defined benefit obligation 16,003 (347) - 15,656
Unrealized exchange losses 8,545 (8,545) - -
Donation expense 2,550 (2,550) - -
Unrealized warranty liabilities 7,040 1,316 - 8,356
Exchange difference on foreign
operations - - 40,479 40,479
Remeasurement on defined
benefit plans 6,136 - 5,277 11,413
$ 114,710 $ (24,336) $ 45,756 $ 136,130
Deferred tax liabilities
Temporary differences
Unappropriated earnings of
subsidiaries $ 868,659 $ 113,511 $ - $ 982,170
Exchange difference on foreign
operations 55,682 - (55,682) -
Remeasurement on defined
benefit plan 3,391 - - 3,391
Unrealized exchange gain - 2,538 - 2,538
$ 927,732 $ 116,049 $ (55,682) $ 988,099
For the year ended December 31, 2015
Opening
Balance
Recognized in
Profit or Loss
Recognized in
Other
Comprehensive
Income Closing Balance
Deferred tax assets
Temporary differences
Unrealized gross profit $ 40,938 $ 15,205 $ - $ 56,143
Unrealized loss on inventory
write-down 15,771 2,522 - 18,293
Defined benefit obligation 16,141 (138) - 16,003
Unrealized exchange losses - 8,545 - 8,545
Donation expense - 2,550 - 2,550
(Continued)

- 49 -
Opening
Balance
Recognized in
Profit or Loss
Recognized in
Other
Comprehensive
Income Closing Balance
Unrealized warranty liabilities $ 6,140 $ 900 $ - $ 7,040
Remeasurement on defined
benefit plans 2,951 - 3,185 6,136
$ 81,941 $ 29,584 $ 3,185 $ 114,710
Deferred tax liabilities
Temporary differences
Unappropriated earnings of
subsidiaries $ 807,836 $ 60,823 $ - $ 868,659
Exchange difference on foreign
operations 69,302 - (13,620) 55,682
Remeasurement on defined
benefit plan 3,391 - - 3,391
Unrealized exchange gain 8,520 (8,520) - -
$ 889,049 $ 52,303 $ (13,620) $ 927,732
(Concluded)
e. Integrated income tax
December 31
2016 2015
Unappropriated earnings
Generated on and after January 1, 1998 $ 8,435,785 $ 7,098,449
Shareholder-imputation credit account $ 777,620 $ 608,917
For the Year Ended December 31
2016 (Expected) 2015
Creditable ratio for distribution of earning 18.69% 13.86%
f. Income tax assessments
The Company’s tax returns through 2011 have been assessed by the tax authorities. The Company
disagreed with the tax authorities’ assessment of its 2008 tax returns and applied for reexamination.
Nevertheless, to be conservative, the Company provided for the income tax assessed by the tax
authorities.
19. EARNINGS PER SHARE
Unit: NT$ Per Share
For the Year Ended December 31
2016 2015
Basic earnings per share $ 8.96 $ 8.08
Diluted earnings per share $ 8.90 $ 8.05

- 50 -
The earnings and weighted average number of ordinary shares outstanding in the computation of earnings
per share were as follows:
Net Profit for the Year
For the Year Ended December 31
2016 2015
Earnings used in the computation of basic earnings per share $ 5,666,862 $ 5,104,346
Earnings used in the computation of diluted earnings per share $ 5,666,862 $ 5,104,346
Weighted Average Number of Ordinary Shares Outstanding (In Thousand Shares)
For the Year Ended December 31
2016 2015
Weighted average number of ordinary shares in computation of basic
earnings per share 632,148 631,633
Effect of potentially dilutive ordinary shares:
Employee share option 3,492 1,372
Employees’ compensation 1,168 1,202
Weighted average number of ordinary shares used in the
computation of diluted earnings per share 636,808 634,207
If the Company offered to settle compensation paid to employees in cash or shares, the Company assumed
the entire amount of the compensation would be settled in shares, and the resulting potential shares were
included in the weighted average number of shares outstanding used in the computation of diluted earnings
per share, as the effect is dilutive. Such dilutive effect of the potential shares is included in the
computation of diluted earnings per share until the number of shares to be distributed to employees is
resolved in the following year.
20. SHARE-BASED PAYMENT ARRANGEMENTS
Qualified employees of the Company and its subsidiaries were granted 6,500 options in 2016, 5,000 options
in 2014 and 3,000 options in 2010. Each option entitles the holder to subscribe for one thousand common
shares of the Company. The holders of these shares include employees whom meet certain criteria set by
the Company, from both domestic and overseas subsidiaries in which the Company directly or indirectly
invests over 50%. Options issued in 2016, 2014 and 2010 are valid for six, six and five years,
respectively. All are exercisable at certain percentages after the second anniversary year from the grant
date. Options granted in 2010 had an exercise price equal to the closing price of the Company’s common
shares listed on the grant date, and the exercise prices of those granted in 2016 and 2014 were both NT$100
per share. For any subsequent changes in the Company’s paid-in capital, the exercise price and the
number of options will be adjusted accordingly.

- 51 -
Information on employee share options was as follows:
2016 2015
Employee Share Options
Number of
Options (In
Thousands)
Weighted-
average
Exercise
Price (NT$)
Number of
Options (In
Thousands)
Weighted-
average
Exercise
Price (NT$)
Balance at January 1 5,000 $ 100.00 5,644 $ 94.10
Options granted 6,500 100.00 - -
Options exercised (1,231) 95.10 (644) 47.95
Balance at December 31 10,269 - 5,000 100.00
Options exercisable, end of the year 3,769 95.10 - -
Weighted-average fair value of
options granted (NT$) $ 95.10 $ -
The weighted-average share price at the date of exercise of share options for the years ended December 31,
2016 and 2015 were from NT$204 to NT$269 and from NT$210 to NT$254, respectively.
Information about outstanding options as of December 31, 2016 and 2015 was as follows:
For the Year Ended December 31
2016 2015
Employee Share Options
Exercise Price
(NT$)
Weighted-
average
Remaining
Contractual
Life (Years)
Exercise Price
(NT$)
Weighted-
average
Remaining
Contractual
Life (Years)
Issuance in 2016 $ 100.00 5.45 $ - -
Issuance in 2014 95.10 3.63 $ 100.00 4.63
Options granted were priced using the Black-Scholes model, and the inputs to the model were as follows:
2016 2014 2010
Grant-date share price (NT$) 235 $239.5 $67.4
Exercise price (NT$) 100 $100 $67.4
Expected volatility 31.42-32.48% 28.28%-29.19% 34.11%-35.15%
Expected life (years) 4-5.5 years 4-5.5 years 3.5-4.5 years
Expected dividend yield 0% 0% 0%
Risk-free interest rate 0.52%-0.65% 1.07%-1.30% 0.92%-1.10%
Expected volatility was based on the historical share price volatility over the past five years.
Compensation cost recognized was $338,194 thousand and $261,877 thousand for the years ended
December 31, 2016 and 2015, respectively.

- 52 -
21. ACQUISITION OF SUBSIDIARIES - WITH OBTAINED CONTROL
Principal Activity
Date of
Acquisition
Proportion of
Voting Equity
Interests
Acquired (%)
Consideration
Transferred
B+B SmartWorx, Inc.
(Note)
Sale of industrial
network
communications
January 4, 2016 100 $ 3,296,048
Advanixs Kun Shan Corp.
(formerly Yeh-Chiang
Technology Kun Shan
Co., Ltd.)
Production and sale of
industrial automation
products
May 27, 2016 100 $ 459,648
Note: For more information of BEMC, Avtek and B+B and its subsidiaries IMC, Quatech, BBI, B&B
Electronics, B&B DMCC, B+B (CZ) (formerly Conel) and Conel Automation (formerly Softcon),
please refer to Table 8.
To expand the Company’s global brand market in industrial network communications and operations in
China, the Company acquired B+B SmartWorx Inc. and Advanixs Kun Shan Corp. (formerly Yeh-Chiang
Technology Kun Shan Co., Ltd.). For details about the acquisition of B+B SmartWorx Inc. and Advanixs
Kun Shan Corp., please refer to Note 26 to the consolidated financial statements for the year ended
December 31, 2016.
22. PARTIAL ACQUISITION OR DISPOSAL OF SUBSIDIARIES - WITHOUT LOSS OF CONTROL
a. In 2015, the Company subscribed for an additional 6,533 thousand shares of AdvanPOS, increasing the
Company’s equity interest from 84.01% to 100%.
b. In the first and third quarter of 2016, the Company acquired 0.07% and sold 8.83% equity in ALNC,
respectively, decreasing the Company’s equity interest from 89.93% to 81.17%.
c. In the first quarter of 2016, the Company acquired 40% equity in Hanzhou Advantofine Automation
Co., Ltd., increasing the Company’s equity interest from 60% to 100%.
The above transactions were accounted for as equity transactions, since the Company did not cease to have
control over these subsidiaries. For details about the above transactions, please refer to Note 27 to the
consolidated financial statements for the year ended December 31, 2016.
23. OPERATING LEASE ARRANGEMENTS
The Company as Lessee
Operating leases are mainly leases of warehouses with lease term of 1 year. The future minimum lease
payments of non-cancellable operating lease commitments were as follows:
December 31
2016 2015
Not later than 1 year $ 280 $ 5,352

- 53 -
The lease payments recognized in profit or loss for the current year were as follows:
For the Year Ended December 31
2016 2015
Minimum lease payment $ 12,079 $ 15,455
24. CAPITAL MANAGEMENT
The Company manages its capital to ensure it will be able to continue as going concerns while maximizing
the return to stakeholders through the optimization of the debt and equity balance. The Company’s overall
strategy remains unchanged in both 2015 and 2016.
The capital structure of the Company consists of net debt (borrowings offset by cash and cash equivalents)
and equity of the Company (comprising issued capital, reserves, retained earnings and other equity.
The Company is not subject to any externally imposed capital requirements.
Key management personnel of the Company review the capital structure on a quarterly basis. As part of
this review, the key management personnel consider the cost of capital and the risks associated with each
class of capital. Based on recommendations of the key management personnel, in order to balance the
overall capital structure, the Company may adjust the amount of dividends paid to shareholders, the number
of new shares issued, and the amount of new debt issued.
25. FINANCIAL INSTRUMENTS
a. Fair value of financial instruments that are measured at fair value on a recurring basis
1) Fair value hierarchy
December 31, 2016
Level 1 Level 2 Level 3 Total
Financial assets at FVTPL
Derivative financial assets $ - $ 34,348 $ - $ 34,348
Available-for-sale financial
assets
Securities listed in ROC
Equity securities $ 1,694,801 $ - $ - $ 1,694,801
Mutual funds 700,269 - - 700,269
$ 2,395,070 $ - $ - $ 2,395,070
Financial liabilities at FVTPL
Derivative financial liabilities $ - $ 8,845 $ - $ 8,845

- 54 -
December 31, 2015
Level 1 Level 2 Level 3 Total
Financial assets at FVTPL
Derivative financial assets $ - $ 7,391 $ - $ 7,391
Available-for-sale financial
assets
Securities listed in ROC
Equity securities $ 1,700,814 $ - $ - $ 1,700,814
Financial liabilities at FVTPL
Derivative financial liabilities $ - $ 6,352 $ - $ 6,352
There were no transfers between Level 1 and 2 in the current and prior periods.
2) Valuation techniques and inputs applied for the purpose of measuring Level 2 fair value
measurement
Derivatives held by the Company were foreign currency forward contracts, whose fair values were
calculated using discounted cash flow. Future cash flows are estimated based on observable
forward exchange rates at the end of the reporting period and contract forward rates, discounted at a
rate that reflects the credit risk of various counterparties.
b. Categories of financial instruments
December 31
2016 2015
Financial assets
Fair value through profit or loss (FVTPL)
Held for trading $ 34,348 $ 7,391
Loans and receivables (Note 1) 7,652,453 6,112,664
Available-for-sale financial assets 2,395,070 1,700,814
Financial liabilities
Fair value through profit or loss (FVTPL)
Held for trading 8,845 6,352
Measured at amortized cost (Note 2) 6,860,985 5,842,525
Note 1: The balances included loans and receivables measured at amortized cost, which comprise cash
and cash equivalents, note receivables, trade receivables, trade receivables from related
parties, and other receivables (including those due from related parties).
Note 2: The balances included financial liabilities measured at amortized cost, which comprise trade
and other payables (including those to related parties).

- 55 -
c. Financial risk management objectives and policies
The Company’s major financial instruments include equity investments, trade receivables and trade
payables. The Company’s Corporate Treasury function provides services to the business, coordinates
access to domestic and international financial markets, monitors and manages the financial risks
relating to the operations of the Company through internal risk reports which analyze exposures by
degree and magnitude of risks. These risks include market risk (including currency risk, interest rate
risk and other price risk), credit risk and liquidity risk.
The Company sought to minimize the effects of these risks by using derivative financial instruments to
hedge risk exposures. The use of financial derivatives was governed by the Company’s policies
approved by the board of directors, which provided written principles on foreign exchange risk, interest
rate risk, credit risk, the use of financial derivatives and non-derivative financial instruments, and the
investment of excess liquidity. Compliance with policies and exposure limits was reviewed by the
internal auditors on a continuous basis. The Company did not enter into or trade financial instrument,
including derivative financial instruments, for speculative purposes.
The Corporate Treasury function reports quarterly to the board of directors on the Company’s current
derivative instrument management.
1) Market risk
The Company’s activities exposed it primarily to financial risks of changes in foreign currency
exchange rates (see (a) below) and interest rates (see (b) below). The Company entered into a
variety of derivative financial instruments to manage its exposure to foreign currency risk and
interest rate risk.
There had been no change to the Company’s exposure to market risks or the manner in which these
risks were managed and measured.
a) Foreign currency risk
The Company undertook operating activities and investment of foreign operations denominated
in foreign currencies, which exposed the Company to foreign currency risk. The Company’s
forward exchange contracts are used to minimize risks of market price and fluctuations in cash
flows; however, because these contracts did not meet the criteria for hedge effectiveness, they
were not subject to hedge accounting.
The maturities of the Company’s forward contracts were less than six months, and these
contracts did not meet the criteria for hedge accounting.
The carrying amounts of the Company’s foreign currency denominated monetary assets and
monetary liabilities (including those eliminated on consolidation) and of the derivatives
exposing to foreign currency risk at the end of the reporting period are set out in Notes 28 and 7,
respectively.
Sensitivity analysis
The Company was mainly exposed to U.S. dollar, Euro and Chinese Yuan currencies.

- 56 -
The following table details the Company’s sensitivity to a 5% increase in New Taiwan dollars
(the functional currency) against the relevant foreign currencies. The 5% sensitivity rate is
used when reporting foreign currency risk internally to key management personnel and
represents management’s assessment of the reasonably possible change in foreign exchange
rates. The sensitivity analysis included only outstanding foreign currency denominated
monetary items and foreign currency forward contracts designated as cash flow hedges, and
adjusts their translation at the end of the reporting period is adjusted for a 5% change in
exchange rates. A positive number below indicates an increase in pre-tax profit associated
with New Taiwan dollar strengthen 5% against the relevant currency. For a 5% weakening of
New Taiwan dollar against the relevant currency, there would be an equal and opposite impact
on pre-tax profit and the balances below would be negative.
U.S. Dollar Impact Euro Impact Chinese Yuan Impact
2016 2015 2016 2015 2016 2015
Profit or loss $ 60,788
(Note 1)
$ 33,883
(Note 1)
$ 56,716
(Note 2)
$ 41,827
(Note 2)
$ 23,072
(Note 3)
$ 41,897
(Note 3)
$ 41,897
(Note 3)
Note 1: This was mainly attributable to the exposure outstanding on U.S. dollars denominated
cash, trade receivables and trade payables, which were not hedged at the end of the
reporting period.
Note 2: This was mainly attributable to the exposure outstanding on Euro denominated cash,
trade receivables and trade payables, which were not hedged at the end of the
reporting period.
Note 3: This was mainly attributable to the exposure outstanding on Renminbi denominated
cash, trade receivables and trade payables.
b) Interest rate risk
The Company’s floating-rate bank savings are exposed to risk of changes in interest rates. The
Company does not operate hedging instruments for interest rates. The Company’s
management monitors fluctuations in market interest rates regularly. If it is needed, the
management might perform necessary procedures for significant interest rate risks to control the
risks from fluctuations in market interest rates.
The Company’s fixed-term bank deposits are exposed to fair value interest rate risk; however,
this expected risk is insignificant.
The carrying amount of the Company’s financial assets and financial liabilities with exposure to
interest rates at the end of the reporting period were as follows:
December 31
2016 2015
Cash flow interest rate risk
Financial assets $ 2,004,912 $ 813,331
Sensitivity analysis
The sensitivity analyses below were determined based on the Company’s exposure to interest
rates for non-derivative instruments at the end of the reporting period. For floating rate
liabilities, the analysis was prepared assuming the amount of the liability outstanding at the end
of the reporting period was outstanding for the whole year. A 50 basis point increase or
decrease was used when reporting interest rate risk internally to key management personnel and
represents management’s assessment of the reasonably possible change in interest rates.
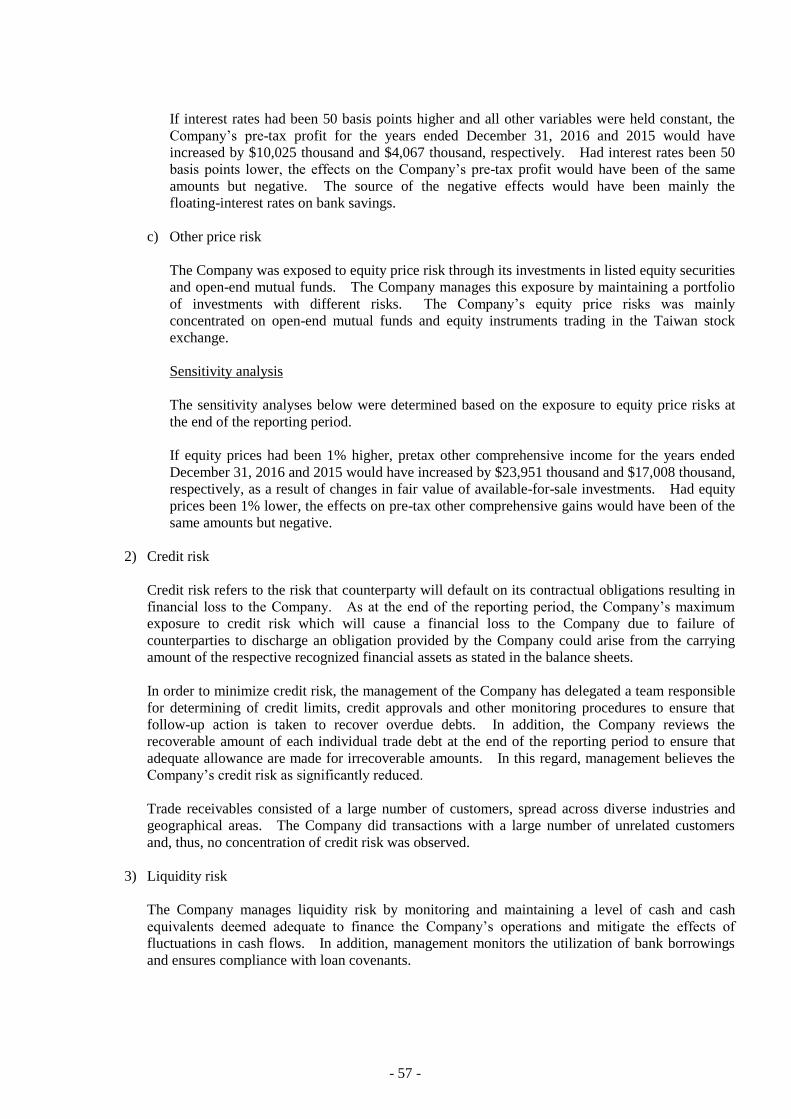
- 57 -
If interest rates had been 50 basis points higher and all other variables were held constant, the
Company’s pre-tax profit for the years ended December 31, 2016 and 2015 would have
increased by $10,025 thousand and $4,067 thousand, respectively. Had interest rates been 50
basis points lower, the effects on the Company’s pre-tax profit would have been of the same
amounts but negative. The source of the negative effects would have been mainly the
floating-interest rates on bank savings.
c) Other price risk
The Company was exposed to equity price risk through its investments in listed equity securities
and open-end mutual funds. The Company manages this exposure by maintaining a portfolio
of investments with different risks. The Company’s equity price risks was mainly
concentrated on open-end mutual funds and equity instruments trading in the Taiwan stock
exchange.
Sensitivity analysis
The sensitivity analyses below were determined based on the exposure to equity price risks at
the end of the reporting period.
If equity prices had been 1% higher, pretax other comprehensive income for the years ended
December 31, 2016 and 2015 would have increased by $23,951 thousand and $17,008 thousand,
respectively, as a result of changes in fair value of available-for-sale investments. Had equity
prices been 1% lower, the effects on pre-tax other comprehensive gains would have been of the
same amounts but negative.
2) Credit risk
Credit risk refers to the risk that counterparty will default on its contractual obligations resulting in
financial loss to the Company. As at the end of the reporting period, the Company’s maximum
exposure to credit risk which will cause a financial loss to the Company due to failure of
counterparties to discharge an obligation provided by the Company could arise from the carrying
amount of the respective recognized financial assets as stated in the balance sheets.
In order to minimize credit risk, the management of the Company has delegated a team responsible
for determining of credit limits, credit approvals and other monitoring procedures to ensure that
follow-up action is taken to recover overdue debts. In addition, the Company reviews the
recoverable amount of each individual trade debt at the end of the reporting period to ensure that
adequate allowance are made for irrecoverable amounts. In this regard, management believes the
Company’s credit risk as significantly reduced.
Trade receivables consisted of a large number of customers, spread across diverse industries and
geographical areas. The Company did transactions with a large number of unrelated customers
and, thus, no concentration of credit risk was observed.
3) Liquidity risk
The Company manages liquidity risk by monitoring and maintaining a level of cash and cash
equivalents deemed adequate to finance the Company’s operations and mitigate the effects of
fluctuations in cash flows. In addition, management monitors the utilization of bank borrowings
and ensures compliance with loan covenants.

- 58 -
Ultimate responsibility for liquidity risk management rests with the board of directors, which has
built an appropriate liquidity risk management framework for the Company’s short, medium and
long-term funding and liquidity management requirements. The Company manages liquidity risk
by maintaining adequate reserves and continuously monitoring forecast and actual cash flows as
well as matching the maturity profiles of financial assets and liabilities. As of December 31, 2016
and 2015, the Group had available unutilized short-term bank loan facilities set out in (3) below.
a) Liquidity and interest risk rate tables for nonderivative financial liabilities
The following table details the Company’s remaining contractual maturity for its non-derivative
financial liabilities with agreed-upon repayment periods. The tables had been drawn up based
on the undiscounted cash flows of financial liabilities from the earliest date on which the
Company can be required to pay. The table included both interests and principal cash flows.
Specifically, bank loans with a repayment on demand clause were included in the earliest time
band regardless of the probability of the banks choosing to exercise their rights. The maturity
dates for other non-derivative financial liabilities were based on the agreed repayment dates.
To the extent that interest flows are at floating rate, the undiscounted amount was derived from
the interest rate curve at the end of the reporting period.
December 31, 2016
On Demand
or Less than
1 Month 1-3 Months
Over
3 Months to
1 Year Over 1 Year -
5 Years
Nonderivative financial
liabilities
Noninterest bearing $ 4,481,036 $ 1,320,648 $ 1,059,301 $ -
December 31, 2015
On Demand
or Less than
1 Month 1-3 Months
Over
3 Months to
1 Year Over 1 Year -
5 Years
Nonderivative financial
liabilities
Noninterest bearing $ 3,017,559 $ 1,790,626 $ 1,034,340 $ -
The amounts included above for variable interest rate instruments for non-derivative financial
assets and liabilities were subject to change if changes in variable interest rates differ from those
estimates of interest rates determined at the end of the reporting period.
b) Liquidity and interest risk rate tables for derivative financial liabilities
The following tables detailed the Company’s liquidity analysis for its derivative financial
instruments. The tables were based on the undiscounted gross contractual net cash inflows and
outflows on these derivative instruments that settle on a net basis, and the undiscounted gross
inflows and outflows on those derivatives that require gross settlement. When the amount
payable or receivable is not fixed, the amount disclosed has been determined by reference to the
projected interest rates as illustrated by the yield curves at the end of the reporting period.

- 59 -
December 31, 2016
On Demand
or Less than
1 Month 1-3 Months
Over
3 Months to
1 Year Total
Gross settled
Foreign exchange forward
contracts
Inflows $ 297,337 $ 693,399 $ 282,619 $ 1,273,355
Outflows 287,861 682,033 277,958 1,247,852
$ 9,476 $ 11,366 $ 4,661 $ 25,503
December 31, 2015
On Demand
or Less than
1 Month 1-3 Months
Over
3 Months to
1 Year Total
Gross settled
Foreign exchange forward
contracts
Inflows $ 314,246 $ 523,146 $ 93,795 $ 931,187
Outflows 310,013 526,535 93,600 930,148
$ 4,233 $ (3,389) $ 195 $ 1,039
c) Financing facilities
December 31
2016 2015
Unsecured bank loan facilities
Amount used $ - $ -
Amount unused 2,362,900 1,379,466
$ 2,362,900 $ 1,379,466
26. TRANSACTIONS WITH RELATED PARTIES
Besides information disclosed elsewhere in the other notes, details of significant transactions between the
Company and other related parties are disclosed below.
a. Sales of goods
For the Year Ended December 31
Related Party Categories 2016 2015
Subsidiaries $ 22,819,095 $ 21,850,199
Associates 17,108 29,337
Other related parties 10 -
$ 22,836,213 $ 21,879,536

- 60 -
b. Purchases of goods
For the Year Ended December 31
Related Party Categories 2016 2015
Subsidiaries $ 14,708,329 $ 15,254,030
Associates 21,126 22,241
$ 14,729,455 $ 15,276,271
c. Receivables from related parties (excluding loans to related parties)
December 31
Line Item Related Party Categories 2016 2015
Trade receivables - related parties Subsidiaries $ 3,906,231 $ 3,961,514
Associates 2,206 16,485
Other related parties 11 -
$ 3,908,448 $ 3,977,999
Note receivable Associates $ - $ 183
The outstanding trade receivables from related parties are unsecured. For the years ended December
31, 2016 and 2015 no impairment loss was recognized for trade receivables from related parties.
d. Payables to related parties (excluding loans from related parties)
December 31
Related Party Categories 2016 2015
Subsidiaries $ 2,601,846 $ 2,685,959
Associates 8,796 1,171
$ 2,610,642 $ 2,687,130
The outstanding trade payables to related parties are unsecured.
e. Other receivables from related parties
December 31
Related Party Categories 2016 2015
Subsidiaries $ 19,002 $ 15,596
f. Property, plant and equipment acquired
Price
For the Year Ended December 31
Related Party Categories 2016 2015
Subsidiaries $ 10,408 $ 42,912

- 61 -
g. Other transactions with related parties
Operating Expenses
For the Year Ended December 31
2016 2015
Administration expenses
Subsidiaries $ 17,855 $ 13,244
Rent expenses
Subsidiaries $ 1,518 $ 1,518
Others
Subsidiaries $ 3,871 $ 2,391
Other Income
For the Year Ended December 31
2016 2015
Rent income
Subsidiaries $ 4,836 $ 6,416
Other related parties 60 50
$ 4,896 $ 6,466
Others
Subsidiaries $ 88,537 $ 87,367
Other related parties 2,702 2,712
Associates - 787
$ 91,239 $ 90,866
Lease contracts formed between the Company and its associates were based on market rental prices and
had normal payment terms. Revenue contracts for technical services formed between the Company
and its associates were based on market prices and had payment terms on the contracts. For the rest
of transactions with related parties, since normal payment terms with related parties were not stipulated,
the payment terms were based on mutual agreement.
h. Compensation of key management personnel
For the Year Ended December 31
2016 2015
Short-term employee benefits $ 34,349 $ 36,643
Post-employment benefits 113 116
Share-based payments 20,114 26,188
$ 54,576 $ 62,947
The remuneration of directors and key executives was determined by the remuneration committee based
on the performance of individuals and market trends.

- 62 -
27. SIGNIFICANT CONTINGENT LIABILITIES AND UNRECOGNIZED COMMITMENTS
In addition to those disclosed in other notes, significant commitments and contingencies of the Company
were as follows:
Significant commitments
As of December 31, 2015, the Company had a construction contract amounting to $1,627,500 thousand for
a newly constructed science park located in Linkou in Taoyuan City. The remaining payables were
$701,927 thousand.
28. SIGNIFICANT ASSETS AND LIABILITIES DENOMINATED IN FOREIGN CURRENCIES
The following information was aggregated by the foreign currencies other than functional currencies of the
Company and the exchange rates between foreign currencies and respective functional currencies were
disclosed. The significant assets and liabilities denominated in foreign currencies were as follows:
December 31, 2016
Foreign
Currencies Exchange Rate
Carrying
Amount
Financial assets
Monetary items
USD $ 125,577 32.25 (USD:NTD) $ 4,049,858
RMB 329,147 4.167 (RMB:NTD) 1,519,672
EUR 23,502 33.90 (EUR:NTD) 796,718
$ 6,366,248
Non-monetary items
Subsidiaries and associates accounted
for using the equity method
USD 290,712 32.25 (USD:NTD) $ 9,375,462
EUR 29,470 33.90 (EUR:NTD) 999,033
KRW 9,340,408 0.027 (KRW:NTD) 252,191
JPY 832,407 0.276 (JPY:NTD) 229,744
$ 10,856,430
Financial liabilities
Monetary items
USD 79,465 32.25 (USD:NTD) $ 2,562,746
RMB 200,202 4.617 (RMB:NTD) 924,333
$ 3,487,079

- 63 -
December 31, 2015
Foreign
Currencies Exchange Rate
Carrying
Amount
Financial assets
Monetary items
USD $ 84,470 32.825 (USD:NTD) $ 2,772,728
RMB 328,421 4.9950 (RMB:NTD) 1,640,463
EUR 24,408 35.880 (EUR:NTD) 875,759
$ 5,288,950
Non-monetary items
Subsidiaries and associates accounted
for using the equity method
USD 230,225 32.825 (USD:NTD) $ 7,557,136
EUR 29,132 35.880 (EUR:NTD) 1,045,256
KRW 8,311,195 0.0280 (KRW:NTD) 232,713
JPY 678,922 0.2730 (JPY:NTD) 185,346
$ 9,020,451
Financial liabilities
Monetary items
USD 63,419 32.825 (USD:NTD) $ 2,081,729
RMB 207,665 4.9950 (RMB:NTD) 1,037,287
$ 3,119,016
For the years ended December 2016 and 2015, realized and unrealized net foreign exchange losses were
$140,689 thousand and $88,859 thousand, respectively. It is impractical to disclose net foreign exchange
gains (losses) by each significant foreign currency due to the variety of the foreign currency transactions.
29. SEPARATELY DISCLOSED ITEMS
a. Information on significant transactions and b. information on investees:
1) Financing provided to others. (Table 1)
2) Endorsement/guarantee provided. (Table 2)
3) Marketable securities held (excluding investment in subsidiaries and associates). (Table 3)
4) Marketable securities acquired and disposed at costs or prices at least NT$300 million or 20% of the
paid-in capital. (Table 4)
5) Acquisition of individual real estate at costs of at least NT$300 million or 20% of the paid-in
capital. (Table 6)
6) Disposal of individual real estate at prices of at least NT$300 million or 20% of the paid-in capital.
(None)

- 64 -
7) Total purchases from or sales to related parties amounting to at least NT$100 million or 20% of the
paid-in capital. (Table 5)
8) Receivables from related parties amounting to at least NT$100 million or 20% of the paid-in
capital. (Table 7)
9) Transactions of financial instruments. (Notes 7 and 25)
10) Name, locations, and other information of investees. (Table 8)
c. Information on investments in mainland China
1) Information on any investee company in mainland China, showing the name, principal business
activities, paid-in capital, method of investment, inward and outward remittance of funds,
shareholding ratio, investment gains or losses, carrying amount of the investment at the end of the
period, repatriated investment gains, and limit on the amount of investment in the mainland China
area. (Table 9)
2) Any of the following significant transactions with investee companies in mainland China, either
directly or indirectly through a third area, their prices, and payment terms, and unrealized gains or
losses. Refer to Tables 1, 5 and 7.

- 65 -
TABLE 1
ADVANTECH CO., LTD. AND INVESTEES
FINANCING PROVIDED TO OTHERS
FOR THE YEAR ENDED DECEMBER 31, 2016
(In Thousands of New Taiwan Dollars, Unless Stated Otherwise)
No.
(Note A) Lender Borrower
Financial Statement
Account
Related
Parties
Credit Line (Note D) Actual Borrowing Interest
Rate (%)
Nature of
Financing
Business
Transaction
Amounts
Reasons for
Short-term
Financing
Allowance for
Impairment Loss
Collateral Financing Limit for
Each Borrower
Aggregate
Financing Limits Highest Balance for
the Year Ending Balance Ending Balance Item Value
1 Better Auto Dongguan Pou Yuen Digital
Technology Co., Ltd.
Trade receivables - related
parties
Yes $ 22,980
( RMB 4,520 thousand)
$ 20,869
(RMB 4,520 thousand)
$ 20,869
( RMB 4,520 thousand)
- Short-term
financing
$ - Financing need $ - None None $ 2,521,358
(Note C)
$ 5,042,716
(Note C)
Dongguan Pou Yuen Digital
Technology Co., Ltd.
Trade receivables - related
parties
Yes 16,725
( US$ 500 thousand)
16,125
( US$ 500 thousand)
12,900
( US$ 400 thousand)
- Short-term
financing
- Financing need - None None 2,521,358
(Note C)
5,042,716
(Note C)
2 ANA B+B Trade receivables - related
parties
Yes 66,900
( US$ 2,000 thousand)
64,500
( US$ 2,000 thousand)
24,188
( US$ 750 thousand)
2 Short-term
financing
- Financing need - None None 2,521,358
(Note C)
5,042,716
(Note C)
3 B+B B+B (CZ) (formerly Conel) Trade receivables - related parties
Yes 133,408 ( CZK 31,756
thousand)
39,949 (CZK 31,756
thousand)
4,382 (CZK 3,483
thousand)
2 Short-term financing
- Financing need - None None 2,521,358 (Note C)
5,042,716 (Note C)
4 B+B (CZ) (formerly Conel) Conel Automation (formerly Softcon)
Trade receivables - related parties
Yes 16,111 (CZK 12,000
thousand)
15,096 ( CZK 12,000
thousand)
15,096 ( CZK 12,000
thousand)
1 Short-term financing
- Financing need - None None 2,521,358 (Note C)
5,042,716 (Note C)
5 Cermate Technologies
(Shanghai) Inc.
Shenzhen Cermate
Technologies Inc.
Prepayments of inventories Yes 15,252
( RMB 3,000
thousand)
13,851
( RMB 3,000
thousand)
- - Short-term
financing
- Financing need - None None 2,521,358
(Note C)
5,042,716
(Note C)
6 ALNC Dongguan Pou Yuen Digital
Technology Co., Ltd.
Prepayments of inventories Yes 150,000 150,000 93,532 - Short-term
financing
- Financing need - None None 2,521,358
(Note C)
5,042,716
(Note C)
7 Advanix Corp. The Company Trade receivables - related
parties
Yes 200,000 200,000 - 1 Short-term
financing
- Financing need - None None 2,521,358
(Note C)
5,042,716
(Note C)
8 Advantech Corporate
Investment
The Company Trade receivables - related
parties
Yes 500,000 - - 1 Short-term
financing
- Financing need - None None 2,521,358
(Note C)
5,042,716
(Note C)
9 AdvanPOS The Company Trade receivables - related parties
Yes 100,000 - - 1 Short-term financing
- Financing need - None None 2,521,358 (Note C)
5,042,716 (Note C)
Note A: Investee companies are numbered sequentially from 1.
Note B: The exchange rates as of December 31, 2016 were US$1=NT$32.25, RMB1=NT$4.617 and CZK1=NT$1.258.
Note C: The financing limit for each borrower and for the aggregate financing were 10% and 20%, respectively, of the Company’s net asset values.
Note D: The maximum balance for the year and ending balance are approved by the board of directors of financiers.

- 66 -
TABLE 2
ADVANTECH CO., LTD. AND INVESTEES
ENDORSEMENT/GUARANTEE PROVIDED
FOR THE YEAR ENDED DECEMBER 31, 2016
(In Thousands of New Taiwan Dollars, Unless Stated Otherwise)
No. Endorser/
Guarantor
Endorsee/Guarantee
Limits on
Endorsement/
Guarantee
Given on Behalf
of Each Party
(Note A)
Maximum
Amount
Endorsed/
Guaranteed
During the
Year
Outstanding
Endorsement/
Guarantee at
the End of the
Year
Actual
Borrowing
Amount
Amount
Endorsed/
Guaranteed by
Collaterals
Ratio of
Accumulated
Endorsement/
Guarantee to
Net Equity in
Latest Financial
Statements
(%)
Maximum
Collateral/
Guarantee
Amounts
Allowable
(Note B)
Endorsement/
Guarantee
Given by
Parent on
Behalf of
Subsidiaries
Endorsement/
Guarantee
Given by
Subsidiaries
on Behalf of
Parent
Endorsement/
Guarantee
Given on
Behalf of
Companies in
Mainland
China
Name Relationship
0 The Company Advanixs Corp. (formerly
Advansus Corp.)
Subsidiary $ 2,521,358 $ 64,500
(US$ 2,000
thousand)
$ 64,500
(US$ 2,000
thousand)
$ -
$ - 0.27 $ 7,564,074 Y N N
AdvanDos Subsidiary 2,521,358 64,500
(US$ 2,000
thousand)
64,500
(US$ 2,000
thousand)
- - 0.27 7,564,074 Y N N
ANA Subsidiary 2,521,358 978,450
(US$ 30,000
thousand)
967,500
(US$ 30,000
thousand)
483,750
(US$ 15,000
thousand)
- 4.07 7,564,074 Y N N
B+B Subsidiary 2,521,358 326,150
(US$ 10,000
thousand)
322,500
(US$ 10,000
thousand)
- - 1.36 7,564,074 Y N N
AKMC Subsidiary 2,521,358 195,690
(US$ 6,000
thousand)
193,500
(US$ 6,000
thousand)
- - 0.81 7,564,074 Y N Y
ALNC Subsidiary 2,521,358 114,153
(US$ 3,500
thousand)
112,875
(US$ 3,500
thousand)
- - 0.47 7,564,074 Y N N
Advanixs Corp. (formerly
Advansus Corp.)
Subsidiary 2,521,358 52,184
(US$ 1,600
thousand)
51,600
(US$ 1,600
thousand)
- - 0.22 7,564,074 Y N N
Cermate Subsidiary 2,521,358 50,553
(US$ 1,550
thousand)
49,988
(US$ 1,550
thousand)
- - 0.21 7,564,074 Y N N
AiST Subsidiary 2,521,358 4,892
(US$ 150
thousand)
4,838
(US$ 150
thousand)
- - 0.02 7,564,074 Y N N
AdvanPOS Subsidiary 2,521,358 32,615
(US$ 1,000
thousand)
32,250
(US$ 1,000
thousand)
- - 0.14 7,564,074 Y N N
A-DLoG Subsidiary 2,521,358 36,300
(EUR 1,000
thousand)
33,900
(EUR 1,000
thousand)
- - 0.14 7,564,074 Y N N
(Continued)

- 67 -
No. Endorser/
Guarantor
Endorsee/Guarantee
Limits on
Endorsement/
Guarantee
Given on Behalf
of Each Party
(Note A)
Maximum
Amount
Endorsed/
Guaranteed
During the
Year
Outstanding
Endorsement/
Guarantee at
the End of the
Year
Actual
Borrowing
Amount
Amount
Endorsed/
Guaranteed by
Collaterals
Ratio of
Accumulated
Endorsement/
Guarantee to
Net Equity in
Latest Financial
Statements
(%)
Maximum
Collateral/
Guarantee
Amounts
Allowable
(Note B)
Endorsement/
Guarantee
Given by
Parent on
Behalf of
Subsidiaries
Endorsement/
Guarantee
Given by
Subsidiaries
on Behalf of
Parent
Endorsement/
Guarantee
Given on
Behalf of
Companies in
Mainland
China
Name Relationship
ABR Subsidiary $ 2,521,358 $ 48,923
(US$ 1,500
thousand)
$ 48,375
(US$ 1,500
thousand)
$ - $ - 0.20 $ 7,564,074 Y N N
AAU Subsidiary 2,521,358
6,523
(US$ 200
thousand)
6,450
(US$ 200
thousand)
- - 0.03 7,564,074 Y N N
AKR Subsidiary 2,521,358
1,631
(US$ 50
thousand)
1,613
(US$ 50
thousand)
- - 0.01 7,564,074 Y N N
Note A: 10% of the Company’s net asset value.
Note B: 30% of the Company’s net asset value.
Note C: The exchange rates as of December 31, 2016 were US$1=NT$32.25 and EUR1=NT$33.90.
Note D: The latest net equity is from the financial statements on ended September 30, 2016.
(Concluded)

- 68 -
TABLE 3
ADVANTECH CO., LTD. AND INVESTEES
MARKETABLE SECURITIES HELD
FOR THE YEAR ENDED DECEMBER 31, 2016
(In Thousands of New Taiwan Dollars, Unless Stated Otherwise)
Holding Company Name Type and Name of Marketable Securities
Relationship with
the Holding
Company
Financial Statement Account
December 31, 2016
Note Shares
Carrying
Amount
Percentage of
Ownership Fair Value
The Company Stock
ASUSTek Computer Inc. - Available for sale financial assets - noncurrent 5,239,461 $ 1,388,457 0.71 $ 1,388,457 Note A and C
Pegatron Corp. - 〃 3,540,570 272,624 0.14 272,624 Note A and D
Allied Circuit Co., Ltd. - 〃 1,200,000 33,720 2.41 33,720 Note A
Fund
Capital Money Market - Available for sale financial assets - current 6,257,979 100,016 - 100,016 Note B
Mega Diamond Money Market - 〃 24,168,482 300,131 - 300,131 Note B
FSITC Money Market - 〃 1,698,386 300,122 - 300,122 Note B
Advantech Corporate Investment Stock
Allied Circuit Co., Ltd. - Financial assets at fair value through profit or
loss - current
2,800,000 78,680 5.63 78,680 Note A
BroadTec System Inc. - Available for sale financial assets - noncurrent 150,000 1,500 6.16 1,500 -
BiosenseTek Corp. - 〃 37,500 375 1.79 375 -
Jaguar Technology - 〃 500,000 7,500 16.67 7,500 -
Allied Circuit Co., Ltd. - 〃 299,000 8,402 0.60 8,402 Note A
Phison Electronics Corporation - Available for sale financial assets - current 1,500,000 383,250 0.76 383,250 Note A
Radiant Opto-Electronics Corporation - 〃 500,000 28,100 0.11 28,100 Note A
Lelon Electronics Corporation - 〃 2,436,000 95,004 1.86 95,004 Note A
Fund
Mega Diamond Money Market - Available for sale financial assets - current 23,861,961 296,325 - 296,325 Note B
FSITC Money Market - 〃 2,038,341 360,195 - 360,195 Note B
Taishin 1699 Money Market - 〃 14,932,171 200,073 - 200,073 Note B
Advanixs Corp. Fund
(formerly Advansus Corp.) Jih Sun Money Market - 〃 38,021,440 557,763 - 557,763 Note B
CTBC Hwa-win Money Market Fund 2,290,363 25,000 - 25,000 Note B
Mega Diamond Money Market - 〃 2,416,413 30,008 - 30,008 Note B
AiST Fund
Jill Sun Money Market - 〃 1,226,167 17,987 - 17,987 Note B
(Continued)

- 69 -
Holding Company Name Type and Name of Marketable Securities
Relationship with
the Holding
Company
Financial Statement Account
December 31, 2016
Note Shares
Carrying
Amount
Percentage of
Ownership Fair Value
ALTC Fund
Mega Diamond Money Market - 〃 5,677,549 $ 70,506 - $ 70,506 Note B
Capital Money Market - 〃 2,132,508 34,082 - 34,082 Note B
AdvanPOS Fund
Mega Diamond Money Market - 〃 11,231,810 139,480 - 139,480 Note B
Advantech Innovative Design Co., Ltd. Fund
Capital Money Market - 〃 281,756 4,503 - 4,503 Note B
Cermate Fund
Mega Diamond Money Market - 〃 1,130,641 14,041 - 14,041 Note B
Note A: Market value was based on the closing price on December 31, 2016.
Note B: Market value was based on the net asset values of the open-ended mutual funds on December 31, 2016.
Note C: The amount included $1,099,750 thousand, the carrying value of 4,150,000 shares held in trust with CTBC Bank. Please refer to Note 8 of the financial statements for more information.
Note D: The amount included $157,850 thousand, the carrying value of 2,050,000 shares held in trust with CTBC Bank. Please refer to Note 8 of the financial statements for more information.
(Concluded)

- 70 -
TABLE 4
ADVANTECH CO., LTD. AND INVESTEES
MARKETABLE SECURITIES ACQUIRED AND DISPOSED AT COSTS OR PRICES OF AT LEAST $300 MILLION OR 20% OF THE PAID-IN CAPITAL
FOR THE YEAR ENDED DECEMBER 31, 2016
(In Thousands of New Taiwan Dollars, Unless Stated Otherwise)
Company Name Type and Name of
Marketable Securities
Financial Statement
Account Counterparty Relationship
Beginning Balance Acquisition (Note) Disposal Ending Balance (Note)
Shares Amount (Cost) Shares Amount Shares Amount Carrying
Amount
Gain (Loss) on
Disposal Shares Amount (Cost)
The Company Fund
Capital Money Market Available for sale financial
assets - current
- - - $ - 77,706,012 $ 1,240,000 71,448,034 $ 1,140,484 $ 1,140,000 $ 484 6,257,978 $ 100,000
Mega Diamond Money
Market
Available for sale financial
assets - current
- - - - 126,440,929 1,568,000 102,272,448 1,268,601 1,267,979 622 24,168,481 300,021
FSITC Money Market Available for sale financial
assets - current
- - - - 6,174,911 1,090,000 4,476,525 790,207 790,000 207 1,698,386 300,000
Stock
B+B Investments accounted for
using the equity method
- - - - 230,467 1,968,044
(US$ 59,910)
- - - - 230,467 1,968,044
Advantech Corporate Fund
Investment FSITC Money Market Available for sale financial
assets - current
- - - - 2,038,341 360,000 - - - - 2,038,341 360,000
Advanixs Corp. Fund
(formerly Advansus
Corp.)
Jih Sun Money Market Available for sale financial
assets - current
- - 19,537,275 285,055 50,635,993 742,004 32,151,828 471,000 469,941 1,059 38,021,440 557,118
AdvanPOS Fund
Mega Diamond Money
Market
Available for sale financial
assets - current
- - 242,411 3,000 35,288,731 437,021 24,299,332 301,358 300,824 534 11,231,810 139,197
ANA Fund
B+B Investments accounted for
using the equity method
- - - - 153,644 1,328,004
(US$ 39,940)
- - - - 153,644 1,328,004
ATC (HK) Stock
Advanixs Kunshan Corp. Investments accounted for
using the equity method
- - - - - 459,648
(RMB 92,758)
- - - - - 459,648
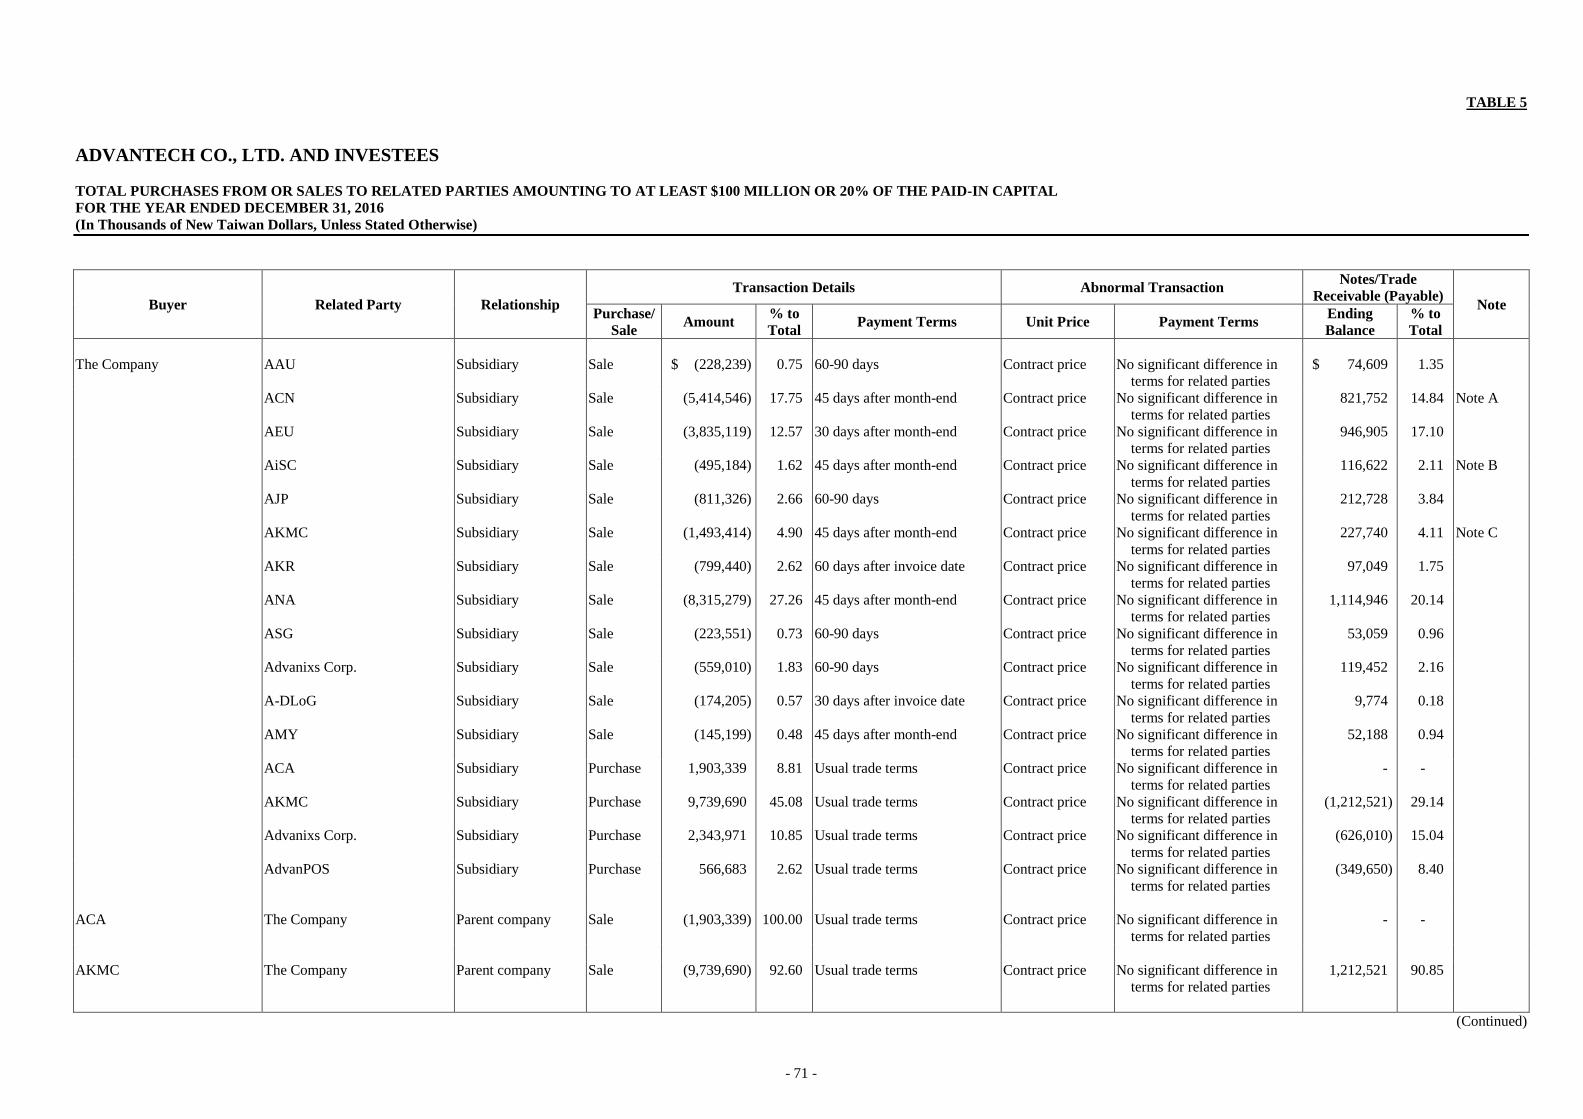
- 71 -
TABLE 5
ADVANTECH CO., LTD. AND INVESTEES
TOTAL PURCHASES FROM OR SALES TO RELATED PARTIES AMOUNTING TO AT LEAST $100 MILLION OR 20% OF THE PAID-IN CAPITAL
FOR THE YEAR ENDED DECEMBER 31, 2016
(In Thousands of New Taiwan Dollars, Unless Stated Otherwise)
Buyer Related Party Relationship
Transaction Details Abnormal Transaction Notes/Trade
Receivable (Payable) Note
Purchase/
Sale Amount
% to
Total Payment Terms Unit Price Payment Terms
Ending
Balance
% to
Total
The Company AAU Subsidiary Sale $ (228,239) 0.75 60-90 days Contract price No significant difference in
terms for related parties
$ 74,609 1.35
ACN Subsidiary Sale (5,414,546) 17.75 45 days after month-end Contract price No significant difference in
terms for related parties
821,752 14.84 Note A
AEU Subsidiary Sale (3,835,119) 12.57 30 days after month-end Contract price No significant difference in
terms for related parties
946,905 17.10
AiSC Subsidiary Sale (495,184) 1.62 45 days after month-end Contract price No significant difference in
terms for related parties
116,622 2.11 Note B
AJP Subsidiary Sale (811,326) 2.66 60-90 days Contract price No significant difference in
terms for related parties
212,728 3.84
AKMC Subsidiary Sale (1,493,414) 4.90 45 days after month-end Contract price No significant difference in
terms for related parties
227,740 4.11 Note C
AKR Subsidiary Sale (799,440) 2.62 60 days after invoice date Contract price No significant difference in
terms for related parties
97,049 1.75
ANA Subsidiary Sale (8,315,279) 27.26 45 days after month-end Contract price No significant difference in
terms for related parties
1,114,946 20.14
ASG Subsidiary Sale (223,551) 0.73 60-90 days Contract price No significant difference in
terms for related parties
53,059 0.96
Advanixs Corp. Subsidiary Sale (559,010) 1.83 60-90 days Contract price No significant difference in
terms for related parties
119,452 2.16
A-DLoG Subsidiary Sale (174,205) 0.57 30 days after invoice date Contract price No significant difference in
terms for related parties
9,774 0.18
AMY Subsidiary Sale (145,199) 0.48 45 days after month-end Contract price No significant difference in
terms for related parties
52,188 0.94
ACA Subsidiary Purchase 1,903,339 8.81 Usual trade terms Contract price No significant difference in
terms for related parties
- -
AKMC Subsidiary Purchase 9,739,690 45.08 Usual trade terms Contract price No significant difference in
terms for related parties
(1,212,521) 29.14
Advanixs Corp. Subsidiary Purchase 2,343,971 10.85 Usual trade terms Contract price No significant difference in
terms for related parties
(626,010) 15.04
AdvanPOS Subsidiary Purchase 566,683 2.62 Usual trade terms Contract price No significant difference in
terms for related parties
(349,650) 8.40
ACA The Company Parent company Sale (1,903,339) 100.00 Usual trade terms Contract price No significant difference in
terms for related parties
- -
AKMC The Company Parent company Sale (9,739,690) 92.60 Usual trade terms Contract price No significant difference in
terms for related parties
1,212,521 90.85
(Continued)

- 72 -
Buyer Related Party Relationship
Transaction Details Abnormal Transaction Notes/Trade
Receivable (Payable) Note
Purchase/
Sale Amount
% to
Total Payment Terms Unit Price Payment Terms
Ending
Balance
% to
Total
Advanixs Corp. The Company Parent company Sale $ (2,343,971) 37.52 Usual trade terms Contract price No significant difference in
terms for related parties
$ 626,010 45.72
AdvanPOS The Company Parent company Sale (566,683) 48.24 Usual trade terms Contract price No significant difference in
terms for related parties
349,650 57.55
AAU The Company Parent company Purchase 228,239 84.80 60-90 days Contract price No significant difference in
terms for related parties
(74,609) 86.01
ACN The Company Parent company Purchase 5,414,546 72.60 45 days after month-end Contract price No significant difference in
terms for related parties
(821,752) 67.59
AEU The Company Parent company Purchase 3,835,119 83.12 30 days after month-end Contract price No significant difference in
terms for related parties
(946,905) 94.96
AiSC The Company Parent company Purchase 495,184 49.27 45 days after month-end Contract price No significant difference in
terms for related parties
(116,622) 62.28
AJP The Company Parent company Purchase 811,326 97.66 60-90 days Contract price No significant difference in
terms for related parties
(212,728) 98.63
AKMC The Company Parent company Purchase 1,493,414 15.63 45 days after month-end Contract price No significant difference in
terms for related parties
(227,740) 10.70
AKR The Company Parent company Purchase 799,440 66.35 60 days after invoice date Contract price No significant difference in
terms for related parties
(97,049) 60.47
ANA The Company Parent company Purchase 8,315,279 89.02 45 days after month-end Contract price No significant difference in
terms for related parties
(1,114,946) 94.36
ASG The Company Parent company Purchase 223,551 71.28 60-90 days Contract price No significant difference in
terms for related parties
(53,059) 86.20
Advanixs Corp. The Company Parent company Purchase 559,010 10.05 60-90 days Contract price No significant difference in
terms for related parties
(119,452) 8.16
A-DLoG The Company Parent company Purchase 174,205 18.58 30 days after invoice date Contract price No significant difference in
terms for related parties
(9,774) 16.93
AMY The Company Parent company Purchase 145,199 86.05 45 days after month-end Contract price No significant difference in
terms for related parties
(52,188) 100.00
AiSC AKMC Related enterprise Sale (123,469) 11.03 Usual trade terms Contract price No significant difference in
terms for related parties
1,185 0.51
AKMC ACN Related enterprise Sale (509,671) 4.85 Usual trade terms Contract price No significant difference in
terms for related parties
88,163 6.61
AiSC Related enterprise Sale (185,452) 1.76 Usual trade terms Contract price No significant difference in
terms for related parties
28,687 2.15
(Continued)
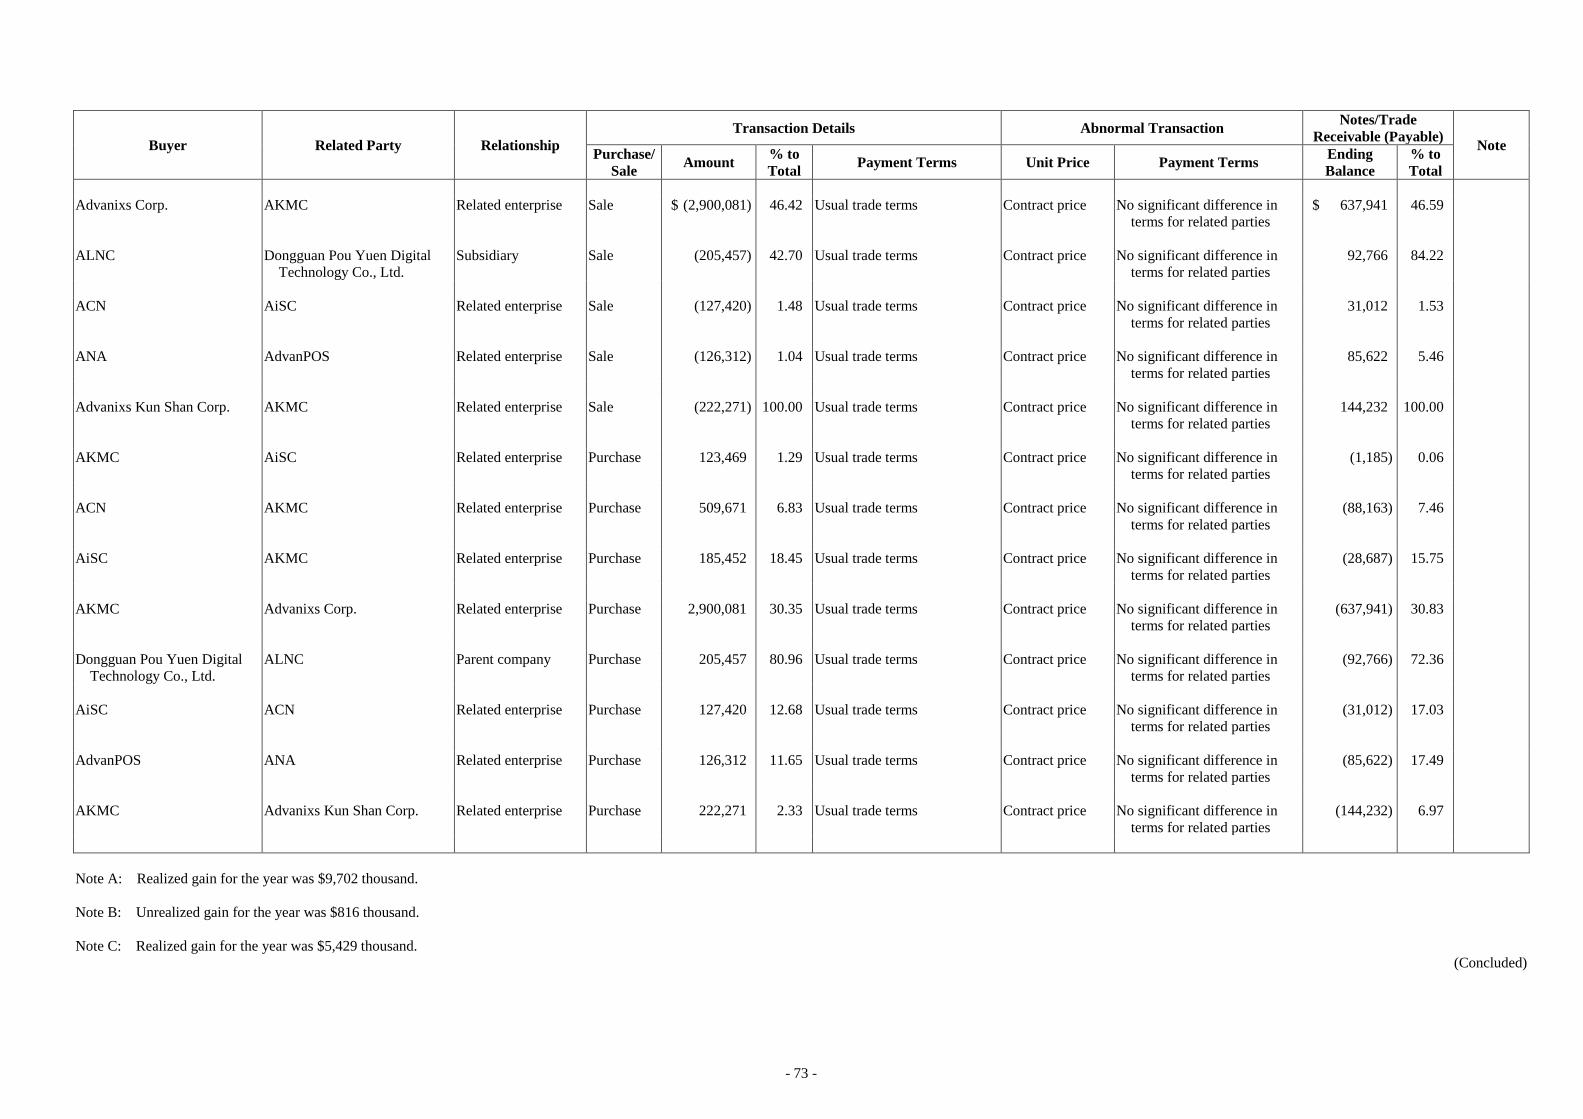
- 73 -
Buyer Related Party Relationship
Transaction Details Abnormal Transaction Notes/Trade
Receivable (Payable) Note
Purchase/
Sale Amount
% to
Total Payment Terms Unit Price Payment Terms
Ending
Balance
% to
Total
Advanixs Corp. AKMC Related enterprise Sale $ (2,900,081) 46.42 Usual trade terms Contract price No significant difference in
terms for related parties
$ 637,941 46.59
ALNC Dongguan Pou Yuen Digital
Technology Co., Ltd.
Subsidiary Sale (205,457) 42.70 Usual trade terms Contract price No significant difference in
terms for related parties
92,766 84.22
ACN AiSC Related enterprise Sale (127,420) 1.48 Usual trade terms Contract price No significant difference in
terms for related parties
31,012 1.53
ANA AdvanPOS Related enterprise Sale (126,312) 1.04 Usual trade terms Contract price No significant difference in
terms for related parties
85,622 5.46
Advanixs Kun Shan Corp. AKMC Related enterprise Sale (222,271) 100.00 Usual trade terms Contract price No significant difference in
terms for related parties
144,232 100.00
AKMC AiSC Related enterprise Purchase 123,469 1.29 Usual trade terms Contract price No significant difference in
terms for related parties
(1,185) 0.06
ACN AKMC Related enterprise Purchase 509,671 6.83 Usual trade terms Contract price No significant difference in
terms for related parties
(88,163) 7.46
AiSC AKMC Related enterprise Purchase 185,452 18.45 Usual trade terms Contract price No significant difference in
terms for related parties
(28,687) 15.75
AKMC Advanixs Corp. Related enterprise Purchase 2,900,081 30.35 Usual trade terms Contract price No significant difference in
terms for related parties
(637,941) 30.83
Dongguan Pou Yuen Digital
Technology Co., Ltd.
ALNC Parent company Purchase 205,457 80.96 Usual trade terms Contract price No significant difference in
terms for related parties
(92,766) 72.36
AiSC ACN Related enterprise Purchase 127,420 12.68 Usual trade terms Contract price No significant difference in
terms for related parties
(31,012) 17.03
AdvanPOS ANA Related enterprise Purchase 126,312 11.65 Usual trade terms Contract price No significant difference in
terms for related parties
(85,622) 17.49
AKMC Advanixs Kun Shan Corp. Related enterprise Purchase 222,271 2.33 Usual trade terms Contract price No significant difference in
terms for related parties
(144,232) 6.97
Note A: Realized gain for the year was $9,702 thousand.
Note B: Unrealized gain for the year was $816 thousand.
Note C: Realized gain for the year was $5,429 thousand.
(Concluded)
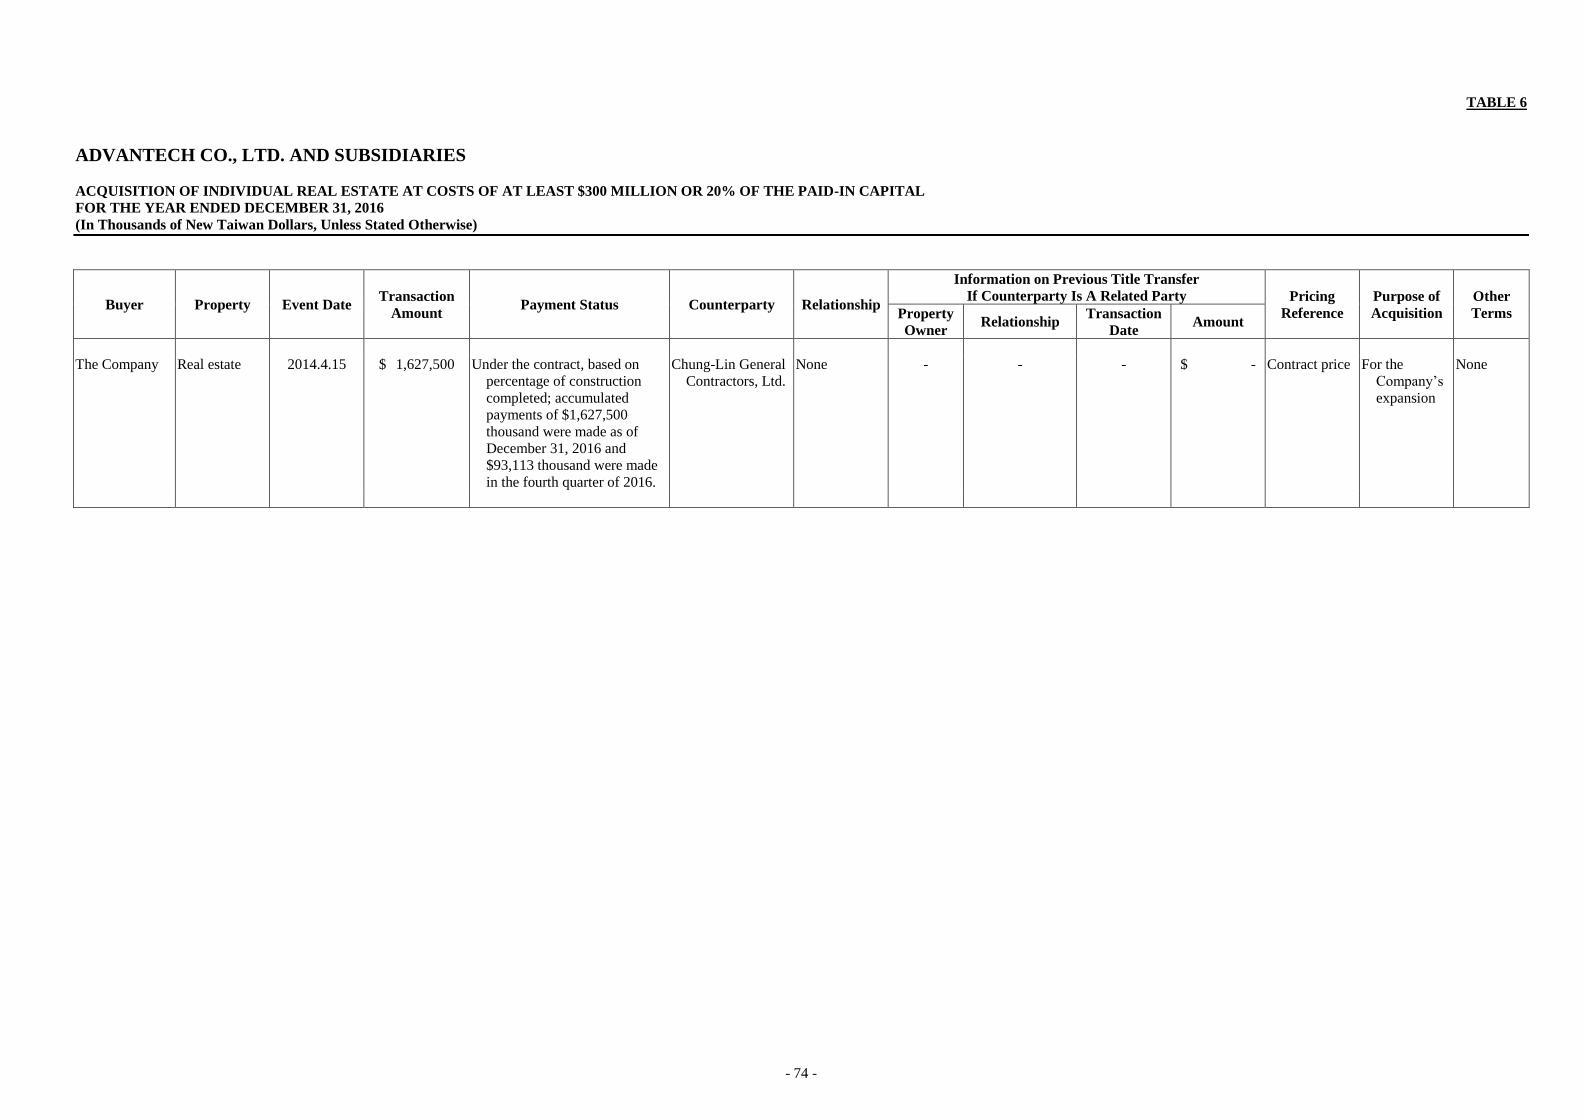
- 74 -
TABLE 6
ADVANTECH CO., LTD. AND SUBSIDIARIES
ACQUISITION OF INDIVIDUAL REAL ESTATE AT COSTS OF AT LEAST $300 MILLION OR 20% OF THE PAID-IN CAPITAL
FOR THE YEAR ENDED DECEMBER 31, 2016
(In Thousands of New Taiwan Dollars, Unless Stated Otherwise)
Buyer Property Event Date Transaction
Amount Payment Status Counterparty Relationship
Information on Previous Title Transfer
If Counterparty Is A Related Party Pricing
Reference
Purpose of
Acquisition
Other
Terms Property
Owner Relationship
Transaction
Date Amount
The Company Real estate 2014.4.15 $ 1,627,500 Under the contract, based on
percentage of construction
completed; accumulated
payments of $1,627,500
thousand were made as of
December 31, 2016 and
$93,113 thousand were made
in the fourth quarter of 2016.
Chung-Lin General
Contractors, Ltd.
None - - - $ - Contract price For the
Company’s
expansion
None

- 75 -
TABLE 7
ADVANTECH CO., LTD. AND INVESTEES
RECEIVABLES FROM RELATED PARTIES AMOUNTING TO AT LEAST NT$100 MILLION OR 20% OF THE PAID-IN CAPITAL
FOR THE YEAR ENDED DECEMBER 31, 2016
(In Thousands of New Taiwan Dollars, Unless Stated Otherwise)
Company Name Related Party Relationship Ending Balance Turnover Rate
Overdue Amounts
Received in
Subsequent
Period
Allowance for
Impairment Loss Amount Actions Taken
The Company ACN Subsidiary $ 821,752 5.30 $ - - $ 249,318 $ -
AEU Subsidiary 951,281 3.96 - - 155,587 -
AiSC Subsidiary 116,622 4.60 - - 34,166 -
AJP Subsidiary 214,660 5.21 - - 38,854 -
AKMC Subsidiary 227,749 7.54 - - 189,659 -
ANA Subsidiary 1,117,501 7.61 - - 751,425 -
Advanixs Corp. Subsidiary 119,511 6.37 - - 63,848 -
AKMC The Company Parent company 1,212,521 7.45 - - 983,962 -
Advanixs Corp. AKMC Related enterprise 637,941 5.34 - - 280,810 -
The Company Parent company 626,010 2.79 - - 301,471 -
AdvanPOS The Company Parent company 349,650 3.21 - - 156,987 -

- 76 -
TABLE 8
ADVANTECH CO., LTD. AND SUBSIDIARIES
INFORMATION ON INVESTEES
FOR THE YEAR ENDED DECEMBER 31, 2016
(In Thousands of New Taiwan Dollars/Foreign Currency, Unless Stated Otherwise)
Investor Company Investee Company Location Main Businesses and Products
Investment Amount Balance as of December 31, 2016 Net Income
(Loss) of the
Investee
Investment
Gain (Loss)
(Note A)
Note December 31,
2016
December 31,
2015 Shares
Percentage of
Ownership
Carrying
Value
The Company AAC (BVI) BVI Investment and management service $ 1,000,207 $ 1,000,207 29,623,834 100.00 $ 4,021,994 $ 429,541 $ 427,865 Subsidiary
ATC BVI Sale of industrial automation products 998,788 1,231,118 33,850,000 100.00 3,243,871 104,114 96,661 Subsidiary
Advanixs Corporate (formerly
Advansus Corp.)
Taipei, Taiwan Production and sale of industrial automation products 486,000 486,000 36,000,000 100.00 979,563 486,566 462,195 Subsidiary
Advantech Corporate Investment Taipei, Taiwan Investment holding company 1,400,000 1,400,000 150,000,000 100.00 1,639,126 34,108 33,632 Subsidiary
Axiomtek Taipei, Taiwan Production and sale of industrial automation products 249,059 249,059 20,537,984 25.99 464,155 360,023 93,560 Equity-method investee
AdvanPOS Taipei, Taiwan Production and sale of POS system 460,572 460,572 20,438,000 100.00 577,260 224,493 218,495 Subsidiary
ALNC Taichung, Taiwan Production and sale of machines with computerized
numerical control
431,634 478,825 24,350,000 81.17 493,481 11,514 10,606 Subsidiary
Jan Hsiang Taipei, Taiwan Electronic parts and components manufacturing 3,719 3,719 655,500 28.50 8,904 (1,322) (411) Equity-method investee
AMX Mexico Sale of industrial automation products 4,922 4,922 - 100.00 594 (771) (771) Subsidiary
AEUH Helmond, The Netherlands Investment and management service 1,219,124 1,219,124 12,572,024 100.00 864,191 17,978 17,702 Subsidiary
ASG Techplace, Singapore Sale of industrial automation products 27,134 27,134 1,450,000 100.00 72,186 5,100 5,100 Subsidiary
AAU Sydney, Australia Sale of industrial automation products 40,600 40,600 500,204 100.00 34,737 5,704 5,704 Subsidiary
AJP Tokyo, Japan Sale of industrial automation products 15,472 15,472 1,200 100.00 218,331 45,585 45,585 Subsidiary
AMY Malaysia Sale of industrial automation products 35,140 35,140 2,000,000 100.00 45,752 19,416 19,416 Subsidiary
AKR Seoul, Korea Sale of industrial automation products 73,355 73,355 600,000 100.00 228,407 63,563 63,563 Subsidiary
ABR Sao Paulo, Brazil Sale of industrial automation products 43,216 43,216 1,794,996 80.00 75,531 24,253 19,403 Subsidiary
ACA Taipei, Taiwan Production and sale of portable industrial automation
products
- 146,440 - - - 59,906 65,577 Subsidiary (Note D)
Advantech Innovative Design
Co., Ltd.
Taipei, Taiwan Product design 10,000 10,000 1,000,000 100.00 9,633 1,054 1,054 Subsidiary
Advantech iFactory Co., Ltd. Taipei, Taiwan Cybernation equipment manufacturing - 60,000 - 100.00 - 201 201 Subsidiary
AiST Taipei, Taiwan Design, develop and sale of intelligent services 157,915 - 10,000,000 100.00 160,414 (23,860) 2,511 Subsidiary (Note E)
BEMC Delaware, USA Sale of industrial network communications systems 1,968,044 - 230,467 60.00 1,959,805 53,173 31,903 Subsidiary (Note C)
AIN India Sale of industrial automation products 5,567 5,567 999,999 99.99 1,663 (11,974) (11,974) Subsidiary
AIMobile Co., Ltd. Taipei, Taiwan Design and manufacture of industrial mobile systems 135,000 - 13,500,000 45.00 109,241 (57,243) (25,759) Equity-method investee
Advantech Corporate Investment AiST Taipei, Taiwan Design, develop and sale of intelligent services - 142,063 - - - (23,860) (26,371) Subsidiary (Note E)
Cermate Taipei, Taiwan Manufacturing of electronic parts, computer, and
peripheral devices
71,500 71,500 5,500,000 55.00 117,913 27,681 14,844 Subsidiary
Deneng Taichung, Taiwan Installment and sale of electronic components and
software
18,095 18,095 658,000 39.69 16,154 (4,606) (1,828) Equity-method investee
ATC ATC (HK) Hong Kong Investment and management service 1,212,730 1,212,730 41,650,001 100.00 3,135,926 251,893 244,440 Subsidiary
AAC (BVI) ANA Sunnyvale, USA Sale and fabrication of industrial automation products 504,179 504,179 10,952,606 100.00 2,296,976 236,063 235,733 Subsidiary
AAC (HK) Hong Kong Investment and management service 539,146 539,146 15,230,001 100.00 1,873,641 194,940 193,595 Subsidiary
ANA BEMC Delaware, USA Sale of industrial network communications 1,328,004 - 153,644 40.00 1,306,537 53,173 21,270 Subsidiary (Note C)
AEUH AEU Eindhoven, The Netherlands Sale of industrial automation products 431,963 431,963 11,314,280 100.00 874,511 17,819 17,542 Subsidiary
APL Warsaw, Poland Sale of industrial automation products 14,176 14,176 6,350 100.00 22,127 801 801 Subsidiary
AEU A-DLoG Munich, Germany Design, R&D and sale of industrial automation
vehicles and related products
553,536 553,536 1 100.00 485,607 (34,598) (45,520) Subsidiary
ASG ATH Thailand Production of computers 7,537 7,537 51,000 51.00 18,044 4,696 2,395 Subsidiary
AID Indonesia Sale of industrial automation products 4,797 4,797 300,000 100.00 2,380 (1,883) (1,883) Subsidiary
(Continued)

- 77 -
Investor Company Investee Company Location Main Businesses and Products
Investment Amount Balance as of December 31, 2016 Net Income
(Loss) of the
Investee
Investment
Gain (Loss)
(Note A)
Note December 31,
2016
December 31,
2015 Shares
Percentage of
Ownership
Carrying
Value
Cermate LandMark BVI General investment $ 28,200 $ 28,200 972,284 100.00 $ 75,241 $ 15,296 $ 15,296 Subsidiary
ALNC Better Auto BVI General investment 264,445 264,445 8,556,096 100.00 79,770 (12,359) (12,307) Subsidiary
Better Auto Famous Now BVI General investment US$ 4,000 US$ 4,000 1 100.00 51,779 (11,654) (11,654) Subsidiary
AdvanPOS Bright Mind Limited Samoa General investment - US$ 200 - - - - - Subsidiary
BEMC Avtek Delaware, USA General investment US$ 99,850 - - 100.00 3,266,342 53,173 53,173 Subsidiary
Avtek B+B Delaware, USA General investment US$ 99,850 - - 100.00 3,266,342 53,173 53,173 Subsidiary
B+B BBI Ireland Sale of industrial network communications systems US$ 39,481 - - 100.00 128,294 (18,762) (18,762) Subsidiary
Quatech Delaware, USA Sale of industrial network communications systems - - - 100.00 - - - Subsidiary
IMC Delaware, USA Sale of industrial network communications systems - - - 100.00 - - - Subsidiary
BBI B&B Electronics Delaware, USA Sale of industrial network communications systems US$ 1,314 - - 100.00 - - - Subsidiary
B+B (CZ) (formerly Conel) Czech Republic Sale of industrial network communications systems - - - 99.99 141,999 49,588 49,588 Subsidiary
Conel Automation (formerly
Softcon)
Czech Republic Sale of industrial network communications systems - - - 1.00 112 5,717 57 Subsidiary
B&B DMCC Dubai Sale of industrial network communications systems - - - 100.00 - - - Subsidiary
B&B Electronics B+B (CZ) (formerly Conel) Czech Republic Sale of industrial network communications systems - - - 0.01 - - - Subsidiary
B+B (CZ) (formerly Conel) Conel Automation (formerly
Softcon)
Czech Republic Sale of industrial network communications systems - - - 99.00 11,111 5,717 5,660 Subsidiary
Note A: The financial statements used as basis of net asset values had not been audited by independent CPAs, except those of AIN, AMX and Advantech Innovative Design Co., Ltd.
Note B: Refer to Table 9 for investments in mainland China.
Note C: In the first quarter of 2016, the Group made arrangements to acquire 100% equity in BEMC for US$99,850 thousand.
Note D: In the third quarter of 2016, ACA and AdvanPOS merged and ACA ceased to exist.
Note E: In the third quarter of 2016, the Group has adjusted its investment structure and the Company directly acquired 100% share equity of AiST.
(Concluded)

- 78 -
TABLE 9
ADVANTECH CO., LTD. AND INVESTEES
INVESTMENTS IN MAINLAND CHINA
FOR THE YEAR ENDED DECEMBER 31, 2016
(In Thousands of New Taiwan Dollars, Unless Stated Otherwise)
Investee Company Name Main Businesses and
Products
Total Amount
of Paid-in
Capital
Investment
Type (e.g.,
Direct or
Indirect)
Accumulated
Outflow of
Investment
from Taiwan
as of
January 1, 2016
Investment Flows Accumulated
Outflow of
Investment
from Taiwan
as of
December 31,
2016
Net Income
(Loss) of the
Investee
%
Ownership of
Direct or
Indirect
Investment
Investment
Gain (Loss)
(Note A)
Carrying
Value as of
December 31,
2016
Accumulated
Inward
Remittance of
Earnings as of
December 31,
2016
Outflow Inflow
Advantech Technology
(China) Company Ltd.
(AKMC)
Production and sale of
components of
industrial automation
products
US$ 43,750
thousand
(Note F)
Indirect $ 1,202,925
(US$ 37,300
thousand)
$ - $ - $ 1,202,925
(US$ 37,300
thousand)
$ 235,499 100 $ 227,951 $ 2,691,960 $ -
Beijing Yan Hua Xing Ye
Electronic Science &
Technology Co., Ltd. (ACN)
Sale of industrial
automation products
US$ 4,230
thousand
Indirect 171,957
(US$ 5,332
thousand)
- - 171,957
(US$ 5,332
thousand)
199,635 100 199,052 1,123,813 362,232
(US$ 11,232
thousand)
Shanghai Advantech
Intelligent Services Co., Ltd.
(AiSC)
Production and sale of
industrial automation
products
US$ 8,000
thousand
Indirect 258,000
(US$ 8,000
thousand)
- - 258,000
(US$ 8,000
thousand)
28,343 100 27,581 739,662 -
Xi’an Advantech Software Ltd.
(AXA)
Development and
production of
software products
US$ 1,000
thousand
Indirect (Note C) - - (Note C) (33,654) 100 (33,654) 7,771 -
Hangzhou Advantofine
Automation Tech. Co., Ltd.
Processing and sale of
industrial automation
products
RMB 3,000
thousand
Indirect (Note D) - - (Note D) (6,478) 100 (6,478) 14,954 -
Advanixs Kun Shan Corp. Production and sale of
industrial automation
products
RMB 99,515
thousand
Indirect (Note G) - - (Note G) 29,532 100 16,394 443,870 -
Accumulated Investment in
Mainland China as of
December 31, 2016
Investment Amounts Authorized
by Investment Commission,
MOEA
Allowable Limit on Investment
$1,639,332
(US$50,832 thousand)
(Note E)
$2,760,600
(US$85,600 thousand)
$15,232,138
(Note I)
(Continued)

- 79 -
Note A: The financial statements used as basis of asset values had been audited.
Note B: The significant events, prices, payment terms and unrealized gains or losses generated on trading between the Company and its investees in Mainland China are described in Tables 5.
Note C: Remittance by AAC (H.K.) Limited.
Note D: Remittance by ACN.
Note E: Included is the outflow of US$200 thousand on the investment in Yan Hua (Guang Zhou Bao Shui Qu) Co., Ltd. located in a free trade zone in Guang Zhou. When this investee was liquidated in September 2005, the outward investment
remittance ceased upon the approval of the Ministry of Economic Affairs (MOEA). For each future capital return, the Company will apply to the MOEA for the approval of the return as well as reduce the accumulated investment
amount by the return amount
Note F: For AKMC, there was a capital increase of US$6,450 thousand out of earnings.
Note G: ATC, parent company of ATC (HK), increased the share capital of ATC (HK) and ATC (HK) acquired 100% share equity of Advanixs Kun Shan Corp. from Yeh-Chiang Technology (Cayman).
Note H: The exchange rate was US$1.00=NT$32.25.
Note I: The maximum allowable limit on investment was at 60% of the consolidated net asset value of the Company.
(Concluded)