advantages of intercropping soybean with maize under...
TRANSCRIPT
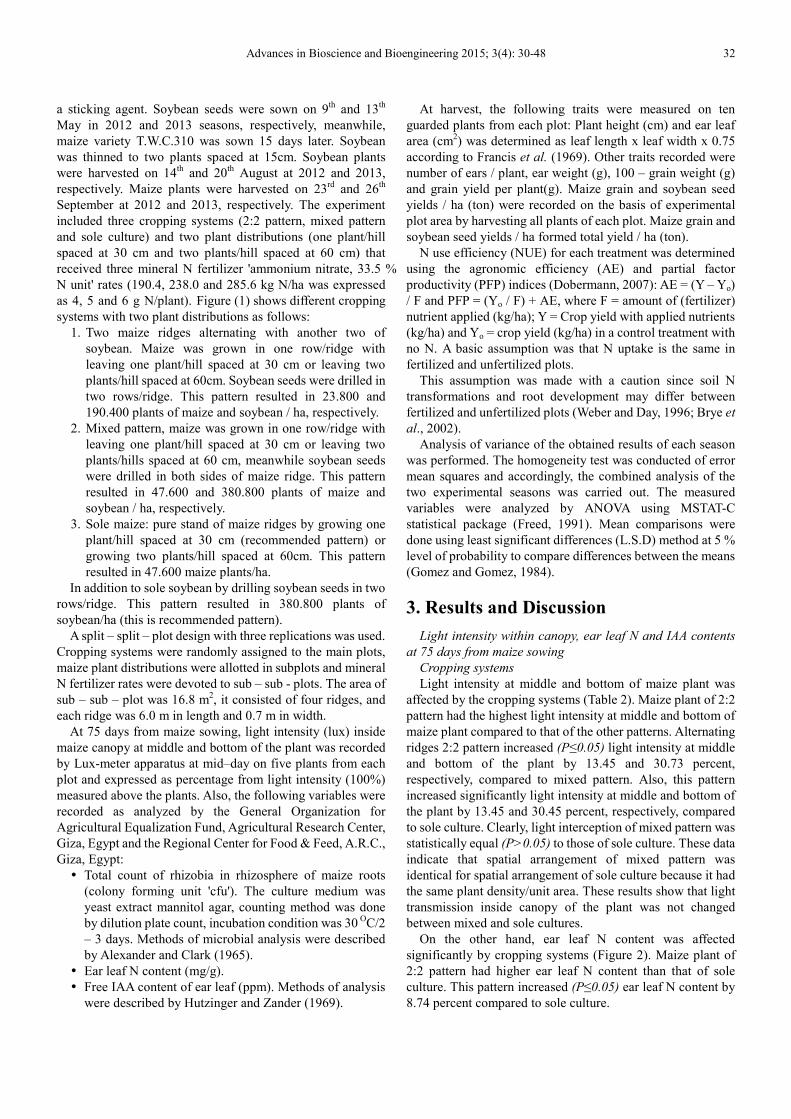
Advances in Bioscience and Bioengineering 2015; 3(4): 30-48 Published online August 25, 2015 (http://www.sciencepublishinggroup.com/j/abb) doi: 10.11648/j.abb.20150304.11 ISSN: 2330-4154 (Print); ISSN: 2330-4162 (Online)
Advantages of Intercropping Soybean with Maize Under Two Maize Plant Distributions and Three Mineral Nitrogen Fertilizer Rates
Moshira Ahmed El-Shamy1, Tamer Ibrahim Abdel-Wahab
1, Sherif Ibrahim Abdel-Wahab
1,
Samuel Berty Ragheb2
1Crop Intensification Research Department, Field Crops Research Institute, Agricultural Research Center, Giza, Egypt 2Food Legumes Research Department, Field Crops Research Institute, Agricultural Research Center, Giza, Egypt
Email address: [email protected] (M. A. El-Shamy)
To cite this article: Moshira Ahmed El-Shamy, Tamer Ibrahim Abdel-Wahab, Sherif Ibrahim Abdel-Wahab, Samuel Berty Ragheb. Advantages of Intercropping Soybean with Maize Under Two Maize Plant Distributions and Three Mineral Nitrogen Fertilizer Rates. Advances in Bioscience and
Bioengineering. Vol. 3, No. 4, 2015, pp. 30 – 48. doi: 10.11648/j.abb.20150304.11
Abstract: The advent of further bioengineering for growing soybean with maize holds only promise for the future of the crop intensification field. The present research studied responses of maize crop and its yield attributes to decrease mineral nitrogen (N) inputs by growing soybean with two maize plant distributions under three cropping systems. Local maize variety T.W.C. 310 was grown under intercropping and sole cultures in one row/ridge in one and two plants/hill spaced at 30 and 60cm, respectively, that received three mineral N fertilizer rates (4, 5 and 6 g N/plant), while local variety of soybean seeds Giza 82 were drilled in two rows/ridge. A split – split – plot design with three replications was used. Light intensity with in maize canopy, ear leaf N and indole acetic acid (IAA) contents were affected by all the studied factors. Mixed pattern increased grain yields per plant and per ha by 1.56 and 3.98 %, respectively, in comparison with sole culture in addition to yielding 1.74 ton/ha of soybean. Increasing number of plants from one to two plants/hill by increasing plant spacing from 30 to 60 cm increased grain yields per plant and per ha. There were no significant differences between the medium and the highest mineral N fertilizer rates for all the studied traits. Soybean improved N use efficiency (NUE) for maize plant of mixed pattern. The mixed pattern had a total yield increase of 29.79 % than sole maize. Growing soybean on both sides of maize ridge that distributed to two plants/hill spaced at 60 cm decreased 47.6 kg N/ha of the recommended mineral N rate of maize plants which formed the best bioengineered treatment under Egyptian conditions.
Keywords: Bioengineering, Soybean, Maize Plant Distributions, Mineral N Fertilizer, IAA, NUE
1. Introduction
Bioengineering as a defined field is relatively new, although attempts to solve biological problems have persisted throughout history. Recently, the practice of bioengineering has expanded beyond large-scale efforts for agricultural advancement. The highest maize (Zea mays L.) yield productivity depended on soil fertility, maize variety and nitrogen (N) fertilization (Ding et al., 2005). Maize plant development is strongly dependent on the availability of N in the soil and the efficiency of N utilization for biomass production and yield (Sonnewald, 2012). It is the world's most widely grown cereal and produced cereal crops (FAO, 2013). It is an important crop grown in summer/autumn throughout
Egypt for both grain and green fodder purposes. The demand for mineral N fertilizers that required for maize growth and development has prompted to minimize the N – fertilizer rates, especially N – the most frequent limiting factor of intensive agriculture production – which is extremely costly for many farmers (Montanez and Margarita, 2013). In addition, large losses of reactive N to the environment are still common from agricultural systems through transport of nitrate to ground water or surface waters and emissions of nitrous gases to the atmosphere (Davidson et al., 2014).
The most studied and longest exploited plant growth promoting rhizobacteria are the rhizobia for their ability to fix atmospheric N (Werner, 1992) in association with their legume host plants. Most of the research to optimize symbiotic N fixation and to increase the use of legumes in cropping

31 Moshira Ahmed El-Shamy et al.: Advantages of Intercropping Soybean with Maize Under Two Maize Plant Distributions and Three Mineral Nitrogen Fertilizer Rates
systems has been in part stimulated by increasing fertilizer prices and environmental concerns (Sanginga et al., 2003). There has been increasing evidence that rhizobia can play an important role in the growth promotion of non – legumes (Lupwayi et al., 2004). The subsidiary effect of having an N – fixing legume in a cropping system has been shown to be an important resource for N for intercropped cereal (Shen and Chu, 2004). In response to changes in N supply, plants display elaborate responses at both physiological and morphological levels to adjust their growth and development (Lošák et al., 2010). In grass crops, the transfer of the fixed N to the plant occurs slowly and only a small amount becomes available to plant; therefore, biological N fixation (BNF) by these bacteria (Azospirillum brasilense and Herbaspirillum seropedicae) in association with grass crops is only able to meet plant N demand partially (Hungria et al., 2011).
Plant hormones are chemical messengers that are produced in one part of the plant and have a physiological effect on a target tissue that may be distant from the site of production. Auxins, cytokinins, gibberellins, abscisic acid, and ethylene are the best known plant hormones. Natural and synthetic auxins have been used extensively in plant cell, tissue, and organ cultures to elicit specific morphogenetic responses (Bhojwani and Razdan, 1983). Until recently, the biosynthesis of indol-3-acetic acid (IAA "auxin") was hypothesized to occur via oxidative decarboxylation and deamination of the amino acid tryptophan (Bandurski et al., 1995). Since plant meristems are actively growing tissues where cell division governs sink strength, environmental signals can modulate plant responses to the growing conditions through changes in phytohormone concentrations, thus controlling assimilate partitioning between different sink tissues (Hartig and Beck, 2006). Amongst phytohormones, IAA was closely linked to N signaling (Kiba et al., 2011).
Obviously, plant responses to nutrient availability depend on the availability of other required resources. Solar radiation must be immediately intercepted by maize plant in order for it to drive photosynthesis. The light inhibition of IAA transport was closely related to the increase of IAA immobilization (Kondo et al., 1969). Certainly, light influences ammonia assimilation at the glutamine synthetase reaction in maize
leaves (Klaus et al., 1985), especially leaf N directly affects net photosynthetic rates (Meziane and Shipley, 2001).
Also, plant spacing varies with the growth of plants and the growing environments (Zhao et al., 1997). Doubling maize number from two to four plants/hill by increasing spacing between plants from 30 to 60 cm resulted in significant increments in maize yield and its attributes under intercropping and sole culture (Metwally et al., 2009). Therefore, the main objective of the present research was to study responses of maize crop and its yield attributes to decrease mineral N inputs by growing soybean with two maize plant distributions under three cropping systems.
2. Materials and Methods
A research was carried out at Sakha Agricultural Experiments and Research Station, Agricultural Research Center (A.R.C.), Kafr El – Sheikh governorate (31°06'42"N, 30°56'45"E, 17 m a.s.l.), Egypt, during 2012 and 2013 summer seasons. Wheat was the preceding winter crop in both seasons. Bioengineering approach was the interaction among cropping systems, maize plant distributions and mineral N fertilizer rates in addition to varieties of both species and environmental (climatic and edaphic) conditions such as temperature, relative humidity, sunshine hours, water duty, mechanical, chemical and biological soil structure. Mechanical analysis of the soil (0 – 30 cm), sand (9.5 %), silt (53.0 %), clay (37.5 %), the experimental soil was a loamy clay texture. Chemical analysis of the soil (0 – 30 cm), pH value (7.95), organic matter (1.64 %), available N (30.5 ppm), available phosphorus (7.77 ppm) and available potassium (392.5 ppm) were analyzed by Water and Soil Research Institute, A.R.C. Methods of mechanical and chemical analysis were described by Chapman and Pratt (1961). The average monthly temperature for the two years ranged from 20.8 to 34.7 °C in the first season and from 21.8 to 33.8 °C in the second season, the average relative humidity ranged from 50.0 to 84.9 % in the first season and from 45.7 to 83.6 % in the second season, meanwhile the average sunshine hours ranged from 10.4 to 12.5 hours (Table 1).
Table 1. Meteorological information data of Kafr El-Sheikh governorate (May–September) in 2012 and 2013 summer seasons.
Season
2012 2013
Temperature (0C) Relative humidity (%) Sunshine
(hours)
Temperature (0C) Relative humidity (%) Sunshine
(hours) Max. Min. 7.30 1.30 Max. Min. 7.30 1.30
May 30.8 20.8 75.7 50.0 11.0 31.4 21.8 75.0 45.7 11.0 June 33.6 23.5 79.6 50.7 12.5 32.4 23.9 74.6 51.2 12.5 July 33.2 25.3 84.0 53.0 12.3 32.3 24.3 79.5 54.7 12.3 August 34.7 25.0 84.9 52.1 11.5 33.8 24.8 83.6 60.5 11.5 September 32.3 22.7 82.8 52.3 10.4 32.5 22.9 81.0 56.6 10.4
� Rice Research and Training Center (RRTC), Sakha Agriculture Research Station, Monthly weather observations. � Average relative humidity (%), at 7.30 and 13.30 hour.
Calcium super phosphate (15.5 % P2O5) at rate of 357 kg / ha and potassium sulfate (48.0 % K2O) at rate of 119 kg / ha were applied during soil preparation for planting maize and soybean in the two summer seasons. Water was supplied by
furrow irrigation (water duty = 8806 m3 / ha in 2012 summer season and 8330 m3 / ha in 2013 summer season). Seeds of the early – maturing soybean variety Giza82 were inoculated with Bradyrhizobium japonicum and gum Arabic was used as
Advances in Bioscience and Bioengineering 2015; 3(4): 30-48 32
a sticking agent. Soybean seeds were sown on 9th and 13th May in 2012 and 2013 seasons, respectively, meanwhile, maize variety T.W.C.310 was sown 15 days later. Soybean was thinned to two plants spaced at 15cm. Soybean plants were harvested on 14th and 20th August at 2012 and 2013, respectively. Maize plants were harvested on 23rd and 26th September at 2012 and 2013, respectively. The experiment included three cropping systems (2:2 pattern, mixed pattern and sole culture) and two plant distributions (one plant/hill spaced at 30 cm and two plants/hill spaced at 60 cm) that received three mineral N fertilizer 'ammonium nitrate, 33.5 % N unit' rates (190.4, 238.0 and 285.6 kg N/ha was expressed as 4, 5 and 6 g N/plant). Figure (1) shows different cropping systems with two plant distributions as follows:
1. Two maize ridges alternating with another two of soybean. Maize was grown in one row/ridge with leaving one plant/hill spaced at 30 cm or leaving two plants/hill spaced at 60cm. Soybean seeds were drilled in two rows/ridge. This pattern resulted in 23.800 and 190.400 plants of maize and soybean / ha, respectively.
2. Mixed pattern, maize was grown in one row/ridge with leaving one plant/hill spaced at 30 cm or leaving two plants/hills spaced at 60 cm, meanwhile soybean seeds were drilled in both sides of maize ridge. This pattern resulted in 47.600 and 380.800 plants of maize and soybean / ha, respectively.
3. Sole maize: pure stand of maize ridges by growing one plant/hill spaced at 30 cm (recommended pattern) or growing two plants/hill spaced at 60cm. This pattern resulted in 47.600 maize plants/ha.
In addition to sole soybean by drilling soybean seeds in two rows/ridge. This pattern resulted in 380.800 plants of soybean/ha (this is recommended pattern).
A split – split – plot design with three replications was used. Cropping systems were randomly assigned to the main plots, maize plant distributions were allotted in subplots and mineral N fertilizer rates were devoted to sub – sub - plots. The area of sub – sub – plot was 16.8 m2, it consisted of four ridges, and each ridge was 6.0 m in length and 0.7 m in width.
At 75 days from maize sowing, light intensity (lux) inside maize canopy at middle and bottom of the plant was recorded by Lux-meter apparatus at mid–day on five plants from each plot and expressed as percentage from light intensity (100%) measured above the plants. Also, the following variables were recorded as analyzed by the General Organization for Agricultural Equalization Fund, Agricultural Research Center, Giza, Egypt and the Regional Center for Food & Feed, A.R.C., Giza, Egypt:
� Total count of rhizobia in rhizosphere of maize roots (colony forming unit 'cfu'). The culture medium was yeast extract mannitol agar, counting method was done by dilution plate count, incubation condition was 30 OC/2 – 3 days. Methods of microbial analysis were described by Alexander and Clark (1965).
� Ear leaf N content (mg/g). � Free IAA content of ear leaf (ppm). Methods of analysis
were described by Hutzinger and Zander (1969).
At harvest, the following traits were measured on ten guarded plants from each plot: Plant height (cm) and ear leaf area (cm2) was determined as leaf length x leaf width x 0.75 according to Francis et al. (1969). Other traits recorded were number of ears / plant, ear weight (g), 100 – grain weight (g) and grain yield per plant(g). Maize grain and soybean seed yields / ha (ton) were recorded on the basis of experimental plot area by harvesting all plants of each plot. Maize grain and soybean seed yields / ha formed total yield / ha (ton).
N use efficiency (NUE) for each treatment was determined using the agronomic efficiency (AE) and partial factor productivity (PFP) indices (Dobermann, 2007): AE = (Y – Yo) / F and PFP = (Yo / F) + AE, where F = amount of (fertilizer) nutrient applied (kg/ha); Y = Crop yield with applied nutrients (kg/ha) and Yo = crop yield (kg/ha) in a control treatment with no N. A basic assumption was that N uptake is the same in fertilized and unfertilized plots.
This assumption was made with a caution since soil N transformations and root development may differ between fertilized and unfertilized plots (Weber and Day, 1996; Brye et
al., 2002). Analysis of variance of the obtained results of each season
was performed. The homogeneity test was conducted of error mean squares and accordingly, the combined analysis of the two experimental seasons was carried out. The measured variables were analyzed by ANOVA using MSTAT-C statistical package (Freed, 1991). Mean comparisons were done using least significant differences (L.S.D) method at 5 % level of probability to compare differences between the means (Gomez and Gomez, 1984).
3. Results and Discussion
Light intensity within canopy, ear leaf N and IAA contents
at 75 days from maize sowing
Cropping systems
Light intensity at middle and bottom of maize plant was affected by the cropping systems (Table 2). Maize plant of 2:2 pattern had the highest light intensity at middle and bottom of maize plant compared to that of the other patterns. Alternating ridges 2:2 pattern increased (P≤0.05) light intensity at middle and bottom of the plant by 13.45 and 30.73 percent, respectively, compared to mixed pattern. Also, this pattern increased significantly light intensity at middle and bottom of the plant by 13.45 and 30.45 percent, respectively, compared to sole culture. Clearly, light interception of mixed pattern was statistically equal (P>0.05) to those of sole culture. These data indicate that spatial arrangement of mixed pattern was identical for spatial arrangement of sole culture because it had the same plant density/unit area. These results show that light transmission inside canopy of the plant was not changed between mixed and sole cultures.
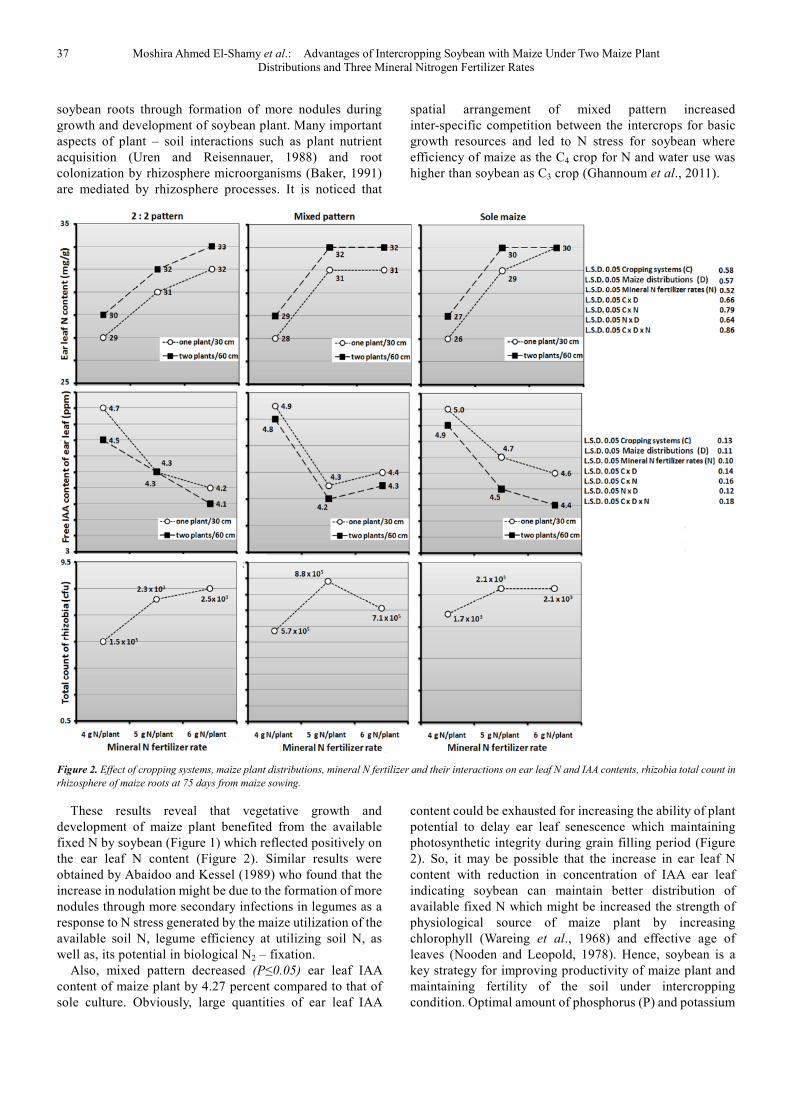
On the other hand, ear leaf N content was affected significantly by cropping systems (Figure 2). Maize plant of 2:2 pattern had higher ear leaf N content than that of sole culture. This pattern increased (P≤0.05) ear leaf N content by 8.74 percent compared to sole culture.

33 Moshira Ahmed El-Shamy et al.: Advantages of Intercropping Soybean with Maize Under Two Maize Plant Distributions and Three Mineral Nitrogen Fertilizer Rates
Figure 1. Intercropping soybean with maize and sole maize under two plant distributions.

Advances in Bioscience and Bioengineering 2015; 3(4): 30-48 34
Figure 1. Continued.
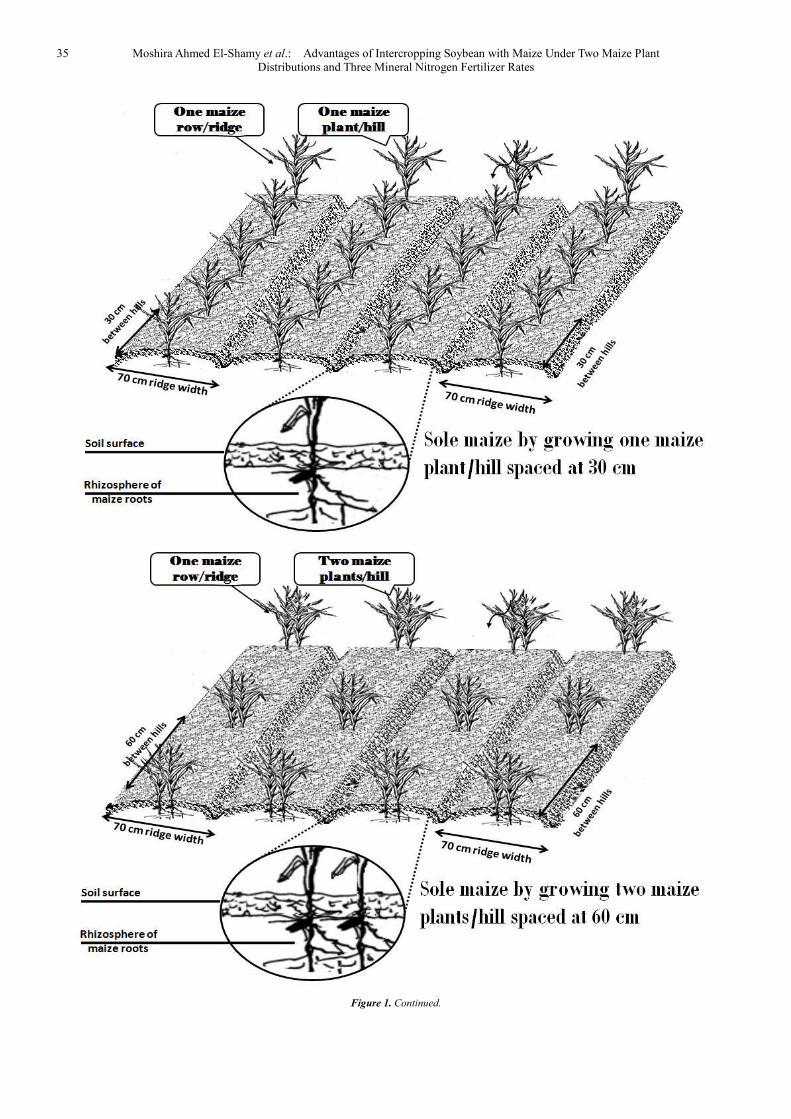
35 Moshira Ahmed El-Shamy et al.: Advantages of Intercropping Soybean with Maize Under Two Maize Plant Distributions and Three Mineral Nitrogen Fertilizer Rates
Figure 1. Continued.

Advances in Bioscience and Bioengineering 2015; 3(4): 30-48 36
Table 2. Effect of cropping systems, maize plant distributions, mineral N fertilizer and their interactions on light intensity within maize canopy, combined data
across 2012 and 2013 seasons.
Cropping system Maize plant distributions
Percentages of light intensity at
Middle of the plant Bottom of the plant
4 g N
/plant
5 g N
/plant
6 g N
/plant Mean
4 g N
/plant
5 g N
/plant
6 g N
/plant Mean
2:2 pattern 1P/30cm 26.52 26.02 25.96 26.16 12.11 11.88 11.73 11.90
2P/60cm 27.27 26.55 26.60 26.80 12.93 12.41 12.46 12.60
Mean 26.89 26.28 26.28 26.48 12.52 12.14 12.09 12.25
Mixed pattern 1P/30cm 23.39 22.61 22.66 22.88 9.31 8.85 8.89 9.01
2P/60cm 24.15 23.71 23.59 23.81 10.10 9.58 9.55 9.74
Mean 23.77 23.16 23.12 23.34 9.70 9.21 9.22 9.37
Average of intercropping 25.33 24.72 24.70 24.91 11.11 10.67 10.65 10.81
Sole culture 1P/30cm 23.44 22.58 22.70 22.90 9.37 8.93 8.99 9.09
2P/60cm 24.08 23.68 23.63 23.79 10.02 9.52 9.56 9.70
Mean 23.76 23.13 23.16 23.34 9.69 9.22 9.27 9.39
Average of maize plant distributions
1P/30cm 24.45 23.73 23.77 23.98 10.26 9.88 9.87 10.00
2P/60cm 25.16 24.64 24.60 24.80 11.01 10.50 10.52 10.67
Average of N fertilizer rates 24.80 24.19 24.18 24.39 10.63 10.19 10.19 10.33
L.S.D.0.05 Cropping systems (C) 1.12 0.77
L.S.D.0.05 Maize plant distributions (D) 0.71 0.59
L.S.D.0.05 Mineral N fertilizer (N) 0.52 0.38
L.S.D.0.05 C x D 1.26 0.81
L.S.D.0.05 C x N 1.33 0.84
L.S.D.0.05 N x D 0.94 0.67
L.S.D.0.05 C x D x N 1.55 0.92
These results could be due to spatial arrangement of 2:2
pattern formed 50:50 percent of number of each crop/unit area compared to sole crops. Consequently, this pattern deceased intra–specific competition between maize plants for basic growth resources (especially solar radiation transmission) which enhanced efficiency of photosynthesis process in maize plant. It is known that the light environment surrounding plants affects seedling growth (Schopfer, 1984). In vegetative canopies, the profile of N concentration in leaves has been shown to be positively correlated to the light environment experienced by the leaves (Werger and Hirose, 1991). The N concentration in a leaf layer can be related to the proportion of the incoming light that reaches that layer (Milroy et al., 2001). Moreover, ribulose 1,5 carboxylase / oxygenas (Rubisco) activity and phosphor enol pyruvate carboxylase (PEPc) activity that plays a major role in photosynthesis process varies with leaf age, N content and light environment during the growth of plants (Tazoe et al., 2006).
Also, free IAA content of ear leaf was affected significantly by cropping systems (Figure2). Free IAA content of ear leaf in maize plant of 2:2 pattern was decreased (P≤0.05) by 7.05 percent compared to that of sole culture. These results reveal that vegetative growth and development of the plant benefited greatly from available environmental climatic resources especially solar radiation where light has been shown to alter the levels of IAA (Behringer and Davies, 1992). Resource use efficiency is not likely to be much affected in intercropping systems with component crops that differ in growing period, since competition between component crops is weak (Fukai and
Trenbath, 1993). Consequently, spatial arrangement of 2:2 pattern could be influenced assimilates accumulation of the plant by the effects on IAA activity where IAA starts the movement of carbohydrates during their manufacture (Awan et al., 1999). Moreover, light has a profound effect on the growth and development of plants (Briggs and Olney, 2001). Accordingly, photosynthetic pigments such as carotenoids contents, chlorophyll a and b increased with changing concentrations of IAA (Parvaiz, 2014).
These findings imply that plant growth and development involved biochemical reactions that are sensitive to solar radiation. Growing two soybean ridges alternating with two maize ridges increased ear leaf N that appeared to be associated with single leaf photosynthetic rates. So, a higher quantity of IAA would be required to the photosynthetic process in the presence of high light intensity, indicating that there was an increase in the efficiency of photosynthesis process in maize plant of 2:2 pattern than that of sole culture.
Clearly, advantage of 2:2: pattern could be due to this pattern formed better above – ground conditions especially light intensity for maize growth and development than those of sole culture (Metwally et al., 2009).
With regard to mixed pattern, maize plant of this pattern had higher ear leaf N content than that of sole culture. This pattern increased (P≤0.05) ear leaf N content by 6.64 percent compared to sole culture. It is observed that growing soybean with maize on the same ridge promoted rhizobia growth in rhizosphere of maize root compared to those in rhizosphere of sole maize (Figure2). Consequently, this spatial arrangement pattern could be increased nodulation of
37 Moshira Ahmed El-Shamy et al.: Advantages of Intercropping Soybean with Maize Under Two Maize Plant Distributions and Three Mineral Nitrogen Fertilizer Rates
soybean roots through formation of more nodules during growth and development of soybean plant. Many important aspects of plant – soil interactions such as plant nutrient acquisition (Uren and Reisennauer, 1988) and root colonization by rhizosphere microorganisms (Baker, 1991) are mediated by rhizosphere processes. It is noticed that
spatial arrangement of mixed pattern increased inter-specific competition between the intercrops for basic growth resources and led to N stress for soybean where efficiency of maize as the C4 crop for N and water use was higher than soybean as C3 crop (Ghannoum et al., 2011).
Figure 2. Effect of cropping systems, maize plant distributions, mineral N fertilizer and their interactions on ear leaf N and IAA contents, rhizobia total count in
rhizosphere of maize roots at 75 days from maize sowing.
These results reveal that vegetative growth and development of maize plant benefited from the available fixed N by soybean (Figure 1) which reflected positively on the ear leaf N content (Figure 2). Similar results were obtained by Abaidoo and Kessel (1989) who found that the increase in nodulation might be due to the formation of more nodules through more secondary infections in legumes as a response to N stress generated by the maize utilization of the available soil N, legume efficiency at utilizing soil N, as well as, its potential in biological N2 – fixation.
Also, mixed pattern decreased (P≤0.05) ear leaf IAA content of maize plant by 4.27 percent compared to that of sole culture. Obviously, large quantities of ear leaf IAA
content could be exhausted for increasing the ability of plant potential to delay ear leaf senescence which maintaining photosynthetic integrity during grain filling period (Figure 2). So, it may be possible that the increase in ear leaf N content with reduction in concentration of IAA ear leaf indicating soybean can maintain better distribution of available fixed N which might be increased the strength of physiological source of maize plant by increasing chlorophyll (Wareing et al., 1968) and effective age of leaves (Nooden and Leopold, 1978). Hence, soybean is a key strategy for improving productivity of maize plant and maintaining fertility of the soil under intercropping condition. Optimal amount of phosphorus (P) and potassium

Advances in Bioscience and Bioengineering 2015; 3(4): 30-48 38
(K) in the soil cannot be utilized efficiently if N is deficient in plants where N mediates the utilization of P, K and other elements in plants (Brady, 1984). Accordingly, it seems that soybean could be controlled the size of sink and source of maize plant of mixed pattern. These findings imply that advantage of mixed pattern due to this pattern formed better under – ground conditions for maize growth and development than those of sole maize. These results are in accordance with those obtained by Odongo et al. (1988) who concluded that inoculation of soybean seeds increased N concentration and accumulation in maize grains. Also, Ribaut and Pilet (1994) reported that increased levels of IAA have been correlated with reduced growth. Moreover, Taiz and Zeiger (2002) showed that one of the effective factors that can control the size of sink and source are plant growth regulators. However, Alves et al., (2011) found that inoculation with the strain BR11417 of Herbaspirillum
seropedicae contributed in average with 26 % of the N necessary for the development of maize. Furthermore, Hayat et al. (2012) revealed one the mechanisms of the plant growth promoting bacteria – mediated enhancement of crop growth is production of hormones, i.e. IAA.
Maize plant distributions
Maize plant distributions affected significantly light intensity at middle and bottom of plant (Table 2). Increasing number of maize plants from one to two plants/hill by increasing plant spacing from 30 to 60 cm (with the same plant density/unit area) increased (P≤0.05) light intensity at middle and bottom of the plant by 3.41 and 6.70 percent, respectively. Accordingly, it is expected that one plant/hill had not enough space to grow and competition for solar radiation compared to two plants/hill.
On the other hand, ear leaf N and free IAA contents were affected significantly by maize plant distributions (Figure 2). Increasing number of plants from one to two plants/hill increased (P≤0.05) ear leaf N content by 3.04 percent, but it decreased (P≤0.05) free IAA content of ear leaf by 2.63 percent at 75 days from maize sowing. These data may be due to growing two plants/hill at wide plant spacing decreased intra–specific competition between plants for basic growth resources especially solar radiation where the stimulation of IAA–aspartic acid synthesis by light caused depletion of free IAA (Zelena, 2000). IAA plays a key role in both root and shoot development (Reinhardt et al., 2003). Consequently, light quantity, quality, direction and duration have great impact on photosynthesis and other growth and developmental events in plants (Franklin and Whitelam, 2005). These findings indicate that growth and development of different parts of the plant may be acclimated by increasing plant spacing from 30 to 60 cm which improved the translocation of water and nutrients between root and leaves of the plant especially maize is one of the C4 plants and is immune for light saturation. Obviously, the plant had high ability for acclimation by increasing number of plants/hill with good utilization of nutrients and water (Abdel-Galil et al., 2014). These results are in accordance with those observed by Sharwood et al. (2014) who
concluded that leaf N concentration tended to be lower in the shaded plants relative to the control because of shade can perturb CO2 concentration mechanisms efficiency as evidenced by changed leakiness during photosynthesis process. They added that long–term acclimation to low light in maize causes a reduction in bundle – sheath cell leakiness.
Mineral N fertilizer
Light intensity at middle and bottom of plant was affected by mineral N fertilizer (Table 2). Light intensity at middle and bottom of plant was decreased significantly by increasing mineral N fertilizer rate from 4 to 6 g N/plant without any significant differences between the medium (5 g N/plant) and the highest (6 g N/plant) mineral N fertilizer rates. Increasing mineral N fertilizer rate from 4 to 5 g N/plant decreased (P≤0.05) light intensity at middle and bottom of plant by 2.45 and 4.13 percent, respectively, at 75 days from maize sowing. Also, increasing mineral N fertilizer rate from 4 to 6 g N/plant decreased (P≤0.05) light intensity at middle and bottom of plant by 2.50 and 4.13 percent, respectively, at 75 days from maize sowing. These data indicate that intercepted solar radiation by the plant canopy was affected positively by increasing mineral N fertilizer rate from 4 to 5 or 6 g N/plant that increased ability of the plant for convert more solar energy to chemical energy.
On the other hand, ear leaf N and IAA contents were affected significantly by mineral N fertilizer (Figure 2). Ear leaf N content was increased significantly by increasing mineral N fertilizer rate from 4 to 6 g N/plant, meanwhile the reverse was true for ear leaf IAA, without any significant differences between the medium (5 g N/plant) and the highest (6 g N/plant) mineral N fertilizer rates. Increasing mineral N fertilizer rate from 4 to 5 or 6 g N/plant increased (P≤0.05) ear leaf N content by 9.60 or 11.38 percent, respectively, at 75 days from maize sowing. Also, increasing mineral N fertilizer rate from 4 to 5 or 6 g N/plant decreased (P≤0.05) ear leaf IAA content by 8.75 or 9.79 percent, respectively, at 75 days from maize sowing. These results may be due to adding 5 or 6 g N to the plant decreased the root / shoot ratio that improved N uptake by decreasing IAA synthesized in tissues of the plant. IAA is a molecule that is synthesized by plants and a few microbes (Basse et al., 1996). These results are in agreement with those obtained by Baldotto et al. (2012) who found that with increasing rates of fertilizers, there was a decrease in the root / shoot ratio, confirming the increased availability of nutrients in the root environment. Also, Pavlíková et al. (2012) showed that N is a macronutrient present in many key biological molecules and it is available for plants predominantly as NO3
– and NH4
+ that reduced IAA concentration where there is a correlation between NO3
– and IAA (R2 = 0.77 – 0.94). Response of cropping systems to maize plant distributions
Light intensity at middle and bottom of plant, ear leaf N and free IAA contents were affected significantly by the interaction between cropping systems and maize plant distributions (Table 2 and Figure 2). Growing two maize

39 Moshira Ahmed El-Shamy et al.: Advantages of Intercropping Soybean with Maize Under Two Maize Plant Distributions and Three Mineral Nitrogen Fertilizer Rates
plants/hill in 2:2 pattern had the highest light intensity at middle and bottom of plant and ear leaf N content but it had the lowest free IAA content of ear leaf compared to those of the other treatments. It is observed that soybean played a major role in enhancing maize productivity of 2:2 pattern by decreasing plant density to 50 percent of sole culture at wide plant spacing. Accordingly, this interaction increased light penetration within canopies of both species compared to those of the other treatments (Metwally et al., 2009).
However, mixed pattern integrated with wide plant spacing to reach the similar or less response of 2:2 pattern for light interception, ear leaf N and free IAA contents compared to sole culture. Growing one maize plant/hill spaced at 30 cm in mixed pattern could be decreased the export of carbohydrates from the shoot to the root of both species and decreased the ratio of root biomass to shoot biomass (Thomley, 1972) that could be affected negatively translocation of assimilates. Dry matter production often shows a positive correlation with the amount of intercepted radiation by crops in intercropping system (Sivakumar and Virmani, 1980). Growing two maize plants/hill spaced at 60 cm improved efficiency of soybean photosynthesis process that promoted rhizobia growth in rhizosphere of maize root (100 percent of sole maize density) at 75 days from maize sowing (Figure 2); especially the morphological and physiological differences between non–legumes and legumes benefit their mutual association (Akuda, 2001).These data indicate that each of these two factors act dependently on light intensity at middle and bottom of plant, ear leaf N and free IAA contents meaning that cropping systems responded differently (P≤0.05) to maize plant distributions for light intensity at middle and bottom of plant, ear leaf N and free IAA contents.
Response of cropping systems to mineral N fertilizer
Light intensity at middle and bottom of plant, ear leaf N and free IAA contents were affected significantly by the interaction between cropping systems and mineral N fertilizer (Table 2 and Figure 2). Maize plant of 2:2 pattern that received 6 g N had the highest light intensity at middle and bottom of plant and ear leaf N content but it had the lowest free IAA content of ear leaf compared to that of the other treatments. These data may be attributed to plant density of 2:2 pattern (50 percent of sole culture) contributed positively in increasing light transmission within intercrops and enhanced efficiency of photosynthesis process. Consequently, this interaction could be increased synthesis of amino acids into vegetative tissues of the plant.
On the other hand, mixed pattern integrated with mineral N fertilizer to reach the similar or less response of 2:2 pattern to mineral N fertilizer for light intensity at middle and bottom of plant, ear leaf N and free IAA contents. These data may be due to plant density of mixed pattern (100 percent of sole culture) contributed negatively in efficiency of light transmission within intercrops and affected negatively photosynthesis process. The reduction in photosynthesis process could be reflected on the reduction in amino acids into vegetative tissues of the plant. It is
important to mention that maize plant of mixed pattern that received 5 g N had the same contents of ear leaf N and free IAA when received 6 g N. Clearly, adding 5 g N to the plant enhanced nodulation of adjacent soybean root in rhizosphere of maize root (Figure 1) and promoted rhizobia growth in rhizosphere of maize root (Figure 2). The greater competition of maize for available soil N at high bean populations, when legumes were nearer to maize rows, might have stimulated root nodulation of intercropped beans (Abaidoo and Kessel, 1989). Moreover, symbiotic N fixation begins after the formation of nodules then reaches maximum activity in the early stages of pod filling, and subsides in the late reproductive stage (George and Singleton, 1992). These findings imply that there was adequate period of maize vegetative growth for inter-specific competition with soybean on fixed N to benefit it. By adding 5 g N to the plant, it is observed that soybean fixed about 20 percent of maize N requirements where nodulation and N fixation by legumes is adversely affected by higher rates of fertilizer N (Dogra and Dudeja, 1993). These data reveal that each of these two factors act dependently on light intensity at middle and bottom of plant, ear leaf N and free IAA contents meaning that cropping systems responded differently (P≤0.05) to mineral N fertilizer for light intensity at middle and bottom of plant, ear leaf N and free IAA contents.
Response of maize plant distributions to mineral N
fertilizer
Light intensity at middle and bottom of plant, ear leaf N and free IAA contents were affected significantly by the interaction between maize plant distributions and mineral N fertilizer (Table 2 and Figure 2). Growing two plants/hill that received 12 g N had the highest light intensity at middle and bottom of plant and ear leaf N content but it had the lowest free IAA content of ear leaf compared to the other treatments. These data may be due to growing two plants/hill at wide plant spacing increased light transmission within intercrops and led to a positive effect on efficiency of photosynthesis process. These data show that each of these two factors act dependently on light intensity at middle and bottom of plant, ear leaf N and free IAA contents meaning that maize plant distributions responded differently (P≤0.05) to mineral N fertilizer for light intensity at middle and bottom of plant, ear leaf N and free IAA contents.
Response of cropping systems and mineral N fertilizer to
maize plant distributions
Light intensity at middle and bottom of plant, ear leaf N and free IAA contents were affected significantly by the interactions among cropping systems, maize plant distributions and mineral N fertilizer (Table 2 and Figure 2). Growing two maize plants/hill in 2:2 pattern that received 12 g N had the highest light intensity at middle and bottom of plant and ear leaf N content but it had the lowest free IAA content of ear leaf which formed the best bioengineered treatment compared to the other treatments. These data reveal that there was effect (P≤0.05) of cropping systems x maize plant distributions x mineral N fertilizer on light
Advances in Bioscience and Bioengineering 2015; 3(4): 30-48 40
intensity at middle and bottom of plant, ear leaf N and free IAA contents.
Yield and its attributes
Cropping systems
Ear leaf area, number of ears/plant, ear weight, 100 – kernel weight, grain yield/plant, grain, seed and total yields/ha were affected significantly by cropping systems (Tables 3 and 4). Intercropping soybean with maize increased significantly ear leaf area, number of ears/plant, ear weight and grain yield/plant compared to sole culture, meanwhile the reverse was true for 100–kernel weight, grain and total yields/ha. As a result of intercropping; ear leaf area, ear weight and grain yield/plant were increased (P≤0.05) by 4.93, 7.04 and 3.76 %, respectively, compared to sole culture. These results may be attributed to there was yield advantage occurred because growth resources such as light, water, and nutrients are more completely absorbed and converted to crop biomass by the intercrop over time and space as a result of differences in competitive ability for growth resources between the component crops (Tsubo et al., 2001).
Maize plant of 2:2 pattern had the highest ear leaf area, number of ears, ear weight and grain yield/plant than that of the other patterns, meanwhile, the opposite trend was true for 100 – kernel weight, grain and total yields/ha. These results may be attributed to maize of 2:2 pattern benefited greatly from environmental climatic resources and decreased intra–specific competition for basic growth resources that reflected on the highest grain yield/plant compared to that of the other patterns. Clearly, the advantage of alternating ridges of this pattern could be due to soybean gave more space for adjacent maize plant to grow well by decreasing plant density to 50 percent of sole culture and increased light intensity between plants (Metwally et al., 2009). However, plant density of 2:2 pattern was not sufficient to produce the highest grain and total yields/ha.
In other words, spatial arrangement of 2:2 pattern formed suitable climatic environmental conditions for growth and development which reflected positively on ear leaf area (Table 3) that contributed largely in higher photosynthates in the developing ears/plant compared to the other patterns (Table 4). Similar results were obtained by Metwally et al. (2009) who found that intercropping pattern (2:2) recorded higher grain yield / unit area than sole culture.
Accordingly, spatial arrangement of 2:2 pattern improved maize productivity through producing high amount of ear leaf N content that enhanced growth and development by exhausting large quantities of IAA for producing more assimilates that partitioned to the developing ears compared to the other treatments (Figure 2). Spatial arrangement has an important influence on the degree of competition between crops (Addo – Quaye et al., 2011).
Although plant density was identical between mixed pattern and sole culture, however, mixed pattern increased grain and total yields/ha compared to sole culture. Growing soybean with maize on the same ridge had higher grain and
total yields/ha than sole culture. There is evidence that leguminous plants can benefit the intercrop cereals in the same season through N excretion (Eaglesham et al., 1981) and nodule decomposition (Bonetti, 1991). Plant growth and dry weight was increased by plant growth promoting rhizobacteria application (Zahir et al., 1998). Clearly, mixed pattern played an important role to improve edaphic environmental conditions in rhizosphere of intercropped maize roots (Wiehe and Höflich, 1995) which reflected positively on ear leaf N and free IAA contents (Figure 2) that maximized carbon assimilation and crop productivity (Dreccer et al., 2000) compared to sole culture. Obviously, the fixed N by legume can be use by intercropped cereals during their growing period and this N is an important resource for the cereals (Shen and Chu, 2004). Moreover, Gao et al. (2010) found that the grain yield of maize as an intercrop were significantly greater than those of maize as a sole crop. Soybean facilitates N uptake of the intercropping maize (Shu – Min and Fan, 2011) and consequently, N symbiotic fixation has contributed to facilitate N uptake for intercropped maize (Latati et al., 2013).
Maize plant distributions
Ear leaf area, ear weight, 100 – kernel weight, grain yield / plant, grain, seed and total yields/ha were affected significantly by maize plant distributions, meanwhile, number of ears/plant was not affected (Tables 3 and 4). Increasing number of plants from one to two plants/hill by increasing plant spacing from 30 to 60 cm (with the same plant density/unit area) increased significantly ear leaf area, ear weight, grain yield/plant, grain and total yields/ha. In other words, doubling number of plants from one to two plants/hill increased (P≤0.05) grain yield/plant, grain and total yields/ha by 1.21, 2.00 and 3.11 %, respectively. Although symmetry of plant density was found between two types plant distribution, however, wide plant spacing had higher ear leaf N content than the other one (Figure 2). Obviously, growing two plants/hill led to largely balance in plant–to–plant competition for climatic and edaphic environmental conditions that enhanced ear leaf area for convert more solar energy to chemical energy and more translocation of photosynthates metabolites to the sink (ears), especially leaf N is distributed in parallel to light distribution (Anten et al., 1995). The leaves of plants grown in the shade often exhibit what is called the shade avoidance syndrome (Smith, 2000). These results are in accordance with those obtained by Kessel and Roskoski (1988) who indicated that maize grown at the 40 cm row spacing was under more N stress than maize grown at wider rows pacing. Also, Metwally et al. (2009) found that total leaf area, grain yields per plant and per ha were increased by increasing plant spacing from 30 to 60 cm. Moreover, Yin et al. (2011) showed that the estimated bundle – sheath conductance values on leaf – area basis ranged from 1.4 to 10.3 mmol m-2s-1 and were affected more by leaf N content than by leaf age, although bundle–sheath conductance tended to decrease as leaves became older. Under the condition of ambient CO2 and saturating irradiance, photo respiratory loss accounted for
41 Moshira Ahmed El-Shamy et al.: Advantages of Intercropping Soybean with Maize Under Two Maize Plant Distributions and Three Mineral Nitrogen Fertilizer Rates
3–5 % of fixed carbon for the high N, versus 1–2 % for the low–N, leaves. Finally, Jiang et al. (2013) concluded that the reductive activity of maize roots in all soil layers and dry
weights of shallow roots were decreased significantly under narrow plant spacing conditions, resulting in lower root biomass and yield reduction at maturity.
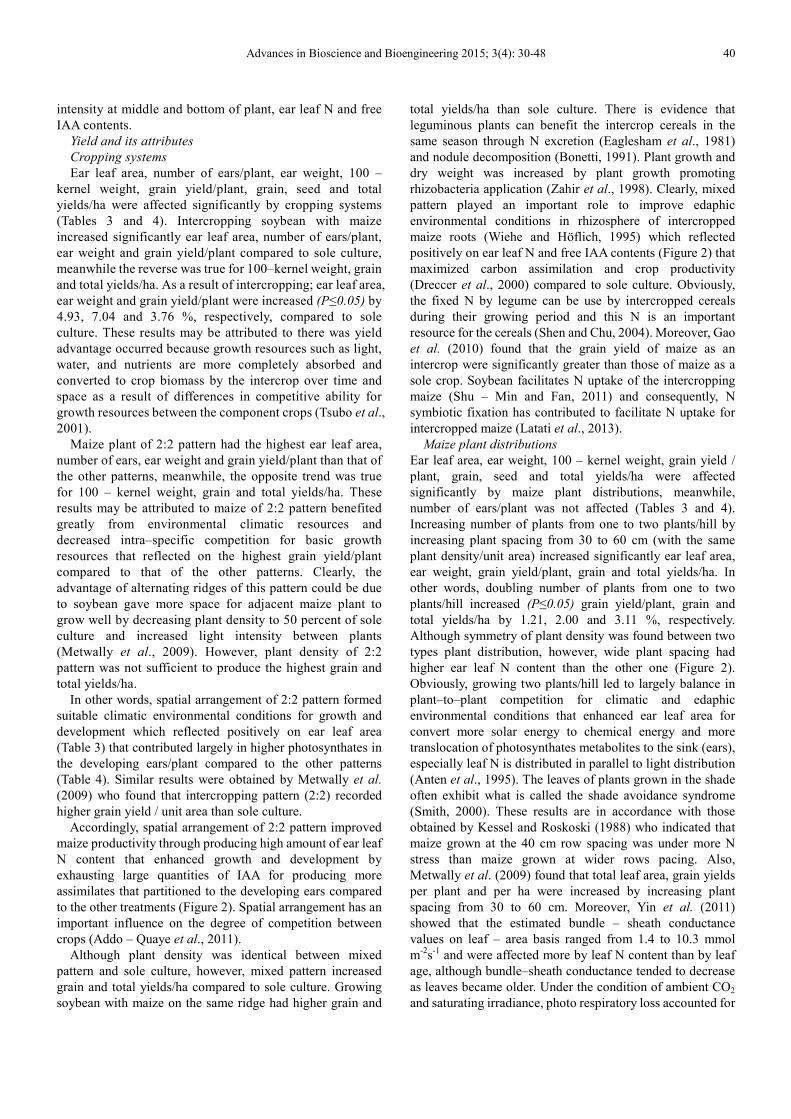
Table 3. Effect of cropping systems, maize plant distributions, mineral N fertilizer and their interactions on ear leaf area, number of ears per plant, ear weight
and one hundred kernel weight, combined data cross 2012 and 2013 seasons.
Cropping
system
Maize
plant
distributions
Ear leaf area (cm2) Number of ears per plant
4 g N
/plant
5 g N
/plant
6 g N
/plant Mean
4 g N
/plant
5 g N
/plant
6 g N
/plant Mean
2:2 pattern 1P/30cm 916.00 929.33 932.33 925.88 1.066 1.080 1.086 1.077
2P/60cm 919.33 932.33 936.33 929.33 1.070 1.086 1.090 1.082
Mean 917.66 930.83 934.33 927.60 1.068 1.083 1.088 1.079
Mixed pattern 1P/30cm 841.00 865.00 864.66 856.88 1.006 1.020 1.023 1.016
2P/60cm 846.00 867.66 867.00 860.22 1.010 1.016 1.026 1.017
Mean 843.50 866.33 865.83 858.55 1.008 1.018 1.024 1.016
Average of intercropping 880.58 898.58 900.08 893.08 1.038 1.050 1.056 1.048
Sole culture 1P/30cm 839.00 853.33 857.00 849.77 1.003 1.023 1.023 1.016
2P/60cm 844.33 854.00 859.00 852.44 1.006 1.026 1.030 1.020
Mean 841.66 853.66 858.00 851.10 1.004 1.024 1.026 1.018
Average of maize plant distributions
1P/30cm 865.33 882.55 884.66 877.51 1.025 1.041 1.044 1.036
2P/60cm 869.88 884.66 887.44 880.66 1.028 1.042 1.048 1.039
Average of N fertilizer rates 867.60 883.60 886.05 879.08 1.026 1.041 1.046 1.037
L.S.D.0.05 Cropping system (C) 3.86 0.06
L.S.D.0.05 Maize plant distributions (D) 3.01 N.S.
L.S.D.0.05 Mineral N fertilizer (N) 2.92 N.S.
L.S.D.0.05 C x D 4.08 N.S.
L.S.D.0.05 C x N 4.15 N.S.
L.S.D.0.05 N x D 3.11 N.S.
L.S.D.0.05 C x D x N 4.51 N.S.
Table 3. Continued.
Cropping
system
Maize
plant
distributions
Ear weight (g) 100 – kernel weight (g)
4 g N
/plant
5 g N
/plant
6 g N
/plant Mean
4 g N
/plant
5 g N
/plant
6 g N
/plant Mean
2:2 pattern 1P/30cm 200.66 203.66 208.33 204.21 34.32 33.72 32.89 33.64
2P/60cm 204.66 207.66 212.66 208.32 33.75 33.37 32.81 33.31
Mean 202.66 205.66 210.49 206.26 34.03 33.54 32.85 33.47
Mixed pattern 1P/30cm 181.00 189.33 190.33 186.88 34.89 33.72 34.04 34.21
2P/60cm 184.66 192.33 193.33 190.10 34.35 32.99 33.52 33.62
Mean 182.83 190.83 191.83 188.49 34.62 33.35 33.78 33.91
Average of intercropping 192.74 198.24 201.16 197.37 34.32 33.44 33.31 33.69
Sole culture 1P/30cm 177.66 183.33 187.33 182.77 35.25 34.98 34.53 34.92
2P/60cm 180.66 187.00 190.33 185.99 35.07 34.50 34.28 34.61
Mean 179.16 185.16 188.83 184.38 35.16 34.74 34.40 34.76
Average of maize plant distributions
1P/30cm 186.44 192.10 195.33 191.29 34.82 34.14 33.82 34.26
2P/60cm 189.99 195.66 198.77 194.80 34.39 33.62 33.53 33.84
Average of N fertilizer rates 188.21 193.88 197.05 193.04 34.60 33.88 33.67 34.05
L.S.D.0.05 Cropping system (C) 4.02 0.39
L.S.D.0.05 Maize plant distributions (D) 3.39 0.26
L.S.D.0.05Mineral N fertilizer (N) 3.22 0.22
L.S.D.0.05 C x D 4.08 0.40
L.S.D.0.05 C x N 4.17 0.42
L.S.D.0.05 N x D 3.61 0.33
L.S.D.0.05 C x D x N 4.33 0.49
Advances in Bioscience and Bioengineering 2015; 3(4): 30-48 42
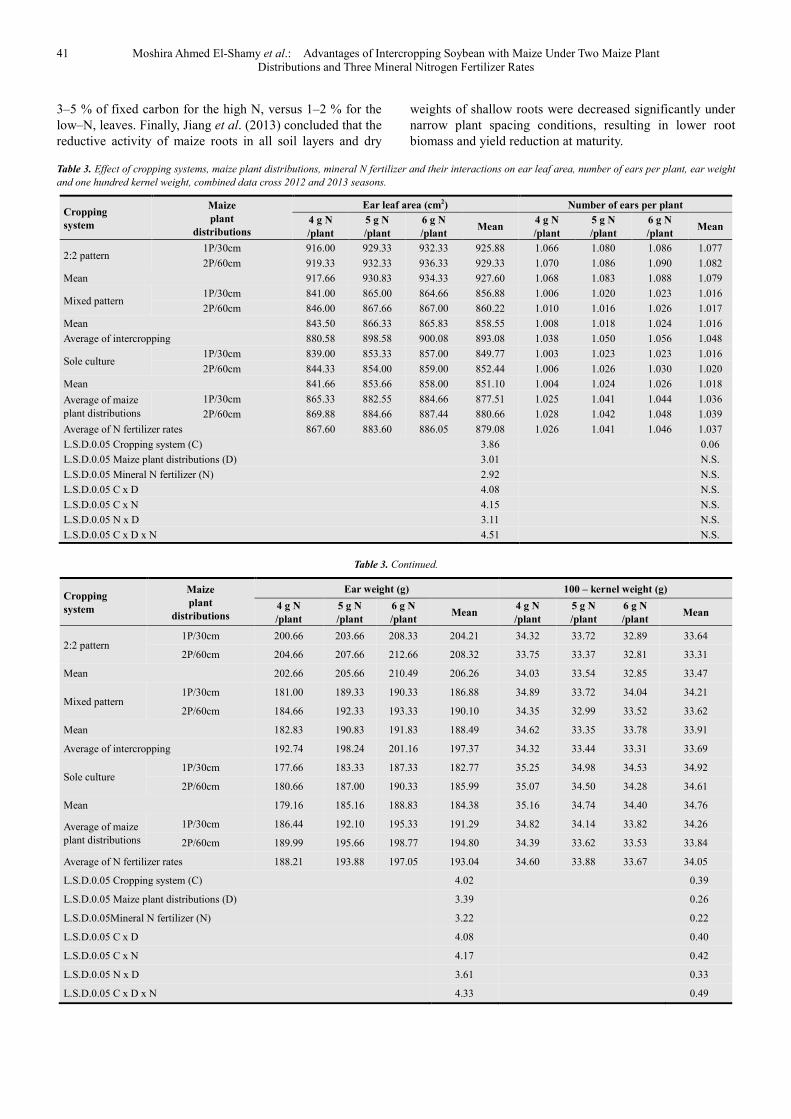
Table 4. Effect of cropping systems, maize plant distributions, mineral N fertilizer and their interactions on maize grain yields per plant and per ha, soybean seed
and total yields per ha, combined data across 2012 and 2013 seasons.
Cropping
system
Maize
plant
distributions
Grain yield per plant (g) Grain yield per ha (ton)
4 g N
/plant
5 g N
/plant
6 g N
/plant Mean
4 g N
/plant
5 g N
/plant
6 g N
/plant Mean
2:2 pattern 1P/30cm 142.30 145.12 146.49 144.63 4.11 4.20 4.27 4.19
2P/60cm 145.26 146.36 147.75 146.45 4.30 4.40 4.50 4.40
Mean 143.78 145.74 147.12 145.54 4.20 4.30 4.38 4.29
Mixed pattern 1P/30cm 137.80 140.14 138.72 138.88 6.94 7.08 7.07 7.03
2P/60cm 139.14 141.21 139.94 140.09 7.01 7.11 7.12 7.08
Mean 138.47 140.67 139.33 139.49 6.97 7.09 7.09 7.05
Average of intercropping 141.12 143.20 143.22 142.51 5.58 5.69 5.73 5.66
Sole culture 1P/30cm 135.28 136.51 137.10 136.29 6.56 6.75 6.86 6.72
2P/60cm 137.09 138.83 139.29 138.40 6.73 6.84 6.98 6.85
Mean 136.18 137.67 138.19 137.34 6.64 6.79 6.92 6.78
Average of maize plant distributions
1P/30cm 138.46 140.59 140.77 139.94 5.87 6.01 6.06 5.98
2P/60cm 140.49 142.13 142.32 141.64 6.01 6.11 6.20 6.10
Average of N fertilizer rates 139.47 141.36 141.54 140.79 5.94 6.06 6.13 6.04
L.S.D.0.05 Cropping system (C) 1.11 0.16
L.S.D.0.05 Maize plant distributions (D) 0.87 0.12
L.S.D.0.05 Mineral N fertilizer (N) 0.51 0.10
L.S.D.0.05 C x D 1.12 0.21
L.S.D.0.05 C x N 1.26 0.27
L.S.D.0.05 N x D 0.98 0.14
L.S.D.0.05 C x D x N 1.35 0.33
Table 4. Continued.
Cropping
system
Maize
Plant
distributions
Soybean seed yield per ha (ton) Total yield per ha (ton)
4 g N
/plant
5 g N
/plant
6 g N
/plant Mean
4 g N
/plant
5 g N
/plant
6 g N
/plant Mean
2:2 pattern 1P/30cm 1.62 1.57 1.66 1.61 5.73 5.77 5.93 5.81 2P/60cm 1.76 1.71 1.73 1.73 6.06 6.11 6.23 6.13
Mean 1.69 1.64 1.69 1.67 5.89 5.94 6.08 5.97
Mixed pattern 1P/30cm 1.66 1.61 1.68 1.65 8.60 8.69 8.75 8.68 2P/60cm 1.84 1.88 1.80 1.84 8.85 8.99 8.92 8.92
Mean 1.75 1.74 1.74 1.74 8.72 8.84 8.83 8.80 Average of intercropping 1.72 1.69 1.71 1.70 7.30 7.39 7.45 7.38
Sole culture 1P/30cm 3.03 3.03 3.03 3.03 6.56 6.75 6.86 6.72 2P/60cm 3.03 3.03 3.03 3.03 6.73 6.84 6.98 6.85
Mean 3.03 3.03 3.03 3.03 6.64 6.79 6.92 6.78 Average of maize plant distributions
1P/30cm 1.64 1.59 1.67 1.63 6.96 7.07 7.18 7.07 2P/60cm 1.80 1.79 1.76 1.78 7.21 7.31 7.37 7.29
Average of N fertilizer rates 1.72 1.69 1.71 1.70 7.08 7.19 7.27 7.18 L.S.D.0.05 Cropping system (C) 0.12 0.24 L.S.D.0.05 Maize plant distributions (D) 0.05 0.21 L.S.D.0.05Mineral N fertilizer (N) N.S. 0.11 L.S.D.0.05 C x D 0.13 0.24 L.S.D.0.05 C x N N.S. 0.26 L.S.D.0.05 N x D N.S. 0.32 L.S.D.0.05 C x D x N N.S. 0.38
Mineral N fertilizer
Ear leaf area, ear weight, 100–kernel weight, grain yield/plant, grain and total yields/ha were affected significantly by mineral N fertilizer, meanwhile, number of ears/plant and seed yield/ha were not affected (Tables 3 and 4). Increasing mineral N fertilizer rates from 4 to 6 g N/plant increased (P≤0.05) ear leaf area, ear weight, grain yield/plant,
grain and total yields/ha without any significant differences between the highest (6 g N/plant) and the medium (5 g N/plant) mineral N fertilizer rates for these traits. These results could be due to adding 5 or 6 g N to the plant produced the highest ear leaf N content and the lowest free IAA content of ear leaf (Figure 2) that contributed greatly in photosynthesis process at 75 days from maize sowing (Table 2). It is observed that
43 Moshira Ahmed El-Shamy et al.: Advantages of Intercropping Soybean with Maize Under Two Maize Plant Distributions and Three Mineral Nitrogen Fertilizer Rates
growth regulators increase the strength of physiological source by increasing chlorophyll (Wareing et al., 1968) and effective age of leaves (Nooden and Leopold, 1978) which finally led to increase in grain yield/plant. Some researchers have shown that spraying IAA on leaves considerably increased the growth rate of maize (Koter et al., 1983).
These results are in the same context with those obtained by Bojović and Marković (2009) who found that N content influenced from presence and ratio mineral elements in the soil and it was close link with chlorophyll content. Also, Hokmalipour and Darbandi (2011) revealed that chlorophyll was increased significantly by increasing N fertilizer levels.
Response of cropping systems to maize plant distributions
Ear leaf area, ear weight, 100–kernel weight, grain yield/plant and grain, seed and total yields/ha were affected significantly by the interaction between cropping systems and maize plant distributions, meanwhile, number of ears/plant was not affected (Tables 3 and 4). Growing two maize plants/hill spaced at 60 cm in 2:2 pattern had the highest ear leaf area, ear weight and grain yield/plant compared to those of the other treatments. These data may be due to plant density of 2:2 pattern integrated with wide plant spacing to increase light transmission within maize canopy (Table 2) which improved the efficiency of photosynthesis process. This improvement had a great ecological importance in crop productivity that reflected on ear weight and grain yield/plant.
On the other hand, maize plants of mixed pattern that grown at wide plant spacing had the highest grain and total yields/ha compared to those of the other treatments. Clearly, growing two maize plants/hill spaced at 60 cm increased light transmission within maize + soybean canopies under mixed pattern. Accordingly, this positive interaction improved efficiency of photosynthesis process in soybean plants that resulted in promoting rhizobia growth in rhizosphere of maize root (Figure 2) by BNF. Accordingly, growing two maize plants/hill spaced at 60 cm under mixed pattern enhanced growth and development of maize plant by absorbed more N through fixation of atmospheric N and exhausted large quantities of IAA for producing more vegetative organs compared to the other treatments (Figure 2). It is important to mention that soybean played a major role to form better under–ground conditions for maize growth and development. BNF of the legume is not always reduced, but is dependent on the legume's ability to intercept light (Fujita and Ofosu - Budu, 1996). These data reveal that each of these two factors act dependently on these traits except number of ears/plant meaning that cropping systems responded differently (P≤0.05) to maize plant distributions for ear leaf area, ear weight, 100–kernel weight, grain yield/plant, grain, seed and total yields/ha. Similar results were obtained by Metwally et al. (2009) who indicated that number of ears/plant was not affected by the interaction between cropping systems and maize plant distributions.
Response of cropping systems to mineral N fertilizer
Ear leaf area, ear weight,100–kernel weight, grain yield/plant, grain and total yields/ha were affected significantly by the interaction between cropping systems and
mineral N fertilizer, meanwhile, number of ears/plant and seed yield/ha were not affected (Tables 3 and 4). Maize plant of 2:2 pattern that received 6 g N had the highest ear leaf area, ear weight, grain yield/plant compared to that of the other treatments. Although there was high intra–specific competition between the same species for mineral N fertilizer under sole culture which reflected negatively on ear leaf area, ear weight, 100–kernel weight and grain yield/plant, however, plant density of sole culture that received 6 g N/plant played a major role in grain yield/ha. Fertilizer N applied in excess of crop needs may result when soil inorganic N content is not adequately considered (Keeney, 1987). Maize plant of mixed pattern that received 4 g N did not achieve the highest grain and total yields/ha because N requirement of legumes can be met by both mineral N assimilation and symbiotic N2 – fixation (George and Singleton, 1992). Also, the quantity of biologically fixed N can be reduced if soil available N is far below 10 kg/ha (Van Kessel and Hartley, 2000).
Also, maize plant of mixed pattern that received 5 g N had the highest grain and total yields/ha compared to that received 4 or 5 N. These data may be due to adding 5 g N to the plant promoted rhizobia growth in rhizosphere of maize roots and reflected positively on N uptake and IAA content in tissues of the plant (Figure 2) which contributed strongly in enhancing efficiency of photosynthesis process (Table 2). Clearly, mixed pattern interacted with 5 g N/plant to form suitable edaphic environmental conditions by decreasing inter–specific competition between both species for N use through N2 fixation to produce the highest grain and total yields/ha compared to the other treatments (Table 4). Intercropping conditions of cereals and legumes would be valuable because the component crops can utilize different sources of N (Chu et
al., 2004). These results are in accordance with those obtained by Latati et al. (2013) who revealed that common bean intercropped with maize decreased inter–specific competition for N use through N2 fixation, especially at low N concentration.
Moreover, maize plant of mixed pattern that received 6 g N did not achieve the highest grain and total yields/ha. Adding 6 g N to the plant affected negatively rhizobia activity in rhizosphere of maize roots and efficiency of biological N fixation by adjacent soybean plants (Figure 2). Although, nitrate (NO3
-) is easily absorbed by plants at high rates, however, nitrate inhibits nitrogenase activity in legume plant nodules (Streeter, 1988). Adding commercial N fertilizer to legumes, whether straight seeded or inablend, the bacteria that actually fix the N can become lazy and N fixing declines (Braunwart, 2001). These data show that each of these two factors act dependently on these traits except number of ears/plant and seed yield/ha meaning that cropping systems responded differently (P≤0.05) to mineral N fertilizer for ear leaf area, ear weight, 100–kernel weight, grain yield/plant, grain and total yields/ha.
Response of maize plant distributions to mineral N fertilizer
Ear leaf area, ear weight, 100–kernel weight, grain yield/plant, grain and total yields/ha were affected significantly by the interaction between maize plant
Advances in Bioscience and Bioengineering 2015; 3(4): 30-48 44
distributions and mineral N fertilizer, meanwhile, number of ears/plant and seed yield/ha were not affected (Tables 3 and 4). Growing two plants/hill spaced at 60 cm that received 12 g N gave the highest ear leaf area, ear weight, grain yield/plant, grain and total yields/ha compared to the other treatments. The insignificant effect between maize plant distributions and mineral N fertilizer on number of ears/plant and seed yield/ha shows that maize plant distributions responded similarly (P>0.05) to mineral N fertilizer for number of ears/plant and seed yield/ha.
Response of cropping systems and maize plant distributions
to mineral N fertilizer
Ear leaf area, ear weight, 100–kernel weight, grain yield/plant, grain and total yields/ha were affected significantly by the interaction of cropping systems x maize plant distributions x mineral N fertilizer, meanwhile, number of ears/plant and seed yield/ha were not affected (Tables 3 and 4). Growing two maize plants/hill in 2:2 pattern that received 12 g N gave the highest ear leaf area, ear weight and grain yield/plant compared to that of the other treatments formed the best bioengineered treatment. The highest grain and total yields/ha was obtained by intercropping soybean on both sides of maize ridge with growing two maize plants/hill that received 10 g N formed the best bioengineered treatment. The insignificant effect of cropping systems x maize plant distributions x mineral N fertilizer for number of ears/plant and seed yield/ha shows that cropping systems and maize plant distributions responded similarly (P>0.05) to mineral N fertilizer for number of ears/plant and seed yield/ha.
N use efficiency (NUE)
Cropping systems
Partial factor productivity (NUE–PFP) expressed as crop yield per unit of N applied (Roberts, 2008) are indicative of the degree of economic and environmental efficiency in use of nutrient inputs. In this study, NUE ranges from 44.85 to 149.36 kg grain yield per kg nutrient applied (Figure 3). NUE values of 40–80 kg/kg are usual with values > 60 kg/kg for NUE being common in well–managed systems or at low levels of N use, or at low soil N supply (Doberman, 2007). Maize plant of 2:2 pattern had the lowest (P≤0.05) NUE compared to that of the other patterns. These results may be due to plant density of 2:2 pattern reached 50 percent of sole culture which affected negatively grain and total yields/ha (Table 4), meanwhile maize plant of mixed pattern had the highest NUE compared to that of sole culture due to plant density reached 100 percent of sole culture. Obviously, NUE may be influenced by the complex interplay between many biological processes under mixed pattern compared to the others. These results indicate that promotion of rhizobia growth in rhizosphere of maize roots by soybean (Figure 2) led to an increase in absorption fixed N uptake from soil by maize roots. Consequently, this status led to more assimilation into amino acids that serve as N carriers throughout the plant and N transport from source to sink tissues throughout plant development, especially during the grain filling period (Table 4). Similar results were obtained by Gao et al. (2010) who showed that N uptake of maize as an intercrop was
significantly greater than those of maize as a sole crop. Also, Zhang et al. (2015) indicated that intercropping systems reduced use of N fertilizer per unit land area and increased relative biomass of intercropped maize, due to promoted photosynthetic efficiency of border rows and N utilization during symbiotic period.
Maize plant distributions
Increasing number of plants from one to two plants/hill by increasing plant spacing from 30 to 60 cm increased (P≤0.05) NUE by 1.91 percent in the combined data across 2012 and 2013 seasons (Figure 3). The results of our study show that growing maize plants at wide spacing could be decreased intra–specific competition for basic growth resources, especially solar radiation which increased ear leaf area and resulted in a positive effect on dry matter accumulation compared to the other one. Obviously, doubling plant number from one to two plants/hill led to largely balance in plant–to–plant competition for climatic and edaphic environmental conditions that enhanced ear leaf area for convert more solar energy to chemical energy and more translocation of photosynthates metabolites to the sink (ears), especially leaf N is distributed in parallel to light distribution (Anten et al., 1995) and consequently increase in grain and total yields/ha (Table 4).
Mineral N fertilizer
NUE was affected significantly by mineral N fertilizer (Figure 3). Adding 5 g N to the plant increased (P≤0.05) NUE by 97.74 percent compared to those that received 6 g N/plant. These results reveal that NUE was influenced by available soil N in the experimental soil and it was close link with mineral N fertilizer. It is observed that NUE values emerging from this study apply to low levels of N use, or at low soil N supply and contributed positively in increase of photosynthesis process efficiency and consequently grain yield/plant (Table 4).
Response of cropping systems to maize plant distributions
Growing two maize plants/hill in mixed pattern had the highest NUE compared to those of the other treatments (Figure 3). It is noticed that growing soybean with two maize plants/hill at wide spacing on the same ridge increased light transmission within canopies of both species and in turn promoted rhizobia growth in rhizosphere of maize roots which facilitated more N uptake in tissues of the plant compared to that of the other treatments (Table 2 and Figure 2).
Growing soybean on both sides of maize ridge led to the highest grain yield/plant, grain and total yields/ha due to a better N-use efficiency of C4 compared to C3 plants, since the rate of photosynthesis per unit N in the leaf is increased (Oaks, 1994). These data indicate that each of these two factors act dependently on NUE meaning that cropping systems responded differently (P≤0.05) to maize plant distributions for NUE.
Response of cropping systems to mineral N fertilizer
Maize plant of mixed pattern that received 5 g N had the highest NUE compared to that of the other patterns (Figure 3). These data may be due to adding 5 g N to the plant promoted rhizobia growth in rhizosphere of maize roots and reflected positively on N uptake and IAA content in tissues of the plant

45 Moshira Ahmed El-Shamy et al.: Advantages of Intercropping Soybean with Maize Under Two Maize Plant Distributions and Three Mineral Nitrogen Fertilizer Rates
(Figure 2) which contributed strongly in enhancing efficiency of photosynthesis process and the grain yield /plant compared to the other treatments (Table 4). This result expected
considering each cropping system has different number of plants and each will have their own N uptake.
Figure 3. NUE as affected by cropping systems, maize plant distributions, mineral N fertilizer and their interactions, combined data across 2012 and 2013
seasons.
Response of maize plant distributions to mineral N fertilizer
Growing two plants/hill spaced at 60 cm that received 10 g N had the highest NUE compared to that of the other treatments (Figure 3). These results indicate that growing two maize plants/hill interacted with 10 g N to decrease inter–specific competition between both species for N use through N2 fixation and produced the highest grain and total yields/ha compared to the other treatments (Table 4). These data show that each of these two factors act dependently on NUE meaning that maize plant distributions responded differently (P≤0.05) to mineral N fertilizer for NUE.
Response of cropping systems and maize plant distributions
to mineral N fertilizer
Growing two maize plants/hill in mixed pattern that received 10 g N had the highest NUE compared to those of the other treatments (Figure 3) and formed the best bioengineered treatment. These data reveal that there was effect (P≤0.05) of cropping systems x maize plant distributions x mineral N fertilizer on NUE.
4. Conclusion
Our results indicate that bioengineering has a great importance for maximizing intercrop yields. The best bioengineered treatment was varied according to the intercropping pattern. Soybean increased productivity of maize plant through modifying the light environment around maize plants that directly affected positively ear leaf free IAA and N contents in 2:2 pattern. Spatial arrangement of mixed pattern influenced strongly maize productivity of unit area though maintaining the recommended plant density of both species that integrated strongly with positive effects of soybean plant on soil N availability. Soybean could be a biological tool to compensate the one–third of the amount of
mineral N fertilizer for maize requirements.
References
[1] Abaidoo RC and Kessel CV.1989. 15N uptake, N2 – fixation and rhizobial interstrain competition in soybean and bean, intercropped with maize. Soil Mot Biochem., 21 (1): 155 – 159.
[2] Addo-Quaye AA, Darkwa AA and Ocloo GK. 2011. Growth analysis of component crop in a maize – soybean intercropping system as affected by time of planting and spatial arrangement. ARPN Journal of Agricultural and Biological Science, 6 (6): 34 – 44.
[3] Abdel-Galil AM, Abdel-Wahab TI and Abdel-Wahab ShI. 2014. Maize productivity under intercropping with four soybean varieties and maize planting geometry. Middle East Journal of Agricultural Research, 3 (2): 346 – 352.
[4] Akuda EM. 2001. Intercropping and population density effects on yield component, seed quality and photosynthesis of sorghum and soybean Journal of Food Technology in Africa, 6(3): 170-173.
[5] Alexander M. and Clark F. 1965. Chemical and Microbiological Properties. In: "Methods of Soil Analysis" (Eds. Black et al.), Agronomy Series, No. 9, American Society of Agronomy, Madison, Wisconsin, USA.
[6] Alves GC. 2011. Study of interaction of bacterium herbaspirillum seropedicae br11417 with plants of maize. Rio de Janeiro: UFRRJ. 52 p. Thesis (doctorate) – agronomy graduate course, concentration area: soil science, federal rural university of Rio de Janeiro, Seropédica.
[7] Anjum MA, Sajjad MR, Akhtar N, Qureshi MA, Iqbal A, Jami AR and Hasan MU. 2007. Response of cotton to plant growth promoting rhizobacteria (PGPR) inoculation under different levels of nitrogen. Journal of Agricultural Research, 45(2): 135-143.

Advances in Bioscience and Bioengineering 2015; 3(4): 30-48 46
[8] Anten NPR, Schieving F and Werger MJA. 1995. Patterns of light and nitrogen distribution in relation to whole canopy carbon gain in C3 and C4 mono- and dicotyledonous species. Oecologia, 101: 504-513.
[9] Awan IU, Baloch MS, Sadozai NS and Sulemani MZ. 1999. Stimulatory effect of GA3 and IAA on ripening process, kernel development and quality of rice. Pakistan Journal of Biological Science, 2 (2): 410-412.
[10] Baker R. 1991. Induction of rhizosphere competence in the biocontrol fungus Trichoderma. In The Rhizosphere and Plant Growth. Eds. Keister, D.L. & Cregan, P.B., 221-228. Kluwer Academic Publishers, Dordrecht, The Netherlands.
[11] Baldotto MA, Baldotto LEB, Santana RB and Marciano CR. 2012. Initial performance of maize in response to NPK fertilization combined with Herbaspirillum seropedicae. Revista Ceres, Viçosa, 59(6): 841-849.
[12] Bandurski RS, Cohen JD, Slovin JP, Reinecke DM. 1995. Auxin biosynthesis and metabolism. In: Davies PJ, editor. Plant Hormones: Physiology, Biochemistry and Molecular Biology. Dordrecht, The Netherlands: Kluwer Academic Publishers; pp. 35–57.
[13] Basse CW, Lottspeich F, Steglich W and Kahmann R. 1996. Two potential indole-3-acetaldehyde dehydrogenases in the phytopathogenic fungus Ustilago maydis. Eur J Biochem., 242 (3): 648 – 656.
[14] Behringer FJ and Davies PJ. 1992. Indole-3-acetic acid levels after phytochrome-mediated changes in the stem elongation rate of dark- and light-grown Pisum seedlings. Planta, 188: 85-92.
[15] Bhojwani, SS and Razdan MK. 1983. Plant tissue culture: Theory and practice. Elsevier, Amsterdam, The Netherlands.
[16] Bojović B and Marković A. 2009. Correlation between nitrogen and chlorophyll content in wheat (Triticum aestivum L.). Kragujevac Journal of Science, 31: 69-74.
[17] Bonetti R. 1991. Transferência de nitrogênio do feijão para o milho consorciado: avaliação pelo método de diluição isotópica do 15N e efeito da associação micorrízica. 1991. 63 f. Tese (Doutorado em Agronomia) - Escola Superior de Agricultura Luiz de Queiroz, Piracicaba.
[18] Brady NC. 1984. The Nature and Prosperities of Soils. Macmillan Publishing Company, New York.
[19] Braunwart K, Putnam D and Fohner G. 2001. Alternative annual forages – now and in the future. Proceedings of 31st California Alfalfa and Forage Symposium, Modesto, CA, UC Cooperative Extension; 2001. University of California, Davis 95616.
[20] Briggs WR and Olney MA. 2001. Photoreceptors in plant photo- morphogenesis to date, five phytochromes, two cryptochromes, one phototropin, and one super chrome. Plant Physiology, 125: 85-88.
[21] Brye KR, Norman JM, Nordheim EV, Gower ST and Bundy LG. 2002. Refinements to an in-Situ soil core technique for measuring net nitrogen mineralization in moist, fertilized agricultural soil. Agronomy Journal, Vol. 94.
[22] Chapman HD and Pratt PE. 1961. Methods of Analysis for Soil, Plant and Water. Division Agric. Sci., California Univ., U.S.A.
[23] Chu GX, Shen QR and Cao JL. 2004. Nitrogen fixation and N transfer from peanut to rice cultivated in aerobic soil in intercropping system and its effect on soil N-fertility. Plant Soil, 263: 17-27.
[24] Davies PJ. 1995. Plant Hormones: Physiology, Biochemistry, and Molecular Biology. Kluwer Academic Publishers, Netherlands.
[25] Davidson EA, David MB, Galloway JN, Goodale CL, Haeuber R, Harrison JA, Howarth RW, Jaynes DB, Lowrance RR, Nolan BT, Peel JL, Pinder RW, Porter E, Snyder CS, Townsend AR and Ward MH. 2012. Excess nitrogen in the U.S. environment: trends, risks, and solutions. Issues in Ecology, Report Number 15, Ecological Society of America. http://www.whrc.org/about/cvs/edavidson.html#sthash.QzHKCAXT.dpuf.
[26] Ding L, Wang KJ, Jiang GM, Biswas DK, Xu H, Li LF and Li H. 2005. Effects of nitrogen deficiency on photosynthetic traits of maize hybrids released in different years. Annals of Botany Doi: 10.1093/aob/mci. 244. www.aob.oupjournals.org.
[27] Dobermann A. 2007. Nutrient use efficiency – measurement and management. Proceedings of IFA International Workshop on Fertilizer Best Management Practices, Brussels, Belgium.
[28] Dreccer MF, Oijen VM, Schapendonk AHCM, Pot CS and Rabbinge R. 2000. Dynamics of vertical leaf nitrogen distribution in a vegetative wheat canopy: Impact on canopy photosynthesis. Annals of Botany, 86: 821-831.
[29] Eaglesham ARJ, Ayanaba A, Rao VR and Eskew DL. 1981. Improving the nitrogen nutrition of maize by intercropping with cowpea. Soil Biology and Biochemistry, Oxford, 13, 169-171.
[30] FAO. 2013. Statistical Yearbook – World Food and Agriculture. FAO, Rome.
[31] Francis CA, Rutger JN and Palmer AFE. 1969. A rapid method for plant leaf area estimation in maize (Zea mays L.). Crop Science, 9: 537-539.
[32] Franklin KA and Whitelam GC. 2005. Phytochromes and shade avoidance responses in plants. Annals of Botany, 96: 169 – 175.
[33] Freed RD. 1991. MSTATC Microcomputer Statistical Program. Michigan State University, East Lansing, Michigan, USA.
[34] Fujita K and Ofosu-Budu KG. 1996. Significance of intercropping in cropping systems. pp19-40. In: Ito O, Johansen C, Adu-Gyamfi JJ, Katayama K, Kumar Rao JVDK and Rego TJ (Eds.): Dynamics of roots and nitrogen in cropping systems of the semi-arid tropics. Japan International Research Center for Agricultural Sciences. International Agricultural Series No. 3 Ohwashi, Tsukuba, Ibavaki 305, Japan.
[35] Gao Y, Duan A, Qiu X, Liu Z, Sun J, Zhang J and Wang H. 2010. Distribution of roots and root length density in a maize/soybean strip intercropping system. Agricultural Water Management, 98: 199 – 212.
[36] George T and Singleton PW. 1992. Nitrogen assimilation traits and dinitrogen fixation in soybean and common bean. Agronomy Journal, 84: 1020-1028.
[37] Ghannoum O, Evans JR and Caemmerer SV. 2011. Nitrogen and Water Use Efficiency of C4 Plants In: Raghavendra, A.S. & Sage, R.F. (eds.), C4 Photosynthesis and Related CO2 Concentrating Mechanisms, pp. 129-146.

47 Moshira Ahmed El-Shamy et al.: Advantages of Intercropping Soybean with Maize Under Two Maize Plant Distributions and Three Mineral Nitrogen Fertilizer Rates
[38] Gomez KA and Gomez AA. 1984. Statistical Procedures for Agricultural Research. 2nd ed., John Willey and Sons, Toronto, ON, Canada.
[39] Hartig K and Beck E. 2006. Crosstalk between auxin, cytokinins, and sugars in the plant cell cycle. Plant Biology, 8: 389-396.
[40] Hayat R, Ahmed I and Sheirdil AR. 2012. An Overview of Plant Growth Promoting Rhizobacteria (PGPR) for Sustainable Agriculture. Springer.
[41] Hokmalipour S and Darbandi MH. 2011. Effects of nitrogen fertilizer on chlorophyll content and other leaf Indicate in three cultivars of maize (Zea mays L.). World Applied Sciences Journal, 15(12): 1780-1785.
[42] Hungria M. 2011. Inoculation with Azospirillum brasilense: innovation in yield at low cost. Londrina: Embrapa soybean. 36p.
[43] Hungria M, Campo RJ, Mendes IC and Graham PH. 2006. Contribution of biological nitrogen fixation to the n nutrition of grain crops in the tropics: the success of soybean (Glycine max (l.) Merr.) In South America. In: Singh RP, Shankar N, Jaiwal PK (ed.). Nitrogen nutrition and sustainable plant productivity. Houston: Studium press, pp. 43-93.
[44] Hungria M, Franchini JC, Campo RJ and Graham PH. 2005. The importance of nitrogen fixation to soybean cropping in South America. In: Werner D and Newton WE (Eds.): Nitrogen fixation in agriculture: forestry ecology and environment. Dordrecht, Kluwer Academic Publishers, pp. 25-42.
[45] Hutzinger O and Zander M. 1969. Indoles and auxins. I. Spectrophosphorimetry of some natural and synthetic indoles. Anal. Biochem., 28: 70-75.
[46] Jiang W, Wang K, Wu Q, Dong S, Liu P and Zhang J. 2013. Effects of narrow plant spacing on root distribution and physiological nitrogen use efficiency in summer maize. The Crop Journal, pp. 77- 83.
[47] Jensen ES. 1996. Grain yield, symbiotic N fixation and inter-specific composition for inorganic N in Pea/barley intercrops. Plant Soil, 182(1): 25-38.
[48] Keeney DR. 1987. Nitrate in groundwater: Agricultural contribution and control.p.329-351. In Procediong of Conference on Agric. Impacts on Ground Water, Omaha, NE.11-13 August 1986. National Water Well Assoc., Dublin, OH.
[49] Kessel CV and Hartley C. 2000. Agricultural management of grain legumes: has it led to an increase in nitrogen fixation?. Field Crops Research, 65: 165-181.
[50] Kessel CV and Roskoski JP. 1988. Row spacing effects on N2-fixation, N-yield and soil N uptake of intercropped cowpea and maize. Plant and Soil, 111: 17-23.
[51] Kiba T, Kudo T, Kojima M and Sakakibara H. 2011. Hormonal control of nitrogen acquisition: Roles of auxin, abscisic acid, and cytokinin. J. Experimental Botany, 62: 1399–1409.
[52] Klaus RE, Berger MG and Fock HP. 1985. Effect of light intensity on ammonia assimilation in maize leaves. Photosynthesis Res., 6 (3): 221- 228.
[53] Kondo N, Fugii T and Yamaki T. 1969. Effect of light on auxin transport and elongation of Avena mesocotyl. Development,
Growth and Differentiation, 11 (1): 46 -61.
[54] Koter M, Czapla J, Nowak G and Nowak J. 1983. Study on use of growth regulators in agricultural production. 1. Effect of GA, IAA and kinetin on growth and development of bean, maize and flax. Plant Physiology and Biochemistry, 36:17-27.
[55] Latati M, Pansu M, Drevon JJ and Ounane SM. 2013. Advantage of intercropping maize (Zea mays L.) and common bean (Phaseolus vulgaris L.) on yield and nitrogen uptake in Northeast Algeria. International Journal of Research in Applied Sciences, 01: 1-7.
[56] Lošák T, Hlušek J, Filipčík R, Pospíšilová L, Maňásek J, Prokeš K, Buňka F, Kráčmar S, Martensson A and Orosz F. 2010. Effect of nitrogen fertilization on metabolisms of essential and non-essential amino acids in field-grown grain maize (Zea mays L.). Plant, Soil and Environment, 56: 574–579.
[57] Lupwayi NZ, Clayton GW, O'Donovan JT, Harker KN, Turkington TK and Rice WA. 2004. Decomposition of crop residues under conventional and zero tillage. Canadian Journal of Soil Science, 84: 403-410.
[58] Metwally AA, Shafik MM, El-Habbak KE and Abdel-Wahab ShI. 2009. Step forward for increasing intercropped soybean yield with maize. The 4th Conference, Recent Technologies in Agriculture, 3 – 5 Nov., Cairo University, 2 : 256 - 269, Egypt.
[59] Mezianea D and Shipley B. 2001. Direct and indirect relationships between specific leaf area, leaf nitrogen and leaf gas exchange: Effects of irradiance and nutrient supply. Annals of Botany, 88(5): 915-927.
[60] Milroy SP, Bange MP and Sadras VO. 2011. Profiles of leaf nitrogen and light in reproductive canopies of cotton (Gossypium hirsutum). Annals of Botany, 87: 325-333.
[61] Montanez A and Margarita S. 2013. Effect of inoculation on growth promotion and biological nitrogen fixation in maize (Zea mays L.) under green house and field conditions. Basic Research Journal of Agricultural Science and Review, 2(4): 102-110.
[62] Nooden LD and Leopold AC. 1978. Phytohormones and the endogenous regulation of senescence and abscission. In phytohomones and related compounds, a comprehensive Treatise. Vol. 2: Phytohormones and the Development of Higher Plants, Elsevier, Amsterdam, pp. 329-370.
[63] Odongo JCW, Veresoglou DS, Papakosta D and Sficas AG. 1988. Biomass and nitrogen yields of intercropped maize and soybeans as affected by applied nitrogen, rhizobium, maize hybrids and population density. Journal of Agronomy and Crop Science, 160(1): 38-46.
[64] Ogutu MO, Owuoche JO, Muasya R and Ouma G. 2012. Effects of inter-specific interaction of nitrogen fertilizer and bean-maize cropping systems on quality of bean seed in Western Kenya. Agriculture and Biology Journal of North America, 3(4): 154-168.
[65] Oaks A. 1994. Efficiency of nitrogen utilization in C3 and C4
cereals. Plant Physiology, 106: 407–414
[66] Palmer AFE, Heichel GH and Musgrave RB. 1973. Pattern of translocation, respiratory loss and redistribution of 14C in maize labelled after flowering. Crop Science, 13: 371-376.
[67] Parvaiz M. 2014. Response of maize to salt stress a critical review. International J. Healthcare Sci., 1 (1): 13-25.

Advances in Bioscience and Bioengineering 2015; 3(4): 30-48 48
[68] Pavlíková1 D, Neuberg M, Žižková E, Motyka V and Pavlík M. 2012. Interactions between nitrogen nutrition and phytohormone levels in Festulolium plants. Plant, Soil and Environment, 58(8): 367-372.
[69] Reinhardt D, Pesce ER,Stieger P, Mandel T, Baltensperger K, Bennett M, Traas J, Friml J and Kuhlemeier C. 2003. Regulation of phyllotaxis by polar auxin transport. Nature, 426: 255–260.
[70] Ribaut JM and Pilet PE. 1994. Water stress and indole-3 yl acetic acid content of maize roots. Planta, 193: 502-507.
[71] Roberts TL. 2008. Improving Nutrient Use Efficiency. Turkish Journal of Agriculture and Forestry, 32: 177-182.
[72] Sivakumar MVK. and Virmani SM. 1980. Growth and resource use of maize, pigeonpea and maize/pigeonpea intercrop in an operational research watershed. Experimental Agriculture., 16: 377-86.
[73] Sonnewald U. 2012. Plant Physiology Preview. www.plant.org, American Society of Plant Biologists.
[74] Sharwood RE, Sonawane BV and Ghannoum O. 2014. Photosynthetic flexibility in maize exposed to salinity and shade. Journal of Experimental Botany, pp. 1- 10.
[75] Shen QR and Chu GX. 2004. Bi-directional nitrogen transfer in an intercropping system of peanut with rice cultivated in aerobic soil. Biology and Fertility of Soils, 40: 81- 87.
[76] Shu-Min LI and Fan WU. 2011. Nitrogen uptake facilitation in soybean/maize intercropping system inoculated with rhizobium and arbuscular mycorrhizal fungi. Acta Metallurgica Sinica, 17(1): 110-116. DOI: 10.11674/zwyf.2011.0115.
[77] Smith H. 2000. Phytochromes and light signal perception by plants: an emerging synthesis. Nature, 407:585-591.
[78] Streeter, J.G. 1988.. Inhibition of legume nodule formation and N2 fixation by nitrate. CRC Critical Reviews in Plant Sciences, 7: 1-23.
[79] Taiz L and Zeiger E. 2002. Plant Physiology. 3rd Edition. Sinauer Associates Publisher, pp: 690.
[80] Tazoe Y, Noguchi K and Terashima I. 2006. Effects of growth light and nitrogen nutrition on the organization of the photosynthetic apparatus in leaves of a C4 plant, Amaranthus cruentus. Plant, Cell & Environment, 29: 691–700.
[81] Thomley JHM. 1972. A balanced quantitative model for root: shoot ratios in vegetative plants. Ann. Bot. 36: 431-441.
[82] Tsubo M, Walker S and Mukhala E. 2001. Comparisons of radiation use efficiency of mono-/inter-cropping systems with different row orientations. Field Crops Research, 71: 17-29.
[83] Uren NC and Reisennauer HM. 1988. The role of root exudates in nutrient acquisition. Advances in Plant Nutrition, 3: 79–114.
[84] Wareing PF, Khalifa MM and Treharne KJ. 1968. Rate-limiting processes in photosynthesis at saturating light intensities. Nature, 222: 453-457.
[85] Weber EP and Day FP. 1996. Effect of nitrogen fertilization on the phenology of roots in a barrier island sand dune community. Plant and soil, 182: 139-148.
[86] Werger MJA and Hirose T. 1991. Leaf nitrogen distribution and whole canopy photosynthetic carbon gain in herbaceous stands. Vegetatio, 97: 11-20.
[87] Werner D. 1992. Symbiosis of plants and microbes. London, UK: Chapman & Hall.
[88] Wiehe W and Höflich G. 1995. Survival of plant growth promoting rhizosphere bacteria in the rhizosphere of different crops and migration to non-inoculated plants under field conditions in north-east Germany. Microbiological Research, 150: 201-206.
[89] Yin X, Sun Z, Struik PC, Der Putten PELV, Ieperen WV and Harbinson J. 2011. Using a biochemical C4 photosynthesis model and combined gas exchange and chlorophyll fluorescence measurements to estimate bundle-sheath conductance of maize leaves differing in age and nitrogen content. Plant, Cell and Environment, 34: 2183-2199.
[90] Zahir AZ, Arshad M and Khalid A. 1998. Improving maize yield by inoculation with plant growth promoting rhizobacteria. Pakistan Journal of Soil Science, 15: 7-11.
[91] Zelená E. 2000. The effect of light on metabolism of IAA in maize seedlings. Plant Growth Regulation, 30(1): 23-29.
[92] Zhang Y, Liu J, Zhang J, Liu H, Liu S, Zhai L, Wang H, Lei Q, Ren T and Yin C. 2015. Row ratios of intercropping maize and soybean can affect agronomic efficiency of the system and subsequent wheat. PLoS One, 10 (6): e0129245.
[93] Zhao SL, Li FM, Zhang DY and Duan S.S. 1997. Crop production is a population progress. Acta Ecol. Sin., 17: 100–104 (in Chinese with English abstract).