advancing sustainable materials management - us … studies of recycling economic activity ......
TRANSCRIPT

Advancing Sustainable Materials Management:
2016 Recycling Economic Information (REI) Report Methodology
`
` October 2016

2016 EPA REI Report Methodology i
Table of Contents 1. Introduction ...................................................................................................................................................... 7
1.1. Economic Contributions of Recycling ................................................................................................... 7
1.2. REI Methodology Report Organization ................................................................................................ 9
2. Summary of the WIO Model Methodology ................................................................................................ 10
2.1. The Recycling, Reuse and Remanufacturing Value Chain .................................................................. 10
2.2. Analytic Approaches Included in the REI Study ................................................................................. 13
2.2.1. Hypothetical Economy to Illustrate Methods ................................................................................ 15
2.2.2. Direct Production of Recycling ....................................................................................................... 16
2.2.3. Direct and Indirect Production of Recycling Approach .................................................................. 17
2.2.4. Direct Household Demand on Recycling Approach ....................................................................... 18
2.2.5. Recycled Content in Final Demand Approach ................................................................................ 19
2.3. The Waste Input‐Output Model ......................................................................................................... 20
2.3.1. Waste Input‐Output Framework ................................................................................................... 21
2.3.2. Integrating Measures of Economic Impact .................................................................................... 21
3. Data Collection ........................................................................................................................................... 23
3.1. Data Collection Approach .................................................................................................................. 23
3.2. Summary of Collected Data................................................................................................................ 26
3.2.1. Recycling Process Data ................................................................................................................... 26
3.2.2. Economic Data ............................................................................................................................... 28
3.3. Challenges and Limitations ................................................................................................................ 30
4. Results ........................................................................................................................................................ 32
4.1. Overview ............................................................................................................................................ 32
4.2. Direct and Indirect Production of Recycling Approach ...................................................................... 33
4.3 Comparison of 2016 REI Study and the 2001 REI Study ..................................................................... 38
4.4 Model Approach Selection for Communication Purposes ................................................................. 40
5. Recommendations for Future Studies ........................................................................................................ 45
5.1. Conclusion .......................................................................................................................................... 45
5.2. Other Applications of the WIO Model ............................................................................................... 45
5.3. Areas for Future Study and Refinement ............................................................................................ 46
6. References .................................................................................................................................................. 47

2016 EPA REI Report Methodology ii
7. Appendix A – Recycling Economic Impact Metrics: Guidance for Policymakers ........................................ 53
7.1. Step 1: Determine the Objective of the Study ................................................................................... 53
7.2. Step 2: Determine the Most Suitable Metric Analysis Approach ....................................................... 53
7.3. Step 3: Data Preparation .................................................................................................................... 55
7.4. Step 4: Impact Calculation ................................................................................................................. 56
8. Appendix B – WIO Model Methodology ..................................................................................................... 63
8.1. Methodology Introduction ................................................................................................................. 63
8.2. Methods for Measuring the Economic Impacts of Recycling ............................................................. 63
8.2.1. Scope and Definition of Recycling .................................................................................................. 63
8.2.2. Direct and Multiplier Effects .......................................................................................................... 64
8.2.3. Defining ‘Demand’ in Recycling ..................................................................................................... 65
8.2.4. Four Approaches for Modeling the Impact of Recycling on a National Economy ......................... 67
8.2.5. Causality and Interpretation of Multiplier Analysis Results ........................................................... 69
8.3. Waste Input‐Output (WIO) Model ..................................................................................................... 69
8.3.1. WIO Model ..................................................................................................................................... 69
8.3.2. Derivation of the WIO Analytical Tables ........................................................................................ 71
8.3.3. Use of WIO Model to Calculate Tax Revenue Associated with Recycling and Reuse .................... 74
9. Appendix C – Results for Alternate WIO Approaches ................................................................................ 75
9.1. Direct Production of Recycling Approach .......................................................................................... 75
9.2. Recycled Content in Direct Household Demand on Recycling Approach .......................................... 77
9.3. Direct Household Demand on Recycling Approach ........................................................................... 80
10. Appendix D – Recycling Process Allocation Assumptions ...................................................................... 83
10.1. Overview ............................................................................................................................................ 83
10.2. Nonferrous Metals (Aluminum) ......................................................................................................... 84
10.3. Plastics ................................................................................................................................................ 86
10.4. Rubber ................................................................................................................................................ 89
10.5. Glass ................................................................................................................................................... 92
10.6. Paper .................................................................................................................................................. 93
10.7. Construction and Demolition (C&D) Material .................................................................................... 95
10.8. Electronics ........................................................................................................................................ 100
10.9. Food and Organics ............................................................................................................................ 104
11. Appendix E – Recycling Material Quantity and Price Data ................................................................... 120

2016 EPA REI Report Methodology iii
12. Appendix F – Employment and Tax Revenue Data Compilation .......................................................... 129
12.1. Overview of Methodology ............................................................................................................... 129
12.2. Employment and Wages .................................................................................................................. 129
12.2.1. Agriculture (Crop and Animal Production) ................................................................................... 130
12.2.2. Private Nonfarm Goods and Services .......................................................................................... 131
12.2.3. Government ................................................................................................................................. 131
12.2.4. NAICS‐to‐BEA Concordance Table ............................................................................................... 131
12.3. Occupational Profiles ....................................................................................................................... 144
12.4. Corporate Taxes ............................................................................................................................... 145
12.5. Summary of Employment and Tax Revenue Data ............................................................................ 145
13. Appendix G – Relevant Input‐Output sectors—Initial Screening (2007 Benchmark Table Classification)
147
14. Appendix H – Standard Supply and Use Calculus ................................................................................. 150
15. Appendix I – Prior REI Studies, Sources and Measures ........................................................................ 153
15.1. Prior REI Studies ............................................................................................................................... 153
15.2. Other Studies of Recycling Economic Activity .................................................................................. 154
15.3. Alternative Boundaries, Data Sources and Measures ...................................................................... 154
15.4. Use of Economic Impact Methods to Study Policy Alternatives ...................................................... 155
15.5. International Studies ........................................................................................................................ 155
15.6. Trends in Recycling, Reuse and Remanufacturing ........................................................................... 156

2016 EPA REI Report Methodology iv
Table 1. Materials Included in the Scope of Recycling for This Study ................................................................ 11
Table 2. Four Approaches to Measuring the Impact of Recycling ...................................................................... 15
Table 3: 2016 REI Study Data Elements .............................................................................................................. 23
Table 4: 2016 REI Study Data Collection Outreach ............................................................................................. 24
Table 5: Type of Data Received ........................................................................................................................... 26
Table 6: Economic Data Sources by Economic Sector ........................................................................................ 28
Table 7: Summary of Employment and Tax Revenue Data Used in the WIO Model, U.S. 2007 ......................... 29
Table 8: Summary of Overall Job, Wage and Tax Results ................................................................................... 33
Table 9: Comparison Current and Previous REI Studies’ Estimates of Contributions of Recycling to U.S.
Economic Activity ................................................................................................................................................ 38
Table 10: Comparison of 2016 REI Report and the 2001 REI Study Based on Direct Employment Estimates ... 41
Table 11: Metrics to Implement Approach #1 .................................................................................................... 57
Table 12: Metrics to Implement Approach #2 .................................................................................................... 62
Table 13: Metrics to Implement Approach #3 .................................................................................................... 62
Table 14: General Structure of the Flow Table Used in WIO Model* ................................................................. 70
Table 15: Supply Table for WIO Model of the U.S. ............................................................................................. 72
Table 16: Use Table for WIO Model of the U.S. .................................................................................................. 73
Table 17: Recycling Material Quantity and Price Data ..................................................................................... 120
Table 18: Data Sources by Economic Sector ..................................................................................................... 129
Table 19: NAICS‐to‐BEA Concordance Table ..................................................................................................... 131
Table 20: Correspondence Between Occupational Categories Used in WIO Model and BLS OES ................... 144
Table 21: Summary of Employment and Tax Revenue Data Used in the WIO Model, U.S. 2007 ..................... 146
Index of Tables and Figures
Tables

2016 EPA REI Report Methodology v
Figures
Figure 1: Double‐Counting Can Occur When Intermediate Demand is Applied to an Input‐Output Multiplier
Framework ...................................................................................................................................................... 15
Figure 2: Hypothetical Economy to Illustrate Methods ...................................................................................... 16
Figure 3: Illustration of Direct Production Approach for Estimating Recycling Economic Impacts .................... 17
Figure 4: Illustration of Direct and Indirect Production Approach for Estimating Recycling Economic Impacts 18
Figure 5: Illustration of Direct Household Demand on Recycling Approach for Estimating Recycling Economic
Impacts ............................................................................................................................................................... 19
Figure 6: Illustration of Recycled Content Approach for Estimating Recycling Economic Impacts .................... 20
Figure 7: Overview of Food and Organic Material (and Monetary) Flows ......................................................... 27
Figure 8: Employment Results for the Direct and Indirect Production of Recycling Approach .......................... 34
Figure 9: Wage Results for the Direct and Indirect Production of Recycling Approach .....................................34
Figure 10: Tax Revenue Results for the Direct and Indirect Production of Recycling Approach ........................ 35
Figure 11: Share of Recycling’s Job Creation, Wage and Tax Revenue by Material (Direct and Indirect
Production of Recycling Approach) .................................................................................................................... 36
Figure 12: Share of Direct and Indirect Employment Numbers (# of Jobs), Wages ($) and Taxes ($) by Organics
Recycling ............................................................................................................................................................. 37
Figure 13: Flow Diagram for Determining the Most Suitable Metrics Approach ............................................... 55
Figure 14: Direct, Indirect and Induced Impact and Double Counting in Multiplier Analyses ........................... 66
Figure 15: Employment Results for the Direct Production of Recycling Approach ............................................ 75
Figure 16: Wage Results for the Direct Production of Recycling Approach ....................................................... 76
Figure 17: Tax Revenue Results for the Direct Production of Recycling Approach ............................................ 76
Figure 18: Share of Recycling’s Job Creation, Wage and Tax Revenue by Material (Direct Production of
Recycling Approach) ........................................................................................................................................... 77
Figure 19: Share of Direct Employment Numbers (# of Jobs), Wages ($) and Taxes ($) by Organics Recycling. 77
Figure 20: Contribution of Recycled Material‐Enabled Final Demand to Job Creation (Top 10) ........................ 78
Figure 21: Contribution of Recycled Material‐Enabled Final Demand to Wage Payment (Top 10) ................... 79
Figure 22: Contribution of Recycled Material‐Enabled Final Demand to Tax Revenue (Top 10) ....................... 80
Figure 23: Employment Results for Recycling as Direct Household Demand on Recycling Approach ............... 81
Figure 24: Wage Results for Recycling as Direct Household Demand on Recycling Approach .......................... 81
Figure 25: Tax Revenue Results for Direct Household Demand on Recycling Approach .................................... 82

2016 EPA REI Report Methodology vi
This methodology report and supporting documentation was submitted to the U.S. Environmental Protection
Agency, Office of Resource Conservation and Recovery under Contract: EP‐W‐10‐054, Task Order 72 by Abt
Associates Inc., 4550 Montgomery Avenue, Suite 800 North, Bethesda, MD 20814. This effort was led by
Sangwon Suh, Industrial Ecology Research Service LLC (IERS); Dan Basoli, Abt Associates Inc. and Bill Michaud,
SRA International, Inc. Primary data collection was done by Shivira Tomar of IERS with EPA facilitation.
Additional input was provided by Kent Foerster, Swarupa Ganguli, Tyler Rubright, Elizabeth Sundin, Ronald
Vance, and Nathan Wittstruck of the US EPA, Office of Resource Conservation and Recovery (ORCR).

2016 U.S. REI Study Methodology 7
1. Introduction
1.1. EconomicContributionsofRecyclingRecycling is an important part of the U.S. economy that contributes to national economic activity (Ross and
Evans 2003; Ayres 1997; Byström and Lönnstedt 1997; Craighill and Powell 1996; Hawley 2009). From an
economic perspective, recycling contributes to increased productivity, competitiveness and economic
activity, including increased job creation, wages and tax revenue (R.W. Beck/NRC, 2001; Fiksel, 2006; OECD,
2012). Recycling is fundamental to sustainable materials management (SMM), which aims to reduce our
reliance on limited natural capital and strengthen the economic position of future generations (EPA, 2009a).
The economic benefits of recycling have rarely been measured. In 2001, EPA laid the groundwork for better
understanding the economic benefits of recycling with the National Recycling Economic Information (REI)
study, U.S. Recycling Economic Information Study (R.W. Beck/NRC, 2001). This study estimated the
contributions of recycling to national economic activity and helped raise awareness of the ways in which
recycling activities support jobs, wages, revenue, and government tax receipts. The 2001 REI study also
provided valuable insights for understanding how changes in waste management policy and investments in
recycling markets can contribute to economic outcomes.
The 2001 study acknowledged several challenges and limitations of the REI methodology, including the
inability to isolate recycling activities within multi‐faceted manufacturing sectors and the issue of double‐
counting inherent in the methods being used (see Figure 1) (R.W. Beck/NRC, 2001). Since the release of the
2001 report, other researchers have introduced refinements to the methodology to address some of these
issues, but challenges remain. The 2016 REI effort represents the next iteration in national REI analysis. It
explores alternative approaches for measuring the economic activity associated with recycling, addresses
uncertainties from the previous study and creates the foundation for a reinvigorated analysis of the
economic impacts of recycling.
The 2016 REI study focuses on the diversion of nine categories of useful material from the waste stream. The
material categories include paper, aluminum, glass, plastics, ferrous metals, rubber, food and organics,
electronics and construction and demolition (C&D) material that are diverted from the waste stream (e.g.,
municipal solid waste) and recycled to make new products.The 2016 REI study includes recovery and
refurbishing or remanufacturing for reuse of products and materials that have reached the end of their
intended useful life, including electronics and certain types of C&D material (e.g., wood flooring). The study
also considers the economic activity associated with the salvage and donation of edible food (e.g., canned
goods nearing their expiration date).
EPA recognizes that food salvage for donation and the reuse or remanufacturing of electronics are not
“recycling” activities. However, for brevity, the 2016 REI Report uses the term “recycling” when describing
the overall scope and results of the analysis. In sections describing food donation and electronics recovery,
reuse and remanufacturing, more precise language is used.
The 2016 REI study uses four approaches to measure the contribution of recycling to economic activity the
U.S. economy:
The "direct production of recycling" approach accounts for the direct economic activity associated
with recycling operations. This definition includes, for example, the number of employees associated
with recycling operations that produce steel castings from iron and steel scrap.

2016 U.S. REI Study Methodology 8
The "direct and indirect production of recycling" approach accounts for not only direct but also
indirect production such as upstream supply chain economic activity that supports recycling
processes. Using the steel recycling example, this approach adds the number of employees who
work in material recovery facilities that separate steel scrap, employees who work for suppliers of
steel recycling facilities (e.g., electric utilities) and employees of other suppliers throughout the
upstream supply chain.
The "recycled content in final demand" approach is a novel methodology developed for this study.
The approach estimates the direct and supply chain economic activity attributable to recycling based
on the recycled content of final products consumed by households. Under this approach, for
example, the number of employees directly and indirectly associated with recycling activities in the
upstream supply chain of automobile manufacturing is allocated proportionally to the recycled
content of an automobile by mass. This approach attempts to measure the size of the economy
sustained by the physical presence of recycled materials in final products.
The "direct household demand on recycling" approach accounts for direct and indirect (supply
chain) economic activity associated with recycling that is demanded directly by households. Given
that most of the recycled materials are used first by industry rather than households (i.e., they are
intermediate products), this approach is expected to yield smaller estimates of economic activity
(e.g., employment) compared to the other approaches in this study. The direct household demand
on recycling approach is considered for the sake of completeness.
To estimate the economic activity associated with recycling using these different approaches, a waste input‐
output (WIO) model was compiled for the U.S. that distinguishes recycling operations and recyclable and
recycled material flows from other sectors of the economy. This model was built on the official U.S. input‐
output (I‐O) tables maintained by the Bureau of Economic Analysis (BEA), which describe the economic
transactions between industries in the U.S. and are used, in part, to formulate U.S. monetary and fiscal
policy. The U.S. official I‐O tables do not distinguish recyclable and recycled material flows. For example, the
I‐O tables aggregate many of the recyclable material flows addressed in this study in a single “scrap” category
(USBEA 2014). In addition, recycling activities are either embedded in the broader activities of a
manufacturing sector (e.g., I‐O category “331110, Iron and steel mills and ferroalloy manufacturing”) or
combined and included within the I‐O category “562000: Waste management and remediation services.”
The WIO model estimates the economic activity attributable to recycling in terms of employment, wages and
tax payments. Using the I‐O tables as the starting point, the WIO model distinguishes recyclable and recycled
material flows and recycling processes and associates information about jobs and wages, as well as local,
state and federal tax revenue to specific recycling processes. Combining this information with detailed
statistics regarding economic transactions enables the estimation of the economic activity attributable to
recycling for a specified year.
In addition to supporting the existing study, a key benefit of developing a WIO model was that it established a
sound analytical framework for estimating the broader environmental and economic benefits associated with
recycling. The WIO model could provide a framework for analyzing economic impacts (e.g., in terms of shifts
in employment from extractive to recycling industries) associated with counterfactual waste management
scenarios and recycling policy alternatives. The WIO model could also be extended to analyze environmental
impacts associated with different recycling scenarios by linking environmental data to recycling processes
(i.e., using the methods established for environmentally extended input‐output life cycle analysis).

2016 U.S. REI Study Methodology 9
Of the four approaches used for this study, the direct and indirect production of recycling approach is the
most analytically similar to the approach used for the 2001 national REI study. Nonetheless, the two
approaches differed in significant ways, including differences in the scope of recyclable materials included in
the analysis, characterization of the contributions of recyclable materials collection and processing industries
and assumptions1 and methods used to attribute economic factors to recycling processes in sectors where
recycling takes place alongside other manufacturing operations. Additionally, the methodology for the direct
and indirect production of recycling approach is most representative of the current dynamics of recycling
flows. Not only are facilities directly involved with recycling impacted, but there is also influence on the
surrounding infrastructure. The results from the direct and indirect methodology are towards the center of
the range of estimates provided across all four approaches. Finally, the direct and indirect production of
recycling approach is able to capture the economic impact of recycling while limiting double‐counting, which
are reasons why the direct and indirect production approach was chosen to summarize the results from the
study in the 2016 REI Report.
In general, the approach used for the 2016 study provides more conservative estimates of the economic
activity attributable to recycling than the 2001 study. Specific differences between the two studies are
described in Section 4 of this methodology report.
1.2. REIMethodologyReportOrganizationThe following sections of the methodology report describe the updated methodology and present the results
of the 2016 REI study:
Section 2 presents an overview of the methodology used to develop the 2016 REI study, describes
important concepts used to define the scope of the analysis, presents alternative approaches for
estimating the economic activity attributable to recycling and describes how the WIO model is used
to estimate the economic activity associated with recycling based on these alternatives;
Section 3 describes the data used in this study and the approaches taken for data collection;
Section 4 presents the main results of the 2016 REI study using the methodology and approaches;
Section 5 discusses the implications of the results and presents recommendations of the study;
Section 6 provides references; and
Sections 7 – 16 include Appendices that detail the WIO methodology and data sources, results,
history, and context.
1 In the 2001 REI study, economic activity associated with collection and processing activities were included as
“direct” activities. In the current study, they are included as “indirect” activities.

2016 U.S. REI Study Methodology 10
EPA developed a waste input‐output (WIO) model to provide an improved analytical framework for better
understanding the contributions of recycling to the U.S. economy. The WIO model builds on the official U.S.
input‐output (I‐O) tables maintained by the Bureau of Economic Analysis (BEA). These tables describe the
economic transactions between industries in the U.S. and are used, for example, to formulate U.S. monetary
and fiscal policy.
Using the I‐O tables as the starting point, the WIO model adds information about recyclable and recycled
material flows in the U.S. and information about employment and local, state and federal tax revenue.
Combining this information with the detailed statistics regarding economic transactions enables the
estimation of the economic activity attributable to recycling.
This section of the report presents an overview of the methodology used to develop the 2016 REI study, and
describes important concepts that define the scope of the analysis. This section also presents alternative
approaches for estimating economic activity attributable to recycling and describes how the WIO model is
used to recycling’s economic contributions based on these approaches. A more detailed description of the
methodology is presented in Appendix B – WIO Model Methodology.
2.1. TheRecycling,ReuseandRemanufacturingValueChainFor the purpose of this analysis, recycling is defined as the recovery of useful materials such as paper, glass,
plastic, metals, construction and demolition (C&D) and organics from the waste stream (e.g., municipal solid
waste) and the transformation of that material to make new products, resulting in a reduction in the amount
of virgin raw materials needed to meet consumer demand. This analysis also includes within the definition of
recycling the recovery and refurbishing or remanufacturing of products and materials that have reached the
end of their intended useful life. This scope could include, for instance, the recovery of timbers from an old
house and milling and finishing the timbers to make wood flooring, or the recovery and remanufacturing of
computer components. It does not include the reuse of products that are intended to be reused multiple
times and have yet to reach the end of their useful life (e.g., tire casings designed for retreading). To help
inform federal efforts to reduce food waste, the study also analyzes the economic activity associated with
food salvage and donation.
EPA recognizes that food salvage for donation and the reuse or remanufacturing of electronics are not
“recycling” activities. However, for brevity, the report uses the term “recycling” when describing the overall
scope and results of the analysis. In sections describing food donation and electronics recovery, reuse and
remanufacturing, more precise language is used.
To estimate the economic activity attributable to recycling, it is necessary to associate recyclable and
recycling flows with the physical processes involved in transforming recyclable materials into useful products,
providing reusable materials to the intermediate or final consumer and delivering salvaged food to those in
need. These processes can then be associated with specific product and service industries to estimate the
direct, indirect and induced economic activity attributable to recycling, reuse and food donation.
There are many different, and equally valid, definitions of recycling that include some or all of the following
activities: 1) material collection; 2) separation, cleaning and/or other processing (e.g., baling plastic bottles);
3) transformation of recyclable materials into marketable products; 4) distribution, storage and service
delivery (e.g., distribution of food to and from food banks, used products wholesaling and retailing) and 5)
2. SummaryoftheWIOModelMethodology

2016 U.S. REI Study Methodology 11
transportation at each stage. For this analysis, recycling is defined to include all of these activities. However,
to create an efficient analytical framework that avoids double‐counting, recycling activities are further
distinguished as direct or indirect.
Direct recycling activities are those associated with the actual transformation of recyclable materials into
marketable products such as the transformation of aluminum scrap into semi‐fabricated products (e.g.,
ingots) in a secondary smelter. For reuse and food donation, the recycling activity is defined as the point for
sale (e.g., where reused goods substitute for new goods) or the point of service (e.g., where a food pantry
provides donated food to those in need). Indirect activities associated with recycling, reuse and food
donation include the activities involved in the value chain of the direct processes, such as the collection,
sorting and transportation of aluminum scrap to the smelter or the transportation of donated food from the
food bank to the local food pantry.
Finally, the development of a comprehensive WIO model to estimate economic activity attributable to
recycling in the U.S. is a significant undertaking involving documentation and modeling of specific material
flows. The initial development of the WIO model focused on the most commonly recycled materials and
materials that are significant from an environmental, economic and social policy standpoint. Table 1
summarizes the materials and types of processes captured in the 2016 Report WIO model.
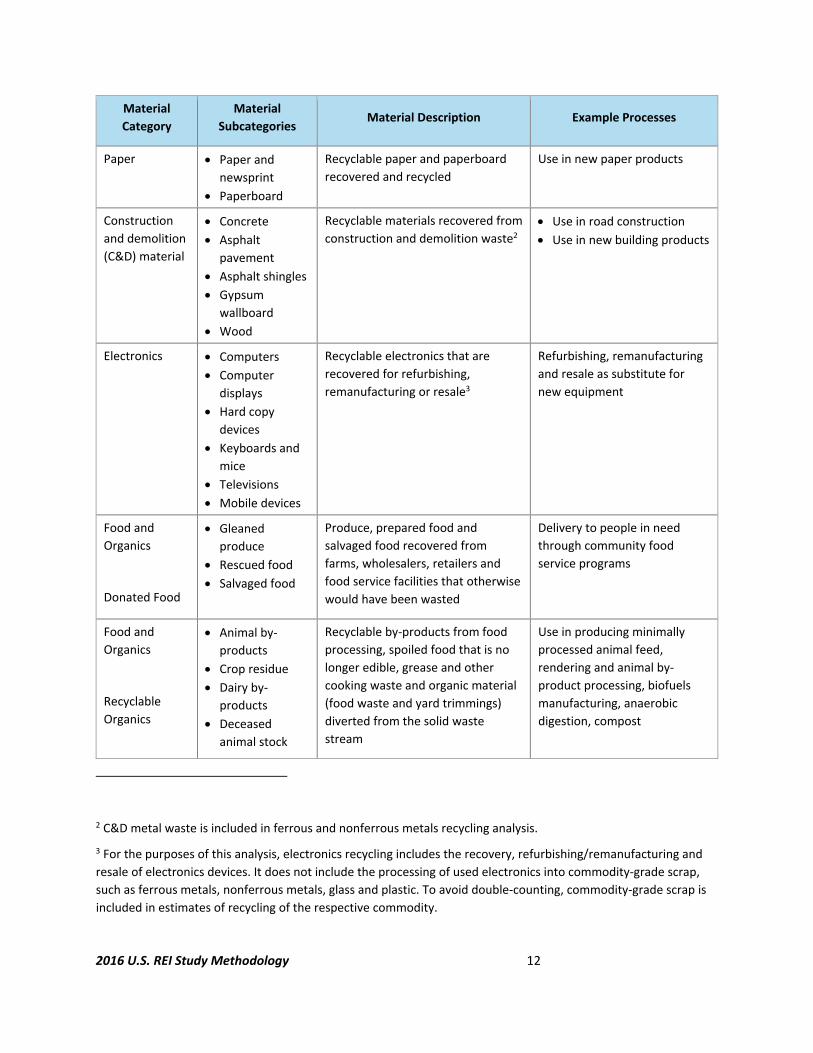
Table 1. Materials Included in the Scope of Recycling for this Study
Material
Category
Material
Subcategories Material Description Example Processes
Ferrous metals
Iron
Steel
Ferrous metals recovered from
appliances, automobiles, steel
containers, construction and other
sources
Use as a feedstock in steel mills
and foundries to manufacture
raw steel and castings
Aluminum No subcategories Aluminum scrap from used
beverage cans, other containers,
transportation, construction and
other sources
Use as a feedstock in smelting
operations to manufacture
semi‐fabricated products (e.g.,
ingots, slabs)
Plastics
PET
HDPE
LDPE
Recyclable plastics recovered for
recycling
Use in new food and
nonfood packaging products
Use in new rug fibers
Use in new pipe products
Use in new composite
lumber
Rubber
Rubber crumb
Other recyclable
rubber
Ground rubber produced from scrap
tires used to produce rubber crumb
and used in other scrap forms
Use in new molded rubber
products
Use for playground surfacing
and athletic fields
Glass No subcategories Glass cullet recovered from glass
bottles and jars
Use in new glass containers
Use in new fiberglass
2016 U.S. REI Study Methodology 12
Material
Category
Material
Subcategories Material Description Example Processes
Paper Paper and newsprint
Paperboard
Recyclable paper and paperboard
recovered and recycled
Use in new paper products
Construction
and demolition
(C&D) material
Concrete Asphalt
pavement
Asphalt shingles Gypsum
wallboard
Wood
Recyclable materials recovered from
construction and demolition waste2
Use in road construction Use in new building products
Electronics Computers
Computer
displays
Hard copy devices
Keyboards and mice
Televisions Mobile devices
Recyclable electronics that are
recovered for refurbishing,
remanufacturing or resale3
Refurbishing, remanufacturing
and resale as substitute for
new equipment
Food and
Organics
Donated Food
Gleaned produce
Rescued food Salvaged food
Produce, prepared food and
salvaged food recovered from
farms, wholesalers, retailers and
food service facilities that otherwise
would have been wasted
Delivery to people in need
through community food
service programs
Food and
Organics
Recyclable
Organics
Animal by‐
products
Crop residue Dairy by‐
products
Deceased animal stock
Recyclable by‐products from food
processing, spoiled food that is no
longer edible, grease and other
cooking waste and organic material
(food waste and yard trimmings)
diverted from the solid waste
stream
Use in producing minimally
processed animal feed,
rendering and animal by‐
product processing, biofuels
manufacturing, anaerobic
digestion, compost
2 C&D metal waste is included in ferrous and nonferrous metals recycling analysis.
3 For the purposes of this analysis, electronics recycling includes the recovery, refurbishing/remanufacturing and
resale of electronics devices. It does not include the processing of used electronics into commodity‐grade scrap,
such as ferrous metals, nonferrous metals, glass and plastic. To avoid double‐counting, commodity‐grade scrap is
included in estimates of recycling of the respective commodity.

2016 U.S. REI Study Methodology 13
Material
Category
Material
Subcategories Material Description Example Processes
Grease/FOG
Plate waste
Produce, oilseed
and grain
residues
Spoiled food
Trim and other
cooking waste
Yard trimmings
manufacturing and landscape
material application
EPA recognizes that the current 2016 REI WIO model does not include all of the materials where recycling
makes important contributions to the U.S. economy. However, the model is a first step in establishing a
framework for integrating additional materials, products, material flow and other information as it becomes
available to develop a more complete picture of the economic activity attributable to recycling in the U.S.
over time.
2.2. AnalyticApproachesIncludedintheREIStudyManufacturing a product from recyclable materials requires machinery, raw materials (e.g., water, virgin
material inputs), energy and other inputs. Manufacturers of recycled products purchase these inputs from
other industries (e.g., machinery manufacturers, power companies) that in turn purchase inputs from
upstream suppliers. The effect of the demand for recycling inputs on industries throughout the upstream
supply chain is referred to as the multiplier effect or ripple effect. The multiplier effect can be calculated using
the Leontief inverse of an input‐output table (see Appendix B – WIO Model Methodology).
Multiplier analyses assume the final and intermediate demands for products and services pull corresponding
upstream inputs, and upstream factor inputs are attributable to downstream activities that require them. In
other words, the demand for aluminum scrap for recycling, for example, creates a demand for facilities that
recover aluminum scrap and the demand for energy used in those material recovery facilities. If there were
no demand for aluminum scrap, this upstream economic activity necessary for aluminum scrap recovery
would not exist.
A key issue to consider in multiplier analysis is therefore the definition of demand. As discussed in Figure 1, calculating economic activity attributable to recycling by multiplying intermediate (i.e. business‐to‐business)
demand by an input‐output multiplier results in the type of double‐counting that has challenged previous
REI studies. To overcome these challenges, the WIO model bases estimates of economic activity
attributable to recycling on the final demand for products and services – that include recycled content or
involve recyclables – by the end‐users in the economy. Final demand end‐users include households,
governments and exports.
It is important to realize that the results from multiplier analyses are the results of an analytical model (as
opposed to observation). Therefore, they depend on the methodology and assumptions employed in the
analytical model. More than one set of assumptions is possible in modeling the economic activity attributable

2016 U.S. REI Study Methodology 14
Complex interconnections between economic sectors make it difficult to quantitatively attribute economic
activity to a particular sub‐component of a sector, such as recycling. Economic input‐output models provide
a well‐established analytical framework for quantifying direct and indirect economic activity. Sector
interconnections throughout the supply chain can be captured through input‐output multipliers. However,
input‐output multipliers are designed to estimate the activity attributable to changes in final demand,
rather than intermediate demand between economic sectors. When used to analyze changes in
intermediate demand, economic activity can be substantially overstated across the supply chain due to a
double‐counting effect.
For example, suppose that the recycler processes and delivers steel to a smelter that uses the material to
produce hot‐rolled coil for use in motor vehicle suspensions. By creating a demand for the recycled steel,
each and every industry in the downstream supply chain (e.g., smelter, suspension maker and automaker)
can claim the direct and indirect economic activity of the recycling facility as part of their contribution to
the economy. Aggregating economic activity at intermediate points along the supply chain will therefore
result in figures that far exceed the true regional and national totals.
Existing methods to mitigate the double‐counting effect generally involve normalization of the results to
dilute the effect. However, the origin of the problem is the misuse of these multipliers, which are designed
to be used with final demand, not intermediate demand. Normalization techniques do not specifically
address this issue. Final demand in an input‐output framework is the end‐point of a supply chain. When
economic activity is attributed to final demand, consumption—and the economic activity created in the
supply chain as a result of that consumption, such as the economic activity associated with recycled steel
created by the demand for motor vehicles—is counted only once in a mutually exclusive and collectively
exhaustive manner (see, e.g., Lenzen et al., 2007).
The WIO model builds on BEA’s national I‐O tables by disaggregating the “scrap” flow to better represent
the flows of secondary materials, recycling processes and their interactions with the rest of the economy.
This enables approaches (e.g., recycled content in final demand) that transparently track gross physical and
economic recycling activity at a higher resolution and assess the net economic activity of recycling, avoiding
the double‐counting problem.
to recycling in the U.S. economy. To provide a more insightful analysis, the WIO model is used to estimate
recycling’s contribution to economic activity using four approaches: 1) direct production, 2) direct and
indirect production, 3) final demand and 4) recycled content in final demand. Table 2 shows the direct,
indirect and induced economic activity covered by each approach.
Section 3 describes the four approaches and the different assumptions and methods used to model economic
activity attributable to recycling. The results shared in Section 4 focus on the direct and indirect production
approach, which is the preferred method due to its ability to capture the economic impact of recycling while
limiting double‐counting.

2016 U.S. REI Study Methodology 15
Figure 1: Double‐Counting Can Occur When Intermediate Demand is applied to an Input‐Output Multiplier Framework
Table 2. Four Approaches to Measuring the Impact of Recycling
Direct production ○ × ×
Direct and indirect production ○ ○ ×
Final demand ×
Recycled content in final demand
Notes: ○ Included. Not included. Partly included (only the final demand sectors’ share of recycling).× Partly included (based on recycled content in final demand).
2.2.1. HypotheticalEconomytoIllustrateMethodsFigure 2 presents a hypothetical economy to illustrate alternate methods for estimating the economic
activity attributable to recycling. The figure highlights four subsectors of the economy (Sectors 1 through 4)
that involve a linear set of supply chain relationships. Two of the sectors are involved in recycling activities
associated with two materials (Materials A and B).
The hypothetical economy is described as follows:
Sector‐to‐sector relationships:
o Sector 1 manufactures durable equipment using Material A as an input. The equipment is used
by manufacturers in Sector 2 (i.e. it is one of the products shown in the Direct Inputs box
beneath Sector 2). The equipment does not become, in a physical sense, part of the product
manufactured in Sector 2.
o Sector 2 produces an intermediate product that is used in the Material B recycling process in
Sector 3.
o Sector 3 produces a mechanical part that is assembled with other materials and parts during the
manufacturing of the final product in Sector 4 (e.g., a part made with recycled aluminum
assembled into a car engine). The product of Sector 3 is embedded in a physical sense in the final
product manufactured in Sector 4.
Relationships to final consumers:
o Sector 4 produces the final product consumed by households and governments.
Approach Name Recycling’s
direct activity Recycling’s supply
chain activity
Ordinary products’ direct and induced activity outside recycling’s
supply chain

2016 U.S. REI Study Methodology 16
o Sectors 1 through 3 are part of the upstream supply chain of the Sector 4 final product.
Recycling activity:
o Sectors 1 and 3 are engaged in recycling activities. At least a portion of the activity within each
sector is involved in transforming recyclable materials generated by consumers or other sectors
into intermediate products.
For simplicity, this hypothetical segment of the economy does not show the detailed interactions and
processes associated with other product and service sectors. These product and service sectors consume
inputs and produce the resources, materials, products and services that are used in Sectors 1 through 4 and
other parts of the economy. For illustration purposes, it is assumed that recycling does not take place in
these other sectors. The other products and services component includes both upstream supply chain sectors
and final products and services.
2.2.2. Directproductionofrecycling
The direct production of recycling approach defines the economic activity attributable to recycling in terms of
inputs and outputs associated with sectors directly engaged in recycling. Using the hypothetical economy,
this model consists of the labor inputs (jobs) associated with Sectors 1 and 3. Figure 3 illustrates this
approach, partially highlighting the “labor” inputs to indicate the hypothetical situation where not all of the
Figure 2: Hypothetical economy to illustrate methods

2016 U.S. REI Study Methodology 17
jobs in these sectors are engaged in recycling processeOther measures of economic impacts could include
percentage of total sales or tax payments attributable to recycling activities in Sectors 1 and 3. The direct
2.2.3. DirectandindirectproductionofrecyclingapproachThe direct and indirect production of recycling approach builds on the direct production approach and adds
the economic activity in the upstream supply chain of recycling processes. Of the four approaches described
herein, this methodology is most similar to the approach for estimating direct and indirect economic activity
used in the 2001 REI study.
As illustrated in Figure 4 the direct and indirect production approach includes workers directly engaged in
recycling in Sectors 1 and 3. It also includes workers engaged in the upstream supply chain of the recycling
activities in both Sectors 1 and Sector 3. Workers directly engaged in recycling in Sector 1 and workers
engaged in the upstream supply chain of recycling activities in Sector 1 are also be counted in the jobs
estimates for Sector 3, which results in double‐counting.
Recycling Jobs by Direct Production % Labor in Sector 1 associated with Sector 1 recycling processes
Approach = + % Labor in Sector 3 associated with Sector 3 recycling processes
Figure 3: Illustration of direct production approach for estimating recycling economic impacts
method does not include indirect (i.e., supply chain) effects.
2016 U.S. REI Study Methodology 18
Recycling Jobs by Direct and Indirect 2*(% Labor in Sector 1 associated with Sector 1 recycling processes)
Production Approach = + % Labor in Sector 3 associated with Sector 3 recycling processes
+ 2*(Labor in upstream supply chain associated with Sector 1 recycling processes)
+ Labor in upstream supply chain associated with Sector 3 recycling processes
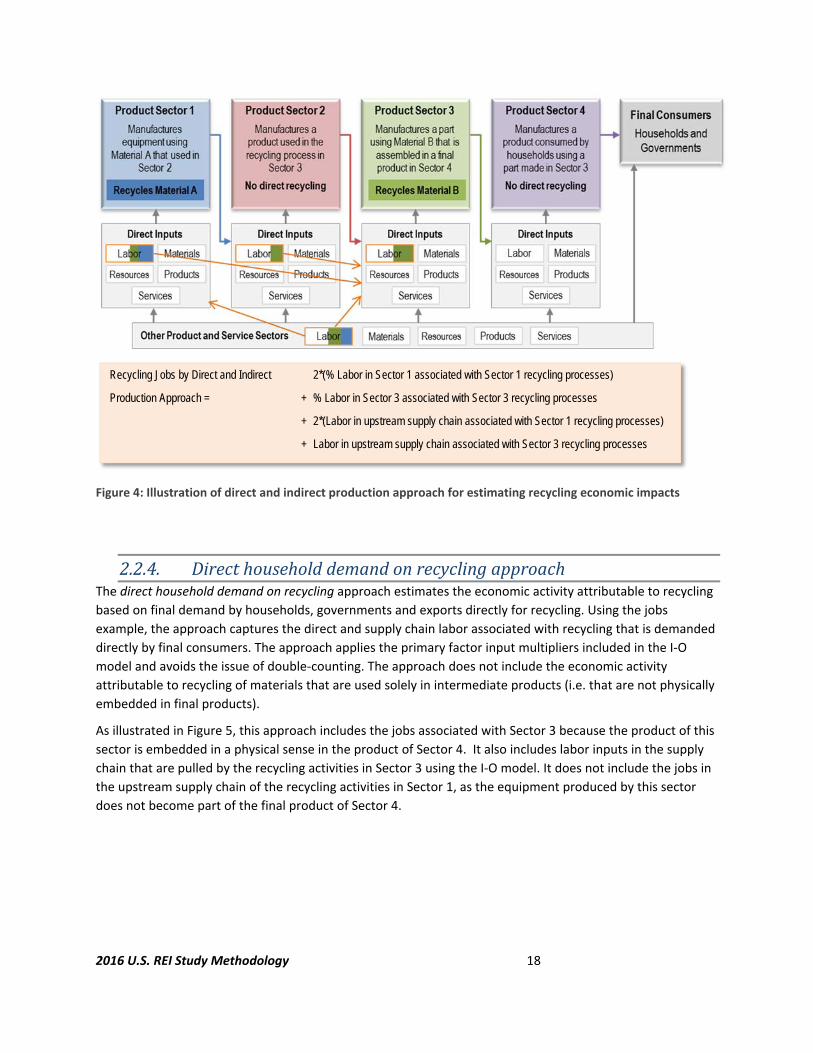
Figure 4: Illustration of direct and indirect production approach for estimating recycling economic impacts
2.2.4. DirecthouseholddemandonrecyclingapproachThe direct household demand on recycling approach estimates the economic activity attributable to recycling
based on final demand by households, governments and exports directly for recycling. Using the jobs
example, the approach captures the direct and supply chain labor associated with recycling that is demanded
directly by final consumers. The approach applies the primary factor input multipliers included in the I‐O
model and avoids the issue of double‐counting. The approach does not include the economic activity
attributable to recycling of materials that are used solely in intermediate products (i.e. that are not physically
embedded in final products).
As illustrated in Figure 5, this approach includes the jobs associated with Sector 3 because the product of this
sector is embedded in a physical sense in the product of Sector 4. It also includes labor inputs in the supply
chain that are pulled by the recycling activities in Sector 3 using the I‐O model. It does not include the jobs in
the upstream supply chain of the recycling activities in Sector 1, as the equipment produced by this sector
does not become part of the final product of Sector 4.

2016 U.S. REI Study Methodology 19
Recycling Jobs by Direct Household % Labor in Sector 3 associated with Sector 1 recycling processes
Demand Approach = + Labor in upstream supply chain associated with Sector 3 recycling processes
2.2.5. RecycledContentinFinalDemandApproachThe recycled content in final demand approach (referred to herein as the recycled content approach for
brevity) allocates the economic activity attributable to product proportionally to the recycled content of the
products consumed by final consumers (households, government and exports). This approach incorporates
the concept that the materials constituting a consumer product harbor the services that the product renders.
Therefore, this approach extends the definition of final demand for recycling to the final consumer products
that physically incorporate recycled materials based on the recycled material share by mass.
Using the hypothetical example, one can calculate the direct and indirect labor required to produce the final
product in Sector 4 including not only direct labor input to Sector 4 but also all of the labor in the upstream
supply chain that can be attributed to manufacturing the product. The recycled content approach uses the
share of recycled materials in the final consumer product that Sector 4 produces and attributes the direct and
indirect labor requirement of Sector 4 to recycling based on the share.
Computationally, recycling economic activity attributable to the final consumption of a product is estimated
as the share of the total direct and multiplier impacts associated final consumption that is proportional to the
final product’s recycled content. The approach applies the primary factor input multipliers and pulls in all
recycling activity that has been included in the I‐O model. It produces a more complete estimate of the
economic activity attributable to recycling while avoiding double‐counting. In doing so, it includes the labor
inputs to ordinary sectors not directly associated with recycling if the downstream products of those sectors
incorporate recycled content.
Figure 5: Illustration of direct household demand on recycling approach for estimating recycling economic impacts

2016 U.S. REI Study Methodology 20
Using the hypothetical example, the approach would include workers directly engaged in recycling in Sectors
1 and 3. It would also include workers engaged in the upstream supply chain of the recycling activities in both
Sectors 1 and 3, without double‐counting and is illustrated in Figure 6.
Recycling Jobs by Final Demand Method = % Labor in Sector 1 associated with Sector 1 recycling processes
+ % Labor in Sector 3 associated with Sector 3 recycling processes
+ Labor in upstream supply chain associated with Sector 1 recycling processes
Figure 6: Illustration of recycled content approach for estimating recycling economic impacts
2.3. TheWasteInput‐OutputModelThe WIO model combines the official U.S. input‐output tables and more detailed information about
recyclable and recycling material flows, process inputs and economic data to create a computational
framework for estimating the economic activity attributable to recycling. Developing the WIO model
required:
Creating the WIO framework—defining the recycling economy in relation to the rest of the U.S.
economy by defining the sectors where recycling occurs, distinguishing recycling activities from other
activities within those sectors and translating this information into a computational model.
Integrating measures of economic impact—aligning publicly available and verifiable measures of
economic impact, including jobs, wages, occupational classifications and tax revenue, to the resulting
WIO framework.
The methodologies used to create the WIO framework and integrate measures of economic impact are
described in the following section. The resulting WIO model is the first iteration of the model that leverages
publicly available information to estimate the economic activity attributable to recycling in the U.S. The

2016 U.S. REI Study Methodology 21
model provides a framework that can be used to further our understanding of the economic activity
attributable to recycling as new information is made available (e.g., through updated federal statistics, state
data, and industry sources). It also establishes a sound analytical framework for estimating the broader
economic impacts associated with recycling. Section 5 identifies opportunities for further refinements and
extensions to the WIO model.
2.3.1. WasteInput‐OutputFramework
The existing U.S. official input‐output table shows flows of transactions between industries, but does not
specifically distinguish recyclable and recycled material flows. For example, the I‐O table aggregates many of
the recyclable material flows addressed in this study in the form of single scrap flow (USBEA 2014). In
addition, recycling activities are either embedded in the broader activities of a manufacturing sector (e.g., I‐O
category “331110, Iron and steel mills and ferroalloy manufacturing”) or combined and included within the I‐
O category “562000: Waste management and remediation services.” Therefore, the input‐output structure
specifically for recycling activities is not specified in that framework.
Development of the WIO model involves disaggregation of recyclable and recycled flows in the existing
national input‐output table, and creation of a hybrid unit table that links physical flows of recycling inputs
and outputs to monetary flows in the economy. The following additional types of information were collected
and incorporated into a hybrid I‐O framework for the nine material categories included in this study to
produce the WIO model:
Estimates and/or modeled flows of scrap, recyclable materials, reusable products and materials and
salvaged food produced or donated by industry or households;
Estimates and/or modeled flows of secondary (recycled, reused and remanufactured) materials
consumed by industry and households;
Unit price data for recyclable materials, reusable products and materials, donated food and
secondary (recycled) materials, used to integrate material flows with existing I‐O data;
Statistics on the percentage of scrap, recyclable materials and reusable products and materials
generated that enter into recycling, reuse and remanufacturing operations and percentage of
donated food that reaches people in need;
For recycling processes (versus reuse and food donation), secondary material yields; and
The input used by recycling, reuse, remanufacturing and food donation operations (i.e., amounts of
materials and energy consumed).
Section 3 describes data collection efforts in more detail, including sources of information and techniques
used to impute missing information.
2.3.2. IntegratingMeasuresofEconomicImpactBy defining relationships among businesses and final consumers in the economy, the WIO framework creates
a computational approach for estimating the direct and upstream economic inputs and outcomes associated
with recycling processes. For consistency with previous REI studies, economic inputs and outcomes
incorporated into the WIO model include employment as measured in terms of number of jobs, wages and
occupational distribution; and tax revenue generated as a result of recycling operations.

2016 U.S. REI Study Methodology 22
To integrate this information within the WIO framework, data on jobs and wages were collected from
publicly available information sources, including the Census Bureau Statistics on U.S. Businesses (SUSB), the
U.S. Agricultural Census and the U.S. Census of Governments. Data regarding corporate tax review was
collected from the Internal Revenue Service (IRS) Statistics of Income (SOI) program. These sources were
used to ensure that the methodology leverages existing public data and can be reproduced and updated in
the future as new data become available.
Data were integrated with the WIO framework by associating economic sector classifications in the original
data source with the sectors used in the BEA I‐O tables. Economic data were attributed to specific recycling
processes using the types of material flow information described above to calculate the share of production
in recycling industries that can be attributed to recyclables versus materials for which recyclables are
substituted to meet the functional requirements of products and services. Section 3 describes the data
collection activities in greater detail.

2016 U.S. REI Study Methodology 23
3. DataCollectionTwo primary types of data were collected to create the waste input‐output (WIO) model: 1) recycling process
data, including data used to characterize recyclable material flows, recycling process inputs and outputs and
recycled material flows and 2) economic data to enable analysis of the impact of recycling on jobs, wages and
tax revenue. Section 3 describes the data collection effort, summarizes collected data and discusses the
challenges and limitations associated with the data collection effort.
3.1. DataCollectionApproachTable 3 provides a list of data elements that were targeted for data collection for each of the nine material
categories included in the study. Information for most data elements was collected from public data sources.
For other information, such as recycling process inputs, that were not as readily available, assumptions based
on best judgement were applied. A list of assumptions made to characterize the inputs of recycling processes
can be found in Appendix D – Recycling Process Allocation Assumptions. Additionally, detailed information on
the quantities of materials recycled/recovered, along with unit prices for recycled materials can be found in
Appendix E – Recycling Material Quantity and Price Data.
Table 3: 2016 REI Study Data Elements
Data Element Description Units
Recycling Process Inputs, including recyclable materials
Quantity of energy, material, water, transportation, labor and capital inputs to recycling processes, including the recyclable material inputs.
Physical, and if available, monetary unit
Recyclable Material Production
Quantity of recyclable materials produced by industrial sectors and households, which can become inputs to recycling processes depending on the destination of those materials.
Physical, and if available, monetary unit
Distribution of Recyclable Materials
Sectors to which recyclable materials produced by industrial sectors and households are distributed such as recycling, landfill and incineration; including the quantity sourced to each.
Physical, and if available, monetary unit
Recyclable Materials Proportion
Ratio of recyclable material to total material (sum of recyclable material and virgin material for which the recyclable material is used as a substitute) used in processes that involve recycling.
Physical unit
Recycled Material Production
Quantity of recycled materials produced by recycling processes.
Physical, and if available, monetary unit
Distribution of Recycled Materials
Sectors to which recycled materials produced by recycling processes are distributed, including the quantity sourced to each. These materials may be used for consumption by households, or as intermediate inputs by industry for subsequent industrial production processes.
Physical, and if available, monetary unit
Data collection efforts included literature review and outreach to industry associations for the nine material
categories selected for the project. EPA contacted representatives at industry associations and organizations
through e‐mail and telephone calls to describe the project’s data requirements and establish initial
communication. Additionally, contact was established with working groups within EPA that could provide

2016 U.S. REI Study Methodology 24
information relevant to this study, including information on electronics recycling, reuse and remanufacturing,
food donation and organics recycling. A list of organizations and industry associations contacted is provided
in Table 4.
Table 4: 2016 REI Study Data Collection Outreach
Material Organization / Industry Association
Ferrous Metals Institute of Scrap Recycling Industries, Inc. (ISRI)
Steel Recycling Institute (SRI)
Nonferrous Metals The Aluminum Association
Plastic American Chemistry Council (ACC)
The Association of Postconsumer Plastic Recyclers (APR)
Society of the Plastics Industry (SPI)
KW Plastics
Rubber Rubber Manufacturers Association
Glass Glass Packaging Institute
Container Recycling Institute
Paper American Forest and Paper Association (AF&PA)
American Wood Council (AWC)
U.S. Department of Agriculture (USDA)
Construction & Demolition Construction & Demolition Recycling Association
Electronics Electronics TakeBack Coalition
Organics BioCycle
Key data sources included in the literature review include the following U.S. Government Reports:
EPA ORCR’s Municipal Solid Waste Generation, Recycling and Disposal report for 2012 containing
figures for all nine product categories in the United States (USEPA, 2014)
EPA report on Electronics Waste Management in the United States (USEPA 2011)
EPA documentation for the Waste Reduction Model (WARM) (USEPA, 2015b)
EPA studies of food waste loss, diversion and donation in the US (USEPA, 2009b; USEPA 2013; USEPA,
2014b; USEPA 2015b)
EPA’s Anaerobic Digestion and its Applications (USEPA 2015e)
USGS Minerals Yearbook containing recycling figures for ferrous and nonferrous metals (USGS, 2006;
USGS, 2010a; USGS 2010b; USGS, 2013; USGS, 2014)
U.S. International Trade Commission’s report on Used Electronic Products (USITC, 2013)

2016 U.S. REI Study Methodology 25
USDA Consumer‐level Food Loss estimates (USDA, 2011)
Industry Association Reports:
Bureau of International Recycling’s world steel recycling reports for ferrous metals (BIR, 2013) and
non‐ferrous metals (BIR, 2012)
Reports from the Aluminum Association (Aluminum Association, 2011)
Reports from the American Chemistry Council on plastics recycling (ACC, 2009; ACC, 2014; ACC,
2015a; ACC, 2015b)
Publications from the National Renderers Association (Meeker, 2006)
Container Recycling Institute’s report on U.S. beverage container recycling rates and trends (CRI,
2013)
Rubber Manufacturers Association reports on scrap tire recycling (RMA 2009; RMA, 2014)
Glass Packaging Institute’s report on glass recycling (GPI, 2014)
Annual Statistical Summary of Recovered Paper Utilization report from the American Forest and
Paper Association (AFPA, 2014)
Other Reports:
Tellus Institute and Sound Resource Management Group, Inc.’s report on Growing the Recycling
Economy in the U.S. (Tellus Institute, 2011)
Institute for Local Self‐Reliance’s report on the State of Composting in the U.S. (Platt et al. 2014)
These reports were used to collect information on production volumes, recycling statistics and the recyclable
material proportions. For information on recycling process inputs, mass‐based and monetary‐based data
were gathered from Life Cycle Inventory datasets such as EcoInvent v.3.0, U.S. LCI and CEDAv.4.8.
Mass‐based inputs are direct inputs (in physical units) that go into production of 1 kg of the material, and
monetary‐based inputs are direct inputs (in dollar values) that go into production of $1 of the material.
Industry associations provided review and comments on the input structure information for their industry
and were able to supply alternate data when available. While the input structure in some cases was specific
to inputs of a recycled product (such as inputs to 1 kg of 100% recycled graphic paper), in other cases input
information was available for the product in general (such as inputs to $1 of synthetic rubber manufacturing).
The purpose of this exercise was to provide industry associations with an approximation of the input
structure for the products being analyzed, and to request more accurate or complete information if available.
When better information was not available the existing input structure was used as proxy data to build the
WIO model.
In two cases alternate input structure data was available from industry: for aluminum, from the Aluminum
Association’s report on The Environmental Footprint of Semi‐Finished Aluminum Products in North America
(2010) (Aluminum Association, 2013) and for corrugated cardboard products from the NCASI report on Life
Cycle Assessment of U.S. Average Corrugated Product (NCASI, 2014).
The efforts coordinating with industry yielded data on the production volumes of recyclable and recycled
materials, recycling statistics and input structures. However, data describing distribution of recyclables and
recycled materials to other sectors and geographically was not readily available.

2016 U.S. REI Study Methodology 26
3.2. SummaryofCollectedData
3.2.1. RecyclingProcessDataSome recycling process data were obtained directly from industry associations, while other data are supplied
as proxy data from life cycle inventory databases. Table 5 summarizes data received by industry associations
and data gaps that were filled using proxy data garnered from life cycle data.
Table 5: Type of Data Received
Material Production of recyclables
Distribution of recyclables
Production of recycled
Distribution of recycled
Inputs and outputs of recycling
Ferrous metals Proxy data
Nonferrous metals Proxy data Proxy data
Plastic Proxy data
Rubber Proxy data
Glass Proxy data Proxy data
Paper
Construction and demolition material Proxy data
Electronics Proxy data
Food and organics Proxy data
Proxy data are needed when there are incomplete full life cycle analyses done by the particular material
sectors. Table 5 demonstrates that only aluminum and paper have complete recycling flow of the inputs and
outputs of recycling for their industry. Given the complex, heterogeneous nature of food and organics
category material and monetary flows and fundamental differences between food donation and organics
recycling, the WIO model (and associated data collection efforts) incorporated a higher level of granularity.
Donated food was characterized in terms of three categories: gleaned produce, rescued food and salvaged
food.4 Recyclable organics were subdivided into nine additional categories, including eight categories
4 In some figures and tables used in this report, salvaged food and rescued food are combined into a single
category, “salvaged and rescued food” for brevity.

2016 U.S. REI Study Methodology 27
associated with food production, processing, distribution, preparation and waste and one category
associated with yard trimmings (e.g., grass clippings and branches). All categories were defined to be
mutually exclusive. A high‐level depiction of material (and monetary) flows associated with the food and
organics category is shown in Figure 7. Definitions of the twelve food and organics categories are included in
Appendix D – Recycling Process Allocation Assumptions.
Figure 7: Overview of food and organic material (and monetary) flows

2016 U.S. REI Study Methodology 28
Agriculture Crop and animal production 2007 U.S. Census of Agricultural (USDA 2009)
2007 Occupational and Employment Statistics (USBLS, 2007)
2007 U.S. Statistics of Income (USIRS, 2007)
Nonfarm private industry
Forestry, fishing and agricultural support services Mining, quarrying, oil and gas extraction, utilities and construction Manufacturing Wholesale and retail trade Transportation and warehousing Services (except government)
2007 Statistics of U.S. Businesses (U.S. Census Bureau, 2007b)
2007 Occupational and Employment Statistics (USBLS, 2007)
2007 U.S. Statistics of Income (USIRS, 2007)
Government
Federal government State government Local government
2007 Annual Survey of Public Employment and Payroll (U.S. Census Bureau, 2007a)
3.2.2. EconomicDataEmployment, wage, occupation and tax revenue data were collected from publicly available sources for the
U.S. economy for the baseline model year 2007. Data were associated with the economic sectors used in the
BEA I‐O tables to form a model of employment and tax payments for the entire economy as the basis for
estimating economic activity attributable to recycling using the four approaches described in. Table 6 lists the
sources of employment and tax data. Table 6 summarizes the data, aggregated to major economic sectors.
Appendix F – Employment and Tax Revenue Data Compilation describes the economic data collection
methodology in greater detail.
Table 6: Economic Data Sources by Economic Sector
Sector Associated Activities Jobs and Wages Occupational Profile Tax Payments

2016 U.S. REI Study Methodology 29
Sector Total
Employment
Total Wages
($ million)
*
Mgmt
*
B&L
*
STEM
*
S&A
*
P&T
*
EH&O
Total Tax Payments
($ million)
Crop and animal production
5,973,955 $46,235 2% 0% 1% 6% 90% 2% $2,916
Forestry, fishing and agricultural support services
172,105 $5,564 2% 0% 1% 6% 90% 1% $976
Mining, quarrying, oil and gas extraction, utilities and construction
8,586,544 $427,574 5% 3% 3% 12% 77% 0% $80,049
Manufacturing 13,275,432 $624,422 5% 3% 8% 13% 70% 1% $158,152
Wholesale and retail trade
20,057,919 $668,528 3% 2% 2% 64% 23% 6% $140,625
Transportation and warehousing
4,351,460 $173,908 3% 2% 1% 22% 69% 4% $28,540
Services (except government)
72,006,244 $3,063,248 5% 7% 6% 25% 17% 40% $342,034
Government 22,116,019 $942,997 5% 13% 8% 19% 37% 18% ---**
Total 146,539,678 $5,952,479 5% 6% 6% 27% 34% 23% $753,296
* Occupational Profile (% employment by category)
* Key to Occupational Profile (see Appendix E for crosswalk with BLS occupational categories):
Mgmt: Management occupations
B&L: Business and legal occupations
STEM: Science, technology and engineering occupations
S&A: Sales and office administration occupations
P&T: Production, building services and transportation occupations
EH&O: Educational, health care and other service occupations
** Does not include inter-governmental transfers
Table 7: Summary of Employment and Tax Revenue Data Used in the WIO Model, U.S. 2007

2016 U.S. REI Study Methodology 30
Economic data were allocated to recycling processes based on statistics and other information regarding
recyclable material production, distribution and proportions for the nine material categories included in the
model. To the extent possible, data were collected to represent conditions as they existed for the baseline
model year 2007.
Recyclable material production data were collected from industry sources and publicly available reports, as
described in Section 3.1. The distribution of recyclables was modeled by identifying the major consuming
sectors of recyclable materials and/or by identifying major intermediate and end‐uses of recyclables and the
economic sectors in which the associated recycling processes take place. Recycling material proportions were
estimated based on statistics and other publicly available information on virgin and recyclable material flows
associated with each recycling process.
Material‐specific summaries of assumptions were also developed and distributed to the industry
organizations listed in Table 7 for review. Feedback from these organizations was used to modify
assumptions based on verifiable data sources and/or was used to help interpret the results of the analysis.
Appendix D contains the material‐specific summaries of assumptions, amended based on comments received
from industry associations and other organizations.
3.3. ChallengesandLimitationsEPA faced several data challenges and limitations during the data collection process. While best efforts were
made, it is acknowledged that data used in the study will need to be refined in the future.
One of the challenges in collecting data for different material categories was that the type of data collected
from different sources varies by year, by units (e.g., short tons, pounds) as well as by type (e.g., mass‐based
or monetary‐based). Where data were expressed in different units, conversion factors were applied to
convert from one unit to another. For consistency, metric tons was applied throughout as the mass unit and
the dollar (USD) was used as the monetary unit. While efforts were made to find and use price data of
recyclables and recycled products for the study baseline year – 2007 – in some cases price data were selected
from a different year which might not be the best representation of the price of that recyclable/recycled
material during 2007. Price data were also challenging due to the varied definitions of recyclable and recycled
materials being applied in public sources and reports. Many such reports do not differentiate clearly between
recyclable and recycled materials (e.g., the price of “recyclable glass cullet” is described as the price of
“recycled glass”). The price of scrap material, in many cases, is represented as the price of the recycled
material, which is inaccurate.
During the data collection process, data sources were limited to those found in the public domain. Therefore,
proprietary data were outside the scope of the data collection for the study.
Moreover, while nine major material categories were targeted for data collection, obtaining data for each
overall category itself, such as for recycled paper or recycled plastics, was fairly uncommon. For instance,
production volumes and recyclable and recycled material data for ‘plastics’ was not available. Data
availability differed by the type of plastic (i.e. plastic bag and PE films, plastic bottles, postconsumer non‐
bottle rigid plastics and plastic polymer type such as polyethylene terephthalate (PET), high density
polyethylene (HDPE), polyvinyl chloride (PVC), low density polyethylene (LDPE) or polypropylene (PP)) and
were aggregated.

2016 U.S. REI Study Methodology 31
Similarly, for construction and demolition materials, data on recyclable quantities was available by the type
of material consumed. For paper, data collection was focused on recycled paperboard, and recycled paper
amounts were estimated using commodity outputs of industrial sectors related to paper production. For the
glass product category, data collection efforts focused on glass beverage containers as data for other types of
glass were not readily available. Data collection for rubber products focused on ground rubber produced
from scrap tires and other rubber recovered from scrap tires used in civil engineering, reclamation and
agricultural applications. Electronic items such as computers, monitors, hard copy devices, keyboards, mice,
televisions and mobile devices were considered for data collection for electronics. Ferrous metals data
collection was conducted for steel products, and non‐ferrous metals data collection was conducted for
aluminum products such as aluminum scrap from used beverage cans, other containers, transportation,
construction and other sources.
For food and organics, data were collected for each of the twelve sub‐material categories shown in Appendix
D – Recycling Process Allocation Assumptions. Donated food and many organic products do not have a price
value (e.g., donated food is given away for free, and some food waste and yard trimmings are diverted from
municipal solid waste). Unit price information was only available for grease, animal‐by‐products and dairy‐by‐
products. In addition, obtaining data on physical inputs to recycled material was a challenge and in many
cases assumptions were required to estimate inputs (see Appendix D – Recycling Process Allocation
Assumptions).
Finally, some of the economic data used in the analysis is only available at an aggregated industry level. For
these situations, the project team used other information to allocate data. For example, the U.S. Census of
Agriculture reports total farm employment and wage data, but does not break down these data by type of
farm product. This finer resolution is required to associate farm employment and wage data to the BEA I‐O
classification system. The U.S. Census of Agriculture does break down market value of agricultural products at
an adequate level to associate the data with specific BEA I‐O codes. Therefore, the proportion of market sales
associated with different sectors of the agricultural economy was used to apportion total employment and
wage data. Additional details regarding the methods used to address these data limitations are described in
Appendix A.

2016 U.S. REI Study Methodology 32
4. Results
4.1. OverviewUsing the WIO model, for each proposed approach EPA estimated the number of job, wages and tax revenue
attributable to recycling.
Table 8 summarizes the estimates of the economic activity attributable to recycling in the base year 2007
using the four approaches described in Section 3. In summary:
Using the direct production of recycling approach, it is estimated that 371,000 of the 147 million jobs in
the U.S. economy in 2007 (0.25% of all jobs in the U.S. economy) were directly attributable to recycling.
The direct production approach also estimates that recycling activities contributed $18.7 billion in wages
(0.32% of total wages paid) and generated tax revenues of $3.7 billion (0.50% of the total tax revenues).
Using the direct and indirect production of recycling approach, it is estimated 386,000 jobs can be
attributed to indirect activity in the upstream supply chain of recycling. Combining the indirect and direct
activities makes a total of 757,000 jobs (0.52% of all jobs in the U.S. economy) attributable to recycling in
2007. The direct and indirect approach also estimates that recycling activities contributed to $36.6 billion
in wages (0.62% of total wages paid) and $6.7 billion in tax revenues (0.90% of total tax revenues).
The recycled content in final demand approach estimated recycling’s contribution to the U.S. economy in
2007 as 3.5 million jobs (2.41% of all jobs in the U.S. economy), $181 billion wage (3.04% of total wages
paid) and $30.7 billion in tax revenue (4.08% of total tax revenues). This methodology indicates that a
more complete accounting of physical flows of recycled material would likely yield higher estimates of
recycling’s contribution to the U.S. economy than the direct and direct and indirect approaches.
Looking at the direct household demand on recycling approach, the number of jobs, wage and tax
revenues attributable to recycling were estimated to be 83,000 (0.06% of all jobs in the U.S. economy),
$3.9 billion (0.07% of total wages paid) and $694 million (0.09% of total tax revenues), respectively. This
low number demonstrates the relative importance of intermediate (direct and indirect), business‐to‐
business flows of recycled materials in the U.S. economy. When intermediate or indirect production is
not accounted for, the estimates likely underestimate the contribution of recycling on jobs, wages and
taxes.

2016 U.S. REI Study Methodology 33
Table 8: Summary of Overall Job, Wage and Tax Results
* mt = metric ton
Section 4.2 summarizes the results for the direct and indirect production approach. Section 4.3 compares the
results of the 2001 and 2016 REI food salvage studies and discusses the significant differences between the
two studies, in terms of methods and underlying assumptions. Results for the other three approaches are
presented in greater detail in Appendix C.
4.2. DirectandIndirectProductionofRecyclingApproachThe results from the analysis under the direct and indirect production of recycling approach is summarized in
Figure 8, 9 and Figure 10. C&D provides the largest contribution to all three categories considered (job, wage and tax revenue), followed by ferrous metals and non‐ferrous metals
(aluminum). It is notable that the relative proportion of shares by the nine materials are kept stable between
the direct production of recycling and direct and indirect recycling production approaches, while the absolute
amounts are bigger under the direct and indirect production of recycling approach (Figure 11).
Title Unit Total Economy
Direct production of
recycling approach
Direct and indirect
production of recycling approach
Recycled content
approach
Direct household demand on recycling approach
Quantity and Value Contribution
Jobs # of jobs 146,539,678 371,452 757,325 3,527,304 83,550
Wage $1,000 5,952,479,603 18,768,765 36,636,597 181,018,880 3,908,227
Tax $1,000 753,296,234 3,743,036 6,795,244 30,747,406 694,178
Percentage Contribution
Jobs % 100% 0.25% 0.52% 2.41% 0.06%
Wage % 100% 0.32% 0.62% 3.04% 0.07%
Tax % 100% 0.50% 0.90% 4.08% 0.09%
Normalized Contribution Metrics (per metric ton)
Jobs # jobs/1000 mt
- 0.85 1.73 8.07 0.19
Wage $/1000 mt - 42,935 83,809 414,097 8,940
Tax $/1000 mt - 8,562 15,544 70,337 1,588

2016 U.S. REI Study Methodology 34
Figure 8: Employment results for the direct and indirect production of recycling approach
Figure 9: Wage results for the direct and indirect production of recycling approach

2016 U.S. REI Study Methodology 35
Figure 10: Tax Revenue results for the direct and indirect production of recycling approach

2016 U.S. REI Study Methodology 36
Since the organics material category comprises a heterogeneous material stream, a breakdown of direct and
indirect employment numbers, wages and taxes associated with the seven different sub‐material types is
shown in Figure 12.5 The total direct and indirect employment (# of jobs) by the organics category is around
47,118, associated wages are about $1.5 billion and associated taxes are about $200 million.
5 Note that this figure refers to animal meal (blood, bone and meat) and animal fats, oils and tallow since these
are recycled products from the rendering sector. Fats, oil and grease is a recyclable material flow (see Figure 8).
Figure 11: Share of recycling’s job creation, wage and tax revenue by material (direct and indirect production of recycling approach)

2016 U.S. REI Study Methodology 37
Figure 12: Share of direct and indirect employment numbers (# of jobs), wages ($) and taxes ($) by organics recycling

2016 U.S. REI Study Methodology 38
4.3 Comparisonof2016REIStudyandthe2001REIStudyOf the four approaches included in this current study, the direct and indirect production of recycling approach
is conceptually most similar to the original 2001 national REI study. However, the current study’s estimates of
the contributions of recycling to the U.S. economy using the direct and indirect approach are significantly
lower than the estimates generated by the 2001 REI study. For example, the 2016 study estimates that
recycling activities accounted for 0.5% of the jobs in the U.S. in 2007, directly or indirectly. The 2001 study
estimated this figure to be 2.0%. Table 9 summarizes the 2001 REI Report results and the 2016 Report
estimates of direct and indirect economic activity attributable to recycling.
Table 9: Comparison Current and Previous REI Studies’ Estimates of Contributions of Recycling to U.S. Economic Activity
Metric 2016 REI Report
(Direct and Indirect Approach)
2001 REI Report1
(Direct and Indirect Estimates)
Direct Indirect Total Direct Indirect Total
Quantity and Value Contribution
Jobs 371,452 385,873 757,325 1,121,804 1,377,310 2,499,114
Wage ($1,000) $18,768,765 $17,867,832 $36,636,597 $36,712,482 $52,275,305 $88,987,787
Tax Revenue ($1,000) $3,743,036 $3,052,208 $6,795,244 $12,935,000 NR2 NR2
Percentage Contribution Relative to Whole U.S. Economy
Jobs 0.25% 0.27% 0.52% 0.86% 1.06% 1.92%
Wage 0.32% 0.30% 0.62% 1.00% 1.43% 2.43%
Tax 0.50% 0.40% 0.90% --- --- ---
Notes:
1 Ref. R.W. Beck/NRC (2001), Tables 4-2, 5-1 and 5-6

2016 U.S. REI Study Methodology 39
The 2001 REI study estimates tax revenue associated with direct and total economic activity (direct, indirect and induced); it does not break out a separate estimate tax revenues from indirect activity
As discussed in previous sections of this report, there are several fundamental differences between the
original 2001 study and the 2016 REI study that help explain the different results. The most significant
differences include:
Definition of recycling processes—the 2001 study included recyclable material collection, processing
and related activities (e.g., wholesaling) in its definition of recycling processes and estimates of
recycling direct economic contributions. The 2016 study does not classify these activities as recycling
processes. Rather, recyclable material collection, processing and related activities are defined as
upstream supply chain processes. Using the relationships defined in the WIO model, they are
included in the estimates of indirect economic activity attributable to recycling.
Scoping approach—in the 2001 study industry sectors directly or indirectly engaged in recycling were
identified a priori based on the methodology established in earlier REI studies and recommended by
NERC (NERC, 1998). The 2016 study identified the scope of recycling activity using a materials flow
approach. Recyclable materials were selected a priori and industries directly engaged in recycling
were identified based on government and industry information documenting the flows and
destination of these materials. Industries indirectly engaged in recycling were identified using the
WIO model.
Proportioning economic factors—the two studies used a different approach for apportioning jobs
and wages associated with processes that use a mix of recyclable and virgin material feedstocks. The
2001 study counted all jobs (and associated wages) engaged in processing recyclables regardless of
the mix of recyclable and virgin materials in the process. The 2016 study apportioned jobs and wages
according to the mix of recyclables and the virgin materials for which recycles are used as a
substitute.
Input‐output methodology—the 2001 REI study used a proprietary set of multiplier models created
for local and regional economies using the national economic input‐output tables, estimates of non‐
market transactions and local and regional economic data. The WIO model from the 2016 Report
uses national I‐O tables with peer‐reviewed primary factor input multipliers. These differences affect
the magnitude of double‐counting in the indirect estimates.
Base year and recycling trends— the 2001 study used a base year of 1997 and the 2016 study uses a
base year of 2007 (the most recent national data available) to estimate economic activity
attributable to recycling. Differences in absolute and relative contributions of recycling to national
economic activity between 1997 and 2007 would be affected by changes in conditions such as
economic output and employment in different sectors, recyclables recovery, recyclable and recycled
material markets, and recycling technology.
Table 10 compares estimates of jobs directly attributable to recycling generated by the two studies to
illustrate sources of difference in the estimates, including differences in the scope of industries identified as
engaged in recycling and the apportionment of jobs within an industry to recycling processes.

2016 U.S. REI Study Methodology 40
The 2016 study presents a more conservative estimate of the economic activity in the U.S. economy that is
directly or indirectly attributable to recycling. The study likely underestimates the direct activity associated
with recycling activities due to the empirical methods used to identify recycling processes, more limited
definition of the scope of recycling and conservative assumptions used to apportion economic activity to
recycling processes. Underestimates of direct activity will have a ripple effect on estimates of indirect activity,
resulting in greater underestimation of the total direct and indirect activity attributable to recycling.
The approach taken in the 2016 REI Report to estimate the direct contributions of recycling minimizes the
possibility of double‐counting.6 The 2001 study estimates of the share of U.S. jobs directly attributable to
recycling is 0.75%, which is three times the estimate in the 2016 study. Both the original 2001 REI Report and
current 2016 REI Report estimates of direct contributions of recycling as a share of national employment are
significantly higher than estimates developed for the European Union using similar methodologies.7
In terms of indirect estimates, the direct and indirect production of recycling approach used in the 2016 study
does not eliminate the double‐counting issue inherent in the original 2001 REI study, but may significantly
reduce its impact on the estimate. Double‐counting will offset some of the conservative factors affecting the
current 2016 study’s estimates of indirect economic activity.
4.4 ModelApproachSelectionforCommunicationPurposesFor purposes of communicating the recycling jobs, wages and taxes numbers and the REI story, it was
determined that one approach should be selected. The process of selection involved reviewing the four
approaches presented in the 2016 REI Methodology Document: direct, direct and indirect (intermediate
approach), recycled material flow and the recycled demand by end consumer. The direct production of
recycling approach was too one dimensional and limited in its analysis and missed the impact within indirect
and upstream industries. The direct and indirect (intermediate) production of recycling approach is the two
dimensional analysis that accounts for not only direct, but also upstream supply chain economic activity. The
intermediate approach is the closest methodological approach to the original 2001 REI study, but
incorporates advances that improve the estimates and limit double‐counting. The recycled content in final
demand approach was the newly created three dimensional SMM material flow model that needs
considerably more data and further independent review and analysis before becoming the 21st century job
analysis tool. The direct household demand on recycling approach was an academic exercise to test the
model with limited analytical capability for providing a reliable estimate of the impact recycling has on jobs,
wages and taxes. EPA’s National Center for Environmental Economics (NCEE) gave an informal preliminary
review of the draft 2016 REI Report and found the direct, and direct and indirect methodologies the most
6 For example, recycling of nonferrous metals and plastics recovered from disassembly of electronic products was
not included in estimates of the recycling activity associated with electronics to minimize possibility of double‐
counting the jobs, wages and tax revenues associated with nonferrous metals and plastics recycling.
7 For further comparison, similar studies of the European Union estimated that recycling directly contributed to
0.09% of all jobs in the EU in 2007 (Ecorys, 2012).

2016 U.S. REI Study Methodology 41
appropriate. With those considerations, the intermediate approach (direct and indirect) was selected for the
2016 REI report.
Table 10: Comparison of 2016 REI Report and the 2001 REI Study based on Direct Employment Estimates
Ferrous metals
Iron and steel mills 331111 81% 118,544 40% 43,183
-75,361
Iron and steel foundries
331511331512331513
96% 126,313 40%
36,071 -90,242
Nonferrous metals
Nonferrous Secondary Smelting and Refining Mills
331314331423331492
62% 12,790 27% 4,788 -8,002
Nonferrous ProductProducers
331421331315331316331319
45% 36,363 33% 20,039 -16,324
NonferrousFoundries
331521331522331524331525331528
74% 69,317 26% 17,936 -51,381
---1 331422331491
--- --- 23% 6,017 +6,017
Plastics Plastics converters Included in both studies:
326112326113326122326160326199
Included in 2001 REI study only:2
326111326121326130326140326150326191326192
22% 178,700 4% 30,53 5 -148,165
Plastics reclaimers 325991 70% 19,411 0%2 0 -19,411
Material Category
(2016 Study)
Corresponding Industry Category
(2001 Study)
Associated NAICS Industry Classifications
2001
Study Recycling Share of
Jobs
2001
Study Estimated Recycling
Jobs
2016
Study Recycling Share of Jobs
2016 Study
Estimated Recycling
Jobs
Difference in Jobs
Estimate

2016 U.S. REI Study Methodology 42
---1 325222 --- --- 4% 651 +651
Rubber Rubber productmanufacturers
326211 326220 326291 326299
2% 3,917 17,211 12% +13,294
Tire Retreaders 326212 100% 7,939 5% 410 -7,529
---1 237310 237990 238910 238990
--- --- 12% 119,496 +119,496
Glass Glass containermanufacturing plants
327213 90% 19,066 23% 3,451 -15,615
Glass productproducers (other recycled uses)
327212 13% 4,723 0%2 0 -4,723
---1 327993 --- --- 30% 5,639 +5,639
Paper Paper, paperboardand deinked marketpulp mills
322121 322122 322130
72% 139,375 14% 17,183 -122,192
Paper-basedproduct manufacturers
322299 54% 12,867 0%2 0 -12,867
Construction and demolition (C&D) material
Pavement mix producers (asphalt and aggregate)
324121 25% 3,460 17% 14,457 -1,069
---1 115112 321219 321918 324122 327310 327420
--- --- 2% 2,278 +2,290
Electronics Computer andelectronic appliance demanufacturers
421690 811212
1% 3,837 0%2 0 -3,837
Material Category
(2016 Study)
Corresponding Industry Category
(2001 Study)
Associated NAICS Industry Classifications
2001
Study Recycling Share of
Jobs
2001
Study Estimated Recycling
Jobs
2016
Study Recycling Share of Jobs
2016 Study
Estimated Recycling
Jobs
Difference in Jobs
Estimate

2016 U.S. REI Study Methodology 43
Difference in Jobs
Estimate
Material Category
(2016 Study)
Corresponding Industry Category
(2001 Study)
Associated NAICS Industry Classifications
2001
Study Recycling Share of
Jobs
2001
Study Estimated Recycling
Jobs
2016
Study Recycling Share of Jobs
2016 Study
Estimated Recycling
Jobs
---1
333315334111334119334210334220334310
--- --- 3% 8,025 +8,025
Food and Organics
Compost and miscellaneous organics producers
Specified in 2016 study:3
112210221119311613325199325314561730624210
---3 31,718 4% 36,118 +4,400
Other Industries Not Included in 2016 Study
Residential curbside collection
562111 24% 32,010 0%4 0 -32,010
Materials recoveryfacilities
562920 100% 14,155 0%4 0 -14,155
Recyclable materialwholesalers
421930 100% 114,992 0%4 0 -114,992
Other recyclingprocessors/ manufacturers
Not specified ---3 14,901 0% 0 -14,901
Motor vehicle parts (used)
421140 100% 45,807 0% 0 -45,807
Retail usedmerchandise sales
453310 100% 97,965 0% 0 -97,965
Wood reuse (not C&D)
321920321999
10% 9,109 0% 0 -9109
Materials ExchangeServices
541990 1% 186 0% 0 -186
Other Reuse 421810421820
22% 4,340 0% 0 -4,340

2016 U.S. REI Study Methodology 44
Notes:
1 Industry identified in as 2016 study but not 2001 study as including enterprises engaged in recycling (see Appendix C).
2 Industry not identified in 2016 study as including enterprises engaged in recycling (see Appendix C).
3 Industrial sectors not specified in original 2001 study; recycling share of jobs in industry(ies) based on the 2001 study cannot be calculated.
4 Jobs associated with industry captured as “indirect” employment in 2016 study based on supply chain relationships to recycling processes.
421830
Total Direct Employment Estimates
--- 1,121,804 --- 335,317 -786,487

2016 U.S. REI Study Methodology 45
5. RecommendationsforFutureStudies
5.1. ConclusionIn this study, a waste input‐output (WIO) model is developed, which focuses on nine material categories, to
estimate related employment, wages and tax revenues attributable to recycling, reuse and food donation in
the United States. Four alternative approaches were employed in estimating recycling’s impact on the U.S.
economy. These approaches include the direct production of recycling, direct and indirect production of
recycling, recycled content in final demand and direct household demand on recycling approaches. Of the four
approaches, the direct and indirect production of recycling approach was chosen to communicate the results
as it best modeled the impact recycling has on the economy, including intermediate and upstream impacts,
while limiting the impact of double‐counting on the estimates of jobs, wages and taxes.
The results from the four estimating strategies show that recycling in the nine material categories employs
0.06% (based on the direct household demand on recycling approach), 0.52% (based on the direct and
indirect production of recycling approach) and 2.41% (based on the recycled content approach) of the
national workforce. Due to the significance of recycling and demand by intermediate industry, the results
from the direct household demand on recycling approach did not provide useful insights on the overall
recycling activities and their roles in the U.S. economy.
Overall, the recycled content in final demand approach consistently shows substantially higher estimates of
recycling’s contributions to economic activity because the approach is based on the physical presence of
recycled materials in consumer products. The other approaches are based on the monetary share of recycling
activities and the monetary transactions between industries. Given that prices of recyclables and recycled
materials are often lower than those of virgin materials, the estimates do not correspond to the physical
volume of recycled materials and the production and consumption activities that they enable.
In all cases, the recycling of metals (ferrous and non‐ferrous) and construction and demolition (C&D)
materials are identified as the most significant contributors to the national economy. The other materials
assessed included plastics, rubber, glass, paper, electronics and food and organics.
The results highlight the importance of recycling’s role in providing physical materials to the national
economy. These impacts may be considerably larger than the volume of monetary transactions indicate.
5.2. OtherApplicationsoftheWIOModelThis project is the first attempt to construct a WIO model for the United States. As such, there are several
limitations in the 2016 REI Report WIO model (see Section 3). Higher quality data would significantly improve
the accuracy of the estimates of the model.
The WIO model could eventually be used to estimate the broader economic and environmental benefits
associated with recycling. The model could be used to conduct first‐order counterfactual (“what‐if”) scenario
analyses where the economic impacts of different recycling and waste management strategies could be
evaluated (e.g., in terms of shifts in employment from extractive to recycling industries). The framework
could also be used to quantify the benefits of recycling with regard to greenhouse gas (GHG) emission
reduction, energy, employment and other environmental and social metrics.
2016 U.S. REI Study Methodology 46
In other countries, WIO models have been utilized for Life Cycle Assessment (LCA), Life Cycle Costing (LCC)
and waste management planning (Nakamura et al., 2007; Nakamura and Kondo, 2009; Kondo and Nakamura,
2004; Takase et al., 2005; Nakamura and Kondo, 2002; Ecorys, 2012).
The basic idea of distinguishing materials, wastes, recyclables and recycled flows in an input‐output table can
also be applied to sustainable resource management policy. A well‐constructed hybrid‐unit WIO model
serves as a map that shows how resources are extracted, transformed, distributed, deposited and discarded
in and out of a national economy. Such a tool is indispensable for understanding the materials metabolism of
a national economy and identifying potential areas for resource efficiency improvement.
5.3. AreasforFutureStudyandRefinementResource efficiency is recognized as an important strategy for a competitive economy, and many countries
and authorities are actively developing new strategies toward resource efficiency. EPA established a vision
for improving resource efficiency in the U.S. in the Sustainable Materials Management, The Road Ahead
report (USEPA, 2009a), and is pursuing several strategic initiatives to foster SMM (USEPA, 2015d). The
European Commission issued a roadmap toward a circular economy in April 2015 (European Commission,
2015), and a new and comprehensive strategy document and policy to achieve a circular economy
(http://ec.europa.eu/environment/circular‐economy).
Recycling statistics to support future research can be greatly improved with additional data collection efforts
focused on the following topics:
Amount, price and source (producing parties) of recyclables by materials
Amount, price and destination (consuming parties) of recycled materials
Inputs needed to process recyclables and to produce recycled materials
In addition, developing a standard definition of recycling processes and system boundaries would be
beneficial for future REI studies. The 2016 WIO framework is capable of being continuously updated and
maintained with additional data as they become available. While the framework developed in this study can
be applied to regional analyses, it is suggested that estimates be substituted by data specific to a particular
region of interest for a more sophisticated economic impact analysis.

47 2016 U.S. REI Study Methodology
6. ReferencesADEM. (2012). Economic Impact of Recycling in Alabama and Opportunities for Growth. Montgomery,
AL: Alabama Department of Environmental Management (ADEM).
Aluminum Association (2011). Aluminum: The Element of Sustainability. Arlington, Virginia.
Aluminum Association. (2013). The Environmental Footprint of Semi‐Finished Aluminum Products in North
America: A Life Cycle Assessment Report.
ACC (2009). 2007 United States National Post‐Consumer Plastics Bottle Recycling Report. Washington,
DC: American Chemistry Council.
American Chemistry Council (ACC) (2014). 2013 United States National Post‐Consumer Plastics Bottle
Recycling Report. Washington, DC: American Chemistry Council.
American Chemistry Council (ACC) (2015a). 2013 National Post‐Consumer Non‐Bottle Rigid Plastic
Recycling Report. Washington, DC: American Chemistry Council.
American Chemistry Council (ACC) (2015b). 2013 National Post‐Consumer Plastic Bag & Film Recycling
Report. Washington, DC: American Chemistry Council.
American Forest & Paper Association (AFPA) (2014). Annual Statistical Summary of Recovered Paper
Utilization 2014. Washington, DC: American Forest & Paper Association.
Ayers, R.U. (1997). Metals Recycling: Economic and Environmental Implications. Resources, Conservation
and Recycling, 21(3): 145‐173.
Bratkovich, S., J. Howe, J. Bowyer, E. Pepke, M. Frank and K. Fernholz (2014). Municipal Solid Waste (MSW)
and Construction and Demolition (C&D) Wood Waste Generation and Recovery in the United States.
Minneapolis, MN: Dovetail Partners, Inc.
Bureau of International Recycling (BIR) (2012). World Steel Recycling in Figures 2007‐2011. Brussels,
Belgium: Bureau of International Recycling, Ferrous Division.
Bureau of International Recycling (BIR). (2013). World Steel Recycling in Figures: 2008 ‐ 2012. Steel Scrap ‐
a Raw Material for Steelmaking.
Byström, S. and L. Lönnstedt (1997). Paper recycling: environmental and economic impact. Resources,
Conservation and Recycling, 21(2): 109‐127.
CalRecycle. 2014. Waste Prevention Terms and Definitions by California Department of Resources
Recycling and Recovery. http://www.calrecycle.ca.gov/reducewaste/define.htm#Recycling.
Accessed August 6, 2014.
Cascadia Consulting Group. (2009). Recycling and Economic Development: A Review of Existing
Literature on Job Creation, Capital Investment, and Tax Revenues. Seattle: King County Solid Waste
Division.
Cochran, K., Townsend, T. 2010. Estimating Construction and Demolition Debris Generation Using a
Materials Flow Analysis Approach. Waste Management, 30: 2247‐2254.
doi:10.1016/j.wasman.2010.04.008.
Connecticut Economic Resource Center (CERC) (2012). The Economic Impact on Connecticut from
Recycling Activity. Hartford, CT: Connecticut Resources Recovery Authority

2016 U.S. REI Study Methodology 48
Container Recycling Institute. (2013). Bottled Up: Beverage Container Recycling Stagnates (2000‐2010).
U.S. Container Recycling Rates & Trends, 2013.
Craighill, A.L. and J.C. Powell. 1996. Lifecycle assessment and economic evaluation of recycling: A case
study. Resources, Conservation and Recycling 17(2): 75–96.
Dietzenbacher, E. 2005. More on multipliers. Journal of Regional Science 45(2): 421–426. Accessed August
6, 2014.
DSM Environmental (2010). 2010 Recycling Economic Information Study Update for Illinois. Oak Park,
Illinois: Illinois Recycling Association.
DSM/NERC. (2009). Recycling Economic Information Study Update: Delaware, Maine, Massachusetts,
New York, and Pennsylvania. Brattleboro, VT: Northeast Recycling Council
Duchin, F. 2014. The transformative potential of input–output economics for addressing critical resource
challenges in the 21st century. In In Baranzini M, Rotondi C, Scazzieri R (eds). Scale Constraints,
Resource Rents, and Structural Dynamics. Cambridge University Press, Cambridge, UK.
Ecorys and IDEA. 2009. Study of the competitiveness of the EU eco‐industry. Brussels: European Commission.
Ecorys. 2012. The number of Jobs dependent on the Environment and Resource Efficiency improvements.
Rotterdam: Ecorys.
European Commission. 2007. Communication from the Commission to the Council and the European
Parliament on the Interpretative Communication on waste and by‐products. EUR‐Lex ‐
52007DC0059. Brussels, Belgium: DG Environment. http://eur‐lex.europa.eu/legal‐
content/EN/TXT/?uri=CELEX:52007DC0059 Accessed August 6, 2014.
European Commission. 2015. Communication from the Commission to the European Parliament, the Council,
the European Economic and Social Committee and the Committee of the Regions: Closing the Loop –
An EU Action Plan for the Circular Economy. COM(2015) 614 final. Brussels: European Commission.
European Environment Agency. 2014. Environmental Terminology Discovery Service — EEA.
http://glossary.eea.europa.eu/terminology/concept_html?term=waste%20recycling. Accessed
August 6, 2014.
Fiksel, J. 2006. A Framework for Sustainable Materials Management. Journal of Materials 58(8): 15‐22.
GHK, Cambridge Econometrics and IEEP. 2007. Links between the environment, economy and jobs. London:
GHK Consulting.
Glass Packaging Institute (GPI) (2014). Achieving 50% Recycled Content for Glass Containers: Efforts,
Challenges, and Opportunities Ahead for the North American Glass Container Industry.
Arlington, Virginia: Glass Packaging Institute.
Glavič, P. and R. Lukman. 2007. Review of sustainability terms and their definitions. Journal of Cleaner
Production 15(18): 1875–1885. Accessed August 6, 2014.
Goldman, G. and A. Ogishi (2001). The Economic Impact of Waste Disposal and Diversion in California.
Sacramento, CA: California Integrated Waste Management Board.
Hawley, J.M. 2009. Economic impact of textile recycling: 207–232.

2016 U.S. REI Study Methodology 49
Hefner, F. (2014). The Economic Impact of the Recycling Industry in South Carolina. Report No. CR‐ 011380.
Columbia, SC: South Carolina Department of Health and Environmental Control.
International Data Corporation (IDC) (2011). Inside the U.S. Electronics Recycling Industry. Framingham,
Massachusetts: International Data Corporation.
John Dunham and Associates. (2013). Economic Impact of the Scrap Recycling Industry in the United States.
Washington, DC: Institute of Scrap Recycling Industries.
Jorgenson, D.W. and P.J. Wilcoxen. 1993. Reducing US carbon emissions: an econometric general
equilibrium assessment. Resource and Energy Economics 15(1). Resource and Energy
Economics: 7–25. Accessed December 2, 2011.
KEDC. (2007). Profile of Kentucky's Recycling Industry. Frankfort, KY: Kentucky Economic Development
Cabinet (KEDC).
Kondo, Y. and S. Nakamura. 2004. Evaluating alternative life‐cycle strategies for electrical appliances by
the waste input‐output model. The International Journal of Life Cycle Assessment 9(4): 236–246.
Konijn, P. 1994. The make and use of commodities by industries: on the compilation of input‐output data
from the national accounts.
Lenzen, M. 2001. A Generalized Input‐Output Multiplier Calculus for Australia. Economic Systems
Research 13(1): 65–92.
Lenzen, M., J. Murray, F. Sack and T. Wiedmann. 2007. Shared producer and consumer responsibility —
Theory and practice. Ecological Economics 61(1): 27–42. Accessed April 3, 2014.
Lenzen, M. and C.J. Reynolds. 2014. A Supply‐Use Approach to Waste Input‐Output Analysis. Journal of
Industrial Ecology 18(2): 212–226. Accessed August 8, 2014.
Leontief, W. 1970. Environmental Repercussions and the Economic Structure: An Input‐Output
Approach. The Review of Economics and Statistics 52(3): 262. Accessed August 6, 2014.
Leontief, W.W. 1951. Input‐output economics. Sci Am 185(4): 15–21.
Lofgren, H., R.L. Harris and S. Robinson. 2002. A Standard Computable General Equilibrium (CGE) Model
in GAMS. International Food Policy Research Institute, January 1.
Miller, A., H. Nguyen, S. Sifleet. 2007. The Economic Benefits of Recycling in Virginia. Richmond, VA: Virginia
Department of Environmental Quality.
Meeker, D.L., ed. 2006. Essential Rendering: All About the Animal By‐products Industry. Arlington, VA:
National Renderers Association.
Miller, R.E. and P.D. Blair. 2009. Input‐output analysis: foundations and extensions. Cambridge
[England]; New York: Cambridge University Press.
Morgan, J. and P. Mitchell. 2015. Employment and the circular economy: Job creation in a more resource
efficient Britain. London: Green Alliance.
National Asphalt Pavement Association (NAPA) (2014). Annual Asphalt Pavement Industry Survey on
Recycled Materials and Warm‐Mix Asphalt Usage: 2009‐2013. Lantham, Maryland: National Asphalt
Pavement Association.

2016 U.S. REI Study Methodology 50
National Association for PET Container Resources (NAPCOR) (2014). Postconsumer PET Container
Recycling Activity in 2013. Florence, Kentucky: National Association for PET Container
Resources.
NCASI. (2014). Life Cycle Assessment of U.S. Average Corrugated Product.
Nakamura, S. and Y. Kondo. 2002. Input‐Output Analysis of Waste Management. Journal of Industrial
Ecology 6(1): 39–63. Accessed April 3, 2014.
Nakamura, S. and Y. Kondo. 2009. Waste Input‐Output Analysis: Concepts and Application to Industrial
Ecology. Springer, February 8.
Nakamura, S., K. Nakajima, Y. Kondo and T. Nagasaka. 2007. The Waste Input‐Output Approach to
Materials Flow Analysis. Journal of Industrial Ecology 11(4): 50–63. Accessed April 3, 2014.
Northeast Recycling Council (NERC) (1998). Recycling Economic Information Project,
Recommendations for Conducting a Study of the U.S. Recycling and Reuse Industries, Final Report.
Brattleboro, VT: Northeast Recycling Council.
OECD. 2012. Sustainable Materials Management: Making Better Use of Resources. OECD Publishing.
Oosterhaven, J. and D. Stelder. 2002. Net Multipliers Avoid Exaggerating Impacts: With A Bi–Regional
Illustration for the Dutch Transportation Sector. Journal of Regional Science 42(3): 533–543.
Accessed April 3, 2014.
Partridge, M.D. and D.S. Rickman. 1998. Regional Computable General Equilibrium Modeling: A Survey
and Critical Appraisal. International Regional Science Review 21(3): 205–248. Accessed August 8, 2014.
Platt, B., N. Goldstein, C. Coker and S. Brown. 2014. State of Composting in the U.S. Washington, DC: Institute
for Local Self‐Reliance.
Recycling Business Assistance Center (RBAC) (2013). Employment Trends in North Carolina’s Recycling
Industry – 2013. Raleigh, NC: North Carolina Department of Environment and Natural Resources.
Rose, A. 1995. Input‐output economics and computable general equilibrium models. Structural Change
and Economic Dynamics 6(3): 295–304. Accessed August 8, 2014.
Ross, S. and D. Evans. 2003. The environmental effect of reusing and recycling a plastic‐based packaging
system. Journal of Cleaner Production 11(5): 561–571.
Rubber Manufacturers Association (RMA) (2009). Scrap Tire Markets in the United States. Washington, DC:
Rubber Manufacturers Association.
Rubber Manufacturers Association (RMA) (2014). 2013 U.S. Scrap Tire Management Summary.
Washington, DC: Rubber Manufacturers Association.
R.W. Beck/NERC. (2000). Recycling Economic Information Study. Brattleboro, VT: Northeast Recycling
Council (NERC).
R.W. Beck/NRC. (2001). U.S. Recycling Economic Information Study. Washington, DC: National
Recycling Coalition (NRC).
Stone, R.A. 1961. Input‐output accounts and national accounts. Organization for European Economic
Cooperation, Paris.

2016 U.S. REI Study Methodology 51
Suh, S. 2004. Functions, commodities and environmental impacts in an ecological–economic model.
Ecological Economics 48(4): 451–467. Accessed July 4, 2012.
Suh, S. and G. Huppes. 2005. Methods for Life Cycle Inventory of a product. Journal of Cleaner
Production 13(7): 687–697. Accessed August 8, 2014.
Suh, S., M. Lenzen, G.J. Treloar, H. Hondo, A. Horvath, G. Huppes, O. Jolliet and colleagues. 2004. System
Boundary Selection in Life‐Cycle Inventories Using Hybrid Approaches. Environmental Science &
Technology 38(3): 657–664. Accessed February 18, 2013.
Suh, S. and B.C. Lippiatt. 2012. Framework for hybrid life cycle inventory databases: a case study on the
Building for Environmental and Economic Sustainability (BEES) database. The International Journal
of Life Cycle Assessment 17(5): 604–612. Accessed August 27, 2013.
Suh, S., B. Weidema, J.H. Schmidt and R. Heijungs. 2010. Generalized Make and Use Framework for
Allocation in Life Cycle Assessment. Journal of Industrial Ecology 14(2): 335–353. Accessed August
8, 2014.
Suh, S. and Y. Yang. 2014. On the uncanny capabilities of consequential LCA. The International Journal
of Life Cycle Assessment 19(6): 1179–1184. Accessed August 8, 2014.
Takase, K., Y. Kondo and A. Washizu. 2005. An Analysis of Sustainable Consumption by the Waste Input‐
Output Model. Journal of Industrial Ecology 9(1‐2): 201–219.
Tellus Institute. (2011). More Jobs, Less Pollution: Growing the Recycling Economy in the U.S. Boston: Tellus
Institute.
United Nations. 2008. System of National Accounts. New York, NY, US: United Nations Statistics
Division. http://unstats.un.org/unsd/nationalaccount/sna2008.asp. Accessed August 6, 2014.
USBEA. (2014). Bureau of Economic Analysis (BEA). 2007 Benchmark Input‐Output Accounts (data files),
Bureau of Economic Analysis, Department of Commerce, Washington D.C., USA.
U.S. Bureau of Labor Statistics (USBLS) (2007). 2007 Occupational and Employment Statistics. Retrieved April
20, 2015 from http://www.bls.gov/oes/tables.htm
U.S. Census Bureau (2007). 2007 Annual Survey of Public Employment and Payroll. Retrieved April 20, 2015 from http://www.census.gov/govs/apes/
U.S. Census Bureau (2007). 2007 Statistics of U.S. Businesses Annual Data. Retrieved April 20, 2015 from
https://www.census.gov/econ/susb/data/susb2007.html
USDA (2009). 2007 Census of Agriculture, United States, Summary and State Data, Geographic Area Series,
Part 51. Report No. AC‐07‐A‐51. Washington, DC: U.S. Department of Agriculture.
USDA (2011). Consumer‐Level Food Loss Estimates and Their Use in the ERS Loss‐Adjusted Food Availability
Data. Economic Research Service. Technical Bulletin No. 1927. Washington, DC: U.S. Department of
Agriculture.
USEPA (2009a). Sustainable Materials Management: The Road Ahead. Report No. EPA530‐R‐09‐009.
Washington, DC: U.S. Environmental Protection Agency.
USEPA (2009b). An Informal Data Study of Food Waste in the U.S. Office of Resource Conservation and
Recovery. Washington, DC: U.S. Environmental Protection Agency.

2016 U.S. REI Study Methodology 52
USEPA (2011). Electronics Waste Management in the United States through 2009. Washington, DC: U.S.
Environmental Protection Agency.
USEPA (2013). Food Waste Loss and Donation. Office of Resource Conservation and Recovery.
Washington, DC: U.S. Environmental Protection Agency.
USEPA (2014a). Municipal Solid Waste Generation, Recycling, and Disposal in the United States: Facts
and Figures for 2012. Office of Solid Waste and Emergency Response. Washington, DC: U.S.
Environmental Protection Agency.
USEPA (2014b). Food Waste Management Scoping Study. Washington, DC: U.S. Environmental Protection
Agency.
USEPA (2015a). Documentation for Greenhouse Gas Emission and Energy Factors Used in the Waste
Reduction Model (WARM). Washington, DC: U.S. Environmental Protection Agency.
USEPA (2015b). Postconsumer Food Diverted Through Donation, Animal Feed, Anaerobic Digestion, and
Composting for 2013. Washington, DC: U.S. Environmental Protection Agency.
USEPA (2015c). Advancing Sustainable Materials Management: Facts and Figures 2013. Office of Resource
Conservation and Recovery. Report No. EPA530‐R‐15‐002. Washington, DC: U.S. Environmental
Protection Agency.
USEPA (2015d). U.S. EPA Sustainable Materials Management Program Strategic Plan, Fiscal Year 2017‐2022.
Washington, DC: U.S. Environmental Protection Agency.
USEPA (2015e). Anaerobic Digestion and its Applications. Office of Research and Development, National Risk
Management Research Laboratory. Report No. EPA/600/R‐15/304. Cincinnati, OH: U.S.
Environmental Protection Agency.
USGS (2006). Aluminum Recycling in the United States in 2000. Reston, VA: U.S. Geological Survey.
USGS (2010a). 2008 Minerals Yearbook: Aluminum. Reston, VA: U.S. Geological Survey.
USGS (2010b). 2007 Mineral Yearbook: Iron and Steel, Scrap. Reston, Virginia: U.S. Geological Survey.
USGS (2013). Metal Prices in the United States through 2010. Reston, Virginia: U.S. Geological Survey.
USGS (2014). 2012 Minerals Yearbook: Iron and Steel Scrap (Advance Release). Reston, Virginia: U.S.
Geological Survey.
U.S. Geological Survey. (2012). Minerals Yearbook 2012: Recycling – Metals (Advance Release)
U.S. Internal Revenue Service (USIRS) (2007). 2007 Statistics of Income. Retrieved April 20, 2015 from
http://www.irs.gov/uac/Tax‐Stats‐2
U.S. International Trade Commission (USITC) (2013). Used Electronic Products: An Examination of U.S.
Exports. Washington, CD: United States International Trade Commission.
Ward. 2012. Ward’s Motor Vehicle Facts & Figures. Ward’s Communications.

2016 U.S. REI Study Methodology 53
7. AppendixA–RecyclingEconomicImpactMetrics:GuidanceforPolicymakers
This appendix is designed to assist state and local government to estimate potential economic impacts of
recycling activities based on the framework, methods and data presented in this report using a step‐by‐step
approach.
It is important to note that the calculations presented in this document are designed to provide an
approximate assessment of recycling’s economic impacts. Due to the limitations of the data and the
methodology used, the metrics provided in this document may include significant uncertainties. Estimates
produced based on the data below cannot therefore be substituted for a more sophisticated economic
impact analysis and data tailored to the particular location and question of interest.
While this study establishes a sound analytical framework for estimating the broader economic and
environmental impacts associated with recycling, and could be a useful tool for pursuing more sustainable
materials management (SMM), it is acknowledged that the purpose of this study is not for future analyses of
EPA’s regulatory impacts or for more specific regional analyses. For regional analyses, further detailed local
data will be required since the high level of aggregation of the data used in the 2016 report can make the
report and analysis better suited to applicability at the national scale rather than at a regional scale.
7.1.Step1:DeterminetheObjectiveoftheStudyFirst, consider the objective(s) of the recycling economic impact analysis, including:
Who is the audience?
What level of analytic rigor is required to support the study?
What are the decisions to be supported by the results, if any?
Identifying the objective(s) informs whether the approaches presented in this guidance can sufficiently
accomplish the objective(s), and if so, which approach is most appropriate. For example, if the objective of
the study is to estimate with absolute precision the amount of additional tax revenue needed for funding a
mission‐critical program, then the use of this report is not advisable. On the other hand, if the objective of
the study is to acquire a first‐cut estimate of recycling’s economic benefits, then this report can provide
useful information.
7.2. Step2:DeterminetheMostSuitableMetricAnalysisApproachBased on the objectives determined in Step 1, navigate through the decision tree in Figure 13, and select an
approach to be used for the analysis:
Is the focus of the study to gauge the size of the economy supported by the physical presence of
recycled materials in products (go to Approach 1)8, or to measure the economic impact of recycling
activities (go to)
8 Recycled materials’ physical presence is larger than their monetary representation in our economy. Consumption
of products that incorporate recycled materials induces economic impacts. This approach assumes that direct and

2016 U.S. REI Study Methodology 54
Is the study interested in the consequence of increasing recycling activities (go to)9, or
understanding the economic impacts attributable to the current recycling activities (go to)10?
Is the study focusing only on the direct impact (go to Approach 2)11, or both direct and indirect
impact of recycling (N/A)12
Is the study focusing only on the direct impact (go to Approach 2), or both direct and indirect impact
of recycling (Approach 3)13?
indirect economic impacts of a product is attributable to recycling proportional to the recycled material content of
the product measured by weight. See Section 3 for details.
9 This section is about predicting the changes that increasing recycling activities will induce. Recycling activities can
be increased by increasing recycling rate or by building or expanding recycling facilities.
10 This section is about allocating current level of economic activities to existing recycling operations. It aims at
understanding the role of recycling in the economy as it currently stands rather than predicting the impact of
recycling in the future.
11 Direct impact refers to the job, wage and tax revenue generation impacts directly from the recycling operation
itself.
12 The methodology used in this report does not support the calculation of direct and indirect economic
consequences of increasing recycling activities. The users are advised to consult economic impact analysis
professionals in this case.
13 This approach calculates the direct and indirect economic impacts attributable to existing recycling operations.

2016 U.S. REI Study Methodology 55
Figure 13: Flow Diagram for Determining the Most Suitable Metrics Approach
7.3. Step3:DataPreparationOnce the approach is selected in Step 2, required data for calculation needs to be compiled.
Approach 1 (‘recycled content in final demand’ approach) requires the amount of products
consumed within the system of interest in monetary value (in 2007 dollars). Table 11 shows the list
of products for which default recycled material content, job intensity, wage intensity and tax
revenue intensity are calculated.
Approach 2 (‘direct production of recycling’ approach) requires the amount of additional or current
amount of materials recycled for each of the nine material categories in metric tons. Table 12 shows
job intensity, wage intensity and tax revenue intensity for Approach 2.
Approach 3 (‘direct and indirect production of recycling’ approach) requires the amount of materials
recycled for each of the nine material categories in metric tons. Table 13 shows job intensity, wage
intensity and tax revenue intensity for Approach 3.

2016 U.S. REI Study Methodology 56
7.4. Step4:ImpactCalculationOnce the required data is prepared, use the corresponding table to calculate the impact of interest.
For Approach 1 (‘recycled content in final demand’ approach):
o Multiply the amount of product consumed in 2007 USD by the percentage of recycled
content in Table 11 and by any of the three intensity metrics (Direct and indirect job
intensity, Direct and indirect wage intensity ($/$), or Direct and indirect tax intensity ($/$))
in Table 13.
For Approach 2 (‘direct production of recycling’ approach):
o Multiply the quantity of recycled material of interest, measured in metric tons, by the
respective economic impact metrics in Table 12.
For Approach 3 (‘direct and indirect production of recycling’ approach):
o Multiply the quantity of recycled material of interest, measured in metric tons, by the
respective economic impact metrics in Table 13.

2016 U.S. REI Study Methodology 7 5
Table 11: Metrics to Implement Approach #1
Commodity Description
Default recycled content
Direct and Indirect
job intensity (job/$)
Direct and
indirect wage
intensity ($/$)
Direct and
indirect tax
intensity ($/$)
Health care structures 2.8% 1.6E-05 0.74 0.08
Manufacturing structures 2.8% 1.9E-05 0.84 0.09
Power and communication structures 2.8% 6.3E-06 0.32 0.05
Educational and vocational structures 2.8% 1.7E-05 0.76 0.09
Highways and streets 2.8% 8.9E-06 0.47 0.08
Commercial structures, including farm structures 2.8% 1.9E-05 0.86 0.10
Other nonresidential structures 2.8% 7.2E-06 0.35 0.05
Single-family residential structures 2.8% 1.1E-05 0.47 0.06
Multifamily residential structures 2.8% 7.9E-06 0.35 0.05
Other residential structures 2.8% 7.7E-06 0.33 0.05
Mineral wool manufacturing 25.0% 9.2E-06 0.45 0.08
Iron and steel mills and ferroalloy manufacturing 38.5% 8.1E-06 0.43 0.09
Steel product manufacturing from purchased steel 38.5% 1.0E-05 0.48 0.09
Alumina refining and primary aluminum production 19.6% 8.6E-06 0.43 0.09
Aluminum product manufacturing from purchased aluminum 19.6% 1.1E-05 0.54 0.11
Plate work and fabricated structural product manufacturing 50.3% 1.1E-05 0.52 0.09
Ornamental and architectural metal products manufacturing 50.3% 1.2E-05 0.55 0.09
Power boiler and heat exchanger manufacturing 50.3% 9.7E-06 0.50 0.08
Metal tank (heavy gauge) manufacturing 26.0% 1.1E-05 0.51 0.08
Metal can, box and other metal container (light gauge) manufacturing 47.0% 1.0E-05 0.49 0.10
Hardware manufacturing 50.3% 1.1E-05 0.52 0.08
Spring and wire product manufacturing 50.3% 1.2E-05 0.55 0.09
Turned product and screw, nut and bolt manufacturing 50.3% 1.1E-05 0.52 0.07
Valve and fittings other than plumbing 50.3% 9.9E-06 0.49 0.08
Plumbing fixture fitting and trim manufacturing 50.3% 8.5E-06 0.40 0.08
Ball and roller bearing manufacturing 50.3% 9.3E-06 0.45 0.07
Ammunition, arms, ordnance and accessories manufacturing 50.3% 8.7E-06 0.44 0.07
Fabricated pipe and pipe fitting manufacturing 50.3% 9.8E-06 0.47 0.08
Other fabricated metal manufacturing 50.3% 1.1E-05 0.52 0.08
Farm machinery and equipment manufacturing 63.4% 9.4E-06 0.45 0.08

2016 U.S. REI Study Methodology 58
Commodity Description
Default recycled content
Direct and Indirect
job intensity (job/$)
Direct and
indirect wage
intensity ($/$)
Direct and
indirect tax
intensity ($/$)
Lawn and garden equipment manufacturing 63.4% 1.1E-05 0.48 0.09
Construction machinery manufacturing 63.4% 9.3E-06 0.46 0.09
Mining and oil and gas field machinery manufacturing 63.4% 9.4E-06 0.48 0.08
Other industrial machinery manufacturing 63.4% 1.1E-05 0.57 0.08
Plastics and rubber industry machinery manufacturing 63.4% 1.1E-05 0.56 0.08
Semiconductor machinery manufacturing 63.4% 8.7E-06 0.51 0.08
Vending, commercial laundry and other commercial and service industry machinery manufacturing 63.4% 1.0E-05 0.50 0.08
Office machinery manufacturing 63.4% 9.1E-06 0.49 0.08
Optical instrument and lens manufacturing 63.4% 9.9E-06 0.54 0.07
Photographic and photocopying equipment manufacturing 63.4% 7.4E-06 0.39 0.07
Air purification and ventilation equipment manufacturing 63.4% 1.1E-05 0.48 0.08
Heating equipment (except warm air furnaces) manufacturing 63.4% 1.1E-05 0.51 0.08
Air conditioning, refrigeration and warm air heating equipment manufacturing 63.4% 1.0E-05 0.49 0.09
Industrial mold manufacturing 63.4% 1.2E-05 0.60 0.07
Metal cutting and forming machine tool manufacturing 63.4% 1.0E-05 0.56 0.08
Special tool, die, jig and fixture manufacturing 63.4% 1.3E-05 0.65 0.08
Cutting and machine tool accessory, rolling mill and other metalworking machinery manufacturing 63.4% 1.2E-05 0.63 0.08
Turbine and turbine generator set units manufacturing 63.4% 9.0E-06 0.48 0.08
Speed changer, industrial high-speed drive and gear manufacturing 63.4% 9.7E-06 0.48 0.07
Mechanical power transmission equipment manufacturing 63.4% 9.8E-06 0.49 0.08
Other engine equipment manufacturing 63.4% 1.0E-05 0.51 0.09
Pump and pumping equipment manufacturing 63.4% 8.8E-06 0.45 0.08
Air and gas compressor manufacturing 63.4% 8.9E-06 0.45 0.08
Material handling equipment manufacturing 63.4% 9.6E-06 0.48 0.08
Power-driven hand tool manufacturing 63.4% 8.7E-06 0.41 0.08
Other general purpose machinery manufacturing 63.4% 1.1E-05 0.56 0.09
Packaging machinery manufacturing 63.4% 1.1E-05 0.60 0.08
Industrial process furnace and oven manufacturing 63.4% 1.1E-05 0.55 0.08

2016 U.S. REI Study Methodology 59
Commodity Description
Default recycled content
Direct and Indirect
job intensity (job/$)
Direct and
indirect wage
intensity ($/$)
Direct and
indirect tax
intensity ($/$)
Fluid power process machinery 63.4% 1.0E-05 0.52 0.08
Electronic computer manufacturing 24.7% 5.5E-06 0.32 0.07
Computer storage device manufacturing 24.7% 6.7E-06 0.42 0.08
Computer terminals and other computer peripheral equipment manufacturing 24.7% 8.2E-06 0.49 0.11
Telephone apparatus manufacturing 24.7% 7.5E-06 0.55 0.09
Broadcast and wireless communications equipment 24.7% 7.3E-06 0.45 0.08
Other communications equipment manufacturing 24.7% 8.4E-06 0.43 0.08
Audio and video equipment manufacturing 24.7% 8.4E-06 0.42 0.09
Other electronic component manufacturing 24.7% 1.1E-05 0.52 0.08
Semiconductor and related device manufacturing 24.7% 6.5E-06 0.39 0.07
Printed circuit assembly (electronic assembly) manufacturing 24.7% 1.0E-05 0.52 0.10
Electromedical and electrotherapeutic apparatus manufacturing 24.7% 6.9E-06 0.41 0.07
Search, detection and navigation instruments manufacturing 24.7% 7.8E-06 0.47 0.08
Automatic environmental control manufacturing 24.7% 8.8E-06 0.45 0.07
Industrial process variable instruments manufacturing 24.7% 9.1E-06 0.49 0.08
Totalizing fluid meter and counting device manufacturing 24.7% 9.2E-06 0.47 0.09
Electricity and signal testing instruments manufacturing 24.7% 8.1E-06 0.53 0.08
Analytical laboratory instrument manufacturing 24.7% 7.9E-06 0.47 0.08
Small electrical appliance manufacturing 16.6% 9.5E-06 0.45 0.08
Household cooking appliance manufacturing 16.6% 1.0E-05 0.46 0.08
Household refrigerator and home freezer manufacturing 16.6% 8.6E-06 0.42 0.07
Household laundry equipment manufacturing 16.6% 1.0E-05 0.47 0.08
Other major household appliance manufacturing 16.6% 8.7E-06 0.42 0.07
Power, distribution and specialty transformer manufacturing 24.7% 8.6E-06 0.41 0.07
Motor and generator manufacturing 24.7% 1.0E-05 0.49 0.08
Switchgear and switchboard apparatus manufacturing 24.7% 8.8E-06 0.45 0.07
Relay and industrial control manufacturing 24.7% 9.1E-06 0.47 0.07
Storage battery manufacturing 24.7% 9.1E-06 0.45 0.07
Primary battery manufacturing 24.7% 8.4E-06 0.42 0.07
Communication and energy wire and cable manufacturing 24.7% 9.1E-06 0.45 0.09

2016 U.S. REI Study Methodology 60
Commodity Description
Default recycled content
Direct and Indirect
job intensity (job/$)
Direct and
indirect wage
intensity ($/$)
Direct and
indirect tax
intensity ($/$)
Wiring device manufacturing 24.7% 9.0E-06 0.43 0.07
All other miscellaneous electrical equipment and component manufacturing 24.7% 9.8E-06 0.51 0.07
Automobile manufacturing 18.1% 9.2E-06 0.48 0.09
Light truck and utility vehicle manufacturing 18.1% 9.4E-06 0.49 0.09
Heavy duty truck manufacturing 18.1% 1.1E-05 0.52 0.09
Motor vehicle body manufacturing 18.1% 1.2E-05 0.58 0.09
Truck trailer manufacturing 18.1% 1.3E-05 0.56 0.09
Motor home manufacturing 18.1% 1.2E-05 0.57 0.09
Travel trailer and camper manufacturing 18.1% 1.4E-05 0.59 0.09
Motor vehicle gasoline engine and engine parts manufacturing 18.1% 1.1E-05 0.55 0.09
Motor vehicle electrical and electronic equipment manufacturing 18.1% 1.1E-05 0.56 0.09
Motor vehicle steering, suspension component (except spring) and brake systems manufacturing 18.1% 1.1E-05 0.54 0.09
Motor vehicle transmission and power train parts manufacturing 18.1% 1.0E-05 0.54 0.09
Motor vehicle seating and interior trim manufacturing 18.1% 1.2E-05 0.54 0.09
Motor vehicle metal stamping 18.1% 1.0E-05 0.54 0.09
Other motor vehicle parts manufacturing 18.1% 1.1E-05 0.53 0.09
Aircraft manufacturing 11.0% 7.1E-06 0.42 0.06
Aircraft engine and engine parts manufacturing 33.8% 8.0E-06 0.45 0.07
Other aircraft parts and auxiliary equipment manufacturing 33.8% 8.6E-06 0.48 0.06
Guided missile and space vehicle manufacturing 33.8% 7.7E-06 0.51 0.06
Propulsion units and parts for space vehicles and guided missiles 33.8% 8.8E-06 0.56 0.06
Railroad rolling stock manufacturing 41.0% 1.1E-05 0.58 0.09
Ship building and repairing 11.6% 1.2E-05 0.57 0.07
Boat building 7.0% 1.3E-05 0.56 0.09
Motorcycle, bicycle and parts manufacturing 33.8% 9.1E-06 0.46 0.08
Military armored vehicle, tank and tank component manufacturing 33.8% 5.8E-06 0.30 0.06
All other transportation equipment manufacturing 33.8% 1.1E-05 0.51 0.09

2016 U.S. REI Study Methodology 61
Commodity Description
Default recycled content
Direct and Indirect
job intensity (job/$)
Direct and
indirect wage
intensity ($/$)
Direct and
indirect tax
intensity ($/$)
Carpet and rug mills 4.8% 1.3E-05 0.53 0.09
Pulp mills 38.7% 9.1E-06 0.46 0.08
Paper mills 38.7% 9.1E-06 0.46 0.08
Paperboard mills 38.7% 8.9E-06 0.45 0.08
Paperboard container manufacturing 38.7% 1.1E-05 0.54 0.09
Paper bag and coated and treated paper manufacturing 38.7% 9.9E-06 0.49 0.09
Stationery product manufacturing 38.7% 1.0E-05 0.48 0.08
Sanitary paper product manufacturing 38.7% 8.3E-06 0.42 0.08
All other converted paper product manufacturing 38.7% 1.1E-05 0.50 0.08
Asphalt paving mixture and block manufacturing 0.2% 5.3E-06 0.28 0.09
Petrochemical manufacturing 3.4% 5.2E-06 0.27 0.10
Plastics material and resin manufacturing 3.4% 8.0E-06 0.41 0.12
Synthetic rubber and artificial and synthetic fibers and filaments manufacturing 3.4% 9.9E-06 0.47 0.11
Plastics packaging materials and unlaminated film and sheet manufacturing 3.4% 9.8E-06 0.48 0.09
Plastics pipe, pipe fitting and unlaminated profile shape manufacturing 3.4% 1.0E-05 0.49 0.09
Laminated plastics plate, sheet (except packaging) and shape manufacturing 3.4% 8.8E-06 0.43 0.07
Polystyrene foam product manufacturing 3.4% 1.1E-05 0.51 0.09
Urethane and other foam product (except polystyrene) manufacturing 3.4% 1.1E-05 0.48 0.08
Plastics bottle manufacturing 3.4% 9.7E-06 0.45 0.09
Other plastics product manufacturing 3.4% 1.3E-05 0.56 0.08
Tire manufacturing 57.3% 1.1E-05 0.54 0.08
Rubber and plastics hoses and belting manufacturing 1.8% 1.2E-05 0.52 0.07
Other rubber product manufacturing 1.0% 1.2E-05 0.53 0.07

2016 U.S. REI Study Methodology 62
Table 12: Metrics to Implement Approach #2
Material Employment (jobs /
metric ton)
Wages ($1000 / metric ton)
Tax Revenue ($1000 / metric ton)
Ferrous metals 0.00238 0.14 0.035
Aluminum 0.03201 1.45 0.415
Glass 0.00443 0.23 0.028
Paper 0.00057 0.04 0.009
Plastics 0.01314 0.51 0.049
Rubber 0.00530 0.22 0.017
Construction and Demolition 0.00038 0.02 0.003
Electronics 0.02066 1.57 0.555
Organics 0.00080 0.02 0.003
Average 0.00085 0.043 0.00856
Table 13: Metrics to Implement Approach #3
Material Employment (jobs /
metric ton)
Wages ($1000 / metric ton)
Tax Revenue ($1000 / metric ton)
Ferrous metals 0.0050 0.25 0.056
Aluminum 0.0822 3.87 0.859
Glass 0.0104 0.54 0.077
Paper 0.0017 0.09 0.018
Plastics 0.0295 1.32 0.187
Rubber 0.0076 0.32 0.034
Construction and Demolition 0.00073 0.04 0.006
Electronics 0.0359 2.41 0.701
Organics 0.0010 0.03 0.004
Average
0.00173 0.084 0.01554
2016 U.S. REI Study Methodology 63
8. AppendixB–WIOModelMethodology
8.1. MethodologyIntroductionThis appendix describes four approaches for measuring the impacts to the U.S. economy attributable to
recycling. First, the “direct” approach measures the wage and tax payments made directly by recycling
operations. Second, the “final demand” approach uses the multiplier effects of recycling demanded by
households, the government and exports. Third, the “recycled content in final demand” approach is a novel
method proposed in this report. The approach applies the wage and tax payment multipliers to the portion of
the total final demands on material goods that consists of recycled materials. Finally, the “intermediate
production” approach applies the wage and tax payment multipliers to the sum of intermediate production
for recycled products. To empirically test the differences, a waste input‐output (WIO) model is compiled for
the U.S., distinguishing recycling operations and recyclable and recycled material flows from other sectors of
the economy.
8.2. Methodsformeasuringtheeconomicimpactsofrecycling
8.2.1. ScopeanddefinitionofrecyclingThe European Environment Agency defines waste recycling as “a method of recovering wastes as resources
which includes the collection and often involving the treatment, of waste products for use as a replacement
of all or part of the raw material in a manufacturing process” (European Environment Agency 2014). Similarly,
the California Department of Resources Recycling and Recovery define recycling as “using waste as material
to manufacture a new product” (CalRecycle 2014). Glavič and Lukman (2007) define recycling “as a resource
recovery method involving the collection and treatment of waste products for use as raw material in the
manufacture of the same or a similar product.”
There are two potential sources of ambiguity in these definitions. First, all of these definitions rely on the
term waste. Waste is defined as “objects or materials for which no use or reuse is intended” (CalRecycle
2014). The term waste is not defined in European Environment Agency (2014) or Glavič and Lukman (2007).14
Given that recycling makes use of what is defined as waste, the no use condition that defines waste in the
first place becomes no longer valid as soon as it is intended to be used for recycling.
A way to get around this problem is to assume a temporal gap, in which case recycling can be (re)defined as
using what was recognized as waste as material to manufacture a new product. In this case, the temporal
dimension becomes important in defining recycling: how many years should one count before recycling
becomes a new norm, therefore it can no longer be counted as recycling? Depending on the answer, the
14 The European Environment Agency’s glossary does provide definitions to related terms such as ‘household
waste’ and ‘industrial waste’, which all refer to the term ‘waste’.

2016 U.S. REI Study Methodology 64
entire petrochemical industry, for example, can be characterized as a recycling activity.15 Likewise, depending
on the answer, the use of used aluminum scraps for smelters may no longer be counted as recycling.
The 2007 Communication to the European Parliament distinguishes by‐products and wastes (European
Commission 2007). In this communication ‘by‐product’ is defined as “a production residue that is not a
waste” and ‘production residue’ is defined as “a material that is not deliberately produced in a production
process.” This definition of by‐product conforms well to the term used in production economics and national
accounts, where by‐products are generally referred to as a potentially marketable product, while the demand
of it does not generally increase the overall production activity of the process that produces it (Konijn 1994;
United Nations 2008). However, not all by‐products are recyclable, and not all recyclable materials are by‐
products. For example, many recyclable materials are given away for free, or a producer has to pay for
hauling recyclable materials away from their facilities, in which case the recyclable materials cannot be
referred to as a ‘product.’
Recycling, as it is commonly understood, involves a series of processes such as (1) collection and separation
of recyclable materials (collection and pre‐processing), (2) transformation of the recyclable materials into
marketable products (conversion) and (3) transportation and storage (logistics) associated with them. Many
of these processes overlap with ordinary production processes. For example, recycling iron and steel in end‐
of‐life automobile involves dismantling, sorting, compression (hulk making), shredding, cleaning, magnetic
separation, transportation and melting through an electric arc furnace (EAF) or basic oxygen furnace (BOF).
The question is whether all or only some of these processes should be referred to as recycling. In the
literature, recycling is sometimes narrowly defined to include only some of these processes, such as
collection and pre‐processing, or it can be defined more broadly.
In this report recycling refers to the recovery of useful materials, such as paper, glass, plastic and metals,
from the waste stream (e.g., municipal solid waste) to make new products, reducing the amount of virgin raw
materials needed to meet consumer demands. Recycling also includes recovery and refurbishing or
remanufacturing for reuse of products and materials that have reached the end of their intended useful life.
8.2.2. DirectandmultipliereffectsProducing a product requires machinery, raw materials and energy, which in turn requires upstream inputs
from their suppliers, the suppliers’ suppliers and so on. The impact of demand on upstream processes
throughout the upstream supply chain is referred to as the multiplier effect or ripple effect. The multiplier
effect has been commonly calculated using Leontief inverse of an input‐output table (Lenzen 2001; Leontief
1951, 1970; Miller and Blair 2009).
Let a product‐by‐1 vector y describe the quantity of arbitrary final demand. Let primary factor‐by‐product
matrix B describe the quantity of primary factor input per a unit product output. Let product‐by‐product
matrix A describe the quantity of product input per unit of product output. If so, the amount of factor input
15 Distillation of crude oil for liquid fuel and light oil leaves large volume of ‘waste’, which has been the target for
petrochemical industries to identify new uses as feedstock over the last half a century. Under the current
definition of ‘recycling’ and ‘waste’, even the entire history of material use in human civilization since
Paleolithic era can be said as the history of recycling, i.e., discovery of new uses of ‘waste’ starting from
stones.

2016 U.S. REI Study Methodology 65
needed to meet the final demand directly by the production activities that produce them can be noted as By.
The production of these products to meet the final demand will require upstream inputs from their direct
suppliers (1st tier upstream input), which can be calculated by Ay, and the amount of primary factor input
directly needed by the 1st tier upstream input can be denoted as BAy. Likewise, the amount of primary factor
input to 2nd, 3rd and nth tier upstream can be denoted as BA2y, BA3y and BAny, respectively. If the chain of
upstream requirements propagates infinitely, the total factor inputs required to fulfil y can be calculated as:
(1) ⋯ ⋯
for → ∞. Let
(2) ⋯ .
Then, m = Bx. Multiplying (I – A) on both sides of (2),
(3) ⋯ ⋯ .
Therefore, x = (I – A)‐1y and
(4) m = B(I – A)‐1y.
The inverse matrix (I – A)‐1 is the Leontief inverse L, and BL is the primary factor multiplier showing direct and
indirect primary factor inputs per unit of final demand.
8.2.3. Defining‘demand’inrecyclingMultiplier analyses assume that the final and subsequent intermediate demands pull corresponding
upstream inputs and that upstream factor inputs are attributable to downstream activities that require them.
Therefore, how demand is defined in an input‐output table determines the result of a multiplier analysis. In
input‐output analysis tradition, the supply‐demand relationship is easily defined by the flow of payment.
Unlike ordinary products where payment and product flow at the same time in an opposite directions, the
flows of recyclables may not always accompany payment or both money and recyclables may flow in the
same direction. For example, suppose that a stamping operation for an automotive part produces steel scrap
which is hauled away for free by a local recycling center where it is sold to a household light stand
manufacturer. In this case, it becomes a question whether the recycling center is the party that demands the
recyclable steel from the stamping facility or the stamping facility is the party that demands waste treatment
service from the recycling center. If the recycling center is the demanding party, the stamping facility
becomes the recycling center’s upstream supplier and part of the direct and supply chain impacts of the
facility becomes attributable to the recycling center, which will be passed down to the light stand (the
question, how much of it is attributable to recycling center will be treated later). If the stamping facility is the

2016 U.S. REI Study Methodology 66
party that demanded the waste management service, part of the recycling center’s direct and supply chain
impacts are attributable to the stamping facility. The impacts will be passed down to automobiles, but not to
light stands.
In this report, the party that makes the payment is assumed to be the demanding party regardless of the
direction of the physical flow. In case of no payment, corresponding physical flow is split and allocated
equally to waste management service and recyclable material rows of the two columns in the use matrix that
represent the two parties (see Section 3.3. for details). For instance, the stamping facility is assumed to have
purchased waste treatment service from the recycling center for the half of the stamping scrap it generated,
and the recycling center is assumed to have purchased half of the stamping scrap as a recyclable by‐product
from the stamping facility (c.f., Lenzen and colleagues 2007). For a household and the government the
payment for waste management service is assumed to be included either in the tax payment or in the
purchase price of the goods from which recyclable products are generated. Therefore, a household and the
government are assumed to be the demanding party for all recyclable material flows originating from them.
Another important issue to consider in multiplier analysis is the definition of vector y in equation (4). Factor
multipliers in input‐output analysis are designed to be pre‐multiplied to a vector of final demand y.
Therefore, the amount of recycled materials produced or the amount of recyclable materials consumed by
recycling operations are not proper entry to y vector in multiplier analyses. It is well known in input‐output
literature that such a practice generates grossly exaggerated impact results, which have been unfortunately
misused in some program evaluation studies and are referred to as “the sin of exaggerating sectorial
impacts” (Oosterhaven and Stelder 2002; Dietzenbacher 2005). The reason why the use of intermediate
production or consumption leads to an exaggerated multiplier result is that gross production values are
counted multiple times. Consider a y vector of a closed economy for a multiplier analysis using total
production volume of glass ($50 million), steel ($200 million), engine and automotive parts ($100 million) and
automobile ($300 million). Among the $300 million of automobile production, $100 million engine and
automotive parts and part of the $200 million steel might have been already included and among the $100
engine and automotive parts production, part of $200 million steel and $50 million glass might have been
included. When such a y vector is used, the direct and indirect factor inputs attributable to automobile, the
engine and automotive parts, steel and glass create multiple double‐counting, resulting in an exaggeration.
The only methodologically sound approach to avoid double‐counting in a multiplier analysis is to use only
final demand values for y.
Figure 14: Direct, indirect and induced impact and double‐counting in multiplier analyses
Suppose that the economic and employment impacts attributable to an iron and steel
recycling plant in the suburb of Pittsburgh, PA (“Facility A”, hereafter) are being estimated.
The plant receives end‐of‐life vehicles in the form of hulk, processes them through crushing
and magnetic separation and finally hauls out separated iron and steel to smelters in the
neighborhood. The entire revenue, value‐added and employment accredited to the
operation itself, is referred to as direct impact. Direct impacts are easily attributable to this
recycling operation.
Suppose further that Facility A requires heavy equipment, electricity, fuel, ground freight
services, as well as automobile disassembly and compression services in order to produce the

2016 U.S. REI Study Methodology 67
hulk. In this case, the value‐added and employment from those upstream supply chain
industries needed to provide such inputs to Facility A would be attributable to iron and steel
recycling to the extent that they are utilized by Facility A, which constitute indirect impact.
The wages paid to the employees of Facility A and its upstream supply chain industries will
spend their income earned in relation to the operation of Facility A on various items including
groceries, housing, automobiles, etc. and such expenditures and associated supply chain
would induce another round of economic and employment impact, which is referred to as
induced impact.
These direct, indirect and induced impacts have been widely quantified using regional
multipliers. However, regional multipliers such as IMPLAN and RIMS II are designed to be
used to estimate the impact of changes in final demand not in intermediate sectors. When
they are used for intermediate sectors, economic and employment impacts are (more than)
double‐counted across the supply chain.
Suppose that the recycled steel from Facility A sent to smelters are used to produce hot‐
rolled coil, which is used for suspension of a motor vehicle ultimately purchased by a
household. Each and every industry in the downstream supply chain of Facility A (i.e.,
smelters, hot‐rolled coil maker, suspension maker and automaker) can claim the entire
direct, indirect and induced economic and employment impact of Facility A as a part of their
contributions to the economy. Industries upstream from Facility A can do the same: each
industry can also claim their upstream suppliers’ economic and employment impacts as part
of their contributions. Summing these up across the supply chain produces the impact figures
that well exceed the regional or national total due to the double‐counting effect throughout
the supply chain.
Efforts have been made to mitigate the double‐counting effect of gross multipliers, and
proposed various approaches, which generally involve some form of normalization to dilute
the double‐counting. But the very origin of the problem is the misuse of these multipliers,
which are designed to be used with final demand changes rather than intermediate changes.
The reason why there is no double‐counting problem when these multipliers are used for
final demand changes only is because the final demands are considered in an input‐output
framework at the end‐point of supply chains and therefore all economic and employment
impacts are attributed to final demands only once in a mutually exclusive and collectively
exhaustive manner (Lenzen et al., 2007).
8.2.4. Fourapproachesformodelingtheimpactofrecyclingonanationaleconomy
It is important to note that the results from multiplier analyses are the results of a model (as opposed to
observation), and therefore depend on the approaches and assumptions employed by a modeler. More than
one approach is possible in measuring the impact of recycling in a national economy, and such alternative

2016 U.S. REI Study Methodology 68
approaches may allow complementary insights. When interpreting the results, it is important to understand
the differences in underlying assumptions employed in a model.
Direct production of recycling approach
First, this approach measures the primary factor inputs directly to recycling operations (see also Box 1). The
direct primary factor input to recycling, m1, is calculated by:
(5) ,
where r is a column vector of recycling fraction of production activity (ri ∈ 0, 1 ). I.e., ri = 1 for all recycling
activities, 0 for non‐recycling activities and between 0 and 1 for the activities that contribute partly to
recycling. For example, a paper production that produces 60% recycled paper gets 0.6 of recycling fraction.
Hat () diagonalizes a vector. This approach does not include any multiplier effects.
Direct household demand on recycling approach
The direct household demand on recycling approach uses the amount of final demand on recycling (waste
management service in the form of recycling in physical unit) by household, government and export (y2) (4)
(6) ,
While the calculation is methodologically consistent, this approach limits the impact of recycling only to the
ones that are demanded directly by the final consumers.
Recycled Content in Final Demand Approach
The recycled content in final demand approach applies the primary factor input multipliers to the portion of
the total final demands to the extent that they consist of recycled materials. Total primary factor input can be
calculating following this approach by:
(7) ,
Where is a diagonalized vector of recycled content in final consumption (ci ∈ 0, 1 ). I.e., ci = 1 for 100%
recycled product, and 0 for 0% recycled product by mass. For example, a typical automobile contains 60‐80%
recycled content by mass (Ward 2012), and therefore the corresponding element in c becomes 0.6‐0.8. In this
case 60%‐80% of the total direct and multiplier impacts of automobile is attributed to recycling. Under this
approach, the materials constituting a consumer product are considered to harbor the services that the
product renders, and therefore it views that the direct, and multiplier impacts associated with the final
consumption of the product are attributable to recycling proportional to their recycled content. Because it
uses a portion of final demand, this approach avoids the double‐counting problem discussed earlier.

2016 U.S. REI Study Methodology 69
Direct and Indirect Production of Recycling Approach
This approach applies the primary factor input multipliers to the sum of intermediate and final demands on
recycling. In a matrix equation, this can be calculated by:
(8) ,
Where x4 is the total (direct and indirect) production of recycled products in physical unit. This approach
exaggerates the results and is not methodologically sound. Post‐multiplying production to Leontief inverse in
equation (8) is known to create double‐counting (Oosterhaven and Stelder 2002; Dietzenbacher 2005).
8.2.5. CausalityandinterpretationofmultiplieranalysisresultsMultiplier analyses aim at quantifying the amount of factor inputs that are attributable to certain final
demand based on the allocation scheme employed, and the results of a multiplier analysis does not imply a
cause‐effect relationship. For example, suppose that total compensation to employees attributable to total
final demand on recycling is calculated to be $X. It does not mean that increasing the recycling rate by 10%
will increase the compensation to employees by 10% of $X, because such a change may potentially affect
various elements of an economy such as price, input structure and wages, and therefore the underlying
economic structure used for the calculation of the multiplier effect becomes no longer valid.
Such changes can be, in principle, captured by using computable general equilibrium (CGE) models (Lofgren
and colleagues 2002; Partridge and Rickman 1998; Jorgenson and Wilcoxen 1993). CGE models
simultaneously derive quantity and price based on a new supply‐and‐demand equilibrium after a shock to the
economy. The underlying principles of CGE models are well in line with those of mainstream economics, and
it may provide useful insights on the direction of changes in response to a large‐scale policy intervention. In
reality, however, the sector resolution in such a model is generally very poor (generally less than 60 sectors
for a national economy), and statistically significant substitution elasticity functions specifically derived for
the given region, technology and time of a study are rare (see also Duchin 2014; Rose 1995; Suh and Yang
2014).
8.3. WasteInput‐OutputModelThe official U.S. input‐output tables by the Bureau of Economic Analysis (BEA) distinguish a limited number of
categories for recyclables and recycling operations (see Appendix F) hampering adequate understanding of
recycling’s contribution to the national economy. To address the problem, a waste input‐output (WIO) model
is compiled for the U.S.
8.3.1. WIOmodelWIO model is a mixed‐unit input‐output model that highlights the flows of wastes in a national economy
(Nakamura and colleagues 2007; Nakamura and Kondo 2009, 2002). The underlying flow table for the WIO
model distinguishes flows of wastes and recyclables and activities of recycling and waste management in
addition to the flows of ordinary products and sectors described in official input‐output tables. Table 14
shows the general structure of the flow table used in WIO model.

REI Study Report 70
Table 14: General structure of the flow table used in WIO model*
Intermediate sectors
Sector 1 Sector 2 ⋯ Sector n
Interm
ediate
sectors
Sector 1
Sector 2
⋮
Sector n
n n matrix of intermediate
inputs to intermediate sectors
($)
n 3 matrix of final
consumption of
intermediate products
($)
Primary
factors
Wage
Tax
Profit
3 n matrix of primary factor
inputs by intermediate
sectors ($)
* Shaded area contains additional information that is not well represented in an ordinary input‐output. The framework can accommodate any number of final
demand sectors and primary factors. Only three final demand sectors and primary factors are shown here for the sake of simplicity.
Waste management ac tivities
Activity 1 Activity 2 ⋯ Activity p
Final demand
Household Governmen Export
t
n p matrix of intermediate
inputs to waste management
activities ($)
flows
Waste
Waste 1
Waste 2
⋮
Waste q
q n matrix of waste
generated by intermediate
sectors (ton)
q p matrix of waste generated
by waste management
activities (ton)
q 3 matrix of waste
generated by final
consumers (ton)
3 p matrix of primary factor
inputs to waste management
activities ($)

REI Study Report 71
The underlying flow table for WIO model can be rectangular, and the square direct input coefficient matrix is
derived using the allocation matrix from the flow table. Here the basic analytical framework of the 2001 REI
Report WIO model is summarized without discussing the derivation of the analytical tables, which will be
done in the next section.
Let A* be the direct input coefficient matrix of the WIO model by Nakamura and Kondo (2009). A* consists of
four concatenated matrices such that:
∗(9) ∗
∗
∗ ∗ ,
where ∗ is an intermediate sector‐by‐intermediate sector matrix, of which i‐jth element shows the input
from sector i to sector j per unit of out from j ($/$), ∗ is an intermediate sector‐by‐waste management
activity matrix, of which i‐jth element shows the input from sector i to waste management activity j per unit of
out from j ($/ton), ∗ is an waste management activity‐by‐intermediate sector matrix, of which i‐jth element
shows the use of waste management service or product (such as solid waste landfill service or recycled
paper) i by intermediate sector j per unit of out from j (ton/$), and finally ∗ is an waste management
activity‐by‐waste management activity matrix, of which i‐jth element shows the use of waste management
service or product i by waste management activity j per unit of out from j (ton/ton). The elements of A* may
take a negative sign, in which case it shows production of product or service (instead of consumption).
The general analytical framework can be considered a special case of the integrated hybrid framework (Suh
2004; Suh et al. 2004; Suh and Huppes 2005; Suh and Lippiatt 2012), where the foreground system describes
waste management processes in the WIO model. The integrated hybrid approach of Suh (2004) is based on a
product‐by‐product matrix derived from supply and use (S&U) framework, while the 2001 WIO model in
Nakamura and Kondo (2002) follows an industry‐by‐industry (or activity) framework.
WIO multiplier analyses can be performed by using A* in the place of A in equations (6) to (8).
8.3.2. DerivationoftheWIOanalyticaltablesThe supply and use framework separates product flows of products from the institutions or activities
(sectors) that house their production (supply) and consumption (use) (Stone 1961; Konijn 1994; United
Nations 2008). The separation enables higher statistical quality in underlying flow tables used for input‐
output analyses, while it also necessitates the use of models to convert the flow tables to symmetric
analytical tables such as commodity‐technology model and industry‐technology model (Konijn 1994).
Built upon such developments, the use of supply and use framework in the hybrid input‐output setting was
introduced by Suh (2004), which was extended to a generalized supply and use calculus for process‐level
details represented in physical units by Suh and colleagues (2010).
Suh and colleagues (2010) observed that the use of an allocation matrix to convert waste flows to waste
management activities in the 2001 WIO framework by Nakamura and Kondo (2002, 2009) is a special case of
standard supply and use calculus. Lenzen and Reynolds (2014) recently confirmed the earlier observation by
(Suh et al. 2010) and further elaborated on the relationship between the WIO model and supply and use
framework. The official input‐output tables of Japan, where the 2001 WIO model originates, are not using a
supply and use framework, and therefore Nakamura and Kondo (2002, 2009) treated the conversion
between the waste flows and activities separately from the rest of the economy.

REI Study Report 72
In the U.S., the official input‐output tables are published in the form of supply and use tables. Therefore, it is
natural to embed the derivation of analytical tables for WIO on a supply and use framework.
The flow table for WIO model shown in Table 14 is separated into two tables, namely the supply table (Table
15) and the use table (Table 16). The supply table shows the production of ordinary products (goods and
services) by ordinary sectors as well as the production of waste management services by waste management
activities. It is very important to carefully define production, especially for the flows involving waste
management services. The 2001 WIO model (Nakamura and Kondo 2002) assumes that generation of wastes
means consumption (use) of waste management service. For recyclables, however, producers of recyclable
materials may be able to sell such materials. In this case the recyclables are in fact by‐products that need to
be registered in the supply table not in the use table.
Table 15: Supply table for WIO model of the U.S.
Intermediate products
Product 1 Product 2 ⋯ Product n
Interm
ediate
sectors
Sector 1
Sector 2
⋮
Sector n
n n matrix of intermediate
product produced by
intermediate sectors ($)
* Shaded area contains additional information that is not well represented in an ordinary supply table. The
framework can accommodate any number of final demand sectors and primary factors. Only three final demand
sectors and primary factors are shown here for the sake of simplicity.
The intermediate and waste management portion of the supply and use tables forms V and U matrices,
respectively, which can be subsequently manipulated to produce product‐by‐product or industry‐by‐industry
(or activity‐by‐activity) analytical tables following a standard supply and use framework.
Waste management services
Service 1 Service 2 ⋯ Service q
n q matrix of waste
management services
produced by intermediate
sectors (ton) (≈0)
Waste
managem
ent
activities
Activity 1
Activity 2
⋮
Activity p
p n matrix of intermediate
products produced by
waste management
activities ($) (≈0)
p q matrix of waste
management services
produced by waste
management activities (ton)

REI Study Report 73
Table 16: Use table for WIO model of the U.S.
Intermediate sectors
Sector 1 Sector 2 ⋯ Sector n
Interm
ediate
ts
produc
Product 1
Product 2
⋮
Product n
n n matrix of intermediate
inputs to intermediate sectors
($)
n 3 matrix of final
consumption of
intermediate products
($)
Primary
factors
Wage
Tax
Profit
3 n matrix of primary factor
inputs by intermediate
sectors ($)
* Shaded area contains additional information that is not well represented in an ordinary use table. The framework can accommodate any number of final
demand sectors and primary factors. Only three final demand sectors and primary factors are shown here for the sake of simplicity.
Waste management ac tivities
Activity 1 Activity 2 ⋯ Activity p
Final demand
Household Governmen Export
t
n p matrix of intermediate
inputs to waste management
activities ($)
Waste
managem
ent
services
Service 1
Service 2
⋮
Service q
q n matrix of waste
management services
purchased by intermediate
sectors (ton)
q p matrix of waste
management services
purchased by waste
management activities (ton)
q 3 matrix of waste
management services
purchased by final
consumers (ton)
3 p matrix of primary factor
inputs to waste management
activities ($)
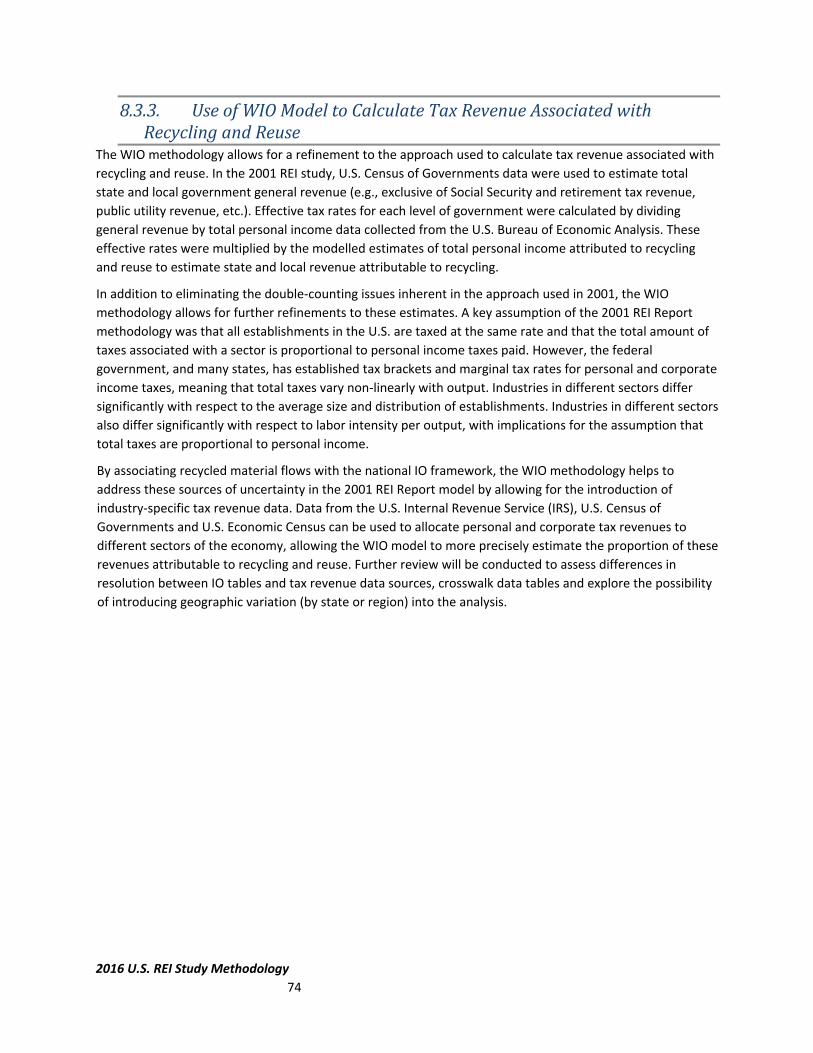
2016 U.S. REI Study Methodology
74
8.3.3. UseofWIOModeltoCalculateTaxRevenueAssociatedwithRecyclingandReuse
The WIO methodology allows for a refinement to the approach used to calculate tax revenue associated with
recycling and reuse. In the 2001 REI study, U.S. Census of Governments data were used to estimate total
state and local government general revenue (e.g., exclusive of Social Security and retirement tax revenue,
public utility revenue, etc.). Effective tax rates for each level of government were calculated by dividing
general revenue by total personal income data collected from the U.S. Bureau of Economic Analysis. These
effective rates were multiplied by the modelled estimates of total personal income attributed to recycling
and reuse to estimate state and local revenue attributable to recycling.
In addition to eliminating the double‐counting issues inherent in the approach used in 2001, the WIO
methodology allows for further refinements to these estimates. A key assumption of the 2001 REI Report
methodology was that all establishments in the U.S. are taxed at the same rate and that the total amount of
taxes associated with a sector is proportional to personal income taxes paid. However, the federal
government, and many states, has established tax brackets and marginal tax rates for personal and corporate
income taxes, meaning that total taxes vary non‐linearly with output. Industries in different sectors differ
significantly with respect to the average size and distribution of establishments. Industries in different sectors
also differ significantly with respect to labor intensity per output, with implications for the assumption that
total taxes are proportional to personal income.
By associating recycled material flows with the national IO framework, the WIO methodology helps to
address these sources of uncertainty in the 2001 REI Report model by allowing for the introduction of
industry‐specific tax revenue data. Data from the U.S. Internal Revenue Service (IRS), U.S. Census of
Governments and U.S. Economic Census can be used to allocate personal and corporate tax revenues to
different sectors of the economy, allowing the WIO model to more precisely estimate the proportion of these
revenues attributable to recycling and reuse. Further review will be conducted to assess differences in
resolution between IO tables and tax revenue data sources, crosswalk data tables and explore the possibility
of introducing geographic variation (by state or region) into the analysis.

2016 U.S. REI Study Methodology
75
9. AppendixC–ResultsforAlternateWIOApproachesThe results of the three alternate approaches, other than the intermediate production approach are
summarized below.
9.1. DirectProductionofRecyclingApproachThe results of the direct production of recycling approach is summarized in this section. Construction and
demolition (C&D) contributed most significantly to job creation and wages, followed by ferrous metals.
Ferrous metals were the most significant source of tax revenue among the eight materials studied, followed
closely by C&D. Figure 15, Figure 16 and Figure 17 present the employment, wage and tax revenue results for
this approach. Figure 18 shows the relative contribution by the nine materials to job creation, wage and tax
revenue under this approach.
Figure 15: Employment results for the direct production of recycling approach
‐
50,000
100,000
150,000
200,000
250,000
300,000
350,000
400,000
Number of Jobs

2016 U.S. REI Study Methodology
76
Figure 16: Wage results for the direct production of recycling approach
‐
2,000,000
4,000,000
6,000,000
8,000,000
10,000,000
12,000,000
14,000,000
16,000,000
18,000,000
20,000,000Wages ($1000)
Figure 17: Tax revenue results for the direct production of recycling approach
‐
500,000
1,000,000
1,500,000
2,000,000
2,500,000
3,000,000
3,500,000
4,000,000
Tax Revenue ($1000)

2016 U.S. REI Study Methodology
77
Figure 18: Share of recycling’s job creation, wage and tax revenue by material (direct production of recycling approach)
A breakdown of direct and indirect employment numbers, wages and taxes associated with the seven
different sub‐material types is shown in Figure 19 below. The total direct employment (# of jobs) by the
organics category is around 36,118, associated wages are about $1.04 billion and associated taxes are about
$135 million.
Figure 19: Share of direct employment numbers (# of jobs), wages ($) and taxes ($) by organics recycling
9.2. RecycledContentinDirectHouseholdDemandonRecyclingApproachUnlike the direct production of recycling and the direct and indirect production of recycling approaches, the
results of the analysis under the recycled content in final demand approach do not fall only under the nine
material categories. Therefore the results from the analysis under the recycled content in final demand
approach are organized according to the final demand categories in a decreasing order of contribution per
each measure (Figure 20, Figure 21Figure 22). The results show that consumption of various recyled material‐
enabled products contributes significantly to job creation, wage payment and tax revenue generation. Motor
vehicles, and machinery and equipment cateories are ranked high in these tables due to their uses of various
recycled materials such as ferrous metals, non‐ferrous metals, plastics and rubber.

2016 U.S. REI Study Methodology
78
Figure 20: Contribution of recycled material‐enabled final demand to job creation (Top 10)

2016 U.S. REI Study Methodology
79
Figure 21: Contribution of recycled material‐enabled final demand to wage payment (Top 10)

2016 U.S. REI Study Methodology
80
Figure 22: Contribution of recycled material‐enabled final demand to tax revenue (Top 10)
‐
2,000,000
4,000,000
6,000,000
8,000,000
10,000,000
12,000,000
14,000,000
16,000,000
18,000,000Tax Reveue ($1000)
It is notable that the contributions from motor vehicles, machinery manufacturing and electronic and
electrical equipment stand out under the recycled content approach because of the combination of (1) the
significant share of recycled ferrous and nonferrous metals and recycled plastics by weight, and (2) the
significant consumption quantity of these products.
9.3. DirectHouseholdDemandonRecyclingApproachThe results from the analysis under the direct household demand on recycling approach is summarized in
Figure 23, Figure 24 Figure 25. Recycling of paper provides the largest contribution to all three categories
considered (job, wage and tax revenue).

2016 U.S. REI Study Methodology
81
Figure 23: Employment results for recycling as direct household demand on recycling approach
Figure 24: Wage results for recycling as direct household demand on recycling approach
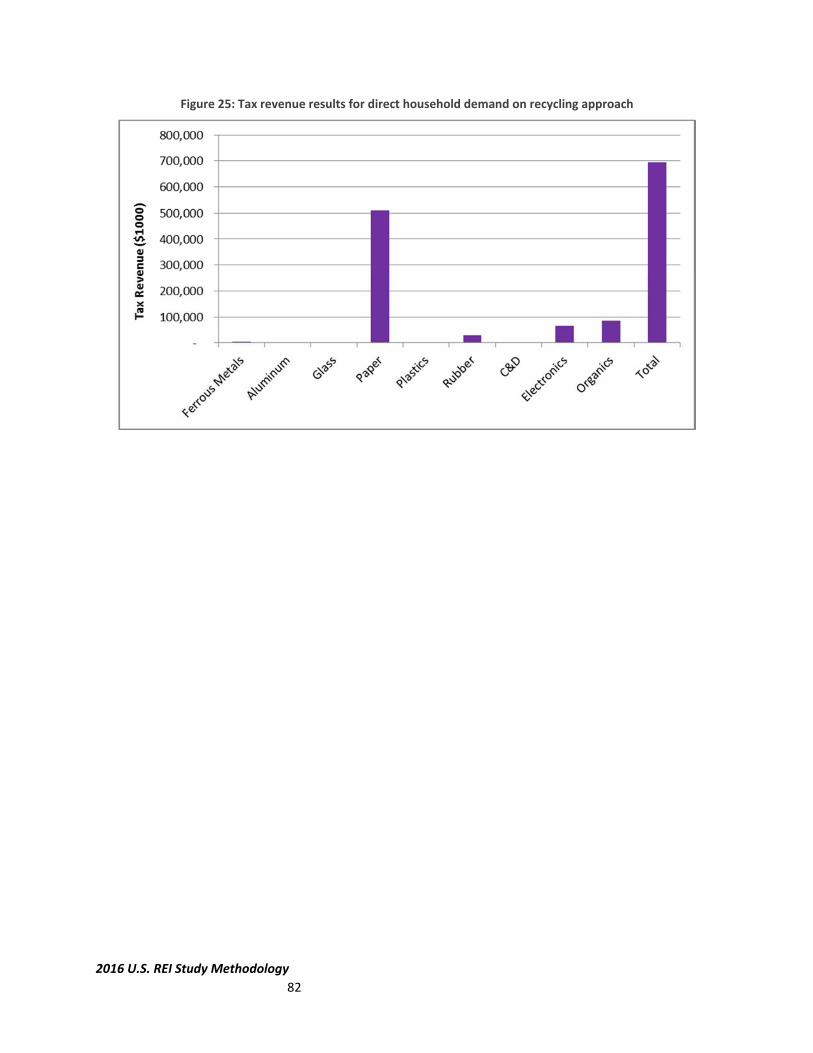
Figure 25: Tax revenue results for direct household demand on recycling approach
2016 U.S. REI Study Methodology
82

2016 U.S. REI Study Methodology 83
10. AppendixD–RecyclingProcessAllocationAssumptions
10.1. OverviewThe following tables summarize assumptions used to define recycling processes within the larger I‐O framework. The tables identify assumptions and
data sources for the following:
Recycled material quantity and price—used to express recyclable and recycling material flows in monetary units to allow integration with
official I‐O statistical tables.
Major consumers of and processes consuming recyclable material—identifies economic sectors where recycling activities occur or processes
where recyclable materials are consumed, by material, where a recycling activity is defined as the transformation of scrap or recovered
materials and products into a useful intermediate or final product.
Recyclable material proportion—ratio of scrap/recovered material/products to the sum of the scrap/recovered material/products and the
virgin material/new products for which the scrap/recovered material/products is used as a substitute.
These three bullets correspond to the three heading in each section below. The rationale for the approach is that it provides a means of defining
recyclable material flows. This accomplishes two things: 1) it lays the foundation for a data‐based approach for identify sectors where recycling occurs
(versus identifying them a priori like in the previous REI studies); and 2) sets up a proportional flow approach for allocating economic factors across
manufacturing and recycling processes. If instead of a proportional flow approach, we try to define specific recycling activities, this would suggest a
hybrid LCA approach, which would require significantly more effort to create and maintain. Ferrous Metals
Recycled Material Quantities and Price
Material Description Assumptions (2007 Basis) Data Sources
Iron and Steel Ferrous metals recovered from appliances (such as Material amounts recovered and 33,287,587 mt USGS (2014)
washing machines, water heaters, refrigerators, etc.), recycled
automobiles, steel containers, construction material and
other sources Unit price of recycled material16 $795.65 /mt USGS
72
(2013), p.
16 Based on average annual unit price for hot rolled steel bar

2016 U.S. REI Study Methodology 84
mt = metric ton
Major Consumers of Recyclable Material
Manufacturers of pig iron and raw steel and castings (NAICS 331111)
Manufacturers of steel castings (NAICS 331512, 331513)
Iron foundries and miscellaneous users (NAICS 331511)
Data source: USGS (2010), Table 1
Recyclable Material Proportion
Consuming Process Process Description Recyclable Material
Proportion Basis for Proportion Data Source
Manufacturers of
and raw steel and
pig iron
castings
Ferrous scrap used as feedstock
to manufacturing process
40.1% World industry‐wide average share of total
crude steel production from scrap, 2007
BIR (2012),
p. 9
Manufacturers
castings
of steel Ferrous scrap used as feedstock
to manufacturing process
40.1% World industry‐wide average share of total
crude steel production from scrap, 2007
BIR (2012),
p. 9
Iron foundries
miscellaneous
and
users
Ferrous scrap used as feedstock
to manufacturing process
40.1% World industry‐wide average share of total
crude steel production from scrap, 2007
BIR (2012),
p. 9
Sources Cited
BIR (2012). World Steel Recycling in Figures 2007‐2011. Brussels, Belgium: Bureau of International Recycling, Ferrous Division. Retrieved May 21, 2015, from
http://www.bdsv.org/downloads/bir_fr.pdf
USGS (2010). 2007 Mineral Yearbook: Iron and Steel, Scrap. Reston, Virginia: U.S. Geological Survey. Retrieved May 21, 2015, from
http://minerals.usgs.gov/minerals/pubs/commodity/iron_&_steel_scrap/myb1‐2008‐fescr.pdf
USGS (2013). Metal Prices in the United States Through 2010. Reston, Virginia: U.S. Geological Survey. Retrieved May 21, 2015, from
http://pubs.usgs.gov/sir/2012/5188/sir2012‐5188.pdf
USGS (2014). 2012 Minerals Yearbook: Iron and Steel Scrap (Advance Release). Reston, Virginia: U.S. Geological Survey. Retrieved May 21, 2015, from
http://minerals.usgs.gov/minerals/pubs/commodity/iron_&_steel_scrap/myb1‐2012‐fescr.pdf
10.2. NonferrousMetals(Aluminum)Recycled Material Quantities and Price

2016 U.S. REI Study Methodology 85
Material Description Assumptions (2007 Basis) Data Sources
Aluminum Aluminum scrap from used
containers, transportation,
sources
beverage cans, other
construction and other
Material
recycled
amounts recovered and 1,524,071 mt USGS (2010)
Unit price of recycled material17 $2,640 /mt Index Mundi
(2015)
mt = metric ton
Major Consumers of Recyclable Material
Secondary aluminum smelters (NAICS 331314)
Independent mill fabricators and other (NAICS 331315, 331316, 331319)
Aluminum foundries (NAICS 331521, 331524)
Data sources: USGS (2010), Table 3; USGS (2006), Figure 1
Recyclable Material Proportion
Consuming Process Process Description Recyclable Material
Proportion Basis for Proportion Data Source
Secondary aluminum
smelters
Aluminum scrap used as
feedstock to manufacturing
process
40% Percentage of total U.S. aluminum supply
recovered from scrap
USGS (2010)
Independent mill
fabricators and other
Aluminum scrap used as
feedstock to manufacturing
process
40% Percentage of total U.S. aluminum supply
recovered from scrap
USGS (2010)
17 Based on LME spot price for aluminum, 99.5% purity; comparable to unit price from USGS (2013), p. 5

2016 U.S. REI Study Methodology 86
Consuming Process Process Description Recyclable Material
Proportion Basis for Proportion Data Source
Aluminum foundries Aluminum scrap used as
feedstock to manufacturing
process
40% Percentage of total U.S. aluminum supply
recovered from scrap
USGS (2010)
Sources Cited
Index Mundi (2015). Aluminum Monthly Price – U.S. Dollars per Metric Ton. Commodity Prices, Aluminum. Retrieved May 21, 2015, from
http://www.indexmundi.com/commodities/?commodity=aluminum&months=300
USGS (2006). Aluminum Recycling in the United States in 2000. Reston, VA: U.S. Geological Survey. Retrieved May 21, 2015, from
http://pubs.usgs.gov/circ/c1196w/c1196w.pdf
USGS (2010). 2008 Minerals Yearbook: Aluminum. Reston, VA: U.S. Geological Survey. Retrieved May 21, 2015, from
http://minerals.usgs.gov/minerals/pubs/commodity/aluminum/myb1‐2008‐alumi.pdf
USGS (2013). Metal Prices in the United States Through 2010. Reston, Virginia: U.S. Geological Survey. Retrieved May 21, 2015, from
http://pubs.usgs.gov/sir/2012/5188/sir2012‐5188.pdf
10.3. PlasticsRecycled Material Quantities and Price
Material Description Assumptions (2007 Basis) Data Sources
Plastic Recycled plastics Material amounts recovered and recycled 2,413,112 mt EPA (2014)
Unit price of recycled material $1,208.68
/mt
Block (2012)
mt = metric ton
Major Consumers of Recyclable Material
PET

2016 U.S. REI Study Methodology 87
o Non‐cellulosic fibers (NAICS 325222)
o Sheet, film and strapping (NAICS 326112, 326113)
o Food and non‐food bottles (NAICS 326160)
HDPE
o Non‐food bottles (NAICS 326160)
o Pipe (NAICS 326122)
o Automotive products (NAICS 326199)
o Lawn and garden products (NAICS 326220)
o Sheet and film (NAICS 326112, 326113)
o Composite lumber (NAICS 326199)
o Pallets, crates and buckets (NAICS 326199)
LDPE
o Composite lumber (NAICS 326199)
Data sources: ACC (2009), ACC (2014a), ACC (2015a), ACC (2015a), NAPCOR (2014)
Recyclable Material Proportion
Consuming Process Process Description
PET
Non‐cellulosic fibers
Recovered PET used as substitute for
virgin PET during non‐cellulosic fiber
manufacturing
24.6% National “recycling rate” (ratio of
plastic recycled to total resin sales) for
PET
ACC (2009)
PET
Sheet, film and strapping
Recovered PET used as substitute for
virgin PET during PET sheet, film and
strapping manufacturing
24.6% National “recycling rate” (ratio of
plastic recycled to total resin sales) for
PET
ACC (2009)
PET
Food and non‐food bottles
Recovered PET used as substitute for
virgin PET during food and non‐food
bottle manufacturing
24.6% National “recycling rate” (ratio of
plastic recycled to total resin sales) for
PET
ACC (2009)
HDPE
Non‐food bottles
Recovered HDPE used as substitute for
virgin HDPE during non‐food bottle
manufacturing
26.0% National “recycling rate” (ratio of
plastic recycled to total resin sales) for
HDPE
ACC (2009)
Recyclable Material
Proportion Basis for Proportion Data Source

2016 U.S. REI Study Methodology 88
Consuming Process Process Description Basis for Proportion Data Source
HDPE
Pipe
Recovered HDPE used as substitute for
virgin HDPE during HDPE pipe
manufacturing
26.0% National “recycling rate” (ratio of
plastic recycled to total resin sales) for
HDPE
ACC (2009)
HDPE
Automotive products
Recovered HDPE used as substitute for
virgin HDPE during automotive plastic
parts manufacturing
26.0% National “recycling rate” (ratio of
plastic recycled to total resin sales) for
HDPE
ACC (2009)
HDPE
Lawn and garden products
Recovered HDPE used as substitute for
virgin HDPE during lawn and garden
products manufacturing
26.0% National “recycling rate” (ratio of
plastic recycled to total resin sales) for
HDPE
ACC (2009)
HDPE
Sheet and film
Recovered HDPE used as substitute for
virgin HDPE during HDPE sheet and film
manufacturing
26.0% National “recycling rate” (ratio of
plastic recycled to total resin sales) for
HDPE
ACC (2009)
HDPE
Composite lumber
Recovered HDPE used as substitute for
virgin HDPE during composite lumber
manufacturing
26.0% National “recycling rate” (ratio of
plastic recycled to total resin sales) for
HDPE
ACC (2009)
HDPE
Pallets, crates and buckets
Recovered HDPE used as substitute for
virgin HDPE during durable plastic
products manufacturing
26.0% National “recycling rate” (ratio of
plastic recycled to total resin sales) for
HDPE
ACC (2009)
LDPE Composite lumber Recovered LDPE used as substitute for
virgin LDPE during composite lumber
manufacturing
25% Assumption based on LDPE:HDPE share
(and other materials) and relatively
high average recycled content
Sources Cited
ACC (2009). 2007 United States National Post‐Consumer Plastics Bottle Recycling Report. Washington, DC: American Chemistry Council. Retrieved May 22,
2015, from http://plastics.americanchemistry.com/Education‐Resources/Publications/2007‐National‐Postconsumer‐Bottle‐Recycling‐Report.pdf
ACC (2014). 2013 United States National Post‐Consumer Plastics Bottle Recycling Report. Washington, DC: American Chemistry Council. Retrieved May 22,
2015, from http://plastics.americanchemistry.com/Education‐Resources/Publications/2013‐National‐Post‐Consumer‐Plastics‐Bottle‐Recycling‐Report.pdf
Recyclable Material
Proportion

2016 U.S. REI Study Methodology 89
ACC (2015a). 2013 National Post‐Consumer Non‐Bottle Rigid Plastic Recycling Report. Washington, DC: American Chemistry Council. Retrieved May 22, 2015,
from http://plastics.americanchemistry.com/Education‐Resources/Publications/2013‐National‐Report‐on‐Post‐Consumer‐Non‐Bottle‐Rigid‐Plastic‐
Recycling.pdf
ACC (2015b). 2013 National Post‐Consumer Plastic Bag & Film Recycling Report. Washington, DC: American Chemistry Council. Retrieved May 22, 2015, from
http://plastics.americanchemistry.com/Education‐Resources/Publications/2013‐National‐Postconsumer‐Plastic‐Bag‐Film‐Recycling‐Report.pdf
Block, D.G. (2012). Recycled Resin Prices: Recycled Plastics Prices Unstable In First Half of 2012. Plastics Technology. Retrieved May 22, 2015, from
http://www.ptonline.com/articles/recycled‐plastics‐prices‐unstable‐in‐first‐half‐of‐2012
EPA (2014). Municipal Solid Waste Generation, Recycling, and Disposal in the United States: Tables and Figures for 2012. Office of Solid Waste and Emergency
Response. Washington, DC: U.S. Environmental Protection Agency. Retrieved May 22, 2015, from
http://www.epa.gov/solidwaste/nonhaz/municipal/pubs/2012_msw_dat_tbls.pdf
NAPCOR (2014). Postconsumer PET Container Recycling Activity in 2013. Florence, Kentucky: National Association for PET Container Resources. Retrieved May
22, 2015, from http://www.napcor.com/pdf/NAPCOR_2013RateReport‐FINAL.pdf
10.4. RubberRecycled Material Quantities and Price
Material Description Assumptions (2007 Basis) Data Sources
Rubber crumb Ground rubber produced from scrap tires Material amounts recovered and recycled 1,100,016
mt
RMA (2014)
Unit price of recycled material $374.79 /mt ProfitableRecycling (2015)
Other recycled
rubber
Other rubber recovered from scrap tires
used in civil engineering, reclamation and
agricultural applications.
Material amounts recovered and recycled 971,218 mt RMA (2014)
Unit price of recycled material $385.81 /mt ProfitableRecycling (2015)
mt = metric ton
Major Consumers of Recyclable Material
Molded/extruded rubber products (NAICS 326291)
Athletic field construction (NAICS 237990)

2016 U.S. REI Study Methodology 90
Artificial turf installation (NAICS 238990)
Playground construction (NAICS 237990)
Tire manufacturing (NAICS 326211)
Tire retreading (NAICS 326212)
Rubber hoses and belting (NAICS 326220)
Rubber‐modified asphalt (NAICS 324121)
Road subgrade (NAICS 237310)
Light rail construction (NAICS 237990)
Septic drain fields and construction fill (NAICS 238910)
Data sources: RMA (2009)
Recyclable Material Proportion
Consuming Process Process Description Recyclable Material
Proportion Basis for Proportion Data Source
Molded/extruded rubber
products
Ground rubber substituted for virgin
rubber in molded rubber products (e.g.,
carpet underlay, dock bumpers, etc.)
30% Assumption based on general literature
review and heterogeneity of products
RW (2012)
Athletic field construction Direct application of crumb rubber as
substitute for other material on
field/track surface
<1% Assumption based on general literature
review
Artificial turf installation Direct application of crumb rubber as
substitute for other material as cushion
layer beneath artificial turf
80% Assumption based on general literature
review
MadeHow
(2015)
Playground construction Direct application of crumb rubber as
substitute for other material for
playground surfacing
20%
Assumption based on general literature
review
Tire manufacturing Ground rubber substituted for virgin
rubber in tire manufacturing
5% Recycled content achieved based on
performance/technical limitations
TiE50 (2015)

2016 U.S. REI Study Methodology 91
Recyclable Material
Proportion Consuming Process Process Description Basis for Proportion Data Source
Tire retreading Ground rubber substituted for virgin
rubber in new tread; does not include
retreadable casings
5% Recycled content achieved based on
performance/technical limitations
TiE50 (2015)
Rubber hoses and belting Ground rubber substituted for virgin
rubber in hose/belt manufacturing
30% Assumption based on general literature
review
Rubber‐modified asphalt Crumb rubber substituted for other
material during asphalt manufacturing
<1% Assumption based on characterization
of minimal use/market demand
RMA (2009), p.
11
Road subgrade Direct application of crumb rubber as
substitute for other material in road
subgrade
<1% Assumption based on general literature
review and amounts of non‐rubber
material used in this application
Light rail construction Direct application of crumb rubber as
substitute for other material to create
vibration dampening layer for light rail
<1% Assumption based on general literature
review and amounts of non‐rubber
material used in this application
Septic drain fields and
construction fill
Direct application of crumb rubber as
substitute for other material in septic
drain fields and construction fill
<1% Assumption based on general literature
review and amounts of non‐rubber
material used in this application
Sources Cited
MadeHow (2015). How Products Are Made: Artificial Turf. MadeHow.com. Retrieved May 22, 2015, from http://www.madehow.com/Volume‐7/Artificial‐
Turf.html
ProfitableRecycling (2015). Scrap Tire Recycling. ProfitableRecycling.com. Retrieved May 22, 2015, from http://www.profitablerecycling.com/tirerecycling.htm
RMA (2009). Scrap Tire Markets in the United States. Washington, DC: Rubber Manufacturers Association. Retrieved May 22, 2015, from
http://www.rma.org/download/scrap‐tires/market‐reports/US_STMarkets2007.pdf
RMA (2014). 2013 U.S. Scrap Tire Management Summary. Washington, DC: Rubber Manufacturers Association. Retrieved May 22, 2015, from
http://www.rma.org/download/scrap‐tires/market‐reports/US_STMarket2013.pdf
RW (2012). Market Focus: Rubber consumption to approach 31 mmt in 2015. Rubber World Magazine. Retrieved May 22, 2015, from
http://d27vj430nutdmd.cloudfront.net/9911/113868/2cd86525977761e2e04a03f833fc5a363e639080.pdf

2016 U.S. REI Study Methodology 92
TiE50 (2015). 2014 TiE50 Company Profile: Tyromer Inc. TiE50 Awards Program. Retrieved May 22, 2015, from
http://www.tie50.net/CompanyProfile/TiE50CompanyProfile_2014.asp?VwID=JNPOPRN0
Other General Literature
CalRecycle (2014). Matrix: Overview of Recycled Content Levels and Product Availability. Sustainable (Green) Building. Retrieved May 22, 2015, from
http://www.calrecycle.ca.gov/greenbuilding/materials/matrix.htm
10.5. GlassRecycled Material Quantities and Price
Material
Glass Material amounts recovered and
recycled
2,053,020
mt
Unit price of recycled material $32.50 /mt Popular
Mechanics (2008)
mt = metric ton
Major Consumers of Recyclable Material
Glass container manufacturing (NAICS 327213)
Fiberglass manufacturing (NAICS 327993)
Data sources: GPI (2015); Waste360 (2015)
Recyclable Material Proportion
Assumptions (2007 Basis)Description
Glass cullet recovered from glass bottles and jars
Data Sources
GPI (2014)

2016 U.S. REI Study Methodology 93
Consuming Process Process Description Recyclable Material
Basis for Proportion Proportion
Data Source
Glass container
manufacturing
Glass cullet used as feedstock
during container manufacturing
process
23% Mix of production from virgin and recycled
inputs for glass manufacturing, 2015
EPA (2015),
Exhibit 9
Fiberglass manufacturing Fiberglass manufacturing 30% Average recycled content of fiberglass TNet (2015)
Sources Cited
EPA (2015). Documentation for Greenhouse Gas Emission and Energy Factors Used in the Waste Reduction Model (WARM), Glass. Washington, DC: U.S.
Environmental Protection Agency. Retrieved May 21, 2015, from http://epa.gov/epawaste/conserve/tools/warm/pdfs/Glass.pdf
GPI (2014). Achieving 50% Recycled Content for Glass Containers: Efforts, Challenges and Opportunities Ahead for the North American Glass Container Industry.
Arlington, Virginia: Glass Packaging Institute. Retrieved May 21, 2015, from
http://www.gpi.org/sites/default/files/GPI%20Recycled%20Content%20Report%2C%20September%202014.pdf
GPI (2015). Glass Facts. Recycling. Arlington, Virginia: Glass Packaging Institute. Retrieved May 21, 2015, from http://www.gpi.org/recycling/glass‐recycling‐
facts
TNet (2015). Metal Building: Fiberglass and Mineral Wool Insulation. New York: Thomas Publishing Company. Retrieved May 21, 2015, from
http://www.thomasnet.com/articles/plastics‐rubber/fiberglass‐mineral‐wool‐insulation
Popular Mechanics (2008). Recycling by the Numbers: The Truth About Recycling. Retrieved May 21, 2015, from
http://www.popularmechanics.com/science/environment/a3757/4291576/
Waste360 (2015). Glass Containers. Recycling. Retrieved May 21, 2015, from http://waste360.com/Recycling_And_Processing/waste_glass_containers_4
10.6. PaperRecycled Material Quantities and Price
Material
Paper 30,290,546
mt
AFPA (2014)
Unit price of recycled material $126.77 /mt Popular Mechanics (2008)
mt = metric ton
Data SourcesDescriptio n
Recovered and recycled paper and
paperboard
Assumptions (2007 Basis)
Material amounts recovered and recycled

2016 U.S. REI Study Methodology 94
Major Consumers of Recyclable Material
Paper mills, except newsprint (NAICS 322121)
Newsprint mills (NAICS 322122)
Paperboard mills (NAICS 322130)
Data sources: AFPA (2014)
Recyclable Material Proportion
Consuming Process Process Description Recyclable Material
Proportion Basis for Proportion Data Source
Paper mills, except
newsprint
Paper manufacturing using pulp produced
from recycled paper, either in integrated
pulp‐paper mill or in pulp mill that processes
recycled paper18
4% From WARM model % production from
recycled inputs (ref. products:
magazines/ third class mail, office
paper and textbooks)
EPA (2015)
Newsprint mills Newsprint manufacturing using pulp
produced from recycled newsprint, either in
integrated pulp‐newsprint mill or in pulp mill
that processes recycled newsprint2
23% From WARM model % production from
recycled inputs (ref. product:
newspaper)
EPA (2015)
Paperboard mills Paperboard manufacturing using pulp
produced from recycled paperboard, either in
integrated pulp‐paperboard mill or in pulp
mill that processes recycled paperboard2
35% From WARM model % production from
recycled inputs (ref. product:
corrugated containers)
EPA (2015)
Sources Cited
AFPA (2014). Annual Statistical Summary of Recovered Paper Utilization 2014. Washington, DC: American Forest & Paper Association.
18 This definition of the recycling process assumes that production of pulp from recycled paper materials occurs separately from production of pulp from virgin
material (EPA 2012). Therefore, pulping is defined as a “processing” step that transforms the paper material into a form usable as a substitute for pulp from
virgin materials. Recycling takes place when the pulp from recycled material is used to make paper, newsprint or paperboard.

2016 U.S. REI Study Methodology 95
EPA (2012). Paper Making and Recycling. U.S. Environmental Protection Agency. Retrieved May 22, 2015, from
http://www.epa.gov/osw/conserve/materials/paper/basics/papermaking.htm
EPA (2015). Documentation for Greenhouse Gas Emission and Energy Factors Used in the Waste Reduction Model (WARM), Paper Products. Washington, DC:
U.S. Environmental Protection Agency. Retrieved May 22, 2015, from http://epa.gov/epawaste/conserve/tools/warm/pdfs/Paper_Products.pdf
Popular Mechanics (2008). Recycling by the Numbers: The Truth about Recycling. PopularMechanics.com. Retrieved May 22, 2015, from
http://www.popularmechanics.com/science/environment/a3757/4291576/
10.7. ConstructionandDemolition(C&D)MaterialRecycled Material Quantities and Price
Material Description Assumptions (2007 Basis) Data Sources
Recycled C&D
Material
Recycled concrete, asphalt, gypsum and
wood recovered from construction and
demolition waste19
Material amounts recovered and
recycled
318,419,727 mt Modeled based on estimates
of C&D generation amounts,
recycling rates, recovery
rates and recycled amounts
for Mixed C&D, bulk
aggregate and Reclaimed
Asphalt Pavement (RAP)
from CDRA whitepaper
(CDRA 2014), NAPA survey
(NAPA 2014) and personal
communication with K.
Janjic. (EPA)
Recycled C&D
Material
Unit price of recycled material $9.50 /mt USGS (2000)
19 C&D metal waste is included in ferrous and nonferrous metals recycling analysis.
Unit price assumpt ions
Recycled concrete

2016 U.S. REI Study Methodology 96
Material Description Assumptions (2007 Basis) Data Sources
Brick (recycled aggregate) Unit price of recycled material $27.78 /mt Kurtz (2015)
Wood (recycled wood chips) Unit price of recycled material $24.80 /mt NETI (2015)
Asphalt (recycled asphalt shingles) Unit price of recycled material $44.09 /mt Crushcrete (2015)
Gypsum (drywall) Unit price of recycled material $15.98 /mt Bauer (2012)
mt = metric ton
Major Consuming Processes/Applications of Recyclable Material
C&D concrete
o Aggregate for road base (NAICS 212319)
o Aggregate for ready mix concrete (NAICS 212319)
o Construction fill (NAICS 238910)
o Other construction applications (e.g., soil stabilization, pipe bedding and landscaping) (NAICS 238910)
Data Sources: CDRA (2015b); USGS (2010), p. 71.3
C&D asphalt pavement
o Aggregate for asphalt pavement (NAICS 237310, 324121)
Data Source: NAPA (2014); USGS (2010), p. 71.3
C&D asphalt shingles
o Asphalt pavement (NAICS 324121)
o Asphalt roofing products (NAICS 324122)
Data Source: SRO (2014); ARMA (2015)
C&D gypsum wallboard
o New drywall (NAICS 327420)
o Portland cement (NAICS 327310)
o Soil amendment (NAICS 115112)
o Fertilizer (NAICS 325314)
Data Source: CDRA (2015c); USGS (2010)
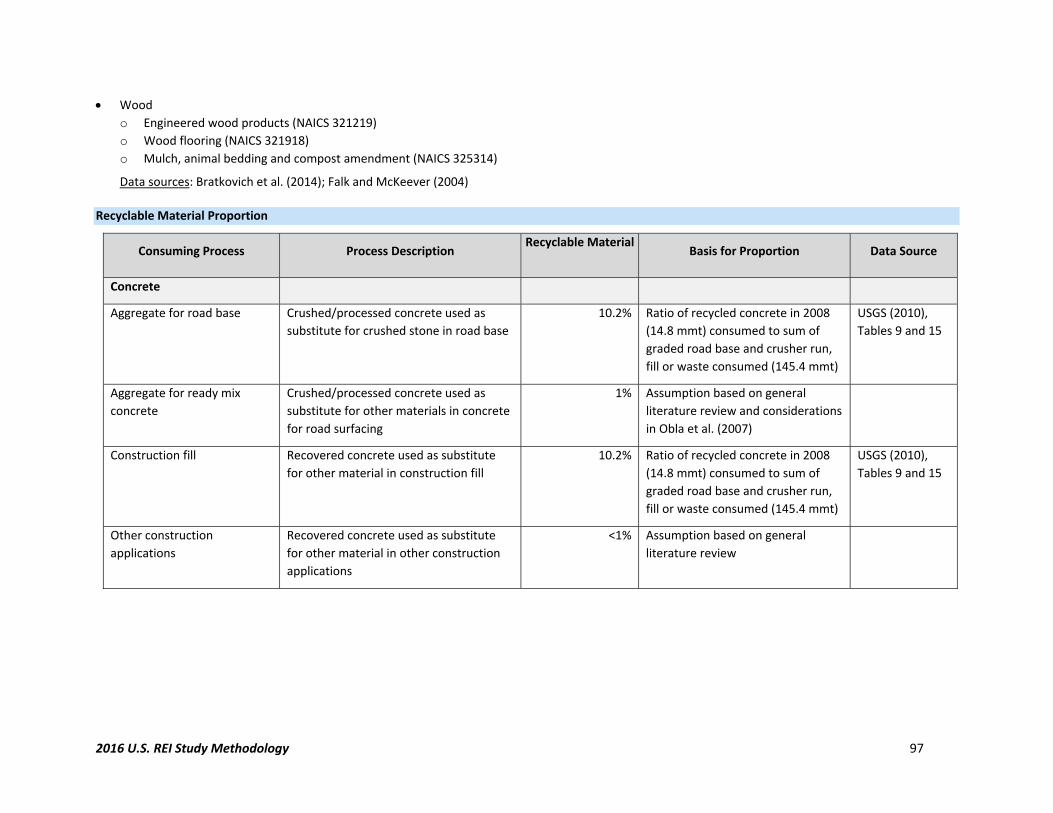
2016 U.S. REI Study Methodology 97
Wood
o Engineered wood products (NAICS 321219)
o Wood flooring (NAICS 321918)
o Mulch, animal bedding and compost amendment (NAICS 325314)
Data sources: Bratkovich et al. (2014); Falk and McKeever (2004)
Recyclable Material Proportion
Consuming Process Process Description Recyclable Material
Proportion Basis for Proportion Data Source
Concrete
Aggregate for road base Crushed/processed concrete used as
substitute for crushed stone in road base
10.2% Ratio of recycled concrete in 2008
(14.8 mmt) consumed to sum of
graded road base and crusher run,
fill or waste consumed (145.4 mmt)
USGS (2010),
Tables 9 and 15
Aggregate for ready mix
concrete
Crushed/processed concrete used as
substitute for other materials in concrete
for road surfacing
1% Assumption based on general
literature review and considerations
in Obla et al. (2007)
Construction fill Recovered concrete used as substitute
for other material in construction fill
10.2% Ratio of recycled concrete in 2008
(14.8 mmt) consumed to sum of
graded road base and crusher run,
fill or waste consumed (145.4 mmt)
USGS (2010),
Tables 9 and 15
Other construction
applications
Recovered concrete used as substitute
for other material in other construction
applications
<1% Assumption based on general
literature review

2016 U.S. REI Study Methodology 98
Consuming Process Process Description Recyclable Material
Proportion Basis for Proportion Data Source
Asphalt pavement
Asphalt pavement aggregate
(on‐site)
Reclaimed/milled asphalt used as
substitute for new aggregate in on‐site
hot mix asphalt process
16.2% National average all mixes based on
RAP tons used in HMA/WMA, 2009
NAPA (2014),
Table 4, p. 11
Asphalt pavement aggregate
(plant)
Reclaimed/milled asphalt used as
substitute for new aggregate in asphalt
manufacturing plant
16.2% National average all mixes based on
RAP Tons used in HMA/WMA, 2009
NAPA (2014),
Table 4, p. 11
Asphalt shingles
Asphalt pavement additive Reclaimed/crushed asphalt shingles
added as substitute for other material in
asphalt paving manufacturing
1% Assumption based on general
literature review
Asphalt roofing products Reclaimed/crushed asphalt shingles
added as substitute for other material in
asphalt shingle manufacturing
3% Assumption based on general
literature review
Gypsum wallboard
New drywall Gypsum from scrap drywall used as
substitute for virgin gypsum in
manufacturing new drywall
15% Midpoint of typical recycled
amounts of scrap drywall in new
products (10%‐20%)
CDRA (2015a)
Portland cement Gypsum from scrap drywall used as
substitute for other material in
manufacturing of Portland cement
1% Assumption based on general
literature review, including USGS
(2010a), p. 33.2 and EPA (2015)
Soil amendment Reclaimed gypsum from scrap drywall
applied to soil as substitute for other
nutrients or texture amendments
1% Assumption based on general
literature review, including USGS
(2010a), p. 33.2 and EPA (2015)
Fertilizer additive Gypsum from scrap drywall used as
substitute for other nutrient sources in
fertilizer manufacturing
1% Assumption based on general
literature review, including USGS
(2010a), p. 33.2 and EPA (2015)

2016 U.S. REI Study Methodology 99
Consuming Process Process Description Recyclable Material
Proportion Basis for Proportion Data Source
Wood
Engineered wood products Reclaimed C&D wood chipped and used
as substitute for other wood in
engineered wood product manufacturing
1% Assumption based on general
literature review, including
Bratkovich et al. (2014) and Falk and
McKeever (2004)
Wood flooring Reclaimed C&D flooring and lumber
processed and used as substitute for
flooring made from virgin wood
1% Assumption based on general
literature review, including
Bratkovich et al. (2014) and Falk and
McKeever (2004)
Mulch, animal bedding and
compost amendment
Reclaimed C&D wood chipped and used
as substitute for other material in mulch,
animal bedding and compost
manufacturing
1% Assumption based on general
literature review, including
Bratkovich et al. (2014) and Falk and
McKeever (2004)
Sources Cited
ARMA (2015). Asphalt Shingle Recycling FAQs. Retrieved May 24, 2015, from Asphalt Roofing Manufacturers Association:
http://www.asphaltroofing.org/asphalt‐shingle‐recycling‐faqs
Bauer, C. (2012). Gypsum Recycling in PlaNYC 2030: Spaces for Government Intervention. Retrieved May 24, 2015, from Columbia University Academic
Commons: http://hdl.handle.net/10022/AC:P:13287
Bratkovich, S., J. Howe, J. Bowyer, E. Pepke, M. Frank and K. Fernholz (2014). Municipal Solid Waste (MSW) and Construction and Demolition (C&D) Wood
Waste Generation and Recovery in the United States. Minneapolis, MN: Dovetail Partners, Inc. Retrieved May 24, 2015, from
http://www.dovetailinc.org/report_pdfs/2014/dovetailwoodrecovery0914.pdf
CDRA (2014). The Benefits of Construction and Demolition Materials Recycling in the United States. Retrieved September 14, 2015, from Construction &
Demolition Recycling Association: http://www.cdrecycling.org/assets/docs/exec%20summary_cd%20recycling%20impact%20white%20paper.pdf
CDRA (2015a). Drywall Recycling Market: Manufacture of New Drywall. Retrieved May 24, 2015, from Construction & Demolition Recycling Association:
http://www.cdrecycling.org/new‐drywall
CDRA (2015b). Markets for Recycled Concrete Aggregate. Retrieved May 24, 2015, from Construction & Demolition Recycling Association:
http://www.cdrecycling.org/end‐markets

2016 U.S. REI Study Methodology 100
CDRA (2015c). Markets for Recycling Gypsum Drywall. Retrieved May 24, 2015, from Construction & Demolition Recycling Association:
http://www.cdrecycling.org/markets
Crushcrete (2015). Recycled Asphalt Shingles (RAS) as a Valuable Commodity. Retrieved May 24, 2015, from Crushcrete Inc.:
http://www.crushcrete.com/ras.html
EPA (2015). Documentation for Greenhouse Gas Emission and Energy Factors Used in the Waste Reduction Model (WARM), Wallboard. Washington, DC: U.S.
Environmental Protection Agency. Retrieved May 24, 2015, from http://epa.gov/epawaste/conserve/tools/warm/pdfs/Drywall.pdf
Faulk, R. and D. McKeever (2004). Recovering Wood for Reuse and Recycling, A United States Perspective. European COST E31 Conference: Management of
Recovered Wood Recycling Bioenergy and other Options: proceedings, 22‐24 April 2004, Thessaloniki. Thessaloniki: University Studio Press. Retrieved May
24, 2015, from http://www.fpl.fs.fed.us/documnts/pdf2004/fpl_2004_falk001.pdf
Kurtz (2015). #304 Recycled Aggregate. Retrieved May 24, 2015, from Kurtz Bros., Inc.: http://www.kurtz‐bros.com/landscape‐supplies/recycled‐
aggregate/304‐recycled‐aggregate/
NAPA (2014). Annual Asphalt Pavement Industry Survey on Recycled Materials and Warm‐Mix Asphalt Usage: 2009‐2013. Lantham, Maryland: National Asphalt
Pavement Association. Retrieved May 24, 2015, from http://www.asphaltpavement.org/PDFs/IS138/IS138‐2013_RAP‐RAS‐WMA_Survey_Final.pdf
NETI (2015). Wood Chips. Retrieved May 24, 2015, from NE Timberland Investments, LLC: http://www.netimberland.com/woodchips.html
Obla, K., H. Kim and C. Lobo (2007). Crushed Returned Concrete as Aggregates for New Concrete. Silver Spring, Maryland: National Ready Mixed Concrete
Association. Retrieved May 24, 2015, from http://www.rmc‐foundation.org/images/CCA%20Study%20Final%20Report%209‐07.pdf
SRO (2015). Markets for Recycling Asphalt Shingles. Retrieved May 24, 2015, from Shingle Recycling.org: http://www.shinglerecycling.org/content/markets‐
recycling‐asphalt‐shingles
USGS (2000). Recycled Aggregates—Profitable Resource Conservation. Reston, Virginia: U.S. Geological Survey. Retrieved May 24, 2015, from
http://pubs.usgs.gov/fs/fs‐0181‐99/fs‐0181‐99so.pdf
USGS (2010). 2008 Minerals Yearbook: Gypsum. Reston, Virginia: U.S. Geological Survey. Retrieved May 24, 2015, from
http://minerals.usgs.gov/minerals/pubs/commodity/gypsum/myb1‐2008‐gypsu.pdf
USGS (2010). 2008 Minerals Yearbook: Stone, Crushed. Reston, Virginia: U.S. Geological Survey. Retrieved May 24, 2015, from
http://minerals.usgs.gov/minerals/pubs/commodity/stone_crushed/myb1‐2008‐stonc.pdf
10.8. ElectronicsRecycled Material Quantities and Price

2016 U.S. REI Study Methodology 101
Recycled
Electronics
Recycled computers, computer displays,
printers, fax machines, keyboards,
televisions and mobile devices
Material amounts
recovered and recycled
388,404 mt EPA (2011)
Unit price assumptions
Recycled
Electronics
Recycled UEP ‐ Computers and computer
peripheral devices
Unit price (weight basis) $702.25 /mt ITC (2013), Table 3.2
Recycled UEP ‐ Monitors Unit price (weight basis) $798.93 /mt ITC (2013), Table 3.2
Recycled UEP ‐ Hard Copy Devices Unit price (weight basis) $116.87 /mt On‐line marketplace prices20
Recycled UEP ‐ Keyboards & Mice Unit price (weight basis) $44.24 /mt On‐line marketplace prices1
Recycled UEP – Televisions Unit price (weight basis) $73.99 /mt ITC (2013), Table 3.2
Recycled UEP ‐ Mobile Devices Unit price (weight basis) $2,741.39 /mt ITC (2013), Table 3.2
mt = metric ton
Major Consuming Processes/Applications of Recyclable Material
Computer refurbishers, remanufacturers, resellers (NAICS 334111)
Computer monitor refurbishers, remanufacturers, resellers (NAICS 334119)
Printer, scanner and multi‐function device refurbishers, remanufacturers and resellers (NAICS 334119)
Fax machine refurbishers, remanufacturers and resellers (NAICS 334210)
Digital copier refurbishers, remanufacturers and resellers (NAICS 333315)
Keyboard and mouse refurbishers, remanufacturers and resellers (NAICS 334119)
Television refurbishers, remanufacturers and resellers (NAICS 334310)
Mobile device refurbishers, remanufacturers and resellers (NAICS 334220)
20 Calculated based on average price of top 10 "new & popular" on Amazon.com
Material Description Assumptions (2007 Basis) Data Sources

2016 U.S. REI Study Methodology 102
Data sources: IDC (2011); EPA (2011)

2016 U.S. REI Study Methodology 103
Recyclable Material Proportion
Computers Used computers refurbished, remanufactured
and resold as substitute for new computers
9.1% Ratio of weight of recycled
devices sold to all devices sold
EPA (2011), Tables 1,
2 and 11; IDC (2011)
Computer displays Used computer displays refurbished,
remanufactured and resold as substitute for
new computer displays
9.2% Ratio of weight of recycled
devices sold to all devices sold
EPA (2011), Tables 1,
2 and 11; IDC (2011)
Hard copy devices:
printers, scanners,
multi‐function devices
Used hard copy devices refurbished,
remanufactured and resold as substitute for
new hard copy devices
7.7% Ratio of weight of recycled
devices sold to all devices sold
EPA (2011), Tables 1,
2 and 11; IDC (2011)
Hard copy devices: fax
machines
Used hard copy devices refurbished,
remanufactured and resold as substitute for
new hard copy devices
7.7% Ratio of weight of recycled
devices sold to all devices sold
EPA (2011), Tables 1,
2 and 11; IDC (2011)
Hard copy devices:
digital copiers
Used hard copy devices refurbished,
remanufactured and resold as substitute for
new hard copy devices
7.7% Ratio of weight of recycled
devices sold to all devices sold
EPA (2011), Tables 1,
2 and 11; IDC (2011)
Keyboards and mice Used keyboards and mice refurbished,
remanufactured and resold as substitute for
new keyboards and mice
2.5% Ratio of weight of recycled
devices sold to all devices sold
EPA (2011), Tables 1,
2 and 11; IDC (2011)
21 For the purposes of this analysis, electronics recycling includes the recovery, refurbishing/remanufacturing and resale of electronics devices. It does not
include the processing of used electronics into commodity‐grade scrap, such as ferrous metals, nonferrous metals, glass and plastic. To avoid double‐counting,
commodity‐grade scrap is included in estimates of recycling of the respective commodity.
22 The ratio is calculated by multiplying tons of products collected for recycling (EPA 2011, Table 11) by percentage recycled from IDC (2011) (30% for all
products except mobile devices; 42% for mobile devices) and dividing this number by the total weight of comparable products sold, derived by multiplying total
sales from EPA (2011), Table 1, by average device weight from EPA (2011), Table 2, and converting units. E.g., Recyclable Material Proportion for computers
(2007) = (143,000*30%)/ (((34,210,000*22) + (30,020,000*6.4))/2000)=9.1%.
Consuming Process Process Description21 Recyclable Material
Proportion (2007) Basis for Proportion (2007)22 Data Source

2016 U.S. REI Study Methodology 104
Consuming Process Process Description21 Basis for Proportion (2007)22 Data Source
Televisions Used televisions refurbished, remanufactured
and resold as substitute for new televisions
3.9% Ratio of weight of recycled
devices sold to all devices sold
EPA (2011), Tables 1,
2 and 11; IDC (2011)
Mobile devices Used mobile devices refurbished,
remanufactured and resold as substitute for
new mobile devices
3.0% Ratio of weight of recycled
devices sold to all devices sold
EPA (2011), Tables 1,
2 and 11; IDC (2011)
Sources Cited
EPA (2011). Electronics Waste Management in the United States through 2009. Washington, DC: U.S. Environmental Protection Agency. Retrieved May 24,
2015, from http://www.epa.gov/epawaste/conserve/materials/ecycling/docs/fullbaselinereport2011.pdf
IDC (2011). Inside the U.S. Electronics Recycling Industry. Framingham, Massachusetts: International Data Corporation. Retrieved May 24, 2015, from
https://www.isri.org/docs/default‐source/recycling‐analysis‐%28reports‐studies%29/idc‐report‐inside‐the‐us‐electronics‐recycling‐industry‐
final.pdf?sfvrsn=4
ITC (2013). Used Electronic Products: An Examination of U.S. Exports. Washington, CD: United States International Trade Commission. Retrieved May 24, 2015,
from http://www.usitc.gov/publications/332/pub4379.pdf
10.9. FoodandOrganics Donated Food Quantities and Price
Material Description Data Sources
Gleaned
produce
Produce that would not have been harvested by farmers for
commercial sale and was gleaned for donation to community
food programs. Does not include unusable parts of fruits,
vegetables and grains that are unsuitable for human
consumption (see “crop residue”).
Material amounts
recovered and donated
19,654 mt EPA (2009), Exhibit 5
Recyclable Material
Proportion (2007)
Assumptions
(2007 Basis)

2016 U.S. REI Study Methodology 105
Description Assumptions
(2007 Basis) Data Sources Material
Rescued food Food that was prepared by restaurants and institutional food
services that would have been wasted but was diverted and
recovered for use in community food programs.
Material amounts
recovered and donated
17,378 mt EPA (2009), Exhibit 5
Salvaged food Food, including manufactured food products nearing
expiration and fresh produce nearing spoilage, that would
have been wasted but was diverted and recovered for use in
community food programs. Does not include food that would
not have been wasted if it was not donated (e.g., canned
goods collected as part of a food drive).
Material amounts
recovered and donated
265,268 mt EPA (2009), Exhibit 5
Recyclable Organic Material Quantities and Price
Animal by‐
products
By‐products of livestock slaughtering operations and fish
and other seafood processing operations and processing
scraps (e.g., trimmed fat) from grocery stores and butcher
shops.
Material amounts
recovered and recycled
21,858,700 mt Jekanowski (2011)
Crop residue Parts of fruit and vegetables such as stalks, leaves and roots
that are not normally sold for food products as well as
misshapen, bruised or undersized fruit and vegetables that
are separated out on the farm as unsuitable for sale or food
donation. Does not include "gleaned produce," as defined
herein.
Material amounts
recovered and recycled
3,533 mt Sapkota et al. (2007);
Platt et al. (2014)
Dairy by‐
products
By‐products of milk and cheese production, including
buttermilk and whey that would be wasted if not diverted
for recycling.
Material amounts
recovered and recycled
15,518 mt NARA (2009); BSR
(2013); USEPA (2014)
Material Description Assumptions
(2007 Basis) Data Sources

2016 U.S. REI Study Methodology 106
Description Assumptions
(2007 Basis) Data Sources Material
Deceased stock Animals that are condemned and/or non‐ambulatory prior
to slaughter and dead aquatic animals from aquaculture
operations that, therefore, cannot be processed for human
food.
Material amounts
recovered and recycled
952,350 mt Jekanowski (2011)
Grease/FOG Natural by‐products of the cooking process, derived from
animal fats, vegetable oils, baked goods, dairy products and
other foods. Includes yellow grease rendered from spent
filtered cooking oil and brown grease that has been
processed to remove contaminants.
Material amounts
recovered and recycled
1,159,146 mt Jekanowski (2011);
USEPA (2014)
Plate waste Uneaten food served in restaurants, institutional food
service facilities and homes that is not saved as leftovers for
future human consumption.
Material amounts
recovered and recycled
495,517 mt USEPA (2007); NARA
(2009); USEPA (2014)
Produce, oilseed
and grain
residue
Residues from food manufacturing and processing
operations, including inedible trimmings, other fruit and
vegetable material left‐over after processing and residues
from grain and oilseed processing. Does not include edible
produce that is salvaged for feeding people (see "salvaged
food") or “spoiled food,” as defined herein.
Material amounts
recovered and recycled
463,530 mt NARA (2009); BSR
(2013); USEPA (2014)
Spoiled food Food, including fruits, vegetables, meat and semi‐perishable
manufactured products, which spoil or expire and cannot be
sold, donated or processed for human consumption.
Material amounts
recovered and recycled
445,595 mt NARA (2009); BSR
(2013); USEPA (2014)
Trim and other
cooking waste
Food scraps resulting from food preparation, including
inedible and/or trimmed parts of fruits and vegetables,
trimmings from preparing meat and burned or otherwise
inedible cooking products.
Material amounts
recovered and recycled
428,565 mt USEPA (2007); NARA
(2009); USEPA (2014)
Yard trimmings Grass, leaves and tree and brush trimmings from residential,
institutional and commercial sources.
Material amounts
recovered and recycled
17,505,100 mt EPA (2007); CalRecycle
(2010); Platt et al.
(2013)

2016 U.S. REI Study Methodology 107
Material
Unit price assumptions (only for recyclable organic products sold on the market)
Animal by‐
products
Estimated the average annual price of selected rendered
products in 2007. The rendered products include materials
such as inedible tallow and greases, edible tallow and lard
and protein meals (meat and bone meal, pork meat and
bone meal, blood meal, pork blood meal).
Unit price of 1 metric ton
of rendered products
$545.30/mt NRA (2012)
Dairy by‐
products
Estimated the average price of dairy by‐products whey and
buttermilk in 2007.
Unit price of 1 metric ton
of dairy by‐products
$2481.76/mt USDA (2008)
Grease Estimated the average price of recovered grease product. Unit price of 1 metric ton
of grease
$224.87/mt Centrec (2014)
mt = metric ton
Recycled Organic Material Quantities
Material Description Data Sources
Animal meal,
meat, fats, oils
and tallow
Primary products of animal rendering processes. Different
types of meat and bone meal is a protein product used to
produce livestock, poultry, aquaculture feed and pet food.
Animal fats, oils and tallow are used as intermediate
products for animal feed; industrial products like fatty acids,
lubricants, plastics, printing inks and explosives; and
consumer products such as soap, cosmetics, shaving cream,
deodorants, perfumes, polishes, cleaners, paints, candles,
fertilizer and caulking compounds. Special rendering
processes are used to produce edible products, such as lard,
from specially sourced animal by‐products.
Material amounts
recycled
8,364,137 mt Jekanowski (2011)
Description Assumptions
(2007 Basis) Data Sources
Assumptions
(2007 Basis)

2016 U.S. REI Study Methodology 108
Description Assumptions
(2007 Basis) Data Sources Material
Animal feed for
animal
production
Keeping, grazing, breeding or feeding animals, including
livestock and aquatic animals, for sale.
Material amounts
recycled
2,742,531 mt EPA (2009)
Biodiesel A replacement fuel for diesel engines made from used
cooking oils, vegetable oils and/or animal fats and oils;
usually made up of a blend of pure biodiesel and petroleum‐
based diesel.
Material amounts
recycled
2,524,963 mt NRA (2007)
Biogas A renewable energy fuel gas consisting mainly of methane
and carbon dioxide that is produced through anaerobic
digestion.
Material amounts
recycled
17,402,653
mt
American Biogas Council
(2014)
Compost Material produced from the aerobic decomposition of
organic material. Compost is used as a soil amendment and
surface dressing for agricultural, silvicultural, horticultural,
landscaping and construction applications.
Material amounts
recycled
5,830,932 mt Platt et al. (2013)
Mulch & wood
chips
Mulch: Organic, non‐composted product created by chipping
or grinding woody yard trimmings, land clearing debris, crop
residuals and other natural wood, used as a ground cover
around or over plants to enrich or insulate the soil. Wood
Chips: Organic, non‐composted product created by chipping
or grinding woody yard trimmings, land clearing debris and
other natural wood, used as a ground cover, boiler fuel or as
an intermediate product for animal bedding and other value‐
added applications.
Material amounts
recycled
5,532,740 mt Assumption
mt = metric ton
Sources and Uses of Donated Diverted Food Waste
Gleaned produce
o Community food programs (NAICS 624210, Community Food Services)

2016 U.S. REI Study Methodology 109
Data Sources: USEPA and USDA (1999)
Salvaged and rescued food
o Community food programs (NAICS 624210, Community Food Services)
Data sources: USEPA (1999); USEPA (2009); USEPA (2013a); USEPA (2014); USEPA (2015a)
Sources and Uses of Recyclable Organics
Animal by‐products
o Rendering and animal by‐product processing (NAICS 311613, Rendering and Meat Byproduct Processing)
o Other bio‐based materials manufacturing (not specified – see Note 1)
Data Sources: Meeker (2006); Jekanowski (2011); Centrec (2014); USEPA (2014)
Crop residue
o Minimally processed animal feed (NAICS 112210, Hog and Pig Farming)
o Biofuels manufacturing (NAICS 325199, All Other Basic Organic Chemical Manufacturing)
o Anaerobic digestion (NAICS 221119, Other Electric Power Generation)
o Other bio‐based materials manufacturing (not specified – see Note 1)
o Compost manufacturing (NAICS 325314, Fertilizer (Mixing Only) Manufacturing)
Data Sources: Sapkota et al. (2007); Platt et al. (2014)
Dairy by‐products
o Minimally processed animal feed (NAICS 112210, Hog and Pig Farming)
o Anaerobic digestion (NAICS 221119, Other Electric Power Generation)
Data sources: Sapkota et al. (2007); NREL (2013); USEPA (2015b); USDA (2008)
Deceased stock
o Rendering and animal by‐product processing (NAICS 311613, Rendering and Meat Byproduct Processing)
o Compost manufacturing (NAICS 325314, Fertilizer (Mixing Only) Manufacturing)
Data Sources: Meeker (2006); Jekanowski (2011); Platt et al. (2014)
Grease/FOG
o Rendering and animal by‐product processing (NAICS 311613, Rendering and Meat Byproduct Processing)
o Biofuels manufacturing (NAICS 325199, All Other Basic Organic Chemical Manufacturing)
o Anaerobic digestion (NAICS 221119, Other Electric Power Generation)
Data sources: IWMRC (2006); USEPA (2009); Jekanowski (2011); USDA (2011); USEPA (2014); USEPA (2015a); USEPA (2015b)

2016 U.S. REI Study Methodology 110
Plate waste
o Minimally processed animal feed (NAICS 112210, Hog and Pig Farming)
o Anaerobic digestion (NAICS 221119, Other Electric Power Generation)
o Compost manufacturing (NAICS 325314, Fertilizer (Mixing Only) Manufacturing)
Data sources: Sapkota et al. (2007); USEPA (2008); USEPA (2009); CalRecycle (2010); USDA (2011); USEPA (2013b); NREL (2013); Platt et al. (2014);
Themelis and Arsova (2015); USEPA (2014); USEPA (2015a); USEPA (2015b)
Produce, oilseed and grain residue
o Minimally processed animal feed (NAICS 112210, Hog and Pig Farming)
o Anaerobic digestion (NAICS 221119, Other Electric Power Generation)
o Other bio‐based materials manufacturing (not specified – see Note 1)
o Compost manufacturing (NAICS 325314, Fertilizer (Mixing Only) Manufacturing)
Data sources: Sapkota et al. (2007); BSR (2013); NREL (2013); Platt et al. (2014); USEPA (2014); USEPA (2015a); USEPA (2015b)
Spoiled food
o Minimally processed animal feed (NAICS 112210, Hog and Pig Farming)
o Anaerobic digestion (NAICS 221119, Other Electric Power Generation)
o Compost manufacturing (NAICS 325314, Fertilizer (Mixing Only) Manufacturing)
Data sources: Sapkota et al. (2007); USEPA (2008); USEPA (2009); CalRecycle (2010); USDA (2011); BSR (2013); USEPA (2013b); NREL (2013); Platt et al.
(2014); USEPA (2014); USEPA (2015a); Themelis and Arsova (2015); USEPA (2015b)
Trim and other cooking waste
o Minimally processed animal feed (NAICS 112210, Hog and Pig Farming)
o Anaerobic digestion (NAICS 221119, Other Electric Power Generation)
o Compost manufacturing (NAICS 325314, Fertilizer (Mixing Only) Manufacturing)
Data sources: Sapkota et al. (2007); USEPA (2008); USEPA (2009); CalRecycle (2010); USDA (2011); USEPA (2013b); NREL (2013); Platt et al. (2014); USEPA
(2014); Themelis and Arsova (2015); USEPA (2015a); USEPA (2015b)
Yard trimmings
o Other biomass‐based power generation (NAICS 221119, Other Electric Power Generation)
o Compost manufacturing (NAICS 325314, Fertilizer (Mixing Only) Manufacturing)
o Landscape materials application (NAICS 561730, Landscaping Services)
Data sources: USEPA (2008); CalRecycle (2010); Platt et al. (2013); USEPA (2013b); Platt et al. (2014); SCDHEC (2014); Themelis and Arsova (2015)

2016 U.S. REI Study Methodology 111
Note 1: The WIO model includes production of bio‐based materials and chemicals as an output of recycling through two processes: 1) rendering and animal by‐
products processing, and 2) biofuels manufacturing. It is recognized that bio‐based materials are produced through other recycling processes. However, due to
the diffuse nature of these processes and lack of data to model them, they are not included quantitatively in the analysis.
Donated Food Proportion
Consuming Process Process Description Recyclable Material
Proportion Basis for Proportion Data Source
Gleaned produce
Community food programs Gleaned produce from farms without
which community food programs would
need to find another source of produce
(e.g., purchased produce) to meet their
needs.
2.3% Ratio of estimated amount of
gleaned produce to total food
donated in 2008, where 10% of
produce donated in 2008 is
assumed to be gleaned
USEPA (2009)
Salvaged and rescued food
Community food programs Salvaged and rescued food without which
community food programs would need to
find another source of food (e.g.,
purchased) to meet their needs.
33.2% Ratio of estimated amount of
salvaged and rescued food to total
food donated in 2008, where 90%
of produce donated in 2008 is
assumed to be from food salvage or
rescue
USEPA (2009)

2016 U.S. REI Study Methodology 112
Recyclable Materials Proportion
Consuming Process Process Description Recyclable Material
Proportion Basis for Proportion Data Source
Animal by‐products
Rendering and animal
product processing
by‐ By‐products from slaughterhouses,
grocery stores and butcher shops
rendered to produce usable products
91.3% Ratio of estimated amount
animal by‐products to total
material, 2008
of
raw
Jekanowski
(2011)
Other bio‐based
manufacturing1
materials Animal by‐products recovered and used
(without intermediate rendering) to
produce bio‐based products (e.g., oyster
shells as landscaping material)
‐‐‐ ‐‐‐ ‐‐‐
Crop residue
Minimally
feed
processed animal Crop residue recovered and
substitute for other sources
in hog and pig farming
used as
of feed used
<0.1% Ratio estimated crop residue
diverted for animal feed to animal
feed required to support hog
inventory, 2007
NARA (2009);
Feedstuffs
(2011)
Biofuels manufacturing2 Crop residue recovered and used as
feedstock for biofuels manufacturing
‐‐‐ ‐‐‐ ‐‐‐
Anaerobic digestion Dairy by‐products recovered and used as
substitute for other feedstock in off‐farm,
commercial anaerobic digestion
operations
0.3% Percentage anaerobic digestion
feedstock from crop residue based
on European study (5%)
ABDA (2015)
Other bio‐based
manufacturing1
materials Crop residue recovered and
produce bio‐based products
used to ‐‐‐ ‐‐‐ ‐‐‐
Compost manufacturing Crop residue recovered and used to
produce compost in off‐farm commercial
composting operations
<0.1% Ratio of estimated crop residue
recovered for off‐farm composting
to total compost feedstock
Platt et al. (2014)

2016 U.S. REI Study Methodology 113
Consuming Process Process Description Recyclable Material
Proportion Basis for Proportion Data Source
Dairy by‐products
Minimally
feed
processed animal Dairy by‐products recovered and used as
substitute for other sources of feed used
in hog and pig farming
<0.1% Ratio estimated dairy by‐products
diverted for animal feed to animal
feed required to support hog
inventory, 2007
NARA (2009);
Feedstuffs
(2011)
Anaerobic digestion Dairy by‐products recovered and used as
substitute for other feedstock in off‐farm,
commercial anaerobic digestion
operations
0.5% Percentage anaerobic digestion
feedstock from food waste based
on European study (5%)
apportioned across food waste
categories in study; dairy products
assumed 10% of this recyclables
stream
ABDA (2015)
Deceased stock
Rendering and animal
product processing
by‐ Deceased stock rendered
usable products
to produce 4.0% Ratio
stock
of
to
estimated amount
total raw material,
of dead
2008
Jekanowski
(2011)
Compost manufacturing Deceased stock recovered and used to
produce compost in off‐farm commercial
composting operations
<0.1% Ratio of estimated crop residue
recovered for off‐farm composting
to total compost feedstock
Platt et al. (2014)
Grease/FOG
Rendering and animal
product processing
by‐ Recovered restaurant grease
produce usable products
rendered to 4.7% Ratio of estimated amount of
recovered restaurant grease to
raw material, 2008
total
Jekanowski
(2011)
Biofuels manufacturing2 Recovered restaurant
feedstock for biofuels
grease used as
manufacturing
‐‐‐ ‐‐‐ ‐‐‐

2016 U.S. REI Study Methodology 114
Consuming Process Process Description Recyclable Material
Proportion Basis for Proportion Data Source
Anaerobic digestion Recovered restaurant grease used
substitute for other feedstock in
commercial anaerobic digestion
operations
as 1.0% Percentage anaerobic digestion
feedstock from food waste based
on European study (5%)
apportioned across food waste
categories in study; grease/FOG
assumed 20% of this recyclables
stream
ABDA (2015)
Plate waste
Minimally
feed
processed animal Plate waste recovered and diverted
used as substitute for other sources
feed used in hog and pig farming
and
of
0.7% Ratio estimated plate waste
diverted for animal feed to animal
feed required to support hog
inventory, 2007
NARA (2009);
Feedstuffs
(2011)
Anaerobic digestion Recovered plate waste used as substitute
for other feedstock in commercial
anaerobic digestion operations
0.5% Percentage anaerobic digestion
feedstock from food waste based
on European study (5%)
apportioned across food waste
categories in study; grease/FOG
assumed 20% of this recyclables
stream
ABDA (2015)
Compost manufacturing Plate waste recovered and used to
produce compost in off‐farm commercial
composting operations
2.9% Ratio of food waste composted in
2007 to total compost feedstock;
apportioned equally between plate
waste and trim and other cooking
waste
EPA (2007);
et al. (2014)
Platt

2016 U.S. REI Study Methodology 115
Consuming Process Process Description Recyclable Material
Proportion Basis for Proportion Data Source
Produce,
residue
oilseed and grain
Minimally
feed
processed animal Produce, oilseed and grain processing
residue recovered and used as substitute
for other sources of feed used in hog and
pig farming
0.2% Ratio estimated produce, oilseed
and grain residue diverted for
animal feed to animal feed required
to support hog inventory, 2007
NARA (2009);
Feedstuffs
(2011)
Anaerobic digestion Produce, oilseed and grain processing
residue recovered and used as substitute
for other feedstock in commercial
anaerobic digestion operations
2.0% Percentage anaerobic digestion
feedstock from food waste based
on European study (5%)
apportioned across food waste
categories in study; produce,
oilseed and grain residue assumed
40% of this recyclables stream
ABDA (2015)
Other bio‐based
manufacturing1
materials Produce, oilseed and grain processing
residue recovered and used to produce
bio‐based products
‐‐‐ ‐‐‐ ‐‐‐
Compost manufacturing Produce, oilseed and grain processing
residue recovered and used to produce
compost in off‐farm commercial
composting operations
3.0% Ratio of estimated diverted food
waste from manufacturing sector
total compost feedstock
to
BSR (2013); Platt
et al. (2014)
Spoiled food
Minimally
feed
processed animal Spoiled food recovered and
substitute for other sources
in hog and pig farming
used as
of feed used
0.2% Ratio of estimated spoiled food
diverted for animal feed to animal
feed required to support hog
inventory, 2007
NARA (2009);
Feedstuffs
(2011)

2016 U.S. REI Study Methodology 116
Consuming Process Process Description Recyclable Material
Proportion Basis for Proportion Data Source
Anaerobic digestion Spoiled food recovered and used
substitute for other feedstock in
commercial anaerobic digestion
operations
as 0.5% Percentage anaerobic digestion
feedstock from food waste based
on European study (5%)
apportioned across food waste
categories in study; spoiled food
assumed 10% of this recyclables
stream
ABDA (2015)
Compost manufacturing Spoiled food recovered and used to
produce compost in off‐farm commercial
composting operations
3.3% Ratio of estimated diverted food
waste from food wholesale/resale
sector to total compost feedstock
BSR (2013); Platt
et al. (2014)
Trim and
waste
other cooking
Minimally
feed
processed animal Trim and other cooking waste recovered
and used as substitute for other sources
of feed used in hog and pig farming
0.3% Ratio estimated trim and other
cooking waste diverted for animal
feed to animal feed required to
support hog inventory, 2007
NARA (2009);
Feedstuffs
(2011)
Anaerobic digestion Trim and other cooking waste recovered
and used as substitute for other
feedstock in commercial anaerobic
digestion operations
0.5% Percentage anaerobic digestion
feedstock from food waste based
on European study (5%)
apportioned across food waste
categories in study; trim and other
cooking waste assumed 10% of this
recyclables stream
ABDA (2015)
Compost manufacturing Trim and other cooking waste recovered
and used to produce compost in off‐farm
commercial composting operations
2.9% Ratio of food waste composted in
2007 to total compost feedstock;
apportioned equally between plate
waste and trim and other cooking
waste
EPA (2007);
et al. (2014)
Platt

2016 U.S. REI Study Methodology 117
Consuming Process Process Description Recyclable Material
Proportion Basis for Proportion Data Source
Yard trimmings
Other biomass‐based power Diverted natural wood waste processed 0.1% Industrial biomass energy EIA (2012), Table
generation by chipping and grinding and used as consumption and electricity net 1.8
boiler fuel for energy production generation by industry and energy
source, 2007
Compost manufacturing Yard trimmings (grass and woody waste) 83.8% Ratio of estimated tons of yard EPA (2007); Platt
recovered and used to produce compost waste composted to total compost et al. (2013);
in off‐farm commercial composting feedstock Platt et al. (2014)
operations
Landscape materials Diverted natural wood waste processed y 1.0% Assumption based on reasoning ‐‐‐
application chipping and grinding (not composted) that most bio‐based landscaping
and applied for landscape cover (e.g., materials are produced in the forest
“mulch” and “wood chips”) products manufacturing industry
(not from wood waste diverted
from MSW)
Notes:
1 Economic activity associated with recycling of organics via bio‐based materials manufacturing processes were not quantified due to diffuse nature of
activities and lack of supporting data.
2 Economic activity associated with biofuels manufacturing was not included in the scope of the study.
Sources Cited
American Biogas Council (2014). Current and Potential Biogas Production. Accessed on January 09, 2016:
https://www.americanbiogascouncil.org/pdf/biogas101.pdf
Business for Social Responsibility (BSR). 2013. Analysis of U.S. Food Waste among Food Manufacturers, Retailers, & Wholesalers. Washington, DC: Grocery
Manufacturers Association and Food Marketing Institute.
Buzby, J.C., J. Hyman, H. Stewart and H.F. Wells. 2011. The Value of Retail‐ and Consumer‐Level Fruit and Vegetable Losses in the United States. The Journal of
Consumer Affairs, Fall 2011: 492–515.
2016 U.S. REI Study Methodology 118
California Department of Resources Recycling and Recovery (CalRecycle). 2010. Third Assessment of California’s Compost‐ and Mulch‐Producing Infrastructure,
Management Practices and Market Conditions. Sacramento, CA: California Department of Resources Recycling and Recovery.
Centrec Consulting Group. 2014. Biodiesel Demand for Animal Fats and Tallow Generates an Additional Revenue Stream for the Livestock Industry. Jefferson
City, MO: National Biodiesel Board.
Council for Agricultural Science and Technology (CAST). 2013. Animal Feed vs. Human Food: Challenges and Opportunities in Sustaining Animal Agriculture
Toward 2050. Issue Paper 53. Ames, IA: Council for Agricultural Science and Technology
Cuéllar A.D. and M.E. Webber. 2010. Wasted Food, Wasted Energy: The Embedded Energy in Food Waste in the United States. Environ. Sci. Technol., 44 (16):
6464–6469.
Energy Information Administration (EIA). 2012. Renewable Energy Annual 2009. Washington, DC: U.S. Department of Energy.
Feedstuffs. 2011. Feed Marketing and Distribution.
Illinois Waste Management and Research Center (IWMRC). 2006. Feasibility Report: Small Scale Biodiesel Production. Champaign, IL: Waste Management and
Research Center.
Jekanowski, M. Survey Says: A Snapshot of Rendering. Render Magazine. April 2011: 58‐61.
Meeker, D.L., ed. 2006. Essential Rendering: All about the Animal By‐products Industry. Arlington, VA: National Renderers Association.
National Archives and Records Administration (NARA). 2009. Swine Health Protection; Feeding of Processed Product to Swine. Office of the Federal Register. 74
FR 15215. Washington, DC: Government Printing Office.
National Renderer’s Association (2007). Accessed on January 08, 2016: http://www.nationalrenderers.org/environmental/biofuels/
National Renderers Association (NRA). 2012. Render Magazine, Market Report, April 2012. Accessed January 11, 2016 at
https://d10k7k7mywg42z.cloudfront.net/assets/4f7f24b2dabe9d320b008ec3/apr12render.pdf
National Renewable Energy Research Laboratory (NREL). 2013. Feasibility Study of Anaerobic Digestion of Food Waste in St. Bernard, Louisiana. Report No.
NREL/TP‐7A30‐57082. Golden, Colorado: U.S. Department of Energy.
Platt, B., B. Bell and C. Harsh. 2013. Pay Dirt, Composting in Maryland to Reduce Waste, Create Jobs, and Protect the Bay. Washington, DC: Institute for Local
Self‐Reliance.
Platt, B., N. Goldstein, C. Coker and S. Brown. 2014. State of Composting in the U.S. Washington, DC: Institute for Local Self‐Reliance.
Sapkota, A.R., L.Y. Lefferts, S. McKenzie and P. Walker. 2007. What Do We Feed to Food‐Production Animals? A Review of Animal Feed Ingredients and Their
Potential Impacts on Human Health. Environmental Health Perspectives. 115 (5): 663‐670.
South Carolina Department of Health and Environmental Control (SCDHEC). 2014. Solid Waste Management: Compost and Mulch Production from Land‐
clearing Debris, Yard Trimmings and Organic Residuals. Report No. R.61‐107.4. Columbia, SC: South Carolina Department of Health and Environmental
Control.

2016 U.S. REI Study Methodology 119
Themelis, N.J. and L. Arsova. Calculating Tons to Composting In the U.S. BioCycle. 56 (2): 27.
U.S. Department of Agriculture (USDA). 2008. Dairy Products. 2007 Summary. Accessed on January 08, 2016 at:
http://usda.mannlib.cornell.edu/usda/nass/DairProdSu//2000s/2008/DairProdSu‐04‐25‐2008.pdf
U.S. Department of Agriculture (USDA). 2011. Consumer‐Level Food Loss Estimates and Their Use in the ERS Loss‐Adjusted Food Availability Data. Economic
Research Service. Technical Bulletin No. 1927. Washington, DC: U.S. Department of Agriculture.
U.S. Department of Agriculture (USDA). 2013. U.S. Hog Production from 1992 to 2009: Technology, Restructuring, and Productivity Growth. Economic Research
Service. Economic Research Report No. 158. Washington, DC: U.S. Department of Agriculture.
U.S. Department of Agriculture (USDA). 2015. Oil Crops Yearbook, Table 35, Use for selected industrial products, U.S., 1980‐2010. Economic Research Service.
Washington, DC: U.S. Department of Agriculture. Accessed December 30, 2015 at http://www.ers.usda.gov/data‐products/oil‐crops‐yearbook.aspx
U.S. Environmental Protection Agency (USEPA) and U.S. Department of Agriculture (USDA). 1999. Waste Not Want Not, Feeding the Hungry and Reducing Solid
Waste Through Food Recovery. Report No. EPA 530‐R‐99‐040. Washington, DC: U.S. Environmental Protection Agency.
U.S. Environmental Protection Agency (USEPA). 2007. Municipal Solid Waste in the United States, 2007 Facts and Figures. Office of Solid Waste. Report No. EPA
530‐R‐08‐010. Washington, DC: U.S. Environmental Protection Agency.
U.S. Environmental Protection Agency (USEPA). 2009. An Informal Data Study of Food Waste in the U.S. Office of Resource Conservation and Recovery.
Washington, DC: U.S. Environmental Protection Agency.
U.S. Environmental Protection Agency (USEPA). 2008. Municipal Solid Waste in the United States, 2007 Facts and Figures. Office of Solid Waste. Report No. EPA
530‐R‐08‐010. Washington, DC: U.S. Environmental Protection Agency.
U.S. Environmental Protection Agency (USEPA). 2013a. Food Waste Loss and Donation. Office of Resource Conservation and Recovery. Washington, DC: U.S.
Environmental Protection Agency.
U.S. Environmental Protection Agency (USEPA). 2013b. Municipal Solid Waste in the United States, 2011 Facts and Figures. Office of Solid Waste. Report No.
EPA 530‐R‐13‐001. Washington, DC: U.S. Environmental Protection Agency.
U.S. Environmental Protection Agency (USEPA). 2014. Food Waste Management Scoping Study. Washington, DC: U.S. Environmental Protection Agency.
U.S. Environmental Protection Agency (USEPA). 2015a. Postconsumer Food Diverted Through Donation, Animal Feed, Anaerobic Digestion, and Composting for
2013. Washington, DC: U.S. Environmental Protection Agency.
U.S. Environmental Protection Agency (USEPA). 2015b. Anaerobic Digestion and its Applications. Office of Research and Development, National Risk
Management Research Laboratory. Report No. EPA/600/R‐15/304. Cincinnati, OH: U.S. Environmental Protection Agency.
West Virginia University (WVU). 2002. Waste Management in Aquaculture. Agriculture and Resource Economics Program. Aquaculture Information Series
Publication No. AQ02‐1. Morgantown, WV: West Virginia University.

2016 U.S. REI Study Methodology 120
11. AppendixE–RecyclingMaterialQuantityandPriceData
Table 17: Recycling Material Quantity and Price Data
Material Description Assumptions (2007 Basis) Data Sources Comments
Iron and Steel Total ferrous metals recovered from appliances (such as washing machines, water heaters, refrigerators etc.), automobiles, steel containers, construction material and other sources
Material amounts recovered and recycled
35,039,566 mt
USGS (2014) This tonnage is the sum of all ferrous metal products recovered. The recycled ferrous metal amount was estimated from this number by assuming a material loss of 5% during the recycling process meaning that 95% of the recovered ferrous metal is assumed to be recycled
Iron and Steel Appliances (washing machines, water heaters, air conditioners, refrigerators, dryers)
Material amounts recovered and recycled
2,600,000 mt USGS (2014) See pg. 38.1 of source USGS (2014)
Iron and Steel Automobiles Material amounts recovered and recycled
14,800,000 mt
USGS (2014) See pg. 38.1 of source USGS (2014)
Iron and Steel Steel containers Material amounts recovered and recycled
17,000,000 mt
USGS (2014) See pg. 38.1 of source USGS (2014)
Iron and Steel Construction materials and other
Material amounts recovered and recycled
639,566 mt EPA (2003), Tellus Institute (2011)
The amount of ferrous metals that comprise all of the metal amount recovered from construction and demolition activities (EPA, 2003) was estimated using the Tellus Institute report (Tellus Institute 2011). Acc. to the report approx. 75% of metal waste in C&D activities is comprised of ferrous metals and 12.5% of waste is comprised of non-ferrous metals while the remaining 12.5% is comprised of other metals. Pg. B-18 of source EPA (2003) provides metal amounts recycled from C&D waste as 940,000 short tons/yr which when converted is

2016 U.S. REI Study Methodology 121
Material Description Assumptions (2007 Basis) Data Sources Comments
852,754 mt, of which 75% is ferrous metal amount, i.e., 639,566 mt
Iron and Steel - Unit price of recycled material
$795.65 /mt USGS (2013), p. 72
Based on average annual unit price for hot rolled steel bar. The source reports the price as $36.09/100 lbs., converted to $795.65/mt
Aluminum Aluminum scrap from used beverage cans, other containers, transportation, construction and other sources
Material amounts recovered and recycled
1,524,071 mt Aluminum Association (2011)
According to personal communications with the Aluminum Association, the recycled proportion in the US metal supply was approx. 40%. Quantities of recovered material from scrap recycling in 2007 were 4.2 million tons which converted is 3,810,177 mt, 40% of which is 1,524,071 mt.
Aluminum - Unit price of recycled material
$2,640 /mt Index Mundi (2015) Based on the London Metal Exchange spot price for aluminum in 2007, 99.5% purity; comparable to unit price of aluminum in 2007 from USGS (2013), p. 5
Glass Glass cullet recovered from glass bottles and jars
Material amounts recovered and recycled
2,053,020 mt GPI (2014) According to source, glass cullet recovered is approx. 2,263,067 short ton which converted is 2,053,020 mt
Glass - Unit price of recycled material
$32.50 /mt Popular Mechanics (2008)
Price converted from $/short ton to $/mt
Paper Recovered and recycled paper and paperboard
Material amounts recovered and recycled
13,508,892 mt
AFPA (2014) According to source AFPA (2014), recycled paperboard production in year 2007 was 14,891,000 short tons which converted is 13,508,892 mt. However, for WIO calculations, recycled paper production amounts were calculated by dividing the recycled paperboard production amounts by the sum of commodity output of industrial sectors - 'Paperboard mills' and 'Paperboard container manufacturing', multiplied with the sum of commodity output of all industrial sectors related to paper production such as 'Paper mills', 'Paperboard mills', 'Paperboard container manufacturing', 'Paper bag manufacturing', 'Stationery product manufacturing',

2016 U.S. REI Study Methodology 122
Material Description Assumptions (2007 Basis) Data Sources Comments
'Sanitary product manufacturing' and 'All other converted paper product manufacturing'.
Paper - Unit price of recycled material
$126.77 /mt Popular Mechanics (2008)
Price converted from $/short ton to $/mt
Plastic Total Recycled plastics
Material amounts recovered and recycled
2,540,118 mt EPA (2014) This is the sum of all plastics recovered and recycled
Plastic Durable goods Material amounts recovered and recycled
698,532 mt EPA (2014) According to source EPA (2014), material amounts of durable goods (PET, HDPE, PVC, LDPE/LLDPE, PP, PS and other resins) are reported as 770,000 short tons which converted is 698,532 mt
Plastic Nondurable goods Material amounts recovered and recycled
117,934 mt EPA (2014) According to source EPA (2014), material amounts of nondurable goods (plastics in clothing, footwear, disposable diapers, etc.) are reported as 130,000 short tons which converted is 117,934 mt
Plastic Plastic containers and packaging
Material amounts recovered and recycled
1,723,652 mt EPA (2014) According to source EPA (2014), material amounts of plastic containers and packaging (such as bottles, jars, other containers, bags, sacks, wraps and other plastic packaging) are reported as 1,900,000 short tons which converted is 1,723,652 mt
Plastic - Unit price of recycled material
$1,208.68 /mt
Block (2012) The source Block (2012) provides recycled resin prices in ¢/lb. which after averaging out is converted into $/mt
Rubber crumb Ground rubber produced from scrap tires
Material amounts recovered and recycled
1,100,016 mt RMA (2014) The source RMA (2014) provides information on ground rubber and rubber used in civil engineering projects. Both estimates were used to calculate the ground rubber amounts produced from scrap tires
Rubber crumb - Unit price of recycled material
$374.79 /mt ProfitableRecycling (2015)
Price converted from $/short ton to $/mt

2016 U.S. REI Study Methodology 123
Material Description Assumptions (2007 Basis) Data Sources Comments
Other recycled Other rubber Material amounts 971,218 mt RMA (2014) The source RMA (2014) provides information on different rubber recovered from scrap
tires used in civil engineering, reclamation and agricultural applications.
recovered and recycled
types of recycled rubber amounts including recycled rubber used in tire derived fuel. Estimates of other rubber recovered were derived by subtracting the sum of ground rubber and tire derived fuel rubber from the total recycled rubber amounts
Other recycled rubber
- Unit price of recycled material
$385.81 /mt ProfitableRecycling (2015)
Price converted from $/short ton to $/mt
Recycled Recycled concrete, Material amounts 863,050,913 Modeled based on C&D metal waste is included in ferrous and nonferrous Construction & asphalt, gypsum and recovered and mt estimates of % metals recycling analysis. Recycled construction and Demolition wood recovered from recycled contribution of demolition amounts were calculated by dividing the total Material construction and
demolition waste C&D to end uses commodity output of the C&D sectors by the price of total
recycled C&D material in $/mt
Recycled Construction & Demolition Material
Recycled concrete Unit price of recycled material
$9.50 /mt USGS (2000) Averaged out the price of aggregate products made from recycled concrete
Recycled Brick (recycled Unit price of $27.78 /mt Kurtz (2015) Recycled bricks are often placed in mixed aggregate Construction & aggregate) recycled material markets, with concrete and block and are used in Demolition aggregate production. Therefore the price of recycled Material bricks is assumed to be the same as price of recycled
aggregates $25.20/short ton which converted is $27.78/mt
Recycled Construction & Demolition Material
Wood (recycled chips)
wood Unit price of recycled material
$24.80 /mt NETI (2015) Averaged out the price of wood chips in source NETI (2005), $22.50/short ton which converted is $24.80/mt
Recycled Construction & Demolition Material
Asphalt (recycled asphalt shingles)
Unit price of recycled material
$44.09 /mt Crushcrete (2015) According to the source, recycled asphalt shingles are $40/short ton which converted is $44.09/mt
Recycled Construction &
Gypsum (drywall) Unit price of recycled material
$15.98 /mt Bauer (2012) According to the source, pg. 30, recycled gypsum is on an average $14.5/short ton which converted is $15.98/mt

2016 U.S. REI Study Methodology 124
Material Description Assumptions (2007 Basis) Data Sources Comments
Demolition Material
Recycled Total Recycled Material amounts 388,404 mt EPA (2011) This is the sum of all electronic products recovered and Electronics computers, computer
displays, printers, fax machines, keyboards, televisions and mobile devices
recovered and recycled
recycled
Recycled Computers Material amounts 100,589 mt EPA (2011) According to source EPA (2011) pg. 26, material Electronics recovered and
recycled amounts of computer products collected for recycling is 168,000 short tons. Of these roughly 66% were recycled (pg. 20) amounting to 110,880 short tons which converted is 100,589 mt
Recycled Monitors Material amounts 116,156 mt EPA (2011) According to source EPA (2011) pg. 26, material Electronics recovered and
recycled amounts of electronic products - monitors collected for recycling is 194,000 short tons. Of these roughly 66% were recycled (pg. 20) amounting to 128,040 short tons which converted is 116,156 mt
Recycled Hard Copy Devices Material amounts 58,078 mt EPA (2011) According to source EPA (2011) pg. 26, material Electronics recovered and
recycled amounts of electronic products - hard copy devices collected for recycling is 97,000 short tons. Of these roughly 66% were recycled (pg. 20) amounting to 64,020 short tons which converted is 58,078 mt
Recycled Keyboards and Mice Material amounts 3,868 mt EPA (2011) According to source EPA (2011) pg. 26, material Electronics recovered and
recycled amounts of electronic products - keyboards and mice - collected for recycling is 6460 short tons. Of these roughly 66% were recycled (pg. 20) amounting to 4,264 short tons which converted is 3,868 mt
Recycled Televisions Material amounts 108,372 mt EPA (2011) According to source EPA (2011) pg. 26, material Electronics recovered and
recycled amounts of electronic products - televisions - collected for recycling is 181,000 short tons. Of these roughly 66% were recycled (pg. 20) amounting to 119,460 short tons which converted is 108,372 mt

2016 U.S. REI Study Methodology 125
Material Description Assumptions (2007 Basis) Data Sources Comments
Recycled Mobile Devices Material amounts 1,341 mt EPA (2011) According to source EPA (2011) pg. 26, material Electronics recovered and
recycled amounts of electronic products - mobile devices - collected for recycling is 2,240 short tons. Of these roughly 66% were recycled (pg. 20) amounting to 1,478 short tons which converted is 1,341 mt
Recycled Recycled UEP - Unit price (weight $702.25 /mt ITC (2013), Table According to source ITC (2013), Table 3.2, pg. 3-7, the Electronics Computers and
computer peripheral devices
basis) 3.2 price of computers and computer peripheral devices was estimated by dividing the value (in million $) by volume (in short tons) and then converting the resulting price in $/short tons to $/mt
Recycled Recycled UEP - Unit price (weight $798.93 /mt ITC (2013), Table According to source ITC (2013), Table 3.2, pg. 3-7, the Electronics Monitors basis) 3.2 price of monitors was estimated by dividing the value (in
million $) by volume (in short tons) and then converting the resulting price in $/short tons to $/mt
Recycled Electronics
Recycled UEP - Hard Copy Devices
Unit price (weight basis)
$116.87 /mt On-line marketplace prices
Calculated based on average price of top 10 "new & popular" on Amazon.com
Recycled Electronics
Recycled UEP - Keyboards & Mice
Unit price (weight basis)
$44.24 /mt On-line marketplace prices
Calculated based on average price of top 10 "new & popular" on Amazon.com
Recycled Electronics
Recycled UEP – Televisions
Unit price (weight basis)
$73.99 /mt ITC (2013), Table 3.2
According to source ITC (2013), Table 3.2, pg. 3-7, the price of televisions was estimated by dividing the value (in million $) by volume (in short tons) and then converting the resulting price in $/short tons to $/mt
Recycled Recycled UEP - Unit price (weight $2,741.39 ITC (2013), Table According to source ITC (2013), Table 3.2, pg. 3-7, the Electronics Mobile Devices basis) /mt 3.2 price of mobile devices was estimated by dividing the
value (in million $) by volume (in short tons) and then converting the resulting price in $/short tons to $/mt
Donated Food Donated gleaned produce
Material amounts recovered and recycled
19,654 mt EPA (2009) Calculated based on the assumption that 10% of produce donated in 2007 from EPA (2009), Exhibit 5, was from gleaned produce.
Donated Food Donated rescued food Material amounts recovered and recycled
17,378 mt EPA (2009) “Prepared food” from EPA (2009), Exhibit 5, based on alignment between definitions of rescued food herein and prepared food in EPA (2009).

2016 U.S. REI Study Methodology 126
Material Description Assumptions (2007 Basis) Data Sources Comments
Donated Food Donated salvaged food
Material amounts recovered and recycled
265,268 mt EPA (2009) Calculated as “salvaged food” plus remaining 90% of donated produce from EPA (2009), Exhibit 5.
Recycled Organics
Animal meal, meat, fats, oils and tallow
Material amounts recovered and recycled
8,364,137 mt
Jekanowski (2011) Reported information.
Recycled Organics
Animal feed for animal production
Material amounts recovered and recycled
2,742,531 mt EPA (2009) Reported information.
Recycled Organics
Biodiesel Material amounts recovered and recycled
2,524,963 mt NRA (2007) Reported information.
Recycled Organics
Biogas Material amounts recovered and recycled
17,402,653 mt
American Biogas Council (2014)
Reported information.
Recycled Organics
Compost Material amounts recovered and recycled
5,830,932 mt Platt et al. (2013) Reported information.
Recycled Organics
Mulch & wood chips Material amounts recovered and recycled
5,532,740 mt Assumption Calculated based on estimated recovered yard trimmings and process loss assumptions.
Sources Cited
AFPA (2014). Annual Statistical Summary of Recovered Paper Utilization 2014. Washington, DC: American Forest &
Paper Association.
Aluminum Association (2011). Aluminum: The Element of Sustainability. Arlington, Virginia. Retrieved May 21,
2015, from http://www.aluminum.org/sites/default/files/Aluminum_The_Element_of_Sustainability.pdf
American Biogas Council (2014). Current and Potential Biogas Production. Accessed on January 09, 2016:
https://www.americanbiogascouncil.org/pdf/biogas101.pdf

2016 U.S. REI Study Methodology 127
Bauer, C. (2012). Gypsum Recycling in PlaNYC 2030: Spaces for Government Intervention. Retrieved May 24, 2015, from
Columbia University Academic Commons: http://hdl.handle.net/10022/AC:P:13287
Block, D.G. (2012). Recycled Resin Prices: Recycled Plastics Prices Unstable In First Half of 2012. Plastics Technology.
Retrieved May 22, 2015, from http://www.ptonline.com/articles/recycled‐plastics‐prices‐ unstable‐in‐first‐
half‐of‐2012
Crushcrete (2015). Recycled Asphalt Shingles (RAS) as a Valuable Commodity. Retrieved May 24, 2015, from Crushcrete
Inc.: http://www.crushcrete.com/ras.html
EPA (2003). Building‐Related Construction and Demolition Material Amounts. Washington, DC: U.S. Environmental
Protection Agency. Retrieved May 24, 2015, from http://www.epa.gov/epawaste/conserve/imr/cdm/pubs/cd‐
meas.pdf
EPA (2009). An Informal Data Study of Food Waste in the U.S. Office of Resource Conservation and Recovery.
Washington, DC: U.S. Environmental Protection Agency.
EPA (2011). Electronics Waste Management in the United States Through 2009. Washington, DC: U.S. Environmental
Protection Agency. Retrieved May 24, 2015, from
http://www.epa.gov/epawaste/conserve/materials/ecycling/docs/fullbaselinereport2011.pdf
EPA (2014). Municipal Solid Waste Generation, Recycling, and Disposal in the United States: Tables and Figures for 2012.
Office of Solid Waste and Emergency Response. Washington, DC: U.S. Environmental Protection Agency.
Retrieved May 22, 2015, from
http://www.epa.gov/solidwaste/nonhaz/municipal/pubs/2012_msw_dat_tbls.pdf
GPI (2014). Achieving 50% Recycled Content for Glass Containers: Efforts, Challenges, and Opportunities Ahead for the
North American Glass Container Industry. Arlington, Virginia: Glass Packaging Institute. Retrieved May 21, 2015,
from
http://www.gpi.org/sites/default/files/GPI%20Recycled%20Content%20Report%2C%20September%202014.pdf
Index Mundi (2015). Aluminum Monthly Price – U.S. Dollars per Metric Ton. Commodity Prices, Aluminum. Retrieved
May 21, 2015, from http://www.indexmundi.com/commodities/?commodity=aluminum&months=300
ITC (2013). Used Electronic Products: An Examination of U.S. Exports. Washington, CD: United States International Trade
Commission. Retrieved May 24, 2015, from http://www.usitc.gov/publications/332/pub4379.pdf
Jekanowski, M. Survey Says: A Snapshot of Rendering. Render Magazine. April 2011: 58‐61.

2016 U.S. REI Study Methodology 128
Kurtz (2015). #304 Recycled Aggregate. Retrieved May 24, 2015, from Kurtz Bros., Inc.: http://www.kurtz‐
bros.com/landscape‐supplies/recycled‐aggregate/304‐recycled‐aggregate/
NRA (2012). Render Magazine, Market Report, April 2012. Accessed January 11, 2016 at
https://d10k7k7mywg42z.cloudfront.net/assets/4f7f24b2dabe9d320b008ec3/apr12render.pdf
NETI (2015). Wood Chips. Retrieved May 24, 2015, from NE Timberland Investments, LLC:
http://www.netimberland.com/woodchips.html
Platt, B., B. Bell and C. Harsh (2013). Pay Dirt, Composting in Maryland to Reduce Waste, Create Jobs, and Protect the
Bay. Washington, DC: Institute for Local Self‐Reliance.
Popular Mechanics (2008). Recycling by the Numbers: The Truth About Recycling. Retrieved May 21, 2015, from
http://www.popularmechanics.com/science/environment/a3757/4291576/
ProfitableRecycling (2015). Scrap Tire Recycling. ProfitableRecycling.com. Retrieved May 22, 2015, from
http://www.profitablerecycling.com/tirerecycling.htm
RMA (2014). 2013 U.S. Scrap Tire Management Summary. Washington, DC: Rubber Manufacturers Association.
Retrieved May 22, 2015, from http://www.rma.org/download/scrap‐tires/market‐
reports/US_STMarket2013.pdf
Tellus Institute (2011). More Jobs, Less Pollution: Growing the Recycling Economy in the U.S. Retrieved May 22, 2015,
from http://www.tellus.org/tellus/publication/more‐jobs‐less‐pollution‐growing‐the‐recycling‐economy‐in‐the‐
u‐s
USGS (2000). Recycled Aggregates—Profitable Resource Conservation. Reston, Virginia: U.S. Geological Survey.
Retrieved May 24, 2015, from http://pubs.usgs.gov/fs/fs‐0181‐99/fs‐0181‐99so.pdf
USGS (2013). Metal Prices in the United States Through 2010. Reston, Virginia: U.S. Geological Survey. Retrieved May
21, 2015, from http://pubs.usgs.gov/sir/2012/5188/sir2012‐5188.pdf
USGS (2014). 2012 Minerals Yearbook: Iron and Steel Scrap (Advance Release). Reston, Virginia: U.S. Geological Survey.
Retrieved May 21, 2015, from http://minerals.usgs.gov/minerals/pubs/commodity/iron_&_steel_scrap/myb1‐2012‐
fescr.pdf

2016 U.S. REI Study Methodology 129
12. Appendix F – Employment and Tax Revenue DataCompilation
12.1. Overview of Methodology This appendix describes the methodology used to compile employment and tax data for estimating the jobs, wages, occupational profile and tax revenue associated with recycling. All data were obtained from official U.S. Government sources, which are listed in Table 18. All data represent a 2007 baseline for consistency with the economic information used in the WIO model. Methods used to associate publicly available data to the BEA I-O structure used in the WIO model are described in the following sections of this appendix.
Table 18: Data Sources by Economic Sector
Sector Associated Activities Jobs and Wages Occupational
Profile Tax Payments
Agriculture • Crop production• Animal production
2007 U.S. Census of Agricultural (USDA, 2007)
2007 Occupational and Employment Statistics (BLS, 2007)
2007 U.S. Statistics of Income (IRS, 2007)
Nonfarm private industry
• Mining and logging• Construction• Manufacturing• Trade, transportation
and utilities• Services
2007 Statistics of U.S. Businesses (Census, 2007)
Government • Federal government• State government• Local government
2007 Annual Survey of Public Employment and Payroll (Census, 2007)
12.2. Employment and Wages The U.S. Government collects information regarding employment and wages through a number of different programs. For the purposes of this analysis, the following sources were used:
• U.S. Census of Agriculture—The U.S. Department of Agriculture (USDA) conducts the Census ofAgriculture every 5 years to gather information regarding U.S. farms and ranches, includinginformation about operators, hired labor and wages, total sales and farm/ranch income.23
23 Ref. http://www.agcensus.usda.gov/

2016 U.S. REI Study Methodology 130
• Statistics of U.S. Businesses (SUSB)—SUSB is an annual series developed by the U.S. Census Bureau from the Business Register, Company Organization Survey, other Census Bureau programs (e.g., Annual Survey of Manufactures and Current Business Surveys) and records of the Internal Revenue Service, Social Security Administration and Bureau of Labor Statistics. The SUSB provides national data on jobs, wages, sales and other factors, covering most of the country's economic activity. The series does not cover agricultural production, non-employer businesses, private households, railroads and most government entities.24
• Annual Survey of Public Employment & Payroll—the U.S. Census Bureau conducts the Annual Survey of Public Employment & Payroll to provide statistics on federal, state and local employment and payroll. The survey covers governmental functions including education, police and fire protection, financial administration, judicial and legal, public works and utilities, including solid waste management, public transit, social services and other functions.25
Employment, wage and other data were compiled and linked to BEA codes for integration with the WIO model as described in Section 8.
12.2.1. Agriculture (Crop and Animal Production) Data from the Census of Agriculture and the Statistical Abstract of the United States were used to estimate employment and wages associated with crop and animal production. The Census of Agriculture provides total employment and farm payroll data. The Statistical Abstract of the United States provides information on household earnings from farm income. Neither source disaggregates this information by NAICS code in publicly available datasets.
The Census of Agriculture does provide statistics at a 4- to 6-digit NAICS resolution on the market value of agricultural products sold. Therefore, employment and wage estimates were apportioned to NAICS categories based on the assumption that they are proportional to sales. Specific data sources include:
• Market value of agricultural products sold, 2007—USDA (2007), Table 46.
• Total agricultural employment, 2007—Sum of total operators, 2007 (USDA 2012, Table 45) and total hired farm labor, 2007 (USDA 2012, Table 7).
• Total agricultural earnings and wages, 2007—Sum of:
o Total farm household earnings from farm income, calculated as product of total family farms, 2007 (Census 2012, Table 830) and average net earnings from farm income, 2007 (Census 2012, Table 830) and
o Farm payroll for hired labor, 2007 (USDA 2012, Table 7). Data were associated with NAICS categories and aggregated to BEA codes using the 2007 NAICS-to-BEA concordance table, Table 19.
24 Ref. http://www.census.gov/econ/susb/
25 http://www.census.gov/govs/apes/

2016 U.S. REI Study Methodology 131
12.2.2. Private Nonfarm Goods and Services Estimates of employment and wages associated with nonfarm goods and services sectors were obtained from the 2007 Statistics of U.S. Businesses. Employment and wage data are available at 6-digit NAICS resolution. For some NAICS sectors, data were not reported in the 2007 SUSB because data were withheld to avoid disclosing data for individual businesses or they were deemed by the Census to be of insufficient quality. Where data were missing for a critical sector (e.g., employment and wage data for Glass Container Manufacturing, NAICS 327213), data were imputed from information reported at the 5-digit NAICS resolution. Data were associated with NAICS categories and aggregated to BEA codes using the 2007 NAICS-to-BEA concordance table, Table 19.
12.2.3. Government Data regarding public sector employment were compiled from the 2007 Annual Survey of Public Employment and Payroll. Federal, state and local employment data and wages are not associated with specific NAICS codes and were associated directly with BEA codes without using the NAICS concordance table. The data do not include statistics for federal defense employment and wages.
12.2.4. NAICS-to-BEA Concordance Table The majority of publicly available data sources report 2007 according to the 2007 NAICS classification system. Generally, NAICS 6-digit codes represent a finer level or the same level of resolution than BEA codes, creating one-to-many or one-to-one (NAICS-to-BEA) relationships. These types of relationships can be mapped using a concordance table and data at finer NAICS resolutions can be rolled-up to BEA codes. For the construction and real estate sectors, NAICS and BEA codes have a many-to-many relationship. Additional data sources were required to associate NAICS-level data to multiple BEA codes.
Table 19 presents the NAICS-to-BEA concordance table used to compile employment and tax data in a way that enabled alignment and integration with the WIO model.
Table 19: NAICS-to-BEA Concordance Table
BEA Code Description Corresponding NAICS Codes
Crop and Animal Production
1111A0 Oilseed farming 111110, 111120
1111B0 Grain farming 111130, 111140, 111150, 111160, 11119
111200 Vegetable and melon farming 111211, 111219
111300 Fruit and tree nut farming 111310, 111320, 111331, 111332, 111333, 111334, 111335, 111336, 111339
111400 Greenhouse, nursery and floriculture production 11141, 111421, 111422
111900 Other crop farming 111910, 111920, 111930, 111940, 11199
1121A0 Beef cattle ranching and farming, including feedlots and dual-purpose ranching and farming
112111, 112112
112120 Dairy cattle and milk production 11212
112A00 Animal production, except cattle and poultry and eggs 1122, 112410, 112420, 1125, 112910, 112920, 112930, 112990

2016 U.S. REI Study Methodology 132
BEA Code Description Corresponding NAICS Codes
112300 Poultry and egg production 112310, 112320, 112330, 112340, 112390
Forestry, Fishing and Agricultural Support Services
113000 Forestry and logging 113110, 113210, 113310 114000 Fishing, hunting and trapping 114111, 114112, 114119, 114210 115000 Support activities for agriculture and forestry 115111, 115112, 115113, 115114, 115115,
115116, 115210, 115310 Mining, Quarrying, Oil and Gas Extraction, Utilities
and Construction
211000 Oil and gas extraction 211111, 211112
212100 Coal mining 212111, 212112, 212113
2122A0 Iron, gold, silver and other metal ore mining 212210, 212221, 212222, 212291, 212299
212230 Copper, nickel, lead and zinc mining 212231, 212234
212310 Stone mining and quarrying 212311, 212312, 212313, 212319
2123A0 Other nonmetallic mineral mining and quarrying 212321, 212322, 212324, 212325, 212391, 212392, 212393, 212399
213111 Drilling oil and gas wells 213111
21311A Other support activities for mining 213112, 213113, 213114, 213115
221100 Electric power generation, transmission and distribution
221111, 221112, 221113, 221119, 221121, 221122
221200 Natural gas distribution 221210
221300 Water, sewage and other systems 221310, 221320, 221330
230301 Nonresidential maintenance and repair 236210, 236220, 237210, 238110, 238120, 238130, 238140, 238150, 238160, 238170, 238190, 238210, 238220, 238290, 238310, 238320, 238330, 238340, 238350, 238390, 238910, 238990
230302 Residential maintenance and repair 236118
233210 Health care structures 236220, 237210, 238110, 238120, 238130, 238140, 238150, 238160, 238170, 238190, 238210, 238220, 238290, 238310, 238320, 238330, 238340, 238350, 238390, 238910, 238990
233230 Manufacturing structures 236210, 237210, 238110, 238120, 238130, 238140, 238150, 238160, 238170, 238190, 238210, 238220, 238290, 238310, 238320, 238330, 238340, 238350, 238390, 238910, 238990
233240 Power and communication structures 237130
233262 Educational and vocational structures 236220, 237210, 238110, 238120, 238130, 238140, 238150, 238160, 238170, 238190, 238210, 238220, 238290, 238310, 238320, 238330, 238340, 238350, 238390, 238910, 238990

2016 U.S. REI Study Methodology 133
BEA Code Description Corresponding NAICS Codes
233293 Highways and streets 237310
2332A0 Commercial structures, including farm structures 236220, 237210, 238110, 238120, 238130, 238140, 238150, 238160, 238170, 238190, 238210, 238220, 238290, 238310, 238320, 238330, 238340, 238350, 238390, 238910, 238990
2332B0 Other nonresidential structures 237110, 237120, 237990
233411 Single-family residential structures 236115, 236117, 237210, 238110, 238120, 238130, 238140, 238150, 238160, 238170, 238190, 238210, 238220, 238290, 238310, 238320, 238330, 238340, 238350, 238390, 238910, 238990
233412 Multifamily residential structures 236116, 236117, 237210, 238110, 238120, 238130, 238140, 238150, 238160, 238170, 238190, 238210, 238220, 238290, 238310, 238320, 238330, 238340, 238350, 238390, 238910, 238990
2334A0 Other residential structures 236115, 236116, 236117, 237210, 238110, 238120, 238130, 238140, 238150, 238160, 238170, 238190, 238210, 238220, 238290, 238310, 238320, 238330, 238340, 238350, 238390, 238910, 238990
Manufacturing
321100 Sawmills and wood preservation 321113, 321114
321200 Veneer, plywood and engineered wood product manufacturing
321211, 321212, 321213, 321214, 321219
321910 Millwork 321911, 321912, 321918
3219A0 All other wood product manufacturing 321920, 321991, 321992, 321999
327100 Clay product and refractory manufacturing 327111, 327112, 327113, 327121, 327122, 327123, 327124, 327125
327200 Glass and glass product manufacturing 327211, 327212, 327213, 327215
327310 Cement manufacturing 327310
327320 Ready-mix concrete manufacturing 327320
327330 Concrete pipe, brick and block manufacturing 327331, 327332
327390 Other concrete product manufacturing 327390
327400 Lime and gypsum product manufacturing 327410, 327420
327910 Abrasive product manufacturing 327910
327991 Cut stone and stone product manufacturing 327991
327992 Ground or treated mineral and earth manufacturing 327992
327993 Mineral wool manufacturing 327993
327999 Miscellaneous nonmetallic mineral products 327999
331110 Iron and steel mills and ferroalloy manufacturing 331111, 331112
331200 Steel product manufacturing from purchased steel 331210, 331221, 331222
33131A Alumina refining and primary aluminum production 331311, 331312

2016 U.S. REI Study Methodology 134
BEA Code Description Corresponding NAICS Codes
331314 Secondary smelting and alloying of aluminum 331314
33131B Aluminum product manufacturing from purchased aluminum
331315, 331316, 331319
331411 Primary smelting and refining of copper 331411
331419 Primary smelting and refining of nonferrous metal (except copper and aluminum)
331419
331420 Copper rolling, drawing, extruding and alloying 331421, 331422, 331423
331490 Nonferrous metal (except copper and aluminum) rolling, drawing, extruding and alloying
331491, 331492
331510 Ferrous metal foundries 331511, 331512, 331513
331520 Nonferrous metal foundries 331521, 331522, 331524, 331525, 331528
33211A All other forging, stamping and sintering 332111, 332112, 332117
332114 Custom roll forming 332114
33211B Crown and closure manufacturing and metal stamping 332115, 332116
332200 Cutlery and hand tool manufacturing 332211, 332212, 332213, 332214
332310 Plate work and fabricated structural product manufacturing
332311, 332312, 332313
332320 Ornamental and architectural metal products manufacturing
332321, 332322, 332323
332410 Power boiler and heat exchanger manufacturing 332410
332420 Metal tank (heavy gauge) manufacturing 332420
332430 Metal can, box and other metal container (light gauge) manufacturing
332431, 332439
332500 Hardware manufacturing 332510
332600 Spring and wire product manufacturing 332611, 332612, 332618
332710 Machine shops 332710
332720 Turned product and screw, nut and bolt manufacturing 332721, 332722
332800 Coating, engraving, heat treating and allied activities 332811, 332812, 332813
33291A Valve and fittings other than plumbing 332911, 332912, 332919
332913 Plumbing fixture fitting and trim manufacturing 332913
332991 Ball and roller bearing manufacturing 332991
33299A Ammunition, arms, ordnance and accessories manufacturing
332992, 332993, 332994, 332995
332996 Fabricated pipe and pipe fitting manufacturing 332996
33299B Other fabricated metal manufacturing 332997, 332998, 332999
333111 Farm machinery and equipment manufacturing 333111
333112 Lawn and garden equipment manufacturing 333112
333120 Construction machinery manufacturing 333120
333130 Mining and oil and gas field machinery manufacturing 333131, 333132
33329A Other industrial machinery manufacturing 333210, 333291, 333292, 333293, 333294, 333298
333220 Plastics and rubber industry machinery manufacturing 333220
333295 Semiconductor machinery manufacturing 333295

2016 U.S. REI Study Methodology 135
BEA Code Description Corresponding NAICS Codes
33331A Vending, commercial laundry and other commercial and service industry machinery manufacturing
333311, 333312, 333319
333313 Office machinery manufacturing 333313
333314 Optical instrument and lens manufacturing 333314
333315 Photographic and photocopying equipment manufacturing
333315
33341A Air purification and ventilation equipment manufacturing
333411, 333412
333414 Heating equipment (except warm air furnaces) manufacturing
333414
333415 Air conditioning, refrigeration and warm air heating equipment manufacturing
333415
333511 Industrial mold manufacturing 333511
33351A Metal cutting and forming machine tool manufacturing 333512, 333513
333514 Special tool, die, jig and fixture manufacturing 333514
33351B Cutting and machine tool accessory, rolling mill and other metalworking machinery manufacturing
333515, 333516, 333518
333611 Turbine and turbine generator set units manufacturing 333611
333612 Speed changer, industrial high-speed drive and gear manufacturing
333612
333613 Mechanical power transmission equipment manufacturing
333613
333618 Other engine equipment manufacturing 333618
33391A Pump and pumping equipment manufacturing 333911, 333913
333912 Air and gas compressor manufacturing 333912
333920 Material handling equipment manufacturing 333921, 333922, 333923, 333924
333991 Power-driven hand tool manufacturing 333991
33399A Other general purpose machinery manufacturing 333992, 333997, 333999
333993 Packaging machinery manufacturing 333993
333994 Industrial process furnace and oven manufacturing 333994
33399B Fluid power process machinery 333995, 333996
334111 Electronic computer manufacturing 334111
334112 Computer storage device manufacturing 334112
33411A Computer terminals and other computer peripheral equipment manufacturing
334113, 334119
334210 Telephone apparatus manufacturing 334210
334220 Broadcast and wireless communications equipment 334220
334290 Other communications equipment manufacturing 334290
334300 Audio and video equipment manufacturing 334310
33441A Other electronic component manufacturing 334411, 334412, 334414, 334415, 334416, 334417, 334419
334413 Semiconductor and related device manufacturing 334413
334418 Printed circuit assembly (electronic assembly) manufacturing
334418

2016 U.S. REI Study Methodology 136
BEA Code Description Corresponding NAICS Codes
334510 Electromedical and electrotherapeutic apparatus manufacturing
334510
334511 Search, detection and navigation instruments manufacturing
334511
334512 Automatic environmental control manufacturing 334512
334513 Industrial process variable instruments manufacturing 334513
334514 Totalizing fluid meter and counting device manufacturing
334514
334515 Electricity and signal testing instruments manufacturing
334515
334516 Analytical laboratory instrument manufacturing 334516
334517 Irradiation apparatus manufacturing 334517
33451A Watch, clock and other measuring and controlling device manufacturing
334518, 334519
334610 Manufacturing and reproducing magnetic and optical media
334611, 334612, 334613
335110 Electric lamp bulb and part manufacturing 335110
335120 Lighting fixture manufacturing 335121, 335122, 335129
335210 Small electrical appliance manufacturing 335211, 335212
335221 Household cooking appliance manufacturing 335221
335222 Household refrigerator and home freezer manufacturing
335222
335224 Household laundry equipment manufacturing 335224
335228 Other major household appliance manufacturing 335228
335311 Power, distribution and specialty transformer manufacturing
335311
335312 Motor and generator manufacturing 335312
335313 Switchgear and switchboard apparatus manufacturing 335313
335314 Relay and industrial control manufacturing 335314
335911 Storage battery manufacturing 335911
335912 Primary battery manufacturing 335912
335920 Communication and energy wire and cable manufacturing
335921, 335929
335930 Wiring device manufacturing 335931, 335932
335991 Carbon and graphite product manufacturing 335991
335999 All other miscellaneous electrical equipment and component manufacturing
335999
336111 Automobile manufacturing 336111
336112 Light truck and utility vehicle manufacturing 336112
336120 Heavy duty truck manufacturing 336120
336211 Motor vehicle body manufacturing 336211
336212 Truck trailer manufacturing 336212
336213 Motor home manufacturing 336213
336214 Travel trailer and camper manufacturing 336214

2016 U.S. REI Study Methodology 137
BEA Code Description Corresponding NAICS Codes
336310 Motor vehicle gasoline engine and engine parts manufacturing
336311, 336312
336320 Motor vehicle electrical and electronic equipment manufacturing
336321, 336322
3363A0 Motor vehicle steering, suspension component (except spring) and brake systems manufacturing
336330, 336340
336350 Motor vehicle transmission and power train parts manufacturing
336350
336360 Motor vehicle seating and interior trim manufacturing 336360
336370 Motor vehicle metal stamping 336370
336390 Other motor vehicle parts manufacturing 336391, 336399
336411 Aircraft manufacturing 336411
336412 Aircraft engine and engine parts manufacturing 336412
336413 Other aircraft parts and auxiliary equipment manufacturing
336413
336414 Guided missile and space vehicle manufacturing 336414
33641A Propulsion units and parts for space vehicles and guided missiles
336415, 336419
336500 Railroad rolling stock manufacturing 336510
336611 Ship building and repairing 336611
336612 Boat building 336612
336991 Motorcycle, bicycle and parts manufacturing 336991
336992 Military armored vehicle, tank and tank component manufacturing
336992
336999 All other transportation equipment manufacturing 336999
337110 Wood kitchen cabinet and countertop manufacturing 337110
337121 Upholstered household furniture manufacturing 337121
337122 Nonupholstered wood household furniture manufacturing
337122
33712A Other household nonupholstered furniture 337124, 337125, 337129
337127 Institutional furniture manufacturing 337127
33721A Office furniture and custom architectural woodwork and millwork manufacturing
337211, 337212, 337214
337215 Showcase, partition, shelving and locker manufacturing
337215
337900 Other furniture related product manufacturing 337910, 337920
339112 Surgical and medical instrument manufacturing 339112
339113 Surgical appliance and supplies manufacturing 339113
339114 Dental equipment and supplies manufacturing 339114
339115 Ophthalmic goods manufacturing 339115
339116 Dental laboratories 339116
339910 Jewelry and silverware manufacturing 339911, 339912, 339913, 339914
339920 Sporting and athletic goods manufacturing 339920
339930 Doll, toy and game manufacturing 339931, 339932
339940 Office supplies (except paper) manufacturing 339941, 339942, 339943, 339944

2016 U.S. REI Study Methodology 138
BEA Code Description Corresponding NAICS Codes
339950 Sign manufacturing 339950
339990 All other miscellaneous manufacturing 339991, 339992, 339993, 339994, 339995, 339999
311111 Dog and cat food manufacturing 311111
311119 Other animal food manufacturing 311119
311210 Flour milling and malt manufacturing 311211, 311212, 311213
311221 Wet corn milling 311221
31122A Soybean and other oilseed processing 311222, 311223
311225 Fats and oils refining and blending 311225
311230 Breakfast cereal manufacturing 311230
311300 Sugar and confectionery product manufacturing 311311, 311312, 311313, 311320, 311330, 311340
311410 Frozen food manufacturing 311411, 311412
311420 Fruit and vegetable canning, pickling and drying 311421, 311422, 311423
31151A Fluid milk and butter manufacturing 311511, 311512
311513 Cheese manufacturing 311513
311514 Dry, condensed and evaporated dairy product manufacturing
311514
311520 Ice cream and frozen dessert manufacturing 311520
31161A Animal (except poultry) slaughtering, rendering and processing
311611, 311612, 311613
311615 Poultry processing 311615
311700 Seafood product preparation and packaging 311711, 311712
311810 Bread and bakery product manufacturing 311811, 311812, 311813
3118A0 Cookie, cracker, pasta and tortilla manufacturing 311821, 311822, 311823, 311830
311910 Snack food manufacturing 311911, 311919
311920 Coffee and tea manufacturing 311920
311930 Flavoring syrup and concentrate manufacturing 311930
311940 Seasoning and dressing manufacturing 311941, 311942
311990 All other food manufacturing 311991, 311999
312110 Soft drink and ice manufacturing 312111, 312112, 312113
312120 Breweries 312120
312130 Wineries 312130
312140 Distilleries 312140
312200 Tobacco product manufacturing 312210, 312221, 312229
313100 Fiber, yarn and thread mills 313111, 313112, 313113
313200 Fabric mills 313210, 313221, 313222, 313230, 313241, 313249
313300 Textile and fabric finishing and fabric coating mills 313311, 313312, 313320
314110 Carpet and rug mills 314110
314120 Curtain and linen mills 314121, 314129
314900 Other textile product mills 314911, 314912, 314991, 314992, 314999
315000 Apparel manufacturing 315111, 315119, 315191, 315192, 315211, 315212, 315221, 315222, 315223, 315224,

2016 U.S. REI Study Methodology 139
BEA Code Description Corresponding NAICS Codes
315225, 315228, 315231, 315232, 315233, 315234, 315239, 315291, 315292, 315299, 315991, 315992, 315993, 315999
316000 Leather and allied product manufacturing 316110, 316211, 316212, 316213, 316214, 316219, 316991, 316992, 316993, 316999
322110 Pulp mills 322110
322120 Paper mills 322121, 322122
322130 Paperboard mills 322130
322210 Paperboard container manufacturing 322211, 322212, 322213, 322214, 322215
322220 Paper bag and coated and treated paper manufacturing
322221, 322222, 322223, 322224, 322225, 322226
322230 Stationery product manufacturing 322231, 322232, 322233
322291 Sanitary paper product manufacturing 322291
322299 All other converted paper product manufacturing 322299
323110 Printing 323110, 323111, 323112, 323113, 323114, 323115, 323116, 323117, 323118, 323119
323120 Support activities for printing 323121, 323122
324110 Petroleum refineries 324110
324121 Asphalt paving mixture and block manufacturing 324121
324122 Asphalt shingle and coating materials manufacturing 324122
324190 Other petroleum and coal products manufacturing 324191, 324199
325110 Petrochemical manufacturing 325110
325120 Industrial gas manufacturing 325120
325130 Synthetic dye and pigment manufacturing 325131, 325132
325180 Other basic inorganic chemical manufacturing 325181, 325182, 325188
325190 Other basic organic chemical manufacturing 325191, 325192, 325193, 325199
325211 Plastics material and resin manufacturing 325211
3252A0 Synthetic rubber and artificial and synthetic fibers and filaments manufacturing
325212, 325221, 325222
325310 Fertilizer manufacturing 325311, 325312, 325314
325320 Pesticide and other agricultural chemical manufacturing
325320
325411 Medicinal and botanical manufacturing 325411
325412 Pharmaceutical preparation manufacturing 325412
325413 In-vitro diagnostic substance manufacturing 325413
325414 Biological product (except diagnostic) manufacturing 325414
325510 Paint and coating manufacturing 325510
325520 Adhesive manufacturing 325520
325610 Soap and cleaning compound manufacturing 325611, 325612, 325613
325620 Toilet preparation manufacturing 325620
325910 Printing ink manufacturing 325910
3259A0 All other chemical product and preparation manufacturing
325920, 325991, 325992, 325998

2016 U.S. REI Study Methodology 140
BEA Code Description Corresponding NAICS Codes
326110 Plastics packaging materials and unlaminated film and sheet manufacturing
326111, 326112, 326113
326120 Plastics pipe, pipe fitting and unlaminated profile shape manufacturing
326121, 326122
326130 Laminated plastics plate, sheet (except packaging) and shape manufacturing
326130
326140 Polystyrene foam product manufacturing 326140
326150 Urethane and other foam product (except polystyrene) manufacturing
326150
326160 Plastics bottle manufacturing 326160
326190 Other plastics product manufacturing 326191, 326192, 326199
326210 Tire manufacturing 326211, 326212
326220 Rubber and plastics hoses and belting manufacturing 326220
326290 Other rubber product manufacturing 326291, 326299
Wholesale and Retail Trade
420000 Wholesale trade 423110, 423120, 423130, 423140, 423210, 423220, 423310, 423320, 423330, 423390, 423410, 423420, 423430, 423440, 423450, 423460, 423490, 423510, 423520, 423610, 423620, 423690, 423710, 423720, 423730, 423740, 423810, 423820, 423830, 423840, 423850, 423860, 423910, 423920, 423930, 423940, 423990, 424110, 424120, 424130, 424210, 424310, 424320, 424330, 424340, 424410, 424420, 424430, 424440, 424450, 424460, 424470, 424480, 424490, 424510, 424520, 424590, 424610, 424690, 424710, 424720, 424810, 424820, 424910, 424920, 424930, 424940, 424950, 424990, 425110, 425120
441000 Motor vehicle and parts dealers 441110, 441120, 441210, 441221, 441222, 441229, 441310, 441320
445000 Food and beverage stores 445110, 445120, 445210, 445220, 445230, 445291, 445292, 445299, 445310
452000 General merchandise stores 452111, 452112, 452910, 452990
4A0000 Other retail 442110, 442210, 442291, 442299, 443111, 443112, 443120, 443130, 444110, 444120, 444130, 444190, 444210, 444220, 446110, 446120, 446130, 446191, 446199, 447110, 447190, 448110, 448120, 448130, 448140, 448150, 448190, 448210, 448310, 448320, 451110, 451120, 451130, 451140, 451211, 451212, 451220, 453110, 453210, 453220, 453310, 453910, 453920, 453930, 453991, 453998, 454111, 454112, 454113, 454210, 454311, 454312, 454319, 454390
Transportation and Warehousing
481000 Air transportation 481111, 481112, 481211, 481212, 481219
482000 Rail transportation 482111, 482112

2016 U.S. REI Study Methodology 141
BEA Code Description Corresponding NAICS Codes
483000 Water transportation 483111, 483112, 483113, 483114, 483211, 483212
484000 Truck transportation 484110, 484121, 484122, 484210, 484220, 484230
485000 Transit and ground passenger transportation 485111, 485112, 485113, 485119, 485210, 485310, 485320, 485410, 485510, 485991, 485999
486000 Pipeline transportation 486110, 486210, 486910, 486990
48A000 Scenic and sightseeing transportation and support activities for transportation
487110, 487210, 487990, 488111, 488119, 488190, 488210, 488310, 488320, 488330, 488390, 488410, 488490, 488510, 488991, 488999
492000 Couriers and messengers 492110, 492210
493000 Warehousing and storage 493110, 493120, 493130, 493190
Services (except government)
511110 Newspaper publishers 511110
511120 Periodical publishers 511120
511130 Book publishers 511130
5111A0 Directory, mailing list and other publishers 511140, 511191, 511199
511200 Software publishers 511210
512100 Motion picture and video industries 512110, 512120, 512131, 512132, 512191, 512199
512200 Sound recording industries 512210, 512220, 512230, 512240, 512290
515100 Radio and television broadcasting 515111, 515112, 515120
515200 Cable and other subscription programming 515210
517110 Wired telecommunications carriers 517110
517210 Wireless telecommunications carriers (except satellite) 517210
517A00 Satellite, telecommunications resellers and all other telecommunications
517410, 517911, 517919
518200 Data processing, hosting and related services 518210
5191A0 News syndicates, libraries, archives and all other information services
519110, 519120, 519190
519130 Internet publishing and broadcasting and Web search portals
519130
52A000 Monetary authorities and depository credit intermediation
521110, 522110, 522120, 522130, 522190
522A00 Nondepository credit intermediation and related activities
522210, 522220, 522291, 522292, 522293, 522294, 522298, 522310, 522320, 522390
523A00 Securities and commodity contracts intermediation and brokerage
523110, 523120, 523130, 523140, 523210
523900 Other financial investment activities 523910, 523920, 523930, 523991, 523999
524100 Insurance carriers 524113, 524114, 524126, 524127, 524128, 524130
524200 Insurance agencies, brokerages and related activities 524210, 524291, 524292, 524298
525000 Funds, trusts and other financial vehicles 525110, 525120, 525190, 525910, 525920, 525990

2016 U.S. REI Study Methodology 142
BEA Code Description Corresponding NAICS Codes
5310HS Housing 531210, 531320, 531390
531ORE Other real estate 531210, 531320, 531390
532100 Automotive equipment rental and leasing 532111, 532112, 532120
532A00 Consumer goods and general rental centers 532210, 532220, 532230, 532291, 532292, 532299, 532310
532400 Commercial and industrial machinery and equipment rental and leasing
532411, 532412, 532420, 532490
533000 Lessors of nonfinancial intangible assets 533110
541100 Legal services 541110, 541120, 541191, 541199
541511 Custom computer programming services 541511
541512 Computer systems design services 541512
54151A Other computer related services, including facilities management
541513, 541519
541200 Accounting, tax preparation, bookkeeping and payroll services
541211, 541213, 541214, 541219
541300 Architectural, engineering and related services 541310, 541320, 541330, 541340, 541350, 541360, 541370, 541380
541400 Specialized design services 541410, 541420, 541430, 541490
541610 Management consulting services 541611, 541612, 541613, 541614, 541618
5416A0 Environmental and other technical consulting services 541620, 541690
541700 Scientific research and development services 541711, 541712, 541720
541800 Advertising, public relations and related services 541810, 541820, 541830, 541840, 541850, 541860, 541870, 541890
5419A0 Marketing research and all other miscellaneous professional, scientific and technical services
541910, 541930, 541990
541920 Photographic services 541921, 541922
541940 Veterinary services 541940
550000 Management of companies and enterprises 551111, 551112, 551114
561100 Office administrative services 561110
561200 Facilities support services 561210
561300 Employment services 561311, 561312, 561320, 561330
561400 Business support services 561410, 561421, 561422, 561431, 561439, 561440, 561450, 561491, 561492, 561499
561500 Travel arrangement and reservation services 561510, 561520, 561591, 561599
561600 Investigation and security services 561611, 561612, 561613, 561621, 561622
561700 Services to buildings and dwellings 561710, 561720, 561730, 561740, 561790
561900 Other support services 561910, 561920, 561990
562000 Waste management and remediation services 562111, 562112, 562119, 562211, 562212, 562213, 562219, 562910, 562920, 562991, 562998
611100 Elementary and secondary schools 611110
611A00 Junior colleges, colleges, universities and professional schools
611210, 611310

2016 U.S. REI Study Methodology 143
BEA Code Description Corresponding NAICS Codes
611B00 Other educational services 611410, 611420, 611430, 611511, 611512, 611513, 611519, 611610, 611620, 611630, 611691, 611692, 611699, 611710
621100 Offices of physicians 621111, 621112
621200 Offices of dentists 621210
621300 Offices of other health practitioners 621310, 621320, 621330, 621340, 621391, 621399
621400 Outpatient care centers 621410, 621420, 621491, 621492, 621493, 621498
621500 Medical and diagnostic laboratories 621511, 621512
621600 Home health care services 621610
621900 Other ambulatory health care services 621910, 621991, 621999
622000 Hospitals 622110, 622210, 622310
623A00 Nursing and community care facilities 623110, 623311, 623312
623B00 Residential mental retardation, mental health, substance abuse and other facilities
623210, 623220, 623990
624100 Individual and family services 624110, 624120, 624190
624A00 Community food, housing and other relief services, including rehabilitation services
624210, 624221, 624229, 624230, 624310
624400 Child day care services 624410
711100 Performing arts companies 711110, 711120, 711130, 711190
711200 Spectator sports 711211, 711212, 711219
711A00 Promoters of performing arts and sports and agents for public figures
711310, 711320, 711410
711500 Independent artists, writers and performers 711510
712000 Museums, historical sites, zoos and parks 712110, 712120, 712130, 712190
713100 Amusement parks and arcades 713110, 713120
713200 Gambling industries (except casino hotels) 713210, 713290
713900 Other amusement and recreation industries 713910, 713920, 713930, 713940, 713950, 713990
721000 Accommodation 721110, 721120, 721191, 721199, 721211, 721214, 721310
722110 Full-service restaurants 722110
722211 Limited-service restaurants 722211
722A00 All other food and drinking places 722212, 722213, 722310, 722320, 722330, 722410
811100 Automotive repair and maintenance 811111, 811112, 811113, 811118, 811121, 811122, 811191, 811192, 811198
811200 Electronic and precision equipment repair and maintenance
811211, 811212, 811213, 811219
811300 Commercial and industrial machinery and equipment repair and maintenance
811310
811400 Personal and household goods repair and maintenance
811411, 811412, 811420, 811430, 811490
812100 Personal care services 812111, 812112, 812113, 812191, 812199
812200 Death care services 812210, 812220

2016 U.S. REI Study Methodology 144
BEA Code Description Corresponding NAICS Codes
812300 Dry-cleaning and laundry services 812310, 812320, 812331, 812332
812900 Other personal services 812910, 812921, 812922, 812930, 812990
813100 Religious organizations 813110
813A00 Grantmaking, giving and social advocacy organizations
813211, 813212, 813219, 813311, 813312, 813319
813B00 Civic, social, professional and similar organizations 813410, 813910, 813920, 813930, 813940, 813990
Government
S00500 Federal general government (defense) NAICS not used to translate source data
S00600 Federal general government (nondefense) NAICS not used to translate source data
491000 Postal service NAICS not used to translate source data
S00101 Federal electric utilities NAICS not used to translate source data
S00102 Other federal government enterprises NAICS not used to translate source data
S00700 State and local general government NAICS not used to translate source data
S00201 State and local government passenger transit NAICS not used to translate source data
S00202 State and local government electric utilities NAICS not used to translate source data
S00203 Other state and local government enterprises NAICS not used to translate source data
12.3. Occupational Profiles Estimates of the occupational profiles within different BEA categories were derived based on Bureau of Labor Statistics 2007 Occupational Employment Statistics (OES) (BLS, 2007). OES data are available at a 3-digit NAICS resolution. To incorporate occupational data into the WIO model, it was assumed that occupational profiles are consistent across all of the economic sectors grouped within the same 3-digit NAICS category. Using this simplifying assumption, occupational profiles were developed using the following approach:
• The twenty-two high-level occupational categories used in the OES were grouped into eight categories, as summarized in Table 20.
• Occupational profiles were created for each 3-digit NAICS category based on OES statistics. • The profiles were applied to estimate the occupational distribution of total employment within
each 6-digit NAICS category (or by BEA category for public administration). • The profiles were applied to estimate the distribution of wages, by occupation, within each 6-
digit NAICS category, and the results were calibrated to agree with total wage data. Table 20: Correspondence between Occupational Categories Used in WIO Model and BLS OES
Grouped Category BLS Occupational Category
Management (Mgmt) 11: Management occupations
Business and legal (B&L) 13: Business and financial operations occupations
23: Legal occupations

2016 U.S. REI Study Methodology 145
Grouped Category BLS Occupational Category
Science, technology and engineering (STEM)
19: Life, physical and social science occupations
15: Computer and mathematical occupations
17: Architecture and engineering occupations
Sales and office administration (S&A) 41: Sales and related occupations
43: Office and administrative support occupations
Production, building services and transportation (P&T)
33: Protective service occupations
37: Building and grounds cleaning and maintenance occupations
45: Farming, fishing and forestry occupations
47: Construction and extraction occupations
49: Installation, maintenance and repair occupations
51: Production occupations
53: Transportation and material moving occupations
Education, healthcare and other services (EH&O)
25: Education, training and library occupations
27: Arts, design, entertainment, sports and media occupations
29: Healthcare practitioners and technical occupations
31: Healthcare support occupations
39: Personal care and service occupations
35: Food preparation and serving related occupations
21: Community and social services occupations
12.4. Corporate Taxes
Corporate taxes paid to federal, state and local governments were estimated using data from the 2007 U.S. Statistics of Income (SOI) (IRS, 2007), Table 6, Returns of Active Corporations. State and local taxes were estimated as reported taxes paid by corporations less foreign tax credit. Federal taxes were estimated as the income tax paid after credits. Where tax data were only available at a more aggregated resolution than the 6-digit NAICS, total taxes were allocated to sectors using total receipts data from the Agricultural Census or SUSB, as appropriate.
12.5. Summary of Employment and Tax Revenue Data Table 21 summarizes the employment, wage, occupational and tax revenue data compiled for integration with the WIO model, rolled-up to the major economic sectors.

2016 U.S. REI Study Methodology 146
Table 21: Summary of Employment and Tax Revenue Data Used in the WIO Model, U.S. 2007
Sector* Total
Employment
Total Wages
($ million)
Mgmt B&L STEM S&A P&T EH&O Total Tax Payments
($ million)
Crop and animal production
5,973,955 $46,235 2% 0% 1% 6% 90% 2% $2,916
Forestry, fishing and agricultural support services
172,105 $5,564 2% 0% 1% 6% 90% 1% $976
Mining, quarrying, oil and gas extraction, utilities and construction
8,586,544 $427,574 5% 3% 3% 12% 77% 0% $80,049
Manufacturing 13,275,432 $624,422 5% 3% 8% 13% 70% 1% $158,152
Wholesale and retail trade
20,057,919 $668,528 3% 2% 2% 64% 23% 6% $140,625
Transportation and warehousing
4,351,460 $173,908 3% 2% 1% 22% 69% 4% $28,540
Services (except government)
72,006,244 $3,063,248 5% 7% 6% 25% 17% 40% $342,034
Government 22,116,019 $942,997 5% 13% 8% 19% 37% 18% ---***
Total 146,539,678 $5,952,479 5% 6% 6% 27% 34% 23% $753,296
* See Table 20 for industries included in each sector.
** See Table 21 for key to category abbreviations and occupations included in each category.
*** Does not include inter-governmental transfers
**** Occupational Profile** (% employment by category)

2016 U.S. REI Study Methodology 147
13. Appendix G – Relevant input-output sectors—initial screening (2007 benchmark table classification)
Initial screening of the 2007 benchmark input-output table of the US Bureau of Economic Analysis (BEA) identified sufficient data to focus on following sectors.
Waste, waste management and recycling
562000 Waste management and remediation services
S00401 Scrap
S00402 Used and secondhand goods
Paper
322110 Pulp mills
322120 Paper mills
322130 Paperboard mills
322210 Paperboard container manufacturing
322220 Paper bag and coated and treated paper manufacturing
322230 Stationery product manufacturing
322291 Sanitary paper product manufacturing
322299 All other converted paper product manufacturing
Plastics and Rubber
325211 Plastics material and resin manufacturing
3252A0 Synthetic rubber and artificial and synthetic fibers and filaments manufacturing
326110 Plastics packaging materials and unlaminated film and sheet manufacturing
326120 Plastics pipe, pipe fitting and unlaminated profile shape manufacturing
326130 Laminated plastics plate, sheet (except packaging) and shape manufacturing
326140 Polystyrene foam product manufacturing
326150 Urethane and other foam product (except polystyrene) manufacturing
326160 Plastics bottle manufacturing
326190 Other plastics product manufacturing
326210 Tire manufacturing
326220 Rubber and plastics hoses and belting manufacturing

2016 U.S. REI Study Methodology 148
326290 Other rubber product manufacturing
Ferrous and non-ferrous metals
331110 Iron and steel mills and ferroalloy manufacturing
331200 Steel product manufacturing from purchased steel
33131A Alumina refining and primary aluminum production
33131B Aluminum product manufacturing from purchased aluminum
331411 Primary smelting and refining of copper
331419 Primary smelting and refining of nonferrous metal (except copper and aluminum)
331420 Copper rolling, drawing, extruding and alloying
331490 Nonferrous metal (except copper and aluminum) rolling, drawing, extruding and alloying
331510 Ferrous metal foundries
331520 Nonferrous metal foundries
33211A All other forging, stamping and sintering
332420 Metal tank (heavy gauge) manufacturing
332430 Metal can, box and other metal container (light gauge) manufacturing
Glass
327200 Glass and glass product manufacturing
Food and organic
622000 Hospitals
623A00 Nursing and community care facilities
623B00 Residential mental retardation, mental health, substance abuse and other facilities
624100 Individual and family services
624A00 Community food, housing and other relief services, including rehabilitation services
624400 Child day care services
721000 Accommodation
722110 Full-service restaurants
722211 Limited-service restaurants
722A00 All other food and drinking places

2016 U.S. REI Study Methodology 149
Construction and demolition
233210 Health care structures
233230 Manufacturing structures
233240 Power and communication structures
233262 Educational and vocational structures
233293 Highways and streets
2332A0 Commercial structures, including farm structures
2332B0 Other nonresidential structures
233411 Single-family residential structures
233412 Multifamily residential structures
2334A0 Other residential structures
Food and organics
112A00 Animal production, except cattle and poultry and eggs
221100 Electric power generation, transmission and distribution
31161A Animal (except poultry) slaughtering, rendering and processing
325310 Fertilizer manufacturing
561700 Services to buildings and dwellings
624A00 Community food, housing and other relief services, including rehabilitation services

2016 U.S. REI Study Methodology 150
14. Appendix H – Standard Supply and Use Calculus This appendix describes the standard supply and use framework drawn largely from Konijn (1994), and Suh et al. (2010).
For the sake of convenience, let both V and U be square matrices.26 Then, the yearly product output, q, and the yearly process output, g, are calculated by:
(1) iVq ′= ,
And:
(2) Vig = ,
Respectively, where the prime ( ′ ) denotes transposition of a vector or a matrix, and i is a summation column vector with relevant dimension containing only 1.
The primary factor input coefficient matrix, E, which shows the amount of primary factor inputs to a sector/activity per unit of its output is calculated such that:
(3) 1ˆ −= gBE .
Industry-technology model
Suppose that the inputs and outputs of a multi-output sector/activity are assigned over its multiple products based on the amount of output of each product in a common unit, such as U.S. dollar or kg, regardless of whether they are the primary, secondary or byproduct. This assumption is referred to as the industry-technology assumption. Under this assumption, the product-by-product symmetric direct requirement coefficient matrix, AI, is calculated by:
(4) 11 ˆˆ −−= qVgUAI .
26 The commodity-technology model and the byproduct-technology model require this assumption. For the industry technology model, this assumption is not needed.

2016 U.S. REI Study Methodology 151
The corresponding primary factor-by-product coefficient matrix, EI, is calculated by:
(5) 11
I ˆˆ −−= qVgBE .
The industry-by-industry table under the industry technology model can be derived by reversing the order of
the right-hand-side in (4) (11 ˆˆ −− gUqV ), which is the approach implicitly followed in the 2001 WIO model
(Nakamura and Kondo 2002).
Commodity-technology model
Suppose that each product has the same amount of input requirements and primary factor inputs in producing one unit of a product, regardless of the industry where it is produced. This assumption is known as the commodity-technology assumption in the field of input-output economics. Under this assumption, the symmetric, product-by-product direct requirement coefficient matrix is calculated by:
(6) 1C
−′= VUA .
Likewise, the primary factor input by product coefficient matrix is calculated by:
(7) 1
C−′= VBE .
The industry-by-industry version of commodity-technology assumption is not intuitively meaningful, and therefore is not treated here.
Byproduct-technology model27
Suppose that the production of a non-primary product by each sector/activity is fully dependent upon the production of the primary product. In other words, demand on non-primary products of a sector/activity does not directly affect the production schedule of the process, but produced non-primary products can be seen as consumed within the sector/activity. This assumption is referred to as the byproduct-technology assumption. In input-output convention, by-products are treated as negative inputs to the process. The direct requirement coefficient matrix and primary factor input coefficient matrix using the byproduct-technology model are
27 This method is often called “Stone’s method” (Stone, 1961; Konijn, 1994).

2016 U.S. REI Study Methodology 152
determined by:
(8) 1
B )( −′−= dod VVUA ,
and
(9) 1
B−= dBVE ,
Respectively, where subscript od denotes off-diagonal and d denotes diagonal elements of corresponding matrices.
Mixed-technology model
More than one model among the three described earlier can be applied to the same system by partitioning the system into several subsystems. In that case, it is referred to as ‘mixed-technology model’, which combines more than one model described earlier in this appendix.

2016 U.S. REI Study Methodology 153
15. Appendix I – Prior REI Studies, Sources and Measures 15.1. Prior REI Studies
Recognizing the potential economic contributions of recycling activities, early research in the 1990s focused on key economic sectors including collection, processing, manufacturing and remanufacturing enterprises engaged in recycling activities. Studies also explored the economic contributions of the industry in terms of its effect on support industries (e.g., recycling equipment manufacturers), spending in the economy by wage-earners, government tax revenue and avoided disposal costs. There also were attempts to quantify trends in materials recovery and the incremental benefits of state policies designed to increase recycling rates.
In 1997, EPA commissioned the Northeast Recycling Council (NERC) to review existing state and regional studies and recommend a consistent methodology for quantifying the economic contributions of recycling in the United States. NERC recommended a data collection and analytical strategy, including economic input-output modeling, to quantify the direct, indirect and induced economic activity attributable to recycling (NERC, 1998). These recommendations formed the basis for regional and state REI studies and the 2001 U.S. Recycling Economic Information Study.
The 2001 national REI study was led by the National Recycling Coalition (NRC) and involved the joint efforts of EPA, 16 states and NERC. The study examined economic activity associated with 26 business categories directly engaged in recycling, reuse and/or remanufacturing and four additional business categories involved in providing support to the recycling industry. The study collected information on the number of establishments, employment, annual payroll, annual receipts and annual throughput (i.e. tons of recovered materials collected or processed) from public data sources, industry surveys and industry experts. The study analyzed the data and used input-output economic modeling to estimate the direct, indirect and induced economic activity and government tax revenues attributable to recycling in the U.S.
The 2001 national REI study estimated in 1997 that:
• More than 56,000 recycling, reuse and manufacturing establishments were operating in the U.S., employing approximately 1.1 million people, producing an annual payroll of $37 billion and generating annual revenues of approximately $236 billion.
• The recycling sector was supporting an additional 1.4 million jobs, annual payroll of $52 billion and annual receipts of $146 billion in businesses that were providing services to the sector.
• Household spending associated with individuals working in recycling and supporting industries induced additional economic activity supporting 1.5 million jobs, $41 billion in annual payroll and $146 billion in annual receipts.
• Government tax revenue of $46 billion per year was being generated from federal, state and local taxes linked to direct, indirect and induced economic activity associated with recycling.
• Overall, that study estimated that 3.1% of the paid jobs in the U.S. and 2.7% of the gross domestic product (GDP) could be linked to direct, indirect and induced economic activity associated with recycling.
The 2001 national REI study recognized the limitations of the approach, including limitations in data availability and the economic modeling methodology. The study estimated that induced economic activity and government tax revenues could be over-estimated by as much as 15% due to methodological limitations (R.W. Beck/NRC, 2001).

2016 U.S. REI Study Methodology 154
During this same period, and in conjunction with the national effort, NERC completed an REI study for a 10-state region in the Northeast, which included state-level analyses for Delaware, Massachusetts, New Jersey, New York, Pennsylvania and Vermont (R.W. Beck/NERC, 2000). Ten other states also completed studies using the same or similar methodologies during this period: California, Florida, Illinois, Indiana, Iowa, Minnesota, Missouri, Nebraska, Ohio and Wisconsin. (R.W. Beck/NRC, 2001).
15.2. Other Studies of Recycling Economic Activity Other studies of the economic contributions of recycling in the U.S. have offered refinements to the 2001 REI methodology, used different market boundaries and considered different economic measures. Further, these studies have addressed prospective “what if” questions to support policy analysis and focus on market development. The following section reviews key, representative examples of these studies.
15.3. Alternative Boundaries, Data Sources and Measures Since the 2001 national REI study, some states have conducted similar, but more narrowly focused analyses of the economic contributions of recycling, reuse and/or remanufacturing. For example:
In 2010 and 2011, the U.S. Bureau of Labor Statistics (BLS) conducted the Green Goods and Services (GGS) survey to measure jobs in businesses that produced goods and provided services that benefit the environment or conserve natural resources. The BLS survey sampled 120,000 establishments in industries identified as potential producers of GGS. BLS estimated employment associated with different types of GGS, including employment associated with “recycling and waste reduction” based on survey data identifying specific types of GGS produced and estimated percentages worksite sales and employment associated with GGS.28
The North Carolina Recycling Business Assistance Center (RBAC) conducts periodic analyses of employment associated with North Carolina’s recycling industry. Employment estimates are based on a survey of businesses engaged in recycling activity, supplemented with data from the North Carolina Employment Security Commission. The analyses address direct employment only. North Carolina has conducted this analysis in 1994, 2000, 2004, 2008, 2010 and 2013 (RBAC, 2013).
In 2006, researchers at the College of Charleston conducted a study of economic activity associated with the recycling industry in South Carolina. The study followed a similar approach as prior REI studies, but focused on a smaller number of industry categories. The researchers used survey data and regional input-output modeling (IMPLAN) to estimate direct, indirect and induced economic activity in terms of jobs, wages, total output and contribution to state tax revenue. The results of the 2006 study were updated in 2014 (Hefner, 2014).
In 2007, researchers at the College of William and Mary conducted a study of the economic benefits of recycling in Virginia. The study focused on six industrial categories: recyclable material merchant wholesalers, materials recovery facilities, paper mills, industrial building construction, specialized long-distance trucking and solid waste collection. The study used data from the Institute of Scrap Recycling Industries (ISRI) and
28 For a description of the BLS program, including technical notes and sample survey forms, as well as results of the 2010 and 2011 surveys, see http://www.bls.gov/ggs/.

2016 U.S. REI Study Methodology 155
state MSW statistics to estimate recycling-related activity for the manufacturing and transportation sectors (Miller, 2007).
The Connecticut Resources Recovery Authority (CRRA) sponsored a study, published in 2012, that estimated the direct, indirect and induced economic activity associated with recovered materials collection and hauling, materials recovery and recyclable materials wholesaling. Researchers used the regional input-out modeling approach (IMPLAN) and economic activity was measured in terms of jobs, total output and total value added. Reuse and remanufacturing activities and contributions to state and local tax revenues were not included in the analysis (CERC, 2012).
15.4. Use of Economic Impact Methods to Study Policy Alternatives Other studies have incorporated the results of the 2001 national REI and similar studies to quantitatively explore how expansion in recycling industries could affect the economy. These studies have generally been used to inform waste management policy alternatives and promote policies designed to increase recycling rates.
Examples of these studies include:
Researchers at the University of California-Berkeley combined material flows analysis with economic data, using a modeling approach similar to the REI methodology, to estimate the economic impacts of waste diversion in California, including direct, indirect and induced impacts. The study also estimated the economic impacts of the waste disposal industry and developed a basis for analyzing the incremental impacts of diverting (in terms of employment, wages, value- added and total sales) of diverting versus disposing of waste. The study differed from the REI approach in terms of process scope (recycling only) and methods for allocating economic activity within industries that use both recycled and virgin materials (Goldman and Ogishi, 2001).
The Illinois state-wide REI study included a supplemental analysis of the potential incremental economic impacts that could be realized by increasing recycling rates to 35% and 50% and by banning electronics from landfills. The additional analysis used a linear extrapolation to estimate the net increase in activity of recovered materials collection and processing activities. Estimates of the impacts on manufacturing processes considered not only increased activity related to recycled materials but also displacement of economic activity associated with virgin materials (R.W. Beck, Inc., 2001).
NERC recommendations for the REI study methodology were based on part on a methodology used in a 1997 study of the economic impacts of recycling in Iowa commissioned by Recycle Iowa (NERC, 1998). Additional state-wide REI studies were completed in 2001 and 2007. The Iowa REI studies include detailed supplemental commodity flow analyses that support more in-depth understanding of drivers for economic activity associated with recycling over time, with implications for policy analysis and market development (R.W. Beck, 2001).
The Tellus Institute analyzed the potential economic impact of increasing MSW and construction and demolition waste diversion rates from 33% and 37%, respectively, to 75% (both streams) by 2030. Relative to the base case, Tellus estimated that the increased diversion rates could generate an addition 1.1 million jobs in the U.S. (Tellus Institute, 2011).
15.5. International Studies The European Commission identified greater resource efficiency, including transition to a more circular economy that involves “closing the loop” through greater reuse and recycling, as a keys to achieving the

2016 U.S. REI Study Methodology 156
European Union’s job and growth priorities (European Commission, 2015). A number of studies have attempted to measure the economic impacts of improved resource efficiency in Europe (Ecorys 2015). Studies with a similar objectives and scope as the U.S. REI studies include:
• Ecorys and IDEA (2009) used Eurostat data on Environmental Protection Expenditures (EPEs) to estimate direct employment associated with ten economic sectors engaged in pollution or resource management. The study used average wage and other information to estimate job activity based on sector-specific EPEs. Eurostat EPE data were not available for the recycling sector, so proxy data were used to estimate recycling jobs. In its update to the study, Ecorys recognized that the potential for double-counting introduced by this approach and added assumptions to correct for this problem. The updated study estimated that approximately 0.11% of employment in the EU-27 member states in 2008 could be attributed to recycling (Ecorys, 2012).
• GHK et al. (2007) used input-output tables and multipliers to estimate the direct, indirect and induced employment associated with recycling in Europe, using an approach comparable to the U.S. REI studies. The GHK study estimated that direct employment in recycling activities accounted for approximately 0.09% of employment in the EU-27 member states in 2000 and that indirect and induced employment associated with recycling accounted for 0.12% and 0.06% of jobs during the same period, respectively. A re-analysis of the GHK study in 2015 indicated similar but slightly lower contributions of recycling to the European economy based on 2007 data (Ecorys, 2012).
• Morgan and Mitchell (2015) conducted a prospective analysis of the impacts of transformation to a circular economy on job growth, types of jobs (in terms of skills required) and potential job displacement. Data included in the study suggested that used closed and open loop recycling generally involve a greater proportion of low skilled labor relative to other “green jobs” included in the analysis and that remanufacturing generally involves a higher skill mix.
The first national-scale WIO model was developed in Japan to assess the impact of alternative waste management policies on waste incineration performance (Nakamura and Kondo, 2002). The model was developed by augmenting national economic input-output tables to better represent flows of wastes, recyclable and recycled materials and products through waste management and recycling sectors (Nakamura and Kondo, 2002; Kondo and Nakamura, 2004; Takase at el., 2005; Nakamura et al., 2007; Nakamura and Kondo, 2009). Suh et al. (2010) observed that Nakamura and Kondo framework is a special case of standard supply and use calculus and could be extended to other practical applications in input-output economics. Lenzen and Reynolds (2014) confirmed this observation and illustrated the practical uses of the WIO framework using economic and waste data for the Australian economy.
15.6. Trends in Recycling, Reuse and Remanufacturing The size and structure of the recycling industry has changed significantly since the 2001 national REI study which was primarily 1997 data while this effort is primarily 2007 data. These changes have occurred in response to changes in several factors, including:
• Policies and economic considerations affecting material recovery rates;
• Consumer demand for greener products;
• Product formulation and engineering;
• Business models and product stewardship;

2016 U.S. REI Study Methodology 157
• Recycling technology; and
• Commodity exchange mechanisms.
These changes in turn affect the direct, indirect and induced economic activity associated with recycling including employment, wages and total economic output.