advancing process development for antibody-drug conjugates
TRANSCRIPT

Advancing process development for antibody-drug
conjugates
Incorporation of high-throughput, analytical,
and digital tools
zur Erlangung des akademischen Grades eines
DOKTORS DER INGENIEURWISSENSCHAFTEN (DR.-ING.)
von der KIT-Fakultät für Chemieingenieurwesen und Verfahrenstechnik des
Karlsruher Instituts für Technologie (KIT)
genehmigte
DISSERTATION
von
Dipl.-Ing. Sebastian Andris
aus Herrenberg
Erstgutachter: Prof. Dr. Jürgen Hubbuch
Zweitgutachter: Prof. Dr.-Ing. Michel Eppink
Tag der mündlichen Prüfung: 14.05.2020


i
Acknowledgments
This thesis would not have been possible without the support of a number of
people. In the following, I would like to thank them for their different
contributions.
First of all, I would like to thank Prof. Jürgen Hubbuch for giving me the
opportunity of doing my PhD in this fascinating field of research within a group
of talented and motivated people. He always gave me the right amount of
guidance, while leaving a lot of space for developing own ideas.
I also would like to thank Prof. Michel Eppink for taking the time of being the
second advisor, his interest in my work, and his positive attitude.
Prof. Hubbuch and Prof. Eppink further made it possible that my defense could
be held despite Corona restrictions as the first defense in the faculty partly
done via video conferencing.
My work was partially funded by MedImmune, LLC (now AstraZeneca). I
would like to express my gratitude, in particular to Michaela Wendeler and
Xiangyang Wang, for believing in this collaboration. Thank you, Michaela, for
all your efforts and many fruitful discussions.
One publication resulted from a collaboration with my colleague Matthias
Rüdt. I always enjoyed working together and I am very grateful you shared
your knowledge and experience with me.
Next, I want to thank my office mates Philipp Vormittag and Steffen Großhans.
Without your input and the perfect atmosphere in 201, completing this thesis
would have been a lot harder and way less fun.
My students Jonas Rogalla, Dennis Weber, Jonathan Seidel, Christopher Berg,
Tom Huck, and Jan Kehrbaum did a great job in and out of the lab and I am
thankful for their hard work and their ideas.
All my colleagues from MAB, current and former, have contributed to making
my time here as memorable as it was. I am happy to have shared with you all
the great cakes, long days in the lab, lively discussions, creative events,
awesome conferences, amazing defense parties, nice seminars, and the first-
time win of the legendary Kaktus Cup.
My roommates, old and new, were always there, when I needed to clear my
head after a long day at the office or as an audience for a rehearsal talk. My

ii
brothers and my friends always took care of the necessary diversion and had
an open ear for my troubles.
Finally, and most importantly, I am deeply thankful to my parents for their
unconditional support in this and all my other endeavors. You truly are the
best.
Sebastian Andris
Karlsruhe, 03.06.2020
„Eigentlich weiß man nur, wenn man wenig weiß;
mit dem Wissen wächst der Zweifel.“
Johann Wolfgang von Goethe

iii
Abstract
Antibody-drug conjugates (ADCs) have been designed as a combination of
monoclonal antibody (mAb) therapy and chemotherapy. From this fact, they
draw their potential of uniting the advantages of both strategies in one
molecule. mAbs have the ability to specifically bind their target antigen, thus
focusing the effect on the target site of action. Due to their size and other
biochemical properties, they have a good circulation half-life in the body, which
is an important pharmacokinetic property. While mAbs are applied in various
therapeutic fields, they form a highly important part of modern oncology. Here,
mAbs are used to target antigens that are highly expressed on cancer cells,
exhibiting different modes of action to fight the cancer. In order to increase
their capacity of killing cancer cells, small cytotoxic molecules, as applied in
chemotherapy, can be covalently attached to the mAbs, forming ADCs. Due to
the decreased systemic exposure, drug molecules with higher cytotoxicity can
be used. Motivated by this potential and the market approval of the first
successful products in 2011 and 2013, ADCs gained a lot of attention. By the
end of 2019, there were already six products on the market and over 60
candidates in clinical trials. Substantial progress has been made in areas like
the development of new cytotoxic drugs, linker chemistries, and conjugation
strategies. Despite these successes, the development of new ADCs remains
challenging. Unfavorable pharmacokinetic profiles caused by the hydrophobic
nature of the drugs and heterogeneity in the degree and site of conjugation are
factors which are being improved for current ADCs. Solutions include, for
example, site-specific conjugation strategies. Still, the number of parameters
for optimization is high for these complex hybrid molecules. Issues range from
antibody, drug, and linker over attachment chemistry to the optimal drug-to-
antibody ratio (DAR). In order to unlock the full potential of ADCs, efficient,
knowledge-based process development is necessary.
Also looking at the current landscape of biopharmaceutical development, it is
evident that there is high pressure on process developers to efficiently deliver
robust processes while gathering enhanced knowledge on process and product.
One reason is the diversification of the product pipeline caused by emerging
new modalities like ADCs and other antibody formats or cell and gene therapy.
It increases development efforts and hinders the use of platform approaches.
In addition, time to market gets more crucial with rising development costs
and growing global competition, for example by producers of so-called
biosimilars. Finally, it is promoted by regulatory agencies like the U.S. Food
and Drug Administration or the European Medicines Agency that the concept
of quality by design (QbD) is implemented in pharmaceutical development. Its
Abstract
iv
goal is for processes to be designed in a way that the desired product
performance is robustly achieved in a controlled fashion. It requires increased
process understanding and the thorough characterization of the relationship
between critical process parameters and critical quality attributes of the
product.
The goal of this thesis is to advance the process development of ADCs in the
direction of more efficient, systematic, and knowledge-based approaches. As a
strategy for the realization of this objective, the establishment of high-
throughput, analytical, and digital tools for ADC processes was investigated.
High-throughput tools, especially in combination with design of experiments
(DoE), can lead to a strong increase in efficiency regarding time as well as
material consumption. In order to prevent an analytical bottle neck, high-
throughput compatible analytics are crucial. Also analytical techniques for the
on-line monitoring of processes have great benefit. They are the basis for
implementing process analytical technology (PAT) tools, which give the
opportunity for real-time monitoring and control of product quality attributes.
Digital tools, such as methods for the mechanistic modeling and simulation of
processes, offer many advantages for process development. Apart from
granting a deeper understanding of the process fundamentals, mechanistic
models can be efficient tools for process optimization and characterization of
the design space.
The methods for ADC process development applied or developed in this work
did not rely on the highly toxic drugs used in ADCs. Instead, nontoxic surrogate
drug molecules, similar in relevant properties like size and hydrophobicity as
commonly used cytotoxic drugs in ADCs, were employed. The applied
combination of cysteine-engineered mAb and maleimide conjugation chemistry
is a strategy for site-specific conjugation with high relevance for ADC
development.
In the first part of this thesis, a high-throughput process development platform
for site-specific conjugation processes was developed1. The multi-step process
of making ADCs from cysteine-engineered mAbs was successfully transferred
to a robotic liquid handling station. This included a high-throughput buffer
exchange step using cation-exchange batch adsorption and the subsequent
automated protein quantification with process feedback. As high-throughput
compatible analytics, a reversed-phase ultra-high performance liquid
chromatography (RP-UHPLC) method without sample preparation was
developed, focusing on a short runtime for high efficiency. The final platform
was used in a conjugation DoE, showing the capacity of the method for efficient
process characterization. Finally, the comparability of the high-throughput
results with experiments in a larger scale was demonstrated.

Abstract
v
The second part describes the establishment of an on-line monitoring approach
for ADC conjugation reactions using UV/Vis spectroscopy2. First, a spectral
change caused by the conjugation of the maleimide-functionalized surrogate
drug to the thiol group of the engineered cysteines was detected. Spectra were
recorded during the reaction in two setups with different detectors.
Subsequently, the spectral change was correlated to off-line concentration data
measured by RP-UHPLC using partial least-squares (PLS) regression. The
calibrated PLS models enabled the prediction of the amount of conjugated drug
directly from UV/Vis spectra. Both external validation data sets as well as
cross-validation were used for model validation. The successful prediction of
the reaction progress was shown with two different surrogate drugs in both
setups.
After covering high-throughput tools, analytics, and process monitoring in the
first and second parts, the third part focuses on applying mechanistic
understanding towards conjugation process development. In this section, a
kinetic reaction model for the conjugation of ADCs was established and the
application of the mechanistic model to process development was investigated3.
Before model calibration, six model structures were set up based on different
assumptions regarding the binding to the two available cysteines. All six
models were fit to a calibration data set and the best model was selected using
cross-validation. The results suggest that the attachment of a first drug to the
mAb influences the attachment to the second binding site. An external data set
including data outside the calibration range was used for the successful
validation of the model. The validated model was then applied to an in silico
screening and optimization of the conjugation process, enabling the selection
of conditions with efficient drug use and high yield of the target component.
Additional process understanding was generated by showing a positive effect
of different salts on the reaction rate. Finally, a combination of the kinetic
model with the monitoring approach of the second part was investigated.
While the previous parts are primarily concerned with the conjugation reaction
itself, the fourth part deals with the subsequent purification of the ADCs. A
mechanistic model was established for the separation of ADC species with
different DAR using hydrophobic interaction chromatography (HIC)4. This
separation allows to set the target DAR also post-conjugation. For modeling
the transport of solutes through the column and the adsorption equilibrium,
the transport-dispersive model and a suitable adsorption isotherm were
applied. First of all, a detailed characterization of the chromatography system
and column was conducted, which served the calculation of a number of model
parameters. The rest of the model parameters were determined by parameter
estimation using numerical simulations. For the calibration, nine experiments

Abstract
vi
with different linear and step gradients were run with varying load
compositions. Peak positions as well as peak shapes were accurately described
by the model for all components. Applying the final model to process
optimization gave step gradients with improved yield, DAR, and concentration
in the pool. The successful prediction of yield and DAR in the pool of the
optimized gradients was validated with external data. In a first in silico study,
model-based process control was used to react to variations in the preceding
unit operation, ensuring a robust achievement of a critical quality attribute,
the target DAR. A second in silico study shows that a linkage of the HIC model
with the kinetic reaction model developed in the third part of this thesis can be
profitably applied to process development. This ‘digital twin’ widens the system
boundaries over two adjacent unit operations, which could enable the
establishment of a flexible design space over more than one process step.
In conclusion, the present thesis helps to shape the ADC process development
of the future, able to cope with the challenges of a transforming
biopharmaceutical industry. The whole process from the preparation of the
conjugation sites over the conjugation reaction through to the purification of
the conjugates was covered. Efficient characterization of the design space was
demonstrated by incorporating tools like high-throughput experimentation
combined with DoE, and mechanistic modeling techniques. The
implementation of QbD relies on the establishment of suitable tools for
acquiring enhanced process knowledge and for process monitoring and control.
To this end, a PAT method for conjugation monitoring based on multivariate
data analysis, and mechanistic models for conjugation and purification were
developed. The presented studies showcase the realization of new ideas for
exploiting the potential of digital tools for the specific challenges of ADC
process development.
vii
Zusammenfassung
Antikörper-Wirkstoff-Konjugate (antibody-drug conjugates; ADCs) wurden als
Kombination aus der Therapie durch monoklonale Antikörper (monoclonal
antibodies; mAbs) und der Chemotherapie entwickelt. Darauf basiert ihr
Potential die Vorteile beider Strategien in einem Molekül zu vereinen. mAbs
besitzen die Eigenschaft an ihr Zielantigen spezifisch zu binden, wodurch ihr
Effekt auf den vorgesehenen Wirkort konzentriert werden kann. Aufgrund
ihrer Größe und anderer biochemischer Merkmale weisen sie gute
pharmakokinetische Eigenschaften auf, wie beispielweise eine hohe
Verweilzeit im Körper. Während mAbs in verschiedenen therapeutischen
Feldern eingesetzt werden, kommt ihnen in der modernen Onkologie eine
besondere Bedeutung zu. Dort werden mAbs eingesetzt, die spezifisch für
bestimmte Antigene sind, die auf Krebszellen stark exprimiert werden,
wodurch sie verschiedene Wirkungsmechanismen entfalten können, um den
Krebs zu bekämpfen. Ihre Fähigkeit Krebszellen zu töten kann gesteigert
werden, indem kleine zytotoxische Moleküle, wie sie in der Chemotherapie
eingesetzt werden, kovalent an die Antikörper gebunden werden. Bei dieser
sogenannten Proteinkonjugationsreaktion entstehen ADCs. Dank der
geringeren systemischen Exposition können hier Wirkstoffe mit höherer
Zytotoxizität eingesetzt werden als in der Chemotherapie. Angeregt durch ihr
großes Potential für die Krebstherapie und durch die Marktzulassung der
ersten erfolgreichen Produkte 2011 und 2013, wuchs die Aufmerksamkeit für
ADCs. Ende 2019 waren sechs Produkte zugelassen und über 60 Kandidaten
befanden sich in klinischen Studien. Wesentliche Fortschritte wurden in
Bereichen wie der Entwicklung neuer zytotoxischer Wirkstoffe, Linker-Chemie
und Konjugationsstrategien gemacht. Trotz dieser Erfolge bleibt die
Entwicklung neuer ADCs äußerst anspruchsvoll. Ungünstige pharmako-
kinetische Profile, verursacht durch die hydrophobe Natur der zytotoxischen
Wirkstoffe, und Heterogenität bezüglich des Grads und des Ortes der
Konjugation sind Faktoren, die bei aktuellen ADCs verbessert werden. Zu den
möglichen Lösungswegen gehören z.B. bindestellenspezifische Konjugations-
strategien. Dennoch bleibt die Zahl der zu optimierenden Parameter bei diesen
komplexen Hybridmolekülen groß. Von Antikörper, Wirkstoff und Linker über
Konjugationschemie bis zum Wirkstoff-Antikörper-Verhältnis (drug-to-
antibody ratio; DAR) müssen optimale Parameter gefunden werden. Um das
volle Potential von ADCs auszuschöpfen, ist eine effiziente, wissensbasierte
Prozessentwicklung nötig.
Darüber hinaus wird bei der Betrachtung der aktuellen Landschaft der
biopharmazeutischen Entwicklung offenkundig, dass ein großer Druck auf
Zusammenfassung
viii
Prozessentwicklern lastet, auf effiziente Art und Weise robuste Prozesse
abzuliefern und gleichzeitig erweitertes Prozess- und Produktwissen zu
generieren. Ein Grund dafür ist die Diversifizierung der Produkt-Pipeline, die
durch neue Modalitäten wie ADCs, andere Antikörper-Formate oder Zell- und
Gentherapie entsteht. Dadurch erhöht sich der Entwicklungsaufwand und
eine Anwendung von Plattform-Prozessen wird erschwert. Zusätzlich wird die
Markteinführungszeit mit steigenden Entwicklungskosten und wachsendem
globalen Wettbewerb, z.B. durch Hersteller sogenannter Biosimilars, immer
kritischer. Schließlich forcieren die Regulationsbehörden wie die US-
amerikanische Food and Drug Administration oder die European Medicines
Agency die Implementierung des Konzepts Quality by design (QbD) in der
pharmazeutischen Entwicklung. Das Ziel dieses Konzepts ist eine Art der
Prozessentwicklung, durch die gewünschte Produkteigenschaften schon durch
die Beschaffenheit der Prozesse zuverlässig und kontrolliert erreicht werden.
Dies erfordert ein verbessertes Prozessverständnis und eine umfangreiche
Charakterisierung der Beziehung zwischen kritischen Prozessparametern und
kritischen Produktattributen.
Das Ziel dieser Doktorarbeit ist es, die Prozessentwicklung für ADCs in die
Richtung effizienter, systematischer und wissensbasierter Ansätze
weiterzudenken und solche Ansätze zu entwickeln. Für die Realisierung dieses
Ziels, wurde die Etablierung von Hochdurchsatzanwendungen, analytischen
Methoden und digitalen Werkzeugen untersucht. Hochdurchsatz-
anwendungen, insbesondere in Kombination mit statistischer Versuchs-
planung (design of experiments; DoE), können zu großen Effizienzsteigerungen
in Bezug auf Zeit- und Materialaufwand führen. Hochdurchsatzfähige
Analytikmethoden sind zwingend notwendig, um einen Engpass bei der
Analytik zu verhindern. Auch analytische Techniken zur Prozessüberwachung
bringen erhebliche Vorteile mit sich. Sie sind die Basis für die
Implementierung von prozessanalytischen Technologien (process analytical
technology; PAT), die wiederum die Möglichkeit zur Echtzeitüberwachung und
Kontrolle von Produktqualitätsattributen eröffnen. Nicht zuletzt bieten
digitale Werkzeuge, wie Methoden der mechanistischen Modellierung und
Simulation von Prozessen große Vorteile für die Prozessentwicklung. Zum
einen ermöglichen sie ein tieferes Verständnis der Prozessgrundlagen, zum
anderen können sie sehr effizient für die Prozessoptimierung und die
Charakterisierung des Parameterraumes (design space) eingesetzt werden.
Die Methoden zur ADC-Prozessentwicklung, die in dieser Arbeit angewendet
oder entwickelt wurden, basieren nicht auf den äußerst toxischen Wirkstoffen,
die für ADCs typisch sind. Stattdessen wurden nicht-toxische Surrogat-
Moleküle verwendet. Diese wurden so ausgewählt, dass relevante
Eigenschaften wie Größe und Hydrophobizität in der gleichen Größenordnung
Zusammenfassung
ix
lagen wie bei häufig eingesetzten zytotoxischen Wirkstoffen. Des Weiteren
wurde für die Konjugation die Kombination aus einem mAb mit zwei
rekombinant eingebrachten Cysteinen und der Maleimid-Chemie gewählt,
eine Strategie der bindestellenspezifischen Konjugation mit hoher Relevanz
für die ADC-Entwicklung.
Im ersten Teil der Arbeit wurde eine hochdurchsatzfähige
Prozessentwicklungsplattform für bindestellenspezifische Konjugations-
prozesse entwickelt1. Der mehrstufige Prozess aus den Cystein-mAbs ADCs
herzustellen, wurde erfolgreich in vollem Umfang auf eine automatisierte
Liquid Handling-Station transferiert. Dies schloss einen Hochdurchsatz-
Pufferaustausch mit ein, der über einen Kationtauscher-
Batchadsorptionsschritt realisiert wurde. Außerdem wurde darauffolgend eine
automatisierte Proteinquantifizierung mit Prozess-Rückkopplung integriert.
Für die hochdurchsatzfähige Analytik wurde analytische
Umkehrphasenchromatographie (RPC) eingesetzt. Zur Effizienzsteigerung
wurde eine Methode ohne Probenvorbereitung und mit kurzer Laufzeit
entwickelt. Mit der finalen Plattform wurde ein Konjugations-DoE
durchgeführt, um die Eignung der Methode zur effizienten
Prozesscharakterisierung zu demonstrieren. Abschließend wurde die
Vergleichbarkeit der Hochdurchsatz-Ergebnisse mit manuell, in einem
größeren Maßstab durchgeführten Experimenten gezeigt.
Der zweite Teil der Arbeit beschreibt die Etablierung einer On-line-
Überwachungsmethode für ADC-Konjugationsreaktionen unter Verwendung
von UV/Vis-Spektroskopie2. Zunächst wurde eine Änderung im Spektrum
festgestellt, welche durch die Maleimid-Konjugation des Surrogat-Wirkstoffes
an die Thiol-Gruppen der rekombinanten Cysteine verursacht wird. Dafür
wurden in zwei verschiedenen Setups mit zwei unterschiedlichen Detektoren
Spektren während der Reaktion aufgenommen. Die Änderung im Spektrum
wurde daraufhin mit off-line bestimmten Konzentrationsdaten aus der RPC
korreliert. Verwendet wurde dafür die Partial least squares (PLS) Regression.
Die kalibrierten PLS-Modelle ermöglichten die Vorhersage der Menge an
konjugiertem Wirkstoff direkt aus UV/Vis-Spektren. Sowohl externe Daten, als
auch eine Cross-Validierung, wurden für die Validierung des Modells
eingesetzt. Die korrekte Vorhersage des Reaktionsfortschritts wurde mit zwei
verschiedenen Surrogat-Wirkstoffen in beiden Setups erfolgreich gezeigt.
Nachdem Hochdurchsatz-Methoden, Analytik und Prozessüberwachung im
ersten und zweiten Teil bearbeitet wurden, befasst sich der dritte Teil mit der
Anwendung von mechanistischem Prozessverständnis auf die Entwicklung von
Konjugationsprozessen. In diesem Teil der Arbeit wurde ein kinetisches
Reaktionsmodell für die Konjugation von ADCs entwickelt und die Anwendung

Zusammenfassung
x
des mechanistischen Modells für die Prozessentwicklung untersucht3. Vor der
Modellkalibrierung wurden sechs Modellstrukturen entworfen, basierend auf
verschiedenen Annahmen bezüglich der Bindung an die zwei verfügbaren
Cysteine. Alle sechs Modelle wurden an ein Kalibrierdatenset gefittet und das
beste Modell wurde mittels Cross-Validierung ausgewählt. Das Ergebnis legt
nahe, dass die Bindung des ersten Wirkstoffmoleküls an den Antikörper die
Bindung an die zweite Bindestelle beeinflusst. Ein externer Datensatz,
einschließlich Daten außerhalb des Kalibrierraumes, wurde für die
erfolgreiche Validierung des gewählten Modells verwendet. Das validierte
Modell wurde dann für in silico Screening und Optimierung des
Konjugationsprozesses eingesetzt. Dies ermöglichte die Bestimmung von
Bedingungen mit minimalem Wirkstoffverbrauch und hoher Ausbeute der
zweifach konjugierten Zielkomponente. Zusätzliches Prozessverständnis
wurde dadurch generiert, dass ein positiver Effekt auf die Reaktionsrate durch
Zusatz verschiedener Salze zum Puffer gezeigt wurde. Zuletzt wurde noch die
Kombination des kinetischen Modells mit der Prozessüberwachungsmethode
aus dem zweiten Teil untersucht.
Während in den bisher beschriebenen Teilen primär die Konjugationsreaktion
selbst behandelt wird, beschäftigt sich der vierte Teil mit der darauffolgenden
Aufreinigung der ADCs. Ein mechanistisches Modell der präparativen
Trennung von ADC-Varianten mit unterschiedlichem DAR mittels
hydrophober Interaktionschromatographie (HIC) wurde etabliert4. Diese
Trennung gestattet es noch nach der Konjugation das gewünschte DAR
einzustellen. Um den Transport von gelösten Stoffen durch die Säule und das
Adsorptionsgleichgewicht zu modellieren, wurde das sogenannte Transport-
dispersive model und eine geeignete Adsorptionsisotherme verwendet.
Zunächst erfolgte eine eingehende Charakterisierung des Chromatographie-
systems und der Säule, welche der Berechnung mehrerer Modellparameter
diente. Die übrigen Modellparameter wurden durch Parameterschätzung
mithilfe numerischer Simulationen bestimmt. Für die Modellkalibrierung
wurden neun Experimente mit linearen und Stufengradienten, sowie
unterschiedlichen Beladungszusammensetzungen durchgeführt. Die
Peakpositionen wie auch die Peakformen wurden für alle Komponenten
präzise durch das Modell beschrieben. Prozessoptimierung mithilfe des finalen
Modells ergab Stufengradienten mit verbesserter Ausbeute, verbessertem
DAR und höherer Konzentration in den gesammelten Produktfraktionen. Die
erfolgreiche Vorhersage der Ausbeute und des DAR in den Produktfraktionen
der optimierten Gradienten wurde mit externen Daten validiert. In einer
ersten in silico Studie wurde Modell-basierte Prozesskontrolle eingesetzt, um
auf Variationen in vorhergehenden Prozessschritten zu reagieren, wodurch das
zuverlässige Erreichen des gewünschten DAR gewährleistet werden kann.

Zusammenfassung
xi
Eine zweite in silico Studie zeigt, dass eine Verbindung des HIC-Modells mit
dem kinetischen Reaktionsmodell, welches im dritten Teil entwickelt wurde,
für die Prozessentwicklung äußerst vorteilhaft eingesetzt werden kann. Dieser
„digitale Zwilling“ erweitert die Systemgrenzen über zwei aufeinander
folgende Prozessschritte, was die Etablierung eines flexiblen Design space über
mehr als einen Prozessschritt ermöglichen könnte.
Im Ergebnis ist die vorliegende Dissertation ein wertvoller Beitrag dazu, eine
ADC-Prozessentwicklung der Zukunft zu gestalten, welche in der Lage ist, die
Herausforderungen einer sich transformierenden biopharmazeutischen
Industrie zu bewältigen. Der gesamte Prozess von der Vorbereitung der
Bindestellen über die Konjugationsreaktion bis hin zur Aufreinigung der
Konjugate wurde bearbeitet. Eine effiziente Charakterisierung des
Parameterraums (Design space) wurde demonstriert, indem einerseits
Hochdurchsatz-Prozesse kombiniert mit DoE, andererseits Techniken der
mechanistischen Modellierung eingesetzt wurden. Die Implementierung von
QbD setzt die Etablierung von geeigneten Werkzeugen voraus, um erweitertes
Prozesswissen zu generieren und um Prozesse überwachen und kontrollieren
zu können. Mit diesem Ziel wurden sowohl eine PAT-Methode zur
Überwachung von Konjugationsreaktionen, basierend auf multivariater
Datenanalyse, als auch mechanistische Modelle für Konjugation und
Aufreinigung entwickelt. Die vorgestellten Studien präsentieren die
Realisierung neuer Ideen, das Potential digitaler Instrumente für die
spezifischen Herausforderungen der ADC-Prozessentwicklung auszuschöpfen.

xii
Table of contents
Acknowledgments ................................................................................................. i
Abstract .............................................................................................................. iii
Zusammenfassung ............................................................................................. vii
Table of contents ................................................................................................ xii
1 Introduction ................................................................................................... 1
1.1 Antibody-drug conjugates....................................................................... 3
1.1.1 Concept ............................................................................................ 3
1.1.2 ADC structure – the three components ......................................... 4
1.1.3 Conjugation process ........................................................................ 8
1.2 Strategies for process development of biologics .................................... 9
1.2.1 Quality by design .......................................................................... 10
1.2.2 High-throughput process development and design of experiments
....................................................................................................... 11
1.2.3 Model-based process development ............................................... 12
1.3 Process analytical technology............................................................... 13
1.3.1 Principle component analysis ...................................................... 13
1.3.2 Partial least squares regression ................................................... 14
1.4 Mechanistic modeling of liquid chromatography for large biomolecules
............................................................................................................. 16
1.4.1 Process chromatography for biologics .......................................... 16
1.4.2 Mechanistic chromatography modeling ....................................... 18
2 Thesis outline .............................................................................................. 21
2.1 Research proposal ................................................................................. 21
2.2 Outline and author statement ............................................................. 24
3 Multi-step high-throughput conjugation platform for the development of
antibody-drug conjugates ............................................................................ 27
3.1 Introduction .......................................................................................... 28
3.2 Materials and Methods ......................................................................... 30
3.2.1 Chemicals ...................................................................................... 30
3.2.2 Model system and conjugation process ........................................ 30

Table of contents
xiii
3.2.3 Multi-step high-throughput conjugation ..................................... 31
3.2.4 Protein quantification .................................................................. 32
3.2.5 Optimization and characterization of CEX buffer exchange step
....................................................................................................... 33
3.2.6 Analytics ....................................................................................... 33
3.2.7 High-throughput conjugation DoE .............................................. 34
3.2.8 Comparability study ..................................................................... 34
3.3 Results and Discussion ........................................................................ 35
3.3.1 Implementation of high-throughput conjugation process on liquid
handling station ........................................................................... 35
3.3.2 Analytics ....................................................................................... 38
3.3.3 High-throughput conjugation DoE .............................................. 39
3.3.4 Comparability with mL-scale reaction ........................................ 40
3.4 Conclusion ............................................................................................ 41
4 Monitoring of antibody-drug conjugation reactions with UV/Vis
spectroscopy ................................................................................................. 43
4.1 Introduction .......................................................................................... 44
4.2 Materials and Methods ........................................................................ 46
4.2.1 Chemicals ..................................................................................... 46
4.2.2 Model system and conjugation process ....................................... 46
4.2.3 High-throughput on-line monitoring experiments in microplate
format............................................................................................ 47
4.2.4 20 mL lab-scale on-line monitoring experiments ........................ 49
4.2.5 Reversed-phase chromatography ................................................. 50
4.2.6 Data analysis ................................................................................ 50
4.3 Results .................................................................................................. 52
4.3.1 Analysis of UV/Vis absorption spectra ........................................ 52
4.3.2 PLS model calibration and validation for microplate experiments
....................................................................................................... 54
4.3.3 PLS model calibration for lab-scale experiments ....................... 55
4.4 Discussion ............................................................................................. 57
4.5 Conclusion ............................................................................................ 59
5 Kinetic reaction modeling for antibody-drug conjugate process
development ................................................................................................ 61

Table of contents
xiv
5.1 Introduction .......................................................................................... 62
5.2 Materials and Methods ......................................................................... 64
5.2.1 Chemicals ...................................................................................... 64
5.2.2 Model system, conjugation process and sampling of kinetic data
....................................................................................................... 65
5.2.3 Reversed-phase analytical chromatography ............................... 67
5.3 Model construction and development .................................................. 67
5.3.1 Component starting concentrations ............................................. 69
5.3.2 Model fitting, selection and validation ........................................ 69
5.3.3 Model application ......................................................................... 70
5.4 Results ................................................................................................... 71
5.4.1 Model selection ............................................................................. 71
5.4.2 Calibration and parameter uncertainty ...................................... 72
5.4.3 Validation of selected models ....................................................... 74
5.4.4 Investigation of salt effects on rate constants ............................. 75
5.4.5 Application of the kinetic model for process optimization .......... 77
5.4.6 Application of the kinetic model to support process monitoring 77
5.5 Discussion ............................................................................................. 78
5.5.1 Model structure and model selection ........................................... 78
5.5.2 Model calibration and validation ................................................. 80
5.5.3 Salt effects on the rate constants ................................................. 81
5.5.4 Model application ......................................................................... 81
5.6 Conclusion ............................................................................................. 82
6 Modeling of hydrophobic interaction chromatography for the separation of
antibody-drug conjugates and its application towards quality by design . 84
6.1 Introduction .......................................................................................... 85
6.2 Theory ................................................................................................... 87
6.2.1 Transport-dispersive model and boundary conditions ................ 87
6.2.2 Isotherm model ............................................................................. 88
6.3 Materials and Methods ......................................................................... 89
6.3.1 Chemicals, buffers, and proteins ................................................. 89
6.3.2 Conjugation process ...................................................................... 90
6.3.3 System and column characterization ........................................... 90
Table of contents
xv
6.3.4 HIC experiments .......................................................................... 91
6.3.5 Reversed-phase analytical chromatography ............................... 92
6.3.6 HIC model calibration .................................................................. 92
6.3.7 Process optimization and HIC model validation ......................... 93
6.3.8 In silico study for model-based process control ........................... 93
6.3.9 Model-based linkage study of HIC purification and conjugation93
6.4 Results and Discussion ........................................................................ 95
6.4.1 Model calibration .......................................................................... 95
6.4.2 Process optimization and model validation ................................. 99
6.4.3 Robust DAR by model-based process control ............................ 101
6.4.4 Model-based linkage study of conjugation reaction and HIC
purification ................................................................................. 103
6.5 Conclusion .......................................................................................... 106
7 Conclusion and Outlook ............................................................................ 108
Bibliography .................................................................................................... 111
Abbreviations ................................................................................................... 126
Symbols ............................................................................................................ 128
Appendix A Supplementary data for Chapter 4 .......................................... 132
Appendix B Supplementary data for Chapter 5 .......................................... 136

1
1 Introduction
Availability of essential healthcare, like access to medical services or
vaccination of children, is one of the fundamental conditions for a healthy life,
next to other important factors like clean water, access to sanitation and
sufficient nutrition5. Preventive as well as therapeutic medicines form one of
the core elements of modern healthcare. While the majority of available
products are still so-called small-molecule drugs (chemically synthesized
compounds below a molecular weight of 1000 Da), the importance of
biopharmaceutical drugs is increasing rapidly. In 2018, there were 316
biopharmaceutical products on the market with 155 approved between 2014
and 20186. These ‘biologics’ are biological molecules derived from
pharmaceutical biotechnology. The advances in the field are fueled by an ever
growing scientific and technological knowledge base in biochemistry, genetics,
microbiology, molecular biology, engineering, and computer technology,
complementing achievements in medicinal chemistry and pharmaceutics7.
Next to therapeutic proteins and vaccines, the scope of biopharmaceuticals is
expanding towards new formats like cell- and gene-therapy to answer unmet
medical needs. The majority of approved products, however, are recombinant
proteins, with monoclonal antibodies (mAbs) dominating the new approvals
(53% between 2015 and July 2018)6,8. Besides immunoglobulin G molecules
(IgG), there are four other different formats of approved antibody drugs:
antibody-drug conjugates (ADCs), radioimmunoconjugates, bispecific
antibodies, and antibody-fragments9. This increasing diversity of the drug
development pipeline is one of the challenges posed to scientists developing
biopharmaceutical production processes, because it complicates the use of
platform processes. These are very common in IgG production.
ADCs are complex hybrid-molecules comprising mAbs and small cytotoxic
molecules that are covalently attached via a linker. On the one hand, this
hybrid character holds great potential for cancer therapy, because both
specificity of mAbs and efficacy of cytotoxic drugs can be combined. On the
other hand, process development for ADCs involves specific challenges arising
from the fusion of these two molecule classes. This means that specific solutions
have to be investigated in order to efficiently develop suitable processes for the
production of ADCs.
Generally, the production of recombinant protein drugs can be divided into

1.1 Antibody-drug conjugates
2
several steps. In the upstream processing, the drug substance is produced by
fermentation, normally using either a mammalian cell line, Escherichia coli or
yeast6. Also steps preceding the fermentation like cell line development and
cell culture and the cell separation following the fermentation are part of
upstream processing. Next, the drug substance is isolated during downstream
processing, which can be divided into capture, purification, and polishing. In
the case of ADCs, additional steps like the conjugation of the cytotoxic drug to
the mAb and further purification steps have to be included. Finally, the drug
product is prepared by formulating the active pharmaceutical ingredient (API)
together with different excipients supporting long-term stability and
administration to the human body. The whole process comprises many
different unit operations like filtration and chromatography steps, which are
designed during process development. During each molecules’ way through
toxicology studies, preclinical studies, and clinical studies towards market
approval, the production processes must be further and further refined. This is
done until a robust and reliable process is able to produce a safe product in a
consistent quality. To ensure efficacy and patient safety, regulatory agencies
like the U.S. Food and Drug Administration (FDA) and the European
Medicines Agency (EMA) have to approve each product before commercial
launch, including the production processes with design space, specifications,
and manufacturing controls.
For the last decade, regulators have promoted the implementation of a concept
called quality by design (QbD) for pharmaceutical development, which implies
a more informed, systematic approach for process development10. The
underlying idea is that quality should be built into products by design rather
than trying to test quality into products. This is done by gaining a more
profound understanding of product performance over a range of material
attributes, manufacturing processes, and process parameters, yielding an
expanded design space and at the same time creating opportunities for more
flexible regulatory approaches. For acquiring this enhanced knowledge,
possible strategies are, for example, multivariate experiments, process
analytical technology (PAT), and relating mechanistic understanding to
product quality10. For complying with these requirements and to support an
efficient process development in the setting of diversifying pipelines and
immense pressure to minimize time to market, different tools involving a more
digitized process development can be applied. While high-throughput
approaches in combination with design of experiments (DoE) are already
widely spread for some applications11–14, PAT tools in conjunction with
multivariate data analysis and process development based on mechanistic
modeling of processes are on their way there15,16.

1 Introduction
3
In this chapter, some of these methods are introduced in combination with the
unit operations that they have been applied to in this thesis. Furthermore, the
concept of antibody-drug conjugates and their specific development challenges
are described.
1.1 Antibody-drug conjugates
1.1.1 Concept
The idea of creating targeted therapeutics for human diseases is older than a
century and was originally brought forward by Paul Ehrlich in his vision of
creating ‘magic bullets’ to attack pathogens but spare healthy tissues17.
Ehrlich, who is considered the founder of chemotherapy, postulated the
existence of different receptors with varying binding groups, based on
experiments with different chemical dyes17,18. The differential affinities of
these compounds for specific biological structures lead to the concept of drugs
going directly to their designated targets17,19. The first effort to treat cancer
with a chemical substance was undertaken by Goodman, Gilman and Linskog
in the 1940s, who used a nitrogen mustard anticancer agent on a lymphoma
patient20,21. Since then, chemotherapy has come a long way and new therapies
like monoclonal antibodies have been developed. mAbs, in contrast to
polyclonal antibodies, are produced by cells derived from a single B-lymphocyte
and are directed against a single epitope. Originally, murine antibodies were
used, but for reduced immunogenicity, chimeric, humanized, and even human
mAbs have been developed22,23. mAbs bind their corresponding antigen with
high specificity. Due to the fact that some receptors exist on the surface of
tumor cells, which are not or less expressed on the surface of healthy cells,
mAbs can be used to target cancer cells17,24–26. By specifically binding to these
receptors, antibodies can exert different kinds of effects leading to recession of
the tumor. The modes of action can be either direct or immune-mediated.
Examples for direct action are through receptor blockade or agonist activity,
induction of apoptosis, or delivery of a drug to the target cell. Immune-
mediated modes of action range from antibody-dependent cellular cytotoxicity
(ADCC) over complement-dependent cytotoxicity (CDC) to regulation of T-cell
function. Finally, antibodies can have specific effects on tumor vasculature and
stroma24. Drugs targeted to their site of action in cancer cells using mAbs are
usually cytotoxic small-molecules, which are covalently linked to the
antibodies, forming antibody-drug conjugates. They constitute a combination
of mAbs and chemotherapy, yielding the potential for high specificity as well
as high cytotoxicity. As a consequence, a lot of research and development efforts
are focused on developing new ADCs. Among the 33 antibody drugs that were
1.1 Antibody-drug conjugates
4
in late-stage clinical development for cancer therapy by the end of 2018, eight
were ADCs and many more are in earlier stages of the clinic27. Currently, there
are seven marketed ADCs, which are described further in Table 1.1. The mode
of action of ADCs is based on binding to the target cell and releasing the toxin
upon internalization, thus inducing apoptosis. However, there are also ADCs
being investigated using non-internalizing receptors28,29. Apart from the
cytotoxic effect of the toxin, some mAbs can contribute to the cell killing
capacity of the ADC by the modes of action described above, e.g. ADCC.
Table 1.1: There are currently seven antibody-drug conjugates on the market. The name
in brackets is the trade name.
Name Companies Antibody Indication
Brentuximab
vedotin (Adcetris)
Seattle Genetics,
Takeda
Chimeric
IgG1
Hodgkin lymphoma,
systemic anaplastic
large cell lymphoma
Ado-trastuzumab
emtansine
(Kadcyla)
Genentech /
Roche
Humanized
IgG1 Breast cancer
Inotuzumab
ozogamicin
(Besponsa)
Pfizer, UCB Humanized
IgG4
Acute lymphoblastic
leukemia
Gemtuzumab
ozogamicin
(Mylotarg)
Pfizer, Wyeth,
Takeda, UCB,
etc.
Humanized
IgG4
Acute myeloid
leukemia
Polatuzumab
vedotin (Polivy)
Hoffmann-La
Roche
Humanized
IgG1
Diffuse large B-cell
lymphoma
Trastuzumab
deruxtecan
(Enhertu)
Daiichi Sankyo /
AstraZeneca
Humanized
IgG1 Breast cancer
Enfortumab
vedotin (Padcev)
Astellas /
Seattle Genetics
Human
IgG1 Urothelial cancer
1.1.2 ADC structure – the three components
ADCs consist of three components, a monoclonal antibody, a drug molecule,
and a linker molecule, which has, among other functions, the purpose of
covalently attaching the drug to the antibody. In the following, these three
parts are covered in more detail.

1 Introduction
5
1.1.2.1 Monoclonal antibody
As described above, the mAb is supposed to bring its payload to the site of
action, the target cancer cell. For this to be achieved, a high binding affinity for
the target antigen is necessary. Due to their size (no renal clearance of large
biomolecules) and other factors, like FcRn-mediated recycling, antibodies
exhibit long circulation times in the body (about 18-21 days for IgG1, IgG2, and
IgG4), which enhances the chances of reaching their target30. Another
prerequisite for being applied as a therapeutic is low immunogenicity, which is
promoted by using chimeric, humanized, or human IgG. For illustration, the
generic mAb structure is shown in Figure 1.1. A chimeric antibody has the
antigen-binding variable domains of a mouse mAb and a human constant
region. For humanized antibodies the complementarity-determining regions
(CDRs) are taken from a mouse mAb. Depending on the humanization
technology, additional residues are transferred from the parent mouse mAb22.
Another important factor for the mAb is antigen selection. The antibody’s
target antigen should be highly expressed on the surface of target cells, to
ensure a sufficient dose of the drug for the cytotoxic effect is delivered. In most
cases, an antigen with a suitable internalization mechanism is selected for the
drug to reach its intracellular target31. The target of the ADC trastuzumab
emtansine for example is the HER2 antigen (also ERBB2, HER2/neu or
CD340). HER2 stands for human epidermal growth factor receptor and is
amplified in human breast cancer cell lines26. In addition to the cytotoxic effect
of the drug, trastuzumab is able to inhibit HER2 signaling and shedding and
also causes ADCC9.

1.1 Antibody-drug conjugates
6
Figure 1.1: Generic structure of Immunoglobulin G.
1.1.2.2 Small-molecule drug
The goal is to use highly potent cytotoxic drugs with physicochemical properties
that permit the attachment of several molecules without causing mAb
aggregation or unfavorable pharmacokinetics31,32. Typical molecular weights of
the molecules used range from 500 g/mol to 1300 g/mol. About 60% of ADCs in
clinical trials use antimitotic microtubule-disrupting agents33. One reason is
their lack of cytotoxicity towards less proliferative normal cells, which may lead
to a better tolerability profile of ADCs employing these payloads. This is a
valuable property, because target antigens are normally not totally tumor-
specific and the administered ADC is mostly eliminated from the body by
catabolism via the mononuclear phagocyte system34. The important molecule
classes of tubulin polymerization inhibitors are auristatins and maytansinoids,
but also tubulysin is used in a few cases. Despite their widespread use, the
success rate is not very high, most probably due to the use of the same
mechanism for different target antigens and cancer types35. Increasingly, other
Heavy chain
Light chain
Constant region
Variable region
Fc
IgG
Fab
FvHeavy chain
Antigen binding regionswith CDRs

1 Introduction
7
types of molecules like DNA-interacting agents are being investigated.
Examples are DNA-crosslinking compounds based on pyrrolobenzodiazepine
dimers or calicheamicins, showing promising antitumor activity in clinical
trials34,36. It remains a challenge establishing small-molecule drugs fulfilling
the special requirements for application in ADCs like picomolar IC50 (half
maximal inhibitory concentration) and suitable properties regarding solubility
and stability33,35.
1.1.2.3 Linker
The linkers’ essential task is to keep the drug attached to the mAb as long as
necessary for it to reach its site of action and then releasing it effectively. This
means it has to be stable towards premature release during circulation.
Additionally, the cytotoxic drug is in many cases hydrophobic and the linker is
used to solubilize it in aqueous conditions. A linker-drug moiety is normally
prepared before being conjugated to the antibody31. The used linkers can be
categorized into cleavable and non-cleavable linkers. Cleavable linkers contain
a site that is susceptible to enzymatic or chemical disintegration upon reaching
the target cell, while non-cleavable linkers may remain attached to the drug
and rely on the degradation of the antibody’s peptide backbone to set free the
drug-linker moiety. With cleavable linkers, the drug is separated from the
linker by peptidases, reducing agents, or the low-pH environment of the
lysosomes. Since it can have a huge impact on pharmacokinetics and efficacy,
the choice of linker has to be matched to the payload and the target and each
ADC will possibly require its own optimization35,37. Prevalent among ADCs in
clinical trials are the cleavable valine-citrulline dipeptide-linker and the non-
cleavable thioether linkage35,38. Other cleavable linkers used in a number of
ADCs are acid-labile hydrazone linkers and disulfide linkers, which facilitate
reductive cleavage of the toxin.
A summary of the most important ADC component properties is given in
Figure 1.2.
1.1 Antibody-drug conjugates
8
Figure 1.2: Overview of some of the important requirements for the three ADC
components mAb, linker, and payload (cytotoxic drug). Figure adapted from Bakhtiar39
and Gébleux and Casi40.
1.1.3 Conjugation process
Protein conjugation means the attachment of other (non-polypeptide) chemical
groups to a protein, in the case of ADCs via a covalent bond. Different amino
acids contain various functional groups like primary amines, carboxylates,
sulfhydryl, or phenolate groups, which provide reactive sites within proteins.
In addition, mAbs possess an N-glycosylation site in the Fc region offering the
possibility of glycoconjugation. Traditionally, lysine amines or cysteine
sulfhydryl groups are employed for making ADCs, as can also be seen from the
commercial ADCs (see Table 1.1). Trastuzumab emtansine (Kadcyla) for
example is produced by attaching an amino-specific N-hydroxysuccinimide
(NHS) ester to lysine amines forming an amide bond. Brentuximab vedotin
(Adcetris) on the other hand is based on the attachment of the payload to
interchain cysteines via a thiol-specific maleimide-linker. This requires a prior
reduction of the interchain disulfides yielding reactive thiol groups, which can
be achieved by addition of a reducing agent like tris(2-carboxyethyl)phosphine
(TCEP). A drawback of these techniques is their limited site-specificity. The
mAb of trastuzumab contains 88 lysines and 4 N-terminal amines of which 70
were identified having drug molecules attached to them, although the average
drug-to-antibody ratio (DAR) is 3.5 41. In the case of brentuximab and the
conjugation to interchain disulfides, there are 8 possible sites. For ADCs
produced with these stochastic conjugation approaches, this leads to a highly
heterogeneous mixture of conjugates with different amounts of drugs attached
to different sites. These molecules potentially have varying pharmacokinetic
mAb Linker Payload
- Selectivity and affinity
- Low immunogenicity
- Stability
- Long circulation time
- Target: abundant cancer
antigen
- Stable in circulation
- Stable in product storage
- Releasing active payload
- Optimized for target
and payload
- Potency
- Stability
- Low immunogenicity
- Amenable to conjugation
- Good pharmacokinetics

1 Introduction
9
and therapeutic properties. For reducing heterogeneity, numerous strategies
for site-specific conjugation have been developed and are being applied to the
new generation of ADCs42. Techniques range from the incorporation of non-
natural amino acids over enzyme-directed conjugations to the functional re-
bridging of native disulfides42,43. In this introduction, only the conjugation to
engineered cysteines will be covered due to its relevance to this work. It was
introduced by Junutula et al., who recombinantly inserted one cysteine on each
heavy-chain of a mAb affording conjugates with predominantly two drugs per
antibody44. These showed comparable efficacy but a lower toxicity compared to
conventionally produced ADCs, leading to an improved therapeutic index (1).
As for the conjugation to interchain disulfides, a prior reduction step is needed
to uncap the engineered cysteines, which are blocked by glutathione or
cysteine44. In order to reform the interchain disulfides, which are also affected
by the reduction, a partial re-oxidation using dehydro-ascorbic acid (DHA) can
be performed. Then, the linker-drug is added and the conjugation occurs.
Selecting a conjugation chemistry and developing the conjugation reaction are
essential parts of ADC development since important properties like DAR and
conjugation sites are defined that directly influence pharmacokinetics, efficacy,
and safety of the final product. Sun et al. studied this influence for
maytansinoid ADCs with different DARs and showed that DARs between 2 and
6 lead to a better therapeutic index than conjugates with high DARs of 9-10 45.
They interpret their data towards a use of DAR 3-4 for maytansinoid ADCs,
but suggest the investigation of higher and lower DAR depending on target
antigen biology. Regarding the conjugation site, it was shown that there is an
effect on in vivo stability, pharmacokinetics, and therapeutic activity and
approaches were developed for selecting suitable binding sites46–49. The
objectives of selecting appropriate conjugation chemistries and conjugation
sites, and of achieving the optimal DAR contribute to the complexity of ADCs
and their process development. It adds to the general challenges of developing
a biopharmaceutical, because the starting material for the conjugation reaction
is the purified mAb. After being isolated from the harvested cell culture fluid
in a number of unit operations, the mAbs used in ADCs are the product of a
complete biopharmaceutical production process.
1.2 Strategies for process development of biologics
While a new molecule makes its way from candidate selection through clinical
studies towards the market, different stages of process development are taking
(1) Toxic effect versus efficacy; e.g. toxic dose in 50% of subjects divided by efficacious dose in
50% of subjects
1.2 Strategies for process development of biologics
10
place. The later the stage, the more material is needed and the higher are the
requirements for yield and productivity. Time constraints are ubiquitous,
because time to market is crucial and a diversifying biopharmaceutical product
pipeline brings new challenges. At the same time, robust processes have to
guarantee product quality and safety. In the following, current strategies to
overcome these challenges are described.
1.2.1 Quality by design
The International conference on harmonization of technical requirements for
registration of pharmaceuticals for human use (ICH) provides a guideline for
pharmaceutical development, which, since 2008, contains a part describing the
principles of quality by design (QbD)10. In this part, important concepts and
tools for pharmaceutical development from the parent Q8 guideline are further
elaborated. Quality by design essentially means a more systematic approach to
development, which can imply, for example, “the incorporation of prior
knowledge, results from studies using design of experiments (DoE), use of
quality risk management, and use of knowledge management (see ICH Q10)
throughout the lifecycle of the product”10. A great incentive of applying such
concepts is that an increased understanding of the product and the process can
facilitate science- and risk-based regulatory approaches, which can increase
regulatory flexibility. In the following, the most important elements of
pharmaceutical development, according to the ICH guideline, will be described.
First of all, a quality target product profile (QTPP) has to be established,
covering aspects like intended clinical use, route of administration, dosage
form, and appropriate drug product quality criteria (e.g. sterility, purity,
stability). From the QTPP and from prior knowledge, potential critical quality
attributes (CQAs) of the drug product can be derived. These potential CQAs
guide process development and can be adjusted with increasing product
knowledge and process understanding. A prioritization of CQAs can be done
using quality risk management. Part of quality risk management is risk
assessment, where process parameters and material attributes are linked to
CQAs. Since the list of potential parameters can be long, key parameters have
to be identified and then further studied to reach a high degree of process
understanding. DoE and mechanistic models are important tools that can be
applied in this procedure. The so-called design space is then used to
characterize the connection between process inputs and CQAs. It can be
represented in the form of ranges of process inputs or by more complex
mathematical relationships. Also, it can be described for single unit operations,
or, in order to achieve increased operational flexibility, for multiple operations.
To guarantee consistent product quality, a control strategy is necessary,
including in-process controls and controls of input materials, intermediates,

1 Introduction
11
container closure system, and drug products. Of particular importance is the
control of critical process parameters (CPP), which have an influence on critical
quality attributes. Process analytical technologies are a key tool for enhanced
process control approaches and will be discussed separately in Section 1.3. The
enhanced process understanding and control generated by the application of
these methods could support a trend from end-product testing towards in-
process or real-time release testing, which means that CQAs are measured and
controlled already during the process. Finally, it is advisable to implement
product lifecycle management to assess means of improving product quality
during the lifecycle of the product.
Implementation of these principles in the biopharmaceutical field and the
corresponding need for enhanced process understanding and control is
prompting research in areas like model-based process development (statistical
and mechanistic) and the development of PAT tools16,41,50–59. These topics will
be covered in the subsequent sections.
1.2.2 High-throughput process development and design of experiments
The high numbers of drug candidates and conditions that have to be tested and
the narrow time frames especially in manufacturability assessment and early
stage development call for efficient ways of data generation60,61. Here, one
suitable tool is high-throughput experimentation, which is characterized by a
large amount of automated, parallel experiments in very small scale. These are
facilitated by using robotic liquid handling stations, which are usually
equipped with arms for automated pipetting and for the handling of
microplates. Often, they have integrated capabilities for mixing, centrifugation
and analytics, which enable fully automated experimentation. In downstream
process development, high-throughput tools are for example used for the
screening of chromatographic separations, either in 96-well batch experiments
or also with mini columns that are compatible with automation62–65. Important
parameters like pH, salt, and protein concentration can be screened for
different resins and different salts in an efficient manner compared to
potentially dozens of chromatographic column runs62. Also in upstream process
development, high-throughput tools can be applied, for example in micro-scale
cultivations for the optimization of cultivation conditions66. For formulation
development, information on the phase behavior of biopharmaceuticals is
essential. It is strongly influenced by different factors like pH, salt type and
salt concentration, which can also be screened using high-throughput
methods67,68. Recently, high-throughput ADC conjugation approaches started
gaining attention since screening of multiple linker-payload combinations on
different conjugation sites at different conditions represents a practical

1.2 Strategies for process development of biologics
12
application69,70. When using these types of techniques, of course it has to be
shown, that the small-scale results are representative for the process scale
data.
Despite the use of high-throughput experimentation, it is still advisable to
reduce the amount of data that is necessary for process development by
experimental design. DoE means the “process of planning, designing and
analyzing the experiment so that valid and objective conclusions can be drawn
effectively and efficiently”71. Essentially, the dependence of relevant process
outputs on inputs like process parameters is to be investigated for a specified
range of inputs. DoE defines the number and type of experiments that are
conducted to cover this range efficiently. Using statistical models, the
relationship between inputs and outputs can then be described inside the
design space. One element of DoE is randomization of experiments, in order to
reduce experimental bias71. Another is replication, which is the repetition of an
experiment or a part of it to obtain an estimate of the experimental error.
Finally, it can make sense to group the experiments into blocks of experiments
that share a certain property like a batch of raw materials or different
operators. This is a way to eliminate variability between blocks from the
experimental error.
1.2.3 Model-based process development
As touched upon in the previous parts of this section, it can be advantageous
to use models in the support of process development. In all phases of the
implementation of QbD, for example, different types of models can be
employed54. By embodying a representation of the underlying process, they can
help reducing experimental effort, increase process understanding, and
facilitate process optimization leading to a better process and product16,54.
There are different ways to describe a process with a model, depending on the
available data and the degree of process understanding. Empirical or statistical
models derived from DoE data as mentioned in the previous section are also
called ‘black box’ models, since only a mathematical relationship between
process input and output is computed. Here, a comparably low degree of process
understanding is necessary, which can be helpful for very complex processes54.
On the other side, there are mechanistic models, by analogy called ‘white box’
models, trying to capture the physicochemical properties of the system. This
approach requires more process understanding. Equations describing the
underlying processes have to be set up and suitable model parameters
determined. Due to their mechanistic nature, they have the advantage that a
good model is valid outside its calibration range. Finally, there are also ‘grey
box’ models with both mechanistic and empirical features. In fact, mechanistic
1 Introduction
13
models always have some empirical aspects and empirical models always have
a mechanistic part54.
An example for ‘grey box’ models are models based on quantitative structure-
activity relationships (QSAR). These models use structure-based molecular
descriptors, which are correlated to parameters of interest like
chromatographic behavior or precipitation propensity72,73. Empirical models
are for example used for the development of PAT tools, like correlating the
signals of process analyzers with product data (see Section 1.3)50,53,74. Typical
applications for mechanistic models can be computational fluid dynamics
(CFD) models for bioreactor selection or modeling the chromatographic
behavior of proteins (see Section 1.4)59,75,76.
1.3 Process analytical technology
In its 2004 guidance for industry the FDA defined PAT as a “system for
designing, analyzing, and controlling manufacturing through timely
measurements (i.e., during processing) of critical quality and performance
attributes of raw and in-process materials and processes with the goal of
ensuring final product quality”77. The U.S. regulatory agency promotes the
implementation of PAT tools with the purpose of supporting a trend towards
enhanced process understanding and control in development, manufacturing,
and quality assurance. The motivation is that this could move the strategy from
batch processing with laboratory testing in the direction of exploiting more
advanced, innovative approaches for product and process development and
analysis. Well understood, monitored and controlled processes and products
are in line with the QbD framework and might be able to mitigate quality risks
and regulatory concerns and at the same time improve efficiency for example
by facilitating continuous processing and real-time release77.
Besides process analyzers and process control tools, also multivariate tools for
design, data acquisition and analysis are necessary for the implementation of
PAT. In the following, the principles of the multivariate methods applied in
this work are described.
1.3.1 Principle component analysis
The principle component analysis (PCA) forms the basis for partial least
squares regression (PLS, Section 1.3.2) and is thus briefly touched upon in this
section. Its goal is to reduce many variables describing a set of objects to a
couple of so-called latent variables or principal components (PCs) that are
easier to interpret without losing important information. This often serves to

1.3 Process analytical technology
14
identify groups within the objects and can yield insight on which properties
affect the classification78. For determining a PCs of the data matrix X, which
consists of n observations and m variables (for example n samples with their
corresponding UV absorption spectra of m wavelengths), one way is to calculate
the directions or axes of greatest variance in the data. The a PCs, which are
linear combinations of the original variables, then represent a new coordinate
system that is able to describe the data more effectively. Every observation is
projected on every axis in the new coordinate system, yielding the scores matrix
T (n x a) with a score values for each observation. The scores are thus the new
coordinates of the observations. The loadings matrix P (a x m) contains m
loadings for each of the a PCs, constituting the ‘directions’ from the old
coordinate system to the new. The loadings state how much each PC is
influenced by each of the m old variables. Since a data reduction is performed
by reducing the number of variables, there is also a residual matrix E. The PCA
is consequently characterized by the following equation:
𝑋 = 𝑇𝑃T + 𝐸 (1.1)
Before conducting the PCA, it is often necessary to standardize the variables
because otherwise variables with high absolute values would dominate the
results. For that, the variables can be centered by subtracting their average
and scaled by dividing by their standard deviation. When working with spectra,
this step is in many cases omitted to not overemphasize regions with a low
signal and by that increase noise78. Its capability for data and noise reduction,
outlier detection and classification make it a typical method for exploratory
data analysis79.
1.3.2 Partial least squares regression
A regression problem is characterized by the goal of modeling one or more
dependent variables or responses based on a set of predictor variables.
Regression models are often used to predict target variables Y that are
otherwise more difficult to determine by relating them to more easily accessible
variables X. A very common example is relating analyte concentration to
absorbance. Partial least squares (PLS) regression in its basic form is a linear
multivariate regression method, which is capable of handling a large number
of noisy, collinear X-variables, and also several dependent variables Y (in
contrast to multiple linear regression)80. A schematic description of the
principle of PLS regression is displayed in Figure 1.3. Essentially, in PLS
regression, two PCAs are performed, one on the X-data and one on the Y-data,
and the two PCAs influence each other78. Depending on the presence of one or
multiple Y-variables, either the y-vector or the vector u1 with the greatest
Euclidean norm out of the columns of Y is used as first estimate for the scores

1 Introduction
15
vector t1 of the first PC of the PCA on the X-data (subscript 1 refers to the first
PC). With this scores vector, a weighted loadings vector w1 is determined by
minimizing the residual E in the following equation:
𝑋1 = 𝑢1𝑤1𝑇 + 𝐸 (1.2)
After then determining the actual scores t1 and loadings p1 of the first PC of
the X-data, the information is transferred to the y-data by using t1 to calculate
the loadings q1 of the Y-data. For several Y-variables, this process has to be
performed iteratively until t1 converges towards u1, which is updated in every
iteration based on q1. After calculating the first PC, its information has to be
deducted from X and Y and the procedure is repeated for the next PC. After
determining all PCs, the regression coefficients can be calculated from the
scores and loadings matrices. These form the linear multivariate regression
model, which can then be used to predict the response variables for new X-data.
PLS regression is one of the most common multivariate data analysis (MVDA)
tools used in PAT53. One important application is the use of spectroscopy in
PAT, because the recorded spectra can result in a great number of predictor
variables (e.g. wavelengths). Brestrich et al., for example, used it for the
selective in-line quantification of co-eluting proteins in chromatography81.
Figure 1.3: Principle of PLS regression. A PCA is performed for predictor data X as
well as response data Y. These two PCAs influence each other, resulting in a regression
model for the response. T and PT are the scores and loadings matrix for X, respectively,
while WT are the weighted loadings for X. U functions as the scores and QT as the
loadings matrix of Y. Figure adapted from Kessler78.
X
N
M
T
WT
PT
Y
N
K
U
QT
Y-data influencing PCA of X-data
X-data influencing PCA of Y-data

1.4 Mechanistic modeling of liquid chromatography for large biomolecules
16
1.4 Mechanistic modeling of liquid chromatography for large
biomolecules
1.4.1 Process chromatography for biologics
Chromatography is by definition a thermal separation process applied to
separating homogeneous, molecularly disperse mixtures. These mixtures
constitute a fluid phase, in the case described in this section a liquid.
Separation is achieved by introducing a second phase, which exhibits a
differential interaction with different molecules of the first phase. This means
the transfer of mass and energy between the phases, caused by a deviation from
thermodynamic equilibrium82. By then separating the phases, a separation of
the molecules from the mixture can be obtained. The second phase can be solid
or liquid, here only chromatography with a solid stationary phase is described.
It is called stationary, because it is fixed, in contrast to the first phase, which
is called mobile phase. In liquid chromatography (LC), the stationary phase is
usually packed into a cylinder, the system being called a chromatography
column. While the mobile phase is pumped through the column, the molecules
to be separated are retained by the solid phase by reversible, physical
adsorption processes. For process chromatography of biologics, the adsorbent
usually consists of a porous medium of packed beads or also membranes. Here,
only columns with porous bead packing will be regarded. Components of the
mobile phase with a higher affinity to the stationary phase have a higher mean
adsorption time and thus a lower migration speed through the column. This
can be exploited by collecting different fractions at the column end containing
the separated components. The process is usually monitored at the column end,
for example with UV absorption and conductivity detectors. In so-called
chromatograms, the detector signal is displayed and analyzed regarding
parameters like retention time of the components and resolution of the
separation. Furthermore, they can be used for quantification of the processed
components, given a suitable absorption profile.
In biopharmaceutical downstream processing, liquid chromatography is a very
common unit operation. Most purification processes contain between one and
three chromatography steps. Compared to small molecules, the processing of
biologics entails a number of different requirements. For example, biopolymers
like proteins are substantially bigger and thus have around 100 times smaller
diffusion coefficients, which impacts mass transfer characteristics83. Their
tertiary structure, vital for their intended function, can be negatively
influenced by solution conditions or physical effects like shear stress or
temperature. Consequently, preparative chromatography for biomolecules is
conducted with aqueous buffers avoiding extreme conditions (pH, salt,

1 Introduction
17
temperature etc.). Moreover, separation can in most cases only be achieved by
running linear or step gradients of varying solution properties, because of
highly different retention times82. A typical bind-and-elute process is composed
of at least an equilibration, load, wash, and elution step. In the first step, the
column is equilibrated to conditions that facilitate optimal binding of the
target, before the product solution is loaded. A wash step can for example serve
to remove weakly bound contaminants. In the elution, the solution conditions
are changed in order to ensure the complete removal of the product from the
column, which can then be collected at the column outlet, ideally separated
from impurities. In flow-through mode, the impurities are bound instead of the
product.
Three important techniques for the purification of biologics based on different
kinds of interactions between adsorbent and solutes are affinity (AC), ion
exchange (IEX), and hydrophobic interaction chromatography (HIC). In AC,
the adsorption is based on specific interactions between ligand and target. The
Protein A ligand used in mAb purification, for example, is a protein isolated
from Staphylococcus aureus, which specifically binds to the Fc region of the
antibodies. IEX exploits different charges between products and contaminants.
The charges strongly depend on the eluent pH and the isoelectric point of the
components. Retention is modified by varying the salt concentration of the
eluent, a high salt content effecting weaker binding.
HIC is of interest in the ADC field due to the hydrophobic nature of the drugs
that are used and is thus described in greater detail. For this type of
chromatography, hydrophobic ligands like phenyl or alkyl groups are used.
Like the name suggests, adsorption is caused by hydrophobic interactions
between hydrophobic patches of the protein and these hydrophobic ligands.
Kosmotropic salts, in contrast to chaotropic salts, promote hydrophobic
interactions by the way they interact with water molecules, influencing the
chemical potential of the protein in solution84,85. Due to this effect, a high
concentration of rather kosmotropic salts is generally used for equilibration
buffers in HIC. Elution is then induced by lowering the salt content. HIC is a
common step for mAb polishing, but it is also applied to the separation of
antibody-drug conjugates with different levels of conjugation (preparatively as
well as analytics)70,86–88.
When developing a chromatography step for a biopharmaceutical product, it is
crucial to optimize the process for yield, purity, and productivity, while keeping
in mind high adsorber costs and strict timelines. The parameter space is large
and thus process development time-consuming and costly. This is why high-
throughput tools, DoE, and increasingly also mechanistic models are applied
to efficiently design robust and high-quality processes12,14,15,63,65,89–92. The next

1.4 Mechanistic modeling of liquid chromatography for large biomolecules
18
section gives an introduction to the mechanistic modeling of column
chromatography.
1.4.2 Mechanistic chromatography modeling
The function of a mechanistic model for a chromatography process is to describe
mathematically what is happening inside the column, from fluid dynamics over
mass transfer to adsorption. A calibrated model can then be used in different
ways, for example to generate process understanding, for process optimization,
or even root-cause investigations89,90,93,94.
For a time and space dependent process, dynamic and microscopic balances
have to be used94. Common models for chromatographic columns are usually
based on one-dimensional mass balances as shown in Figure 1.4. This is based
on assuming a homogeneous bed of equal and spherical particles, constant fluid
density and viscosity, negligible radial distributions, and no convection inside
the particles94. Furthermore, an isothermal process and inert eluents are
assumed. With a set of different, connected models, it is possible to describe the
adsorption equilibrium between fluid and solid phase, the components’
resistance to mass transfer, and the fluid dynamics inside the column.
Depending on their complexity, chromatography models may include different
numbers of the effects displayed in Figure 1.4 in addition to convective
transport.

1 Introduction
19
Figure 1.4: Processes in chromatographic columns, which can be modeled by setting
up differential mass balances. Not included in the figure is surface diffusion, which
can also contribute to mass transfer inside the pores. Figure adapted from Seidel-
Morgenstern et al.94.
For calibrating the models, a number of parameters and properties of the
system have to be determined. Some are usually provided by manufacturers,
some are accessible experimentally, and some need to be estimated
numerically. Basic parameters like volumes and porosities can be determined
by injections of non-interacting tracers94. The column volume Vc is split into
the interstitial volume Vint (mobile phase) and the volume of the stationary
phase Vads, which consists of the solid part Vsol and the pore volume Vpore. In
Equation 1.3, 1.4, and 1.5 the porosities calculated from these volumes are
displayed. εint is the interstitial porosity, εp the porosity of the stationary phase,
and εtot the total column porosity.
𝜀int =𝑉int𝑉c
(1.3)
𝜀p =𝑉pore
𝑉ads (1.4)
𝜀tot =𝑉int + 𝑉pore
𝑉c= 𝜀int + (1 − 𝜀int)𝜀p (1.5)
dx
Convection
Dispersion 1
2
3
1 - Film diffusion
2 - Pore diffusion
3 - Adsorption

1.4 Mechanistic modeling of liquid chromatography for large biomolecules
20
The interstitial porosity is used to determine the interstitial velocity of the
mobile phase uint in Equation 1.6. �̇� is the volumetric flow rate and dc the inner
diameter of the column.
𝑢int =�̇�
𝜀int ∙ 𝜋 ∙𝑑c2
4
(1.6)
In this work, the transport-dispersive model (TDM), a lumped-rate model, was
used. It comprises an axial dispersion term Dax, covering the influence of
hydrodynamic effects on band broadening (e.g. quality of the packing). Inside
the beads, concentration distribution is not taken into account. Instead, the
TDM includes a lumped coefficient, the effective film transfer coefficient, keff,
which combines external and internal mass transfer resistances (film diffusion,
pore diffusion, and surface diffusion). A balance for the mobile phase (Equation
1.7) and a balance for the stationary phase (Equation 1.8) are necessary to
describe the system. Equation 1.7 gives the change of the concentration ci(x,t)
of component i in the mobile phase. The first term, describing the convective
transport, is affected by the interstitial velocity uint. In the middle is the mass
transfer term, containing keff,i, which is also influenced by εint, the particle
radius rp, and the difference between ci and the pore concentration cp,i. The last
term is the axial dispersion term.
𝜕𝑐𝑖𝜕𝑡
= −𝑢int ∙𝜕𝑐𝑖𝜕𝑥
−1 − 𝜀int𝜀int
∙ (𝑘eff,𝑖 ∙3
𝑟p∙ (𝑐𝑖 − 𝑐p,𝑖)) + 𝐷ax ∙
𝜕2𝑐𝑖
𝜕𝑥² (1.7)
𝜀p ∙𝜕𝑐p,𝑖
𝜕𝑡+ (1 − 𝜀p)
𝜕𝑞𝑖𝜕𝑡
= 𝑘eff,𝑖 ∙3
𝑟p∙ (𝑐𝑖 − 𝑐p,𝑖) (1.8)
The balance for the particle phase (Equation 1.8) is strongly dependent on the
particle porosity εp and it relates the pore concentration cp,i to the concentration
adsorbed to the solid phase qi and the concentration in the mobile phase ci. The
concentration loaded to the adsorber is a function of the pore concentration. In
the case of the transport-dispersive model, no adsorption kinetics are
considered and the equilibrium is given by an isotherm equation. Apart from
common isotherms like Langmuir, various isotherms have been published for
different types of adsorbers75,95–97. Depending on the isotherm, they take into
account factors like salt content, concentration dependent parameters, and
shielding of binding sites by bound proteins.

21
2 Thesis outline
2.1 Research proposal
Antibody-drug conjugates for cancer treatment are one of the recent, promising
modalities taking to the growing biopharmaceutical market. Together with
other new formats, they contribute to a diversifying product pipeline. While
this diversification results in new solutions for so far unmet medical needs, it
also poses challenges to biopharmaceutical process development by impairing
the use of platform approaches. At the same time, the pressure to minimize
time to market is intensified by immense development costs and growing
competition. Another great challenge for process development is the
implementation of the ‘quality-by-design’ concept, called for by regulatory
agencies. It requires enhanced process and product understanding and control
in order to move away from mostly heuristic approaches in process
development.
Being composed of monoclonal antibodies and cytotoxic small molecule drugs,
ADCs are hybrid molecules with inherent development challenges regarding,
for example, product heterogeneity and pharmacokinetics. These specific
characteristics have to be handled, while at the same time meeting the general
challenges of biopharmaceutical process development given above. This
requires the application of new tools facilitating an efficient, systematic, and
knowledge-based process development. The focus of this thesis is the
establishment of high-throughput, analytical, and digital methods for the
purpose of advancing process development of ADCs in this direction.
A key area of ADC research is the development of site-specific conjugation
strategies with the goal of increasing homogeneity and reducing drug
deconjugation of next generation ADCs. The different approaches for site-
specific conjugation often require multiple reaction steps that comprise many
parameters to be screened and optimized. Examples are different conjugation
chemistries, types and concentrations of reactants, reaction times, and solution
conditions like the pH and buffer. For an efficient characterization of the design
space, high-throughput tools combined with DoE approaches are highly suited.
However, especially when intermediate buffer exchange steps and protein
quantification are needed, it is not straightforward to perform such complex
processes in a fully automated fashion. In a first study, the challenge of
2.1 Research proposal
22
transferring a multi-step conjugation process for site-specific conjugation of
antibodies to a robotic liquid handling station is faced. The high-throughput
platform needs to include an intermediate high-throughput buffer exchange
and automated determination of the protein concentration with process
feedback. Another challenge is the development of high-throughput compatible
analytics for assessing the result of the reaction. Once developed, the
applicability of the platform will be investigated in a parameter screening
based on DoE and the comparability to a different scale will be evaluated.
Naturally, it is not only of interest to determine parameters like the protein
concentration after process steps are completed. In order to implement process
control strategies, new ways of monitoring critical process parameters (CPPs)
and critical quality attributes (CQAs) have to be included in process
development. An important CQA of ADCs is the drug-to-antibody ratio (DAR),
which strongly influences efficacy and safety of the product. It is generally
determined by analytical chromatography after stopping the reaction, which is
not very feasible for an application as part of a PAT tool for reaction
monitoring. This requires a method for assessing the progress of ADC
conjugation reactions on-line, which will be the focus of the second study2. The
goal will be the establishment of a fast analytical method for determining the
degree of conjugation without the need for any sample handling. UV/Vis
absorption spectroscopy is widely used in biopharmaceutical manufacturing
and will be investigated as a fast, quantitative, and noninvasive technique. To
this end, it will be examined, if the conjugation reaction of a small surrogate
drug molecule to an antibody causes a spectral change. This change could then
possibly be correlated to the amount of conjugated drug in the solution and
thus the reaction progress. Multivariate data analysis will be applied to
establish this correlation. One important part of the study will be underlining
the validity of the approach by using different surrogate drug molecules and
different experimental setups with different detectors. The final method may
help reduce an analytical bottleneck in ADC process development and allow for
real-time process monitoring, a prerequisite for the implementation of PAT
approaches.
Another essential part in transforming conjugation process development
towards more QbD-focused approaches is addressing it from a mechanistic
angle. A kinetic model of the conjugation reaction, a central step in making
ADCs, would facilitate the prediction of the product composition at any point
of the reaction, enabling in silico parameter screening and optimization,
possibly outside the calibration range. At the same time it could yield
information on the underlying mechanism and thus benefit process and
product understanding. Since no such models exist for ADC conjugations, the

2 Thesis outline
23
third study will have the goal of creating a kinetic reaction model for a site-
specific conjugation to a mAb3. For achieving an accurate model of the
underlying process, different model structures will be set up and tested. The
relevance for ADC process development will be demonstrated by optimizing the
modeled process towards low consumption of drug and a short reaction time.
Efficient drug use is crucial due to its high cost and toxicity. The need for better
process understanding will be further addressed by investigating the influence
of different salts on reaction kinetics. Finally, a combination of the kinetic
model with the reaction monitoring approach developed in the second study is
intended, which could expand its capabilities for on-line process assessment.
As elaborated above, the DAR is critical for the quality of the final ADC
product. Initially, the DAR is set by the conjugation, which will be addressed
in the other studies outlined in this proposal. It is also possible, however, to
adjust the DAR post conjugation. To do so, it might be necessary to remove
unconjugated mAb or components with unfavorable degrees of conjugation. For
achieving this separation, hydrophobic interaction chromatography is the most
suitable method due to additional hydrophobicity introduced by the conjugated
drugs. For a critical quality attribute like the DAR, it is important to
understand the relationship between process and product performance and to
ensure the robust achievement of a specified range. Fulfilling these
requirements usually involves extensive experimental effort. In order to reduce
the lab work and possibly widen the design space and increase robustness,
mechanistic models can be applied. After establishing a model for the
conjugation reaction, it will thus be the goal of a forth study to develop a
mechanistic HIC model for the separation of different ADC components. First,
an adsorber exhibiting sufficient separation of the components will be
identified, before a suitable column model and a model for the adsorption
equilibrium are selected. In case of successful model calibration, it will be
important to validate the capability of the model to calculate optimized HIC
conditions for different load compositions. The accurate prediction of process
outcomes like yield and DAR in the HIC pool needs to be validated. Finally, a
combination with a mechanistic model for the conjugation reaction could be
beneficial since both steps influence the final DAR.
2.2 Outline and author statement
24
2.2 Outline and author statement
In Chapter 4, first authorship was shared (contributed equally) among my
colleague Matthias Rüdt and me. This was undertaken to elevate the quality
of our common publication. A detailed listing of author contributions signed by
the respective authors is given in the Appendix of the examination copy. In
general, work connected to antibody conjugation reactions as put forward in
Abstract and Research proposal has been performed by myself. Fundamentals
for techniques concerning PAT used throughout the study, have been laid by
the thesis of Rüdt, M. (2018) ‘Spectroscopy as process analytical technology for
preparative protein purification’.
Chapter 3: Multi-step high-throughput conjugation platform for
the development of antibody-drug conjugates
S. Andris, M. Wendeler, X. Wang, J. Hubbuch
Journal of Biotechnology (2018), Volume 278, Pages 48–55
In Chapter 3, an automated high-throughput platform for antibody conjugation
reactions was developed on a robotic liquid handling station. Site-specific
approaches for the generation of antibody-drug conjugates often require
multiple steps including an intermediate buffer-exchange. The proposed
method contains all typical steps for the site-specific conjugation to engineered
cysteine residues and facilitates a buffer-exchange using a batch cation-
exchange step. A subsequent automated protein quantification with process
feedback provides the means for accurate adjustment of reagent concentrations
in the following steps. For showcasing the application of the platform towards
efficient process characterization, a high-throughput conjugation DoE was
conducted. Finally, the high-throughput platform showed comparable results
in a comparability-study with a mL-scale manual conjugation approach.

2 Thesis outline
25
Chapter 4: Monitoring of antibody-drug conjugation reactions
with UV/Vis spectroscopy
S. Andris*, M. Rüdt*, J. Rogalla, M. Wendeler, J. Hubbuch
(*contributed equally)
Journal of Biotechnology (2018), Volume 288, Pages 15-22
In this article, the real-time monitoring of an antibody-drug conjugation
reaction using UV/Vis absorption measurements and PLS regression is
demonstrated. Conjugation experiments with two maleimide-functionalized
surrogate drugs were conducted in a microplate setup as well as in 20 mL scale.
A change in the UV/Vis absorption spectra was recorded with a Tecan
microplate reader and a diode array detector (DAD), respectively. This change
was correlated to the course of the reaction i.e. the amount of conjugated drug.
To this end, PLS regression models were generated for the different drug
molecules and the different setups and subsequently validated using cross-
validation. The microplate models were additionally validated with an external
test data set.
Chapter 5: Kinetic reaction modeling for antibody-drug
conjugate process development
S. Andris, J. Seidel, J. Hubbuch
Journal of Biotechnology (2019), Volume 306, Pages 71-80
Chapter 5 investigates the mechanistic modeling of the reaction kinetics of
antibody-drug conjugations and its application to process development. Six
model structures with different assumptions regarding the mechanism were
set up in the form of ordinary differential equations (ODEs). For model
calibration, selection, and validation, 21 experiments with varying starting
concentrations of the reactants were conducted and kinetics were recorded.
After model calibration with 12 experiments, the best model was selected using
cross-validation. The best model was additionally validated with an external
test data set containing 9 experiments. To further enhance process
understanding, the influence of different salts on the reaction rate was studied.
Next, the application of the model to in silico process screening and
optimization was demonstrated. Finally, the combination of the kinetic model
with the reaction monitoring tool established in Chapter 4 was investigated.
2.2 Outline and author statement
26
Chapter 6: Modeling of hydrophobic interaction
chromatography for the separation of antibody-drug conjugates
and its application towards quality by design
S. Andris, J. Hubbuch
Journal of Biotechnology (2020), Volume 317, Pages 48-58
In Chapter 6 the application of mechanistic modeling to the preparative
separation of ADC components using HIC was investigated. After thoroughly
characterizing the system and the column, linear and step gradient runs with
different load compositions were conducted for model calibration. The model
parameters of the transport-dispersive model and a suitable adsorption
isotherm were either determined experimentally or through parameter
estimation. Using the model, optimized step gradient conditions were
calculated and the successful prediction of peak profiles, yield and DAR was
validated. Next, an in silico case study was conducted demonstrating the
capabilities of the model to increase robustness in achieving the target DAR by
reacting to variations in the conjugation. In the last part, the HIC model was
combined with the kinetic reaction model established in Chapter 5, in order to
study the interplay between conjugation and HIC purification in reaching the
target DAR.

27
3 Multi-step high-throughput conjugation
platform for the development of antibody-drug
conjugates
Sebastian Andrisa, Michaela Wendelerb, Xiangyang Wangb, Jürgen Hubbucha *
a Institute of Process Engineering in Life Sciences, Section IV: Biomolecular
Separation Engineering, Karlsruhe Institute of Technology, Fritz-Haber-Weg
2, 76131 Karlsruhe, Germany
b MedImmune LLC, Gaithersburg, Maryland 20878, United States
* Corresponding author
Abstract
Antibody drug conjugates (ADCs) form a rapidly growing class of
biopharmaceuticals which attracts a lot of attention throughout the industry
due to its high potential for cancer therapy. They combine the specificity of a
monoclonal antibody (mAb) and the cell-killing capacity of highly cytotoxic
small molecule drugs. Site-specific conjugation approaches involve a multi-step
process for covalent linkage of antibody and drug via a linker. Despite the
range of parameters that have to be investigated, high-throughput methods
are scarcely used so far in ADC development.
In this work an automated high-throughput platform for a site-specific multi-
step conjugation process on a liquid handling station is presented by use of a
model conjugation system. A high-throughput solid-phase buffer exchange was
successfully incorporated for reagent removal by utilization of a batch cation-
exchange step. To ensure accurate screening of conjugation parameters, an
intermediate UV/Vis-based concentration determination was established
including feedback to the process. For conjugate characterization, a high-
throughput compatible reversed-phase chromatography method with a
runtime of 7 min and no sample preparation was developed. Two case studies

3.1 Introduction
28
illustrate the efficient use for mapping the operating space of a conjugation
process. Due to the degree of automation and parallelization, the platform is
capable of significantly reducing process development efforts and material
demands and shorten development timelines for antibody-drug conjugates.
3.1 Introduction
Antibody-drug conjugates (ADCs) constitute a class of therapeutic molecules
inspiring high hopes for patients as well as pharmaceutical companies on the
basis of their potential for cancer treatment. Around 60 ADCs in clinical trials
in the beginning of 2017 indicate the amount of resources that is currently and
has previously been invested in their development98. Until 2017, the only two
ADCs on the market were Seattle Genetics’s brentuximab vedotin (Adcetris)
and Genentech and Immunogen’s trastuzumab emtansine (Kadcyla), approved
in 2011 and 2013, respectively. In August 2017, inotuzumab ozogamicin
(Besponsa) by Pfizer was approved for relapsed or refractory B-cell precursor
acute lymphoblastic leukemia. The highly complex compounds consist of three
components: a monoclonal antibody (mAb), a cytotoxic drug and a linker
between the two. The intention is to combine the specificity of the mAb and the
cell-killing capacity of the small molecule drug in one compound, potentially
widening the therapeutic window compared to the individual cytotoxic drug.
Induced by the currently limited success of conjugation procedures where
random lysines or hinge cysteines are targeted, a generation of more
homogeneous ADCs with site-specific conjugation strategies is currently in
development. These strategies enable control of drug-to-antibody ratio (DAR)
and conjugation site, both of which heavily influence efficacy, stability and
pharmacokinetics46,49,88,99,100. Site-specific conjugation to engineered cysteines
instead of hinge cysteines has been shown to improve the therapeutic index44.
To pave the way for this third generation of ADCs more than 40 site-specific
drug conjugate technologies have been developed, often in combination with
novel conjugation chemistries98. Many of these technologies require multi-step
conjugation processes, in which a range of parameters can be varied. For the
case of engineered cysteine mAbs, this usually involves a reduction step to
uncap engineered cysteines and a partial re-oxidation step to reform interchain
cysteines. Additionally, the residual reduction agent has to be removed before
oxidation and conjugation. This adds further development challenges to the
existing ones being the selection of the best target antigens and cytotoxic drugs
and the development of a linker system and a suitable conjugation chemistry.
Parameters like protein, reagent and drug concentrations have to be screened
as well as process conditions like temperature, reaction time and mixing.
As an appropriate measure to speed up the development process, high-

3 Multi-step high-throughput conjugation platform
29
throughput tools seem to be the logical choice. Yet they are only scarcely used
in ADC process development, judged by the amount of literature that is
available on the topic. In other biotechnological fields like the development of
chromatographic separations for downstream processes, high-throughput
screenings are widely used in academia and industry63,66,101–103. One of the
reasons is that for many multi-step conjugation processes an intermediate
buffer exchange or reagent removal step is necessary44,87,99,104,105, which is more
complicated to realize in a high-throughput way than simple pipetting and
mixing steps. The other issue can be, that in order to achieve defined process
conditions, concentration determination is necessary between steps, which is
also challenging to perform in an automated, high-throughput fashion.
Vink et al. transferred a dialysis step, which is widely used for buffer exchange,
to high-throughput scale in their 96 well crystallization block106. The challenge
with this approach is that the dialysis time lies in the range of several days,
which makes it less applicable to high-throughput conjugations. Source 30RPC
reversed-phase media was successfully used for buffer exchange in a platform
for high-throughput characterization of mAbs, but this strategy is suitable only
for analytical applications as elution was done with 50% acetonitrile and 0.1%
TFA at 50 °C 107.
With regard to antibody drug conjugation, three approaches for high-
throughput platforms were found in the literature. The first one by
Zimmerman et al. combines the cell free expression of azide amino acid
containing antibodies with their purification and conjugation108. The
purification was done using IMAC Phytips (Phynexus Inc, San Jose, USA)
which require His-tagged proteins. The buffer exchange after conjugation was
performed with special gel filtration plates. Since the conjugation was a single-
step process, no protein quantification was integrated. Catcott et al. proposed
a microscale platform for a single-step conjugation process where 30 kDa filter
plates are used for reagent removal by repeated centrifugation and buffer
addition, resulting in a diafiltration type buffer exchange69. They demonstrated
the applicability to ADC lead selection. A solid-phase site-specific conjugation
methodology was developed by Puthenveetil et al. consisting of a multi-step
conjugation to engineered cysteines where each step is conducted with the
antibody bound to Protein A/L beads70. This facilitates the removal of reagents
or the exchange of buffers by washing the beads with the desired buffer but
raises the question of the comparability to solution-phase conjugations.
What becomes apparent is the absence of an automated high-throughput
platform for a multi-step solution-phase conjugation process with broad
applicability to site-specific conjugations. This work proposes, at the example
of the multi-step conjugation to engineered cysteine antibodies, the transfer of
the complete sequence of steps needed for this reaction to a robotic liquid
handling station. The 96-well high-throughput process includes an automated

3.2 Materials and Methods
30
intermediate buffer exchange, using a cation-exchange resin, with subsequent
protein quantification. Instead of cytotoxic payloads, non-toxic fluorophores are
used as surrogate drugs. The suitability of the approach to screen conjugation
reaction conditions is demonstrated and the comparability to reactions in
milliliter scale is investigated.
3.2 Materials and Methods
3.2.1 Chemicals
For reduction of disulfides tris(2-carboxyethyl)phosphine hydrochloride
(TCEP, Sigma-Aldrich, St. Louis, USA) was used. (L)-dehydroascorbic acid
(DHA, Sigma Aldrich) was used for re-oxidation of interchain disulfides. As
substitute for a cytotoxic drug 7-Diethylamino-3-(4'-Maleimidylphenyl)-4-
Methylcoumarin (CPM, Sigma-Aldrich) was selected. Dimethyl sulfoxide
(DMSO, Sigma Aldrich) was necessary to dissolve DHA and CPM. N-acetyl
cysteine (NAC, Sigma Aldrich) was applied as quenching reagent. For buffer
preparation NaH2PO4 x 2 H2O and K2HPO4 were obtained from VWR
International GmbH (Darmstadt, Germany) and NaCl and KCl from Merck
KGaA (Darmstadt, Germany). All buffers were titrated to the desired pH with
4 M NaOH (Merck KGaA) and filtered through a 0.2 µm cellulose acetate
membrane filter (Sartorius AG, Göttingen, Germany).
3.2.2 Model system and conjugation process
Purified IgG1 mAb with two engineered cysteines as conjugation sites was
provided at a concentration of 12.4 mg/mL in PBS (+5 mM EDTA, pH 7.2) by
MedImmune, LLC. CPM was used as a non-toxic maleimide-functionalized
surrogate drug and conjugated to the antibody’s engineered cysteines via its
maleimide linker. The reaction scheme is shown in Figure 3.1. The initial step
in the conjugation process was a mild reduction with TCEP to uncap
engineered cysteine residues. To re-establish interchain disulfides, reduction
was followed by partial re-oxidation. The conjugation reaction was stopped by
addition of excess NAC. Detailed process and reagents are described in the
following section.

3 Multi-step high-throughput conjugation platform
31
Figure 3.1: Reaction scheme for the conjugation reaction. The maleimide functionality
of the CPM molecule reacts with the thiol group of the two engineered cysteine residues
of the antibody, forming a stable thioether bond.
3.2.3 Multi-step high-throughput conjugation
An overview of the process is shown in Figure 3.2. Automated liquid and
microplate handling was done on a Freedom EVO 200 platform (Tecan Group
Ltd., Männedorf, Switzerland) with an integrated Infinite 200 PRO multimode
plate reader (Tecan Group Ltd.). The platform was controlled via the Freedom
EVOware software (Tecan Group Ltd.). All steps were performed at a
temperature of 22 °C. For all incubation steps, the microplate was covered by
a lid to minimize evaporation.
The purified antibody was transferred to a 96 well U-bottom polypropylene
(PP) microplate (#650201, greiner bio-one GmbH, Frickenhausen, Germany)
and diluted to the desired concentrations with 50 mM sodium phosphate buffer
at pH 7.2 (“equilibration buffer”), resulting in a volume of 245 µL per well. For
global reduction of disulfides 40 molar equivalents of TCEP in equilibration
buffer were added. The plate was incubated for 2 h 15 min on the integrated
orbital shaker (Te-ShakeTM; Tecan Group Ltd) at 700 rpm. During the
reduction, a 96 well 0.2 µm GHP filter plate (#8082, AcroPrepTM Advance; Pall
Corporation, New York, USA) was manually prefilled with a strong cation-
exchange resin (POROSTM XS; #4404338, Life technologies, Foster City, USA).
Each well was filled with 65 µL of 56% slurry in 18% ethanol. The filter plate
was placed inside the liquid handling station for further processing. First, the
storage solution of the resin was removed using the integrated Te-VacSTM
vacuum filtration system (Tecan Group Ltd.). Next, the resin was equilibrated
three times with 200 µL of equilibration buffer. To prevent the resin from
drying out, the equilibration was programmed to be finished shortly before the
end of the reduction step. The equilibrated resin was used to remove TCEP
after the reduction, conducting a solid phase buffer exchange. 225 µL of
reduced mAb solution were transferred to the filter plate to be loaded onto the
resin. After 15 min of orbital shaking at 1000 rpm, the load solution was
removed and the resin with bound mAb was washed once with 150 µL of
equilibration buffer. The first elution step was done by adding 112.5 µL of 50
3.2 Materials and Methods
32
mM sodium phosphate buffer with 500 mM NaCl (“elution buffer”) and
incubating for 10 min while shaking at 1000 rpm. The eluate 1 was removed
by vacuum filtration and collected in a 96 well F-bottom PP microplate
(#655201, greiner bio-one), before conducting the second elution in the same
way. Eluate 1 and 2 were mixed at 1000 rpm for 80 s. With 25 µL of the
resulting 225 µL of eluate a concentration determination was conducted (see
next paragraph) and the pipetting volumes were updated accordingly by
Matlab (Mathworks, Natick, USA). Then, the re-oxidation of interchain
disulfides was started by addition of 20 molar equivalents of DHA dissolved in
DMSO. The plate was incubated for 1-4 h with mild mixing (700 rpm). For the
conjugation reaction, the surrogate drug CPM was dissolved in DMSO and
added to the re-oxidized antibody in molar excess depending on the application.
After 45 min, a molar excess of 12 equiv of NAC over CPM dissolved in
ultrapure water was added to quench the reaction.
Figure 3.2: High-throughput platform for conjugation process development on
automated liquid handling station. The concentration c stands for the mAb
concentration after the buffer exchange step, which is determined to calculate reagent
concentrations for the following steps.
3.2.4 Protein quantification
This step is part of the Freedom EVOware script which was created for the
whole process. After the buffer exchange step, the resulting protein
concentration in the eluate has to be determined. For this purpose, a 25 µL
sample is taken from each well and diluted with 175 µL of elution buffer in a
96 well UV-Star microplate (#655801, greiner bio-one). With the integrated
plate reader, absorption at 280 nm is measured and the resulting excel file is
automatically accessed by Matlab. With a previously determined calibration
UPLC
RP-
with
Analyze
Sampling
& Dilution
Measure
A280 →
Excel
Access via
Matlab &
calculate c Write c in
Excel
Access with
EVOwareReduction
Prefill filter plate
with CEX slurry
Equilibration
Reduced
mAb
LoadWash
2x Elution Partial Re-oxidation
ConjugationQuenching
Determine
concentration

3 Multi-step high-throughput conjugation platform
33
factor the protein concentration is calculated and entered into the source excel
file, from which EVOware receives the pipetting volumes. This way, the mAb
concentration is updated during the process to achieve accurate molar ratios
for oxidation and conjugation.
3.2.5 Optimization and characterization of CEX buffer exchange step
In the experiments conducted to optimize slurry volume and determine yield
and reproducibility, the buffer exchange procedure was generally as described
in the high-throughput conjugation section. To be able to determine the yield
of the steps, load, wash and elution were collected in UV-Star microplates and
the concentrations were determined with the Tecan plate reader. For
concentrations over 2 mg/mL, samples were diluted with elution buffer for the
measurement. The slurry volume study was run with a starting mAb
concentration of 10 mg/mL, which equals a loading of 53-73 g per liter of resin
for the investigated slurry volumes of 55-75 µL. To reduce material
consumption, the reproducibility study was run at 2 mg/mL.
3.2.6 Analytics
To assess the result of the conjugation, reversed-phase ultra-high performance
liquid chromatography (RP-UHPLC) was applied. A Dionex Ultimate 3000
system was used, equipped with pump unit, RS autosampler, RS column
compartment and diode array detector (Dionex Softron GmbH, Germering,
Germany). No sample preparation like reduction was required for this method
as the native mAbs were analyzed. An Acquity UPLC Protein BEH C4 column
(#186004495, Waters Corporation, Milford, USA; 300 Å, 1.7 µm, 2.1 mm x 50
mm) was used with a flow rate of 0.45 mL/min at a temperature of 80 °C.
Solvent A consisted of 0.1% trifluoroacetic acid (TFA) in ultrapure water,
solvent B was 0.1% TFA in acetonitrile. Equilibration and injection were done
at 26% B. After 0.2 min, % B was raised to 30%. Then, a 4.8 min gradient from
30% to 38% B was run for separation of the conjugated samples. Including the
following strip at 95% B and 1.2 min of re-equilibration the entire method had
a runtime of 7 min. UV signals at 280 nm and at the corresponding absorption
maximum of the used surrogate drug were recorded (384 nm for CPM).
Concentrations of ADC species were calculated using a calibration curve for
mAb concentrations and the ratio of CPM absorption at 280 nm and 384 nm.
To determine monomer content, a TSK Gel SuperSW mAb HTP 4.6x150 mm
column (#22855, Tosoh Bioscience, Griesheim, Germany) was used with
isocratic flow of SEC-buffer (200 mM K2HPO4, 250 mM KCl, pH 7) for a
runtime of 8 min (0.3 mL/min).

3.2 Materials and Methods
34
3.2.7 High-throughput conjugation DoE
A central composite face-centered design with 3 center points was created with
the statistics software MODDE 10.1 (Sartorius Stedim Data Analytics AB) to
test the high-throughput approach with the mAb and CPM model system. mAb
concentration and CPM excess were varied as factors in the DoE. mAb
concentration range was set between 2 and 6 mg/mL and CPM excess between
2 and 10 equiv. All runs were performed at once according to the high-
throughput conjugation procedure described above, except reduction was run
for 3 h and oxidation for 4 h. Samples were analyzed using RP-UHPLC.
3.2.8 Comparability study
To showcase the potential of the high-throughput platform and at the same
time show comparability with a standard mL-scale procedure, the reaction
kinetics of the model conjugation system were investigated once using the
described high-throughput approach and once in mL-scale. For the mL-scale,
conjugation reactions were conducted manually in 2 mL centrifuge tubes
(Eppendorf AG, Hamburg, Germany), reduction and oxidation in 50 mL
centrifuge tubes (VWR). The same conditions, reagents and incubation times
were used as for the high-throughput conjugation. During all incubation steps,
light mixing was applied with Thermo Mixer MKR 13 (HLC BioTech,
Bovenden, Germany). After reduction, a buffer exchange was performed by
dialysis to remove residual TCEP. For this, Slide-A-Lyzer dialysis cassettes
(#66807, Thermo Fisher Scientific) with a 10,000 Da molecular weight cut off
(MWCO) were used in 2.0 L of equilibration buffer at 4 °C (overnight). For
concentration determination after buffer exchange, a NanoDrop 2000c
spectrometer (Thermo Fisher Scientific) was used. The model system consisted
of the engineered antibody and CPM which was used as a surrogate drug and
conjugated to the antibody’s engineered cysteines.
2 and 4 mg/mL of antibody were selected as starting concentrations and
duplicates were run for both concentrations. To assess the kinetics, the reaction
was quenched at different time points up to 20 min. For the HTC, a separate
well was assigned to each time point and quenched accordingly. In mL-scale,
100 µL samples were drawn from the tubes at each time point and added to a
prepared quenching plate containing NAC. All samples were analyzed by RP-
UHPLC, the ones from the HTC also with size-exclusion chromatography
(SEC).

3 Multi-step high-throughput conjugation platform
35
3.3 Results and Discussion
3.3.1 Implementation of high-throughput conjugation process on liquid handling
station
The model process utilized for this work consisted of the site-specific
attachment of a maleimide-functionalized fluorophore (surrogate drug) to two
engineered cysteine residues in a mAb. This process involves multiple steps:
reduction with TCEP to remove capping groups from the engineered cysteines;
removal of reducing agent via buffer exchange; re-oxidation of interchain
disulfide bonds with DHA; conjugation with the maleimide-functionalized
surrogate drug; quenching of residual free drug by addition of NAC. To obtain
a fully automated, high-throughput, microscale conjugation process, every part
of the multi-step conjugation process had to be transferred to the liquid
handling station, with the most challenging being the high-throughput buffer
exchange. Weight-based liquid classes were generated for pipetted solutions to
assure high accuracy in pipetting (data not shown). To reduce loss when
transferring samples, U-bottom microplates were used. This way, all but
< 20 µL of a sample can be transferred from one plate to another.
Several methods were assessed regarding the high-throughput TCEP removal,
the first one being the commercially available Immobilized TCEP Disulfide
Reducing Gel (Thermo Scientific). The rationale was to conduct the reaction in
a filter plate and afterwards remove the reduced mAb solution via vacuum
filtration. This concept was abandoned due to insufficient reduction and
unspecific adsorption of the mAb to the agarose beads, which could not be
improved sufficiently by addition of low amounts of salt. Next, a size-exclusion
type approach was studied. Zeba Spin Desalting Plates (40 kDa MWCO,
ThermoFisher Scientific) were used to exchange the buffer and remove TCEP.
Here, the main drawback was the low maximal sample volume of 100 µL which
decreases flexibility or increases complexity for the application in the high-
throughput conjugation process. Also the use of ultrafiltration plates (Acroprep
Advance Omega 30 kDa, Pall) with repeated centrifugation and buffer addition
was discarded due to low reproducibility. The issues with all of these methods
could be eliminated by developing a buffer exchange step based on cation
exchange (CEX). To facilitate this high-throughput CEX-step, a high capacity
CEX-resin was pipetted into a 0.2 µm filter plate. As described in the methods
section, the reduced mAb was loaded onto the CEX-beads at low salt content
and pH 7.2, washed with equilibration buffer to ensure effective TCEP removal
and then eluted with high salt buffer also at pH 7.2 (500 mM NaCl). The
possibility to keep the pH constant is a great advantage compared to using a
Protein A resin like Puthenveetil et al. in their solid-phase conjugation
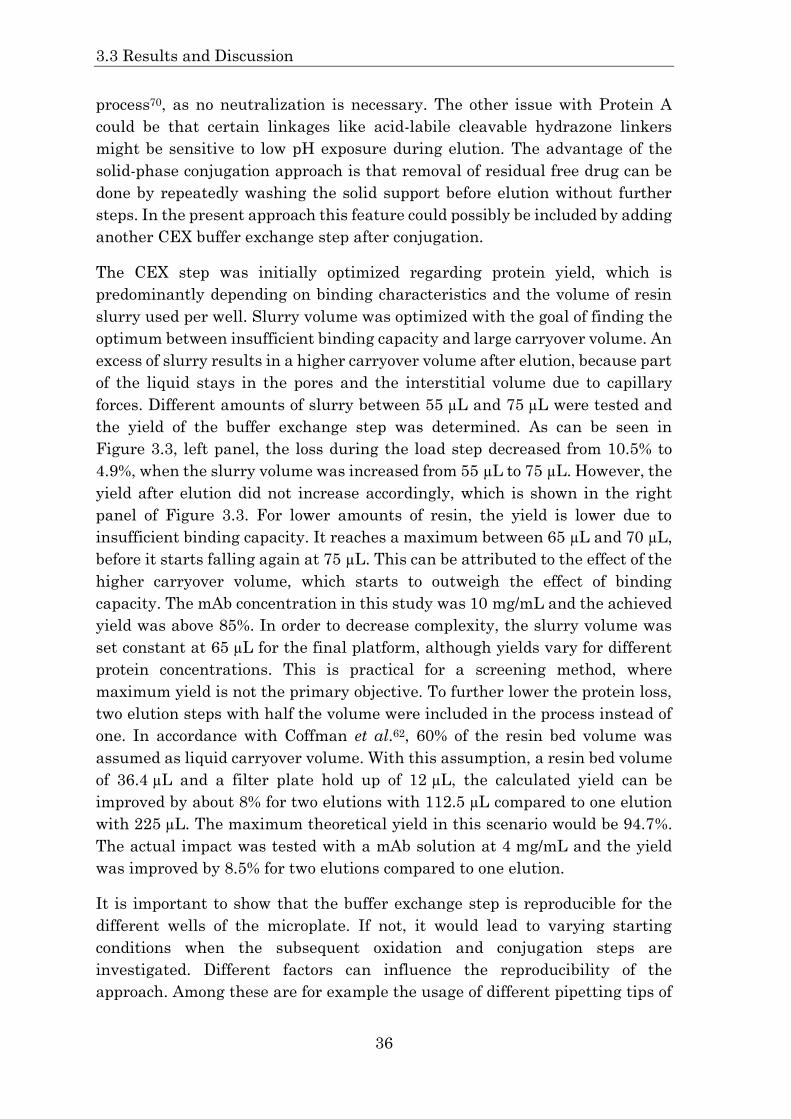
3.3 Results and Discussion
36
process70, as no neutralization is necessary. The other issue with Protein A
could be that certain linkages like acid-labile cleavable hydrazone linkers
might be sensitive to low pH exposure during elution. The advantage of the
solid-phase conjugation approach is that removal of residual free drug can be
done by repeatedly washing the solid support before elution without further
steps. In the present approach this feature could possibly be included by adding
another CEX buffer exchange step after conjugation.
The CEX step was initially optimized regarding protein yield, which is
predominantly depending on binding characteristics and the volume of resin
slurry used per well. Slurry volume was optimized with the goal of finding the
optimum between insufficient binding capacity and large carryover volume. An
excess of slurry results in a higher carryover volume after elution, because part
of the liquid stays in the pores and the interstitial volume due to capillary
forces. Different amounts of slurry between 55 µL and 75 µL were tested and
the yield of the buffer exchange step was determined. As can be seen in
Figure 3.3, left panel, the loss during the load step decreased from 10.5% to
4.9%, when the slurry volume was increased from 55 µL to 75 µL. However, the
yield after elution did not increase accordingly, which is shown in the right
panel of Figure 3.3. For lower amounts of resin, the yield is lower due to
insufficient binding capacity. It reaches a maximum between 65 µL and 70 µL,
before it starts falling again at 75 µL. This can be attributed to the effect of the
higher carryover volume, which starts to outweigh the effect of binding
capacity. The mAb concentration in this study was 10 mg/mL and the achieved
yield was above 85%. In order to decrease complexity, the slurry volume was
set constant at 65 µL for the final platform, although yields vary for different
protein concentrations. This is practical for a screening method, where
maximum yield is not the primary objective. To further lower the protein loss,
two elution steps with half the volume were included in the process instead of
one. In accordance with Coffman et al.62, 60% of the resin bed volume was
assumed as liquid carryover volume. With this assumption, a resin bed volume
of 36.4 µL and a filter plate hold up of 12 µL, the calculated yield can be
improved by about 8% for two elutions with 112.5 µL compared to one elution
with 225 µL. The maximum theoretical yield in this scenario would be 94.7%.
The actual impact was tested with a mAb solution at 4 mg/mL and the yield
was improved by 8.5% for two elutions compared to one elution.
It is important to show that the buffer exchange step is reproducible for the
different wells of the microplate. If not, it would lead to varying starting
conditions when the subsequent oxidation and conjugation steps are
investigated. Different factors can influence the reproducibility of the
approach. Among these are for example the usage of different pipetting tips of

3 Multi-step high-throughput conjugation platform
37
the liquid handling arm for different rows of the plate, inhomogeneity of the
vacuum filtration unit or the filter plate itself or inaccurate pipetting of the
slurry volume. For this reason, a reproducibility study was performed for the
CEX buffer exchange step with 18 wells at equal conditions in different parts
of the plate. The relative standard deviation of the mAb-concentration after
buffer exchange was at 1.6% for the different wells. This means that the
developed step is a robust way for a high-throughput buffer exchange
performed automatically by a liquid handling station without the need for
expensive commercial solutions or pH neutralization. Compared to dialysis,
which is often used for reagent removal or buffer exchange for smaller
volumes70,109,110 time savings are significant.
After TCEP removal, the next steps are re-oxidation and conjugation. For both
steps, reagents are added at a fixed molar ratio to antibody. This means that
before continuing the process, the protein concentration has to be determined
in order to calculate the correct amounts of DHA and surrogate drug to add.
For this purpose, an absorption-based protein quantification step was
successfully incorporated into the EVOware script, using Matlab to calculate
the new concentration and update the pipetting volumes in the excel source file
loaded by EVOware (see Methods section). In a single-step process like the
conjugation platform developed by Catcott et al.69, this in-process control is less
essential. For a multi-step process like site-specific cysteine conjugation
however, it contributes to guarantee defined process conditions for parameter
screenings during oxidation and conjugation.
Figure 3.3: Results of slurry volume study for TCEP removal step at 10 mg/mL of
antibody. Left: Protein loss during load for different resin slurry volumes. Right:
Protein yield of total buffer exchange step for different resin slurry volumes.
76%
78%
80%
82%
84%
86%
88%
55 60 65 70 75
Yie
ld
Resin slurry volume [µL]
0%
2%
4%
6%
8%
10%
12%
55 60 65 70 75
Lo
ss a
fter
Lo
ad
Resin slurry volume [µL]
3.3 Results and Discussion
38
3.3.2 Analytics
A high-throughput method is not functional without high-throughput
compatible analytics. To analyze the result of an antibody conjugation reaction,
conjugate species with different drug loading have to be separated and
detected. For this reason, a chromatographic separation assay was developed
with the focus on low method runtime. With the RP-UHPLC assay, sufficient
separation between unconjugated mAb, mono-conjugated mAb und di-
conjugated mAb was achieved with a total runtime of 7 min and no lengthy
sample preparation. An example chromatogram from the comparability study
is shown in Figure 3.4. The starting concentration was 2 mg/mL and the
conjugation was stopped after 45 s to have enough un- and mono-conjugated
mAb in the samples. The residual free drug is well separated from the
conjugate species. Between mAb and mono-conjugated mAb, resolution was
1.38, between mono- and di-conjugated mAb resolution was 1.56 (calculated
according to EP-Norm). Taking into account that in this case a small molecule
surrogate drug of about 400 Da is attached to a 150 kDa antibody and that
method runtime was of primary concern, separation was satisfactory. Due to
higher hydrophobicity of the real payloads used for ADCs, separation will be
improved. From the resulting peak areas, concentrations of the different
species and DAR can be calculated. Compared to methods in literature
separating ADC conjugate species with runtimes up to 50 min, this method
should be well suited to characterize ADCs in HTS applications70,111,112. A quick
size-exclusion based method would have the advantage that monomer content
and DAR can be determined at the same time69, but the amounts of different
conjugate species, which play a defining role for pharmacokinetics and
efficacy111, cannot be assessed.
Figure 3.4: Reversed-phase chromatogram of the analytical separation of
unconjugated, mono-conjugated, di-conjugated antibodies and residual free CPM. This
example was taken from the comparability study. The starting concentration was
2 mg/mL and the conjugation was stopped after 45 s.
-5
0
5
10
15
20
25
30
0 1 2 3 4 5 6 7
A2
80
[m
AU
]
Time [min]
mAb+2
mAb+1
mAb
Free drug
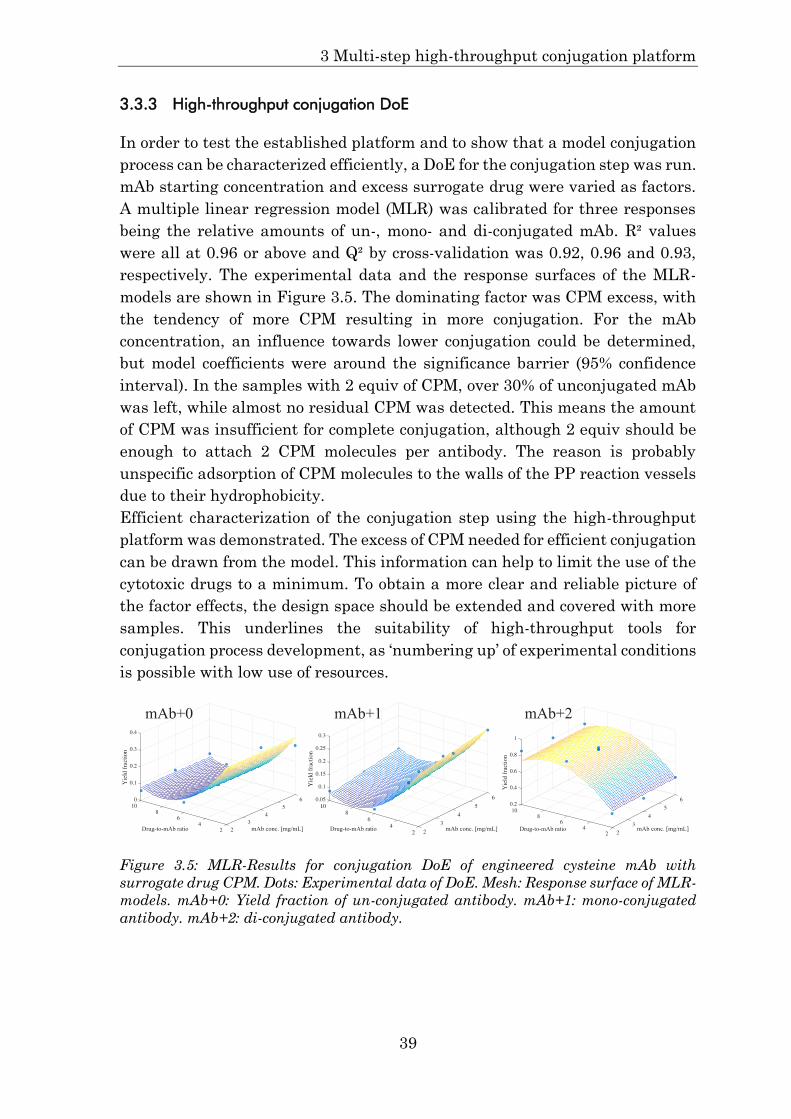
3 Multi-step high-throughput conjugation platform
39
3.3.3 High-throughput conjugation DoE
In order to test the established platform and to show that a model conjugation
process can be characterized efficiently, a DoE for the conjugation step was run.
mAb starting concentration and excess surrogate drug were varied as factors.
A multiple linear regression model (MLR) was calibrated for three responses
being the relative amounts of un-, mono- and di-conjugated mAb. R² values
were all at 0.96 or above and Q² by cross-validation was 0.92, 0.96 and 0.93,
respectively. The experimental data and the response surfaces of the MLR-
models are shown in Figure 3.5. The dominating factor was CPM excess, with
the tendency of more CPM resulting in more conjugation. For the mAb
concentration, an influence towards lower conjugation could be determined,
but model coefficients were around the significance barrier (95% confidence
interval). In the samples with 2 equiv of CPM, over 30% of unconjugated mAb
was left, while almost no residual CPM was detected. This means the amount
of CPM was insufficient for complete conjugation, although 2 equiv should be
enough to attach 2 CPM molecules per antibody. The reason is probably
unspecific adsorption of CPM molecules to the walls of the PP reaction vessels
due to their hydrophobicity.
Efficient characterization of the conjugation step using the high-throughput
platform was demonstrated. The excess of CPM needed for efficient conjugation
can be drawn from the model. This information can help to limit the use of the
cytotoxic drugs to a minimum. To obtain a more clear and reliable picture of
the factor effects, the design space should be extended and covered with more
samples. This underlines the suitability of high-throughput tools for
conjugation process development, as ‘numbering up’ of experimental conditions
is possible with low use of resources.
Figure 3.5: MLR-Results for conjugation DoE of engineered cysteine mAb with
surrogate drug CPM. Dots: Experimental data of DoE. Mesh: Response surface of MLR-
models. mAb+0: Yield fraction of un-conjugated antibody. mAb+1: mono-conjugated
antibody. mAb+2: di-conjugated antibody.

3.3 Results and Discussion
40
3.3.4 Comparability with mL-scale reaction
To illustrate the potential and the comparability of the high-throughput
conjugation (HTC) with conjugations in conventional centrifuge tubes, a
comparability study for the conjugation step was conducted with both set-ups
at two different protein concentrations in duplicates. For the HTC, TCEP
removal was achieved via the CEX buffer exchange step. One reaction was run
for each time point and stopped at the corresponding time with NAC. For the
mL-scale reactions, TCEP removal was done via dialysis overnight. At each
time point, samples were taken from the reaction mixture and quenched by
adding them to a microplate containing NAC stock solution. Apart from the
reaction vessel, this was the main difference between both approaches. The
results of the conjugation were determined by RP-UHPLC and are shown in
Figure 3.6. In general, the reaction is slower for the mL-scale, where the steady
state is reached later for both concentrations. This difference can likely be
attributed to different mixing parameters. The reaction is taking place very
rapidly, so that small differences in quenching efficiency have a strong
influence on the curve. The immediate mixing with the NAC stock solution is
more efficient for the mL-scale approach due to the fact that the microplate
shaker used in the HTC system was programmed to stop very briefly for the
quenching step.
The conjugation reactions were faster for the higher protein concentration. In
Figure 3.6A (2 mg/mL) steady state is not completely reached within the
20 min that were monitored. In Figure 3.6B (4 mg/mL), steady state is almost
reached after 6 min. This trend can also be seen for the HTC, although it is less
pronounced due to the higher reaction rate. However, the final outcome of the
reaction is the same for all four experiments: 90 (±2)% of di-conjugated mAb
and 5 (±2)% for mono- and unconjugated mAb. This results in an average DAR
of 1.84 and 1.86 for HTC and mL-scale, respectively. Also, monomer content for
the HTC was at about 99% as seen for the mL-scale conjugations (data not
shown). These are the essential physicochemical properties for the
comparability of the high-throughput conjugation to larger scale approaches.
It shows successfully that the high-throughput platform results can be
compared to mL-scale reactions. Further scale-up studies are needed to
validate the approach with large scale data. With respect to the buffer
exchange step it can be stated that the amount of salt used for elution (500 mM
NaCl) does not disturb the following reaction steps.
Regarding the efficiency of data generation, there are several advantages for
the automated HTC compared to the manual approach. First of all, the total
duration of the process is reduced substantially by elimination of the slow
dialysis step, which is usually done overnight. After preparation, the liquid
handling station performs all process steps independently without any user

3 Multi-step high-throughput conjugation platform
41
input. This means the operator can focus on other tasks until transferring the
microplate to a UHPLC for analysis. Finally, there is the obvious advantage of
any high-throughput screening approach, which is that the number of screened
conditions can be increased without significant increase in workload and
material demand. For the present study only 32 wells were used in order to
save material for further studies.
Figure 3.6: Comparability study with 2 and 4 mg/mL starting antibody concentration.
Comparison of reactions in mL-scale process (A, B) and 200 µL-scale automated high-
throughput process (C, D). The amount of each conjugate species (unconjugated, mono-
conjugated, di-conjugated) is depicted as a function of reaction time.
3.4 Conclusion
A fully automated high-throughput platform for solution-phase site-specific
conjugation of small molecules to antibodies was successfully established. Due
to the high-throughput buffer exchange step and the intermediate
concentration determination, it is applicable to multi-step processes that, in
many cases, require a removal of reagents between reaction steps. The
proposed method for buffer exchange using CEX can be performed with high
0%
20%
40%
60%
80%
100%
120%
0 500 1000 1500
Am
ou
nt
of
spec
ies
Time [s]
mL-scale: 4 mg/ml
mAb mAb+1 mAb+2
0%
20%
40%
60%
80%
100%
120%
0 500 1000 1500
Am
ou
nt
of
spec
ies
Time [s]
HTC: 2 mg/ml
mAb mAb+1 mAb+2
0%
20%
40%
60%
80%
100%
120%
0 200 400 600 800 1000 1200 1400
Am
ou
nt
of
spec
ies
Time [s]
HTC: 4 mg/ml
mAb mAb+1 mAb+2
0%
20%
40%
60%
80%
100%
120%
0 200 400 600 800 1000 1200 1400
Am
ou
nt
of
spec
ies
Time [s]
mL-scale: 2 mg/ml
mAb mAb+1 mAb+2
A C
DB

3.4 Conclusion
42
yields around physiological pH for IgG1 conjugations and no neutralization is
necessary after elution as for Protein A. Automated protein quantification with
process feedback facilitates addition of reagents in subsequent steps in correct
molar ratios. To complete the platform a high-throughput compatible
analytical RP-UHPLC method was developed, suitable for determination of
DAR and concentration of conjugate species which are relevant parameters for
ADC efficacy and pharmacokinetics. In two case studies for site-specific
engineered cysteine conjugation using the non-toxic fluorophore CPM as a
surrogate drug, the potential of the approach to efficiently characterize
conjugation reactions was demonstrated. It was shown that the amount of salt
needed for elution does not affect conjugation efficiency compared to a mL-scale
reaction with dialysis buffer exchange. The final outcome of the conjugation
reaction was not influenced by the smaller scale or different mixing
characteristics. A more detailed study on scaling-up conjugation reactions from
microscale to lab- or pilot-scale would be worthwhile to be able to transfer
detailed process parameters after mapping the design space. Obviously a direct
transfer of reaction conditions determined with surrogate drugs to real-drug
conjugations is not practical without prior validation, but process parameters
like mixing and pipetting settings should be mostly independent from the
payload. This means the platform can be applied to ADC process development
without significant further development effort. Especially because all steps
before conjugation were developed only with the antibody and the relevant
reagents. This way, the platform could play an important role in establishing
high-throughput tools in antibody-drug conjugation development and thus
more efficiently address the challenges posed by the complexity of site-specific
conjugation procedures. A crucial thrust for the development of next-
generation ADCs could be achieved by framing certain design guidelines
derived from the extensive screening of different target antigens, drug-linker
moieties, conjugation sites, reaction conditions and other parameters
significant for next-generation ADCs.
Acknowledgments
We thank Johannes Winderl for his assistance during preparation of this
manuscript. We would like to thank William Wang for his detailed review of
the manuscript and many helpful discussions. This research did not receive
any specific grant from funding agencies in the public, commercial, or not-for-
profit sectors.
43
4 Monitoring of antibody-drug conjugation
reactions with UV/Vis spectroscopy
Sebastian Andrisac, Matthias Rüdtac, Jonas Rogallaa, Michaela Wendelerb,
Jürgen Hubbucha *
a Institute of Process Engineering in Life Sciences, Section IV: Biomolecular
Separation Engineering, Karlsruhe Institute of Technology, Fritz-Haber-
Weg 2, 76131 Karlsruhe, Germany
b Department of Purification Process Sciences, MedImmune LLC,
Gaithersburg, Maryland 20878, United States
c These authors contributed equally to the work.
* Corresponding author
Abstract
The conjugation reaction of monoclonal antibodies (mAbs) with small-molecule
drugs is a central step during production of antibody-drug conjugates (ADCs).
The ability to monitor this step in real time can be advantageous for process
understanding and control. Here, we propose a method based on UV/Vis
spectroscopy in conjunction with partial least squares (PLS) regression for non-
invasive monitoring of conjugation reactions. In experiments, the method was
applied to conjugation reactions with two surrogate drugs in microplate format
as well as at 20 mL scale. All calibrated PLS models performed well in cross-
validation (𝑄2 > 0.975 for all models). In microplate format, the PLS models
were furthermore successfully validated with an independent prediction set
(𝑅pred2 = 0.9770 resp. 0.8940). In summary, the proposed method provides a
quick and easily implementable tool for reaction monitoring of ADC
conjugation reactions and may in the future support the implementation of
process analytical technologies (PAT).
4.1 Introduction
44
4.1 Introduction
ADCs are among the most promising new formats in the biopharmaceutical
industry98. More than 60 candidates are currently evaluated in clinical trials.
ADCs gain their potential from combining the high selectivity of monoclonal
antibodies (mAbs) with the high cytotoxicity of small-molecule drugs. Next to
specificity and cytotoxicity, ADCs also inherit other attributes of both species,
such as the absorption bands of both protein and drug and an often increased
hydrophobicity compared to unmodified mAbs due to the non-polar character
of the drugs113–115.
One of the most central steps during ADC production is the conjugation
reaction which links the drug to the mAb via a linker. The conjugation reaction
may either be site-specific or unspecific, with next-generation ADCs mainly
focusing on site-specific conjugation reactions with well-defined drug-to-
antibody ratios (DARs)31,116,117. The conjugation yield and DAR are generally
measured off-line by analytical hydrophobic interaction chromatography (HIC)
or reversed-phase chromatography (RPC), often in combination with mass
spectrometry118. This is, however, time-demanding and needs manual sample
handling. If only the DAR needs to be measured without the concentration of
each conjugate species, a simple method relying on UV/Vis absorption
measurements can be applied118. It requires the drug to have an absorption
band different from the one of the protein (≈ 280 nm). Using the absorption at
both maxima and the respective extinction coefficients, the concentrations of
protein and drug can be mathematically determined without further analytical
methods. The technique has been used for conjugations with different drugs
like the maytansinoid DM1 and dipeptide-linked auristatins (e.g.
vcMMAE)111,119, but is limited to purified conjugates, as residual free drug and
other possibly UV-active contaminants have to be removed. As a consequence,
this approach as well as analytical chromatography are not very well suited for
fast and prompt characterization of ADC conjugation reactions. Therefore, only
complex analytical solutions are found so far for the monitoring of these
reactions. Size-exclusion chromatography (SEC) with a post-column reaction
was proposed for DAR determination of cysteine-conjugated ADCs51. Tang et
al. present an approach for rapid DAR measurement by fast deglycosylation
and LC-MS detection120.
It would be highly beneficial to establish a fast analytical method for
monitoring the progress of conjugation reactions without any sample
processing. Ideally, such a method would also provide the means for application
as a process analytical technology in accordance with the PAT initiative by the
Food and Drug Administration (FDA). For this, the applied method needs to be

4 Monitoring of antibody-drug conjugation reactions
45
fast, without manual sample handling, and robust121. To monitor the process,
the method should be sensitive to the progress of protein conjugation reactions.
UV/Vis absorption spectroscopy is a rapid, noninvasive, and quantitative
method which is widely established in biopharmaceutical manufacturing. It
has previously been applied to process monitoring of proteins and small
molecules53,81,122–124. Hansen et al. showed the potential of UV/Vis spectroscopy
to distinguish between different proteins based on their content of aromatic
amino acids and their solvatization124. The method was later transferred to
chromatographic separations by Brestrich et al.81. There are some examples of
UV/Vis spectroscopy in reaction monitoring applications. Quinn et al. followed
a small-molecule reaction in lab scale using fiber-optic UV/Vis spectroscopy125.
Gurden et al. employed a model based on UV/Vis absorption data to detect and
diagnose process variations in a non-protein biochemical conversion reaction 126.
Drugs used in ADCs frequently feature delocalized electron systems thus
providing absorption bands in the UV/Vis range 118 besides the ones of the
aromatic amino acids of the mAbs. Spectral shifts of UV/Vis absorption may
not only be caused by a structural change in the UV/Vis active compounds, they
can also occur as a result of changes in the local environment of the
chromophores127,128, e.g. a change in solvent composition. If the conjugation
reaction thus causes a change in the environment of the aromatic amino acids
or the drug, it will cause spectral shifts which in turn may help to monitor this
type of reaction.
This work investigates a new and easily applicable method for on-line
conjugation reaction monitoring. Monitoring was accomplished by a
combination of UV/Vis spectroscopy and partial least squares (PLS) modeling.
Spectra were recorded and analyzed during conjugation reactions in two
different scales with different UV/Vis detectors. Based on the results, a method
was established for small-scale screening in 96-well plates which provides an
estimate of the amount of drug conjugated to the antibody by PLS regression.
Two different surrogate drugs, 7-diethylamino-3-(4'-maleimidylphenyl)-4-
methylcoumarin (CPM) and N-(1-pyrenyl)maleimide (NPM), were applied in
both setups. Additional variability was introduced by changing the
concentrations of the reactants. The method was then adapted to a lab-scale
conjugation reaction with an on-line diode array detector (DAD) to show
applicability as a PAT tool.

4.2 Materials and Methods
46
4.2 Materials and Methods
4.2.1 Chemicals
For disulfide reduction, tris(2-carboxyethyl)phosphine hydrochloride (TCEP,
Sigma-Aldrich, #C4706) was used. (L)-dehydroascorbic acid (DHA, Sigma
Aldrich, #261556) was used as oxidation agent for re-oxidation of interchain
disulfides. As nontoxic substitutes for cytotoxic drugs, 7-diethylamino-3-(4'-
maleimidylphenyl)-4-methylcoumarin and N-(1-pyrenyl)maleimide (both
Sigma-Aldrich, #C1484 and #P7908) were selected. Their structural formulae
are shown in Figure 4.1. Dimethyl sulfoxide (DMSO, Sigma Aldrich) was used
to dissolve DHA, CPM and NPM. N-acetyl cysteine (NAC, Sigma Aldrich,
#A7250) was applied to quench residual free drug. For buffer preparation, Na-
H2PO4 x 2 H2O was obtained from VWR International GmbH. The buffers were
titrated to the desired pH with 4 M NaOH (Merck KGaA) and filtered through
a 0.2 µm cellulose acetate membrane filter (Sartorius AG, Göttingen,
Germany).
Figure 4.1: The structures of conjugated NPM (A) and conjugated CPM (B) are shown.
R denotes the protein.
4.2.2 Model system and conjugation process
Purified IgG1 mAb with two engineered cysteines as conjugation sites was
provided at a concentration of 12.4 mg/mL in PBS (+5 mM EDTA, pH 7.2) by
MedImmune, LLC. CPM and NPM were used as non-toxic maleimide-
functionalized surrogate drugs and conjugated to the antibody’s two
engineered cysteines via their maleimide linker. For the conjugation
experiments, aliquots of the engineered mAb stock solution were thawed and
diluted to the desired concentration (2 mg/mL) with 50 mM sodium phosphate
buffer (pH 7.2). The resulting mAb concentrations were determined with a
4 Monitoring of antibody-drug conjugation reactions
47
Nano Drop 2000c spectrometer (ThermoFisher Scientific, Waltham, USA).
The following mAb preparation steps (reduction and re-oxidation) were
conducted in 50 mL centrifugation tubes (VWR International GmbH). A
reduction step was performed to uncap engineered cysteine residues. For this
purpose, a 40-fold molar excess of TCEP (over mAb concentration) was added
to the mAb solution. After 3 h of incubation at room temperature, the reduced
mAb solution was transferred into a dialysis cassette with a 10 kDa molecular
weight cut-off to remove TCEP. The dialysis was performed in a volume of 1.7 L
of 50 mM sodium phosphate buffer at 5 °C over night (approx. 19 h). The mAb
concentration after dialysis was determined with the Nano Drop spectrometer.
For re-oxidation of the interchain disulfide bonds, 20-fold molar excess of DHA
(3 mM stock solution in DMSO) was added. The mixture was incubated at room
temperature for 4 h. Through addition of the DHA solution, DMSO content was
increased to around 8.5%. To remove potential precipitate before spectroscopic
conjugation monitoring, the mAb solution was filtered through a 0.2 µm
polyethersulfone syringe filter (VWR International GmbH). The final mAb
concentration for the conjugation experiments was set via dilution with 50 mM
sodium phosphate buffer containing 10% of DMSO. Conjugation experiments
were executed with mAb concentrations in the range of 1.0 mg/mL
to 2.0 mg/mL.
The conjugation reaction in the different experimental setups was started by
addition of the surrogate drug (NPM or CPM) to the re-oxidized mAb solution.
The molar ratio (drug to mAb) was set to 2 for the NPM conjugations and to 3
for CPM. The concentration of the surrogate drug stock solutions was varied
(2 - 6 mM) depending on the mAb concentration to result in a final DMSO
content of approximately 10%. This content of DMSO was maintained to ensure
solubility of the hydrophobic surrogate drugs in the water-based solution. The
conjugation reaction was quenched by addition of a 12-fold molar excess of NAC
(over the applied amount of surrogate drug) to ensure the immediate
termination of the conjugation reaction.
4.2.3 High-throughput on-line monitoring experiments in microplate format
The high-throughput conjugation experiments were conducted in 96-well UV-
transparent microplates (UV-STAR®, Greiner bio-one GmbH, Frickenhausen,
Germany). The reaction was monitored by the acquisition of UV/Vis absorption
spectra of the reaction mixture in the range from 250 nm to 450 nm with an
Infinite M200 microplate spectrometer (Tecan Group Ltd., Männedorf,
Switzerland). To allow for the correlation of UV/Vis absorption data with the
progress of the conjugation reaction, spectra had to be recorded while different
time points of the reaction were sampled. The used experimental setup is

4.2 Materials and Methods
48
depicted in Figure 4.2. The UV-microplate was divided into monitoring wells
designated for UV/Vis absorption measurements and quenching wells
designated for off-line analytics. In the latter, the reaction was quenched at
different time points to generate samples for off-line analysis. The six
monitoring wells contained 200 µl of liquid and were further separated into two
blank wells and four reaction wells. One blank well contained buffer solution,
the other one re-oxidized mAb. The remaining monitoring wells were used for
reaction monitoring in duplicates under two different conditions. There were
16 quenching wells for each of the two screened conditions, containing 100 µL
of the corresponding reaction mixture. In this study, the mAb concentration
was varied in the range of 1.0 mg/mL to 2.0 mg/mL while all other process
conditions were kept constant for all experiments. This resulted in 6 calibration
and 2 prediction runs for NPM and 5 calibration and 2 prediction runs for CPM.
The conjugation reaction was started by adding the surrogate drug to the re-
oxidized mAb solution in a 50 mL centrifugation tube. After short mixing,
aliquots were transferred immediately to the microplate. The reaction in the
first quenching well was instantly stopped by addition of NAC solution before
placing the microplate into the reader and starting the on-line monitoring
procedure. The UV/Vis spectra acquisition was controlled by the software
Magellan (Tecan Group Ltd.) according to the following process: Prior to each
measurement, the plate was shaken for 15 s (orbital shaking, 1.5 mm
amplitude, 335.8 rpm). For the first 22 min or 25 min, single spectra were
recorded and after each measurement, one well was quenched. At later time
points more spectra were acquired between each quenching step, resulting in
quenching time intervals of 4 min to up to 10 min. The spectral range for the
conjugation reaction with NPM was defined at 250 nm to 390 nm and for CPM
at 250 nm to 450 nm (step size: 4 nm, 5 reads) to cover the characteristic
absorption maxima of the surrogate drugs. The conjugation reaction was
monitored over a run time of 50 min. Afterwards, the microplate was
centrifuged (1789 g, 7 °C) to remove potential precipitate prior to off-line
analysis. The supernatants were measured by reversed-phase ultra-high
performance liquid chromatography (RP-UHPLC).

4 Monitoring of antibody-drug conjugation reactions
49
Figure 4.2: Experimental setup used for high-throughput on-line monitoring in
microplate format. UV/Vis spectra were recorded during the conjugation reaction
using the integrated Tecan plate reader. Reactions in the quenching wells were stopped
at different time points and analyzed by RP-UHPLC. On-line and off-line data was
used for the generation of PLS regression models.
4.2.4 20 mL lab-scale on-line monitoring experiments
Preparation of the mAb was conducted as described above in the conjugation
process section. The re-oxidized mAb solution at a concentration of 2 mg/mL
was used for the experiments. Here, the acquisition of UV/Vis spectra was
performed with an Ultimate 3000 DAD (Dionex Softron GmbH, Germering,
Germany) with a semi-preparative flow cell (volume 0.7 µL, 0.4 mm path
length) at a spectral resolution of 1 nm. The experimental setup consisted of a
50 mL beaker glass as reaction vessel, a peristaltic pump (Minipuls 3, Gilson,
Villiers de Bel, France) with marprene pump tubing, and the DAD. All
elements were connected via PEEK tubing (0.5 mm diameter). By attaching
the beaker glass to a thermal shaker (HLC BioTech, Bovenden, Germany), the
solution was continuously mixed at 200 rpm and the temperature was kept
constant around 23 °C. The reaction mixture was circulated from the reservoir
via the peristaltic pump through the DAD flow cell and back into the reservoir.
In- and outlet were placed below the liquid surface. The flow rate was
approximately 3 mL/min which equaled the maximum speed of the peristaltic
pump (48 rpm).
Prior to monitoring the reaction, the DAD was equilibrated with sodium
phosphate buffer for 2 h and with re-oxidized mAb solution for 15 min.
Autozero of the DAD signal was performed either with re-oxidized mAb (NPM
readingwells
online data
UV/Vis spectra
offline data
quenching wells
RP-UHPLC
PLS regression

4.2 Materials and Methods
50
experiments) or with sodium phosphate buffer (CPM experiments). After DAD
‘warm-up’, the reactions were started by addition of the surrogate drugs in the
molar ratio of 2 for NPM and 3 for CPM. Three runs were performed for each
surrogate drug.
The conjugation reactions were monitored over 30 min while UV/Vis spectra
were acquired by the DAD every 0.2 s. To reduce noise, the spectra were then
averaged over 10 s. The recorded spectral range was 250 nm to 390 nm for
NPM experiments and 250 nm to 450 nm for CPM experiments.
Over the runtime of 30 min, 21 samples were taken and transferred to a 96-
well microplate for off-line analysis. The wells were previously loaded with
NAC stock solution to facilitate immediate quenching of the reaction upon
sampling. After termination of the experiment, the microplate was centrifuged
(1789 g, 7 °C). The supernatant was analyzed by RP-UHPLC.
4.2.5 Reversed-phase chromatography
To assess conjugation results, RP-UHPLC was applied as described
previously1. An Ultimate 3000 system was used, equipped with pump unit, RS
autosampler, RS column compartment and diode array detector (Dionex
Softron GmbH). Reduction or different sample preparation was not required.
An Acquity UPLC Protein BEH C4 column (Waters Corporation, Milford, USA;
300 Å, 1.7 µm, 2.1 mm x 50 mm) was run at a flow rate of 0.45 mL/min. The
column oven was heated to 80 °C. Solvent A consisted of 0.1% trifluoroacetic
acid (TFA) in ultrapure water, solvent B was 0.1% TFA in acetonitrile. After
equilibration and injection at 26% B, content of B was raised to 30%. Next, a
4.8 min gradient from 30% B to 38% B was used for separation of the conjugate
species. Including strip at 95% B and re-equilibration, the runtime was 7 min.
UV signals at 280 nm and at the corresponding absorption maximum of the
used surrogate drug were recorded (384 nm for CPM and 338 nm for NPM).
The resulting chromatograms yielded peak areas of unconjugated, mono-
conjugated and di-conjugated mAb, as well as of the remaining free drug. Using
the areas at 280 nm and 384 nm or 338 nm, concentrations of the different
conjugate species could be calculated with a previously determined calibration
curve for the mAb peak area. From these concentrations, the amount of
conjugated drug was calculated to be used as response for PLS modeling.
4.2.6 Data analysis
All data analysis was performed in Matlab R2016a (The MathWorks). For lab-
scale experiments, the spectral band shifts were additionally analyzed by
interpolation similar to methods proposed in the literature129. First, the spectra
were smoothed with a 5th order Savitzky-Golay filter with a 9-point window.

4 Monitoring of antibody-drug conjugation reactions
51
Subsequently, the 1 nm resolved spectral data was interpolated with a cubic
spline to a final resolution of 0.01 nm. The wavelength of the maximal
absorbance 𝜆max was obtained from the interpolated data.
In the case of microplate experiments, the experiments were split into
calibration runs (performed at mAb concentrations of 1.0 mg/mL, 1.5 mg/mL
and 2.0 mg/mL; NPM 86 samples, CPM 75 samples) and prediction runs
(performed at mAb concentrations of 1.28 mg/mL and 1.7 mg/mL; NPM 28 and
CPM 30 samples). The prediction runs were excluded from model calibration
and only used for evaluating the model prediction and calculating root mean
square errors of prediction (RMSEP) values. No prediction runs were
performed in case of the lab-scale experiments.
For model calibration, the spectroscopic data was first preprocessed and
subsequently fitted with a PLS-1 model by the SIMPLS algorithm130.
Parameters for preprocessing and model fitting were selected based on an
optimization as proposed previously by Großhans et al.50. Preprocessing
consisted of multiple steps. First, a baseline was subtracted from each
spectrum to reduce possible effects of baseline drifts. For NPM and CPM,
390 nm, respectively 450 nm, were selected as reference wavelength.
Subsequently, a Savitzky-Golay filter with a second-order polynomial was
applied to the spectra, and, optionally, the first or second derivative was taken 131. Finally, and only for the lab-scale experiments, the spectra were normalized
by a 1-norm to further decrease instrumental drifts.
For all models, cross-validation was performed by successively excluding each
batch, calibrating a PLS model based on the remaining runs, and calculating a
residual sum of squares for the excluded batch. All residual sums of squares of
the different submodels were summed yielding the Predictive Residual Sum of
Squares (PRESS). The PRESS was scaled according to Wold et al. by the
number of samples and latent variables used in the PLS model80. Based on the
scaled PRESS, an optimization was performed using the built-in genetic
algorithm of Matlab for integers132. The genetic algorithm optimized the
window width of the Savitzky-Golay filter, the order of derivative, as well as
the number of latent variables for the PLS-1 model. The root-mean-square
error of cross-validation (RMSECV) was calculated from the PRESS by dividing
through the total number of samples. The 𝑄2 values were calculated by dividing
the PRESS through the summed squares of the response corrected to the mean 80. The coefficient of determination for the prediction 𝑅pred
2 was calculated in
the same way for the prediction set.

4.3 Results
52
4.3 Results
4.3.1 Analysis of UV/Vis absorption spectra
In Figure 4.3, the measured spectra of two of the six lab-scale calibration runs
are shown (spectra of all experiments, both microplate and lab scale, are shown
in the supplementary data). The different spectra are colored according to the
reaction progress (blue to red). The autozero for NPM was performed while
already flushing the DAD with mAb and, thus, the protein band does not show
in the spectra. For comparison, pure component spectra of mAb, NPM and CPM
are supplied in the supplementary material. In both experiments, a baseline
drift is visible at all wavelengths.
NPM features a structured absorption band between 300 nm and 360 nm; CPM
a broad band between 330 nm and 450 nm. During NPM conjugation reaction
(Figure 4.3 top), a small bathochromic (red) shift (up to 2 nm) of all NPM bands
upon conjugation can be observed. Looking at the bottom graph in Figure 4.3,
a bathochromic shift is also observed for CPM. The maximum around 390 nm
is shifted by more than 2 nm. On the right side of Figure 4.3, the location of the
band maxima over time is compared to conjugated drug concentrations from
off-line analytics. The two curves show a high degree of correlation for both
NPM and CPM (Pearson correlation coefficient > 0.97). This is also true for the
remaining lab-scale runs, except for the CPM run 1 which reached a correlation
coefficient of 0.92.

4 Monitoring of antibody-drug conjugation reactions
53
Figure 4.3: The raw spectra of two lab-scale experiments for NPM (top) and CPM
(bottom) are shown. The spectra are colored according to the reaction progress from
blue to red. The location of the band maxima of the first (0 min) and the last spectrum
(30 min) are marked by vertical lines. On the right side, the time evolution of the band
maxima location is compared to the amount of conjugated drug measured by off-line
analytics.

4.3 Results
54
4.3.2 PLS model calibration and validation for microplate experiments
For the microplate experiments, the data was split into a calibration set and
an independent prediction set. Multiple parameters were set during model
calibration (Savitzky-Golay window width, derivative, number of latent
variables). As a systematic approach, a numerical optimization was chosen
with the scaled PRESS from cross-validation as an objective. Figure 4.4 shows
the calibrated model for the NPM and CPM experiments. For all experiments,
the measured concentration of conjugated drug first increases quickly and
approximates a limit after 10 min to 20 min. For all calibration experiments,
the PLS prediction follows the concentrations from off-line analytics. Table 4.1
summarizes the optimized parameters. For NPM and CPM, RMSECV values
of 0.60 µmol/L (𝑄2 = 0.9856) and 0.56 µmol/L (𝑄2 = 0.9875), respectively, were
reached.
Figure 4.4: PLS model calibration for the microplate experiments is shown for NPM
(Figure 4A) and CPM (Figure 4B). The nominal mAb concentrations of the different
experiments are 1 mg/mL (red and blue), 1.5 mg/mL (yellow and violet), and 2 mg/mL
(green and cyan).
The calibrated PLS models were then validated by applying them to a
prediction set (Figure 4.5). The shape of the conjugated drug concentration is
similar to the calibration set and captured by the PLS prediction in all
experiments. In the case of CPM, the PLS prediction is offset for both
experiments to higher concentrations. RMSEPs of 0.57 µmol/L (𝑅pred2 = 0.9770)
and 0.90 µmol/L (𝑅pred2 = 0.8940) were reached for NPM and CPM, respectively.

4 Monitoring of antibody-drug conjugation reactions
55
Figure 4.5: PLS model prediction for the microplate experiments is shown for NPM (A)
and CPM (B). The nominal mAb concentrations of the different experiments are
1.3 mg/mL (blue), and red 1.7 mg/mL (red).
4.3.3 PLS model calibration for lab-scale experiments
PLS model calibration for lab-scale experiments was optimized in the same
way as the calibration for experiments in microplates (Table 4.1). Due to
material limitations, no experiments were designated for a prediction set.
Instead, the PLS models were assessed only by cross-validation. For NPM, an
RMSECV of 0.56 µmol/L (𝑄2 = 0.9792) was reached. For CPM, the RMSECV
was 0.57 µmol/L (𝑄2 = 0.9755). For ADCs, the degree of conjugation is
commonly expressed as DAR. By normalizing the conjugated drug
concentration by the initial mAb concentration, the DAR was derived and used
for plotting (Figure 4.6).

4.3 Results
56
Table 4.1: Summary of optimized parameters for the spectral preprocessing and PLS
model as well as the performance of each model in cross-validation and on independent
prediction sets.
Microplate Lab scale
NPM CPM NPM CPM
No. of calibration samples 86 75 60 58
No. of cross-validation
groups 6 5 3 3
No. of prediction samples
with off-line analytics 28 30 0 0
No. of prediction samples
without off-line analytics 118 84 476 512
No. of latent variables 6 5 4 2
Window for Savitzky-Golay 17 13 35 71
Derivative 1 0 1 1
𝑄2 0.9856 0.9875 0.9792 0.9755
RMSECV (µmol/L) 0.60 0.56 0.56 0.57
𝑅pred2 0.9770 0.8940 - -
RMSEP (µmol/L) 0.57 0.90 - -

4 Monitoring of antibody-drug conjugation reactions
57
Figure 4.6: PLS model calibration for the lab-scale experiments is shown for NPM (A,
B, C) and CPM (D, E, F). Each model was calibrated on 3 replicates shown in the
different subplots. The DAR was used for plotting as it is frequently used to specify the
conjugation degree of ADCs. For calculating the DAR, a constant protein concentration
was assumed over the course of the reaction.
4.4 Discussion
To correlate the progress of conjugation reactions with changes in the UV/Vis
absorption spectra, reactions were performed in microplate format as well as
in a lab-scale setup while measuring absorption spectra. First, the spectra were
interpreted qualitatively to justify the assumption that the conjugation
reaction affects the absorption spectra of the protein/drug mixture.
Subsequently, the obtained datasets were used to calibrate four PLS models
predicting the concentration of conjugated drug for CPM or NPM in the two
different setups.
During the conjugation reaction, UV/Vis absorption spectra are expected to
change for multiple reasons. While reacting, the drug moves from an aqueous
to the proteinaceous environment. Due to solvatochromism, the absorption
bands of the drug thus may shift128. Second, the proximity of the drug to

4.4 Discussion
58
aromatic amino acids can change the local hydrophobicity which in turn
impacts the absorption spectra of aromatic amino acids 129,133,134. Finally,
maleimide has been reported to generate a relatively weak absorption band
around 273 nm135. During the conjugation reaction, the double bond in
maleimide is reduced and the band at 273 nm is expected to disappear. For the
used surrogate drugs (NPM and CPM, cf. Figure 4.1), the maleimide linker is
coupled to the chromophores of pyrene and phenylcoumarin. Thus, they may
not have the same absorption bands as free maleimide, and the conjugation
reaction may also influence the chromophore intramolecularly.
Based on the spectral changes clearly correlated to the reaction progress
observed in Figure 4.3, it was concluded, that the conjugation reactions of both
NPM and CPM indeed affect the respective absorption spectra. For further
verification, experiments with previously quenched NPM and CPM were
conducted, and spectra were recorded over 15 min. Here, no spectral shift was
detected, since no reaction was taking place. The resulting spectra are shown
in the supplementary material. As a consequence of the spectral change caused
by the conjugation reaction, predicting the reaction progress from the spectra
should be possible. Further data analysis focused on establishing quantitative
PLS models for each setup and drug.
For each model, parameters for Savitzky-Golay smoothing and derivative as
well as the number of latent variables were optimized. We decided to rely on a
numerical optimization with an integer-based genetic algorithm to implement
a systematic selection of model parameters. For the optimization, the scaled
PRESS served as an objective function. In more detail, cross-validation was
performed by iteratively excluding a complete run from PLS model calibration.
The reasoning was to make cross-validation representative of the prediction of
future runs and thereby maximize the predictive power of the PLS model. This
batch-wise approach was rather conservative, excluding 1/6 (MWP
experiments with NPM) up to 1/3 (lab-scale experiments) of the calibration
data for cross-validation. The so calibrated models were able to predict most of
the variations in the measured concentrations based on the spectral data (𝑄2 >
0.9750).
For the microplate setup, it is worth noting that the calibration data spans a
range from 1 mg/mL to 2 mg/mL of mAb with the corresponding surrogate drug
concentrations. As the external validation shows, the model is able to predict
the reaction course for different concentrations in the calibration space.
Interestingly, the RMSEP for NPM lies below the corresponding RMSECV. For
CPM, the RMSEP is noticeably higher than the RMSECV. This seems to be
related to a slight offset in the PLS prediction (Figure 4.5B). Nevertheless, the
results show that it is possible to quantitatively monitor conjugation reactions
4 Monitoring of antibody-drug conjugation reactions
59
of NPM and CPM to an IgG1 antibody in the microplate format by UV/Vis
spectroscopy. The results furthermore show that the chosen way of model
optimization did not cause a strong overfit.
Lab-scale experiments led to RMSECV and 𝑄2 values similar to those found in
the microplate experiments. The smooth prediction of the PLS models indicates
that the error of the model is mainly related to systematic errors and not to the
measurement noise. For reactions with varying protein concentration, it would
be possible to estimate the concentration by a PLS model. The DAD
experiments successfully show the ease of implementation of the approach in
a lab-scale format. As the DAD measurements are very fast, the approach
facilitates real-time monitoring, which may be beneficial for kinetic studies or
process monitoring and control.
4.5 Conclusion
In summary, we established a novel spectroscopic PAT approach for monitoring
ADC conjugation reactions. In two experimental setups, with two different
detectors, the conjugation process of surrogate drugs to a mAb was monitored
by UV/Vis absorption spectroscopy and PLS regression. The results show that
UV/Vis spectroscopy allows to monitor conjugation reactions in microplates as
well as in lab scale. The method may thus simplify process development by
reducing the analytical bottle neck. This may be especially interesting in
combination with High-throughput Process Development (HTPD) on liquid
handling stations for ADCs1,69. In lab scale, the method allows for real-time
process monitoring. Due to the flexibility and ease of implementation, the
method may be further developed to a PAT approach for conjugation
monitoring at commercial scale.
Future steps should focus on testing the method with cytotoxic drugs. While
common drugs contain chromophores, the solvatochromic behavior of those
drugs is unknown. Furthermore, the position of the engineered cysteines may
have a strong impact on the solvent exposure of the drug and, thus, the change
in hydrophobicity in the environment of the drug upon conjugation. Other
techniques more sensitive to solvatochromism (e.g. fluorescence spectroscopy)
or the changing of covalent bonds (e.g. vibrational spectroscopy) could be
evaluated. Due to the simplicity of UV/Vis absorption spectroscopy, it is still a
reasonable first choice for future studies.
4.5 Conclusion
60
Acknowledgments
We would like to thank Dr. Michael Wörner for the fruitful discussions
regarding spectroscopy and solvatochromism.
Appendix A: Supplementary data
The supplementary data associated with this chapter contain the following
information:
- Spectra of all microplate and lab-scale experiments
- Pure component spectra of mAb, NPM, and CPM
- Spectra of experiments with quenched drugs

61
5 Kinetic reaction modeling for antibody-drug
conjugate process development
Sebastian Andrisa, Jonathan Seidela, Jürgen Hubbucha *
a Institute of Process Engineering in Life Sciences, Section IV: Biomolecular
Separation Engineering, Karlsruhe Institute of Technology, Fritz-Haber-
Weg 2, 76131 Karlsruhe, Germany
* Corresponding author
Abstract
By combining the specificity of monoclonal antibodies (mAbs) and the efficacy
of cytotoxic drugs in one molecule, antibody-drug conjugates (ADCs) form a
promising class of anti-cancer therapeutics. This is emphasized by around 65
molecules in clinical trials and four marketed products. The conjugation
reaction of mAbs with small-molecule drugs is a central step during production
of ADCs. A detailed kinetic model for the conjugation reaction grants enhanced
process understanding and can be profitably applied to process optimization.
One example is the identification of the optimal amount of drug excess, which
should be minimized due to its high toxicity and high cost.
In this work, we set up six different kinetic model structures for the conjugation
of a cysteine-engineered mAb with a maleimide-functionalized surrogate drug.
All models consisted of a set of differential equations. The models were fit to an
experimental data set, and the best model was selected based on cross-
validation. The selected model was successfully validated with an external
validation dataset (R² of prediction: 0.978). Based on the modeling results,
process understanding was improved. The model shows that the binding of the
second drug to the mAb is influenced by the attachment of the first drug
molecule. Additionally, an increase in reaction rate was observed for the
addition of different salts to the reaction. In a next step, the model was applied
to an in silico screening and optimization which illustrates its potential for

5.1 Introduction
62
making ADC process development more efficient. Finally, the combination of
the kinetic model with a PAT tool for reaction monitoring was demonstrated.
In summary, the proposed modeling approach provides a powerful tool for the
investigation of ADC conjugation reactions and establishes a valuable in silico
decision support for process development.
5.1 Introduction
With four marketed products and around 65 molecules in clinical trials,
antibody-drug conjugates (ADCs) are among the most important formats for
the future of cancer treatment136. They combine the targeting specificity of
monoclonal antibodies (mAbs) with the potent cytotoxicity of chemotherapy.
The approval of gemtuzumab ozogamicin in 2001 (withdrawn in 2010, re-
introduced to US market in 2017), brentuximab vedotin in 2011 and ado-
trastuzumab emtansine in 2013 has set off substantial research and
development efforts in that field, and a variety of new technologies are
emerging and are making their way to the clinic.
Regarding the design of enhanced ADCs, areas of focus include new linker
chemistries, site-selective conjugation strategies, the selection of adequate
binding sites, and the development of new payloads alongside new ways of
analyzing and purifying ADCs117,137–140. The manufacturing of ADCs poses
several unique challenges, most notably the requirement to control product
homogeneity and drug-to-antibody stoichiometry. Even with the new
generation of site-directed conjugation approaches, the conjugation processes
are unlikely to result in a single species. It is imperative to understand sources
of ADC heterogeneity, as it can significantly impact safety and efficacy of the
product. Process development of ADCs has many variables, and no platform
process is available. Furthermore, the implementation of quality by design
(QbD) for pharmaceutical development is encouraged by regulatory agencies,
promoting a more informed, systematic approach to process development10.
Apart from these challenges, process development for biologics in general has
to handle a diversifying product pipeline. For facilitating efficient process
development in this framework, an adaptable process development platform
with a broad range of applicability would be highly beneficial. In this setting,
further digitization of process development is a key factor. On the one hand,
the knowledge of process experts and lab experiments, including high-
throughput tools for efficient data generation, will keep forming the basis. On
the other hand, it is becoming increasingly important to support the decision
making with in silico tools. One group are structure-based approaches like
molecular dynamics and quantitative structure-activity relationships (QSAR).

5 Kinetic reaction modeling
63
The second group is formed by statistical models and design of experiments
(DoE). The third group and focus of this research are mechanistic process
models, which can support process development in a number of ways. Here, the
challenge is to develop high-quality models and to apply them in a beneficial
way.
For facilitating efficient process development of ADCs, high-throughput tools
are currently applied to screen a lot of conditions with little use of time and
material. Ohri et al. applied a high-throughput method to scan different
conjugation sites on trastuzumab47. To facilitate high-throughput screenings of
conjugation process parameters, different platforms were developed to conduct
the process in microplates1,69,70. DoE can be used to further improve efficiency
by reducing the number of necessary experiments. In a next step, empirical
models can be deduced, e.g. to give correlations between process parameters
and critical quality attributes (CQAs). An example of a statistical model
applicable to ADC process development shows a correlation between drug-to-
antibody ratio (DAR) and drug load distribution on trastuzumab emtansine 41.
The reasoning is that measuring and controlling DAR could be indirectly used
to control drug load distribution. Gikanga et al. supported their investigation
of product quality attributes of ADCs by a molecular dynamics simulation,
showcasing the application of a structure-based in silico tool for ADC process
development141. There are also several examples of the use of process analytical
technology (PAT) tools in combination with ADC processes2,51,120. They
generally revolve around monitoring the DAR of the reaction.
In the ADC field, opposed to other fields like preparative chromatography,
examples of the use of mechanistic modeling techniques for process
development and understanding are limited89,90,92,142. A central step in making
ADCs is the conjugation reaction, where the drugs are covalently attached to
the antibody via a linker. Hu et al. used computational fluid dynamics (CFD)
as a tool to evaluate multiple reactor designs and evaluate the use of a
disposable reactor for the conjugation reaction76.
Another interesting possibility to mechanistically model the conjugation
reaction would be to develop a kinetic model, enabling the prediction of
concentrations of different conjugate components at different times of the
reaction. At least inside the calibration range, such a model could also be used
to optimize input parameters like starting concentrations to achieve the target
drug load distribution in the most efficient way. To the best of our knowledge,
no such model has been developed for ADC conjugation reactions. For
PEGylation of lysozyme, a kinetic model was proposed with the goal of
optimizing the process towards maximal production of the mono-PEGylated
form58. Factors varied were the ratio of PEG to protein and the pH. Moosmann

5.2 Materials and Methods
64
et al. also simulated PEGylation reactions of lysozyme and a scFv using
numerically solved differential equations143. In addition to the rate laws for the
PEGylation reaction, they introduced an additional term for the inactivation of
mPEG-aldehyde in order to achieve a better fit of their data. Using the
modeling results, they were able to gain process understanding and optimize
the PEGylation process. These examples showcase the ability of kinetic
reaction models to be applied to development and optimization of
bioconjugation reactions in addition to yielding profound knowledge about the
system at hand. With these characteristics, a kinetic modeling approach can be
applied as an in silico decision support for the development of bioconjugation
processes and advance the implementation of QbD. Given the costly and highly
toxic reagents used for ADC production, there is additional motivation to
minimize their use through process optimization. Improved process
understanding could also benefit the selection of suitable binding sites and
conjugation chemistries and spark ideas for better processes.
In this work, we use a kinetic reaction model to describe the site-specific
attachment of maleimide-functionalized surrogate drugs to two thiol groups in
a mAb. Six different model structures were proposed and fit to an experimental
data set with varying protein and drug concentrations. The best model was
selected using cross-validation (CV) and then validated with an external test
data set containing data in- and outside the calibration range. Next, the
resulting rate constants and the impact of different salts on the rate constants
were examined to enhance process understanding. An in silico screening and
process optimization was performed, applying the validated model. Finally, a
combination of the model with a previously developed PAT tool was
investigated.
5.2 Materials and Methods
5.2.1 Chemicals
The reduction of disulfides was done with tris(2-carboxyethyl)phosphine
hydrochloride (TCEP, Merck KGaA, #C4706). (L)-dehydroascorbic acid (DHA,
Merck KGaA, #261556) was used to re-oxidize the antibodies’ interchain
disulfides. Cytotoxic drugs used in ADCs were substituted by the nontoxic
surrogate N-(1-pyrenyl)maleimide (NPM, Merck KGaA, #P7908). The
structural formula is shown in Figure 5.1. Due to low water solubility, dimethyl
sulfoxide (DMSO, Merck KGaA, #472301) was used to dissolve NPM. For
stopping the reaction, remaining free drug was quenched with N-acetyl
cysteine (NAC, Merck KGaA, #A7250). Standard buffers were made with Na-
H2PO4 x 2 H2O from VWR International GmbH. The buffers were titrated to

5 Kinetic reaction modeling
65
the desired pH with 4 M NaOH (Merck KGaA) and filtered through a 0.2 µm
cellulose acetate membrane filter (Sartorius AG, Göttingen, Germany). For
buffers with additional salts, ammonium sulfate (AS, #A1032) and guanidine
hydrochloride (GuHCl, #A4014) were purchased from AppliChem GmbH and
sodium chloride (NaCl) from Merck KGaA.
For analytics, acetonitrile from Carl Roth GmbH + Co. KG (#8825) was used,
and trifluoroacetic acid (TFA) was supplied by Thermo Scientific (#28904).
Figure 5.1: The structure of conjugated NPM is shown. R denotes the protein.
5.2.2 Model system, conjugation process and sampling of kinetic data
A stock solution of purified IgG1 mAb in PBS (+5 mM EDTA, pH 7.2) with two
engineered cysteines as conjugation sites was generously provided by
AstraZeneca. The two additional cysteines were inserted into the heavy chains
in constant regions of the antibody. NPM served as non-toxic maleimide-
functionalized surrogate drug and was conjugated to the antibody’s two
engineered cysteines. Aliquots of the engineered mAb stock solution were
thawed and diluted with 50 mM sodium phosphate buffer (pH 7.2) for each
conjugation experiment. The mAb concentration was determined with a Nano
Drop 2000c spectrometer (Thermo Scientific, Waltham, USA).
For activation of the reaction site on the antibody, a reduction and partial re-
oxidation were conducted in 2 mL Safe-Lock tubes (Eppendorf AG,
#0030120094). The reduction step is performed to uncap engineered cysteine
residues. The mAb concentration was set to 6.2 g/L and a 40-fold molar excess
of TCEP (over the mAb concentration) was added before incubating for 3 h at
room temperature and a 350 rpm orbital shaking rate (Thermo Mixer C,
Eppendorf AG, Hamburg). The reduced mAb solution was then transferred into
a dialysis cassette with a 10 kDa molecular weight cut-off (Thermo Scientific,
#87730) to remove TCEP. The dialysis was performed in a volume of 0.95 L of
50 mM sodium phosphate buffer pH 7.2 at 5 °C. The dialysis buffer was
replaced after 4 h, the total duration was around 19 h. The mAb concentration
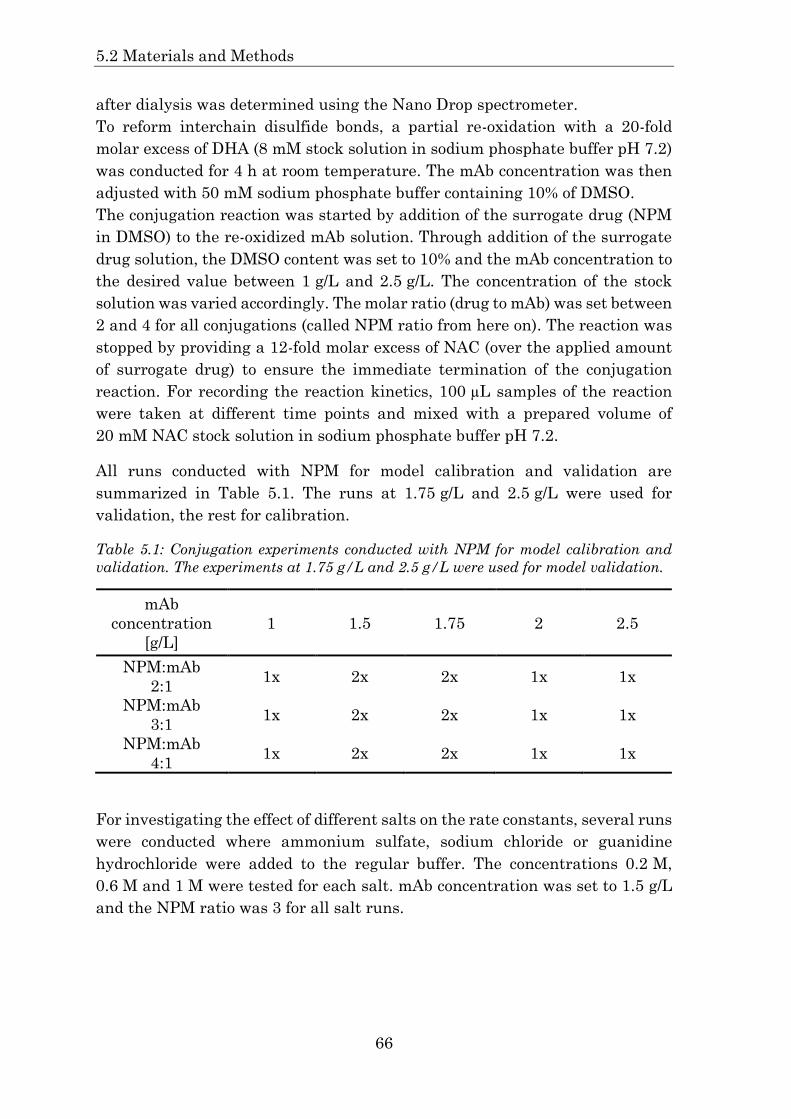
5.2 Materials and Methods
66
after dialysis was determined using the Nano Drop spectrometer.
To reform interchain disulfide bonds, a partial re-oxidation with a 20-fold
molar excess of DHA (8 mM stock solution in sodium phosphate buffer pH 7.2)
was conducted for 4 h at room temperature. The mAb concentration was then
adjusted with 50 mM sodium phosphate buffer containing 10% of DMSO.
The conjugation reaction was started by addition of the surrogate drug (NPM
in DMSO) to the re-oxidized mAb solution. Through addition of the surrogate
drug solution, the DMSO content was set to 10% and the mAb concentration to
the desired value between 1 g/L and 2.5 g/L. The concentration of the stock
solution was varied accordingly. The molar ratio (drug to mAb) was set between
2 and 4 for all conjugations (called NPM ratio from here on). The reaction was
stopped by providing a 12-fold molar excess of NAC (over the applied amount
of surrogate drug) to ensure the immediate termination of the conjugation
reaction. For recording the reaction kinetics, 100 µL samples of the reaction
were taken at different time points and mixed with a prepared volume of
20 mM NAC stock solution in sodium phosphate buffer pH 7.2.
All runs conducted with NPM for model calibration and validation are
summarized in Table 5.1. The runs at 1.75 g/L and 2.5 g/L were used for
validation, the rest for calibration.
Table 5.1: Conjugation experiments conducted with NPM for model calibration and
validation. The experiments at 1.75 g/L and 2.5 g/L were used for model validation.
mAb
concentration
[g/L]
1 1.5 1.75 2 2.5
NPM:mAb
2:1 1x 2x 2x 1x 1x
NPM:mAb
3:1 1x 2x 2x 1x 1x
NPM:mAb
4:1 1x 2x 2x 1x 1x
For investigating the effect of different salts on the rate constants, several runs
were conducted where ammonium sulfate, sodium chloride or guanidine
hydrochloride were added to the regular buffer. The concentrations 0.2 M,
0.6 M and 1 M were tested for each salt. mAb concentration was set to 1.5 g/L
and the NPM ratio was 3 for all salt runs.

5 Kinetic reaction modeling
67
5.2.3 Reversed-phase analytical chromatography
The conjugation results were assessed using reversed-phase ultra-high
performance liquid chromatography (RP-UHPLC) as described previously1.
This assay was optimized to measure the conjugation states of the intact ADC.
No sample preparation was required. The same device and type of column
(Acquity UPLC Protein BEH C4, Waters Corporation, 300 Å, 1.7 µm, 2.1 mm x
50 mm) were used. UV signals at 280 nm and at the absorption maximum of
NPM (338 nm) were recorded. The peak areas of unconjugated, mono-
conjugated and di-conjugated mAb were determined. From the areas at 280 nm
and 338 nm, concentrations of these conjugate species could be calculated with
a previously determined calibration curve for the mAb peak area.
5.3 Model construction and development
The first step in creating a process model is developing a model structure. The
model parameters can then be determined by fitting the model to experimental
data. In this work, six different model structures were proposed and the best
one was determined in the model selection. The models were based on the
following reaction pathway:
𝑚𝐴𝑏 +𝑁𝑃𝑀 → 𝑚𝐴𝑏𝑁𝑃𝑀1 (5.1)
𝑚𝐴𝑏𝑁𝑃𝑀1 + 𝑁𝑃𝑀 → 𝑚𝐴𝑏𝑁𝑃𝑀2 (5.2)
mAb is the unconjugated monoclonal antibody, NPM the surrogate drug,
mAbNPM1 is the mono-conjugated mAb and mAbNPM2 is the bi-conjugated
form. No higher-order conjugates were detected in previous RP-UHPLC
measurements. The rate of these second-order reactions depends on their rate
constants and the concentrations of the reactants. The two conjugation sites
are located in mirroring positions in the constant region of the heavy chains of
the mAb. Model 1 assumes that both binding sites share the same relevant
properties and thus have the same rate constant k. Model 2 also assumes no
influence of the binding sites on the reaction rate, but uses k1 for the first
attachment and k2 for the second attachment of a drug to the antibody. Model 3
assumes that the binding sites have inherently different characteristics
influencing the reaction rate and thus uses 𝑘1′ for the attachment to binding
site 1 and 𝑘2′ for the attachment to binding site 2. Due to drug inactivation and
depletion, for example by wall adsorption, the concentration of drug available
for reaction can decrease independently of the conjugation reaction. For
incorporating this into the model structures, models 4 to 6 were created by
adding a lumped drug sink term with rate constant k3 to models 1 to 3. A
schematic explanation of this model construction is shown in Figure 5.2.

5.3 Model construction and development
68
Figure 5.2: Schematic explanation of assumed model structures. Model 1 assumes two
equal binding sites on the mAb and one rate constant k. Model 2 includes a second rate
constant for the second attachment of drug, which implies an impact of the first binding
on the environment of the second binding site (light blue color). Model 3 assumes two
different binding sites with two different rate constants (different colors). Models 4 to 6
are deduced from models 1 to 3 by adding a lumped drug sink term with rate constant
k3.
Finally, it had to be incorporated into the models, that not all mAbs possess
two active binding sites. In the starting material, there are mAbs with two, one
or zero binding sites available for maleimide conjugation. This can be explained
by an incomplete reduction of the engineered cysteines. The resulting
components were included in the rate laws, which were formulated as a set of
ordinary differential equations (ODEs). As an example, the rate laws of model 5
are listed in the following (Equations 5.3-5.9). Rate laws of the other models
can be found in the supplementary material. 𝐶mAb2c, 𝐶mAb1c and 𝐶mAb0c are the
concentrations of mAbs with two, one or zero binding sites available. 𝐶NPM is
the NPM concentration. 𝐶mAb1cNPM stands for the concentration of mAbs with
one NPM attached and one free binding site, while 𝐶mAb0cNPM has one NPM
attached and zero free binding sites. Accordingly, 𝐶mAb0c(NPM)2 means the
concentration of mAb with two attached NPM and no free binding site.
𝑑𝐶mAb2c
𝑑𝑡 = −𝑘1 ∙ 𝐶mAb2c ∙ 𝐶NPM (5.3)
𝑑𝐶mAb1c
𝑑𝑡 = −𝑘1 ∙ 𝐶mAb1c ∙ 𝐶NPM (5.4)
𝑑𝐶mAb0c
𝑑𝑡 = 0 (5.5)
NPMSHHS
Model 1𝑘
SHHS
Model 3𝑘1′, 𝑘2′
SHSSHHS
Model 2𝑘1, 𝑘2
Model 4:𝑘, 𝑘
Model 5:𝑘1, 𝑘2, 𝑘
Model 6:𝑘1′, 𝑘2′, 𝑘
Include lumped drug sink term with k3

5 Kinetic reaction modeling
69
𝑑𝐶mAb1cNPM
𝑑𝑡 = 𝑘1 ∙ 𝐶mAb2c ∙ 𝐶NPM − 𝑘2 ∙ 𝐶mAb1cNPM ∙ 𝐶NPM (5.6)
𝑑𝐶mAb0cNPM
𝑑𝑡= 𝑘1 ∙ 𝐶mAb1c ∙ 𝐶NPM (5.7)
𝑑𝐶mAb0c(NPM)2
𝑑𝑡= 𝑘2 ∙ 𝐶mAb1cNPM ∙ 𝐶NPM (5.8)
𝑑𝐶NPM𝑑𝑡
= −𝑘1 ∙ 𝐶mAb2c ∙ 𝐶NPM−𝑘1 ∙ 𝐶mAb1c ∙ 𝐶NPM − 𝑘2 ∙ 𝐶mAb1cNPM ∙ 𝐶NPM
− 𝑘 ∙ 𝐶NPM (5.9)
5.3.1 Component starting concentrations
While mAb and NPM starting concentrations were set with the reaction
conditions, the ratio of mAb with two, one or zero active binding sites had to be
estimated from the calibration data. These values could be deduced from the
ratio of di-, mono-, and unconjugated mAb in the experiments, where the
reaction reaches a steady state, since here all the available binding sites are
conjugated. This applies to the runs with NPM ratios of 3 and 4, hence the
average values from all calibration runs with these criteria were taken to
calculate the component starting concentrations.
5.3.2 Model fitting, selection and validation
All data analysis was performed in Matlab R2017b (The MathWorks). The
experimental data was split into a calibration and a validation set. The data at
1 g/L, 1.5 g/L, and 2 g/L were used for model calibration and those at 1.75 g/L
and 2.5 g/L were used for model validation. This equals 12 runs for calibration
and 9 runs for validation. All formulae used for model evaluation can be found
in the supplementary material.
5.3.2.1 Model fitting (parameter optimization)
Each model consisted of a set of ODEs containing between 1 and 3 rate
constants. These rate constants represent the model parameters which were
optimized using the nonlinear least squares solver lsqnonlin in Matlab with
the default algorithm trust-region-reflective. Inside the optimization, the ODEs
were numerically solved using the ode45 solver. The difference between the
kinetic models and the experimental data was minimized and an optimal
parameter set was determined for each of the six models. As start values for
the parameter optimization, k = k1 = k2 = k1’ = k2’ = 1 (mM∙s)-1 and k3 = 0.01 s-1
were selected. In the next step, the best model in the set was selected.

5.3 Model construction and development
70
5.3.2.2 Model selection
Model selection was done by cross-validation and comparison of Q² and
RMSECV values. The calibration data was split into CV groups. Each CV group
was left out of model calibration once and predicted by the resulting model.
Cumulative Q² and RMSECV values were calculated to rank model quality.
Different amounts of CV groups (2-12) were tested for a more robust model
selection.
5.3.2.3 Model validation
For the best model, parameter uncertainty was assessed by calculating 95%
confidence intervals using the Matlab function nlparci. Then, the model was
validated by predicting the conjugations in the validation data set at 1.75 g/L
and 2.5 g/L. R² of prediction and RMSEP were calculated.
5.3.3 Model application
5.3.3.1 Investigation of salt effects on rate constants
To investigate the influence of different salts on the rate constants, the selected
model structure was also fit to the data of the experiments with salts added to
the buffer. The resulting rate constants were compared to the ones of the final
calibrated model.
5.3.3.2 In silico screening and optimization
The selected model was used to perform in silico optimizations of the
conjugation process at different conditions. mAb concentrations between 1 g/L
and 2.5 g/L with a step size of 0.0015 g/L and NPM ratios of 2 to 4 with a step
size of 0.01 were screened. The process was optimized at each combination of
mAb and NPM concentration for a short reaction time and maximal amount of
the bi-conjugated mAb. During the optimization, the reaction time was varied,
while both the reaction time and the amount of bi-conjugated mAb were part
of the objective function. This allows that both parameters are weighted
appropriately. Hence, the model was evaluated for each point until an optimal
reaction time was found that best satisfied the objectives. Here, the amount of
bi-conjugated mAb was weighted stronger to get as close to the highest degree
of conjugation as possible with the shortest possible reaction time.
5.3.3.3 Combination of models to support process monitoring
To illustrate the possibility of a combination of a kinetic reaction model with a
PAT tool, the selected model structure was combined with a reaction
monitoring tool described by us previously2. It records UV/Vis spectra during
the reaction and calculates the amount of conjugated drug via a PLS model.

5 Kinetic reaction modeling
71
Data generation and processing was handled as described in the publication.
Spectra and off-line data from three runs of a 20-mL scale conjugation reaction
at 2 g/L with a NPM ratio of 2 were used. The data was divided into two
calibration runs and one validation run. With the calibration data, the PLS
model for reaction monitoring as well as the kinetic model were fit. Then, the
kinetic model was used to predict the concentration of conjugated drug over the
reaction time, which was then used to assess if the concentration monitored by
the PLS model is in the specified range.
5.4 Results
5.4.1 Model selection
After setting up different model designs, the goal was to evaluate which model
best fits the underlying mechanism of the investigated reaction. Table 5.2 gives
RMSECV and Q² values of the cross-validation, which was conducted to select
the best model. The amount of CV groups was varied in order to achieve a more
robust model selection. For all different amounts of CV groups, model 5
consistently gave the best results. With 4 CV groups, RMSECV equals
0.0007 mM and Q² is 0.963. Model 5 contains k1 and k2 for the first and the
second attachment of a drug molecule and k3 for drug depletion. The models
with drug sink term (models 4, 5, 6) are always better than the respective
models without sink term (models 1, 2, 3), with one exception (models 3 and 6
with 2 CV groups). The models where two inherently different binding sites are
assumed (models 3 and 6) consistently result in the worst RMSECV and Q²
values. The described trends and the selected best model are the same for all
different amounts of CV groups, but absolute values differ.

5.4 Results
72
Table 5.2: Results of model selection by cross-validation based on calibration data set.
Different amounts of CV groups were tested to provide for a more robust model selection.
RMSECV (in mM) and Q² were calculated for all models.
Model
#
2 CV groups 3 CV groups 4 CV groups
RMSECV Q² RMSECV Q² RMSECV Q²
1 0.0012 0.8861 0.0015 0.8271 0.0010 0.9296
2 0.0010 0.9171 0.0013 0.8652 0.0008 0.9559
3 0.0017 0.7851 0.0020 0.6891 0.0014 0.8446
4 0.0012 0.8908 0.0012 0.8868 0.0009 0.9340
5 0.0010 0.9237 0.0008 0.9490 0.0007 0.9630
6 0.0017 0.7845 0.0020 0.7130 0.0014 0.8456
Model
#
6 CV groups 12 CV groups
RMSECV Q² RMSECV Q²
1 0.0013 0.8701 0.0012 0.8971
2 0.0011 0.9016 0.0010 0.9262
3 0.0018 0.7505 0.0017 0.7871
4 0.0011 0.9085 0.0010 0.9239
5 0.0007 0.9591 0.0007 0.9681
6 0.0018 0.763 0.0017 0.7947
5.4.2 Calibration and parameter uncertainty
After model selection, model 5 was fit to the complete calibration data set
consisting of 12 experiments, and the rate constants were calculated. They are
shown in Figure 5.3 with their respective parameter uncertainties. The rate
constant for the first attachment to the mAb is k1 = 0.797 (mM∙s)-1, for the
second attachment k2 = 1.476 (mM∙s)-1. The rate constant of the drug sink term
is k3 = 0.00155 s-1. The 95% confidence intervals correspond to 3%, 5%, and 10%
of the parameter value for k1, k2, and k3, respectively. Regarding the
availability of binding sites, 92.02% of the mAb starting concentration was
used for the mAb with two available binding sites, 7.1% for one available
binding site, and 0.89% for no active binding site.

5 Kinetic reaction modeling
73
Figure 5.3: Rate constants of model 5 with 95% confidence intervals. k1 gives the rate
for the first attachment of NPM to mAb, k2 for the second attachment. k3 is the rate
constant for the lumped drug depletion.
The model calibration for model 5 yielded an R² of 0.970 over the calibration
data set of 12 runs. In Figure 5.4, one experiment at 1.5 g/L and NPM ratio of
3 is shown as an example. Model and experimental concentrations of un-,
mono-, and di-conjugated mAb over 30 min reaction time are shown. Un-
conjugated mAb is decreasing, mono-conjugated mAb is increasing during the
first 45 s before it starts decreasing, and bi-conjugated mAb is continuously
increasing. All concentrations are approaching a threshold corresponding to
the starting values for mAb with zero, one and two active binding sites. The
other experiments including the model fit can be found in the supplementary
material.
Figure 5.4: Example of conjugation run from the calibration set at 1.5 g/L and NPM
ratio of 3. The markers are experimental data, the straight lines the fit for model 5. The
blue square markers are the un-conjugated mAb, the red triangles the mono-conjugated
mAb, and the yellow diamonds the bi-conjugated mAb.
0.0
0.5
1.0
1.5
2.0
k1 k2
Rat
e co
nst
ant
[1/(
mM
*s)]
0.000
0.001
0.002
k3
Rat
e co
nst
ant
[1/s
]
k1 k2 k3

5.4 Results
74
5.4.3 Validation of selected models
An external validation data set consisting of 9 experiments at 1.75 g/L and
2.5 g/L (outside the calibration range of 1-2 g/L) was used to validate model 5.
Using the starting concentrations for mAb and NPM, the course of the
conjugation reaction was predicted by the model and compared to the
experimental data. R² of prediction was at 0.978 and RMSEP at 0.00070 mM,
which is in the same range as for the cross-validation with 4 CV groups. The
results of the experiments and model 5 prediction are shown in Figure 5.5 for
all 9 validation runs. Model predictions are closely following experimental data
for all concentrations which is reflected in the R² of prediction. The
conjugations at an NPM ratio of 2 do not reach an as high degree of conjugation
as is obtained with a ratio of 3 or 4. Higher concentrations of mAb and NPM
lead to a faster conjugation.

5 Kinetic reaction modeling
75
Figure 5.5: Results of model 5 prediction for the 9 validation experiments. The markers
are experimental data and the respective model predictions are shown by straight lines.
The blue square markers are the un-conjugated mAb, the red triangles the mono-
conjugated mAb, and the yellow diamonds the bi-conjugated mAb. R² of prediction was
at 0.978 and RMSEP at 0.00070 mM. The data at 2.5 g/L is outside the calibration
range of the model (1-2 g/L).
5.4.4 Investigation of salt effects on rate constants
For investigating the influence of hydrophobicity and ionic strength on the rate
of the conjugation reaction, varying concentrations of ammonium sulfate (AS),
sodium chloride (NaCl), and guanidine hydrochloride (GuHCl) were added to
the buffer. Model 5 was then newly fit to each of the salt runs and new rate
constants were calculated for each salt and concentration. The results are
shown in Figure 5.6. In general, the addition of salt leads to an increase in the
reaction rate of the conjugation (k1 and k2). The effect of AS is stronger than
the effect of NaCl and GuHCl. A higher concentration of the same salt, leads to
Co
nce
ntr
atio
n [
mM
]
Reaction time [s]
2x NPM 3x NPM 4x NPM
1.75 g/L
1.75 g/L
2.5 g/L

5.4 Results
76
a faster conjugation, except in the case of 1 M AS, where the effect is lower than
at 600 mM. At 1 M AS, the fit (R² = 0.924) was also worse than for the other
runs (R² > 0.963) and the degree of conjugation was lower at the end of the
reaction. With GuHCl, only k1 is increasing with rising salt concentration. k2 is
about 35% higher than for the original model 5, but does not change between
the different salt concentrations. Also regarding the drug sink term, the
addition of salt leads to a higher rate constant. k3 is about 10 times higher for
1 M AS and also 200 mM and 600 mM AS have a stronger effect than the other
salts. For NaCl, k3 is increased between 36% and 66% and for GuHCl between
10% and 25% with wide parameter confidence intervals.
Figure 5.6: Effect of ammonium sulfate (AS), sodium chloride (NaCl), and guanidine
hydrochloride (GuHCl) on model 5 rate constants. 200 mM, 600 mM, and 1 M of salt
were tested. 95% confidence intervals are shown for the parameters. k1 and k2 values
are shown in the top graph, k3 values in the bottom graph.
0
1
2
3
4
5
6
Rat
e co
nst
ant
[1
/(m
M*s
)] k1 k2
0.000
0.005
0.010
0.015
0.020
0.025
Rat
e co
nst
ant
[1/s
]
k3

5 Kinetic reaction modeling
77
5.4.5 Application of the kinetic model for process optimization
For applying the kinetic model as an in silico decision support in selecting the
best process conditions, we conducted – as potential case study – an in silico
screening and optimized the process for a short reaction time and a DAR close
to 2. As described in detail in paragraph 5.3.3.2, different mAb concentrations
and NPM ratios were screened. At each of over 200,000 points, the reaction
time was optimized according to the objective function, maximizing bi-
conjugated antibody and minimizing reaction time. The resulting color maps
are shown in Figure 5.7. In the left graph, the optimal reaction times are
shown. The higher the mAb concentration and the NPM excess, the lower the
optimal reaction time, with the exception of an NPM excess between about 2.5
and 2. Here, a lower NPM excess requires a lower reaction time. In the right
graph, the fraction of bi-conjugated mAb which is achieved at the optimal
reaction time is visualized. Higher mAb concentrations and higher NPM ratios
yield higher bi-conjugated fractions. The shaded area in both graphs represents
a bi-conjugated fraction of over 91.5%. The lowest possible NPM ratio to reach
this fraction depends on the mAb concentration and lies between about 2.65
and 3.85. Higher mAb concentrations need a lower drug excess.
Figure 5.7: Results of in silico screening and optimization. Color maps show optimal
reaction times (left) for screened mAb and NPM concentrations and the resulting
fraction of bi-conjugated component (right). The shaded area in both graphs indicates
a bi-conjugated fraction of greater than 91.5%.
5.4.6 Application of the kinetic model to support process monitoring
The established kinetic modeling approach was also applied to extend the
capabilities of a previously developed PAT tool for conjugation reactions2. The
tool consists of a calibrated PLS model which is able to calculate the reaction
progress (amount of conjugated drug) directly from UV/Vis spectra recorded
during the conjugation reaction. Here, we calibrated the PLS model, as well as
the kinetic model with two conjugation runs at a 20 mL scale and 2 g/L of mAb
Bi-
con
juga
ted
fra
ctio
n
>91.5%
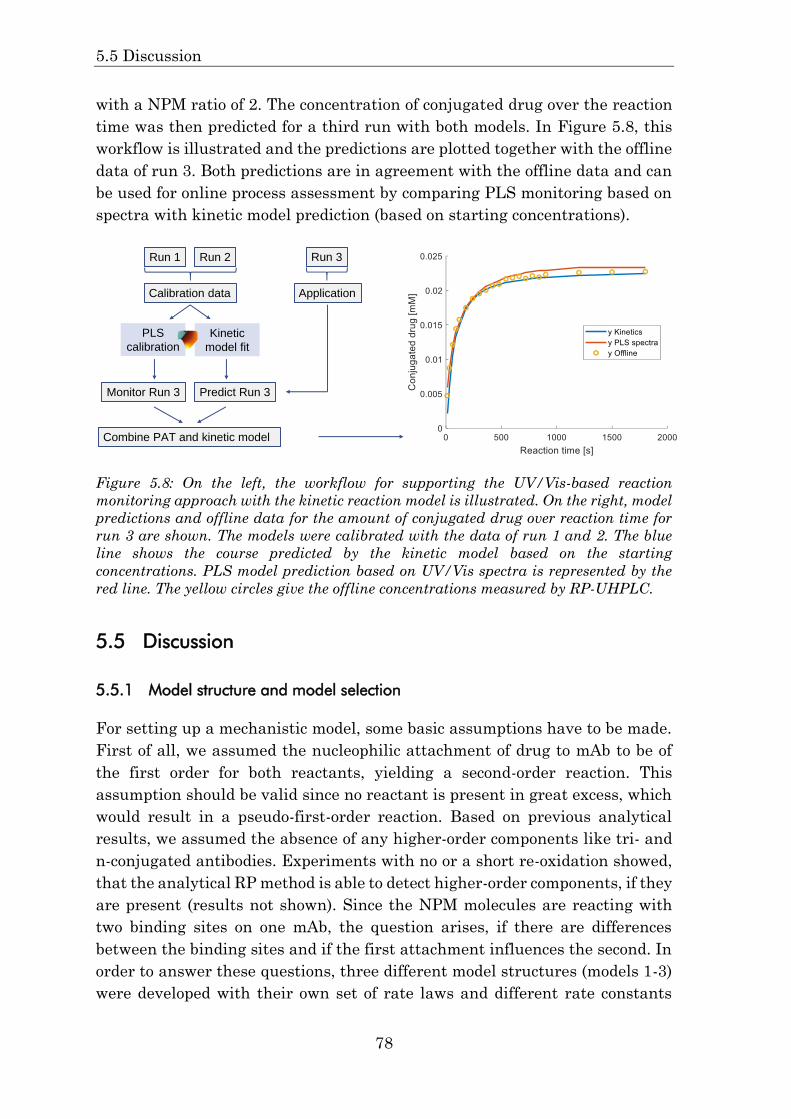
5.5 Discussion
78
with a NPM ratio of 2. The concentration of conjugated drug over the reaction
time was then predicted for a third run with both models. In Figure 5.8, this
workflow is illustrated and the predictions are plotted together with the offline
data of run 3. Both predictions are in agreement with the offline data and can
be used for online process assessment by comparing PLS monitoring based on
spectra with kinetic model prediction (based on starting concentrations).
Figure 5.8: On the left, the workflow for supporting the UV/Vis-based reaction
monitoring approach with the kinetic reaction model is illustrated. On the right, model
predictions and offline data for the amount of conjugated drug over reaction time for
run 3 are shown. The models were calibrated with the data of run 1 and 2. The blue
line shows the course predicted by the kinetic model based on the starting
concentrations. PLS model prediction based on UV/Vis spectra is represented by the
red line. The yellow circles give the offline concentrations measured by RP-UHPLC.
5.5 Discussion
5.5.1 Model structure and model selection
For setting up a mechanistic model, some basic assumptions have to be made.
First of all, we assumed the nucleophilic attachment of drug to mAb to be of
the first order for both reactants, yielding a second-order reaction. This
assumption should be valid since no reactant is present in great excess, which
would result in a pseudo-first-order reaction. Based on previous analytical
results, we assumed the absence of any higher-order components like tri- and
n-conjugated antibodies. Experiments with no or a short re-oxidation showed,
that the analytical RP method is able to detect higher-order components, if they
are present (results not shown). Since the NPM molecules are reacting with
two binding sites on one mAb, the question arises, if there are differences
between the binding sites and if the first attachment influences the second. In
order to answer these questions, three different model structures (models 1-3)
were developed with their own set of rate laws and different rate constants
Run 1 Run 2 Run 3
Calibration data Application
PLS
calibration
Kinetic
model fit
Predict Run 3Monitor Run 3
Combine PAT and kinetic model

5 Kinetic reaction modeling
79
(Figure 5.2). Additionally, these models were extended by incorporating a
lumped drug sink term, yielding models 4-6. The principal reason for a decrease
in NPM content independently of the conjugation probably lies in its unspecific
adsorption to the walls of the tubes. Since this was not studied in detail and
there are other possible causes like a chemical inactivation, a lumped drug sink
term was used. In the cross-validation, the models with drug sink term perform
far better than their counterparts without the sink term, which seems to be a
good extension of the model. Also in experiments containing no protein, a
depletion of NPM over time was measured by a decrease in UV signal
(supplementary material), which underlines the plausibility of including this
term. This is supported by a low parameter uncertainty of k3 (Figure 5.3).
RMSEP and Q² results of all models in the CV point towards model 5 as the
best model in the set and show that the basic model structure of model 2 and
model 5 describes closest the underlying mechanism. Model 5 performed best
for all amounts of CV groups and model 2 and model 4 share the second place.
Since the binding sites are in the same place on identical heavy chains, no effect
caused by different binding sites (model 3 and model 6) was expected. Still, this
structure was included to investigate a possible influence of 3D structure. The
poor performance of both of these models in the CV indicates that the binding
sites can be treated as equal. An influence of the first binding on the second,
on the other hand (model 2 and model 5), is backed by the results. A possible
cause could be the hydrophobicity introduced by the first NPM molecule
making the second attachment more feasible. The increased hydrophobicity
can also be seen in the RP-UHPLC analytics, where the unconjugated mAb
elutes first, before mono-conjugated and last bi-conjugated mAb (method
introduced in a previous publication1). Dai et al. postulated hydrophobic
interactions to be the driving force for reactivity and selectivity of their
hydrophobic π-clamp binding site and showed a salt dependency following the
Hofmeister series144. Since the cysteine binding sites for the NPM molecules
are in the same position on the two heavy chains, an influence of the first
binding on the second is possible. A possible fourth model basic structure
combining model 2 and 3 in a structure where the binding sites are different
and influence each other was discarded for two reasons: first, the poor
performance of the models with different binding sites; second, to not
unnecessarily increase the complexity of the models as model 5 already
achieved excellent results.
The structure of the data and order of the runs can have an influence on CV
results. When the arrangement of the runs for CV group assignment was
changed, model 5 was still clearly the best model.
5.5 Discussion
80
5.5.2 Model calibration and validation
All steps after model selection were done with model 5, while the other models
were discarded. Parameters were estimated using the calibration set consisting
of 12 experiments achieving a good model fit, shown by the alignment of model
and experimental data in Figure 5.4 and the high R². The parameter
uncertainty given by 95% confidence intervals (Figure 5.3) underlines the
meaningfulness of the parameters included in the model structure. The model
quality was then confirmed by the external validation, where 9 different
experiments were used (R² of prediction of 0.978). All graphs in Figure 5.5 show
a good alignment of model and experimental data. The incomplete conjugation
for the runs with a NPM ratio of 2 is well represented by the model. Due to the
NPM depletion, the reactive drug is used up before the maximum level of
conjugation is reached. Here, the importance of including the drug sink term is
highlighted once more. Also the behavior of the mono-conjugated component,
which is first increasing and then going down, is captured well by the model. It
is highly dependent on the ratio of k1 and k2. For most of the validation
experiments, the bi-conjugated component is slightly underestimated by the
model towards the end of the reaction. This is probably caused by the analytics
because for the last samples, the measured concentration exceeded the
adjusted concentration by around 4%. Taking into account that the starting
concentrations are adjusted using UV/Vis measurements and the
concentrations during the reaction are calculated from RP-UHPLC
chromatograms, the deviation is acceptable. Overall, the calibration and
validation of model 5 show excellent results and the model structure with the
assumptions made seems to reflect the underlying principles very well.
One more thing that calls the attention is that k2 is higher than k1, so the
second attachment is faster than the first. Since the binding sites structurally
appear to be equal, the question is why this is the case. Here, the most probable
cause might be the increased hydrophobicity that is introduced by the
attachment of the first hydrophobic NPM molecule, which was discussed in the
last paragraph. Lê-Quôc et al. found an increased reaction rate for N-
substituted maleimides with increasing hydrophobicity145. They attributed this
to a hydrophobic microenvironment of the binding site. Thus, an increased
hydrophobicity of the microenvironment could be able to enhance the rate of
the reaction in the case of the second NPM attachment. This said, the effect
captured by the rate constant k2 could also be caused by an increased local
concentration of NPM in the binding region, caused by the increased
hydrophobicity. By analyzing the influence of different salts on the rate
constants, we intended to further investigate this effect and its inherent
potential for improving the reaction.
5 Kinetic reaction modeling
81
5.5.3 Salt effects on the rate constants
It is known that the addition of kosmotropic salts promotes hydrophobic
interactions, which for example is commonly used in hydrophobic interaction
chromatography (HIC). AS and, to a lower extent, NaCl have this effect. In the
conjugation experiments with added AS, the rate constants were strongly
increased compared to corresponding runs without salt. For addition of
600 mM and 1 M of NaCl, rate constants were also higher, but the effect was a
lot weaker than for AS. This again hints towards a strong impact of
hydrophobicity on the reactivity of this conjugation reaction. At the same time,
however, the addition of GuHCl, a chaotropic agent, also results in higher rate
constants, even more so than NaCl, which suggests the involvement of other
effects. For GuHCl, opposed to the other salts, only k1 changes with salt
concentration, while k2, despite being higher than in the original model, stays
at one level. On the one hand, the reaction rate can also be influenced by the
ionic strength of the solution, which could be one factor. It was shown that
already low concentrations of potassium chloride (< 50 mM) can enhance the
reactivity of thiols in membrane proteins with a maleimide-functionalized
fluorophore146. The effect increased with salt concentration, but stayed the
same above 100 mM. On the other hand, there is the potential of GuHCl
influencing protein conformation which could also have an impact. To get a
clearer understanding of the underlying effects, a dedicated study will be
necessary, but we can conclude that a hydrophobic effect probably is involved
in the reactivity of the binding sites and that this knowledge can be employed
for increasing the reaction rate by salt addition.
The strong effect of AS concentration on k3 is an indicator of drug depletion
being mainly caused by wall adsorption which is also hydrophobically driven.
For 1 M of AS, the high k3 value led to incomplete conjugation because all of
the NPM was depleted. Regarding the influence of the other salts on k3, it can
be stated that they cause a very low increase compared to AS, but parameter
uncertainty is high.
5.5.4 Model application
The selected model was applied to in silico screening, process optimization and
as part of a soft sensor combining model description with PAT application.
In the screening, over 200,000 points were evaluated and the process was
optimized for each one. The result in Figure 5.7 gives a range of conditions, in
which the fraction of target component is over a specified threshold. Within
this range, we can then select suitable conditions, where the needed drug
excess is minimal. This is an important parameter, because excess free drug
has to be removed afterwards. The optimal reaction time for the selected

5.6 Conclusion
82
condition is known from the left graph in Figure 5.7. The objective function of
the optimization can be tuned according to the process development goals.
Although the calibration range was between 1 g/L and 2 g/L, the screening
range was set between 1 g/L and 2.5 g/L, because the validation showed that
the model can extrapolate to 2.5 g/L. The decrease in optimal reaction time
between a NPM ratio of about 2.5 and 2 shows that in this range, the drug is
used up before conjugation is completed. These results show, that the kinetic
model, applied effectively, contains detailed information on the conjugation
process which can be leveraged in process development. It thus constitutes an
efficient tool for in silico decision support.
For process monitoring, the tested combination of PAT tool and kinetic model
is more accurate and flexible than just comparing the monitoring data to
previous runs. What is also shown by the results is that we were able to fit the
model also to data from a different setup in a different scale, which supports
the selected model structure.
If root cause analysis is intended, the kinetic model should be expanded, e.g.
towards more factors like pH, temperature and salt concentration.
5.6 Conclusion
In the present work, we developed a kinetic modeling approach and
demonstrated how it can be applied as in silico decision support for the
development of bioconjugation processes. The investigated reaction was the
covalent attachment of hydrophobic maleimide-functionalized surrogate drugs
to two engineered cysteines in a mAb. Six different model structures were
proposed and the best one was selected by cross-validation, yielding additional
insight into the underlying mechanism. The model provided evidence that the
second binding is affected by the attachment of the first molecule, which was
attributed to an increase in hydrophobicity in the environment of the binding
site. The selected model was validated with an external validation set with high
R² of prediction. Furthermore, an increased reaction rate was observed for the
addition of different salts to the reaction. The application of the model to in
silico screening and optimization showed its potential for enhancing efficiency
in process development by evaluating over 200,000 conditions and calculating
optimal reaction times. This enables the user to choose a condition where the
target product yield is met with minimal use of drug excess and in the shortest
reaction time possible. Finally, we presented an approach to combine the
kinetic model with a previously developed PAT tool2. By extending the kinetic
model, this approach could be used for online process assessment or root-cause
analysis.

5 Kinetic reaction modeling
83
In summary, the proposed kinetic modeling approach has the potential to be
used as a very versatile tool in the development of bioconjugation reactions. By
shaping a further digitization of process development, tools like these are
elementary for a more efficient process development.
Acknowledgments
We would like to thank Matthias Rüdt and Michael Wörner for their valuable
input and Michaela Wendeler from AstraZeneca for her great support. We also
would like to thank AstraZeneca for providing the mAb that was used in this
work.
Appendix B: Supplementary data
The supplementary data associated with this chapter contain the following
information:
- Graphs of model 5 calibration experiments with model fit
- Rate laws for the other models
- Graph of NPM depletion over time independent of conjugation
- Formulae for model evaluation

84
6 Modeling of hydrophobic interaction
chromatography for the separation of
antibody-drug conjugates and its application
towards quality by design
Sebastian Andrisa, Jürgen Hubbucha *
a Institute of Process Engineering in Life Sciences, Section IV: Biomolecular
Separation Engineering, Karlsruhe Institute of Technology, Fritz-Haber-
Weg 2, 76131 Karlsruhe, Germany
* Corresponding author
Abstract
Antibody-drug conjugates (ADCs) are hybrid molecules based on monoclonal
antibodies (mAbs) with covalently attached cytotoxic small-molecule drugs.
Due to their potential for targeted cancer therapy, they form part of the
diversifying pipeline of various biopharmaceutical companies, in addition to
currently seven commercial ADCs. With other new modalities, ADCs
contribute to the increasing complexity of biopharmaceutical development in
times of growing costs and competition. Another challenge is the
implementation of quality by design (QbD), which receives a lot of attention. In
order to answer these challenges, mechanistic models are gaining interest as
tools for enhanced process understanding and efficient process development.
The drug-to-antibody ratio (DAR) is a critical quality attribute (CQA) of ADCs.
After the conjugation reaction, the DAR can still be adjusted by including a
hydrophobic interaction chromatography (HIC) step. In this work, we
developed a mechanistic model for the preparative separation of cysteine-
engineered mAbs with different degrees of conjugation with a non-toxic
surrogate drug. The model was successfully validated for varying load
compositions with linear and optimized step gradient runs, applying conditions
differing from the calibration runs. In two in silico studies, we then present
6 Modeling of hydrophobic interaction chromatography
85
scenarios for how the model can be applied profitably to ensure a more robust
achievement of the target DAR and for the efficient characterization of the
design space. For this, we also used the model in a linkage study with a kinetic
reaction model developed by us previously. The combination of the two models
effectively widens system boundaries over two adjacent process steps.
We believe this work has great potential to help advance the incorporation of
digital tools based on mechanistic models in ADC process development by
illustrating their capabilities for efficient process development and increased
robustness. Mechanistic models can support the implementation of QbD and
eventually might be the basis for digital process twins able to represent
multiple unit operations.
6.1 Introduction
Among antibody therapeutics in late-stage clinical studies by the end of
November 2018, there were more molecules for cancer indications than for all
non-cancer indications combined27. About one quarter of the 33 molecules for
cancer indications were antibody-drug conjugates (ADCs), forming an
important class of novel anti-cancer agents. Combining monoclonal antibodies
(mAbs) and cytotoxic small-molecule drugs in one molecule, ADCs have the
capacity for high selectivity and efficacy. The recent approval of trastuzumab
deruxtecan by Daiichi Sankyo / AstraZeneca in December 2019 results in seven
ADCs currently on the market.
With increasing complexity of therapeutic targets, new modalities like ADCs
are diversifying the pipelines of pharmaceutical businesses, leading to
increasing complexity and costs of pharmaceutical development147. At the same
time, regulators are proposing the implementation of the quality-by-design
(QbD) paradigm, which implies an enhanced knowledge regarding the
relationship of product performance and process inputs in a wider range10.
Among other things, this understanding facilitates an extended design space.
This is beneficial, since, in contrast to conditions outside the design space,
variations inside are not considered a process change. For implementing QbD
as well as for coping with increased complexity and costs, the incorporation of
digital tools like process modeling and simulation into process development
may be essential. The use of mathematical models offers ways to improve
process understanding and more efficiently characterize the process and the
design space54.
One critical quality attribute (CQA) of an ADC is its drug-to-antibody ratio
(DAR), because it influences key factors like pharmacokinetics, efficacy, and
tolerability of the product45,111. High-DAR species (DAR 9-10) exhibit a
different behavior compared to components with less drug molecules attached

6.1 Introduction
86
(DAR 2-6). Next to the average DAR, also the drug load distribution is relevant.
The DAR is initially defined in the conjugation reaction, where the drug
molecules are covalently attached to the mAb via a linker. In current literature,
there are a few examples of kinetic models for protein conjugation reactions,
predominantly PEGylation58,143,148. In our recent publication on conjugation
reaction modeling, we developed a mechanistic model for the engineered
cysteine-conjugation of two surrogate drugs to a mAb3. Apart from generating
mechanistic insights, we applied the model for screening and optimizing the
conjugation conditions towards achieving the target DAR in the most efficient
way. This said, depending on the conjugation strategy, the reaction results in
a rather broad or narrow distribution of components with different drug
loadings. Only if a site-specific conjugation strategy like the conjugation to
engineered cysteines is used, one has increased control over drug-loading and
conjugation site31,117. In any case, it can be necessary to adjust the DAR and
drug load distribution post conjugation, for example to remove unconjugated
mAb, components with very high drug loading, or for troubleshooting purposes.
Thus, a robust combination of conjugation and subsequent purification is
necessary to achieve the target DAR. By establishing mechanistic models for
both processes, linking and applying them towards increased process
understanding, efficient process optimization, and process robustness, the
implementation of QbD for ADC development could be advanced substantially.
Since the small-molecule drugs, introduced into a comparably large protein,
are generally very hydrophobic, the increased hydrophobicity can be exploited
for separation of the components with different degrees of conjugation.
Naturally, the most suitable method is hydrophobic interaction
chromatography (HIC)86–88. It can be used to separate proteins under non-
denaturing conditions depending on their interaction with hydrophobic ligands
on the stationary phase. The retention of proteins in HIC is usually modulated
by varying the ionic strength of the buffer. However, the influence of salt
composition on protein retention is rather complex, and other factors like pH
and temperature have an effect149. Due to the high level of hydrophobicity in
ADCs, it can be necessary to include an organic solvent like isopropanol (IPA)
in the running buffer.
The model-based characterization of the retention of proteins in HIC has been
studied for many years75,150–155. While these models have extensively been used
for facilitating a deeper understanding of the underlying mechanisms, there
are fewer examples in the literature showcasing their beneficial application in
process development. A mechanistic HIC model has, for example, been applied
to optimizing the separation of an IgG from BSA as well as analyzing the
robustness of the optimized process154. Borrmann et al. described how to
develop a model for an antibody purification step enabling the prediction of
process performance at different scales with varying operating conditions156.
6 Modeling of hydrophobic interaction chromatography
87
Close et al. developed a model for the HIC purification of a dimeric therapeutic
protein with varying product form distribution91. Their intention was to use
the model in further studies to explore the effect of the varying load on product
quality. Finally, a mechanistic HIC model has been developed in order to lower
the experimental effort in optimizing a mAb purification step93. Another
example of a (non-HIC) chromatography model being used for handling
variations in the feed composition has been presented for an ion-exchange step
separating charge variants of a mAb157.
For the preparative separation of different ADC species with HIC, no
mechanistic model has been developed so far. As stated above, such a model
could be effectively applied to process development and optimization and could
support the implementation of QbD in ADC development by yielding process
knowledge and facilitating a more robust realization of critical quality
attributes like the DAR.
In this work, we use the transport-dispersive model (TDM) and the HIC
adsorption isotherm developed by Mollerup et al.75 to model the separation of
mAbs conjugated with either zero, one, or two molecules of a non-toxic
surrogate drug. The model is validated with linear gradient elution as well as
optimized step gradient runs applying varying load compositions. Once
validated, two in silico studies are conducted demonstrating the capabilities of
the model in supporting the implementation of QbD in ADC development. The
first study shows the application of the model to model-based process control,
increasing robustness in achieving the target DAR. In the second study, a
linkage study with a previously developed kinetic reaction model is presented.
We believe that the model developed and the described applications represent
an important step towards the intensified use of digital tools like mechanistic
models for ADC process development, a trend that might eventually result in
the creation of ‘digital twins’ for production processes.
6.2 Theory
6.2.1 Transport-dispersive model and boundary conditions
The TDM is a lumped-rate model describing convection, dispersion, and mass
transfer inside a chromatography column94. It is based on mass balances that
are one-dimensional in space, which means that the concentration of a solute i
in the void volume ci and bead pore volume cp,i are solely a function of the
position along the column axis x and the time t. The system is described by a
balance for the mobile phase (Equation 6.1) and a balance for the stationary
phase (Equation 6.2):

6.2 Theory
88
𝜕𝑐𝑖𝜕𝑡
= −𝑢int ∙𝜕𝑐𝑖𝜕𝑥
−1 − 𝜀int𝜀int
∙ (𝑘eff,𝑖 ∙3
𝑟p∙ (𝑐𝑖 − 𝑐p,𝑖)) + 𝐷ax ∙
𝜕2𝑐𝑖
𝜕𝑥² (6.1)
𝜀p ∙𝜕𝑐p,𝑖
𝜕𝑡+ (1 − 𝜀p)
𝜕𝑞𝑖𝜕𝑡
= 𝑘eff,𝑖 ∙3
𝑟p∙ (𝑐𝑖 − 𝑐p,𝑖) (6.2)
The convective transport of the solutes is effected by the interstitial velocity of
the solvent uint. Rather than considering the concentration distribution inside
the pores, the TDM employs a lumped coefficient, the effective film transfer
coefficient keff. It lumps together film diffusion, pore diffusion, and surface
diffusion. Besides keff, the mass transfer term depends on the interstitial
porosity εint, the radius of the porous particles rp, and the difference between
the concentration in the void volume ci and the pore concentration cp,i. In the
last term of Equation 6.1, the impact of hydrodynamic effects on band
broadening, for example caused by packing nonidealities, is described using the
axial dispersion coefficient Dax. The balance for the stationary phase
(Equation 6.2) relates the mass transfer term to the change in pore
concentration cp,i and concentration adsorbed to the solid phase qi, depending
also on the particle porosity εp. The system of differential equations was solved
using the software ChromX. ChromX uses Danckwerts’ boundary conditions
for column inlet and outlet, given by Equation 6.3 and Equation 6.4, where cin,i
means the applied inlet concentration158:
𝑐𝑖(𝑡, 𝑥 = 0) = 𝑐in,𝑖(𝑡) +𝐷ax𝑢int
∙𝜕𝑐𝑖(𝑡, 𝑥 = 0)
𝜕𝑥 (6.3)
𝜕𝑐𝑖(𝑡, 𝑥 = 𝐿)
𝜕𝑥= 0 (6.4)
The TDM does not account for adsorption kinetics, assuming an equilibrium
between concentration in the pores and adsorbed concentration.
6.2.2 Isotherm model
For a description of the adsorption equilibrium, we used the HIC isotherm
developed by Mollerup et al.75. Equation 6.5 shows the kinetic formulation of
the isotherm as implemented in ChromX:
𝑘kin,𝑖 ∙𝜕𝑞𝑖𝜕𝑡
= 𝑘eq,𝑖 ∙ (1 −∑𝑞𝑗
𝑞max,𝑗
𝑁
𝑗=1
)
𝑛𝑖
∙ exp(𝑘s,𝑖 ∙ 𝑐p,salt + 𝑘p,𝑖 ∙ 𝑐p,𝑖) ∙ 𝑐p,𝑖 − 𝑞𝑖 (6.5)
where N represents the number of proteins, kkin,i denotes the kinetic constant,
and keq,i is the equilibrium constant. The saturation capacity qmax,j of the
adsorber for component j depends on the ligand density, steric shielding, and
the stoichiometric parameter nj (number of ligands bound per protein). Finally,
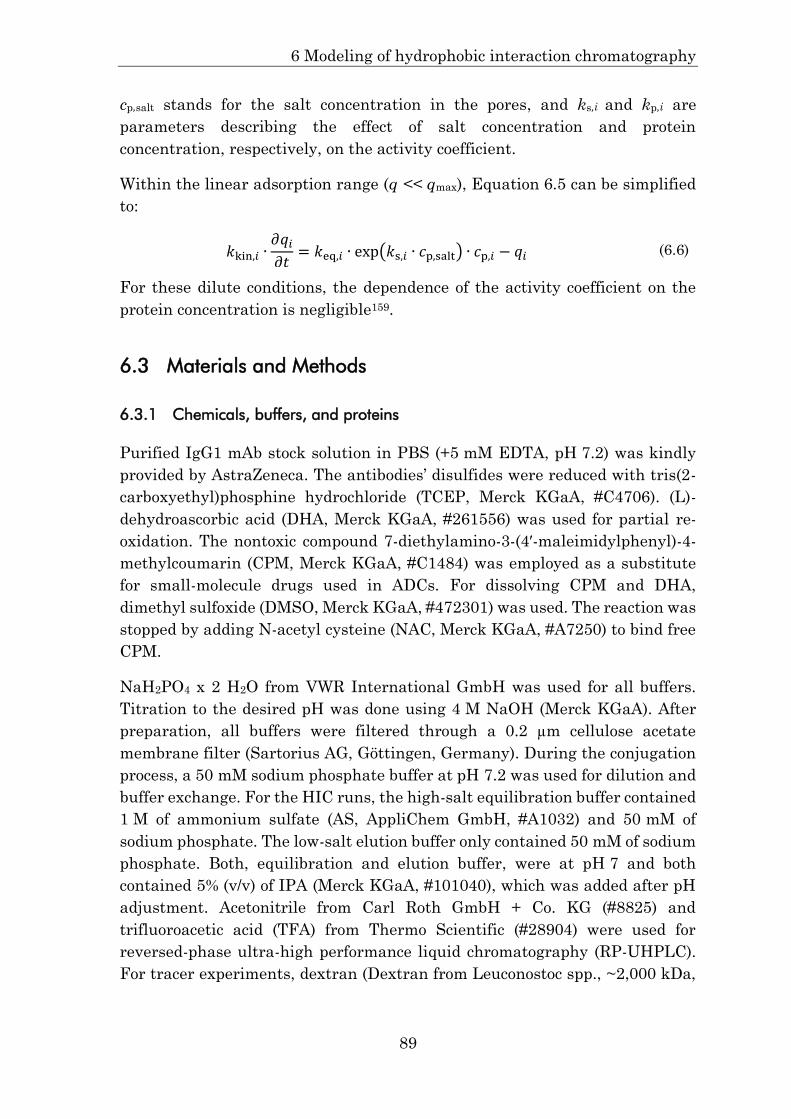
6 Modeling of hydrophobic interaction chromatography
89
cp,salt stands for the salt concentration in the pores, and ks,i and kp,i are
parameters describing the effect of salt concentration and protein
concentration, respectively, on the activity coefficient.
Within the linear adsorption range (q << qmax), Equation 6.5 can be simplified
to:
𝑘kin,𝑖 ∙𝜕𝑞𝑖𝜕𝑡
= 𝑘eq,𝑖 ∙ exp(𝑘s,𝑖 ∙ 𝑐p,salt) ∙ 𝑐p,𝑖 − 𝑞𝑖 (6.6)
For these dilute conditions, the dependence of the activity coefficient on the
protein concentration is negligible159.
6.3 Materials and Methods
6.3.1 Chemicals, buffers, and proteins
Purified IgG1 mAb stock solution in PBS (+5 mM EDTA, pH 7.2) was kindly
provided by AstraZeneca. The antibodies’ disulfides were reduced with tris(2-
carboxyethyl)phosphine hydrochloride (TCEP, Merck KGaA, #C4706). (L)-
dehydroascorbic acid (DHA, Merck KGaA, #261556) was used for partial re-
oxidation. The nontoxic compound 7-diethylamino-3-(4′-maleimidylphenyl)-4-
methylcoumarin (CPM, Merck KGaA, #C1484) was employed as a substitute
for small-molecule drugs used in ADCs. For dissolving CPM and DHA,
dimethyl sulfoxide (DMSO, Merck KGaA, #472301) was used. The reaction was
stopped by adding N-acetyl cysteine (NAC, Merck KGaA, #A7250) to bind free
CPM.
NaH2PO4 x 2 H2O from VWR International GmbH was used for all buffers.
Titration to the desired pH was done using 4 M NaOH (Merck KGaA). After
preparation, all buffers were filtered through a 0.2 µm cellulose acetate
membrane filter (Sartorius AG, Göttingen, Germany). During the conjugation
process, a 50 mM sodium phosphate buffer at pH 7.2 was used for dilution and
buffer exchange. For the HIC runs, the high-salt equilibration buffer contained
1 M of ammonium sulfate (AS, AppliChem GmbH, #A1032) and 50 mM of
sodium phosphate. The low-salt elution buffer only contained 50 mM of sodium
phosphate. Both, equilibration and elution buffer, were at pH 7 and both
contained 5% (v/v) of IPA (Merck KGaA, #101040), which was added after pH
adjustment. Acetonitrile from Carl Roth GmbH + Co. KG (#8825) and
trifluoroacetic acid (TFA) from Thermo Scientific (#28904) were used for
reversed-phase ultra-high performance liquid chromatography (RP-UHPLC).
For tracer experiments, dextran (Dextran from Leuconostoc spp., ~2,000 kDa,

6.3 Materials and Methods
90
Sigma, #95771) and acetone (Acetone for LC, Merck KGaA, #1.00020) were
used.
6.3.2 Conjugation process
The mAb contained two engineered cysteines as binding sites for the
conjugation. Instead of cytotoxic small-molecule drugs, the non-toxic,
maleimide-functionalized surrogate drug CPM was used.
Prior to the conjugation reaction, the binding sites on the antibody were
prepared, performing a reduction and partial re-oxidation step in 50 mL
centrifuge tubes (Corning, #352070).
At the beginning, the mAb stock solution was diluted with 50 mM sodium
phosphate buffer at pH 7.2 to the desired concentration. A Nano Drop 2000c
spectrometer (Thermo Scientific, Waltham, USA) was used for concentration
measurements. For the reduction, the mAb concentration was set to 6.2 g/L
and TCEP was added in a 40-fold molar excess over the mAb concentration.
After incubating for 3 h at room temperature and at a 350 rpm orbital shaking
rate (Thermo Mixer C, Eppendorf AG, Hamburg, Germany), the reduced mAb
was dialyzed into 50 mM sodium phosphate buffer pH 7.2. Dialysis was done
at 5 °C with a 10 kDa molecular weight cut-off cassette (Thermo Scientific,
#87731-87733) to remove the reducing agent.
Interchain disulfide bonds were reformed by a partial re-oxidation with a 20-
fold molar excess of DHA (8 mM stock solution in DMSO), which was conducted
for 4 h at room temperature and 350 rpm orbital shaking.
The conjugation was started by addition of CPM dissolved in DMSO at a molar
ratio of 3:1 (CPM : mAb). During the reaction, the DMSO content was set to
10% and the mAb concentration was 5.1 g/L. Finally, a 12-fold molar excess of
NAC (over CPM) was added to bind residual free drug and stop the conjugation
reaction. To create different DARs for the HIC runs, the reactions were stopped
at different times. Like this, six loads with DARs of 0.76, 0.78, 1.26, 1.49, 1.63,
and 1.84 were generated and stored at -80 °C.
6.3.3 System and column characterization
All chromatography experiments were performed with an Ettan liquid
chromatography (LC) system consisting of pump unit P-905, dynamic single
chamber mixer M-925 (90 µL mixer volume), UV-Vis monitor UV-900, and
conductivity monitor pH/C-900 (all GE Healthcare, Uppsala, Sweden). A
Repligen OPUS Minichrom column with a column volume (CV) of 2.5 mL (ID
8 mm, L 50 mm), pre-packed with TSKgel Phenyl-5PW (20 µm), was used
(Repligen GmbH, Ravensburg, Germany).
The system and column parameters were determined by injections of

6 Modeling of hydrophobic interaction chromatography
91
noninteracting tracers94. As non-pore-penetrating tracer, dextran (~2,000 kDa)
was used in a 10 g/L solution in running buffer. As pore-penetrating tracer, a
1% solution of acetone in running buffer was used. The tracer experiments were
done by injecting 100 µL samples of tracer through a sample loop, with and
without column connected to the system. Each experiment was performed in
triplicates for both high- and low-salt buffer and the results were averaged.
After their determination, these system and column parameters were used to
calculate other model parameters like porosities and volumes. The axial
dispersion coefficient (Dax) was estimated from the concentration profile of the
non-penetrating tracer dextran using the software ChromX (Version 1.3.12.1,
GoSilico GmbH, Karlsruhe, Germany).
6.3.4 HIC experiments
Prior to each run, the load was buffer-exchanged into the equilibration buffer
using PD-10 desalting columns with Sephadex G-25 resin in the spin protocol
(GE Healthcare, #17085101). This step also served to remove free CPM
molecules.
The system was first equilibrated with high-salt buffer (ionic strength (IS) of
3.106 M), before 0.5 mL of sample were loaded through a sample loop. All loads
were concentrated between 4 g/L and 5 g/L of protein with varying
compositions of ADC components (see Table 6.1). After a wash of 2.3 CV with
equilibration buffer, the elution was started. For the linear as well as the step
gradient runs, IS was immediately decreased in a first step (IS between 1.6 M
and 2.504 M). From the level of the first step, IS was then decreased to 0.095 M,
either in a linear gradient or another step. The linear gradient length was
varied between 15 and 25 CV. The step length of the second step was varied
between 6 and 12 CV. All bind-and-elute runs are summed up in Table 6.1.

6.3 Materials and Methods
92
Table 6.1: Summary of HIC gradient runs conducted for model calibration and
validation.
Run
#
Load
#
Load
DAR
Gradient length
[CV]
Ionic strength at
gradient start /
after 1st step
[M]
Model calibration
1 1 0.76 20 2.504
2 1 0.76 15 2.504
3 2 1.48 20 2.504
4 3 1.49 15 2.504
5 3 1.49 25 2.504
6 4 1.84 20 2.504
7 4 1.84 25 2.504
8 5 0.78 6 (Step) 1.785
9 5 0.78 10 (Step) 1.600
Model validation
10 6 1.63 12 (Step) 2.054
11 7 1.26 9 (Step) 1.942
12 7 1.26 17.5 2.353
6.3.5 Reversed-phase analytical chromatography
The load material as well as all fractions were analyzed using RP-UHPLC as
described previously1. The assay was applied for quantification of the
conjugation states of the intact mAb without sample preparation.
6.3.6 HIC model calibration
For modeling the transport of solutes through the column, the transport-
dispersive model was used. All experiments described in Section 6.3.4 are
expected to be in the linear range of the isotherm. Consequently, Equation 6.6
was used for modeling the adsorption. The protein parameters, namely keff, kkin,
keq, and ks, were determined by minimizing the sum of squared residuals
between experimental data and model prediction using ChromX. Adaptive
simulated annealing (ASA)160 and Ceres Solver161 were used as global and local
optimizers, respectively. For finite-element spatial discretization, linear finite
elements with ‘Streamline-Upwind / Petrov-Galerkin-stabilization’ (SUPG)
were selected. As time-stepping scheme for the simulation, the so-called

6 Modeling of hydrophobic interaction chromatography
93
fractional-step scheme was chosen162. Thirty axial cells and time steps of 1 s
were used.
6.3.7 Process optimization and HIC model validation
After achieving a satisfying fit, the model was validated with one linear
gradient run and two step gradient runs with conditions differing from the
calibration runs in load composition, gradient length, and gradient starting
concentration (see Table 6.1). The conditions of the step gradients were
determined by using the calibrated model to optimize the process towards high
purity and yield of the bi-conjugated component, a short process time, and a
low pooling volume (meaning a high concentration in the pool). The
optimization was done for the step gradients only, varying the ionic strength of
the first step, the length of the second step, and the pooling criterion. In order
to have strongly varying conditions for a thorough validation, we changed the
penalty for a long process time between the optimization for run 9 and run 10
(two different loads).
6.3.8 In silico study for model-based process control
In order to demonstrate the potential of a validated HIC model for a more
robust achievement of the target DAR, an in silico study was conducted. A
theoretical load resulting from the conjugation process was generated (DAR =
1.88) and the HIC process was optimized for this load, yielding a final target
DAR in the HIC pool. The outcome of this procedure was assumed to be the
standard process. Due to a process variation in the conjugation, the output and
thus the load for the HIC step can vary. In order to mimic this case, the load
was varied to a lower DAR value of 1.5. In case the subsequent HIC process is
sensitive to these variations in the load, the previously developed ‘stiff’ HIC
process might lead to a situation where the target DAR is missed. In order to
prevent this, the HIC model was used to adjust the HIC process (allowing a
more flexible parameter setting, determined by the targeted outcome) towards
achieving the final target DAR in the HIC pool. Thus, reaching the target DAR
was weighted more heavily in the objective of the optimization.
6.3.9 Model-based linkage study of HIC purification and conjugation
Finally, we combined the validated HIC model with a previously established
kinetic reaction model3. A schematic overview is shown in Figure 6.1. The
kinetic model was initially developed for the conjugation of a maleimide-
functionalized surrogate drug to two engineered cysteines in a mAb, the same
reaction as applied in this work for the generation of the HIC load material.

6.3 Materials and Methods
94
The input to the kinetic model are the starting concentrations of mAb and drug
and the reaction time and the output is the concentration of each conjugate
species, defining the DAR of the product. These output concentrations of the
conjugation model acted as the input needed for the HIC model in order to
apply an optimized step gradient process and calculate the yield and final DAR
in the HIC pool. To showcase the potential of such a model combination or
‘digital twin’, an in silico screening and optimization for the conjugation
reaction was conducted (varying mAb and drug input concentrations, as
described in our previous publication), feeding the output directly into the HIC
model. The HIC model was then used to optimize the HIC step gradient process
for the different loads coming from the conjugation and for directly calculating
the total yield (protein output of HIC in pool / protein input of conjugation) and
final DAR in the HIC pool. In summary, the two models were used to calculate
the total yield and the final output of the HIC process from the input
parameters of the conjugation process. For simplicity, the duration of the HIC
process was not varied in the optimization and the length of the second step
was set constant at 30 mL. Instead, only the ionic strength of the first step and
the pooling criterion were optimized.
Figure 6.1: Schematic overview of the in silico linkage study between kinetic model for
the conjugation and HIC model for the purification of ADCs. 𝑐mab,in and 𝑐Drug,in are the
input concentrations of mAb and drug for the conjugation. 𝑐mAb , 𝑐mAb+1 and 𝑐mAb+2 are
the concentrations of un-, mono-, and di-conjugated mAb resulting from the
conjugation, which form the input for the HIC model. 𝑌𝑖𝑒𝑙𝑑total means the ratio of
protein in the HIC pool to protein going into the conjugation. 𝐷𝐴𝑅final is the DAR after
the HIC step.
Kinetic model ofconjugation
HIC model forADC purification
𝑐mAb,in
𝑐Drug,in
Optimizes process forshort reaction time and 𝐷𝐴𝑅 → 2
𝑐mAb , 𝑐mAb+1 , 𝑐mAb+2
Optimizes processfor high purity and yield of mAb+2
𝑌𝑖𝑒𝑙𝑑total
𝐷𝐴𝑅final
Digital twin for conjugation and HIC purification
Optimal reaction time for different inputs
Optimal HIC conditions fordifferent load compositions

6 Modeling of hydrophobic interaction chromatography
95
6.4 Results and Discussion
6.4.1 Model calibration
All parameters characterizing the system and column used herein are
summarized in Table 6.1. The other model parameters of the TDM and the used
adsorption isotherm (Equations 6.1, 6.2, 6.6) were determined by fitting the
model to nine calibration experiments. Chromatograms showing the model fit
together with the experimental data are presented in Figure 6.2. The
unconjugated mAb is always the first component to elute, followed by the mono-
conjugated and di-conjugated component. Retention times are well described
by the model for all components in all runs. For the linear gradients, also peak
shape and height are in good agreement. One exception is the tailing, especially
of the bi-conjugated component, which is not as well described by the model. It
has been reported repeatedly, that the interaction with the hydrophobic surface
of the adsorber in HIC can lead to a partial unfolding of proteins 163–165. The
unfolded fraction of the protein is retained more strongly, which could lead to
the tailing observed in Figure 6.2. Since this effect is not covered in the applied
model, it would explain the deviation regarding the tailing. While we think that
this is the most probable explanation, it is also possible that aggregates of the
components are eluting in the end of the peak. Every attached CPM molecule
adds hydrophobicity to the mAb, which can also be seen by the order of elution,
so the bi-conjugated component is the most prone to aggregation. It might be
possible to describe this effect by including a forth component for the
aggregates, but the amount of aggregates would have to be quantified for all
fractions with separate analytics. For the case of reversible on-column
aggregation, this would not be possible. In the step runs, the isocratic part after
the first step is also well described by the model, but the peak of the bi-
conjugated component in the second step is wider and lower in the simulation.
Nevertheless, the agreement of peak positions and peak shapes between
experimental data and simulation was good, as visualized using parity plots.
In Figure 6.3A, the retention volume VR of the peak maximum is compared,
giving a reference for the peak position. All markers are close to the parity line,
which implies that the peak positions are well modeled for all components. This
translates to an R² of 0.98 for the position of the peak maximum. By assessing
the width at half of the peak height, a characterization of the peak shape is
possible, because width as well as height of the peak are taken into account.
Figure 6.3B shows that the simulated peaks have a tendency to be wider and/or
lower than the ones in the experimental chromatograms, despite the generally
good agreement between the shapes. The average difference is 0.86 mL, which
is about 15% of the average width at half the peak height. This yields an R² of
0.83. In total, after parameter estimation, the model is able to describe the

6.4 Results and Discussion
96
experimental data very well, covering different linear gradient lengths,
different load compositions as well as step gradients with varying step heights
and lengths. We expect this approach to work in the same way using real
cytotoxic drug molecules instead of surrogate drugs. The requirement is that
sufficient recovery can be achieved and that the concentrations in the fractions
can be quantified. Of course, the model development and calibration become
more extensive, the more components with different DARs are present, which
highly depends on the conjugation strategy.
Table 6.2: Parameters characterizing system and column.
Parameter Symbol Value Unit Determination
Column length L 50 mm Manufacturer
Column diameter d 8 mm Manufacturer
Bead radius rp 0.01 mm Manufacturer
System dead
volume Vd 0.215 mL Acetone tracer, no column
Retention volume
acetone VRAc 2.370 mL
Acetone tracer, with
column
Retention volume
dextran VRDex 1.158 mL
Dextran tracer, with
column
Superficial
velocity u 0.414 mm/s Controlled
Column volume Vc 2.500 mL Manufacturer
Fluid volume Vf 2.155 mL 𝑉f = 𝑉RAc − 𝑉d
Interstitial
volume Vint 0.943 mL 𝑉int = 𝑉RDex − 𝑉d
Total column
porosity εtot 0.862 - 𝜀tot = 𝑉f/𝑉c
Interstitial
porosity εint 0.377 - 𝜀int = 𝑉int/𝑉c
Particle porosity εp 0.778 - 𝜀p = (𝑉f − 𝑉int)/(𝑉c − 𝑉int)
Interstitial
velocity uint 1.099 mm/s 𝑢int = u/𝜀int
Axial dispersion Dax 0.133 mm²/s Estimated from tracer
The results obtained from model calibration are based on the assumption that
q<<qmax, indicating a very low competition for binding sites. Furthermore, the
effect of non-ideal protein behavior in the pores caused by protein-protein

6 Modeling of hydrophobic interaction chromatography
97
interactions represented by the interaction parameter for protein kp was
neglected. All together, these assumptions result in a model only valid in the
linear part of the adsorption isotherm. The adsorption behavior of the three
components modeled is, in this case, only described by the equilibrium constant
keq,i and the kinetic rate constant kkin,i as well as the concentration of salt, its
influence on protein activity being represented by ks,i. In addition to these three
parameters, the effective film diffusion coefficient keff,i was estimated. A
determination using empirical correlations was discarded due to the high salt
concentration and the presence of IPA in the buffers, both increasing the
viscosity of the solution166 and thus influencing its mass transfer properties.
The resulting parameters estimated for the un-conjugated, mono-conjugated,
and bi-conjugated mAb are listed in Table 6.3. When compared to literature
values for mAbs, the effective film diffusion coefficient keff,i is in a plausible
range92,167. An accurate comparison is difficult, however, as mass transfer
inside the pores depends on many factors like pore size, pore tortuosity, and
other conditions168. Furthermore, reports suggest that pore diffusion, as well
as surface diffusion, play a strong part in the transport of proteins in HIC
resins155. Since the components have approximately the same size, it is natural
that their keff,i are in the same range. All three estimated isotherm parameters
were expected to increase with increasing hydrophobicity of the components,
which is the case as shown in Table 6.3. ks,i covers the stronger effect of salt on
more hydrophobic molecules, leading to a later elution of the higher conjugated
species. The adsorption equilibrium keq,i is also higher, meaning a higher
affinity to the adsorber surface for more hydrophobic, more conjugated
molecules. Apart from later elution, a higher keq,i also impacts the peak shape.
For the kinetic rate kkin,i, the values range from 4.9 x 10⁻⁸ s to 39.62 s. Higher
values lead to a slower change in adsorbed concentration, which causes the
peaks to broaden. In this way, the wider peaks of the conjugated species can be
described.
Organic solvents like the IPA present in the buffers also have an impact on the
binding to the HIC adsorber. Since the concentration was 5% in all buffers at
all times, this effect was not modeled separately. It is incorporated as a factor
into the other model parameters and will not be further discussed.

6.4 Results and Discussion
98
Table 6.3: Estimated model parameters for the three modeled components
unconjugated mAb (mAb), mono-conjugated mAb (mAb+1), and bi-conjugated mAb
(mAb+2).
Parameter mAb mAb+1 mAb+2
keff,i [mm/s] 0.0013 0.0010 0.0015
kkin,i [s] 4.9 x 10⁻⁸ 3.47 39.62
keq,i [-] 0.079 0.092 0.131
ks,i [M-1] 3.114 3.256 3.521
Figure 6.2: Overview of HIC gradient experiments used for parameter estimation.
Absorption of the three mAb components at 280 nm (unconjugated in red, mono-
conjugated in green, and bi-conjugated in blue) and ionic strength of the buffer (black)
are plotted over the retention volume. The simulation is shown by the straight lines, the
fraction data by the dashed lines. Load composition, gradient length, and step height
were varied between the runs. The conditions of each run can be found in Table 6.1.
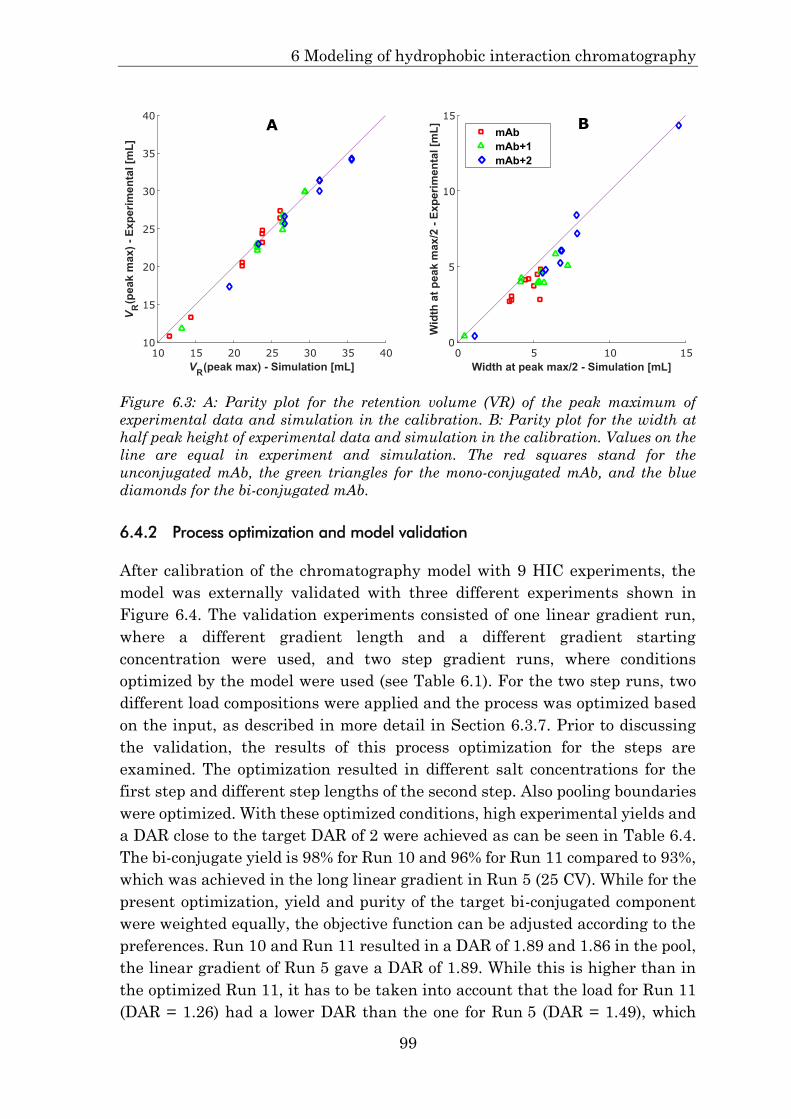
6 Modeling of hydrophobic interaction chromatography
99
Figure 6.3: A: Parity plot for the retention volume (VR) of the peak maximum of
experimental data and simulation in the calibration. B: Parity plot for the width at
half peak height of experimental data and simulation in the calibration. Values on the
line are equal in experiment and simulation. The red squares stand for the
unconjugated mAb, the green triangles for the mono-conjugated mAb, and the blue
diamonds for the bi-conjugated mAb.
6.4.2 Process optimization and model validation
After calibration of the chromatography model with 9 HIC experiments, the
model was externally validated with three different experiments shown in
Figure 6.4. The validation experiments consisted of one linear gradient run,
where a different gradient length and a different gradient starting
concentration were used, and two step gradient runs, where conditions
optimized by the model were used (see Table 6.1). For the two step runs, two
different load compositions were applied and the process was optimized based
on the input, as described in more detail in Section 6.3.7. Prior to discussing
the validation, the results of this process optimization for the steps are
examined. The optimization resulted in different salt concentrations for the
first step and different step lengths of the second step. Also pooling boundaries
were optimized. With these optimized conditions, high experimental yields and
a DAR close to the target DAR of 2 were achieved as can be seen in Table 6.4.
The bi-conjugate yield is 98% for Run 10 and 96% for Run 11 compared to 93%,
which was achieved in the long linear gradient in Run 5 (25 CV). While for the
present optimization, yield and purity of the target bi-conjugated component
were weighted equally, the objective function can be adjusted according to the
preferences. Run 10 and Run 11 resulted in a DAR of 1.89 and 1.86 in the pool,
the linear gradient of Run 5 gave a DAR of 1.89. While this is higher than in
the optimized Run 11, it has to be taken into account that the load for Run 11
(DAR = 1.26) had a lower DAR than the one for Run 5 (DAR = 1.49), which
6.4 Results and Discussion
100
makes it more difficult to reach a high DAR in the HIC pool. Moreover, the
concentration in the optimized step pools is 2.6 times higher than in Run 5 with
a similar loaded mass, and the processing time is shorter.
Table 6.4: Predicted and experimental yield and DAR of optimized step runs (Run 10
and 11).
Run 10 Predicted Experimental Deviation [%]
Yield 0.97 0.98 0.6
DAR 1.96 1.89 3.4
Run 11 Predicted Experimental Deviation [%]
Yield 0.94 0.96 2.1
DAR 1.93 1.86 4.0
The data obtained from fractionation and the respective model prediction for
the three validation runs are depicted in Figure 6.4. Model and experimental
data are in good agreement for all three runs. Especially the elution during the
linear gradient is very well described regarding both peak position as well as
peak shape. As for the calibration runs, the bi-conjugated component deviates
regarding the tailing. The probable cause was discussed in the previous section.
The simulation of the step runs successfully describes the isocratic elution
before the IS drop of the second step for all components, but it slightly
underestimates the rest of unconjugated and mono-conjugated component that
is eluting in the target product peak of the second step. For integrating the
product peak, the pooling boundaries optimized by the model were used. It is
highly important to the application of the model that the amount of the target
bi-conjugated component in the pool is very well predicted, which is reflected
by the good agreement of predicted and experimental yields (see Table 6.4;
about 1.5% deviation). Due to the residual un- and mono-conjugated species in
the product peak, the DAR in the HIC pool is overestimated by about 3.7%. In
general, these results show the successful validation of the calibrated HIC
model. Additionally, it could be demonstrated that the proposed HIC model is
able to determine optimal conditions for a step gradient run for varying load
compositions of conjugated components. This underlines the applicability of a
mechanistic chromatography model for ADC process development and
optimization. In the next two sections, this ability of the model to use
concentrations of conjugated components as an input and identify optimized
HIC parameters as an output is applied in two in silico studies to showcase its
application in process control and model linkage.

6 Modeling of hydrophobic interaction chromatography
101
Figure 6.4: HIC gradient experiments used for model validation. The conditions for the
step gradients in Run 10 and Run 11 were optimized using the calibrated model. For
calculation of yield and DAR, the same optimized pooling boundaries were used for
simulation and experimental data. Absorption of the three mAb components at 280 nm
(unconjugated in red, mono-conjugated in green, and bi-conjugated in blue) and ionic
strength of the buffer (black) are plotted over the retention volume. The simulation is
shown by the straight lines, the fraction data by the dashed lines. The conditions of
each run can be found in Table 6.1.
6.4.3 Robust DAR by model-based process control
In the introduction, the importance of the DAR as a CQA for ADCs was
underlined. It is crucial to reach the specified value in a robust manner. While
the DAR can, of course, depend on many factors, two processes are particularly
important for reaching the target degree of conjugation, namely the
conjugation reaction and the purification post-conjugation. This in silico study
was designed to demonstrate the applicability of the HIC model in this context
of reaching a target degree of conjugation in a controlled manner. A flow chart
with the setup and the results of the study is displayed in Figure 6.5. The top
sequence of steps represents the standard process, where a conjugation
reaction at 5 g/L with a resulting DAR of 1.88 was assumed. Processing this
load composition by using the standard HIC step (optimized for this load), gives

6.4 Results and Discussion
102
a DAR of 1.97 in the HIC pool with a yield of 98.1%.
A deviation from the specified process for the conjugation can potentially lead
to a different output, in this case study a DAR of 1.5. This constitutes a varied
load for the standard HIC process. Due to the inability of the stiff original HIC
process to react on variation in the load, the final DAR in the pool dropped to
1.85. The process performance is apparently sensitive to different load
compositions. For mitigating the impact of the deviation in the conjugation
output, the HIC model was used for model-based process control. In the
previous section, it was shown that the developed model can be used for process
optimization and to predict yield and DAR for varying load compositions. In
this study, we thus optimized the HIC process towards achieving the same
DAR of 1.97 as in the standard process. As a consequence, the yield dropped
from 98.1% to 91.2%, which is an acceptable price compared to losing the whole
batch. In Table 6.5, the original and the adjusted HIC conditions are listed.
Especially the volume of the second step was adjusted, from 30 mL to 44.46 mL
in the adapted process. These results demonstrate how a mechanistic process
model can help compensate variations in previous process steps in order to
reach product specifications by model-based process control. This underlines
the potential of mechanistic models for ADC development.
Figure 6.5: This flow chart shows how a mechanistic chromatography model can be
applied for more robustly achieving the specified degree of conjugation in the pool. By
adjusting the process using the model, one can react to a variation in a previous process
step, here the conjugation reaction.
Yield = 91.2%
Conjugation
LoadDAR = 1.88
HIC poolDAR = 1.97Yield = 98.1%
Varied loadDAR = 1.5
VariedHIC pool
DAR = 1.85
AdjustedHIC pool
DAR = 1.97
Yield = 98.1%
HIC process
Model-adjustedHIC process
Conjugation

6 Modeling of hydrophobic interaction chromatography
103
Table 6.5: HIC process parameters adjusted by model in reaction to variation in
conjugation output.
Parameter HIC standard HIC adjusted
cstep [M] 2.078 2.093 Vstep [mL] 30.00 44.46 Pool start [mL] 37.54 52.00 Pool end [mL] 43.90 57.30
6.4.4 Model-based linkage study of conjugation reaction and HIC purification
In the last part of this work, we performed an in silico linkage by combining
the validated HIC model with a previously established kinetic reaction model
for the conjugation3. The goal was to investigate the potential of the linked
models to act as ‘digital twin’ and thus to exploit the possibility to establish a
flexible design space over two adjacent unit operations. In Figure 6.6, the
results of this linkage study are presented. The overall objective was reaching
a DAR of 2 with high yield.
As described in Section 6.3.9, the input to the kinetic model consisted of the
mAb concentration and the ratio of CPM to mAb concentration. Graph A in
Figure 6.6 shows the DAR, which is achieved with different starting
concentrations, when optimizing the conjugation for a DAR of 2 and a short
reaction time (with the DAR being the primary objective). The DAR is
calculated from the individual component concentrations. At each data point,
this output was then used as input for the HIC model, in order to optimize the
HIC settings on the basis of the different load compositions. Graphs B and C
in Figure 6.6 give the optimal ionic strength of the first step and the volume at
the end of the pool, respectively. The lower the incoming DAR from the
conjugation, the more the salt concentration has to be lowered in the first step
and the lower is the pool volume. For simplicity, the volume of the second step
was not varied in the optimization. For each screened condition, the final yield
was calculated as amount of protein in the HIC pool divided by amount of mAb
going into the conjugation reaction. Yield and DAR in the HIC pool are shown
in graphs D and E of Figure 6.6. It can be seen that good DAR values between
1.94 and 1.97 can be achieved with the optimized HIC steps, working with
incoming DARs as low as 1.46. This is facilitated by the model by adjusting the
HIC process according to the load composition. As is to be expected, the yield
drops lower, the lower the DAR is after conjugation. For the condition with the
lowest degree of conjugation, the yield is 64% compared to 93% for the condition
with the highest DAR.

6.4 Results and Discussion
104
This case study shows how two mechanistic models can be used in combination
to screen inputs of the conjugation reaction and directly assess the output of
the subsequent purification step in silico. Prior to a running process, such
combination can help to investigate questions like how low the drug excess can
be set in the conjugation while still achieving the target DAR with a good yield
after purification. Furthermore, it is not only possible to optimize the second
process step for the best set of parameters in the first process step, but for a
range of parameter sets. Finally, the combination of adjacent process models
widens system boundaries over more than one individual process step and thus
the established ‘digital twin’ might lead to an overall flexible design space.

6 Modeling of hydrophobic interaction chromatography
105
Figure 6.6: Results of linkage study of kinetic reaction model and HIC model for
engineered-cysteine conjugation and subsequent HIC purification. A: DAR after
conjugation for different input concentrations of mAb and CPM. B: Optimal ionic
strength of the first step in HIC depending on output from the conjugation reaction.
Each screened condition in the conjugation is a new load composition for HIC. C:
Optimal pooling end volume in HIC depending on output from the conjugation
reaction. D: Final yield after HIC. E: DAR after HIC. Yield and DAR after HIC are
determined by the two models directly from the input concentrations of the conjugation.
Component concentrations (DAR) predicted by conjugation reaction model are input for HIC model
HIC model calculates optimal yields and DAR for different load compositions
HIC model optimizes process for different loads
CB
A
D E

6.5 Conclusion
106
6.5 Conclusion
A mechanistic HIC model for the preparative separation of ADC species with
different degrees of conjugation was successfully developed and its benefit for
ADC development was demonstrated in two in silico case studies. The model
was validated with one linear and two step gradient experiments, in which
gradient starting concentration, gradient length, and load composition were
changed. With the in silico-optimized step runs, a higher yield and similar
purity of the target bi-conjugated component in a shorter processing time and
with a higher concentration in the pool was achieved compared to a gradient
run with similar load. Yield and DAR of these runs were predicted by the model
with relative errors between 1% and 4%. After validating the ability of the
model to find optimal HIC process conditions for different load compositions,
an in silico study was conducted to show how this can be applied to ensure a
robust achievement of the target DAR, a critical quality attribute of ADCs. By
adjusting the HIC purification according to the model, it was possible to react
to a variation in the conjugation reaction, which had affected the DAR of the
load. Next to model-based process control, the HIC model was used in an in
silico linkage study, combining it with a kinetic reaction model developed by us
previously3. The combination illustrates the application of mechanistic models
for efficient characterization of a wider design space. Both case studies
elucidate, how mechanistic modeling could pave the way from stiff processes
unable to react to variations in previous steps towards more flexible processing
approaches.
Going further, the chromatographic model should be extended to higher load
concentrations by including experiments beyond the linear range of the
isotherm. However, the model developed in this work serves its purpose of
demonstrating how model description can be used in the implementation of
QbD for ADC development and how the incorporation of modeling and
simulation tools can support a more efficient characterization of process and
design space in times of increasing complexity and costs.
We believe that the concepts presented in this work could help fertilize the
ground for a further implementation of QbD in biopharmaceutical development
and eventually for the emergence of digital process twins mirroring whole
chains of unit operations.

6 Modeling of hydrophobic interaction chromatography
107
Acknowledgments
We would like to thank Chris Thompson and Michaela Wendeler from
AstraZeneca for their ideas in the creation of this project. We further thank
AstraZeneca for providing the mAb used in this study. Finally, we would like
to thank Till Briskot, Steffen Großhans, Matthias Rüdt, Philipp Vormittag,
Gang Wang, and Johannes Winderl for their valuable input.

108
7 Conclusion and Outlook
This thesis contributes to finding answers to some of the current challenges in
biopharmaceutical development, and in ADC development in particular. One
objective was establishing tools for highly efficient process development in
order to cope with increasing complexity and costs. Furthermore, it was
intended to promote the implementation of QbD for conjugation processes by
providing enhanced process understanding, techniques for process monitoring,
and efficient ways to characterize the design space. To this end, the potential
of different high-throughput, analytical, and digital tools for ADC process
development was evaluated (Chapters 3-6). Several such methods were
developed for the process of site-specifically attaching two maleimide-
functionalized surrogate drugs to a cysteine-engineered mAb. After validating
the methods, it was demonstrated how they can be applied to dealing with the
mentioned challenges and different ADC-related problems like achieving the
target DAR.
The first part of this work (Chapter 3) was dedicated to establishing a high-
throughput process development platform for site-specific ADC conjugations
comprising the whole conjugation process as well as high-throughput
compatible analytics. All process steps including a buffer exchange and the
subsequent protein quantification were successfully transferred to a robotic
liquid handling station. A high-throughput compatible RP-UHPLC method
with a runtime of 7 min was developed to assess conjugation results efficiently.
Combining high-throughput screening with DoE, the platform was applied to
conjugation experiments and the results were presented using response
surface modeling. Finally, the comparability to a manual setup was shown. The
developed platform facilitates efficient parameter screening for site-specific
conjugation strategies, which often require multiple reaction steps leading to a
wide range of parameters. The degree of automation and parallelization that
high-throughput platforms offer could be essential for finding optimal
parameters for the next generation of ADCs.
In the second part of the thesis (Chapter 4), a UV/Vis-based on-line monitoring
method for ADC conjugation reactions utilizing multivariate data analysis was
created. First, a spectral change caused by the conjugation of the surrogate
drug to the mAb was successfully identified. It can most probably be ascribed

7 Conclusion and Outlook
109
to solvatochromism. By using PLS regression, the change in the UV/Vis signal
was then correlated to the amount of conjugated drug in the solution as
determined by RP-UHPLC. The calibrated PLS model allowed to follow the
reaction progress solely by measuring UV/Vis absorption, a fast and
noninvasive technique. The approach was successfully validated by using
either cross-validation or external data for two different surrogate drugs and
two setups with different detectors. This on-line monitoring tool could be
applied to assessing the DAR of ADCs during the conjugation reaction, possibly
reducing an analytical bottleneck. Additionally, the monitoring of this critical
quality attribute is the first step in implementing a PAT-based control strategy
as promoted by QbD.
The DAR is also pivotal in the third part of this PhD thesis (Chapter 5), where
a kinetic reaction model for site-specific ADC conjugations was developed,
which is able to predict the DAR at each point of the reaction from the starting
concentrations. Six model structures, each a set of ODEs, were proposed and
the best model was selected by cross-validation. This model suggests that the
binding to the second of two equal binding sites is influenced by the first
attachment in the way that it has an increased reaction rate. The effect was
attributed to the hydrophobicity introduced by the first attached drug.
Additionally, it was shown that the addition of different salts, especially
ammonium sulfate, can have a strong, positive effect on the reaction rate. The
selected model was subsequently validated by predicting an external data set,
including data outside the calibration range. In order to determine starting
concentrations yielding the target DAR in the shortest reaction time possible,
the investigated process was optimized performing an in silico screening and
optimization. It also enables the selection of conditions where optimal results
are achieved with minimal drug excess, an important criterion due to high
toxicity and cost of the drug molecules. Finally, an idea for the extension of the
monitoring approach developed in Chapter 4 was presented, combining it with
the kinetic reaction model. This combination can help identify process
deviations on-line. The demonstrated capabilities make the established kinetic
modeling approach a valuable tool for ADC conjugation development benefiting
efficiency and process understanding.
In the final study (Chapter 6), a mechanistic chromatography model for the
preparative separation of ADC components was developed and its application
to efficient process development and model-based process control was
demonstrated. The HIC purification of the surrogate ADCs was described using
a model for the transport of solutes through the column (TDM) and for the
adsorption equilibrium. Calibration and validation showed good agreement of
model and experimental data for linear and step gradient runs. The model was

7 Conclusion and Outlook
110
able to find optimized step gradient conditions for loads with different
compositions of ADC components and to successfully predict DAR and yield of
the optimized runs. In a first in silico case study, this ability of the HIC model
was used for the controlled achievement of the target DAR, reacting to process
variations in the conjugation. An in silico linkage study for conjugation and
HIC purification applying both the HIC model as well as the kinetic reaction
model from Chapter 5 demonstrated the potential of mechanistic models for
efficient process characterization. The linked models form a ‘digital process
twin’ which might enable a flexible design space over the two adjacent unit
operations. The presented study illustrates how a mechanistic HIC model could
benefit ADC process development by facilitating efficient characterization of
the design space and model-based process control. Both are important elements
in the implementation of QbD.
Overall, the tools and ideas developed in this thesis constitute a valuable
contribution to shaping the process development for the next generation of
ADCs. The increased efficiency needed to cope with rising complexity and costs
could be delivered by high-throughput experimentation and mechanistic
modeling approaches. Enhanced process understanding and control enabled by
PAT and mechanistic modeling procedures will help forwarding QbD-focused
process development. By applying techniques like mechanistic modeling to
ADC-specific problems like DAR control or low drug usage, the potential of
these techniques for ADC processing was demonstrated. Combinations of two
mechanistic models or different tools like PAT and a mechanistic model give
an idea of the opportunities which these digital tools might offer in the future,
possibly paving the way to real digital process twins.
111
Bibliography
1. Andris S, Wendeler M, Wang X, Hubbuch J. Multi-step high-throughput
conjugation platform for the development of antibody-drug conjugates. J
Biotechnol 2018; 278:48–55. doi: 10.1016/j.jbiotec.2018.05.004
2. Andris S, Rüdt M, Rogalla J, Wendeler M, Hubbuch J. Monitoring of
antibody-drug conjugation reactions with UV/Vis spectroscopy. J
Biotechnol 2018; 288:15–22. doi: 10.1016/j.jbiotec.2018.10.003
3. Andris S, Seidel J, Hubbuch J. Kinetic reaction modeling for antibody-
drug conjugate process development. J Biotechnol 2019; 306:71–80. doi:
10.1016/j.jbiotec.2019.09.013
4. Andris S, Hubbuch J. Modeling of hydrophobic interaction
chromatography for the separation of antibody-drug conjugates and its
application towards quality by design. J Biotechnol 2020; 317:48–58. doi:
10.1016/j.jbiotec.2020.04.018
5. Jagschies G, Lindskog E, Łacki K, Galliher P. Biopharmaceutical
Processing: Development, Design, and Implementation of Manufacturing
Processes. Elsevier; 2018.
6. Walsh G. Biopharmaceutical benchmarks 2018. Nat Biotechnol 2018;
36:1136–45. doi: 10.1038/nbt.4305
7. Nagel KM. Introduction to Biologic and Biosimilar Product Development
and Analysis. AAPS; 2018.
8. Kiss R, Gottschalk U, Pohlscheidt M. New Bioprocessing Strategies:
Development and Manufacturing of Recombinant Antibodies and
Proteins. Springer International Publishing; 2018.
9. Carter PJ, Lazar GA. Next generation antibody drugs: Pursuit of the
“high-hanging fruit.” Nat Rev Drug Discov 2018; 17:197–223. doi:
10.1038/nrd.2017.227
10. ICH. Q8(R2) Pharmaceutical development. 2009;
11. Hemmerich J, Noack S, Wiechert W, Oldiges M. Microbioreactor Systems
for Accelerated Bioprocess Development. Biotechnol J 2018; 13:1–9. doi:
10.1002/biot.201700141
12. McDonald P, Tran B, Williams CR, Wong M, Zhao T, Kelley BD, Lester
P. The rapid identification of elution conditions for therapeutic antibodies
from cation-exchange chromatography resins using high-throughput
screening. J Chromatogr A 2016; 1433:66–74. doi:
10.1016/j.chroma.2015.12.071
13. Bhambure R, Kumar K, Rathore AS. High-throughput process

Bibliography
112
development for biopharmaceutical drug substances. Trends Biotechnol
2011; 29:127–35. doi: 10.1016/j.tibtech.2010.12.001
14. Chhatre S, Titchener-Hooker NJ. Review: Microscale methods for high-
throughput chromatography development in the pharmaceutical
industry. J Chem Technol Biotechnol 2009; 84:927–40. doi:
10.1002/jctb.2125
15. Narayanan H, Luna MF, Stosch M von, Bournazou MNC, Polotti G,
Morbidelli M, Butté A, Sokolov M. Bioprocessing in the Digital Age – the
Role of Process Models. Biotechnol J 2020; 15. doi:
10.1002/jssc.201200569
16. Chen W, Chen X, Gandhi R, Mantri R V., Sadineni V, Saluja A.
Application of Mechanistic Models for Process Design and Development
of Biologic Drug Products. J Pharm Innov 2016; 11:200–13. doi:
10.1007/s12247-016-9250-0
17. Strebhardt K, Ullrich A. Paul Ehrlich ’ s magic bullet concept : 100 years
of progress. Nat Rev cancer 2008; 8:473–80. doi: 10.1038/nrc2394
18. Ehrlich P, Morgenroth J. Die Seitenkettentheorie der Immunität.
Anleitung zu Hyg Untersuchungen nach den im Hyg Inst der königl
Ludwig-Maximilians-Universität zu München üblichen Methoden
zusammengestellt 1902; 3:381–94.
19. Ehrlich P. Aus Theorie und Praxis der Chemotherapie. Folia Serol 1911;
7:698–714.
20. Goodman LS, Wintrobe MM, Dameshek W, Goodman MJ, Gildman A,
McLennan M. Nitrogen mustard therapy. JAMA 1946; 132:126–32.
21. Gilman A. The initial clinical trial of nitrogen mustard. Am J Surg 1963;
105:574–8. doi: 10.1016/0002-9610(63)90232-0
22. Carter P. Improving the efficacy of antibody-based cancer therapies. Nat
Rev Cancer 2001; 1:118–29.
23. Little M, Kipriyanov SM, Le Gall F, Moldenhauer G. Of mice and men:
Hybridoma and recombinant antibodies. Immunol Today 2000; 21:364–
70. doi: 10.1016/S0167-5699(00)01668-6
24. Scott AM, Wolchok JD, Old LJ. Antibody therapy of cancer. Nat Rev
Cancer 2012; 12:278–87. doi: 10.1038/nrc3236
25. Slamon DJ, Godolphin W, Jones LA, Holt JA, Wong SG, Keth DE, Levin
WJ, Stuart SG, Udove J, Ullrich A, et al. HER-2/neu Proto-oncogene in
human breast and ovarian cancer. Science (80- ) 1989; 244:707–12.
26. Slamon DJ, Clark GM, Wong SG, Levin WJ, Ullrich A, Mcguire WL.
Human Breast Cancer: Correlation of Relapse and Survival with
Amplification of the HER-2/neu Oncogene. Science (80- ) 1987; 235:177–

Bibliography
113
82.
27. Kaplon H, Reichert JM. Antibodies to watch in 2019. MAbs 2019; 11:219–
38. doi: 10.1080/19420862.2018.1556465
28. Rossin R, Versteegen RM, Wu J, Khasanov A, Wessels HJ, Steenbergen
EJ, Ten Hoeve W, Janssen HM, Van Onzen AHAM, Hudson PJ, et al.
Chemically triggered drug release from an antibody-drug conjugate leads
to potent antitumour activity in mice. Nat Commun 2018; 9:1–11. doi:
10.1038/s41467-018-03880-y
29. Gébleux R, Stringhini M, Casanova R, Soltermann A, Neri D. Non-
internalizing antibody–drug conjugates display potent anti-cancer
activity upon proteolytic release of monomethyl auristatin E in the
subendothelial extracellular matrix. Int J Cancer 2017; 140:1670–9. doi:
10.1002/ijc.30569
30. Ryman JT, Meibohm B. Pharmacokinetics of monoclonal antibodies. CPT
Pharmacometrics Syst Pharmacol 2017; 6:576–88. doi:
10.1002/psp4.12224
31. Agarwal P, Bertozzi CR. Site-specific antibody-drug conjugates: the
nexus of bioorthogonal chemistry, protein engineering, and drug
development. Bioconjug Chem 2015; 26:176–92. doi: 10.1021/bc5004982
32. Malik P, Phipps C, Edginton A, Blay J. Pharmacokinetic Considerations
for Antibody-Drug Conjugates against Cancer. Pharm Res 2017; doi:
10.1007/s11095-017-2259-3
33. Fu Y, Ho M. DNA Damaging Agent Based Antibody-Drug Conjugates for
Cancer Therapy. Antib Ther 2018; 1:33–43. doi:
10.1093/abt/tby007/5086672
34. Lambert J. Antibody-drug conjugates: targeted delivery and future
prospects. Ther Deliv 2016; 7:279–82. doi: 10.1002/9781118903681
35. Chari RVJ. Expanding the Reach of Antibody–Drug Conjugates. ACS
Med Chem Lett 2016; 7:974–6. doi: 10.1021/acsmedchemlett.6b00312
36. Damelin M, Bankovich A, Park A, Aguilar J, Anderson W, Santaguida M,
Aujay M, Fong S, Khandke K, Pulito V, et al. Anti-EFNA4 calicheamicin
conjugates effectively target triple-negative breast and ovarian tumor-
initiating cells to result in sustained tumor regressions. Clin Cancer Res
2015; 21:4165–73. doi: 10.1158/1078-0432.CCR-15-0695
37. Hamilton GS. Antibody-drug conjugates for cancer therapy: The
technological and regulatory challenges of developing drug-biologic
hybrids. Biologicals 2015; 43:318–32. doi:
10.1016/j.biologicals.2015.05.006
38. Zhang D, Le H, Cruz-Chuh J dela, Bobba S, Guo J, Staben L, Zhang C,
Ma Y, Kozak KR, Lewis Phillips GD, et al. Immolation of p -Aminobenzyl

Bibliography
114
Ether Linker and Payload Potency and Stability Determine the Cell-
Killing Activity of Antibody–Drug Conjugates with Phenol-Containing
Payloads. Bioconjug Chem 2018; 29:267–74. doi:
10.1021/acs.bioconjchem.7b00576
39. Bakhtiar R. Antibody drug conjugates. Biotechnol Lett 2016; 38:1655–64.
doi: 10.1007/s10529-016-2160-x
40. Gébleux R, Casi G. Antibody-drug conjugates: Current status and future
directions. Pharmacol Ther 2016; 167:48–59. doi:
10.1016/j.drudis.2013.11.004
41. Kim MT, Chen Y, Marhoul J, Jacobson F. Statistical modeling of the drug
load distribution on trastuzumab emtansine (Kadcyla), a lysine-linked
antibody drug conjugate. Bioconjug Chem 2014; 25:1223–32. doi:
10.1021/bc5000109
42. Jackson DY. Processes for Constructing Homogeneous Antibody Drug
Conjugates. Org Process Res Dev 2016; 20:852–66. doi:
10.1021/acs.oprd.6b00067
43. Chudasama V, Maruani A, Caddick S. Recent advances in the
construction of antibody–drug conjugates. Nat Chem 2016; doi:
10.1038/NCHEM.2415
44. Junutula JR, Raab H, Clark S, Bhakta S, Leipold DD, Weir S, Chen Y,
Simpson M, Tsai SP, Dennis MS, et al. Site-specific conjugation of a
cytotoxic drug to an antibody improves the therapeutic index. Nat
Biotechnol 2008; 26:925–32. doi: 10.1038/nbt.1480
45. Sun X, Ponte JF, Yoder NC, Laleau R, Coccia J, Lanieri L, Qiu Q, Wu R,
Hong E, Bogalhas M, et al. Effects of Drug-Antibody Ratio on
Pharmacokinetics, Biodistribution, Efficacy, and Tolerability of
Antibody-Maytansinoid Conjugates. Bioconjug Chem 2017; 28:1371–81.
doi: 10.1021/acs.bioconjchem.7b00062
46. Strop P, Liu S-H, Dorywalska M, Delaria K, Dushin RG, Tran T-T, Ho
W-H, Farias S, Casas MG, Abdiche Y, et al. Location Matters: Site of
Conjugation Modulates Stability and Pharmacokinetics of Antibody Drug
Conjugates. Chem Biol 2013; 20:161–7. doi:
10.1016/j.chembiol.2013.01.010
47. Ohri R, Bhakta S, Fourie-O’Donohue A, Dela Cruz-Chuh J, Tsai SP, Cook
R, Wei B, Ng C, Wong AW, Bos AB, et al. High-Throughput Cysteine
Scanning to Identify Stable Antibody Conjugation Sites for Maleimide-
and Disulfide-Based Linkers. Bioconjug Chem 2018; 29:473–85. doi:
10.1021/acs.bioconjchem.7b00791
48. Su D, Kozak KR, Sadowsky J, Yu SF, Fourie-O’Donohue A, Nelson C,
Vandlen R, Ohri R, Liu L, Ng C, et al. Modulating Antibody-Drug
Conjugate Payload Metabolism by Conjugation Site and Linker

Bibliography
115
Modification. Bioconjug Chem 2018; 29:1155–67. doi:
10.1021/acs.bioconjchem.7b00785
49. Shen B-Q, Xu K, Liu L, Raab H, Bhakta S, Kenrick M, Parsons-Reponte
KL, Tien J, Yu S-F, Mai E, et al. Conjugation site modulates the in vivo
stability and therapeutic activity of antibody-drug conjugates. Nat
Biotechnol 2012; 30:184–9. doi: 10.1038/nbt.2108
50. Großhans S, Rüdt M, Sanden A, Brestrich N, Morgenstern J, Heissler S,
Hubbuch J. In-line Fourier-transform infrared spectroscopy as a
versatile process analytical technology for preparative protein
chromatography. J Chromatogr A 2018; 1547:37–44. doi:
10.1016/j.chroma.2018.03.005
51. Furuki K, Toyo’oka T. Determination of thiol-to-protein ratio and drug-
to-antibody ratio by in-line size exclusion chromatography with post-
column reaction. Anal Biochem 2017; 527:33–44. doi:
10.1016/j.ab.2017.04.008
52. Garg M, Roy M, Chokshi P, Rathore AS. Process Development in the QbD
Paradigm: Mechanistic Modeling of Antisolvent Crystallization for
Production of Pharmaceuticals. Cryst Growth Des 2018; 18:3352–9. doi:
10.1021/acs.cgd.8b00055
53. Rüdt M, Briskot T, Hubbuch J. Advances in downstream processing of
biologics – Spectroscopy: An emerging process analytical technology. J
Chromatogr A 2017; 1490:2–9. doi: 10.1016/j.chroma.2016.11.010
54. Chatterjee S, Moore CM V, Nasr MM. An Overview of the Role of
Mathematical Models in Implementation of Quality by Design Paradigm
for Drug Development and Manufacture. In: Gintaras V. Reklaitis,
Seymour C, García-Munoz S, editors. Comprehensive Quality by Design
for Pharmaceutical Product Development and Manufacture. John Wiley
& Sons, Inc.; 2017. page 9–24.
55. Gronemeyer P, Ditz R, Strube J. Trends in upstream and downstream
process development for antibody manufacturing. Bioengineering 2014;
1:188–212. doi: 10.3390/bioengineering1040188
56. Awotwe-Otoo D, Agarabi C, Wu GK, Casey E, Read E, Lute S, Brorson
KA, Khan MA, Shah RB. Quality by design: Impact of formulation
variables and their interactions on quality attributes of a lyophilized
monoclonal antibody. Int J Pharm 2012; 438:167–75. doi:
10.1016/j.ijpharm.2012.08.033
57. Rathore AS, Sharma C, Persad A. Use of computational fluid dynamics
as a tool for establishing process design space for mixing in a bioreactor.
Biotechnol Prog 2012; 28:382–91. doi: 10.1002/btpr.745
58. Xiaojiao S, Corbett B, Macdonald B, Mhaskar P, Ghosh R. Modeling and
Optimization of Protein PEGylation. Ind Eng Chem Res 2016; 55:11785–

Bibliography
116
94. doi: 10.1021/acs.iecr.6b03122
59. Hahn T, Baumann P, Huuk T, Heuveline V, Hubbuch J. UV absorption-
based inverse modeling of protein chromatography. Eng Life Sci 2016;
16:99–106. doi: 10.1002/elsc.201400247
60. Zurdo J. Developability assessment as an early de-risking tool for
biopharmaceutical development. Pharm Bioprocess 2013; 1:29–50. doi:
10.4155/pbp.13.3
61. I. Razinkov V, J. Treuheit M, W. Becker G. Methods of High Throughput
Biophysical Characterization in Biopharmaceutical Development. Curr
Drug Discov Technol 2013; 10:59–70. doi: 10.2174/157016313804998915
62. Coffman JL, Kramarczyk JF, Kelley BD. High-throughput screening of
chromatographic separations: I. method development and column
modeling. Biotechnol Bioeng 2008; 100:605–18. doi: 10.1002/bit.21904
63. Kramarczyk JF, Kelley BD, Coffman JL. High-throughput screening of
chromatographic separations: II. Hydrophobic interaction. Biotechnol
Bioeng 2008; 100:707–20. doi: 10.1002/bit.21907
64. Kiesewetter A, Menstell P, Peeck LH, Stein A. Development of pseudo-
linear gradient elution for high-throughput resin selectivity screening in
RoboColumn® Format. Biotechnol Prog 2016; 32:1503–19. doi:
10.1002/btpr.2363
65. Brenac Brochier V, Ravault V. High throughput development of a non
protein A monoclonal antibody purification process using mini-columns
and bio-layer interferometry. Eng Life Sci 2016; 16:152–9. doi:
10.1002/elsc.201400244
66. Baumann P, Hahn T, Hubbuch J. High-throughput micro-scale
cultivations and chromatography modeling: Powerful tools for integrated
process development. Biotechnol Bioeng 2015; 112:2123–33. doi:
10.1002/bit.25630
67. Baumgartner K, Galm L, Nötzold J, Sigloch H, Morgenstern J, Schleining
K, Suhm S, Oelmeier SA, Hubbuch J. Determination of protein phase
diagrams by microbatch experiments: Exploring the influence of
precipitants and pH. Int J Pharm 2015; 479:28–40. doi:
10.1016/j.ijpharm.2014.12.027
68. Chai Q, Shih J, Weldon C, Phan S, Jones BE. Development of a high-
throughput solubility screening assay for use in antibody discovery.
MAbs 2019; 11:747–56. doi: 10.1080/19420862.2019.1589851
69. Catcott KC, McShea MA, Bialucha CU, Miller KL, Hicks SW, Saxena P,
Gesner TG, Woldegiorgis M, Lewis ME, Bai C, et al. Microscale screening
of antibody libraries as maytansinoid antibody-drug conjugates. MAbs
2016; 8:513–23. doi: 10.1080/19420862.2015.1134408

Bibliography
117
70. Puthenveetil S, Musto S, Loganzo F, Tumey LN, O’Donnell CJ, Graziani
E. Development of Solid-Phase Site-Specific Conjugation and Its
Application toward Generation of Dual Labeled Antibody and Fab Drug
Conjugates. Bioconjug Chem 2016; 27:1030–9. doi:
10.1021/acs.bioconjchem.6b00054
71. Antony J. Fundamentals of Design of Experiments. In: Design of
experiments for engineers and scientists. Elsevier Ltd.; 2014. page 7–18.
72. Yang T, Sundling MC, Freed AS, Breneman CM, Cramer SM. Prediction
of pH-dependent chromatographic behavior in ion-exchange systems.
Anal Chem 2007; 79:8927–39. doi: 10.1021/ac071101j
73. Hämmerling F, Ladd Effio C, Andris S, Kittelmann J, Hubbuch J.
Investigation and prediction of protein precipitation by polyethylene
glycol using quantitative structure-activity relationship models. J
Biotechnol 2017; 241:87–97. doi: 10.1016/j.jbiotec.2016.11.014
74. Rüdt M, Brestrich N, Rolinger L, Hubbuch J. Real-time monitoring and
control of the load phase of a protein A capture step. Biotechnol Bioeng
2017; 114:368–73. doi: 10.1002/bit.26078
75. Mollerup JM, Hansen TB, Kidal S, Staby A. Quality by design-
Thermodynamic modelling of chromatographic separation of proteins. J
Chromatogr A 2008; 1177:200–6. doi: 10.1016/j.chroma.2007.08.059
76. Hu X, Bortell E, Kotch FW, Xu A, Arve B, Freese S. Development of
Commercial-Ready Processes for Antibody Drug Conjugates. Org Process
Res Dev 2017; 21:601–10. doi: 10.1021/acs.oprd.7b00023
77. FDA. Guidance for Industry - PAT - A Framework for Innovative
Pharmaceutical Development, Manufacturing and Quality Assurance.
2004;
78. Kessler W. Multivariate Datenanalyse. Wiley-VCH Verlag GmbH & Co.
KGaA; 2007.
79. Wold S, Esbensen K, Geladi P. Principal component analysis. Chemom
Intell Lab Syst 1987; 2:37–52. doi: 10.1016/0169-7439(87)80084-9
80. Wold S, Sjöström M, Eriksson L. PLS-regression: A basic tool of
chemometrics. Chemom Intell Lab Syst 2001; 58:109–30. doi:
10.1016/S0169-7439(01)00155-1
81. Brestrich N, Briskot T, Osberghaus A, Hubbuch J. A tool for selective
inline quantification of co-eluting proteins in chromatography using
spectral analysis and partial least squares regression. Biotechnol Bioeng
2014; 111:1365–73. doi: 10.1002/bit.25194
82. Schmidt-Traub H, Schulte M, Seidel-Morgenstern A. Preparative
Chromatography. Wiley-VCH Verlag GmbH & Co. KGaA; 2012.
Bibliography
118
83. Unger KK, Ditz R, Machtejevas E, Skudas R. Liquid chromatography-its
development and key role in life science applications. Angew Chemie -
Int Ed 2010; 49:2300–12. doi: 10.1002/anie.200906976
84. Marcus Y. Effect of ions on the structure of water. Pure Appl Chem 2009;
109:1346–70. doi: 10.1351/PAC-CON-09-07-02
85. Mollerup JM. Applied thermodynamics: A new frontier for biotechnology.
Fluid Phase Equilib 2006; 241:205–15. doi: 10.1016/j.fluid.2005.12.037
86. Godwin A, Bryant P, Pabst M, Badescu G, Bird M, McDowell W,
Jamieson E, Swierkosz J, Jurlewicz K, Tommasi R, et al. In vitro and in
vivo evaluation of cysteine rebridged trastuzumab-MMAE antibody drug
conjugates with defined drug-to-antibody ratios. Mol Pharm 2015;
12:1872–9. doi: 10.1021/acs.molpharmaceut.5b00116
87. Kudirka R, Barfield RM, McFarland J, Albers AE, De Hart GW, Drake
PM, Holder PG, Banas S, Jones LC, Garofalo AW, et al. Generating site-
specifically modified proteins via a versatile and stable nucleophilic
carbon ligation. Chem Biol 2015; 22:293–8. doi:
10.1016/j.chembiol.2014.11.019
88. Drake PM, Albers AE, Baker J, Banas S, Barfield RM, Bhat AS, De Hart
GW, Garofalo AW, Holder P, Jones LC, et al. Aldehyde tag coupled with
HIPS chemistry enables the production of ADCs conjugated site-
specifically to different antibody regions with distinct in vivo efficacy and
PK outcomes. Bioconjug Chem 2014; 25:1331–41. doi: 10.1021/bc500189z
89. Pirrung SM, van der Wielen LAM, van Beckhoven RFWC, van de Sandt
EJAX, Eppink MHM, Ottens M. Optimization of biopharmaceutical
downstream processes supported by mechanistic models and artificial
neural networks. Biotechnol Prog 2017; 33:696–707. doi:
10.1002/btpr.2435
90. Wang G, Briskot T, Hahn T, Baumann P, Hubbuch J. Root cause
investigation of deviations in protein chromatography based on
mechanistic models and artificial neural networks. J Chromatogr A 2017;
1515:146–53. doi: 10.1016/j.chroma.2017.07.089
91. Close EJ, Salm JR, Bracewell DG, Sorensen E. Modelling of industrial
biopharmaceutical multicomponent chromatography. Chem Eng Res Des
2014; 92:1304–14. doi: 10.1016/j.cherd.2013.10.022
92. Huuk TC, Hahn T, Doninger K, Griesbach J, Hepbildikler S, Hubbuch J.
Modeling of complex antibody elution behavior under high protein load
densities in ion exchange chromatography using an asymmetric activity
coefficient. Biotechnol J 2017; 12. doi: 10.1002/biot.201600336
93. Shekhawat LK, Chandak M, Rathore AS. Mechanistic modeling of
hydrophobic interaction chromatography for monoclonal antibody
purification: process optimization in the quality by design paradigm. J

Bibliography
119
Chem Technol Biotechnol 2018; 93:2784. doi: 10.1002/jctb.5742
94. Seidel-Morgenstern A, Schmidt-Traub H, Michel M, Epping A, Jupke A.
Modeling and model parameters. In: Preparative Chromatography.
Wiley-VCH Verlag GmbH & Co. KGaA; 2012. page 312–418.
95. Mollerup JM. A review of the thermodynamics of protein association to
ligands, protein adsorption, and adsorption isotherms. Chem Eng
Technol 2008; 31:864–74. doi: 10.1002/ceat.200800082
96. Wang G, Hahn T, Hubbuch J. Water on Hydrophobic Surfaces:
Mechanistic Modeling of Hydrophobic Interaction Chromatography. J
Chromatogr A 2016; 1465:71–8. doi: 10.1016/j.chroma.2016.07.085
97. Brooks CA, Cramer SM. Steric mass‐action ion exchange: Displacement
profiles and induced salt gradients. AIChE J 1992; 38:1969–78. doi:
10.1002/aic.690381212
98. Beck A, Goetsch L, Dumontet C, Corvaia N. Strategies and challenges for
the next generation of therapeutic antibodies. Nat Rev Drug Discov 2017;
16:315–37. doi: 10.1038/nrd.2016.268
99. Lhospice F, Brégeon D, Belmant C, Dennler P, Chiotellis A, Fischer E,
Gauthier L, Boedec A, Rispaud H, Savard-Chambard S, et al. Site-
Specific Conjugation of Monomethyl Auristatin E to Anti-CD30
Antibodies Improves Their Pharmacokinetics and Therapeutic Index in
Rodent Models. Mol Pharm 2015; 12:1863–71. doi: 10.1021/mp500666j
100. Pillow TH, Tien J, Parsons-reponte KL, Bhakta S, Li H, Staben LR, Li G,
Chuh J, Donohue AF, Darwish M, et al. Site-Specific Trastuzumab
Maytansinoid Antibody − Drug Conjugates with Improved Therapeutic
Activity through Linker and Antibody Engineering. J Med Chem 2014;
57:7890–9. doi: 10.1021/jm500552c
101. Treier K, Hansen S, Richter C, Diederich P, Hubbuch J, Lester P. High-
throughput methods for miniaturization and automation of monoclonal
antibody purification processes. Biotechnol Prog 2012; 28:723–32. doi:
10.1002/btpr.1533
102. Maiser B, Dismer F, Hubbuch J. Optimization of random PEGylation
reactions by means of high throughput screening. Biotechnol Bioeng
2014; 111:104–14. doi: 10.1002/bit.25000
103. Oelmeier S, Ladd Effio C, Hubbuch J. High throughput screening based
selection of phases for aqueous two-phase system-centrifugal
partitioning chromatography of monoclonal antibodies. J Chromatogr A
2012; 1252:104–14. doi: 10.1016/j.chroma.2012.06.075
104. Wendeler M, Grinberg L, Wang X, Dawson PE, Baca M. Enhanced
catalysis of oxime-based bioconjugations by substituted anilines.
Bioconjug Chem 2014; 25:93–101. doi: 10.1021/bc400380f

Bibliography
120
105. Burke PJ, Hamilton JZ, Pires TA, Setter JR, Hunter JH, Cochran JH,
Waight AB, Gordon KA, Toki BE, Emmerton KK, et al. Development of
Novel Quaternary Ammonium Linkers for Antibody–Drug Conjugates.
Mol Cancer Ther 2016; 15:938–45. doi: 10.1158/1535-7163.MCT-16-0038
106. Vink M, Derr K, Love J, Stokes DL, Ubarretxena-Belandia I. A high-
throughput strategy to screen 2D crystallization trials of membrane
proteins. J Struct Biol 2007; 160:295–304. doi: 10.1016/j.jsb.2007.09.003
107. Bailey MJ, Hooker AD, Adams CS, Zhang S, James DC. A platform for
high-throughput molecular characterization of recombinant monoclonal
antibodies. J Chromatogr B 2005; 826:177–87. doi:
10.1016/j.jchromb.2005.08.021
108. Zimmerman ES, Heibeck TH, Gill A, Li X, Murray CJ, Madlansacay MR,
Tran C, Uter NT, Yin G, Rivers PJ, et al. Production of Site-Specific
Antibody−Drug Conjugates Using Optimized Non-Natural Amino Acids
in a Cell-Free Expression System. Bioconjug Chem 2014; 25:351–61. doi:
10.1021/bc400490z
109. Staben LR, Koenig SG, Lehar SM, Vandlen R, Zhang D, Chuh J, Yu S-F,
Ng C, Guo J, Liu Y, et al. Targeted drug delivery through the traceless
release of tertiary and heteroaryl amines from antibody–drug conjugates.
Nat Chem 2016; 8:1112–9. doi: 10.1038/nchem.2635
110. Christie RJ, Fleming R, Bezabeh B, Woods R, Mao S, Harper J, Joseph
A, Wang Q, Xu ZQ, Wu H, et al. Stabilization of cysteine-linked antibody
drug conjugates with N-aryl maleimides. J Control Release 2015;
220:660–70. doi: 10.1016/j.jconrel.2015.09.032
111. Hamblett KJ, Senter PD, Chace DF, Sun MMC, Lenox J, Cerveny CG,
Kissler KM, Bernhardt SX, Kopcha AK, Zabinski RF, et al. Effects of
Drug Loading on the Antitumor Activity of a Monoclonal Antibody Drug
Conjugate. Clin cancer Res 2004; 10:7063–70. doi: 10.1158/1078-
0432.CCR-04-0789
112. Sun MMC, Beam KS, Cerveny CG, Hamblett KJ, Blackmore RS, Torgov
MY, Handley FGM, Ihle NC, Senter PD, Alley SC. Reduction-Alkylation
Strategies for the Modification of Specific Monoclonal Antibody
Disulfides. Bioconjug Chem 2005; 16:1282–90. doi: 10.1021/bc050201y
113. Xu Y, Jiang G, Tran C, Li X, Heibeck TH, Masikat MR, Cai Q, Steiner
AR, Sato AK, Hallam TJ, et al. RP-HPLC DAR Characterization of Site-
Specific Antibody Drug Conjugates Produced in a Cell Free Expression
System. Org Process Res Dev 2016; 20:1034–43. doi:
10.1021/acs.oprd.6b00072
114. Lyon RP, Bovee TD, Doronina SO, Burke PJ, Hunter JH, Neff-LaFord
HD, Jonas M, Anderson ME, Setter JR, Senter PD. Reducing
hydrophobicity of homogeneous antibody-drug conjugates improves
pharmacokinetics and therapeutic index. Nat Biotechnol 2015; 33:733–6.
Bibliography
121
doi: 10.1038/nbt.3212
115. Jain N, Smith SW, Ghone S, Tomczuk B. Current ADC Linker
Chemistry. Pharm Res 2015; 32:3526–40. doi: 10.1007/s11095-015-1657-
7
116. Junutula JR, Gerber H-P. Next-Generation Antibody-Drug Conjugates
(ADCs) for Cancer Therapy. ACS Med Chem Lett 2016; 7:972–3. doi:
10.1021/acsmedchemlett.6b00421
117. Schumacher D, Hackenberger CPR, Leonhardt H, Helma J. Current
Status: Site-Specific Antibody Drug Conjugates. J Clin Immunol 2016;
36:100–7. doi: 10.1007/s10875-016-0265-6
118. Wakankar A, Chen Y, Gokarn Y, Jacobson FS. Analytical methods for
physicochemical characterization of antibody drug conjugates. MAbs
2011; 3:161–72. doi: 10.4161/mabs.3.2.14960
119. Chari RVJ, Martell BA, Gross JL, Cook SB, Shah SA, Blättler WA,
McKenzie SJ, Goldmacher VS. Immunoconjugates Containing Novel
Maytansinoids: Promising Anticancer Drugs. Cancer Res 1992; 52:127–
31.
120. Tang Y, Tang F, Yang Y, Zhao L, Zhou H, Dong J, Huang W. Real-Time
Analysis on Drug-Antibody Ratio of Antibody-Drug Conjugates for
Synthesis, Process Optimization, and Quality Control. Sci Rep 2017;
7:7763–73. doi: 10.1038/s41598-017-08151-2
121. Bakeev KA. Process Analytical Technology: Spectroscopic Tools and
Implementation Strategies for the Chemical and Pharmaceutical
Industries. 2nd ed. John Wiley & Sons; 2010.
122. Bakeev KA. Process Analytical Technology. Blackwell Publishing Ltd;
2005.
123. Simon LL, Pataki H, Marosi G, Meemken F, Hungerbühler K, Baiker A,
Tummala S, Glennon B, Kuentz M, Steele G, et al. Assessment of recent
process analytical technology (PAT) trends: A multiauthor review. Org
Process Res Dev 2015; 19:3–62. doi: 10.1021/op500261y
124. Hansen SK, Jamali B, Hubbuch J. Selective high throughput protein
quantification based on UV absorption spectra. Biotechnol Bioeng 2013;
110:448–60. doi: 10.1002/bit.24712
125. Quinn AC, Gemperline PJ, Baker B, Zhu M, Walker DS. Fiber-optic
UV/visible composition monitoring for process control of batch reactions.
Chemom Intell Lab Syst 1999; 45:199–214. doi: 10.1016/S0169-
7439(98)00105-1
126. Gurden SP, Westerhuis JA, Smilde AK. Monitoring of batch processes
using spectroscopy. AIChE J 2002; 48:2283–97. doi:
10.1002/aic.690481018

Bibliography
122
127. Suppan P. Invited review solvatochromic shifts: The influence of the
medium on the energy of electronic states. J Photochem Photobiol A
Chem 1990; 50:293–330. doi: 10.1016/1010-6030(90)87021-3
128. Reichardt C, Welton T. Solvents and solvent effects in organic chemistry.
John Wiley & Sons; 2011.
129. Jiskoot W, Crommelin D, editors. Methods for structural analysis of
protein pharmaceuticals. American Association of Pharmaceutical
Scientists; 2005.
130. de Jong S. SIMPLS: An alternative approach to partial least squares
regression. Chemom Intell Lab Syst 1993; 18:251–63. doi: 10.1016/0169-
7439(93)85002-X
131. Savitzky A, Golay MJE. Smoothing and differentiation of data by
simplified least squares procedures. Anal Chem 1964; 36:1627–39.
132. Deep K, Singh KP, Kansal ML, Mohan C. A real coded genetic algorithm
for solving integer and mixed integer optimization problems. Appl Math
Comput 2009; 212:505–18. doi: 10.1016/j.amc.2009.02.044
133. Ragone R, Colonna G, Balestrieri C, Servillo L, Irace G. Determination
of tyrosine exposure in proteins by second-derivative spectroscopy.
Biochem 1984; 23:1871–5.
134. Mach H, Middaugh CR. Simultaneous monitoring of the environment of
tryptophan, tyrosine, and phenylalanine residues in proteins by near-
ultraviolet second-derivative spectroscopy. Anal Biochem 1994; 222:323–
31. doi: 10.1006/abio.1994.1499
135. Tedaldi LM, Aliev AE, Baker JR. [2 + 2] Photocycloadditions of
thiomaleimides. Chem Commun 2012; 48:4725–7. doi:
10.1039/C2CC31673K
136. Lambert JM, Berkenblit A. Antibody-Drug Conjugates for Cancer
Treatment. Annu Rev Med 2018; 69:191–207. doi: 10.1146/annurev-med-
061516-121357
137. Lu J, Jiang F, Lu A, Zhang G. Linkers Having a Crucial Role in
Antibody–Drug Conjugates. Int J Mol Sci 2016; 17:561. doi:
10.3390/ijms17040561
138. Akkapeddi P, Azizi S-A, Freedy A, Cal PMSD, Gois PMP, Bernardes GJL.
Construction of Homogeneous Antibody-drug Conjugates using Site-
selective Protein Chemistry. Chem Sci 2016; doi: 10.1039/C6SC00170J
139. Tumey LN, Li F, Rago B, Han X, Loganzo F, Musto S, Graziani EI,
Puthenveetil S, Casavant J, Marquette K, et al. Site Selection: a Case
Study in the Identification of Optimal Cysteine Engineered Antibody
Drug Conjugates. AAPS J 2017; doi: 10.1208/s12248-017-0083-7

Bibliography
123
140. Tolcher AW. Antibody drug conjugates: lessons from 20 years of clinical
experience. Ann Oncol 2016; :1–5. doi: 10.1093/annonc/mdw424
141. Gikanga B, Adeniji NS, Patapoff TW, Chih HW, Yi L. Cathepsin B
Cleavage of vcMMAE-Based Antibody-Drug Conjugate Is Not Drug
Location or Monoclonal Antibody Carrier Specific. Bioconjug Chem 2016;
27:1040–9. doi: 10.1021/acs.bioconjchem.6b00055
142. Westerberg K, Broberg Hansen E, Degerman M, Budde Hansen T,
Nilsson B. Model-based process challenge of an industrial ion-exchange
chromatography step. Chem Eng Technol 2012; 35:183–90. doi:
10.1002/ceat.201000560
143. Moosmann A, Blath J, Lindner R, Müller E, Böttinger H. Aldehyde
PEGylation kinetics: A standard protein versus a pharmaceutically
relevant single chain variable fragment. Bioconjug Chem 2011; 22:1545–
58. doi: 10.1021/bc200090x
144. Dai P, Zhang C, Welborn M, Shepherd JJ, Zhu T, Van Voorhis T,
Pentelute BL. Salt effect accelerates site-selective cysteine
bioconjugation. ACS Cent Sci 2016; 2:637–46. doi:
10.1021/acscentsci.6b00180
145. Lé-Quóc K, Le-Quóc D, Gaudemer Y. Evidence for the Existence of Two
Classes of Sulfhydryl Groups Essential for Membrane-Bound Succinate
Dehydrogenase Activity. Biochemistry 1981; 20:1705–10. doi:
10.1021/bi00510a001
146. Ohyashiki T, Taka M, Mohri T. The Effects of Ionic Strength on the
Protein Conformation and the Fluidity of Porcine Intestinal Brush
Border Membranes. J Biol Chem 1985; 260:6857–61.
147. Kukura JL, Thien MP. Current Challenges and Opportunities in the
Pharmaceutical Industry. In: Chemical Engineering in the
Pharmaceutical Industry. 2019. page 19–26.
148. Pfister D, Ulmer N, Klaue A, Ingold O, Morbidelli M. Modeling the
Kinetics of Protein Conjugation Reactions. Chemie-Ingenieur-Technik
2016; 88:1598–608. doi: 10.1002/cite.201600046
149. Tomaz C. Hydrophobic interaction chromatography. In: Liquid
chromatography. Elsevier Inc.; 2017. page 171–90.
150. Melander WR, Corradini D, Horváth C. Salt-mediated retention of
proteins in hydrophobic-interaction chromatography. Application of
solvophobic theory. J Chromatogr A 1984; 317:67–85. doi: 10.1016/S0021-
9673(01)91648-6
151. Geng X, Guo L, Chang J. Study of the retention mechanism of proteins
in hydrophobic interaction chromatography. J Chromatogr A 1990;
507:1–23. doi: 10.1016/S0021-9673(01)84176-5

Bibliography
124
152. Staby A, Mollerup J. Solute retention of lysozyme in hydrophobic
interaction perfusion chromatography. J Chromatogr A 1996; 734:205–
12. doi: 10.1016/0021-9673(95)01161-7
153. Perkins TW, Mak DS, Root TW, Lightfoot EN. Protein retention in
hydrophobic interaction chromatography: Modeling variation with buffer
ionic strength and column hydrophobicity. J Chromatogr A 1997; 766:1–
14. doi: 10.1016/S0021-9673(96)00978-8
154. Jakobsson N, Degerman M, Nilsson B. Optimisation and robustness
analysis of a hydrophobic interaction chromatography step. J
Chromatogr A 2005; 1099:157–66. doi: 10.1016/j.chroma.2005.09.009
155. Nagrath D, Xia F, Cramer SM. Characterization and modeling of
nonlinear hydrophobic interaction chromatographic systems. J
Chromatogr A 2011; 1218:1219–26. doi: 10.1016/j.chroma.2010.12.111
156. Borrmann C, Helling C, Lohrmann M, Sommerfeld S, Strube J.
Phenomena and modeling of hydrophobic interaction chromatography.
Sep Sci Technol 2011; 46:1289–305. doi: 10.1080/01496395.2011.561515
157. Kumar V, Rathore AS. Mechanistic Modeling Based PAT
Implementation for Ion-Exchange Process Chromatography of Charge
Variants of Monoclonal Antibody Products. Biotechnol J 2017; 12:1–9.
doi: 10.1002/biot.201700286
158. Danckwerts P V. Continuous flow systems - Distribution of residence
times. Chem Eng Sci 1953; 2:1–13. doi: 10.1016/0009-2509(96)81810-0
159. To BCS, Lenhoff AM. Hydrophobic interaction chromatography of
proteins. II. Solution thermodynamic properties as a determinant of
retention. J Chromatogr A 2007; 1141:235–43. doi:
10.1016/j.chroma.2006.12.022
160. Ingber L. Adaptive simulated annealing. In: Stochastic Global
Optimization & Its Applications. 2012. page 33–62.
161. Agarwal S, Mierle K. Ceres Solver.
162. Glowinski R. Handbook of numerical analysis. 9th ed. 2003.
163. Jungbauer A, Machold C, Hahn R. Hydrophobic interaction
chromatography of proteins: III. Unfolding of proteins upon adsorption.
J Chromatogr A 2005; 1079:221–8. doi: 10.1016/j.chroma.2005.04.002
164. Jones TT, Fernandez EJ. Hydrophobic interaction chromatography
selectivity changes among three stable proteins: Conformation does not
play a major role. Biotechnol Bioeng 2004; 87:388–99. doi:
10.1002/bit.20123
165. Jones TT, Fernandez EJ. Α-Lactalbumin Tertiary Structure Changes on
Hydrophobic Interaction Chromatography Surfaces. J Colloid Interface
Bibliography
125
Sci 2003; 259:27–35. doi: 10.1016/S0021-9797(02)00180-7
166. Park J-G, Lee S-H, Ryu J-S, Hong Y-K, Kim T-G, Busnaina AA.
Interfacial and Electrokinetic Characterization of IPA Solutions Related
to Semiconductor Wafer Drying and Cleaning. J Electrochem Soc 2006;
153:G811. doi: 10.1149/1.2214532
167. Briskot T, Stückler F, Wittkopp F, Williams C, Yang J, Konrad S,
Doninger K, Griesbach J, Bennecke M, Hepbildikler S, et al. Prediction
uncertainty assessment of chromatography models using Bayesian
inference. J Chromatogr A 2019; 1587:101–10. doi:
10.1016/j.chroma.2018.11.076
168. Guiochon G, Felinger A, Shirazi DG, Katti AM. Fundamentals of
preparative and nonlinear chromatography. 2nd ed. Elsevier Inc.; 2006.

126
Abbreviations
AC Affinity chromatography
ADC Antibody-drug conjugates
ADCC Antibody-dependent cellular cytotoxicity
API Active pharmaceutical ingredient
ASA Adaptive simulated annealing
CDC Complement-dependent cytotoxicity
CDR Complementarity-determining regions
CEX Cation exchange
CFD Computational fluid dynamics
CPM 7-Diethylamino-3-(4'-maleimidylphenyl)-4-methylcoumarin
CPP Critical process parameter
CQA Critical quality attribute
CV Cross-validation
DAD Diode array detector
DAR Drug-to-antibody ratio
DBC Dynamic binding capacity
DHA (L)-Dehydroascorbic acid
DMSO Dimethyl sulfoxide
DoE Design of experiments
EMA European Medicines Agency
FDA Food and Drug Administration (USA)
GuHCl Guanidine hydrochloride
HCCF Harvested cell culture fluid
HIC Hydrophobic interaction chromatography
HTC High-throughput conjugation
HTS High-throughput screening
IC50 Half maximal inhibitory concentration
ICH
International conference on harmonization of technical
requirements for registration of pharmaceuticals for human
use
IEX Ion exchange chromatography
IgG Immunoglobulin G
IPA Isopropanol

Abbreviations
127
IS Ionic strength
LC Liquid chromatography
mAb Monoclonal antibody
MLR Multiple linear regression
MVDA Multivariate data analysis
MWCO Molecular weight cut-off
NAC N-Acetyl-cysteine
NHS N-hydroxysuccinimide
NPM N-(1-Pyrenyl)maleimide
NPM ratio Molar ratio of NPM over mAb at start of reaction
ODE Ordinary differential equation
PAT Process analytical technology
PBS Phosphate-buffered saline
PC Principal component
PCA Principal component analysis
PLS Partial least squares
PP Polypropylene
PRESS Predictive residual sum of squares
QbD Quality by design
QSAR Quantitative structure-activity relationships
QTPP Quality target product profile
RMSECV Root mean square error of cross-validation
RMSEP Root mean square error of prediction
RP-UHPLC Reversed-phase ultra-high performance liquid
chromatography
RPC Reversed-phase chromatography
SEC Size-exclusion chromatography
TCEP Tris(2-carboxyethyl)phosphine hydrochloride
TDM Transport-dispersive model
TFA Trifluoroacetic acid
UHPLC Ultra-high performance liquid chromatography

128
Symbols
a Number of principal components in T
c Chapter 3: Protein concentration
ci Molar concentration of component i in the mobile phase
cin,i Applied inlet concentration
𝐶mAb0c Molar concentration of mAb with zero free thiols
𝐶mAb0cNPM Molar concentration of mAb with zero free thiols and one
NPM attached
𝐶mAb0cNPMa Molar concentration of mAb with zero free thiols and one
NPM attached to binding site a
𝐶mAb0cNPMb Molar concentration of mAb with zero free thiols and one
NPM attached to binding site b
𝐶mAb0c(NPM)ab Molar concentration of mAb with zero free thiols and one
NPM attached to binding site a and b
𝐶mAb0c(NPM)2 Molar oncentration of mAb with zero free thiols and two NPM
attached
𝐶mAb1c Molar concentration of mAb with one free thiol
𝐶mAb1cNPM Molar concentration of mAb with one free thiol and one NPM
attached
𝐶mAb2c Molar concentration of mAb with two free thiols
𝐶mAba Molar concentration of mAb with one free thiol at binding
site a
𝐶mAbab Molar concentration of mAb with one free thiol at binding site
a and one free thiol at binding site b
𝐶mAbaNPMb Molar concentration of mAb with one free thiol at binding
site a and one NPM attached at binding site b
𝐶mAbb Molar concentration of mAb with one free thiol at binding
site b
𝐶mAbbNPMa Molar concentration of mAb with one free thiol at binding
site b and one NPM attached at binding site a
𝐶NPM Molar concentration of NPM
cp,i Molar concentration of component i in the pores
cp,salt Molar salt concentration in the pores
cstep Ionic strength of first step
c(mAb) Molar concentration of mAb
d Inner column diameter

Symbols
129
Dax Axial dispersion coefficient
dc Inner column diameter
E Residual matrix in PCA or PLS
IC50 Half maximal inhibitory concentration
k Rate constant of NPM attachment in model 1 and 4
k1 Rate constant of first NPM attachment in model 2 and 5
k2 Rate constant of second NPM attachment in model 2 and 5
k1’ Rate constant of NPM attachment to first binding site in
model 3 and 6
k2’ Rate constant of NPM attachment to second binding site in
model 3 and 6
k3 Rate constant of NPM depletion in kinetic models
keff,i Effective mass transfer coefficient of component i
keq,i Equilibrium constant in adsorption isotherm
kkin,i Kinetic constant in adsorption isotherm
kp,i Parameter describing the effect of protein concentration on
activity coefficient of component i
ks,i Parameter describing effect of salt concentration on activity
coefficient of component i
L Column length
m Number of variables in X
mAb Unconjugated monoclonal antibody
mAb+0 mAb with zero surrogate drugs attached
mAb+1 mAb with one surrogate drugs attached
mAb+2 mAb with two surrogate drugs attached
mAbNPM1 Monoclonal antibody with one NPM attached
mAbNPM2 Monoclonal antibody with two NPM attached
N Number of components
n Number of observations in X
nj Number of ligands bounds per protein j
NPM N-(1-Pyrenyl)maleimide
P Loadings matrix of X-data in PCA
pi ith vector in P
Q Loadings matrix of Y-data in PLS
Q2 Coefficient of determination of cross-validation
qi Section 1.3: ith vector in Q

Symbols
130
qi Section 1.4 and Chapter 6: Molar protein concentration
adsorbed to solid phase
qmax,j Saturation capacity of adsorber for component j
R² Coefficient of determination
𝑅pred2 R² of prediction
rp Particle / bead radius
RMSECV Root mean square error of cross-validation
RMSEP Root mean square error of prediction
T Scores matrix of X in PCA or PLS
t Time
ti ith vector in T
U Scores matrix of Y in PLS
u Superficial velocity
ui Vector with greatest Euclidean norm out of the columns of Y
uint Interstitial velocity of mobile phase
�̇� Volumetric flow rate
Vads Volume of the stationary phase
Vc Column volume
Vd System dead volume
Vf Fluid volume
Vint Interstitial volume
Vpore Pore volume
VR Retention volume
VRAc Retention volume of acetone
VRDex Retention volume of dextran
Vsol Volume of stationary phase
Vstep Volume of second step (before decrease in IS)
W Weighted loadings matrix in PLS
wi ith vector in W
X Data matrix for PCA or PLS
x Position along the column length
Y Matrix containing target variables in PLS
yi ith vector of Y
εint Interstitial porosity
εp Porosity of the stationary phase

Symbols
131
εtot Total column porosity
𝜆max Wavelength of maximal absorbance
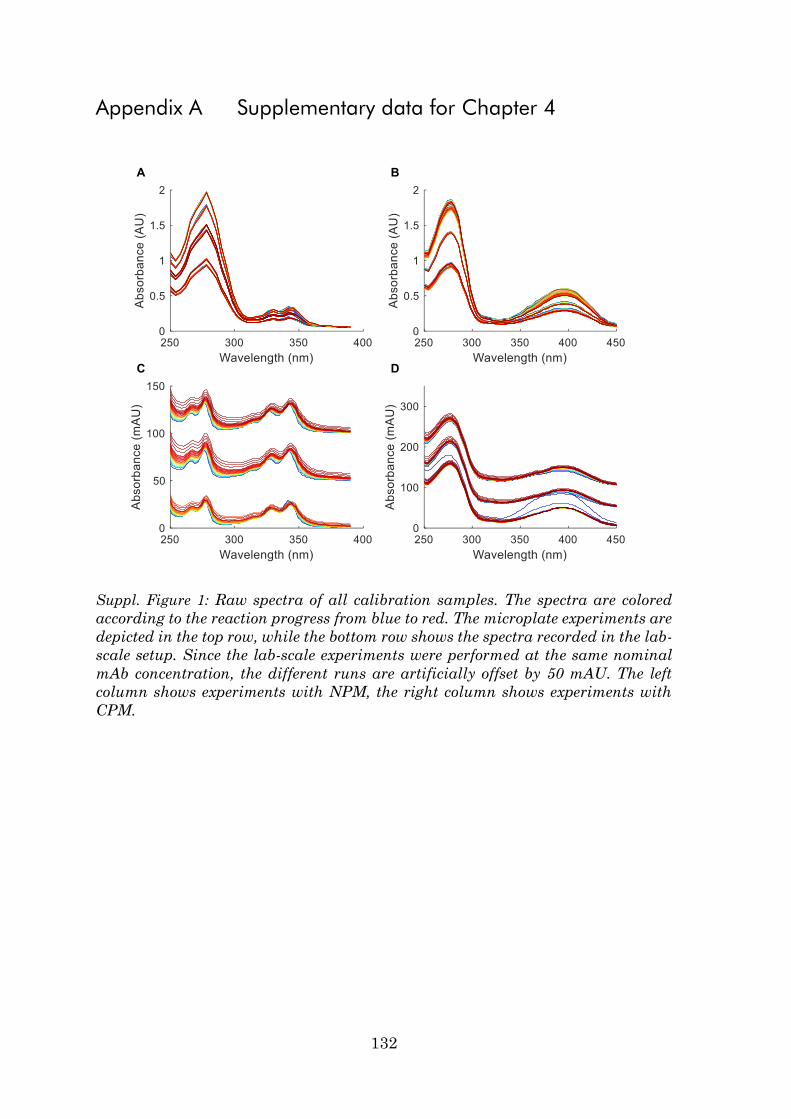
132
Appendix A Supplementary data for Chapter 4
Suppl. Figure 1: Raw spectra of all calibration samples. The spectra are colored
according to the reaction progress from blue to red. The microplate experiments are
depicted in the top row, while the bottom row shows the spectra recorded in the lab-
scale setup. Since the lab-scale experiments were performed at the same nominal
mAb concentration, the different runs are artificially offset by 50 mAU. The left
column shows experiments with NPM, the right column shows experiments with
CPM.

Appendix A Supplementary data for Chapter 4
133
Suppl. Figure 2: Raw spectra of a mixture of 5T4 mAb and quenched drug recorded
over the course of 15 min. The spectra are colored according to reaction time from blue
to red. mAb, drug and NAC concentrations are the same as in the lab-scale experiments.
The surrogate drugs were quenched prior to addition to the mAb solution in order to
prevent the conjugation reaction. DMSO content is 10% as in the other experiments.
The evolution of the band maxima of the drugs over time is shown on the right side. No
shift in band maxima is observed.

Appendix A Supplementary data for Chapter 4
134
Suppl. Figure 3: Pure component UV/Vis absorbance spectrum of 5T4 mAb measured
in Tecan plate reader M200 Pro at a concentration of 2 mg/mL (in 50 mM sodium
phosphate buffer).
Suppl. Figure 4: Pure component UV/Vis absorbance spectrum of NPM in phosphate
buffer containing 10% of DMSO measured in Tecan plate reader M200 Pro.
0
0.2
0.4
0.6
0.8
1
1.2
1.4
1.6
250 270 290 310 330 350 370 390
Ab
so
rba
nc
e (
AU
)
Wavelenght (nm)
0
0.1
0.2
0.3
0.4
0.5
0.6
0.7
0.8
250 270 290 310 330 350 370 390
Ab
so
rban
ce (
AU
)
Wavelength (AU)

Appendix A Supplementary data for Chapter 4
135
Suppl. Figure 5: Pure component UV/Vis absorbance spectrum of CPM in phosphate
buffer containing 10% of DMSO measured in Tecan plate reader M200 Pro.
0
0.1
0.2
0.3
0.4
0.5
0.6
0.7
0.8
250 270 290 310 330 350 370 390 410 430 450
Ab
so
rba
nc
e (
AU
)
Wavelength (nm)

136
Appendix B Supplementary data for Chapter 5
Suppl. Figure 6: Results of model 5 calibration for the 12 calibration experiments.
Markers are experimental data and the respective model predictions are shown by
straight lines. Blue square markers are the un-conjugated mAb, red triangles the mono-
conjugated mAb and yellow diamonds the bi-conjugated mAb. R² was at 0.970.
Co
nce
ntr
atio
n [
mM
]
Reaction time [s]
2x NPM 3x NPM 4x NPM
1.0 g/L
2.0 g/L
1.5 g/L
1.5 g/L

Appendix B Supplementary data for Chapter 5
137
Rate laws for model 4:
𝑑𝐶mAb2c
𝑑𝑡 = −𝑘1 ∙ 𝐶mAb2c ∙ 𝐶NPM
(A1)
𝑑𝐶mAb1c
𝑑𝑡 = −𝑘1 ∙ 𝐶mAb1c ∙ 𝐶NPM
(A2)
𝑑𝐶mAb0c
𝑑𝑡 = 0
(A3)
𝑑𝐶mAb1cNPM
𝑑𝑡 = 𝑘1 ∙ 𝐶mAb2c ∙ 𝐶NPM − 𝑘1 ∙ 𝐶mAb1cNPM ∙ 𝐶NPM
(A4)
𝑑𝐶mAb0cNPM
𝑑𝑡= 𝑘1 ∙ 𝐶mAb1c ∙ 𝐶NPM
(A5)
𝑑𝐶mAb0c(NPM)2
𝑑𝑡= 𝑘1 ∙ 𝐶mAb1cNPM ∙ 𝐶NPM
(A6)
𝑑𝐶NPM𝑑𝑡
= −𝑘1 ∙ 𝐶mAb2c ∙ 𝐶NPM−𝑘1 ∙ 𝐶mAb1c ∙ 𝐶NPM − 𝑘1 ∙ 𝐶mAb1cNPM ∙ 𝐶NPM
− 𝑘 ∙ 𝐶NPM
(A7)
The rate laws for model 1 are the same without the NPM sink term in equation
A7 (−𝑘 ∙ 𝐶NPM).
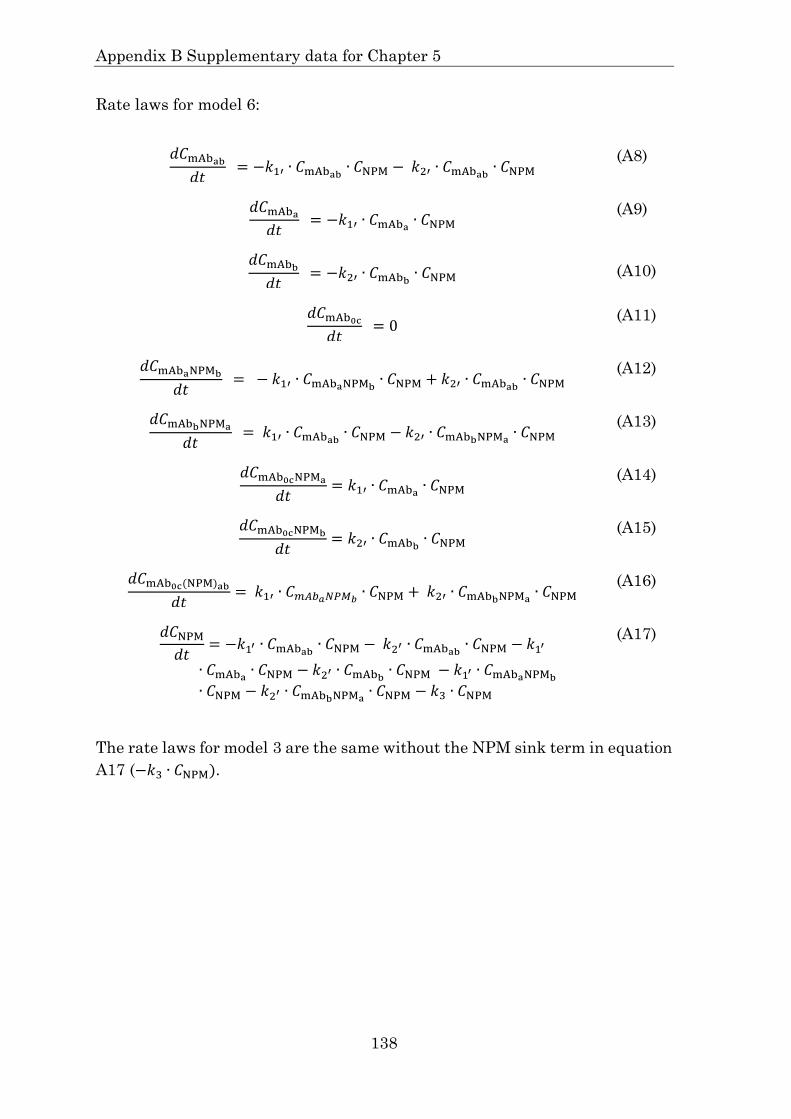
Appendix B Supplementary data for Chapter 5
138
Rate laws for model 6:
𝑑𝐶mAbab
𝑑𝑡 = −𝑘1′ ∙ 𝐶mAbab
∙ 𝐶NPM − 𝑘2′ ∙ 𝐶mAbab∙ 𝐶NPM
(A8)
𝑑𝐶mAba
𝑑𝑡 = −𝑘1′ ∙ 𝐶mAba ∙ 𝐶NPM
(A9)
𝑑𝐶mAbb
𝑑𝑡 = −𝑘2′ ∙ 𝐶mAbb
∙ 𝐶NPM (A10)
𝑑𝐶mAb0c
𝑑𝑡 = 0
(A11)
𝑑𝐶mAbaNPMb
𝑑𝑡 = − 𝑘1′ ∙ 𝐶mAbaNPMb
∙ 𝐶NPM + 𝑘2′ ∙ 𝐶mAbab∙ 𝐶NPM
(A12)
𝑑𝐶mAbbNPMa
𝑑𝑡 = 𝑘1′ ∙ 𝐶mAbab
∙ 𝐶NPM − 𝑘2′ ∙ 𝐶mAbbNPMa∙ 𝐶NPM
(A13)
𝑑𝐶mAb0cNPMa
𝑑𝑡= 𝑘1′ ∙ 𝐶mAba ∙ 𝐶NPM
(A14)
𝑑𝐶mAb0cNPMb
𝑑𝑡= 𝑘2′ ∙ 𝐶mAbb
∙ 𝐶NPM (A15)
𝑑𝐶mAb0c(NPM)ab
𝑑𝑡= 𝑘1′ ∙ 𝐶𝑚𝐴𝑏𝑎𝑁𝑃𝑀𝑏
∙ 𝐶NPM + 𝑘2′ ∙ 𝐶mAbbNPMa∙ 𝐶NPM
(A16)
𝑑𝐶NPM𝑑𝑡
= −𝑘1′ ∙ 𝐶mAbab∙ 𝐶NPM − 𝑘2′ ∙ 𝐶mAbab
∙ 𝐶NPM − 𝑘1′
∙ 𝐶mAba ∙ 𝐶NPM − 𝑘2′ ∙ 𝐶mAbb∙ 𝐶NPM − 𝑘1′ ∙ 𝐶mAbaNPMb
∙ 𝐶NPM − 𝑘2′ ∙ 𝐶mAbbNPMa∙ 𝐶NPM − 𝑘 ∙ 𝐶NPM
(A17)
The rate laws for model 3 are the same without the NPM sink term in equation
A17 (−𝑘 ∙ 𝐶NPM).

Appendix B Supplementary data for Chapter 5
139
Rate laws for model 2:
𝑑𝐶mAb2c
𝑑𝑡 = −𝑘1 ∙ 𝐶mAb2c ∙ 𝐶NPM (A18)
𝑑𝐶mAb1c
𝑑𝑡 = −𝑘1 ∙ 𝐶mAb1c ∙ 𝐶NPM (A19)
𝑑𝐶mAb0c
𝑑𝑡 = 0 (A20)
𝑑𝐶mAb1cNPM
𝑑𝑡 = 𝑘1 ∙ 𝐶mAb2c ∙ 𝐶NPM − 𝑘2 ∙ 𝐶mAb1cNPM ∙ 𝐶NPM (A21)
𝑑𝐶mAb0cNPM
𝑑𝑡= 𝑘1 ∙ 𝐶mAb1c ∙ 𝐶NPM (A22)
𝑑𝐶mAb0c(NPM)2
𝑑𝑡= 𝑘2 ∙ 𝐶mAb1cNPM ∙ 𝐶NPM (A23)
𝑑𝐶NPM𝑑𝑡
= −𝑘1 ∙ 𝐶mAb2c ∙ 𝐶NPM−𝑘1 ∙ 𝐶mAb1c ∙ 𝐶NPM − 𝑘2 ∙ 𝐶mAb1cNPM ∙ 𝐶NPM (A24)
Suppl. Figure 7: Absorption at 280 nm over time measured in Tecan plate reader for a
0.04 mM NPM solution in 50 mM sodium phosphate buffer containing 10% DMSO.
The solution was held in a shaken 2 mL Eppendorf Safelock Tube and 200 µL samples
were taken every 5 min and measured in a Greiner UV-star microplate.
0
0.05
0.1
0.15
0.2
0.25
0.3
0.35
0 5 10 15 20 25 30 35
A2
80
[A
U]
Time [min]

Appendix B Supplementary data for Chapter 5
140
𝑅2 = 1 − ∑ (𝑦𝑖 − �̂�𝑖)²𝑛𝑖
∑ (𝑦𝑖 − �̅�𝑖)²𝑛𝑖
(A25)
𝑆𝑆𝐸 = ∑(𝑦𝑖 − �̂�𝑖)²
𝑛
𝑖
(A26)
𝑅𝑀𝑆𝐸𝑃 = √𝑆𝑆𝐸
𝑛 (A27)
𝑆𝑆𝐸tot = ∑𝑆𝑆𝐸𝑗
𝑛
𝑗
(A28)
𝑅𝑀𝑆𝐸𝐶𝑉 = √𝑆𝑆𝐸tot𝑛
(A29)
𝑄² = 1 − 𝑆𝑆𝐸tot
∑ (𝑦𝑖 − �̅�𝑖)²𝑛𝑖
(A30)
