advances in time-of-flight secondary ion mass spectrometry for the
TRANSCRIPT
Advances in
Time-of-Flight Secondary Ion Mass
Spectrometry
for the Analysis of Single Cells on
Sub-Cellular Scale
A thesis submitted to The University of Manchester for the degree of
Doctor of Philosophy in the Faculty of Engineering and Physical
Sciences
2010
Sadia Rabbani
School of Chemical Engineering and Analytical Science

2
Contents
Abstract 5
Declaration 6
Copyright Statement 6
List of Abbreviations 7
Acknowledgements 9
Chapter 1: Overview of Secondary Ion Mass Spectrometry
1.1 Introduction 10
1.2 Fundamental Principles of SIMS 15
1.2.1 Secondary Ion formation 16
1.2.1.1 Sputtering 16
1.2.1.2 Ionisation 17
1.2.2 The Basic Equation 18
1.3 History of SIMS 19
1.4 Dynamic SIMS/Depth Profiling 21
1.5 Static SIMS 22
1.6 Imaging SIMS 23
1.7 Development of new sources 24
1.7.1 Development of cluster sources 26
1.7.2 Development of polyatomic sources 28
1.7.3 Damage cross-section and secondary ion formation efficiency 31
1.8 Simulation studies 36
1.9 AIMS 40
References 42

3
Chapter 2: Development and Properties of the
J105 3D Chemical Imager
2.1 Limitations of conventional ToF-SIMS instruments 52
2.1.1 Sensitivity 52
2.1.2 Duty Cycle 60
2.1.3 Mass Resolution 61
2.2 Concept and features of the J105 3D Chemical Imager 63
References 81
Chapter 3: Characterisation of the J105 3D Chemical Imager
3.1 Introduction 85
3.2 Comparison between the J105 and the BioToF 86
3.2.1 Experimental 86
3.2.2 Results and Discussion 87
3.2.3 Conclusion 98
3.3 Tandem MS 99
3.3.1 Experimental 103
3.3.2 Results and Discussion 104
3.3.3 Conclusion 115
3.4 Limit of detection 116
3.5 Summary 120
References 121
Chapter 4: Molecular depth profiling using ToF-SIMS
4.1 Introduction 124
4.2 Dept profile of Polycaprolactone 133
4.2.1 Experimental 136
4.2.2 Results and Discussion 136
4.2.3 Conclusion 141

4
4.3 Depth Profile of standard samples using dc 142
C60+ primary ion on the J105 3D Chemical Imager
4.3.1 Experimental 143
4.3.2 Results and Discussion 144
4.3.3 Conclusion 146
4.4 Summary 147
References 148
Chapter 5: Sub-cellular imaging of cells using ToF-SIMS
5.1 Introduction 152
5.2 Imaging of single cell using SIMS 158
5.2.1 Imaging of cells using Dynamic SIMS 158
5.2.2 Imaging of cells using Static SIMS 164
5.2.3 3D sub-cellular imaging of cells using SIMS 170
5.3 Sample preparation 178
5.4 Analysis of a standard cell line, HeLa using ToF-SIMS 183
5.4.1 Experimental 185
5.4.1.1 Cell Culturing 185
5.4.1.1.1 Thawing the cells 185
5.4.1.1.2 Sub-culturing (passaging) and Freezing the cells 186
5.4.1.2 ToF-SIMS analysis of cells 186
5.4.2 Results and Discussion 190
5.4.2.1 2D analysis 190
5.4.2.2 3 D analysis 198
5.4.3 Data analysis tools 208
5.4.3 Conclusion 212
5.5 Summary 213
References 214
Chapter 6: Overall Conclusions and Future Work 222

5
The University of Manchester
ABSTARCT OF THESIS submitted by Sadia Rabbani
For the degree of Doctor of Philosophy
Titled Advances in Time-of-Flight Secondary Ion Mass Spectrometry for the Analysis
of Single Cells on Sub-Cellular Scale
Date of submission 25/11/2010
Time-of-flight the secondary ion mass spectrometry (ToF-SIMS) is becoming a
promising technique in analysis of a biological system due to its chemical specificity
and the ability to perform high spatial resolution imaging. The combination of novel
cluster and polyatomic beams has allowed generating images to map the distribution of
biological components in tissue sections and cell surfaces. However, under these
conditions the cluster beams have to be operated in the static regime, which limits
sensitivity and confines the molecular imaging to 2 m spatial resolution. The
polyatomic beams offer the benefits of high yields and low sub-surface damage,
allowing the analysis to be performed at high ion fluence and abandoning the static
limit. This presents a new approach to molecular imaging in which „voxels‟ are used
rather than pixels, thus increasing sensitivity. As a result, the current SIMS
instrumentation then becomes a limitation and has to be modified.
A novel SIMS instrument, the J105 3D Chemical Imager has been developed
with Ionoptika, which allows taking full advantage of the polyatomic primary beam,
particularly the C60 by using it in a dc mode with buncher-ToF configuration. The aim
of this project was to prove the concept and the potential of this new instrument.
Initially standard organic samples have been used to show the current
performance of the J105 for the analysis of organic samples with respect to a
conventional ToF-SIMS instrument, the BioToF. The tandem MS capability of the
instrument has been tested and proved using standard samples and a lipid mixture of
brain extract.
HeLa cells, an immortalised cell line were analysed using this instrument in 2D
and 3D imaging mode. The images generated show molecular localisation on a sub-
cellular scale, over a practical timeframe, whilst sustaining high mass resolution at
4000. The cells were imaged using a 40 keV C60+ dc beam and a clear differentiation
between the material within the nuclei and lipid membrane can be made. Investigation
of cell preparation suggested that the frozen-hydrated approach may be beneficial.
The data presented in this thesis validates the new instrument concept offering
the advantages of higher mass detection, increase in sensitivity, and an increase in the
duty cycle while at the same time allowing imaging at sub-cellular scale with higher
mass resolution.

6
Declaration
No portion of the work referred to in the thesis has been submitted in support of an
application for another degree or qualification of this or any other university or other
institute of learning
Copyright Statement
i. The author of this thesis (including any appendices and/or schedules to this thesis)
owns certain copyright or related rights in it (the “Copyright”) and s/he has given The
University of Manchester certain rights to use such Copyright, including for
administrative purposes.
ii. Copies of this thesis, either in full or in extracts and whether in hard or electronic
copy, may be made only in accordance with the Copyright, Designs and Patents Act
1988 (as amended) and regulations issued under it or, where appropriate, in accordance
with licensing agreements which the University has from time to time. This page must
form part of any such copies made.
iii. The ownership of certain Copyright, patents, designs, trade marks and other
intellectual property (the “Intellectual Property”) and any reproductions of copyright
works in the thesis, for example graphs and tables (“Reproductions”), which may be
described in this thesis, may not be owned by the author and may be owned by third
parties. Such Intellectual Property and Reproductions cannot and must not be made
available for use without the prior written permission of the owner(s) of the relevant
Intellectual Property and/or Reproductions.
iv. Further information on the conditions under which disclosure, publication and
commercialisation of this thesis, the Copyright and any Intellectual Property and/or
Reproductions described in it may take place is available from the Head of School of
Chemical Engineering and Analytical Sciences.

7
List of Abbreviation
2,5-DHB 2,5-dihydroxybenzoic acid
BioToF biological time of flight
BNCT boron neutron capture therapy
BPA-F p-boronophenylalanine
BrdU bromodeoxyuridine
BSH sodium borocaptate
CAD collision activated dissociation
CID collision induced dissociation
DAG diacylglyceride
DCP-AES direct current plasma-atomic emission spectroscopy
DHBA dihydroxybenzoic acid
DMEM Dulbecco‟s modified eagle medium
DMSO dimethyl sulfoxide
DNA deoxyribonucleic acid
DPPC dipalmitoylphosphatidylcholine
ESA electrostatic analyser
ESI electrospray ionization
FAB fast atom bombardment
FBS fetal bovine serum
GC gas chromatography
GGYR Glycine-Glycine-Tyrosine-Arginine
HeLa Henrietta Lacks
HEPES 4-(2-hydroxyethyl)-1-piperazineethanesulfonic acid
ICP-AES inductively coupled plasma-atomic emission spectroscopy
LB Langmuir-Blodgett
LC liquid chromatography
LMIS liquid metal ion sources
LN2 liquid nitrogen
LoD limit of detection

8
LSCM confocal laser scanning microscope
MAF maximum autocorrelation factor
MALDI matrix-assisted laser desorption
mc maximum counts per pixel
ME matrix enhanced
MIMS multi-isotope imaging mass spectrometry
MS mass spectrometry
MSI mass spectrometry imaging
NPL National Physical Laboratory
NRK normal rat kidney
PBS phosphate buffer saline
PC phosphotidylcholine/phosphocholine
PCA principal components analysis
PCL polycaprolactone
PDMS polydimethylsiloxane
PE phosphotidylethanolamine
PET polyethylene terephthalate
PI phosphatidylinositol
PMMA poly (methyl methacrylate)
POPC palmitoyl-2-oleoyl-sn-glycero-3-phosphocholine
PS phosphatidylserine
PSD post source decay
RNA ribonucleic acid
SAC surface analysis chamber
SEM secondary electron microscopy
SIMS secondary ion mass spectrometry
SM sphingomyelin
SNMS secondary neutral mass spectrometry
TEM transmission electron microscopy
ToF time-of-flight
TPL total phospholipids

9
Acknowledgement
Firstly, I would like to express my warm and sincere thanks to my supervisors
Dr. Nick Lockyer and Prof John C. Vickerman for giving me the opportunity to
undertake this work as well as providing the training, facilities, input and personal
support. I would also like to acknowledge Dr John Fletcher for the immense guidance,
advice and contribution from the very early stages of this research, which have been
vital to accomplishing this project. I am very grateful to all those who devoted their
time reading this thesis and providing critical comments.
I would also like to thank previous and present SARC members particularly, Dr.
Alex Henderson, Dr. A. Piwowar, Dr. Jeanette Kordys and Hua Tian for extensive
discussion around my work and great friendship. I am also very grateful to my friend,
Misbah Nareen for using her precious time to read this thesis and give good feedback
and valuable advice.
I wish to thank Paul Blenkinsopp and Rowland Hill from Ionoptika Ltd and
Steve Thompson from SAI Ltd for providing an insight into the instrumentation and
stimulating discussion over a drink. I am also grateful to Dr D. Jackson and Prof S.
High for providing the cells and Dr Chi W Tang for training in cell culture.
Last but not least, I would like to thank my family for their great support and
prayers without which I would not have finished this project. I would also like to thank
my husband Mr S. Akram for his help, endless support and love.
This thesis is dedicated to my late granddad Mr G. Rasul and my dad Mr G. Rabbani.

10
1. Overview of Secondary Ion Mass Spectrometry
1.1 Introduction
Complexity associated with chemical and structural properties of biological
samples, particularly tissues and cells have presented many analytical measurement
challenges for a biologist. Microscopy has so far been the most powerful tool in history
in helping to understand the physiological processes taking place within a biological
system. Images of the distribution of biological components have been possible by
using florescent tags in combination with antibodies to the molecules of interest.
However, the limitations associated with microscopy are that it provides no chemical
information and the use of fluorescent tags can alter the chemical and physical
properties of the labelled molecule thereby altering its intercellular distribution.
Furthermore, to make the molecules of interest visible, immunofluorescent imaging
techniques require a use of antibodies that are not always accessible.
More recently in the past few decades mass spectrometry (MS) has evolved as a
promising technique for characterisation of molecules. MS when combined with
imaging can provide molecular information from solid surfaces as well as images of the
distribution of atoms and molecules at different spatial resolution. Localisation of
biologically relevant compounds in cells and tissues at the sub-cellular scale is of prime
importance to understand biological pathways, the mechanisms of disease and the effect
of drug molecules. The MS techniques offer many advantages over microscopy such as
extremely low detection limits, identification of compounds based on their molecular
weight and fragments and, spatial as well as chemical information. In addition to this,

11
no labelling is required thus minimising modifications to the molecules of interest
inside the cell. For these reasons, there is a great interest in developing and expanding
the field of mass spectrometry imaging (MSI). A number of reviews on MSI have been
published which provide a comprehensive overview on the methods available along
with their applications [McDonnell et al., 2007], [Zimmerman et al., 2008] [Chughtai et
al., 2010]. The two most common methods that lie at the heart of MSI are matrix-
assisted laser desorption ionisation (MALDI) and secondary ion mass spectrometry
(SIMS), discussed below.
Figure 1.1 illustrates the MALDI-MSI technique. It was first established by the
work of Caprioli and co-workers in 1997 where they analysed peptides and proteins
from tissue sections using a matrix dihydroxybenzoic acid (DHBA) [Caprioli et al.,
1997]. The technique has rapidly developed into a huge success due to the high
sensitivity and wide range of biomolecules that can be detected particularly proteins,
peptides and drugs within tissues and cells [Chughtai et al., 2010]. The analysis of
tissue sections using MALDI-MSI has allowed the identification of biomarkers for
cancer [Chaurand et al., 2004] [Schwartz et al., 2004] as well as Alzheimer [Stoeckli et
al., 2002], and Parkinson‟s diseases [Pierson et al., 2004]. Within the pharmaceutical
industry, it has been used to identify a range of pharmaceutical compounds [Earnshaw
et al., 2010] as well as their distribution within tissue sections [Reyzer et al., 2003],
[Hsieh et al., 2006]. MALDI-MSI has been particularly successful in classifying and
mapping the lipids within mouse tissue sections, Figure 1.2 [Woods et al., 2006],
[Murphy et al., 2009].

12
Figure 1.1 MALDI mass spectrometric imaging. A laser is scanned over a tissue
sample while acquiring a complete mass spectrum from each position, resulting in
molecular images for multiple analytes. Reproduced from Rohner et al. 2005.
Figure 1.2 MALDI-MSI ion images from a section of mouse kidney. A: m/z 369.3,
[M+H–H2O]+, cholesterol. B: m/z 796.6 [16:0a/18:2-PC+K]
+. C: m/z 862.6 [40:6-
PC+H]+. D: m/z 879.7 [16:0/20:4/18:1-TAG+H]
+. Reproduced from Murphy et al.
2009.

13
A recent success in this field has been the ability of this technique to monitor
and identify the molecular changes occurring in tumour tissues when compared to
healthy biopsies [Oppenheimer, 2010], [Kang et al., 2010]. These studies show that
MALDI-MSI has become a critical tool in the analysis of proteomics, lipidomics and
pharmacokinetics and will continue to be an important analytical tool in life science.
The second method, imaging secondary ion mass spectrometry (SIMS) also
allows mapping the distribution of biological components within biological systems on
surface and sub-surface region at sub-micron resolution. This technique is also being
widely recognised, due to the advances in instrumentation and the understanding of
fundamental principles associated with it. Imaging SIMS offers the advantages of
identifying low molecular weight species at a very high spatial resolution <100 nm
along with high selectivity and sensitivity [Zimmerman et al., 2008], [Chughtai et al.,
2010]. Both of these techniques, MALDI and SIMS are performed in high vacuum
systems and require special sample preparation prior to analysis, which will be
discussed at many points in this thesis.
MALDI and SIMS are complementary techniques but SIMS allows imaging
experiments to be performed at higher spatial resolution (0-5 µm) with minimal sample
preparation requirements. In MALDI, a matrix is required to ionise and desorb the
molecules following an impact with a laser. Hence, selecting and depositing the matrix
can prove to complicate the sample preparation procedure and further limits the spatial
resolution to 30-50 µm. Although this spatial resolution is adequate for providing
spatial distribution of lipids and proteins within a tissue, it is insufficient for analysis of
a single cell, since a diameter of an average animal cell is around 20-30 µm

14
[Hammond., 2010], [Solon et al., 2009], [Luxembourg et al., 2003]. A comparison
between the two techniques, MALDI and SIMS is shown in Table 1.1.
Table 1.1. Comparison of MALDI and ToF-SIMS capabilities. Reproduced from
Hammond, 2010.
Capability MALDI SIMS
Incident probe Focused laser Focused cluster ion gun
Practical mass range (Da) >100,000 <2,000
Spatial resolution, organics (µm) 30–50 0–5
Mass resolution (M / ∆ m) ~10,000 ~15,000
Sampling depth (µm) 1 <1
3-D imaging Yes, multiple sections Yes, C60+ sputtering
Molecular spectral library Extensive Very limited
Usual imaging approach Stage mapping Scanned ion gun and stage
mapping
The aim of this project was to develop the technique, ToF-SIMS for the analysis
of a single cell, hence, only this technique will be explained in the remaining chapters.
The rest of this chapter will concentrate on the fundamental principles of SIMS and how
this technique has developed over the years with reference to some relevant
applications.

15
1.2 Fundamental Principles of SIMS
SIMS is a well established surface analysis technique that provides detailed
chemical information about the uppermost layer of a sample as well as with depth
below the initial surface under certain experimental arrangements [Vickerman et al.,
2001]. The basic process underlying SIMS involves bombarding a solid surface in high
vacuum with a high energy (keV) primary ion beam, which can be of monoatomic,
polyatomic or cluster nature. This causes a series of collisions between the primary ions
and the atoms of the surface resulting in a transfer of kinetic energy to these atoms. As
some of these collisions return back to the surface, the result is an emission of atoms,
molecules or their clusters, some of which are ionised as they leave the surface. The
ionised particles known as the “secondary ions” are analysed and detected by the mass
spectrometry, Figure 1.3. There are two modes of operation, the first is dynamic SIMS,
which uses a high primary ion dose to detect elements and small fragments, and the
second is static SIMS, which allows the identification of molecular information by
using a low primary ion flux.

16
Figure 1.3 A schematic representation of the SIMS process. Adopted and Reproduced
from Vickerman, et al. 2001.
1.2.1 Secondary Ion formation
There are two processes that are used to describe the formation of a secondary
ion following an impact with a primary ion beam. First is the sputtering process in
which atoms and multi-atomic clusters are desorbed from the surface; and the second
involves ionisation of the sputtered material that becomes charged by gaining or losing
electrons.
1.2.1.1 Sputtering
Sigmund‟s linear cascade theory (1981) has been the most successful model to
explain the sputtering event caused by the impact with a monatomic primary ion beam
[Sigmund, 1981]. This theory regards atoms of the solids as hard spheres that obey
Newtonian mechanics and assumes that sputtering occurs by using the beam at low

17
current and fluence. Sigmund further classified the sputtering mechanism into a knock-
on effect and electronic sputtering, but disregarded the latter since it is only valid for
beams with high energies. For the low energy beam (few keV), the theory was
developed into elastic collision. In this process, when the primary ion beam impacts a
surface it transfers its energy to the atoms of the surface. This results in a series of
collision cascading between the atoms of solids within 30 Å of a surface and as some of
these collisions return back to the surface secondary particles are emitted, Figure 1.3.
The emission of atoms and molecules is only possible if the energy of the beam
impacting the surface is high enough to overcome the surface binding energy. This
theory matches the experimental results when a medium to high energy (0-10,000 keV)
primary ion beam is used to bombard a single component with yields depending on the
mass and the energy of a primary particle. However in the case of multi-component
system, this model may not be appropriate since the transfer of energy will be
directional and not isotropic.
There has been a great effort by Garrison and Winograd to explain and model
the sputtering mechanism caused by polyatomic or cluster ion beams through molecular
dynamic simulations, explained further in this chapter in section 1.8.
1.2.1.2 Ionisation
Ionisation of sputtered particles depends on the nature of a sample and the
technique used. Only a small fraction of sputtered material during SIMS process is
ionised and the yield is highly dependent on electronic properties of the matrix known
as the matrix effect. Ionisation of metals occurs by swift electronic transitions whereas

18
organics become ionised by losing or gaining a charged species, typically a proton to
form [M+H]+ or [M-H]
- ions, but salt adducts of sodium, chlorine and potassium are
also commonly detected.
Various models have been developed to describe the ionisation process that
occurs during a SIMS experiment. Gerhard and Plog (1983) developed the Nascent ion
molecule model, which proposes that rapid electronic transitions occurring in the
surface region will neutralise any ions before they can leave the surface. Emission of
secondary ions occurs by neutral molecules (nascent ion molecules) undergoing non-
adiabatic dissociation as they leave the surface [Gerhard et al., 1983].
The desorption ionisation model was introduced by Cooks and Busch (1983)
which suggests that vibrational excitation may be significant in understanding the
emission of cluster(s) or molecular ion(s) from organics. This model predicts that
desorption and ionisation process can be considered separately. The ions can be formed
by desorption followed by two chemical reactions:
1) Ion/molecule reactions or electron ionisation can occur on top surface layers.
2) In free vacuum, the parent ion may dissociate to produce fragment ions.
1.2.2 The Basic Equation
As explained above, the SIMS technique is based on the analysis of secondary
ions with the yields depending on the electronic state of the surface. The relationship
between the factors used to determine the number of secondary ions is represented in
the SIMS equation [Vickerman, et al., 1997]:

19
Im
s = IpYmα+θm η Equation 1.1
Where,
Im
s = positive secondary ion current of species m
Ip = primary ion flux
Ym = sputter yield of species m
α+
= ionisation probability of the species m to positive ions
θm = fractional concentration of species m in the surface layer
η = transmission of the analysis system
Two important parameters that determine how a sample will behave under SIMS
are sputter yield and ionisation probability. The sputter yield is the total yield desorbed
from a surface including neutrals and ions per primary ion impact. The yield depends on
the nature and topography of a sample as well as the mass, charge, energy and the
current of primary ion beam. The primary ion flux is operator dependent and the
transmission is generally constant for a particular system [Vickerman, et al., 1997].
1.3 History of SIMS
The basic process underlying SIMS was first observed and identified by JJ
Thompson (1910) in 1900, when he discovered that by bombarding a metal surface with
a primary ion beam causes secondary ions to be emitted. However, it was not until 1949
that the first SIMS instrument was built by Herzog (1949) and Liebl (1963) and
commercialised in 1960. These were dynamic SIMS instruments that used a high
current primary ion beam to detect elements as a function of depth (also known as depth

20
profiling). This technique was primarily used in the semiconductor industry to detect
very low levels (ppm) of elements within a sample, as well as to characterise the layer
structure of devices. Dynamic SIMS developed rapidly in the next two decades and has
become an important tool in the semiconductor industry due to its high depth resolution
and very low detection limits.
Further instrumental advances led to the development of microscope and
microprobe modes [Casting et al., 1962], [Liebl et al., 1967]. These modes allowed the
construction of an image from the surface of a sample, explained later in this chapter.
These instruments were also dynamic systems that used a high primary ion dose to
rapidly erode the upper layer of a sample, making this technique highly destructive and
providing no molecular information.
Further modification in the early 1960s by Benninghoven led to this technique to
be used as a true surface analysis tool. The group showed that by bombarding a sample
with a low primary ion dose, the pristine surface can be maintained. This is because at a
very low ion dose the probability of striking a sample twice at the same location is very
low. Thus, to ensure the mass spectrum or the image acquired represents an undamaged
area of the sample, the ion dose is kept at or below 1 × 10¹³
ions/cm2, known as the
„static limit‟ [Benninghoven, 1970]. The major consequence of using low ion dose is
that the information obtained only represents the uppermost layer of a sample with very
low secondary ion signals. However, since the sample under analysis is still considered
to be in the native state following an impact by the primary ion beam, the concept of
„Static‟ SIMS was developed. The three modes of SIMS, dynamic (depth profiling),
static and imaging will be explained in more detail below.

21
1.4 Dynamic SIMS/Depth Profiling
This mode of SIMS involves using a high flux of primary ion beam to remove
many monolayers of a sample to determine the concentration of a specific component as
a function of depth. The depth profile experiment is performed by rastering a primary
ion beam in x and y direction over a defined area on the sample surface to create an etch
crater. A small area within the crater is selected for analysis in which the secondary ion
signal of the species of interest is monitored [Vickerman et al., 2001].
A number of different parameters have to be considered to fully understand this
type of analysis as the sputtering rate of various elements in a sample will be different.
At first, when sputtering begins the concentration of higher sputtered element will
decrease relative to the lower sputter rate element. This suggests that the secondary ion
signal of the easily sputtered element will diminish, whereas the signal of a less
sputtered element will rise, and when a steady state is reached it represents the
concentration of the components in bulk sample. Other parameters that also need to be
optimised prior to analysis include depth resolution and dynamic range. The depth
resolution corresponds to broadening of the measured depth profile with respect to the
original concentration. Basically, it is a measurement of a sharp interface between the
two species in a sample and is defined as intensity/sputter time curve or
concentration/depth curve. It is reported either in ∆Z depth on the concentration scale or
∆t time difference on the intensity scale and a change in signal is measured over a
distance of 84.13% to 15.47% on the profile graph [Honig, 1976], [Hofmann, 2000],
[Vickerman et al., 1997]. The dynamic range refers to a range of concentrations that are

22
examined for an element under analysis and monitored as a function of depth [Von
Criegern et al., 1990].
Although dynamic SIMS is mostly used in the semiconductor industry and for
characterisation of inorganic compounds, it is now progressing towards analysis of
biological species such as cells. This is discussed in more detail in Chapter 5.
1.5 Static SIMS
Static SIMS allows the molecular information to be probed from the uppermost
layer of a sample using a low primary ion beam current. As mentioned above this
results in low secondary ion signal, and the SIMS community was faced with the
challenge of increasing the sensitivity to allow analysis of more complex samples and
the detection of low concentration of analytes.
Initial Static SIMS instruments were based on using a quadrupole mass analyser,
which has a limited mass range and a low transmission, reducing the amount of
information that can be obtained in one analysis. The quadrupole mass analyser has a
low transmission as it scans over a given mass range and rejects any ions that do not
possess the selective mass to charge ratio, at a given point in the scan. In addition to this
since low secondary ion yields are produced during the static SIMS experiment, it is
essential to use a sensitive mass analyser that will detect all the ions generated [Van der
Wel et al., 1990].
The introduction of the time-of-flight (ToF) mass analyser to SIMS in the late
1980s by Benninghoven (1983) and Chait (1981), led to a significant increase in the
sensitivity due to high transmission and wide mass range offered by the analyser. A ToF

23
analyser separates ions based on the time it takes them to reach a detector, which is
directly related to the mass to charge ratio of an ion. ToF mass analysers offered to
satisfy almost all the requirements of a surface mass spectrometer. These included
detection of all the ions generated, unlimited mass range and a high mass resolution
[Benninghoven, 1994]. It was swiftly incorporated into the SIMS instrument and with
an increase in the sensitivity by four orders of magnitude [Tang et al., 1988], [Niehuis
et al., 1987], [Eccles et al, 1989], it was now possible to analyse diverse sample types
including polymers [Wien. 1997], bio-molecules [Luk et al., 2003] and atmospheric
aerosols [Peterson et al., 2006].
Further improvements in sensitivity were sought through the development of
new primary ion sources, discussed later in this chapter.
1.6 Imaging SIMS
Imaging using SIMS can be performed using either the microscope or the
microprobe modes, introduced earlier. First, the microscope mode uses a stigmatic ion
optical lens system similar to an optical microscope to generate images following an
impact with a defocused primary ion beam over a large area of a sample. The secondary
ion optics system allows the spatial distribution of secondary ions to be maintained as
they travel through the mass analyser and an image resembling the sample is produced.
The spatial resolution is dependent on the instrumental features such as ion optics and
mass resolution of the detector, but is independent of the beam diameter [Castaing et
al., 1981].
24
In the microprobe mode, the primary ion beam is focused to a smaller spot size
and is scanned across a selected area of analysis in x and y directions. 2D images are
constructed by summing images that have been collected over a period of time with
each pixel containing a full mass spectrum. The spatial resolution is now highly
dependent on the spot size of a beam, which should be within the range of pixel size of
the analysis area [Liebl et al., 1967]. If the spot size of a primary ion beam is larger than
the pixel then it becomes difficult to highlight small features within a sample. Whereas
if the spot size is too small there is a possibility of under-sampling and the pixel may
not be truly representative of the area under analysis. Thus, to localise small
components within a sample such as a cell, highly focused primary ion beam is required
but this causes a loss of ion current, resulting in fewer secondary ions per shot and
longer acquisition time.
1.7 Development of new sources
The SIMS community has long been aware of the fact that an increase in the
mass of the primary ion increases the secondary ion yields, thus a shift from Ar+ to Xe
+
[Kötter et al., 1998] was witnessed. At the same time highly focused liquid metal ion
sources (LMIS), Ga+, In
+ [Ostrowski et al., 2004], Au
+ [Davies et al., 2003], [Walker et
al., 2003] and Bi+ [Köllmer., 2004], [Touboul et al., 2005] were developed for
microprobe imaging. The Ga+ primary ion beam has been used to localise cholesterol in
rat kidney tissue section and in leukocytes cells [Nygren et al., 2003], [Nygren et al.,
2004] as well as for the analysis of Paramecium cells [Colliver et al., 1997], discussed
in Chapter 2 and Chapter 5. The Au+
ion source has been used for the analysis of

25
prostate cancer [Gazi et al., 2004], macrophages and galial cells [Parry et al., 2005].
However, even after numerous attempts it was still impossible to produce sub-micron
molecular imaging using monoatomic primary ion source under static conditions. This
is because when the atomic projectile strikes a sample, it penetrates deep below the
surface, resulting in significant fragmentation of sub-surface molecules by breaking
intermolecular bonds. Although by using low primary ion flux, the analysis is restricted
to the outermost monolayer of the sample, it minimises the decay in the signal and
reproducible spectra can be obtained. However, since the sampling depth is limited to
the uppermost layer only, it is not possible to obtain in-depth compositional
information. Furthermore, with corresponding loss in the sensitivity, the application of
static SIMS for dilute compounds in tissue samples has been unfeasible, due to
inadequate number of molecules in the surface monolayer to produce constructive
images. It has been reported that for organic samples, if the ion dose exceeds the 1 x
1014
ion/cm2, the molecular signal will no longer be observed [Gillen et al., 1998].
A non linear enhancement in the secondary ion yields was first observed in 1970
using dimer and trimer primary projectiles to analyse a range of samples [Anderson et
al.,1974], [Thompson et al., 1979], [Wittmaack et al., 1979]. Further experiments
conducted by Blain and co-workers (1989) investigated the effect of using the cluster
(CsI)nCs+ ion beams. These studied concluded that the secondary ion yield increases
with an increase in the mass and the energy of the primary ion beam with higher yields
reported for molecular secondary ions compared to atomic ions.

26
1.7.1 Development of cluster sources
At the turn of the century cluster LMIS Aun+
[Davies et al., 2003] and Bin+
[Köllmer, 2004] were developed for SIMS analysis. These sources quickly replaced the
monoatomic, Ga+ and In
+, offering an increase in the secondary ion yields while
retaining their high focusing capability. Bi3+
cluster primary ion source has successfully
been used to map the distribution of lipids in rat brain section [Touboul et al., 2005],
adipose tissues from chronic kidney biopsies [Sjövall, et al., 2008], skeletal muscle
[Magnusson et al., 2008] and liver biopsies [Debois et al., 2009]. The Au3+ cluster beam
has been used to determine phospholipids, cholesterol and fatty acids in cardiac tissues
[Aranyosiova et al., 2006]. Brunelle and co-workers (2005) used the Au3+ cluster ion to
identify three different regions of mouse leg section by localising different classes of
lipids [Touboul et al., 2005]. Although the behaviour characteristics of these two
beams, Aunn+
and Binn+
are very similar, but Binn+
offers a small practical advantage in
that higher cluster yields are obtained due to high cluster current, Figure 1.4 [Kollmer.,
2004].
Although these cluster beams allow high resolution imaging and non-linear
increase in the secondary ion yields [Benguerba et al., 1991], particularly at higher
molecular mass species with mass up to 1000 detected; they behave very similar to the
monoatomic ion sources in terms of sample damage and the analysis has to be
performed within the static limit. This theory is supported by the molecular dynamic
simulation, which illustrates that when the cluster beam impacts a surface, it breaks into
its constituent atoms giving rise to multiple sputtering and an increase in the secondary
ions. However, as the atoms still has enough energy, they penetrate and embed in the

27
sub-surface region of the sample. This generates chemical damage with an increase in
the fluence, resulting in a loss of molecular information [Ryan et al., 2007], [Rzeznik et
al., 2008]. Therefore, it was still not possible to probe molecular chemistry at sub-
surface level using these small cluster projectiles.
Figure 1.4 Normalised primary ion currents for Aunn+
and Binn+
clusters as a function of
cluster size and charge. Au1+ and Bi1
+ currents are Normalised
to 100%. Reproduced
from Kollmer, 2004.

28
1.7.2 Development of polyatomic sources
The greatest advance in the field of ToF-SIMS in recent years has been the
introduction of polyatomic primary ion beams. Appelhans et al. (1989) used a gas
cluster source SF60
to show an enhancement in the secondary ion yields of
pharmaceutical compounds to be 9 to 24 times greater than the monoatomic Cs+ ion
beam. Benninghoven (1998) reported a non-linear increase in the secondary ion
formation efficiencies of polymers when using a low energy SF5+ polyatomic beam.
Similar effect has also been reported by Gillen and co-workers when they used small
carbon and caesium cluster ions [Gillen. 2000], [Gillen et al., 2001].
A substantial increase in the secondary ion yields was observed by using a
buckminsterfullerene, C60 polyatomic primary ion beam. This enhancement was first
shown by the Orsay and Texas A & M groups when they carried out a number of
experiments to compare the yields for Aun+ cluster ions with large organic molecules,
C60+ and coronene (C24H12) [Baudin, et al., 1994], [Le Beyec, et al., 1998], [Jacquet, et
al., 2002]. The findings from these experiments concluded that Aun+ produces a non-
linear increase in the secondary ion yields for organics samples such as Langmuir-
Blodgett (LB) films and phenylalanine, but even higher yields up to 4-5 times more
were obtained when C60+ and coronene were used. This increase observed has been
explained by the trim calculations estimates which show that upon impact, the C60+
beam at 20 keV deposits its energy over a distance of 30 Å while the Au4+
cluster of the
same energy deposits its energy over a distance of 115 Å. The C60+
primary ion beam
breaks into its individual atoms and deposit more energy near the surface and produces
yields higher than the Au4 cluster ion beam [Baudin, et al., 1994]. Further comparison

29
between the C60+ polyatomic projectile and monatomic, Ga
+ and Cs
+ on the yields of the
molecular ion from phenylalanine was completed by Van Stipdonk (1996) and co-
workers. They reported an increase in the secondary ion yields by an order of
magnitude higher with the C60+ than with the Cs
+ and Ga
+.
Although these experiments were performed in 1990, a practical primary ion
gun for SIMS based on a C60 ion source was first developed and commercialised by the
Vickerman‟s group in collaboration with Ionoptika Ltd (Southampton) in 2003 [Weibel
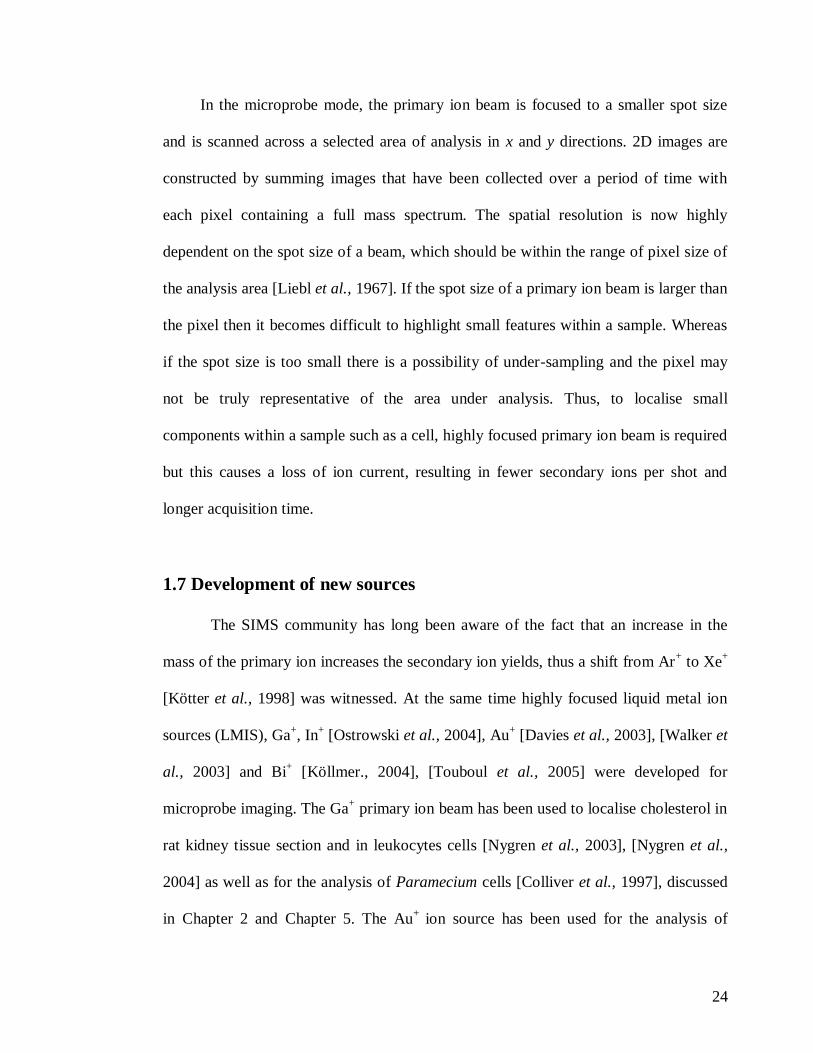
et al., 2003], [Wong, et al., 2003], [Hill et al., 2004]. Figure 1.5 compares the yields of
polyethylene terephthalate (PET) using three different ion projectiles, Au+, Au3
+ and
C60+. It can be clearly seen that the C60
+ produces higher yields for molecular and
fragment ions as compared to cluster, Au3+ and the monoatomic, Au
+ ion beam [Weibel
et al., 2003]. The study completed by Wong et al. (2004) showed that by using the C60+
primary ion beam, molecular ion of Gramicidin A at m/z 1881 can be detected, which is
not present in the spectrum when analysed with a Ga+ ion beam. This study further
highlights an increase in the yields by 20-30 times when using the C60+ ion beam,
particularly at higher mass. The Vickerman‟s group completed a number of experiments
to asses the relative benefits of the C60+ as compared to the monatomic and other cluster
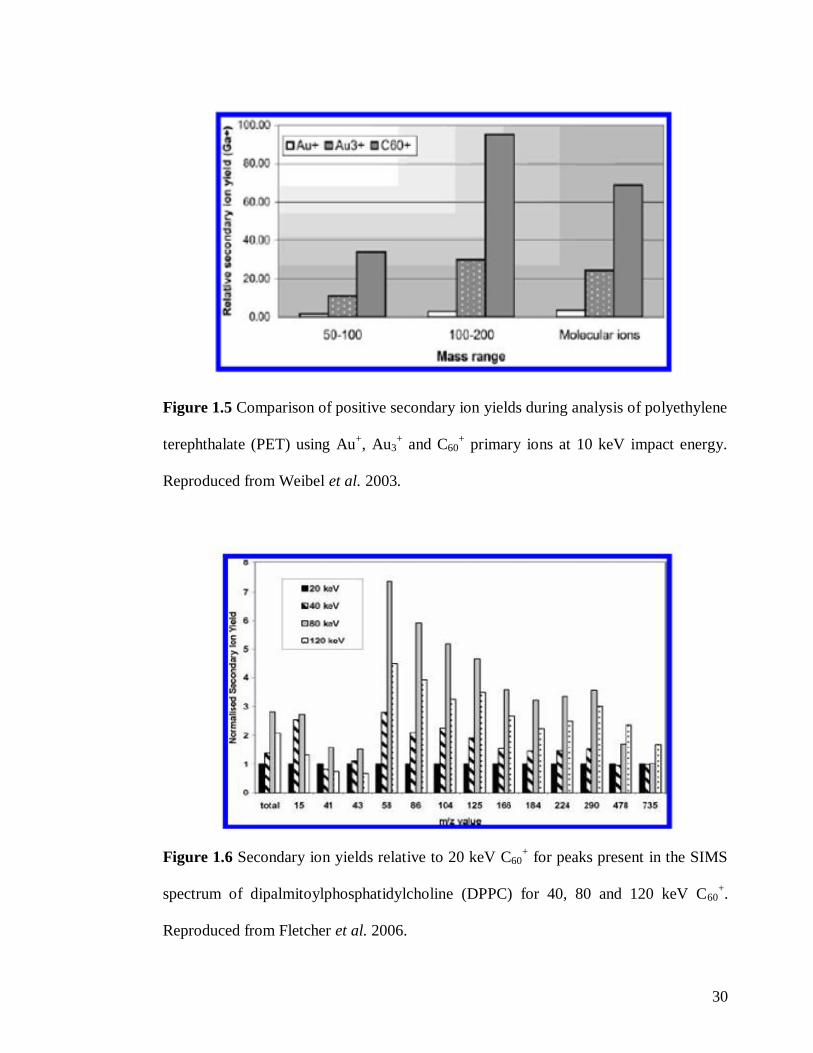
ions [Fletcher et al., 2006], [Jones et al., 2006]. The study by Fletcher et al. (2006) also
investigated the effect of changing the energy of the polyatomic primary ion beam on
the secondary ion yields for a range of samples. The investigators showed that with an
increase in the impact energy of the primary ion beam increases the secondary ion
yields, Figure 1.6.
30
Figure 1.5 Comparison of positive secondary ion yields during analysis of polyethylene
terephthalate (PET) using Au+, Au3
+ and C60
+ primary ions at 10 keV impact energy.
Reproduced from Weibel et al. 2003.
Figure 1.6 Secondary ion yields relative to 20 keV C60+ for peaks present in the SIMS
spectrum of dipalmitoylphosphatidylcholine (DPPC) for 40, 80 and 120 keV C60+.
Reproduced from Fletcher et al. 2006.
31
The Winograd‟s group suggest that the increases in the secondary ion yields
obtained with cluster and particularly for polyatomic beams are caused by the increase
in the sputter yields rather than the ionisation probability. An experiment undertaken by
Szakal (2006) showed that the sputter yields of water from ice increases by 10 fold
when switched from Au+ to Au3
+ and by 25 fold to 2500 when C60
+ was used. A similar
effect was also observed for organic molecules trehalose and cholesterol [Cheng et al.,
2005]. An article published by Wucher (2006) briefly gives an overview of the
secondary ion formation under cluster and polyatomic impact and the sputtering
characteristics are explained by Kersting et al. (2004). The potential benefits observed
with the 10 and 20 keV C60n+
source led to the development of a 40 keV C60n+
ion
source for imaging with SIMS at sub-micron resolution [Fletcher et al., 2006].
To provide a comparison between different beams, parameters such as
secondary ion yields relative to damage cross-section and secondary ion formation
efficiency have to be measured, which are defined and discussed below.
1.7.3 Damage cross-section and secondary ion formation efficiency
Since, these polyatomic beams provide a great enhancement in the secondary
ion yields, it is also important to investigate the damage they cause to the sample
surface upon impact. This is reported in terms of „damage cross-section‟, which is
defined as “the average surface area depleted of the considered surface species M as a
result of a single ion impact” by Kotter et al. (1998) and can, be determined by:

32
σ (X) = Ndes / No Equation 1.2
Where:
Ndes – average number of molecular species that disappears from the surface following a
single primary ion impact.
No – total number of molecular species M in the unit area of 1 cm2
of the uppermost
monolayer.
Principally, it refers to the area around the sample surface that has been
bombarded with the primary ion beam in which the molecules of interest have thought
to be damaged. It also depends on the structure and the composition of the surface, as
well as the properties of the primary ion beam and the secondary particles.
Thus, to provide a comparison between the yields and damage cross-section, the
value efficiency (E) was introduced. This provides a measure of the signal available that
can be acquired from an area before the surface becomes damaged. It is defined as a
ratio of secondary ion yields (Y) to the damage cross-section (σ)
E (X) = Y (X) / σ (X) Equation 1.3

33
The secondary ion yields (Y) of X can be determined by:
Y (X) = N (X) / Np Equation 1.4
Where:
N(X) – number of secondary ions detected.
Np – total number of applied primary ions.
The study by Appelhans and Delomore (1989) showed that by using the
polyatomic beam, SF60, an increase in the secondary ion yields is obtained with a
simultaneous increase in the damage, but the yield enhancement greatly outweighs the
damage increase. Further, Kötter and Benninghoven (1998) accomplished an in-depth
study to provide a comparison between the yields and damage cross-section of the
monoatomic ion beams, Ar+ and Xe
+ and the polyatomic, SF5
+ at the same energy. They
reported an increase in the yields up to factor of 1000 whereas the increase in the
damage was only by a factor of 6 when polyatomic, SF5+ primary ion beam was used.
A study by Gillen and co-workers (1998) evaluates the damaging behaviour of the
organic films when analysed at high primary ion dose using SF5+ and Ar
+. They show
that the molecular signal can be maintained as a function of the primary ion dose when
using the SF5+ projectile, which also has the ability to remove the damage caused by the
monoatomic, Ar+ primary ion beam. In addition to this, reduced damaging effects have
also been reported for the polymer samples, particularly for Poly(methyl methacrylate)
(PMMA) when analysed with SF5+ ion beam [Wagner et al., 2004].

34
On comparison of the C60+ polyatomic projectile to the monoatomic, cluster and
other polyatomic, SF5+ beams, it produces higher secondary ion efficiencies and low
subsurface damage [Weibel et al., 2003], [Kersting et al., 2004]. Table 1.2 and Table
1.3 shows the efficiencies (E) and the damage cross-section (σ) reported for some of the
samples from the literature.
In summary, these publications show that the C60+ primary ion beam results in
low disappearance cross-section (σ) and an increase in the efficiency (E) as compared to
the polyatomic, SF5+ ions. Although the disappearance cross-section (σ) caused by the
C60+ is relatively similar to the Ga
+ and Au3
+, but the efficiencies obtained with the C60
+
are much greater. Further, when Au+ and Au3
+ primary ion beams are used, damage
accumulation occurs with an increase in the primary ion dose. This is contrast to when
the sample is bombarded with the C60+, where a large decrease in the chemical damage
of the sample is observed even with an ion dose up to 1 × 10¹⁵
ions/cm2. This could be
due to the removal of any damage generated with each consecutive impact [Conlan et
al., 2006]. In conclusion, the literature has shown the C60+
to be the most successful and
favourable projectile for ToF-SIMS.

35
Table 1.2 Yields (Y), disappearance cross-section (σ) and secondary ions formation
efficiency (E) for 10 keV Ga+, Au
+, SF5
+ (IONTOF) and C60
+ bombardment of thin film
PS2000. Reproduced from Weibel et al. 2003.
Primary ion Y (1 × 10⁻⁵
)
m/z 325
σ (1 × 10⁻³
cm2)
m/z 325
E (1 × 109cm
2)
m/ z 325
Ga+ 14 1.33 11
Au+
62 4.23 15
SF5+ 1550 5.6 277
C60+
1500 1.06 1415
Table 1.3 Absolute values for secondary ion yields (Y), disappearance cross-sections
(σ) and efficiency (E) for the qausi-molecular ion [M-H]- m/z [C73H107O12]
- of irganox
1010 with primary ion energy 12 keV Au+ and 10 keV Ga
+, Cs
+, SF5
+ and C60
+.
Reproduced from Kersting et al. 2004.
Primary ion Y σ E
Ga+ 1.6 × 10
-6 2.3 × 10
-13 7.0 × 10
6
Cs+
2.0 × 10⁻⁵
3.3 × 10⁻¹³
6.1 × 10⁷
SF5+
2.2 × 10⁻⁴
5.3 × 10⁻¹³
4.2 × 10⁸
Au+
4.4 × 10⁻⁵
3.0 × 10⁻¹³
1.5 × 10⁸
Au2+ 4.3 × 10
-4 9.2 × 10
-13 4.7 × 10
8
Au3+ 2.0 × 10
-3 1.1 × 10
-12 1.8 × 10
9
C60+
3.2 × 10⁻³
2.1 × 10⁻¹³
1.5 × 10¹⁰

36
1.8 Simulation Studies
Molecular dynamic computer simulation studies developed by the Winograd and
Garrison groups have been used to explain the sputtering mechanism and the increase in
the yields of the polyatomic, C60+ primary ion beam [Postawa et al., 2004], [Ryan et al.,
2007]. Figure 1.7 illustrates the difference between monoatomic Ga+ and C60
+ impact on
a silver substrate at 15 keV [Postawa et al., 2004]; and Figure 1.8 shows the difference
between cluster, Au3+ and C60
+ impact on the water ice substrate at 15 keV [Ryan et al.,
2007]. Both figures show that upon impact at 15 keV the polyatomic beam, C60+
dissociates into its 60 constituents carbon atoms and each carbon atom carrying 250 eV
creates its own cascade of moving particles. As the atoms deposit energy very close to
the surface, it results in an increase in the amount of material removed by a single ion
impact and low damage is caused which is removed by subsequent impact. Therefore,
molecular information can be obtained and maintained as a function of primary ion
dose.
On the other hand, when 15 keV Ga+ atomic ion beam strikes a surface, it
penetrates deep into the sample and deposits energy many monolayers below the
surface. This causes sub-surface mixing and less amount of material is ejected per
impact. Furthermore with continuous bombardment, the damage builds up, resulting in
loss of molecular information, Figure 1.7.
Figure 1.8 shows that when the cluster, Au3+ ion beam impacts a surface, it also
breaks into its constituent atoms, Au; but as each atom still posses restively high energy
they travel considerable distance and become embedded into sub-surface region of the
samples. This causes substantial damage to the samples, which builds up and is

37
uncovered as the sputtering proceeds. These simulation studies have been developed by
the Garrison group over many years for metals but now recently effort has been devoted
to the behaviour of organic films which also show the same results.
In summary, the development of the polyatomic ion beams, particularly the C60+
projectiles has led to a significant increase in the secondary ion yields with very low
sub-surface damage and higher efficiencies. This allows the analysis to be performed at
higher primary ion dose, exceeding the static limit while maintaining molecular
information which has opened up the prospect of depth profiling discussed in Chapter 4
and 3D imaging discussed in Chapter 5.

38
Figure 1.7 A silver {111} surface under impact from a 15 keV Ga+ (left) and 15 keV
C60+ (right). The projectile atoms are black, the silver ions are coloured in layers to
allow easier visualisation of the inter layer mixing. Reproduced from Postawa et al.
2004.

39
Figure 1.8 Time snapshots of 15 keV C60+ (left) and Au3
+ (right) bombardment of pure
amorphous water ice. Gray and yellow spheres represent intact water molecules and
projectile atoms, respectively, within a 2 nm slice through the centre of the substrate at
0.5 ps. Orange, green, and blue spheres represent the fragment species placed back in
their initial positions and overlaid on the substrate at 0.5 ps. Reproduced from Ryan et
al. 2007.
40
1.9 AIMS
In the last decade, SIMS has matured into a powerful technique in the field of
MS imaging. The implementation of highly focused cluster LMIS offer the prospect of
imaging at a sub 100 nm spatial resolution but the limitations of the static limit and low
ionisation probability has restricted this to a 2 µm spatial resolution [Fletcher et al.,
2010]. It has been shown that the secondary ion yields can be increased by using a
polyatomic primary ion beam, particularly, C60+, which also offers low sub-surface
damage and analysis at high ion dose. Thus, sub-micron imaging becomes a reality by
using “voxels” rather than pixels with depth profiling and 3D imaging. However, the
conventional ToF-SIMS as a result becomes a limitation since a pulsed ion beam has a
low duty cycle resulting in long analysis time. Furthermore, while pulsing the beam it is
difficult to maintain a high mass resolution and spatial resolution at the same time. A
new configuration for ToF-SIMS is required to overcome these challenges and progress
forward in the field of biological sciences.
Our group at the University of Manchester went into collaboration with
Ionoptika Ltd (Southampton) and Surface Analysis Instruments (SAI) Ltd (Manchester)
to design and build an instrument to overcome the drawbacks on the conventional ToF-
SIMS instrument. This instrument, called the J105 3D Chemical Imager uses a dc
beam for analysis and decouples SIMS process from the mass spectrometry.
The aim of this thesis is to explain the development of the new ToF-SIMS
instrument, the J105 3D Chemical Imager and briefly outline how it differs from the
conventional ToF-SIMS in terms of capability and performance. It has been shown by
the Vickerman‟s group that the buckminsterfullerene C60 polyatomic beam offers much

41
more to the field of biological analysis, particularly in 3D imaging of cells as compared
to other polyatomic projectiles. Hence, the project explores the prospect of using C60+
as
a continuous beam during analysis in order to achieve a better sensitivity and a higher
spatial resolution while maintaining mass resolution. A range of standard samples have
been analysed to prove the concept of the J105 instrument, including tandem MS
capability and limit of detection. The instrument‟s ability to perform sub-cellular
imaging in 2D and 3D is also investigated by using a standard Henrietta Lacks (HeLa)
cell line. In addition, three different sample preparation techniques, formaldehyde
fixing, freeze-drying and freeze-fractured frozen-hydrated is investigated by using an
improved sample handling system specifically designed for biological samples on the
J105 3D Chemical Imager.
42
References
Anderson, H.H.; Bay, H.L. Nonlinear effects in heavy ion sputtering. Journal of
Applied Physics (1974), 45 (2), 953-954
Appelhans, A.D.; Delmore, J.E. Comparison of Polyatomic and Atomic Primary
Beams for Secondary Ion Mass Spectrometry of Organics. Analytical Chemistry
(1989), 61, 1087-1093
Aranyosiova, M.; Chorvatova, A.; Chorvat Jr, D.; Biro, Cs.; Velic, D. Analysis of
cardiac tissue by gold cluster ion bombardment. Applied Surface Science (2006),
252, 6782-6785
Baudin, K.B.; Bolbach, G.; Brunelle, A.; Della-Negra, S.; Håkansson, P.; Le Beyec, Y.
Secondary ion emission under cluster impact at low energies (5-60 keV); influence
of the number of atoms in the projectile. Nuclear Instruments and Methods in Physics
Research B (1994), 160-163
Benguerba. M.; Brunelle, A.; Della-Negra, S.; DepaUW, J.; Joret, H.; Le Beyec,Y.;
Blain, M.G.; Schweikert,E.A.; Ben Assayag G.; Sudraud, P. Impact of slow gold
clusters on various solids : nonlinear effects in secondary ion emission. Nuclear
Instruments and Methods in Physics Research (1991), B62, 8-22
Benninghoven, A. Analysis of monomolecular surface layers of solids by secondary
ion emission. Zeitschrift fuer Physik (1970), 230(5), 403-417
Benninghoven, A. Chemical Analysis of Inorganic and Organic Surfaces and Thin
Films by Static Time-of-Flight Secondary Ion Mass Spectrometry (ToF-SIMS). Angewandte Chemie (International Edition in English) (1994), 33 (10), 1023-1043
Benninghoven, A.; Steffens, P.; Niehuis, E.; Friese, T. Application of a new Time of
Flight. Annual Conference on Mass Spectrometry and Allied Topics (1983), 54-55
Blain, M.G.; Della-Negra, S.; Joret, H.; Le Beyec, Y.; Schweikert, E.A. Secondary-Ion
Yields from Surface Bombarded with keV Molecular and Cluster Ions. Physical
Review Letters (1989), 63 (15), 1625-1628
Caprioli, R.M.; Farmer, T. B.; Gile, J. Molecular Imaging of Biological Samples:
Localization of Peptides and Proteins Using MALDI-TOF MS. Analytical
Chemistry (1997), 69(23), 4751-4760
Castaing, R.; Slodzian, G. Analytical microscopy by secondary ion imaging
techniques. Journal of Physics, E-Scientific Instruments (1981), 14, 1119-1127

43
Castaing, R; Slodzian, G. Microanalysis by secondary ionic emission. Journal of
Microscopy (1962), 1(6), 395-410Chait, B.T.; Standing, K.G. A time-of-flight mass
spectrometer for measurement of secondary ion mass spectra. International Journal
of Mass Spectrometry and Ion Physics (1981), 40 (2), 185-193
Chaurand, P; Schwartz, S.A.; Caprioli, R.M. Assessing protein patterns in disease
using imaging mass spectrometry. Journal of Proteome Research (2004), 3(2), 245-
252
Cheng, J.; Winograd, N. Depth Profiling of Peptide Films with TOF-SIMS and a C60
Probe. Analytical Chemistry (2005), 77(11), 3651-3659
Chughtai. K.; Heeren, R.M.A. Mass Spectrometric Imaging for Biomedical Tissue
Analysis. Chemical Reviews (2010), 110(5), 3237-3277
Colliver, T.L.; Brummel, C.L.; Pacholski, M.L.; Swanek, F.D.; Ewing, A.G.; Winograd,
N. Atomic and Molecular Imaging at the Single-Cell Level with TOF-SIMS.
Analytical Chemistry (1997), 69, 2225-2231
Conlan, X.A.; Gilmore, I.S.; Henderson, A.; Lockyer N.P.; Vickerman, J.C.
Polyethylene terephthalate (PET) bulk film analysis using C60+, Au3
+, and Au
+
primary ion beams. Applied Surface Science (2006), 252, 6562–6565
Cooks, R.G. and Busch, K.L. Matrix Effects, Internal Energies and MS/MS Spectra
of Molecular Ion Sputtered From Surfaces. International Journal of Mass
Spectrometry Ion Physics (1983), 53, 111-124
Davies, N.; Weibel, D.E.; Blenkinsopp, P.; Lockyer, N.; Hill, R.; Vickerman, J.C.
Development and experimental application of a gold liquid metal ion source.
Applied surface science (2003), 203-204, 223-227
Debois, D.; Bralet, M.P., Naour, F.; Brunelle, A.; Laprévote, O. In Situ Lipidomic
Analysis of Nonalcoholic Fatty Liver by Cluster TOF-SIMS Imaging. Analytical
Chemistry (2009), 81, 2823-2831
Earnshaw, C.J.; Carolan, V.A.; Richards, D.S.; Clench, M.R. Direct analysis of
pharmaceutical tablet formulations using matrix-assisted laser
desorption/ionisation mass spectrometry imaging. Rapid Communications in Mass
Spectrometry (2010), 24(11), 1665-1672
Eccles, A. J.; Vickerman, J. C. The characterization of an imaging time-of-flight
secondary ion mass spectrometry instrument. Journal of Vacuum Science &
Technology, A: Vacuum, Surfaces, and Films (1989), 7(2), 234-44
44
Fletcher, J.S.; Xavier, A.C.; Jones, E.A.; Biddulph, G.; Lockyer, N.P.; Vickerman, J.C.
TOF-SIMS Analysis Using C60. Effect of Impact Energy on Yield and Damage.
Analytical Chemistry (2006), 78, 1827-1831
Fletcher, J.S; Lockyer, N.P.; Vickerman, J.C. Developments in molecular SIMS depth
profiling and 3D imaging of biological systems using polyatomic primary ions.
Mass Spectrometry Reviews (2010), 1-33
Gazi, E.; Dwyer, J.; Lockyer, N.; Gardner, P.; Vickerman, J.C.; Miyan, J.; Hart, C.A.;
Brown, M.; Shanks, J.H.; Clarke, N. The combined application of FTIR
microspectroscopy and ToF-SIMS imaging in the study of prostate cancer. Faraday
Discussions (2004), 126, 41-59
Gerhard, W.; Plog, C. Secondary Ion Emission by Nonadiabatic Dissociation of
Nascent Ion Molecules with Energies Depending on Solid Composition. Part I.
Mathematical Formulation and Qualitative Examination of New Emission Conception
from Me+ Ions. Zeitschrif Fur Physik. Condensed Matter, (1983), 54 (1), 59-71
Gillen, G. in Microbeam Analysis. Proceeding of the International Conference on
Microbeam Analysis, 8-15 July 2000. Institute of Physics Conference Series 165,
Taylor & Francis Ltd, London 2000, p. 339
Gillen, G.; King, L.; Freibaum, B.; Lareau, R.; Bennett, J.; Chmara, F. Negative
caesium sputter ion source for generating cluster primary ion beams for secondary
ion mass spectrometry analysis. Journal of Vacuum Science and Technology, Part A:
Vacuum, Surfaces and Films (2001), 19 (2), 568-575
Gillen, G.; Roberson, S. Preliminary Evaluation of an SF5+ Polyatomic Primary Ion
Beam for Analysis of Organic Thin Films by Secondary Ion Mass Spectrometry.
Rapid Communications in Mass Spectrometry (1998), 12, 1303-1312
Hammond, J.S. Imaging Mass Spectrometry Protocols for Mass Microscopy. Chapter
18 Comparison of SIMS and MALDI for Mass Spectrometric Imaging. Setou,
Editor. 2010. Springer.
Herzog, R. F. K.; Viehbock, F. P. Ion source for mass-spectrography. Physical
Review (1949), 76 855-856
Hill, R.; Blenkinsopp, P.W.M. The development of C60 and gold cluster ion guns for
static SIMS analysis. Applied Surface Science (2004), 231-232, 936-939
Hofmann, S. Ultimate Depth Resolution and Profile Reconstruction in Sputter
Profiling with AES and SIMS. Surface and Interface Analysis (2000), 30 (1), 228-236
Honig, R.E. Surface and thin film analysis of semiconductor materials. Thin Solid
Films (1976), 31 (1-2), 89-122

45
Hsieh, Y.; Casale, R.; Fukuda, E.; Chen, J.; Knemeyer, I.; Wingate, J.; Morrison, R.;
Korfmacher, W. Matrix assisted laser desorption/ionization imaging mass
spectrometry for direct measurement of clozapine in rat brain tissue. Rapid
Communications in Mass Spectrometry (2006), 20(6), 965-972
Jacquet, D.; Le Beyec, Y. Cluster impacts on solids. Nuclear Instruments and Methods
in Physics Research B (2002), 193, 227-239
Jones, E.A.; Fletcher, J.S.; Thompson, C.E.; Jackson, D.A.; Lockyer, N.P.; Vickerman,
J.C. ToF-SIMS analysis of bio-systems: Are polyatomic primary ions the solution?
Applied Surface Science 252 (2006) 6844–6854
Kang, S.; Shim, H.S.; Lee, J.S.; Kim, D.S.; Kim, H.Y.; Hong, S.H.; Kim, P.S.; Yoon,
J.H.; Cho, N.H. Molecular proteomics imaging of tumour interfaces by mass
spectrometry. Journal of Proteome Research (2010), 9 (2), 1157-1164
Kersting, R.; Hagenhoff, B.; Kollmer, F.; Möllers, R.; Niehuis, E. Influence of
primary ion bombardment conditions on the emission of molecular secondary ions.
Applied Surface Science (2004), 231–232, 261–264
Kollmer, F. Cluster Primary Ion Bombardment of Organic Materials. Applied
Surface Science (2004), 231-232, 153-158
Kötter, F.; Benninghoven, A. Secondary ion emission from polymer surfaces under
Ar+, Xe
+ and SF5
+ ion bombardment. Applied Surface Science (1998), 133, 47-57
Le Beyec, Y. Cluster impacts at keV and MeV energies: Secondary emission
phenomena. International Journal of Mass Spectrometry and Ion Processes (1998),
174, 101-117
Liebl, H.J. Ion microprobe mass analyser. Journal of Applied Physics (1967), 38(13),
5277-5283
Liebl, H.J.; Herzog, R.F.K. Sputtering ion source for solids. Journal of Applied
Physics (1963), 34(9), 2893-2896
Luk, S. Y.; Patel, N.; Davies, M. C. Chemical imaging of pharmaceuticals by time-of
flight secondary ion mass spectrometry. Spectroscopy Europe (2003), 15(1), 14-18
Luxembourg, S.L.; McDonnell, L.M.; Duursma, M.C.; Guo, X.; Heeren, R.M.A. Effect
of Local Matrix Crystal Variations in Matrix-Assisted Ionization Techniques for
Mass Spectrometry. Analytical Chemistry (2003), 75, 2333-2341
Magnusson, Y.; Friberg, P.; Sjövall, P.; Danardt, F.; Malmberg, P., Chen, Y. Lipid
imaging of human skeletal muscle using TOF-SIMS with bismuth cluster ion as a
primary ion source. Clinical Physiology and Functional Imaging (2008), 28, 202-209
46
McDonnell, L.A.; Heeren, R.M.A. Imaging Mass Spectrometry. Mass Spectrometry
Reviews (2007), 26(4), 606-643
Murphy, R.C.; Hankin, J.A.; Barkley, R.M. Imaging of lipid species by MALDI mass
spectrometry. Journal of Lipid Research (2009), 50, S317-322
Niehuis, E.; Heller, T.; Feld, H.; Benninghoven, A. Design and performance of a
reflectron based time-of-flight secondary-ion mass spectrometer with
electrodynamic primary ion mass separation. Journal of Vacuum Science &
Technology, A: Vacuum, Surfaces, and Films (1987), 5(4, Pt. 2), 1243-6
Nygren, H.; Eriksson, C.; Malmberg , P.; Sahlin, H.; Carlsson, L.; Lausmaa, J.; Sjövall,
P. A cell preparation method allowing subcellular localization of cholesterol and
phosphocholine with imaging TOF-SIMS. Colloids and Surfaces B: Biointerfaces
(2003), 30, 87-92
Nygren, H.; Malmberga, P.; Kriegeskotte, C.; Arlinghaus, H.F. Bioimaging TOF-
SIMS: localization of cholesterol in rat kidney sections. FEBS letters (2004), 566 (1-
3), 291-293
Oppenheimer, S.R.; Mi, D.C.; Sanders, M.E.; Caprioli, R.M. Molecular analysis of
tumour margins by MALDI mass spectrometry in renal carcinoma. Journal of
Proteome Research (2010), 9 (5), 2182-2190
Ostrowski, S.G.; Van Bell, C.T.; Winograd, N.; Ewing, A.G. Mass Spectrometric
Imaging of Highly Curved Membranes During Tetrahymena Mating. Science
(2004), 305, 71-73
Parry, S.; Winograd, N. High-resolution ToF-SIMS imaging of eukaryotic cells
reserved in trehalose matrix. Analytical Chemistry (2005), 77 (24), 7950-7957
Peterson, R. E.; Nair, A.; Dambach, S.; Arlinghaus, H. F.; Tyler, B. J.
Characterization of individual atmospheric aerosol particles with SIMS and laser-
SNMS. Applied Surface Science (2006), 252(19)
Pierson, J.; Norris, J.L.; Aerni, H-R.; Svenningsson, P; Caprioli, R.M.; Andren, P.E.
Molecular Profiling of Experimental Parkinson's Disease: Direct Analysis of
Peptides and Proteins on Brain Tissue Sections by MALDI Mass Spectrometry.
Journal of Proteome Research (2004), 3(2), 289-29
Postawa, Z. Sputtering simulations of organic overlayers on metal substrates by
monoatomic and clusters projectiles. Applied Surface Science (2004), 231-232, 22-28
Reyzer, M.L.; Hsieh, Y.; Ng, K.; Korfmacher, W.A.; Caprioli, R.M. Direct analysis of
drug candidates in tissue by matrix-assisted laser desorption/ionization mass
spectrometry. Journal of Mass Spectrometry (2003), 38(10), 1081-1092
47
Rohner, T.C.; Staab, D.; Stoeckli, M. MALDI mass spectrometric imaging of
biological tissue sections. Mechanisms of Ageing and Development (2005), 126, 177–
185
Ryan, K.E.; Wojciechowski, I.A.; Garrison, B.J. Reaction Dynamics Following keV
Cluster Bombardment. Journal of Physical Chemistry (2007), 111, 12822-12826
Rzeznik, L.; Czerwinski, B.; Garrison B.J.; Winograd, N.; Postawa, Z. Molecular
dynamics simulations of sputtering of organic overlayers by slow, large clusters.
Applied Surface Science (2008), 255, 841-843
Schwartz, S.A.; Weil, R.J.; Johnson, M.D.; Toms, S.A.; Caprioli, R.M. Protein
Profiling in Brain Tumours Using Mass Spectrometry: Feasibility of a New
Technique for the Analysis of Protein Expression. Clinical Cancer Research (2004),
10(3), 981-987
Sigmund, P. Sputtering by Ion Bombardment: Theoretical Concepts. In: Springer
Series Topics in Applied Physics: Sputtering by Particle Bombardment I, Behrisch R
(ed). 1981; 47:9
Sjövall, P.; Johansson, B.; Belazi, D.; Stenvinkel, P.; Lindholm, B.; Lausmaa, J.;
Schalling, M. ToF-SIMS analysis of adipose tissue from patients with chronic
kidney disease. Applied Surface Science (2008), 255, 1177-1180
Solon, E.G.; Schweitzer, A.; Stoeckli, M.; Prideaux, B. Autoradiography, MALDI-MS,
and SIMS-MS Imaging in Pharmaceutical Discovery and Development. American
Association of Pharmaceutical Scientists (2010) 12 (1), 11-26
Stoeckli, M.; Staab, D.; Staufenbiel, M.; Wiederhold, K-H.; Signor, L. Molecular
imaging of amyloid peptides in mouse brain sections using mass spectrometry.
Analytical Biochemistry (2002), 311(1), 33-39
Szakal, C.; Kozole, J.; Winograd, N. Fundamental Studies of the Cluster Ion
Bombardment of Water Ice. Applied Surface Science (2006), 252, 6526-6528
Tang, X.; Beavis, R.; Ens, W.; Lafortune, F.; Schueler, B.; Standing, K. G. A
Secondary ion time-of-flight mass spectrometer with an ion mirror. International
Journal of Mass Spectrometry and Ion Processes (1988), 85(1), 43-67
Thompson, D. A.; Johar, S.S. Nonlinear sputtering effects in thin metal films.
Applied Physics Letters (1979), 34 (5), 342-345
Thomson, J. J. Scattering of Rapidly Moving Electrified Particles. Proc.Cam. Phil.
Soc. (1910), 15 465-71

48
Touboul, D.; Brunelle, A.; Halgand, F.; DeLa Porte, S.; Laprévote, O. Lipid imaging
by gold cluster time-of-flight secondary ion mass spectrometry: Application to
Duchenne muscular dystrophy. Journal of Lipid Research (2005), 46 (7), 1388-1395.
Touboul, D.; Kollmer, F.; Niehuis, E.; Brunelle, A.; Laprévote, O. Improvement of
Biological Time-of-Flight Secondary Ion Mass Spectrometry with a Bismuth
Cluster Ion Source. American Society for Mass Spectrometer (2005), 16, 1608-1618
Van der Wel, H.; Lub, J.; Van Velzen, P.N.T.; Benninghoven, A. Organic surface
analysis with time-of-flight SIMS. Mikrochimica Acta (1990), 101 (1-6), 3-18
Van Stipdonk, M.J.; Harris, R.D.; Schweikert, E.A. A Comparison of Desorption
Yields from C60 to Atomic and Polyatomic Projectiles at keV Energies. Rapid
Communication in Mass Spectrometry (1996), 10, 1987-1991
Vickerman, J.C. and Briggs, D. ToF-SIMS: Surface Analysis by Mass Spectrometry
Surface Spectra, IM Publications LLP 2001
Vickerman, J.C. and Swift, A.J. Secondary Ion Mass Spectrometry in Surface
Analysis the Principle Techniques. Edited by JC Vickerman, John Wiley and Sons
Ltd., Chichester 1997
Von Criegern, R.; Weitzel, I.; Zeininger, H.; Lange-Gieseler, R. Optimization of the
Dynamic Range of SIMS Depth Profiles by Sample Preparation. Surface and
Interface Analysis (1990), 15, 415-421
Walker, A.V.; Winograd, N. Prospects for Imaging with TOF-SIMS Using Gold
Liquid Metal Ion Sources. Applied Surface Science (2003), 203-204, 198-200
Weibel, D.E.; Wong, S. Lockyer, N.P. Vickerman, J.C. C60 Cluster Ion
Bombardment of Organic Surfaces. Applied Surface Science (2004), 231-232, 146-
152
Weibel, D.E.; Wong, S., Lockyer, N.P.; Blenkinsopp, P.; Hill, R.; Vickerman, J.C. A
C60+ Primary Ion Beam System for Time of Flight Secondary Ion Mass
Spectroscopy: Its Developments and Secondary Ion Yield Characteristics.
Analytical Chemistry (2003), 75, 1754-1764
Wien, K. ToF-SIMS analysis of polymers. Nuclear Instruments and Methods in
Physics Research, Section B: Beam Interactions with Material and Atoms (1997), 131
(1-4), 38-54
Wittmaack, K. Secondary-ion emission from silicon bombarded with atomic and
molecular noble gas ions. Surface Science (1979), 90, 557-563

49
Wong, S.C.C.; Hill, R.; Blenkinsopp, P.; Lockyer, N.P.; Weibel, D.E.; Vickerman, J.C.
Development of a C60+ ion gun for static SIMS and chemical imaging. Applied
Surface Science (2003), 203-204, 219-222
Woods, A.S.; Jackson, S.N. Brain Tissue Lipidomics: Direct Probing Using Matrix-
assisted Laser Desorption/Ionization Mass Spectrometry. The APPS Journal (2006),
8 (2), E391-E395
Wusher, A. Molecular secondary ion formation under cluster bombardment: A
fundamental review. Applied Surface Science (2006), 252 (19), 6482-6489
Zimmerman, T.A.; Monroe, E.B.; Tucker, K.R.; Rubakhin, S.S.; Sweedler, J.V.
Chapter 13 Imaging of Cells and Tissues with Mass Spectrometry. Adding
Chemical Information to Imaging. Methods in Cell Biology (2008), 89, 361-390

50
2 Development and Properties of the J105 3D Chemical
Imager
ToF-SIMS is becoming a powerful tool in molecular imaging of biological
components in cells and tissues. Advances in the instrumentation, particularly the
LMIS, Au+, Bi
+ and In
+ that can be focused to spot size of ~100 nm allow high spatial
resolution imaging of very small biological features such as cells and this is discussed
comprehensively in Chapter 5. These analyses were performed on the conventional
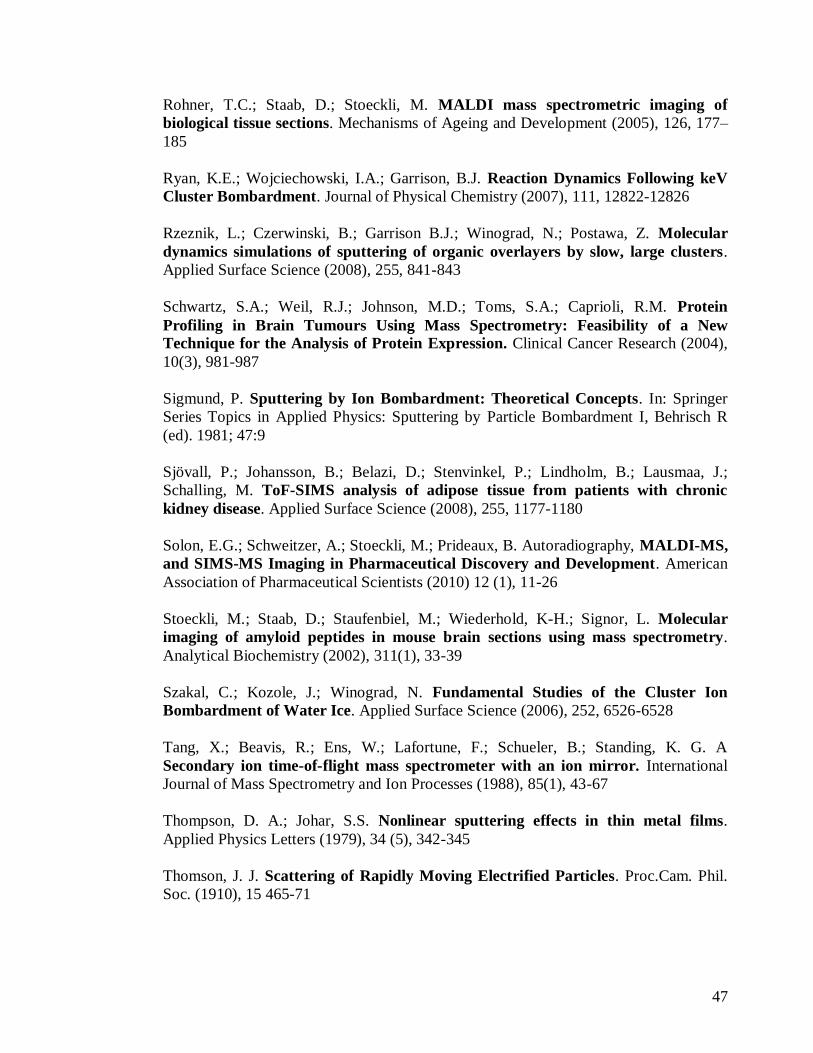
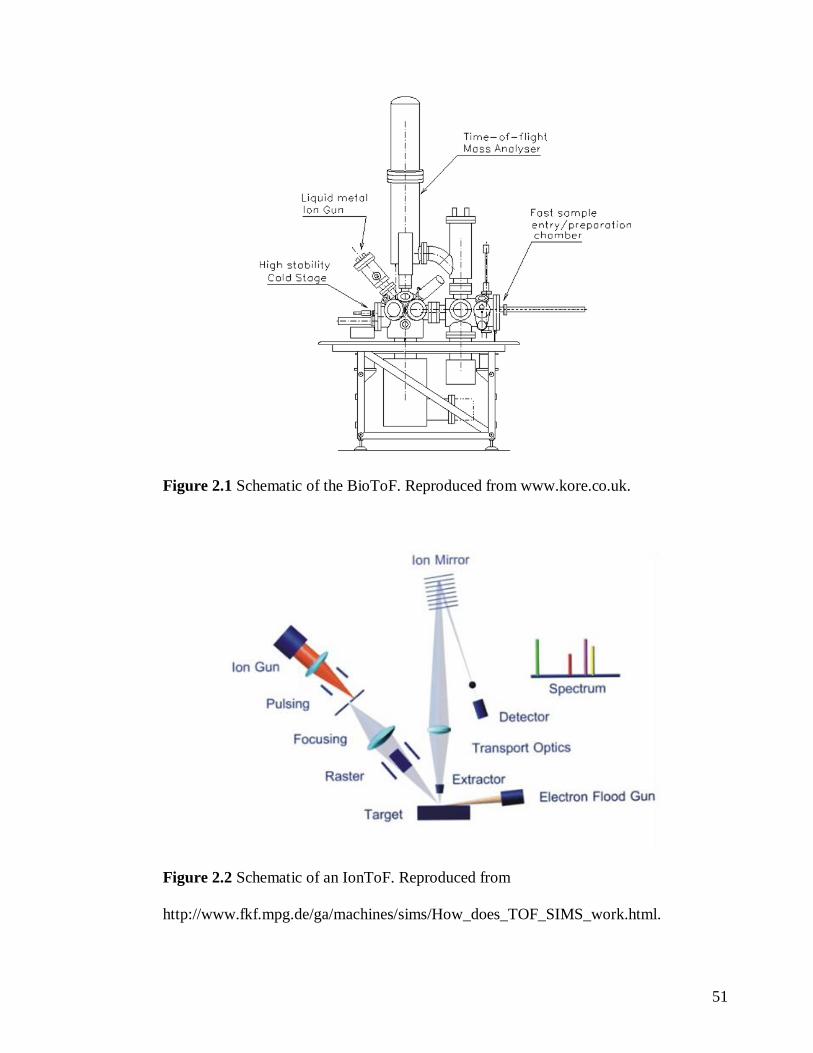
ToF-SIMS instrument, Figure 2.1 “BioToF”, used in the Vickerman‟s lab. Figure 2.2
illustrates the mechanism of operation of a similar ToF-SIMS an “IonToF”, used by
many SIMS groups. Both of these systems use a pulsed primary ion beam to generate
secondary ions which are extracted and accelerated into reflectron ToF where they are
separated depending on their mass to charge ratio. The next pulse of the primary ion
beam cannot start until the secondary ions of the first mass analyser have been separated
and detected. Although impressive imaging experiments have been obtained using these
instruments but issues such as sensitivity, duty cycle, mass resolution and sample
preparation, discussed in detail in Chapter 5 are still preventing this technique reaching
its full potential. These limitations will be reviewed in this chapter followed by the
developments and properties of the new instrument, the J105 3D Chemical Imager.
51
Figure 2.1 Schematic of the BioToF. Reproduced from www.kore.co.uk.
Figure 2.2 Schematic of an IonToF. Reproduced from
http://www.fkf.mpg.de/ga/machines/sims/How_does_TOF_SIMS_work.html.

52
2.1 Limitations of conventional ToF-SIMS instruments
2.1.1 Sensitivity
Sensitivity refers to a proportion of the amount of a sample available that can be
detected using a technique of interest. In dynamic SIMS, the primary ion beam is used
in continuous mode but this causes damage to the sample and the secondary ions
detected are in the form of elemental ions and small fragments [Lorey II et al., 2001].
The modality of static SIMS allows molecular information to be obtained using
monoatomic LMIS, but due to the damaging characteristics of these beams the analysis
is performed under static conditions. This results in restricting the analysis to the upper
layer of the sample only, limiting sensitivity. Nevertheless, these beams are routinely
utilized in SIMS imaging as they generate very sharp images.
Winograd and co-workers (1997) used Ga+ primary ion beam to image freeze-
fractured single Paramecium cells [Colliver et al., 1997]. When the inorganic peaks Na+
and K+ were imaged they co-localise with the cells but the hydrocarbons appear more
uniformly distributed on the cell surface. The Paramecium cells were also doped with
cocaine and dimethyl sulfoxide (DMSO) to image the distribution of these molecules in
a biological matrix. The characteristic peaks used to image cocaine were m/z 105 and
m/z 304 which localise in the Paramecium cells. This study provides a good example of
using ToF-SIMS for an application at sub-cellular resolution. However, the signal levels
for organic species are extremely low and as a result the cocaine signal only appears to
be slightly higher in the cell than in the background. Although, the inorganic species are
detected with high intensity when single ions Na+
and K+ are imaged to outline the

53
Paramecium cell, it is very difficult to differentiate the cell from background, shown in
Figure 2.3.
In some laboratories it was observed that increasing the mass of the primary ion
beam increases the secondary ion yields which led to the use of the heavier primary ion,
In+. Ostrowski et al. (2004) used ToF-SIMS to analyse protozoan Tetrahymena
thermophila cell system using In+ primary ion source. During the fusion process, two
adjacent lipid bilayers of a Tetrahymena cell combine to form fusion pores at the
conjugation site. This radical transformation of the shape causes the lipid bilayer to
adopt a high curvature structure and as a result the lipid composition changes in that
area. ToF-SIMS imaging of freeze fractured Tetrahymena cells show that the
hydrocarbon fragment m/z 69 is uniformly distributed across the conjugation site
whereas the phosphatidylcholine fragment, m/z 184, rapidly decreases in the
conjugation junction, Figure 2.4. This analysis was performed using primary ion beam
fluence below the static limit which is restricting the total amount of material available,
hence limiting sensitivity.

54
Figure 2.3 TOF-SIMS images of a Paramecium sample previously exposed to a 10 µM
cocaine solution. The cocaine image in (a) was produced by creating a two-colour
overlay of the parent cocaine ion [M + H]+ with m/z 304 (the range of counts was 0-1)
and a characteristic fragment m/z 105 (both in red) with water (blue). This image is
compared to overlays of K+ and Na
+ with water in (b) and (c), respectively. The field of
view is 100 × 100 µm2. Reproduced from Colliver et al. 1997.
Figure 2.4 ToF-SIMS images of fusing cells using 200 nm beam spot size. (a) C5H9+:
m/z 69; (b) Phosphocholine: m/z 184; (c): Line scan of m/z 69 intensity across fusion
region and (d) Line scan of m/z 184 intensity across fusion region. Adapted and
reproduced from Ostrowski et al. 2004.

55
Other methods used for enhancing secondary ion yields and hence sensitivity
included silver printing, matrix enhancement and laser post ionisation. Nygren et al.
(2003) and Sjövall et al. (2003) explored the use of silver imprinting to identify and
localise lipid distribution in leucocytes. This involved pressing a clean and etched silver
(Ag) foil against the glass surface covered with cells and once the material was
transferred, the sample was analysed on the Ag surface using ToF-SIMS. This method
offers two advantages; firstly, the sensitivity of the sample is enhanced as high
secondary ion yields are obtained on silver substrate; secondly, an increase in
specificity is also observed due to reduction in fragmentation of the molecular ion
[Sjövall et al., 2003].
In the above two studies, Ag was used as a matrix which although successful,
results in uncontrolled fracturing of cells during imprinting due to the pressure applied.
The SEM images displayed high residues from many cells being transferred when a
high pressure was applied compared to only few cells whose content is visible using
low pressure. As a result, the images of the cells obtained may not be truly
representative of the original sample. Accordingly, the group used an alternative
approach in which Ag was deposited onto the sample [Nygren et al., 2004]. Leucocyte
cells were freeze-dried in ammonium formate and Ag was sputtered onto a layer of cells
using an agar sputtering coater with an argon pressure of 0.08 mbar for 15 s. Following
an analysis with ToF-SIMS, principal components analysis (PCA) was performed
which allowed differentiation between nuclear and non-nuclear regions of the cells.
All of these studies demonstrate that Ag imprinting/depositions is successful in
increasing the yields by the formation of silver cationised species [M+Ag]+. Figure 2.5
56
shows the localisation of phosphocholine and cholesterol to the cells. However on
inspecting the spectrum, the phosphocholine peak m/z 184 is not cationised and
therefore not enhanced. According to Fletcher (2009) the Ag could be suppressing the
signal since it transfers the molecular ion into the [M+Ag]+ species. Furthermore, since
this is static SIMS, it would be expected that the cells are covered with both cholesterol
and phosphocholine in the image acquired, but cholesterol only appears in the
peripheral region and phosphocholine in the nuclear. This raises the question whether
during Ag imprinting the cells are becoming deformed and artefacts into the images are
introduced [Fletcher, 2009].

57
Figure 2.5 ToF-SIMS high mass resolution, positive secondary ion mass spectrum from
cell imprint on silver (100-600 amu, analysis area 100 × 100 µm2). In addition to typical
silver cluster ions, specific signals from phosphocholine (m/z 184) and cationised
cholesterol (m/z 493) are demonstrated. Secondary ion images, m/z 184 (a) and 493 (b)
obtained from silver imprints of glass-adhering leukocytes (PMNLs). The scale
represents relative intensity with white as maximum. Image area; 100 × 100 mm, bar =
20 µm. Arrows indicate spots with low levels of ionisation. Reproduced from Nygren et
al. 2003.
Matrix enhanced (ME) SIMS involves using an organic species as a matrix to
increase the ionisation efficiency of the analyte, similar to MALDI matrix. The effect of
elemental matrices on the atomic yields using SIMS was first studied in late 1970
[Deline et al., 1978], [William, 1982]. At the same time Jonkman and co-workers
explored the use of frozen Argon (Ar) as a matrix to measure small molecules [Jonkman

58
et al., 1978]. Few years later Busch and associate reported an increase in the signals of
quaternary ammonium salt mixed with an ammonium chloride matrix [Busch et al.,
1983]. This was followed by a publication by Gillen et al. (1993) who demonstrated
that by using a frozen glycerol matrix an enhancement in the signal of small
biomolecules can be achieved. ME-SIMS involves using an organic matrix and mixing
it with the analyte at various concentration ratios, resulting in an increase in the signal.
This increase is attributed to two mechanisms. First, the matrix can act as a proton
donor and provides protons for the analytes to become ionised and detected by the mass
spectrometry. The second mechanism, involves the matrix to absorb high energy when
the beam impacts a surface. This energy is transferred to the other molecules during
collisions in the sub-surface region resulting in less fragmentation and high molecular
yields. Thus, the matrix is providing a softer but more efficient desorption and
ionisation of the chemical species under bombardment [Adriaensen et al., 2005]. The
literature shows 2,5-dihydroxybenzoic acid (2,5-DHB) to be the most efficient matrix
and masses up to 10000 Da can now be detected by applying this technique [Jen Wu et
al., 1996], [Altelaar et al., 2005, 2006], [McDonnell et al., 2005]. However, the
drawbacks associated with this technique are that an optimal analyte/matrix mixture has
to be found for a maximum increase in the signal which is effected by the type and the
concentration of the matrix utilized. Also the presence of matrices can cause the relative
ion intensities to change in the ToF-SIMS spectra [Adriaensen et al., 2005].
During the sputtering process a large amount of neutrals are also generated
compared to the secondary ions, resulting in a lot of information being lost. Laser post
ionisation SIMS also known as secondary neutral mass spectrometry (SNMS) involves

59
firing a laser into the sputtered material prior to extraction to ionise the neutrals so they
can be detected in the mass spectrometer. This approach has proved to be successful in
characterising elements and molecules in cells and tissues [Fartmann et al., 2004],
[Arlinghaus et al., 2006]. However, SNMS is a very specific technique in that it will
only enhance yields of particular elements or molecules, as a universal laser set up is
not yet available to ionise all the neutral species generated. Furthermore, it is
particularly useful to ionise and image ultra trace elements within a biological sample
rather than the organics since the laser can cause damage and result in fragmentation of
the organic species [Arlinghaus, 2008].
Although these techniques, ME-SIMS, laser post ionisation and an increase in the
mass of the primary ion beam led to an increase in the secondary ion yields, a further
significant effect was observed with the introduction of cluster ion sources, as
mentioned in Chapter 1 [Andersen et al., 1974], [Wittmaack, 1979], [Johar et al.,1979],
[Blain et al., 1989, 1990]. Cluster projectiles, Aunn+
[Davies et al., 2003] and Binn+
[Kollmer, 2004] were found to give a significant enhancement in the secondary ion
yields for organic species, particularly at high mass compared to the monoatomic ions
and the increase is non-linear with respect to primary particle nuclearity [Benguerba et
al., 1991]. However as described in Chapter 1, these sources too had to be operated
under static conditions which also limits sensitivity.
A major advance in the field of ToF-SIMS has been the development of
polyatomic ion sources [Appelhans et al., 1989], [Kötter et al., 1998], [Gillen, 2000],
predominantly the C60 ion beams [Wong et al., 2003], [Weibel et al., 2003], discussed
in Chapter 1. These ion sources, SF5+
and C60+, provide the advantages of higher

60
secondary ion yields and an enhancement of molecular information, but they also
produce low sub-surface damage [Garrison et al., 2008] allowing ion fluence beyond
the static limit to be used. These beams offer great enhancement in sensitivity,
particularly in cellular imaging as by using a high ion flux it is now possible to access
„voxels‟ rather than pixels, and if there is enough signal available 3D molecular imaging
is possible. However, to fully exploit the use of these beams for chemical imaging at
sub-micrometer lateral resolution, the current ToF technology has to be modified,
discussed later in this chapter [Fletcher et al., 2009, 2010].
2.1.2 Duty Cycle
The duty cycle term refers to the time it takes from firing the primary ion beam
to acquiring a spectrum. On a conventional ToF-SIMS instrument, the primary ion
beam is pulsed for a short time (ns) and the secondary ions generated are extracted with
energies in the order of few keV. The path length of the reflectron employed is 1-3 m
and the secondary ions require flight times in the order of a few hundred microseconds
to reach the detector. Repetition rates cannot exceed 10 kHz and this makes the duty
cycle very low, increasing the duration of the experimental time. The operator is usually
forced to accept a compromise in sensitivity to allow the experiment to finish in a
reasonable time [Fletcher et al., 2009, 2010].
When the beam is tuned for a high lateral imaging experiment it has to be passed
through a smaller aperture to obtain a highly focussed small spot size. This results in a
very low beam current (typically pA) for high brightness LMIS and the electron impact
sources used to produce C60+ ions. Therefore, many ToF cycles are needed to generate

61
images with useful levels of secondary ion signal in each pixel, which makes the
generation of 2D images time consuming. This becomes even more challenging when
the depth profile has to be carried out to generate 3D images as this will take even
longer. An approach that is often adopted on conventional ToF-SIMS instruments is to
acquire a spectrum and then sputter etch the sample by turning the beam on a
continuous mode. Although this approach allows the experiment to be completed on a
reasonable time scale, valuable sample is wasted during the etch cycles, as the current
ToF-SIMS instrumentation does not allow for detection of material during sputtering
[Fletcher et al., 2009, 2010].
2.1.3 Mass Resolution
The duty cycle and the short pulsed primary ion beam can affect the mass
resolution, which is defined as the ability to distinguish between two peaks of similar
masses [Hoffmann et al., 2007].
Where:
M1 = m/z ratio of the first ion
M2 = m/z ratio of the second ion

62
Fundamentally ToF-SIMS is capable of acquiring at a high mass resolution and
accuracy, but the problem arises when one wants to carry out high mass resolution
imaging. The mass resolution is directly related to the length of the primary ion beam
pulse and to maintain high mass resolution, short (<10 ns) pulses are required which
limits spatial resolution. This is because the short pulse will produce an unstable beam
resulting in blurry images being recorded. It is usually preferred to perform imaging at a
high spatial resolution by instantaneously blanking the beam following an impact, rather
than moving it across the sample and use long pulses to obtain a stable spot at each
pixel. As a result, the requirement for a stable spot and rapid acquisition has led to many
experiments being performed with a long pulse length (>50 ns) to acquire spectra, in
which the peaks are only resolved to nominal mass. Therefore, it is not normally
possible to perform analysis at high mass resolution and high spatial resolution at the
same time [Fletcher et al., 2010].
A further constraint arises from the topography variation across electrically
insulating sample because the secondary ions produced are extracted from different
positions at different times in the extraction field. This produces an energy spread which
cannot be compensated by the standard reflectron ToF-analyser. This results in a loss of
mass accuracy and each spectrum has to be calibrated before an image is generated and
even then differences in mass calibration across the image are observed. Variation in
topography presents more problems during 3D analysis where the topography may
change through the depth profile [Fletcher et al., 2010].

63
2.2 Concept and features of the J105 3D Chemical Imager
Fletcher et al. (2008) explain that the best set up for imaging small cells would
be to use a primary ion beam that causes no or minimal sub-surface damage. Further, it
should be easily focussed into a small spot size while at the same time maintaining
reasonable sample current. At present, the C60+ primary ion beam appears to produce
less damage on the sample surface, but an approach is required to compensate for the
low current when it is focussed down to “sub-micrometer diameter” spot sizes. Thus, to
take full advantage of the benefits offered by the polyatomic primary ion beams and to
overcome the limitations on the application of conventional ToF-SIMS instruments to
biological samples, it has been necessary to develop novel instrumental configurations
for the analysis of these samples by ToF-SIMS. Our groups at the University of
Manchester and Winograd group at Penn State have been working in parallel to achieve
this aim and radical changes to the conventional ToF-SIMS have emerged.
The Winograd group adapted a high-performance hybrid quadrupole orthogonal
MALDI instrument (Applied Biosystems Q-Star XL) to explore the combination of
cluster SIMS and MALDI on the same instrumental platform [Carado et al., 2008]. The
Q-STAR XL has been modified to incorporate a 20 keV C60+ primary ion beam to be
used as an alternative to the laser beam, Figure 2.6. The cluster ion source is orientated
at 45° to the sample and operated in continuous mode. The secondary ions produced are
extracted using a flow of nitrogen gas and focussed into a collisionally focusing RF-
only quadrupole before passing through two further quadrupoles. These can either be
employed in RF only mode for standard analysis or used for precursor ion selection and
collisional dissociation in tandem MS mode.
64
A small section of ions generated are pulsed into an orthogonally orientated ToF
spectrometer for mass analysis. As the sputtering process is decoupled from the mass
spectrometry, high mass resolution (m/Δm~14000) is maintained in all modes while
using the primary ion beam in dc mode. The new configuration of the instrument allows
complementary MALDI and SIMS data to be obtained.
Carado et al. (2008) used the modified Q-Star instrument for the analysis of
mouse lung and brain tissues. The authors successfully identified and localised
diacylglyceride (DAG) ions in the lung and phosphocholine (m/z 184) and m/z 439.31 to
the periphery of the mouse brain slice, Figure 2.7. The analysis was completed using a
20 keV C60+ primary ion beam in dc mode and ion dose of 3 × 10
12 ions/cm
2 over an
area of 4.4 × 9.1 mm2. If this experiment was carried out on the conventional ToF-
SIMS instrument using the same ion dose but in pulsed mode it would have taken 2.2
years to complete. Appropriately this study shows the potential of using SIMS for the
analysis of these samples, particularly highlighting the advantages of using primary ion
beam in a dc mode.

65
Figure 2.6 Schematic diagram of the modified QSTAR XL hybrid QqTOF mass
spectrometer. Reproduced from Carado et al. 2008.
Figure 2.7 ToF-SIMS images of selected ions. (a) lung tissue showing the 1-palmitoyl-
2-oleoyl-glycerol ion (m/z+ 577.5), pink and phosphocholine head group (m/z
+ 184)
blue; (b) m/z+ 184 distributed uniformly over the mouse brain cross-section; (c) m/z
+
439.31 localised to the periphery of the tissue slice. Adopted and reproduced from
Carado et al. 2008.

66
However in the prototype instrument the primary ion beam cannot be rastered
and the stage moves in 10 µm steps during imaging experiments, making single cell
analysis impractical. Also due to the needle attached to the nose cone of the C60+, it
cannot be focused to a sub-micrometer spot size. Furthermore, the image acquisition
rate is also limited because until the secondary ions reach the detector the primary ion
source cannot move to the next pixel. Therefore unless the drawbacks of these
technologies are overcome, this instrument is still limited in its ability to perform very
high spatial resolution imaging.
Our group at the University of Manchester took an alternative route and
developed a new ToF-SIMS instrument using a novel methodology of mass
spectrometry in collaboration with Ionoptika Ltd (Southampton, UK) and SAI Ltd
(Manchester, UK) [Fletcher et al., 2008]. This instrument, called the J105 3D Chemical
Imager, has been specifically designed for the analysis of biological samples in 2D and
3D. It allows the analysis to be performed using a dc primary ion beam similar to Q-star
and combines a linear buncher with a harmonic reflectron ToF analyser, Figure 2.8. The
J105 instrument is an ultra-high vacuum system and is more comparable to a
conventional ToF-SIMS instrument than the Q-Star hybrid in terms of sample handling,
ion generation and electrostatic extraction of secondary ions.
A continuous stream of secondary ions is generated from a sample bombarded
with a dc primary ion beam on the J105. This is contrast to conventional SIMS
instruments mentioned above where a pulsed primary ion beam is used to generate a
pulse of secondary ions. This greatly increases the analysis time as the next pulse
cannot start until the secondary ions from the first pulse have been analysed. The

67
secondary ions generated on the J105 are extracted electrostatically and collisionally
cooled in an RF only quadrupole filled with a suitable collision gas (N2) and the
secondary ion stream is further energy filtered by the electrostatic analyser (E.S.A).
This process results in all the ions having energy spread of 100 eV before they are
injected into the linear buncher. The charged particle buncher, Figure 2.9, is
approximately 30 cm long and was invented by SAI Ltd in 2006 for mass spectrometry
instruments such as Gas Chromatography (GC) and MALDI and more recently on the
SIMS instrument [Parr et al., 2006]. It contains a series of evenly spaced electrodes
arranged to generate a shaped electric field. The first buncher fitted on the J105
instrument had 30 plates and later was modified to include 60 electrodes each with an
aperture through which a charged particle passes. An upgrade of the buncher consisting
of 30 plates has been developed at Ionoptika with greatly improved electronic control
and has been recently installed.

68
Figure 2.8 Schematic diagram of the J105 3D Chemical Imager showing the coupling
of the buncher to the harmonic reflectron. Reproduced from Fletcher et al. 2008.
Figure 2.9 A section of secondary ions are bunched in the time focus and accelerated
into reflectron. Reproduced from Fletcher et al. 2008.

69
The buncher is filled with secondary ions for ~90 µs which is controlled by a
blanker while the electric field is held at a 100 V. After ~90 µs the buncher „fires‟ by
applying an instantaneous accelerating field that varies from 7 kV at the back (entrance)
to 1 kV at the front (exit). This process (which takes ~10 µs) accelerates ions at the back
faster than those at the front and ensures all the ions with the same mass reach a focus
point beyond the exit of the buncher but in the same plane as the detector and at the
same time. This creates a time focus at the entrance of the ToF mass analyser and the
mass resolution is now dependent on the width of this tight packet of secondary ions
and is independent of sample topography and sputtering events similar to the Q-star
instrument. The short time primary ion pulse that determines the mass resolution in the
conventional SIMS mentioned above has been replaced by the focus of this tight packet
of ions leaving the buncher. Once the ions have been emitted, the field is turned off in
the buncher and it is filled again with the secondary ions. The cycle repeats every 100
µs and a duty cycle of 90% is obtained in terms of transmission for mass 500 amu and
above. The ions travelling at a faster speed are reduced in transmission in line with the
following equation [Hill et al., 2010]:
l = length of the buncher
V = transport voltage
t = buncher filling time

70
This arrangement results in high transmission for molecular ions while
sacrificing transmission of fragment and elemental ions. Due to the acceleration in the
buncher the ions now have a 6 keV energy spread and a harmonic field ToF reflectron is
required to compensate for this energy spread. In a normal ToF reflectron the ions are
accelerated by an electric field of a known strength, which results in all the ions having
the same kinetic energy. Thus, the time it takes for the ions to travel down the flight
tube is determined by the velocity, which in turn depends on the mass to charge ratio.
However, this design does not work with the buncher since the ions leaving the buncher
have a very high energy spread (6 keV). This cannot be compensated by the normal ToF
reflectron and a harmonic type reflectron is required in which the path of the ions is
only dependent on the mass to charge ratio and not on the kinetic energy. The ions
undergo half a period of simple harmonic motion in the reflectron before impacting a
detector with the same time spread as the focus from the buncher.
The instrument is currently delivering mass resolution of m/Δm ~ 6000 at 500
amu but the upgrade referred to above is expected to produce m/Δm in excess of
10,000. Hence by decoupling the sputtering mechanism from the mass spectrometry, an
imaging instrument has been developed that enables the primary ion beam in dc mode
to be exploited, together with the parallel mass detection and a mass range of the ToF
analyser. Furthermore, for the first time it is now possible to carry out nanoscale
imaging using ToF-SIMS without sacrificing mass resolution. In addition, mass
calibration of each spectrum is no longer required and a mass accuracy of 5 ppm is
observed.

71
The instrument is fitted with 40 kV C60n+
and 40 kV Aun+ ion guns. The C60 ion
beam operates in a dc mode and can be focused down to 200 nm, Table 2.1, and is
capable of producing pure 120 keV C603+
using a Wien filter. The gold ion gun operates
in a collimated or crossover mode and can be focused to deliver ultimate spot sizes of
50 nm, Table 2.2 and Table 2.3.
Table 2.1 Current and spot size of the 40 keV C60+ primary ion beam available on
different apertures, provided by Ionoptika Ltd.
Aperture (µm) Current (nA) Spot size (µm)
1000 1.056 40
300 0.100 15
100 0.045 08
100 0.005 03
30 0.001 0.8
30 0.0006 0.5
Table 2.2 Current and spot size of the 40 keV Au3+ primary ion beam available on
different apertures, provided by Ionoptika Ltd.
Aperture (µm) Current (nA) Spot size (nm)
1000 > 90 < 400
100 > 0.008 < 150
30 > 0.001 < 100

72
Table 2.3 Current and spot size of the 40 keV Au+ primary ion beam available on
different apertures, provided by Ionoptika Ltd.
Aperture (µm) Current (nA) Spot size (nm)
1000 > 2.00 < 500
300 > 1.00 < 300
100 > 0.15 < 150
30 > 0.015 < 100
Figure 2.10 Schematic of J105 sample handling system with main components Transfer
Arm, Lock, Z lift, XYZ stage. Reproduced from the Sample Handling Manual courtesy
of Ionoptika.

73
Figure 2.11 Z lift to show the three tiers to hold three sample stubs. Reproduced from
the Sample Handling Manual courtesy of Ionoptika.
One of the difficulties encountered when analysing biological samples using
ToF-SIMS is their handling and manipulation under a high vacuum. The J105 has an
automated sample handling system which allows the sample to be inserted and
transferred easily. It consists of three parts, a Z lift, a transfer arm in the Preparation
Chamber and XYZ stage in the Surface Analysis Chamber (SAC), Figure 2.10.
The Z-lift is a vertical stage inside the Preparation Chamber that moves up and
down only. To insert the sample the Z-lift is brought up into the lock position where it
seals against the lid of the Preparation Chamber so that the load lock can be vented. The
sample is placed on the top tier and the lock is pumped out using a rotary pump and
then a fine pumping line connected to the Preparation Chamber. Once a pressure of

74
1 × 10⁻⁵
mbar has been achieved, the sample is transferred down into the Preparation
Chamber. The sample handling system is designed so that it can accommodate three
samples stubs in the Preparation Chamber but only the top one can be heated or cooled,
Figure 2.11. A specifically designed steel plate is used as a substrate and is placed on
the copper sample holder which is 40 mm long × 30 mm wide × 12 mm thick, Figure
2.12. Once the sample has been pumped down and pressure of 1 × 10⁻⁶
mbar has been
achieved in the Preparation Chamber the sample is transferred to the XYZ stage in the
SAC using a transfer arm. The transfer arm can also be used to transfer sample stubs
between different tiers of the Z-lift and although it is not heated or cooled it transfers
the sample rapidly enough to maintain the temperature required. The XYZ stage is the
analysis stage in the SAC and the height of this can be adjusted through computer
control to accommodate different sample thicknesses.
The instrument is fitted with two cameras, one is on Load Lock, where the
sample is inserted but focuses on the sample surface when the Z-lift is lowered into the
Preparation Chamber. This provides a complete view of the sample stub and the picture
can be saved and imported into the sample handling software and used to navigate
around the sample. The second camera is fitted on the SAC, showing the area of
analysis and it only focuses when the sample is at the correct height.
The SED imaging system controls the rastering of the ion beam and is used to
acquire and save a secondary electron microscopy (SEM) image of the sample. It is
used to measure the sample current into a Faraday cup on sample stub as well as to tune
the focus of the ion guns in preparation for imaging experiments.

75
The instrument also incorporates an electron gun (10 eV to 1 keV) used for
neutralising the sample. As a sample surface is bombarded with a positive primary ion
beam the potential of the surface increases due to the positive charge input and emission
of secondary electrons. The sample becomes charged and results in a loss of secondary
ions because the kinetic energy of the emitted ions is so large that it is not accepted by
the analyser. In order to counteract this charging an electron flood gun is used which
bombards the surface with low energy electrons. These electrons are attracted to the
region of positive charge on the surface and the potential of the surface returns back to
neutral. It is important to select a correct dose of electrons because if it is too low the
sample surface will not be neutralised and if it is too high it can damage the surface
[Gilmore et al., 2002].
Analysis of biological samples including cells and tissue using SIMS is an
important research area of many labs. Sample preparation, discussed in detail in chapter
5 has a significant effect on the results obtained. The literature shows that the freeze-
fractured frozen-hydrated technique to be successful to some degree in maintaining the
sample‟s physical and chemical morphology [Colliver et al., 1997], [Strick et al., 2001].
However, frozen-hydrated and freeze-fractured samples are not routinely analysed on
ToF-SIMS instruments due to the complexity of the procedure.
The automated sample handling facility on the J105 allows these experiments to
be carried out more routinely. Both the Z lift and the XYZ stage are each connected to
separate liquid nitrogen (LN2) dewers containing copper coils. During the frozen-
hydrated experiment, LN2 is poured into these dewers and nitrogen gas is passed
through the coils, which in turn passes through the sample carriers and then out of the

76
instrument and vented to the atmosphere. As the gas passes through the coils it is cooled
close to the LN2 temperature and this transfer of heat is then passed to the sample
carrier. The Z lift and XYZ stage are designed to be temperature controlled between
95 K to 700 K and to achieve this they are fitted with a PT100 sensor. The temperature
control unit allows the operator to control and measure the temperature accurately and
efficiently in the Preparation Chamber in the Z lift and XYZ stage in the SAC. The
sample stubs are also fitted with a PT100 sensor which allows one to measure the
sample temperature, Figure 2.12. This was previously not possible on our conventional
ToF-SIMS instrument, the Bio-ToF since a high voltage is applied to the stage during
an acquisition which hinders the measurement of the temperature of the sample. Figure
2.13 shows the temperature plot acquired during testing of the instrument.
Figure 2.12 Sample holder for the J105 made up of copper with dimensions of 40 mm
long × 30 mm wide × 12 mm thick. Reproduced from the Sample Handling Manual
courtesy of Ionoptika.

77
Figure 2.13 Temperature plot acquired during cooling the instrument. Key: blue-
temperature measured on the Z-lift in the Preparation Chamber; pink- temperature
measured on the stage in the Surface analysis Chamber (SAC). A: The dewers were
refilled again for cooling; B: Warming up; C: Cooling again.
The instrument also has a novel facility for carrying out automated freeze-
fracture of biological sample in situ using a special device called the “mousetrap”,
Figure 2.14. The sample is sandwiched between the two metal plates and rapidly frozen
in liquid nitrogen-cooled propane. The frozen sample is then transferred to a liquid
nitrogen flask containing the freeze-fracture device and the sample is mechanically
fixed on it while under nitrogen. The sample is transferred to an argon purged glove box
fitted above the sample insertion flange. The glove box is purged for 10 minutes prior to

78
sample transfer to prevent water deposition on the sample and on the pre-cooled sample
holder on the Z-lift which is exposed during sample insertion. Once inserted in the lock
position and pumped, the sample is transferred to the Preparation Chamber and the
sample is fractured in situ by pushing the trigger on the device. This action
automatically releases the top plate of the steel which flips backwards fracturing the
sample. Unlike previous vacuum freeze fracture devices, the two surfaces of material
are retained and available for analysis. The fractured sample is transferred to the pre-
cooled analysis stage and cells are analysed in a frozen-hydrated state. The instrument
also incorporates a cryo-shield fixed above the sample Preparation Chamber to
minimise re-condensation of water vapour once the sample is fractured. Using this
device, the cold sample is never exposed to damp atmosphere and it is already cold
when it enters the vacuum system, avoiding long cooling times or sample degradation
during pump down. This facility combined with the instrument‟s ability to analyse
simultaneously at high spatial resolution and high mass resolution provides a powerful
tool for tissue analysis and even individual cell analysis.

79
Figure 2.14 Mousetrap freeze-fractured device as developed by Ionoptika Ltd for the
J105 instrument. Reproduced from the Sample Handling Manual courtesy of Ionoptika.
A further requirement of the instrument was its ability to perform tandem MS/MS
on pure and complex samples such as cells to help identify the unknown peaks routinely
observed during the analysis of these samples. In the J105 MS/MS analysis is
performed in ToF-ToF configuration. The ions leaving the buncher pass through a cell
containing a suitable collision gas such as nitrogen, helium or argon where they are
fragmented. Since the collision takes place after the buncher and as the collision energy
is in the range of 1-7 kV it causes all of the ions to fragment. However, as the collision
takes place in a field free region of the instrument the parent ion and the associated
daughter ions continue to travel at the same speed and a timed ion gate is used to select
the parent ion of interest along with its daughter ions. These are passed into to the ToF
analyser for the analysis.

80
The analysis software was developed by SAI Ltd and is similar to that provided
for their MALDI instrument. It allows tuning the instrument, switching from positive to
negative mode as well as saving presets. Further, the software allows the acquisition of
a single tiled image or a series of tiled images for depth profiling experiments as well as
multiple tiled images for a large area analysis required for tissue imaging. The rate at
which the data is generated using the J105 is extremely high and new approaches for
data processing visualisation and manipulation are required, discussed further in
Chapter 5.
In summary, the J105 3D Chemical Imager instrument is able to fully exploit the
properties of polyatomic ion beams while providing high mass resolution imaging using
a continuous primary ion beam, increasing the duty cycle and improving the quality of
the mass spectra. The increase in duty cycle allows depth profile and 3D imaging
experiments to be carried out without the interleaved analyse/etch method, thus
maximising sensitivity. The increase in the acquisition rate also aids in large area
imaging of tissue sections.

81
References
Adriaensen, L.; Vangaever, F.; Lenaerts, J.; Gijbels, R. Matrix-enhanced secondary
ion mass spectrometry:the influence of MALDI matrices on molecular ion yields of
thin organic films. Rapid Communications in Mass Spectrometry (2005), 19, 1017-
1024
Altelaar, A. F. M.; Klinkert, I.; Jalink, K.; de Lange, R. P. J.; Adan, R. A. H.;. Heeren,
R. M. A.; Piersma, S. R. Gold-Enhanced Biomolecular Surface Imaging of Cells and
Tissue by SIMS and MALDI Mass Spectrometry. Analytical Chemistry (2006), 78,
734-742
Altelaar, A. F. M.; Minnen, J. V.; Jiménez, C. R.; Heeren, R. M. A.; Piersma, S. R.;
Direct Molecular Imaging of Lymnaea Stagnalis Nervous Tissue at Subcellular
Spatial Resolution by Mass Spectrometry. Analytical Chemistry (2005), 77, 735-741
Andersen, H. H.; Bay, H. L. Nonlinear effects in heavy-ion sputtering. Journal of
Applied Physics (1974), 45 (2), 953-954
Appelhans, A. D.; Delmore, J. E. Comparison of polyatomic and atomic primary
beams for secondary ion mass spectrometry of organics. Analytical Chemistry
(1989), 61 (10), 1087-1093
Arlinghaus, H. F.; Kriegeskotte, C.; Fartmann, M.; Wittig, A.; Sauerwein, W.; Lipinsky,
D. Mass spectrometric characterization of elements and molecules in cell cultures
and tissues. Applied Surface Science (2006), 252, 6941–6948
Arlinghaus, H.F. Possibilities and limitations of high-resolution mass spectrometry
in life science. Applied Surface Science (2008), 255, 1058-1063
Benguerba, M.; Brunelle, A.; Della-Negra, S.; Depa UW, J.; Joret, H.; Le Beyec, Y.;
Blain, M. G.; Schweikert, E. A.; Assayag, G. B.; Sudraud, P. Impact of slow gold
clusters on various solids : nonlinear effects in secondary ion emission. Nuclear
Instruments and Methods in Physics Research (1991), B62, 8-22
Blain, M. G.; Della-Negra, S.; Joret, H.; Le Beyec, Y.; Schweikert, E. A.
Secondary-ion yields from surfaces bombarded with keV molecular and cluster
ions. Physical Review Letters (1989), 63 (15), 1625-1628
Blain, M. G.; Della-Negra, S.; Joret, H.; Le Beyec, Y.; Schweikert, E.A.
(1990) J. Vac. Sci. Technol., 8, 2265
Busch, K.L.; Hsu, B.H.; Xie, Y.-X.; Cooks, R.G. Matrix effect in secondary ion mass
spectrometry. Analytical Chemistry (1983), 55 (7) 1157-1160

82
Carado, A.; Passarelli, M. K.; Kozole, J.; Wingate, J. E.; Winograd, N.; Loboda, A. V.
C60 secondary ion mass spectrometry with a hybrid-quadrupole orthogonal time-
of-flight mass spectrometer. Analytical Chemistry, (2008), 80 (21), 7921-7929
Carado, A.; Kozole, J.; Passarelli, M.; Winograd , N.; Loboda, A.; Bunch, J.; Wingate,
J.; Hankin, J.; Murphy, R. Biological tissue imaging with a hybrid cluster SIMS
quadrupole time-of-flight mass spectrometer. Applied Surface Science (2008), 255,
1572–1575
Colliver, T. L.; Brummel, C. L.; Michaeleen L. Pacholski, M. L.; Swanek, F. D.; Ewing,
A. G.; Winograd, N. Atomic and Molecular Imaging at the Single-Cell Level with
TOF-SIMS. Analytical Chemistry (1997), 69, 2225-2231
Davies, N.; Weibel, D. E.; Blenkinsopp, P.; Lockyer, N.; Hill, R.; Vickerman, J. C.
Development and experimental application of a gold liquid metal ion source.
Applied Surface Science (2003), 203-204, 223-227
Deline, V.R.; Katz, W.; Evans, Jr.; C.A.; Williams, P. Mechanism of the SIMS matrix
effect. Applied Physics Letters (1978), 33(9), 832-835
Fartmann, M.; Kriegskotte, C.; Dambach, S.; Wittig, A.; Sauerwein, W.; Arlinghaus, H.
F. Quantitative imaging of atomic and molecular species in cancer cell cultures
with TOF-SIMS and Laser-SNMS. Applied Surface Science (2004), 428, 231–232
Fletcher, J.S. Cellular imaging with secondary ion mass spectrometry. Analyst
(2009), 134, 2204–2215
Fletcher, J.S.; Henderson, A. Biddulph, G.X.; Vaidyanathan, S.; Lockyer, N.P.;
Vickerman, J.C. Uncovering new challenges in bio-analysis with ToF-SIMS. Applied
Surface Science (2008), 255, 1264–1270
Fletcher, J.S.; Lockyer, N.P.; Vickerman, J.C. A news SIMS paradigm for 2D and 3D
molecular imaging of bio-systems. Analytical and Bioanalytical Chemistry (2010),
396, 85-104
Fletcher, J.S.; Lockyer, N.P.; Vickerman, J.C. Developments in molecular SIMS
depth profiling and 3D imaging of biological systems using polyatomic primary
ions. Mass Spectrometry Reviews (2010)
Fletcher, J.S.; Rabbani, S.; Henderson, A.; Blenkinsopp, P.; Thompson, S.P.; Lockyer
N. P.; Vickerman, J. C. A new dynamic in mass spectral imaging of single biological
cells. Analytical Chemistry, (2008), 80 (23), 9058-9064
Garrison, B.J.; Postawa, Z. Computational view of surface based organic mass
spectrometry. Mass Spectrometry Reviews (2008), 27 (4), 289-315

83
Gillen G. In Proceedings of the International Conference on Microbeam Analysis, 8-15
July 2000, Institute of Physics Conference Series (2000), 165, 339
Gillen, G.; Hues, S.M. Doped gelatin films as a model matrix for molecular
secondary ion mass spectrometry studies of biological soft tissue. Journal of the
American Society for Mass Spectrometry (1993), 4(5), 419-423
Gilmore, I. S.; Seah, M.P. Electron flood gun damage in the analysis of polymers
and organics in time-of-flight SIMS. Applied Surface Science (2002), 187 (1-2), 89-
100
Hill, R.; Blenkinsopp, P.; Thompson, S.P.; Fletcher, J.S.; Vickerman, J.C; Surface
Interface Analysis (2010), submitted
Hoffmann, E.; Stroobant, V. Mass Spectrometry Principles and Applications. John
Wiley and Sons Ltd, Chichester 2007
Jen Wu, K.; Odom, R.B. Matrix-Enhanced Secondary Ion Mass Spectrometry: A
Method for Molecular Analysis of Solid Surfaces. Analytical Chemistry (1996), 68,
873-882
Johar, S. S.; Thompson, D. A. Spike effects in heavy-ion sputtering of Ag, Au and Pt
thin films. Surface Science, (1979) 90 (2), 319-330
Jonkman, H.T.; Michl, J.; King, R.N.; Andrade, J.D. Low-temperature secondary
positive ion mass spectrometry of neat and argon-diluted organic solids. Analytical
Chemistry (1978), 50 (14), 2078-2082
Kollmer, F. Cluster primary ion bombardment of organic materials
Applied Surface Science (2004), 231-232, 153-158
Kötter, F.; Benninghoven, A. Secondary ion emission from polymer surfaces under
Ar+, Xe
+ and SF
+5 ion bombardment. Applied Surface Science (1998), 133 (1-2), 47-
57
Lorey II, D.R.; Morrison, G.H.; Chandra, S. Dynamic secondary ion mass
spectrometry analysis of boron from boron neutron capture therapy drugs in co-
cultures: Single-cell imaging of two different cell types within the same ion
microscopy field of imaging. Analytical Chemistry (2001), 73 (16), 3947-3953
McDonnell, L.; Piersma, S. R.; Altelaar, A. F. M.; Mize, T. H.; Luxembourg, S .L.;
Verhaert, P. D. E. M.; Minnen, J.V.; Heeren, R.M.A. Subcellular imaging mass
spectrometry of brain tissue. Journal of Mass Spectrometry (2005), 40, 160–168

84
Nygren, H.; Eriksson, C.; Malmberg, P.; Sahlin, H.; Carlsson, L.; Lausmaa, J.; Sjövall,
P. A cell preparation method allowing subcellular localization of cholesterol and
phosphocholine with imaging TOF-SIMS. Colloids and Surfaces B: Biointerfaces
(2003), 30, 87-92
Nygren, H.; Malmberg, P. Silver deposition on freeze-dried cells allows subcellular
localization of cholesterol with imaging TOF-SIMS. Journal of Microscopy (2004),
215, 156–161
Ostrowski, S. G.; Van Bell, C. T.; Winograd, N.; Ewing, A. G. Mass Spectrometric
Imaging of Highly Curved Membranes During Tetrahymena Mating. Science
(2004), 305, 71-73
Parr, V.C.; Thompson, S.P.; Mills, M.D. Charged Particle Buncher. United State
Patent, May 2006.
Sjövall, P.; Lausmaa, J.; Nygren, H.; Carlsson, L.; Malmberg, P. Imaging of
Membrane Lipids in Single Cells by Imprint-Imaging Time-of-Flight Secondary
Ion Mass Spectrometry. Analytical Chemistry (2003), 75, 3429-3434
Strick, R.; Strissel, P.L.; Gavrilov, K.; Levi-Setti, R. Cation-chromatin binding as
shown by ion microscopy is essential for the structural integrity of chromosomes.
Journal of Cell Biology (2001), 155 (6), 899-910
The Sample Handling Manual by Ionoptika (private communication)
Weibel, D.; Wong, S.; Lockyer, N.; Blenkinsopp, P.; Hill, R.; Vickerman, J.C.
A C60 primary ion beam system for time of flight secondary ion mass
spectrometry: Its development and secondary ion yield characteristics. Analytical Chemistry (2003), 75 (7), 1754-1764
Williams, P. On mechanism of sputtered ion emission. Applications of Surface
Science (1982), 13 (1-2), 241-259
Winograd, N. The magic of cluster SIMS. Analytical Chemistry (2005), 77 (7), 142A-
A149A
Wittmaack, K. Secondary-ion emission from silicon bombarded with atomic and
molecular noble-gas ions. Surface Science (1979), 90 (2), 557-563
Wong, S.C.C.; Hill, R.; Blenkinsopp, P.; Lockyer, N.P. Weibel, D.E.; Vickerman, J.C.
Development of a C60+ ion gun for static SIMS and chemical imaging.
Applied Surface Science (2003), 203-204, 219-222

85
3 Characterization of the J105 3D Chemical Imager
3.1 Introduction
The new instrument, the Ionoptika J105 3D Chemical Imager, was delivered in
March 2008 and installed at the University of Manchester by engineers from Ionoptika,
SAI and research associate J.S. Fletcher in the Vickerman group. This Chapter
discusses the current performance of the J105 for the analysis of organic samples with
respect to a conventional ToF-SIMS instrument, the BioToF [Braun et al., 1998].
Further, the instrument‟s ability to perform tandem MS is also explored followed by a
sensitivity test to determine the lowest concentration of a compound that produces a
peak.
Once in operation, the instrument was tuned using an inorganic standard,
caesium iodide (CsI), typically used in SIMS to study ion cluster formation and
emission [Honda et al., 1978], [Barlak et al., 1981], [Ens et al., 1983]. Since it is
relatively stable under bombardment by the primary ion, it is commonly used for tuning
and calibration of the SIMS instruments. The behaviour of CsI cluster formation has
also been investigated by fast atom bombardment (FAB) tandem MS [Baldwin et al.,
1983].
The analysis of CsI on the J105 was performed by using a 20 keV C60+ primary
ion beam in a dc mode. Figure 3.1 shows the spectra of CsI clusters (Csn+1In)+
with the
main peaks [Cs]+ m/z 132.905 and [Cs2I]
+ m/z 392.715 used for tuning the quadrupole,
electrostatic analyser (E.S.A) and the buncher voltages to obtain the maximum counts
per ion impact.

86
Figure 3.1 ToF-SIMS spectrum of CsI acquired using 20 keV C60+ primary ion beam
over an area of 500 × 500 µm2 with 32 × 32 pixels and ion fluence of 1 × 10
13 ions/cm
2.
3.2 Comparison between the J105 and the BioToF
3.2.1 Experimental
Thick films of arginine, cholesterol and a tetrapeptide (Glycine-Glycine-
Tyrosine-Arginine) (GGYR) were prepared by using dried droplets on Si wafers to
obtain a fractional coverage of 1. Static surface spectra of these samples were acquired
on the J105 using a 20 keV C60+ primary ion beam (110 pA) with 32 × 32 pixels over an
area of 500 × 500 µm2 covering a mass range of 0-1200 amu. The BioToF data,

87
provided by A. Piwowar for comparison, was also acquired under static conditions
using a 20 keV C60+ ion beam.
3.2.2 Results and Discussion
The standard spectra acquired on the J105 shows the current performance of the
instrument which changes with tuning of the voltages or any upgrade on the instrument.
Arginine is a basic amino acid with a monoisotopic molecular mass of 174.11 g/mol,
and empirical formula C6H14N4O2, Figure 3.2. Following bombardment with a primary
ion beam, arginine forms a molecular ion [M+H]+ at m/z 175.119 with diagnostic
fragment ions at m/z 158.093 formed due to loss of NH3, m/z 130.098 an immonium ion
and m/z 112.087 formed by loss of NH3 from ion at m/z 129.114 shown in Figure 3.3
and 3.4. The formation of the fragment ions of arginine are discussed later in this
chapter.
Figure 3.2 The chemical structure of arginine, C6H14N4O2, monoisotopic mass 175.11
g/mol.

88
Figure 3.3 ToF-SIMS spectrum of arginine acquired on the J105 with 20 keV C60+ at
ion dose of 1 × 10¹³
ions/cm2.
Figure 3.4 ToF-SIMS spectrum of arginine acquired on the BioToF with 20 keV C60+ at
ion dose of 1 × 10¹³
ions/cm2.

89
Cholesterol is a steroid with a monoisotopic molecular mass of 386.35 g/mol,
and empirical formula C27H46O, Figure 3.5. It is also classed as a sterol due to the OH
group which gives it an amphiphilic character. It is highly abundant in the cell
membrane where it helps to maintain the membrane permeability as well as play a key
role in assisting cells to communicate with each other. It is also present in the
membrane of other organelles such as mitochondria and endoplasmic reticulum.
Following an impact with a primary ion beam, cholesterol forms a pseudo-molecular
ion [M-H]+
m/z 385.347 and a diagnostic fragment ion at m/z 369.352 formed by a loss
of OH, Figure 3.6 and Figure 3.7.
Figure 3.5 The chemical structure of cholesterol, C27H46O, monoisotopic mass 386.35
g/mol.
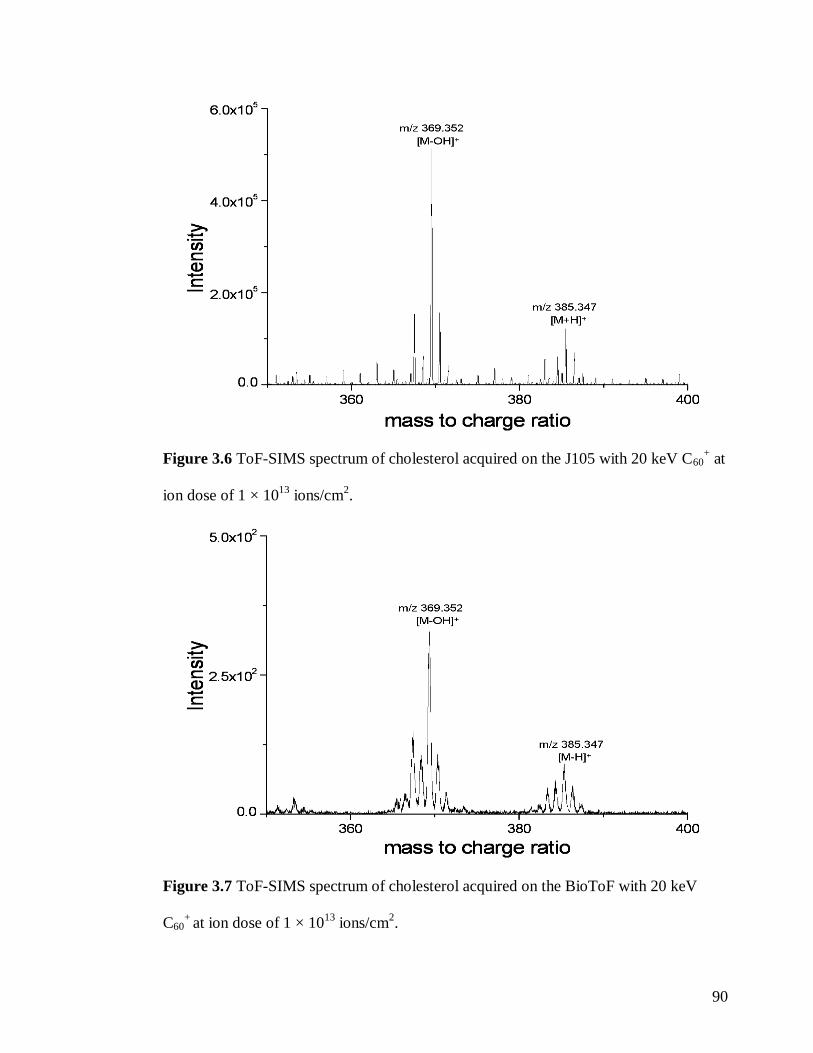
90
Figure 3.6 ToF-SIMS spectrum of cholesterol acquired on the J105 with 20 keV C60+ at
ion dose of 1 × 10¹³
ions/cm2.
Figure 3.7 ToF-SIMS spectrum of cholesterol acquired on the BioToF with 20 keV
C60+
at ion dose of 1 × 10¹³
ions/cm2.

91
The tetrapeptide consists of four amino acids Glycine-Glycine-Tyrosine-
Arginine (GGYR) and has a monoisotopic mass of 451.23 g/mol, and empirical formula
C19H29N7O6, Figure 3.8. The mechanism for the formation of fragment ions from a
peptide was first devised by Roepstorff and Fohlman in 1984 which was later modified
by Johnson and co-workers in 1987. The scheme for the formation of fragment ions is
shown in Figure 3.9. The authors‟ show that a peptide can fragment to give ions classed
as a, b or c if the charge is retained on the N terminal fragment. However, if the charge
is preserved on the C terminal then the ions are classified as x, y or z ions, show in
Figure 3.10 [Roepstorff et al., 1984], [Johnson et al., 1987]. The molecular ion [M+H]+
of the peptide is clearly visible at m/z 452.226 which fragments to produce many
characteristics ions, Figure 3.11 and Figure 3.12. Following the fragmentation
mechanism of a peptide in Figure 3.9 and Figure 3.10, the tetrapeptide (GGYR), Figure
3.8, produces numerous fragments shown in Table 3.1.
Figure 3.8 The chemical structure of the tetrapeptide (GGYR), C19H29N7O6,
monoisotopic mass 451.23 g/mol.

92
Figure 3.9 Scheme for the formation of fragment ions in a peptide as suggested by
Roepstorff et al. 1984 and Johnson et al. 1987.
Figure 3.10 Structures of the charged sequence fragment ion, as suggested by
Roepstorff et al. 1984 and Johnson et al. 1987.
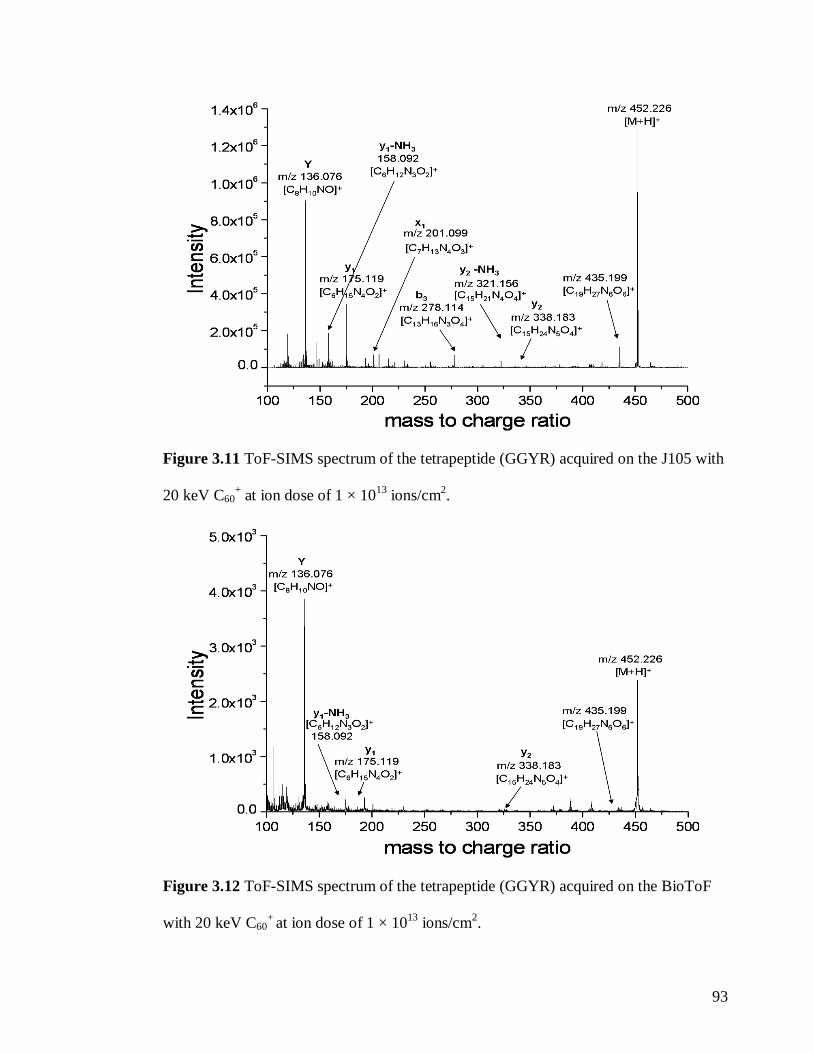
93
Figure 3.11 ToF-SIMS spectrum of the tetrapeptide (GGYR) acquired on the J105 with
20 keV C60+ at ion dose of 1 × 10
13 ions/cm
2.
Figure 3.12 ToF-SIMS spectrum of the tetrapeptide (GGYR) acquired on the BioToF
with 20 keV C60+
at ion dose of 1 × 10¹³
ions/cm2.

94
Table 3.1 Shows the fragment ions observed on the ToF-SIMS MS spectrum of the
tetrapeptide (GGYR).
Ion Formula m/z
[M+H]+
[C19H30N7O6]+
452.226
[M+H]+-NH3 [C19H27N6O6]
+ 435.199
y2 [C15H24N5O]+
338.183
y2- NH3 [C15H21N4O4]+ 321.156
x1 [C7H13N4O3]+ 201.099
y1 [C6H15N4O2]+ 175.119
y1-NH3 [C6H12N3O2]+ 158.092
Y [C8H10NO]+
136.076
On comparison of the surface spectra of arginine, cholesterol and the
tetrapeptide (GGYR) acquired on the J105 and on the BioToF, it can be seen that
similar peaks are detected on both instruments. However, the intensities of these peaks
vary with higher intensities observed on the J105, Figure 3.3, as compared to with the
BioToF, Figure 3.4. Further, the intensity of fragment ions compared to the molecular
ion is also different and the intensity ratio of the fragment ions to the molecular ion in
the low mass region (0-150) is higher on the BioToF, Figure 3.12, in contrast to the
J105, Figure 3.11. There are number of factors which can affect the measured secondary
ion yields in ToF-SIMS. These include the projectile used, the nature of the sample
surface and the transmission of the instrument. With regards to the projectile, the yields
can fluctuate with the energy, mass and angle of incidence of the projectile [Miyayama
et al., 2008], [Kozole et al., 2008]. The nature of the sample can also affect the yields, a

95
thick layer of organic film will produce different yields to a thin layer [Fletcher et al.,
2006]. The same ion beam type at the same impact energy was used on both instruments
to look at similar samples thus, allowing comparisons to be made that result from the
difference in instrument design and operation only. On the J105, a sample is bombarded
with a dc primary ion beam which produces a continuous stream of secondary ions,
increasing signal levels for the samples where the use of C60+ prevents damage
accumulation. However, on the BioToF, a pulsed primary ion beam generates secondary
ions which have to be detected before the beam can strike again. Hence, the BioToF has
a much lower duty cycle and experiments are normally performed under static
conditions even when using C60+ primary ion beam.
The ratio of fragment ions to the molecular ion is low in the low mass range on
the J105 as compared to the BioToF, caused by reduced transmission of low mass ions
on the J105. The J105 instrument is more complex, it requires the secondary ions to
pass through a number of stages before they can be detected. On the BioToF, the ions
leaving the surface are extracted directly into the flight tube to the detector. However,
on the J105 the ions leaving the surface are extracted and then decelerated as they enter
an RF only quadrupole where they are collisionaly cooled and then subsequently energy
filtered by the E.S.A, described in detail in Chapter 2. This results in all the ions having
100 eV energy when they enter the buncher. Once the buncher is filled, it „fires‟ by
applying an instantaneous accelerating field of 7 kV at the entrance dropping down to 1
kV at the exit producing a tight bunch of ions, referred to as a time focus, at the
entrance of the reflectron. Since all the ions leaving the buncher now have an energy

96
spread of 6 keV they are analysed using a quadratic field reflectron [Fletcher et al.,
2008].
Thus, there are two critical stages on the J105 which can effect the transmission
of low mass ions; the collisional cooling quadrupole and the buncher. For example, if
the quadrupole is only optimised for high mass ions then the ions with low mass will
lose so much energy during collisions that they become motionless. These ions can no
longer be extracted to the E.S.A and are lost. Therefore, it is vital to set the collision cell
for an „optimal mass‟ for maximum transmission [Thompson. 2006]. During the
acquisition of the above data set, the quadrupole was optimised for the detection of the
molecular ion for each compound resulting in low transmission of low mass ions.
The effect of the buncher on transmission is fundamental and part of the
instrument‟s design. All the ions entering the buncher have the same energy, 100 eV, so
the ions with low mass will move faster as determined by their floating velocity which
is proportional to the reciprocal of root mass. Thus, if ions with mass of 500 amu are
filling the buncher, then the ions with mass of 50 amu will approximately have 3 times
the velocity and will overfill the buncher and are lost. Also, the transmission of low
mass ions alters with respect to operating the instrument at 5 kHz or 10 kHz. If the
analysis is performed at a low mass <650 amu, the instrument operates at 10 kHz in
which the transmission of the low mass ions is 20% with respect to transmission the
high mass ions. In contrast, if the analysis is performed at 5 kHz, the transmission of the
low mass ions will fall to 10% with respect to transmission the high mass ions
[Thompson. 2006]. During the acquisition of the above data set, the mass range was set

97
to 0-1200 amu causing the transmission of low mass ions to fall as the instrument was
operating at 5 kHz.
The signal to noise ratio defined as signal power to noise power corrupting the
signal is larger on the J105 as compared to the BioToF, outlined in Table 3.2.
Furthermore, since the mass resolution is greater on the J105, the peaks are better
resolved and a peak at every mass is detected. This is not attainable on the BioToF as
shown on Figure 3.12 where the peak at m/z 338.183 is merged with other peaks and is
not distinguishable, whereas on the J105 spectrum it is clearly resolved, Figure 3.11.
Table 3.2 Signal to noise levels on the J105 and the BioToF.
m/z Signal to noise level on
J105
Signal to noise level on
BioToF
175.119 5272 47
136.076 978 92
452.226 1500 65

98
3.2.3 Conclusion
From the data acquired, it is shown that higher signal levels are obtained on the
J105 as compared to the BioToF. Although there is a drawback of loss in transmission
for low mass ions, the J105 offers many more advantages, higher sensitivity, higher
mass detection and an increase in duty cycle which allows depth profiling and 3D
molecular imaging to be performed on a reasonable time frame. In addition, the signal
to noise ratio is greater on the J105 in comparison to the BioToF allowing the real peaks
to be distinguished from background noise. Furthermore, due to higher mass resolution
on the J105, the peaks are better resolved, one of the foremost requirement of sub-
cellular imaging.

99
3.3 Tandem MS
Tandem mass spectrometry (MS/MS) has become an extremely valuable tool in
biochemical research to elucidate the structure of unknown compounds, particularly in
determining protein and nucleotide sequences. It involves two stages of mass analysis,
Figure 3.13. The precursor ion is selected in the first mass analyser and focused into a
collision region where it collides with inert gas atoms or molecules causing the
precursor ion‟s translational energy to be converted into an internal energy. This results
in an unstable excited precursor ion which fragments into product/daughter ions in a
process known as the „collision induced dissociation‟ (CID) also referred to as „collision
activated dissociation‟ (CAD). The product ions are analysed in the second mass
analyser and a daughter spectrum is produced. It is vital to choose an inert gas that
prevents a reaction between ions and the gas molecules and causes little scattering of
the fragments. The most common gases used are helium (He), Xenon (Xe) and argon
(Ar) since they are nonreactive, monatomic with high ionisation probability [Hoffmann
et al., 2006].
Figure 3.13 Scheme representation of a tandem MS experiment. Reproduced from
Downard, 2004.

100
MS/MS is widely available in MS instruments such as Gas Chromatography
(GC), Liquid Chromatography (LC) and MALDI mass spectrometers but it is extremely
rare in commercial SIMS instruments. The first tandem MS SIMS instrument was
devised by the Vickerman‟s group in mid 1980 which was based on a Vacuum
Generator system that used triple quadrupole to perform MS/MS analysis on polymers
[Leggett et al., 1990]. The triple quadrupole analysers offers the advantages of high
sensitivity, improved mass resolution and was relatively easy to switch between
negative and positive modes as compared to magnetic sector analysers. This system was
based on a VG MM 12-12 SIMS but fitted with a VG 12-12 3S triple quadrupole in
place of single quadrupole for tandem MS analysis, Figure 3.14. The main aims of these
studies were to accurately determine the structure of secondary ions and the
fundamental process that oversees the formation of secondary ions and the
fragmentation in the MS/MS mode. The study by Leggett and co-workers (1992)
suggested that the fragmentation occurring during CAD is similar to the fragmentation
taking place at the solid surface during the sputtering process. Further, the group
investigated a range of collision gases and found Xe to be the most effective followed
by Ar, but He proved to be unsuccessful. Nitrogen (N2) was found to behave similar to
Ar [Leggett et al., 1990], [Leggett et al., 1992].

101
Figure 3.14 A triple quadrupole mass spectrometer. Reproduced from Leggett et al.
1990.
Tandem MS has also been used to differentiate between the secondary ions of
analyte from the secondary ions of tissue, chicken liver. Acetylcholine chloride and
methylphenylpyridinium iodide were deposited onto the tissue matrix and the
distribution of these compounds was mapped using SIMS and confirmed by using
MS/MS SIMS [Todd et al., 1995].
Brunelle and co-workers (2006) used ToF-SIMS and the post source decay
method (PSD) to perform tandem MS analysis on model molecules; the phosphocholine
ion, phosphatidylcholines, cholesterol and vitamin E. The PSD method refers to
measuring and detecting the fragment ions produced from a selected precursor ion. The
precursor ion undergoes dissociation in the flight tube after leaving the source and
produces fragment ions which are detected in the reflector. The amount of
fragmentation can be increased by either using a collision cell or higher intensity laser
in MALDI [Sandler, 2003].
In the study by Brunelle (2006) PSD measurements were applied to pure lipid
compounds and tissue sections and same ions were detected with relatively similar
abundances. The analysis of an ion m/z 184 from pure phospahtidylcholine produced

102
ions at m/z 60, 86, 104, 125 and 166, also detected in MALDI MS/MS. These ions were
also observed in the MS spectrum of the phosphocholine produced due to in source
decay of the molecular ion [M+H]+ m/z 758.6 of this compound. Further, these ions
have been imaged on the edge of a corpus callosum of a rat brain section to map their
distribution within a tissue section [Touboul et al., 2006].
The above studies highlight the importance and potential benefits of MS/MS on
SIMS instrumentation since it allows determination of the composition and structure of
complex substances, as well assisting in understanding the formation of secondary ions
produced when the sample is bombarded with a primary ion beam.
The C60+ ion beam equipped QSTAR XL system, developed by the Winograd
group also has the facility to perform MS/MS SIMS analysis, described in Chapter 2.
They used this instrument to perform MS/MS analysis on the fragment ion of
cholesterol m/z 369 [M-OH]+ and the resultant spectrum was used to identify the
fragments previously unidentified in the MS spectrum. Following this, these fragments
were imaged in a model cell system, J774 macrophages doped with cholesterol, to map
the distribution of the cholesterol in cells as well as to confirm that these fragments are
produced from this compound. Further, a peak at m/z 147.117 identified as a fragment
of cholesterol was distinguished from the commonly occurring contamination peak at
m/z 147.065 from poly-dimethyl-siloxane (PDMS). This study also highlights the
importance of tandem MS methodology for ToF-SIMS bioimaging as well as the need
of acquiring data at high mass resolution to differentiate between the real peaks and
possible interferences [Piehowski et al., 2008].

103
MS/MS on the J105 is performed using a ToF-ToF configuration, described in
detail in Chapter 2. In the MS/MS mode the ions leaving the buncher pass through a
collision cell containing a collision gas, N2. Since, the ions have an energy spread of 1-7
kV they all fragment when colliding with the gas. However, as these collisions take
place in a field free region, the daughter ions and the parent ion travel at same velocity
to the ToF analyser. Following a short distance into the ToF region, a timed ion gate is
used to select the precursor ion and its associated daughter fragment ions which are then
passed into ToF analyser for detection [Fletcher et al., 2008].
3.3.1 Experimental
The standards, arginine and the tetrapeptide (GGYR) used for MS/MS analysis
were obtained from Sigma (UK) except the lipid mixture (brain extract) which was
obtained from the Avanti Polar Lipids (USA) by Winograd‟s group and sent to
Manchester. A small amount of arginine and the tetrapeptide (GGYR) were dissolved in
water solvent, whereas the lipid mixture was dissolved in glycerol. 10 µl droplets of
each solution were deposited onto a clean steel plate and air dried.
ToF-SIMS MS and MS/MS analysis was performed using a 40 keV C60+
primary ion beam. MS/MS of the molecular ion peak of arginine was performed using a
range of gas pressure to determine an optimum collision gas pressure for the tandem
MS analysis. It is not possible to measure the gas pressure directly in the collision cell
and is monitored using the ToF pressure gauge. However, this is only an approximation
and the pressure in the cell is expected to be a much higher. Here arbitrary numbers, 2,
10, 20, 25 and 30 have been used which correspond to the time the valve is open to

104
allow the collision gas to enter. During the acquisition of the data set the calibration was
slightly different on the spectra with respect to the exact mass to charge ratio of
molecular and fragment ions of the samples analysed.
3.3.2 Results and Discussion
Amino acids have been studied extensively in normal MS and tandem MS
mode. It is a molecule that consists of an amine group, carboxylic acid and a side chain
R which varies with different amino acids, Figure 3.15. They are a vital part of life and
have many functions in metabolism, particularly in building proteins.
Figure 3.15 General structure of an amino acid, side chain R varies with the amino
acid.
Arginine, shown previously in Figure 3.2 is a basic amino acid, also referred to
as an alpha amino acid because the amine and carboxyl group are attached to the same
carbon atom. The literature shows that the protonated arginine exhibits the most
complex fragmentation pattern as compared to other alpha amino acids [Kulik et al.,
1988], [Dookeran et al., 2006], [Piraud et al., 2003], [Gogichaeva et al., 2007]. Figure
3.16, shows the MS/MS spectrum of the protonated arginine [M+H]+ m/z 175.119
which produces nine main diagnostic product ions. The first daughter ion, at m/z
158.093 [C6H12N3O2]+ is formed by a loss of ammonia from the protonated arginine. A

105
study by Zwinselmann and co-workers showed that the loss of ammonia occurs through
the amine group attached to the alpha C forming a cyclic protonated molecular ion of
arginine before it fragments [Zwinselman et al., 1983]. Dookeran et al. (1996) show
that in FAB MS/MS of arginine a peak at m/z 157 [C6H13N4O]+ is also produced due to
a loss of water, but this peak is not observed in the SIMS ToF-ToF and in the MALDI
ToF-ToF. Further, daughter ions detected include immonium ions at m/z 130.098
[C5H12N3O]+ formed by a loss of CO and NH3 and 129.114 [C5H13N4]
+ corresponding
to a loss of CO and H2O, also illustrated in the study of Zwinselmann et al. (1983) and
Piraud et al. (2003). However, these characteristics ions m/z 157, 158.093 and 129.114
are not detected when the arginine is analysed in the MALDI TOF-TOF. According to
Chait et al. (1981) the ion at m/z 130.122 [C5H14N4]+ can also be formed by a loss of
CHO from the protonated arginine when analysed by 252
Cf plasma desorption. This
difference in the composition of the ion at m/z 130 could be due to the difference in
ionisation of the two techniques.
The daughter ion m/z 60 arises due to the protonation of guanidine group
[(NH2)3C]+ on the arginine, shown by Dookeran and co workers (1996), Figure 3.17.
The authors explain that at low collision energy (2-50 eV), a proton is transferred to
form a protonated guanidine but at higher internal energy the guanidine group
fragments as a neutral molecule prior to proton transfer. This causes the remaining
residue to form a protonated cyclic ring proline which is detected at m/z 116
[C5H10NO2]+, Figure 3.16. This is most abundant in the MALDI ToF-ToF and is also
detected with reasonable intensity in SIMS ToF-ToF. The author further explain that the
protonated proline decomposes to produce an immonium ion at m/z 70 [C4H8N]+ which

106
dominates the spectrum at all energies in electrospray ionisation (ESI), FAB and SIMS
but not in MALDI ToF-ToF. The ToF-SIMS MS/MS of the protonated arginine, Figure
3.16 corresponds to the ToF-SIMS MS of standard arginine, Figure 3.3. This suggests
the process underlying the formation of secondary ions is similar to the formation of the
fragment ions produced during the CID of arginine in MS/MS, also shown by the earlier
literature [Leggett et al., 1990], [Leggett et al., 1992].
MS/MS analysis of the arginine on the J105 was performed at 5 different gas
pressures to determine an optimum gas pressure for MS/MS analysis. Figure 3.18 shows
that the ratio of fragment ions to molecular ion increases with an increase in the gas
pressure. This effect is observed because with an increase in the gas pressure, there is an
increase in the number of successive collisions between the gas N2 and the selected
precursor ion causing an increase in the intensity of daughter ions.

107
Figure 3.16 ToF-SIMS MS/MS spectrum of [M+H]+ m/z 175.119 of 0.3 M arginine
acquired at 64 × 64 pixels over an area of 600 × 600 µm2 with ion dose of 1 × 10
13
ions/cm2.

108
Figure 3.17 Fragmentation mechanism of arginine as suggested by Dookeran and co-
workers. Reproduced from Dookeran et al.1996.

109
Figure 3.18 Graph to show the effect of changing the gas pressure in the collision cell
on the intensity ratio of fragment to molecular ion. Higher collision gas pressure
produces higher intensity of the fragment ions.
MS/MS analysis of the molecular ion [M+H]+ m/z 452.226 of the tetrapeptide
(GGYR) is shown in Figure 3.19. Upon collisions with the gas, the molecular ion
produces four main diagnostic daughter ions at m/z 158.092, m/z 136.076, m/z 87.055
and immonium ions at m/z 112.087, m/z 100.087 and m/z 70.066, labelled as R on
Figure 3.19. These ions were assigned following the scheme of the formation peptide
fragmentation as shown in Figure 3.9 and 3.10. This contrasts with a FAB MS/MS of
tetrapeptide performed by Tang and co-workers (1992). They show that the molecular
ion [M+H]+ fragments to produce numerous daughter ions, similar to that seen in ToF-
SIMS MS of the tetrapeptide, Figure 3.11. Although both processes were performed at
relatively high energy, it is not yet clear why the MS/MS of the molecular ion of the

110
tetrapeptide is different. Further investigation is required to determine what is causing
this difference.
Figure 3.19 ToF-SIMS MS/MS spectrum of [M+H]+
m/z 452.226 of the tetrapeptide
(GGYR) acquired at 64 × 64 pixels over an area of 600 × 600 µm2 with an ion dose of 1
× 1013
ions/cm2.
The composition of the lipid mixture (brain extract) is shown in Table 3.3.
Following an impact with the primary ion beam six main ions are produced m/z 184.06,
734.6, 760.6, 788.6, 943.6, 971.8, Figure 3.20. The spectrum is dominated by the ion at
m/z 184.06 which corresponds to a fragment of phosphatidylcholine (PC) head group
and is easily detected in SIMS. There are many phosphatidylcholine containing
phospholipids but 1,2-Dipalmitoyl-sn-glycero-3-phosphatidylcholine (DPPC),

111
C40H81NO8P, monoisotopic molar mass of 733.57 g/mol and 1-Palmitoyl-2-oleoyl-sn-
glycero-3-phosphocholine (POPC), C42H82NO8P, monoisotopic mass of 759.58 have
been repeatedly analysed in MS mode by ToF-SIMS. The ions at m/z 734.6 and m/z
760.6 detected in the MS spectrum of the lipid mixture can be assigned to molecular ion
of PC containing lipids but further verification is required by the MS/MS of these ions.
The MS/MS spectrum of the precursor ion m/z 734.6 produced four daughter ions, m/z
224.105 [C8H19NO4P]+, m/z 184.074 [C5H15NO4P]
+ and m/z 86.097 [C5H12N]
+ Figure
3.21. On comparison of the MS/MS of the m/z 734.6 to the standard spectrum of DPPC
[SIMS Library], similar ions are detected in both MS and MS/MS mode. This allows
correctly assigning the ion at m/z 734.6 detected in ToF-SIMS of lipid mixture to
phosphocholine containing lipid.
The MS/MS spectrum of m/z 760.6 also produced daughter ions at m/z 166.063
[C5H13NO3P]+, m/z 184.067 [C5H15NO4P]
+ and 86.097 [C5H12N]
+, Figure 3.22. On
comparison of the daughter ions to the ions produced when standard POPC was
analysed on ToF-SIMS it can be confirmed that the ion at 760.6 on the MS of the lipid
mixture belongs to the phosphocholine containing lipid, POPC.
Due to the time constraints, only these two ions were analysed in the MS/MS
mode and further MS/MS analysis of other ions is required to assign other lipids.
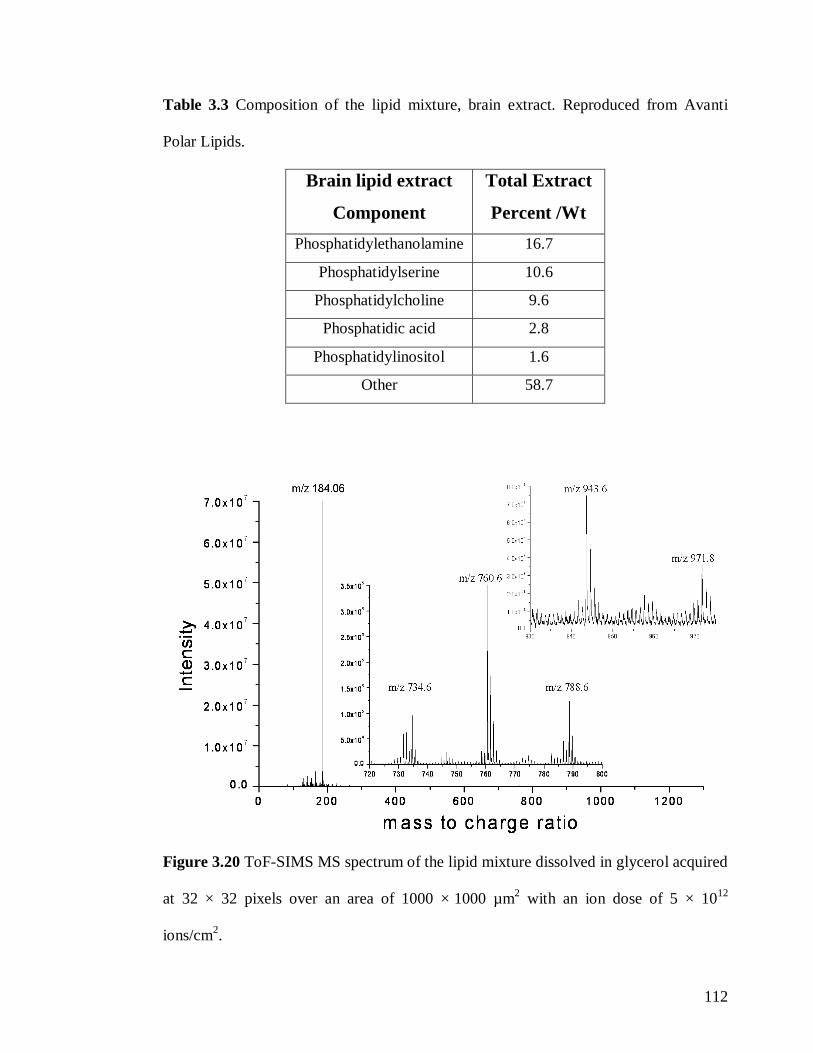
112
Table 3.3 Composition of the lipid mixture, brain extract. Reproduced from Avanti
Polar Lipids.
Brain lipid extract
Component
Total Extract
Percent /Wt
Phosphatidylethanolamine 16.7
Phosphatidylserine 10.6
Phosphatidylcholine 9.6
Phosphatidic acid 2.8
Phosphatidylinositol 1.6
Other 58.7
Figure 3.20 ToF-SIMS MS spectrum of the lipid mixture dissolved in glycerol acquired
at 32 × 32 pixels over an area of 1000 × 1000 µm2 with an ion dose of 5 × 10
12
ions/cm2.

113
Figure 3.21 ToF-SIMS MS/MS spectrum of m/z 734.570 of the lipid mixture dissolved
in glycerol acquired at 32 × 32 pixels over an area of 1000 × 1000 µm2 using ion dose
of 3 × 10¹³
ions/cm2. The intensity has been multiplied by a factor of 1000. This ion has
been assigned to the PC containing lipid in the lipid mixture. The m/z values are slightly
low in mass due to the off calibration during the acquisition of the data set.

114
Figure 3.22 ToF-SIMS MS/MS spectrum of m/z 760.586 of the lipid mixture dissolved
in glycerol acquired at 32 × 32 pixels over an area of 1000 × 1000 µm2
using an ion
dose of 3 × 10¹³
ions/cm2. The intensity has been multiplied by a factor of 10. This ion
has been identified as POPC in the lipid mixture. The m/z values are slightly low in
mass due to the off calibration during the acquisition of the data set.

115
3.3.3 Conclusion
MS/MS capability of the J105 has been tested using standard molecules,
arginine, the tetrapeptide (GGYR) and a lipid mixture from brain extract. The secondary
ions produced during normal ToF-SIMS MS mode correspond to the ions produced
during CID of molecular ion [M+H]+
in the ToF-SIMS MS/MS mode. This suggests
that the process underlying secondary ion formation is similar to the CID fragmentation.
On comparison of the MS/MS of the lipid mixture and standard lipid spectra it was
possible to identify m/z 734.6 and m/z 760 to phosphocholine containing lipids. The
above data shows the importance and benefits of tandem MS/MS on the SIMS
instrument. It is powerful method that offers the sensitivity and selectivity to identify
unknown species particularly in cells and tissues.

116
3.4 Limit of detection
Limit of detection (LoD) refers to the minimum surface concentration that can
be detected with a given analytical method. It can either be determined using a
statistical approach or an empirical (experimental) approach [Armbruster et al., 2008].
The former approach involves measuring replicates of a blank sample (a sample without
analyte) and LoD can be calculated by:
Mean of the blank + (3 × standard deviation of the mean blank)
This approach assumes that in the presence of the analyte, a signal greater than
this value will be produced. Although this is a relatively quick and easy method for
estimating the LoD, it does not provide the real data that can be used to distinguish
signal from analytical noise. This method of detection has also been criticised by some
researchers as “the ability to measure nothing” [Needleman et al., 1990].
The empirical (experimental) approach consists of measuring increasingly dilute
concentrations of the analyte until a signal or a peak can no longer be detected under the
conditions. This method offers the advantage over the statistical approach in that real
data is used to provide a comparison between the analytical response of a blank and low
concentration of sample to determine the lowest concentration of a sample detectable
[Armbruster et al., 2008].
Determining LoD is highly important in the forensic drug testing, where the
presence or the absence of drug can provide critical information to the regulatory body

117
of prohibited substances. It can also play a significant role in medicine, for example
monitoring "biochemical relapse" in prostate cancer [Katz et al., 1973].
SIMS offers the advantage of high sensitivity with detection limits in ppm and
ppb range [Fralick, et al., 1977], [Lockyer. 2007]. The polyatomic beams offer the
advantages of high ion efficiencies, low sub-surface damage as well as very low
detection limits [Ravanel et al., 2008] [Poleunis et al., 2006]. A publication by
Achiwawanich and co workers (2007) show that the temperature dependent
concentrations of trace transitional metals such as Cr and Cu can be determined by ToF-
SIMS at a level that cannot be measured by XPS.
Limit of detection on the J105 has been determined using the empirical
(experimental) approach in which increasingly dilute concentrations of arginine have
been measured. A working solution of arginine with concentration of 3 × 10⁻¹
M was
prepared and was diluted to 3 × 10⁻²
M……up to 3 ×10⁻¹⁰
M. Each concentration
consisting of 1 µl was deposited onto a clean Si wafer and analysed using 40 keV C60+
primary ion beam (110 pA), 32 × 32 pixels, 4 × 4 dynamic stage (to analyse the whole
droplet) over an area of 1000 × 1000 µm2 with 200 shots. A blank was also taken.
The intensity of the molecular ion peak [M+H]+ m/z 175.115 was used to
determine the LoD on the J105. The results demonstrate that the increase in the dilution
decreases the intensity of the molecular ion peak, but not by a factor 10 and minimum
concentration detected at 3 × 10⁻⁵
M after which the signal can be regarded as belonging
to the blank, Table 3.4.

118
Table 3.4 The intensity of [M+H]+ m/z 175.115 vary with change in concentration of
arginine.
Concentration of Arginine
(M)
Intensity (Counts)
3 ×10⁻¹
141087
3 ×10⁻²
474360
3 ×10⁻³
505165
3 ×10⁻⁴
242297
3 ×10⁻⁵
15015
3 ×10⁻⁶
332
3 ×10⁻⁷
270
3 ×10⁻⁸
300
3 ×10⁻⁹
323
3 ×10⁻¹⁰
290
Blank 372
As a consequence, the minimum numbers of moles of arginine that can be
detected are 3 ×10-11
mol, which is equivalent to 1.807 × 10¹³ molecules, determined as
shown below:
M = n/V Equation 3.1
Where
M: concentration of solution in mol/L
n: moles of a substance
V: volume of substance in L

119
Thus
n = M × V
n = 3 × 10⁻⁵
ML-1
× 1 × 10-6
L
n = 3 × 10-11
mol
N = nNA Equation 3.2
Where
N: number of molecules
n: number of mol
NA: Avogadro number 6.022 × 10²³
mol-1
Thus
N = (3 × 10-11
mol) × (6.022 × 10²³
mol-1
)
N = 1.807 × 10¹³

120
3.5 Summary
This chapter has studied the current performance of the new instrument J105 3D
Chemical Imager compared to the conventional ToF-SIMS instrument, the BioToF. The
data showed that although the transmission of low mass ions is low on the J105, this
instrument provides the advantages of higher mass detection, increase in sensitivity and
better peak resolving power compared to the BioToF. The tandem MS capability of the
J105 has been tested and proved and two lipids have been identified in the lipid mixture
of brain extract. It was also determined that the fragmentation mechanism for the
secondary ions is similar to the ions produced during collision induced dissociation.
The tandem MS technique has become a powerful tool for the identification of
unknown peaks and the analysis of complex material.
Following limit of detection test, it was determined that currently the lowest
concentration of arginine that produces a peak on the J105 instrument is 3 × 10⁻⁵
M
which is equivalent to 1.807 × 10¹³
molecules.

121
References
Achiwawanich, S.; James, B.D.; Liesegang, J. XPS and ToF-SIMS analysis of natural
rubies and sapphires heated in an inert (N2) atmosphere. Applied Surface Science
(2007), 253, 6883–6891
Armbruster, D.A.; Pry, T. Limit of Blank, Limit of Detection and Limit of
Quantitation. Clinical Biochemistry Review (2008), S49-S52
Avanti Polar Lipids website http://www.avantilipids.com visited 5-01-2010
Baldwin, M.A.; Proctor, C.J. Amster, L.J. Mclafferty, F.W. The behaviour of caesium
iodide cluster ions produced by fast-atom bombardment. International Journal of
Mass Spectrometry and Ion Processes (1983), 54, 97-107
Barlak, T. M.; Campana, J. E.; Colton, R. J.; DeCorpo, J. J.; Wyatt , J. R. Secondary
Ion Mass Spectrometry of Metal Halides. 1. Stability of Alkali Iodide Clusters. The
Journal of Physical Chemistry (1981), 85 (25), 3840-3844
Braun, R.M. , Blenkinsopp, P. , Mullock, S.J. , Corlett, C. , Willey, K.F. , Vickerman,
J.C., Winograd, N. Performance characteristics of a chemical imaging time-of-flight
mass spectrometer Rapid Communications in Mass Spectrometry (1998), 12 (8),
1246-1252
Chait, B.T., Agosta, W.C., Field, F.H. Fission fragment ionization (252Cf) mass
spectrometry. Positive and negative spectra and decomposition mechanisms for
seven compounds. International Journal of Mass Spectrometry and Ion Physics (1981),
39 (3), 339-366
Dookeran, N.N.; Yalcin, T.; Harrison, A.G. Fragmentation Reactions of Protonated alpha
Amino Acids. Journal of Mass Spectrometry (1996), 31, 500-508
Downard, K. Mass Spectrometry A Foundation Course. The Royal Society of
Chemistry, UK, 2004
Ens, W.; Beavis, R.; Standing, K.G. Time-of-Flight Measurements of Caesium-
Iodide Cluster Ions. Physical Review Letters (1983), 50 (1), 27-30
Fletcher, J.S., Rabbani, S., Henderson, A.; Blenkinsopp, P.; Thompson, S.P.; Lockyer,
N.P., Vickerman, J.C. A new dynamic in mass spectral imaging o single biological
cells. Analytical Chemistry (2008), 23, 9058-9064
Fletcher, J.S.; Conlan, X.A., Jones, E.A.; Biddulph, G., Lockyer, N.P.; Vickerman, J.C.
ToF-SIMS analysis using C60. Effect of impact energy on yield and damage.
Analytical Chemistry (2006), 78 (6), 1827-1831

122
Fralick, R.D.; Conrad, R.L. Quantitative Multielement Analysis with SIMS. RD Res
Dev (1977), 28 (3), 32-34, 36, 38
Gogichaeva, N.V.; Williams, T. MALDI TOF/TOF Tandem Mass Spectrometry as a
New Tool for Amino Acid Analysis. American Society for Mass Spectrometry
(2007),18, 279–284
Hoffmann, E.; Stroobant, V. Mass Spectrometry Principles and Applications. John
Wiley and Sons Ltd, Chichester 2007
Honda, F.; Lancaster, G.M.; Fukuda, Y.; Rabalais, J.W. SIMS study of the mechanism
of cluster formation during ion bombardment of alkali halides. The Journal of
Physical Chemistry (1978), 69 (11), 4931-4937
Johnson, R.S.; Martin, S.A.; Biemann, K. Novel Fragmentation Process of Peptides
by Collision- Induced Decomposition in a Tandem Mass
Spectrometer:Differentiation of Leucine and Isoleucine. Analytical Chemistry
(1987), 59, 2621-2625
Katz, S.M.; Di Silvio, T.V. Ascorbic acid effects on serum glucose values. Journal of
the American Medical Association (1973), 224 (5), 628
Kozole, J.; Willingham, D.; Winograd, N. The effect of incident angle on the C60+
bombardment of molecular solids. Applied Surface Science 255 (2008) 1068–1070
Kulik, W., Heerma, W. A Study of the Positive and Negative Ion Fast Atom
Bombardment Mass Spectra of a-Amino Acids. Biomedical and Environmental Mass
Spectrometry (1988), 15, 419-427
Leggett, G.J.; Briggs, D.; Vickerman, J.C. Collision Target-gas Effects during the
Tandem Secondary-ion Mass-spectrometric Analysis of Polymers. Journal of
Chemical Society. Faraday Transition (1990), 86 (10), 1863-1872
Leggett, G.J.; Vickerman, J.C. Applications of Tandem Quadrupole Mass
Spectrometry in SIMS. Surface and Interface Analysis (1990), 16, 3-8
Leggett, G.J.; Vickerman, J.C. Surface Studies by Static Secondary Ion Mass
Spectrometry: Cluster Ion Formation studied by Tandem Mass-spectrometric
Techniques. Journal of Chemical Society. Faraday Transition (1992), 88 (3), 279-309
Lockyer, N.P. Static secondary ion mass spectrometry for biological and
biomedical research. Methods in Molecular Biology (2007), 369, 543-567
Miyayama, T.; Sanada, N.; Iida, S.; Hammond, J.S.; Suzuki, M. The effect of angle of
incidence to low damage sputtering of organic polymers using a C60 ion beam.
Applied Surface Science (2008), 255, 951–953
123
Needleman S.B.; Romberg R.W. Limits of linearity and detection for some drugs of
abuse. Journal of Analytical Toxicology.(1990), 14(1), 34-8
Piehowski, P.D.; Carado, A.J.; Kurczy, M.E.; Ostrowski, S.G. Heien, M.L., Winograd,
N., Ewing, A.G. MS/MS Methodology To Improve Subcellular Mapping of
Cholesterol Using TOF-SIMS. Analytical Chemistry (2008), 80, 8662–8667
Piraud, M.; Vianey-Saban, C.; Petritis, K.; Elfakir, C.; Steghens, J.P.; Morla, A.;
Bouchu, D. ESI-MS/MS analysis of underivatised amino acids: a new tool for the
diagnosis of inherited disorders of amino acid metabolism. Fragmentation study of
79 molecules of biological interest in positive and negative ionization mode. Rapid
Communications in Mass Spectrometry (2003), 17, 1297-1311
Poleunis, C.; Delcorte, A.; Bertrand, P. Determination of organic contaminations on
Si wafer surfaces by static ToF-SIMS: Improvement of the detection limit with
C60+ primary ions Applied Surface Science 252 (2006) 7258–7261
Ravanel, X.; Trouiller, C. Juhel, M.; Wyonc, C.; Kwakman, L.F.T.; Léonard D. Static
time-of-flight secondary ion mass spectrometry analysis of microelectronics related
substrates using a polyatomic ion source. Applied Surface Science (2008), 255 1440–
1442
Roepstorff, P.; Fohlman, J. Proposal for a common nomenclature for sequence ions
in mass spectra of peptides. Biomedical Mass Spectrometry (1984), 11 (11), 601
Sandler Mass Spectrometry User‟s Group Meeting 2003
http://www.msg.ucsf.edu/agard/maldi/IntrotoMALDITOF.ppt. visited on 20-08-2010
Tang, X.; Boyd, R.K. An Investigation of Fragmentation Mechanisms of Doubly
Protonated Tryptic Peptides. Rapid Communications in Mass Spectrometry (1992), 6,
651-657
Thompson, S.P. SIMS ToF Mass Spectrometer Design Report (2006). Private
communication.
Todd, P.J.; McMahon, J.M.; Short, R.T. Secondary ion emission and images from a
biologic matrix. International Journal of Mass Spectrometry and Ion Processes (1995),
143, 13 1 – 145
Touboul, D.; Brunelle, A.; Laprévote. Structural analysis of secondary ions by post-
source decay in time-of-flight secondary ion mass spectrometry. Rapid
Communications in Mass Spectrometry (2006), 20, 703-709
Zwinselman, J.J.; Nibbering, N.M.M.; van der Greef, J., Ten Noever de Brauw, M.C. A 15
N labelling, FD and FAB Study of Ammonia Loss from Protonated Arginine
Molecules. Organic Mass Spectrometry (1983), 18 (12), 525-529

124
4 Molecular depth profiling using ToF-SIMS
4.1 Introduction
The concept of depth profiling was introduced in Chapter 1. It is a process in
which the composition of a sample can be determined as a function of depth. In
dynamic SIMS a dc primary ion beam is used to profile chemical changes of sample as
a function of depth. However, with the emergence of static SIMS in 1960
[Benninghoven, 1970], followed by incorporation of ToF analysers in 1980
[Benninghoven, 1983], the primary ion beam could no longer be used in a dc mode and
had to be operated in a pulsed mode. This resulted in a low duty cycle and a depth
profile of a sample took a long time to complete. Consequently, to accomplish the
experiment over a reasonable time, an alternating analysis and etch cycle method is
adapted. This involves using a primary ion beam in a dc mode to raster over a large area
on the surface and as it sputters down several microns below the surface, an etch crater
is produced. Following this, the same or a different ion beam in a pulsed mode is used
to analyse within this etch crater and the secondary ions produced are detected by a
mass spectrometer, Figure 4.1. The dual beam approach allows the analyst to select the
finest analysis beam and etching beam for a study under investigation [lltgen et
al.,1997].

125
Figure 4.1 Schematic of the dual beam approach to ToF-SIMS depth profiling and 3D
analysis. Reproduced from Hammond, 2010.
Although, the concept of depth profiling has been known for decades and is
particularly useful in the semiconductor industry, the implementation of molecular
depth profiling was only accomplished with the development of polyatomic ion sources.
The molecular depth profiling of organic and biological material was practically
impossible with the monoatomic beams due to the damage characteristics associated
with these beams, described in Chapter 1.
The very first molecular depth profiling study using polyatomic projectiles was
reported by Gillen and co-workers in 1998. In this work the authors‟ depth profiled
various polymer and organic films using a monoatomic ion beam, Ar+ and a polyatomic
beam, SF5+. This study illustrated that under SF5
+ impact not only high secondary ion

126
yields can be obtained but the molecular signal can also be maintained as a function of
primary ion fluence, until a substrate is reached, Figure 4.2b. However, under the
bombardment with Ar+ the signal rapidly degrades with an increase in the primary ion
dose, Figure 4.2.a [Gillen et al.,1998].
Figure 4.2 Comparison of depth profiles obtained from 180 nm thick, vapour-deposited
glutamate films (a) under Ar+ and (b) under SF5
+ primary ions under dynamic SIMS
conditions. The SF5+ primary ion dose to reach the silicon was 1.4 × 10
15 ions/cm
2.
Reproduced from Gillen et al. 1998.
The authors explained that when the SF5+ beam impacts a surface, the energy is
divided between the sulfur and fluorine atoms and is deposited very close to the surface.
This results in an increase in the sputter yields and the damage is limited to the surface
region which is removed by subsequent impacts. Thus, during the depth profile using
polyatomic beam, a pristine surface is analysed following each impact and a loss in the
molecular signal is not observed. This is in contrast to the behaviour of the monoatomic
127
beam because when it strikes a sample it deposits its energy deep into the sub-surface
region of the sample causing damage deep into the sample and generating low sputter
yields. Furthermore, with continuous impact the damage accumulates in the sample and
a rapid decay in the signal intensity of molecular ions is observed [Postawa et al.,2004].
This work was followed by another study in which carbon cluster ions C2- to C8
-
were used to depth profile glutamate film yielding similar results as to the SF5+ [Gillen
et al.,2001]. The polyatomic, SF5+
projectile has been used extensively to depth profile
polymers in submonolayer [Brox et al.,2000] and multilayer films [Wagner. 2005] as
well as doped with drugs [Mahoney et al.,2004], [Mahoney et al., 2006], [Belu, et al.,
2008].
With the development of the buckminsterfullerene, C60+ ion source [Wong, et
al., 2003], it was also shown that this source too has the capabilities to depth profile a
sample. Initial studies, conducted by Winograd and co-workers, were based on profiling
inorganic and organic multilayer films to identify fundamental depth profiling
characteristics of the C60+ projectile [Sun et al., 2004], [Sostarecz et al., 2004]. These
experiments were completed using a dual beam approach in which C60+ ion beam was
used for etching and Ga+
beam for analysis between etch cycles. These studies show
that the C60+ was able to clearly identify all the individual layers in a multilayer film and
offers significant advantages over other beams; in terms of higher secondary yields,
reduction in interlay mixing and enhanced depth resolution. Depth resolution, described
in Chapter 1, is the ability to measure a sharp interface between the two layers. It has
been shown to decrease with an increase in the roughness of the sample. Higher depth
resolution is attained when polyatomic projectiles are used as compared to monoatomic

128
beams due to the shallow penetration of these beams upon impact and the energy
deposited is limited only to the surface. As a consequence, there is low interlayer
mixing and topographic roughness which improves the depth resolution [Sun et al.,
2004].
Similar effects have also been reported by Gillen and co-worker (1998) and
Yamada and associate (1995) who demonstrate that a smoother surface is produced
when a sample is bombarded with polyatomic projectile, SF5+ and gas clusters as
compared to atomic ion beams [Gillen et al., 2008], [Yamada et al., 1995].
Winograd and co-workers also carried out a series of depth profiles of
polypeptide films using the C60+ ion beam for both analysis and etching cycles [Cheng
et al., 2005], [Cheng et al., 2006], [Cheng et al., 2007]. In the first study the
investigators show the ability of C60+ to depth profile a biological material, trehalose
which also enhances the stability of the polypeptide signal under bombardment [Cheng
et al., 2005]. This work was followed by another study in which organic multilayer
films were depth profiled using the C60+ ion beam. In this work trehalose was embedded
between two chemical species, aluminium (Al), silicon (Si), sliver (Ag) and ice to
produce a number of multilayer films Al/trehalose/Si, Al/trehalose/Al/Si,
Ag/trehalose/Si and ice/trehalose/Si, and following a depth profile it was established
that best profiles were only obtained when the mass of the atoms in the top layer is less
than or equivalent to the mass of atoms in the embedded molecules [Cheng et al., 2006].
Cheng et al. (2007) published an article in which a direct comparison between
the LMIS cluster, Au3+ and polyatomic, C60
+ projectile was made on thin films of
peptide doped trehalose and dipalmitoylphosphatidylcholine (DPPC). The profiles show
129
a decrease in the signal and increase in the fragmentation under Au3+ impact as
compared to the C60+.
At the same time, depth profiling studies using C60+ were also being performed
in the Vickerman lab. A number of articles have been published in which three different
beams, Au+, Au3
+ and C60
+ have been used to depth profile a range of biological
systems to explore the potential and benefits of the C60+ projectile as compared to LMIS
[Fletcher et al., 2006], [Fletcher et al., 2006], [Jones et al., 2007]. The authors also
report on the success of C60+ to depth a profile cellulose film, previously not possible
using SF5+, which highlights the feasibility of C60
+ to analyse and depth profile a range
of biological samples [Fletcher et al., 2006].
Jones et al. (2007) completed a comprehensive study on depth profiling of
standard biological compounds, cholesterol and DPPC to determine a protocol for
possible tissue depth profiling. Figure 4.3 shows that under C60+ bombardment, the
molecular ion [M-H]+ m/z 385 and fragment ion [M-OH]
+ m/z 369 of cholesterol reach a
steady state, whereas with Au3+ and Au
+ the signal rapidly decays with an increase in
the primary ion fluence. A similar effect was also observed during the depth profile of
DPPC film.

130
Figure 4.3 A comparison of the stability of quasi-molecular ion intensity from a
cholesterol film under prolonged bombardment by Au+, Au3
+ and C60
+ primary ion
beams all at 15 keV. The plots show the relative peak intensity from the [M-OH]+
m/z
369 (left) and [M-H]+ m/z 385 (right) with respect to primary ion dose. Reproduced
from Jones et al. 2007.
The literature shows that there are a number of parameters that can affect a
depth profile of a sample, the beam used, angle and energy of the beam, as well as the
temperature. The above studies demonstrate that the best molecular depth profiles are
obtained using the polyatomic beams as compared to monoatomic or metal cluster ions.
With regards to the beam energy, higher sputter and secondary ion yields are
obtained with an increase in the polyatomic beam energy [Bolotin et al., 2006],
[Fletcher et al., 2006], [Shard et al., 2007]. Furthermore, the molecular signal can also
be maintained for longer period of time as a function of primary ion fluence at higher
beam energy [Fisher et al., 2008], [Wucher et al., 2008]. However, this also increases
the roughness of the sample which results in a loss of depth resolution. Winograd and
131
co-workers carried out a study in which they investigated the effect of a range of kinetic
energies 20, 40, 80 and 120 keV of C60+ ion beam on the depth resolution. The authors
found that the energies between 20 and 40 keV provide better depth resolution of 18 nm
as compared to higher energies [Wucher et al., 2008].
Recently the National Physical Laboratory (NPL) have developed a model
multilayer organic sample comprising of Irganox 1010 and Irganox 3114, to provide a
comparison between different instrumentation, ion sources and experimental conditions
for the depth profiling of organic films. Shard et al. (2008) depth profiled this reference
delta layers sample in „interlaced‟ mode using Bi3+ for analysis and C60
+ for sputtering
at various energies 5, 10, 20 and 30 keV. The results illustrate that as the energy of the
sputtering beam is increased, the erosion depth increases and more layers are identified.
However, this also increases the roughness of the sample which limits the depth
resolution. This study shows that at lower energies greater depth resolution is obtained.
With respect to the beam incident angle, the literature shows that the angle at
which the beam impacts a surface can also affect a depth profile of a sample. Winograd
and co-workers used a cholesterol film deposited on Si to show the effect of varying the
angle of incidence from 40° to 73° on molecular depth profiling. The investigators
showed that at glancing angle, 73° the signal can be maintained for a long time and low
damage is caused to the sample as compared to 40° incident angle [Kozole et al., 2008].
Hence, it is preferred to perform depth profiling at glancing incident angle. A similar
effect was also observed by Miyayama and co-workers when they depth profiled a
polymer using C60+ ion beam at different angle of incident [Miyayama et al., 2008].

132
The temperature plays a crucial role in depth profiling experiments. Mahoney
and co-workers identified that temperature can have a significant effect on the success
of profiling organic samples, particularly polymers. This is since the physical and
chemical properties of the polymers vary with temperature and which will also effect
the sputtering rates. The authors showed that profiling Poly(methyl methacrylate)
(PMMA) at low temperature results in an increase in the secondary ion stability, low
interface width as well as a reduced topography effect with an increase in erosion as
compared to depth profiling at room temperature [Mahoney et al., 2006], [Mahoney et
al., 2007]. A study by Zheng et al. (2008) also shows that at cryogenic temperature, the
high mass signal and sputtering of LB multilayer film remains stable with an increase in
primary ion dose, but at room temperature the signal slowly degrades. Recently a paper
by Sjövall and associates also report on the same trend. In this study, the authors used
the NPL reference delta layers to show that at low temperature, better profiles can be
obtained while maintaining constant sputter and secondary ion yields [Sjövall et al.,
2010]. These effects have also been observed and confirmed by a recent study
undertaken in the Vickerman lab where the investigators depth profiled a range of bio-
samples at low temperature [Piwowar et al., 2010]. These studies conclude that high
quality profiles of organic samples can be achieved at cryogenic temperatures.
In summary, the developments of polyatomic ion beams have instigated
molecular depth profiling of organic and biological molecules as monolayer as well as
in multilayer systems. These beams, particularly C60+ offer the benefits of higher
secondary ion yields, reduction in interlayer mixing and reduced topographic roughness
with an improved depth resolution.

133
The aim of this chapter is to discuss the ability of cluster and polyatomic beams
to remove the damage induced by the monatomic beam, thus regenerating the original
surface to establish a protocol for high lateral resolution 3D ToF-SIMS imaging of bio-
samples using polycaprolactone. Further, it explores the use of polyatomic beam C60+ as
a dc beam for molecular depth profiling on the J105 using organic standards samples,
arginine and a tetrapeptide (GGYR).
4.2 Dept profiling of Polycaprolactone
Polycaprolactone (PCL) is biodegradable polyester that can be prepared by a
ring opening polymerisation mechanism of ε-caprolactone, Figure 4.4. It has a low
melting point of 60°C and is used as an additive for resin to enhance their processing
characteristics and operating properties. PCL can be hydrolyzed by its ester linkage in
physiological conditions and has been used as an implantable material [Wikipedia,
2007].
Figure 4.4 Ring opening polymerization of ε-caprolactone. Reproduced from
Wikipedia, 2007

134
Roberson et al. (2003) used ToF-SIMS to complete a bio-compatibility study of
PCL using a Ga+ primary ion beam. The authors disclose that this technique can be
useful in correlating the contact angle measurement, as well as determining a change in
the chemical composition of the PCL surface.
PCL is one of the most commonly biodegradable polymers used as matrix for
drug delivery and has been depth profiled using monoatomic and polyatomic
projectiles. Mahoney et al. (2004) depth profiled a series of biodegradable polymers
including PCL doped with model drugs using monoatomic, Ar+ and Cs
+ and polyatomic
SF5+ primary ion beams. The aim of this study was to investigate the behaviour of the
polymers as a function of primary ion dose as well as monitor the distribution of drugs
as a function of depth. The results show that the secondary ion signal of polymers and
drugs remains stable under polyatomic beam, SF5+ for ion dose as high as 5 × 10
15
ion/cm2 as compared to the monoatomic beams.
Further, depth profiles of PCL were completed by Fletcher et al. (2006) using
C60+, Au
+ and Au3
+ to provide a comparison between the different primary ion beams.
This study also illustrates that PCL remains stable under polyatomic beams, but higher
sputter yields are produced when C60+ is used as compared to SF5
+ ion beam. The PCL
was found to be unstable when depth profiled using monoatomic Au+ and the small
cluster ion, Au3+, Figure 4.5.

135
Figure 4.5 Variation in absolute intensity of the fragments associated with
polycaprolactone (PCL) with increasing dose. Profiles acquired with 20 keV Au+, Au3
+
and C60+ and 40 keV C60
+ primary ions. Reproduced from Fletcher et al. 2006.
A short study was undertaken to determine the ability of cluster, 20 keV Au3+
and the polyatomic ion beam, 20 keV and 40 keV C60+
to remove the damage induced
by the monoatomic, 20 keV Au+ following a depth profile on the conventional ToF-
SIMS instrument, the BioToF.

136
4.2.1 Experimental
PCL (Sigma Aldrich, UK) was dissolved in chloroform to form 10-3
M solution
and a thick film was prepared by spin casting 10 µl droplets onto silicon substrate. The
film was allowed to dry for 10 minutes and the sample was mechanically attached to the
copper sample stub and transferred into the BioToF. The depth profile analysis of the
biopolymer PCL was carried out using 20 keV Au+ with ion dose of 1 × 10
13 ions/cm
2
per analysis and 128 × 128 pixels over an area of 300 × 300 µm2. The depth profile
continued until a dose of 1 × 10¹⁴
ions/cm2 was reached. Following this, the sample was
imaged depth profile by using 20 keV Au3+, 20 keV C60
+ and 40 keV C60
+. An electron
gun was also used for charge compensation.
4.2.2 Results and Discussion
Figure 4.6 shows the standard spectra of PCL acquired with 20 keV Au+ with 5
main peaks at m/z 41 [C3H5]+, m/z 55 [C4H7]
+, m/z 69 [C5H9]
+, m/z 97 [C6H9O]
+ and a
molecular specific fragment [M+H]+ at m/z 115. The depth profile results are depicted
in Figure 4.7 in which the secondary ion intensities of molecular signal [M+H]+ m/z 115
is plotted as a function of increasing ion dose for three beams, Au+, Au3
+ and C60
+. This
figure illustrates that under bombardment with 20 keV Au+, there is a rapid decrease in
the molecular ion [M+H]+ with an increase in the primary ion dose. This has also been
reported previously by Fletcher et al. (2006), Figure 4.5. This decrease in the signal is
attributed to the damaging characteristics of the monoatomic beam when it is operated
at ion dose higher than the static limit. It has been described above and in Chapter 1 that
when the monoatomic beam impacts a surface, it penetrates deep into the sample

137
causing the molecular bonds to break in deep regions of the sample. Thus following an
initial etch, the beam is subsequently impacting an increasingly damaged surface and
preventing the ability to depth profile molecular sample.
Figure 4.6 ToF-SIMS spectrum of polycaprolactone (PCL) acquired with 20 keV Au+
with ion dose of 1 × 10¹³
ion/cm2 over an area of 300 × 300 µm
2.
PCL was depth profiled using 20 keV Au+
up to ion dose of 1 × 10¹⁴
ions/cm2
after which an image depth profile was performed using cluster, Au3+ and polyatomic,
C60+ ion beams. Under the 40 keV C60
+ bombardment, an initial drop in the [M+H]
+
signal is observed, Figure 4.7, but following subsequent alternating etch and analysis
cycles the signal increases and a plateau is attained between 1.5 x 10¹⁴
– 2.0 x 10¹⁴

138
ions/cm2. A similar pattern was also observed when the damaged surface was
bombarded with 20 keV C60+. Thus the C60
+ bombardment not only recovers the
molecular signal by removing the damage induced by the Au+ ion beam but also
maintains the molecular signal as a function of primary ion fluence. Furthermore, higher
secondary ion signals are obtained when the sample is interrogated with 40 keV C60+
than with 20 keV C60+ ion beam. This is because at higher energy, the beam impacts
deeper into the sample causing more material to be ejected and increasing the sputter
yields [Fletcher et al., 2006]. This observation is also supported by the simulation
studies which show that as the impact energy of the C60+ ions on silver is increased, the
impact diameter decreases while the depth of the crater increases, resulting in higher
sputter yields [Postawa et al., 2004].
However, this is in contrast to the results obtained when the sample is imaged
depth profiled using the cluster, 20 keV Au3+ ion beam, where the [M+H]
+ signal
decays further with an increase in the ion dose. These results are also exemplified in the
images generated from the image depth profile, Figure 4.8.

139
Figure 4.7 Secondary ion signal [M+H]+ m/z 115 of polycaprolactone (PCL) plotted as
function of primary ion dose. Black: Data acquired with 20 keV Au+ up to ion dose 1 ×
1014
ions/cm2. Red: Data acquired with 20 keV Au3
+. Green: Data acquired with 20 keV
C60+
. Blue: Data acquired with 40 keV C60+.
Figure 4.8 shows that at primary ion dose 2 × 10¹⁴
ions/cm2
the 40 keV C60+ is
able to fully recover the damage; whereas the 20 keV C60+ is only able to remove some
at the same dose. The Au3+ is unable to eradicate any of the damage implanted by Au
+
and in addition to this destroys the surface further. This is because when the Au3+
impacts a surface it breaks into its constituent atoms but each atom still has enough
energy to penetrate deep into the sub-surface of the sample. As a consequence, the
sample is significantly damaged which builds up and is uncovered as the depth profile

140
proceeds, explained in Chapter 1. Similar results have also been reported by Gillen and
co-workers where they show the success of polyatomic beam SF5+ to successfully
remove the damage caused by the monoatomic, Ar+ beam from the surface [Gillen et
al.,1998].
Figure 4.8 Image depth profile of polycaprolactone (PCL), half of the area was
bombarded with 20 keV Au+ and then half was restored using cluster and polyatomic
beams (a) Right triangle bombarded with 20 keV Au+; Left triangle restored with 40
keV C60+. (b) Left triangle bombarded with 20 keV Au
+; Right triangle restored with 20
keV C60+. (c) Right triangle bombarded with 20 keV Au
+; Left triangle restored with 20
keV Au3+. From top to bottom the primary ions fluence is 1.1 × 10
14, 1.3 × 10
14 and 1.6
× 1014
ions/cm2.

141
4.2.3 Conclusion
The development of novel cluster and polyatomic ion beams has opened up the
possibility for molecular depth profiling using ToF-SIMS which opens up the prospects
of 3D molecular imaging, described in Chapter 5. The PCL study shows that the
polyatomic beam, C60+ is able to fully remove the damage caused by the monoatomic
beam and recover the molecular signal whereas the cluster, Au3+ ion beam causes more
damage to the surface. In addition, the C60+ beam maintains secondary ion signal as a
function of primary ion fluence allowing the ability to depth profile organic samples
successfully.
This research outlines the prospect of performing high lateral resolution 3D
imaging using dual beam approach in which highly focused LMIS, Aun+ or Bin
+ can be
used to acquire images with high spatial resolution, and polyatomic C60+ or SF5
+ for
removing the damage caused by the LMIS. Although this interleaved method is
frequently used by the SIMS community for molecular depth profiling and high lateral
resolution 3D imaging of cells and tissues, the sputter rates calculated using Atomic
Force Microscope (AFM) indicate that the dose required to remove the damage caused
by Au+ ion corresponds to the removal of 25-30 nm material by 40 keV C60
+. This
results in a loss of valuable molecular information from the top 20-30 nm of the sample.

142
4.3 Depth Profile of standard samples using dc C60+ primary ion on the
J105 3D Chemical Imager
It has been recognised in the above study and in the literature that the dual beam
approach allows performing depth profiling at high lateral resolution over a reasonable
time frame. However, a lot of valuable sample is also lost during the sputtering cycles.
Furthermore, the ion dose of monoatomic and metal cluster beams has to be kept within
the static limit to prevent damage to the sample, which limits sensitivity. Thus as
described in Chapter 2, an approach was required in which depth profiling experiments
could be performed using a primary ion beam with high fluence beyond the static limit
which causes little or no damage to the sample. Besides, the depth profile could be
completed over a practical time frame while analysing the whole sample without
needing a separate etch cycle. As discussed previously the C60+ ion beam promises to
meet these requirements but to fully explore the properties of this beam the
conventional ToF-SIMS had to be modified. This led to the design and development of
the new instrument J105 3D Chemical Imager, described in Chapter 2. On this
instrument the polyatomic beam can be used in dc mode and focussed to a small spot
size while retaining high current for high lateral resolution imaging. Depth profile
experiments on the J105 are performed in similar manner to dynamic SIMS but by
using the polyatomic beam molecular information is obtained. Moreover, since the dual
beam approach is no longer used, a loss of sample during the etch cycle is avoided
which maximises sensitivity with an increase in duty cycle, Figure 4.9.

143
Figure 4.9 Depth profiling by ToF-SIMS. (a) Depth profiling using a conventional
SIMS which requires the use of dual beam in which one is used for imaging followed
by etching which wastes valuable sample. (b) The use of a continuous analysis beam on
the J105 means that all the material is sampled [Reproduced from Hill et al., 2009].
Experiments were undertaken to explore the ability of C60+ to depth profile
standard organic films, arginine and a tetrapeptide (GGYR) in dc mode.
4.3.1 Experimental
Thin films of arginine and a tetrapeptide (GGYR) were prepared as dried
droplets on Si wafers. These samples were depth profiled using 40 keV C60+ primary ion
beam (120 pA) with an ion dose of 1 × 10¹³
ions/cm2 per layer with 32 × 32 pixels over
an area of 330 × 330 µm2. In total 31 layers were acquired with total ion dose of 3.0 ×
1014
ions/cm2 was used.
144
4.3.2 Results and Discussion
ToF-SIMS spectra of arginine and tetrapeptide (GGYR) acquired on the J105
have been shown previously, see Figure 3.3 and Figure 3.11 in Chapter 3. Arginine
produces many diagnostic ions, but three ions [M+H]+ m/z 175, [C5H12N3O]
+ m/z 130
and [C4H8N]+ m/z 70 were selected to show the behaviour of arginine when it is
interrogated with a continuous primary ion beam, Figure 4.10. When the sample is
depth profiled with 40 keV C60+, an initial drop in signal intensity for molecular and the
fragment ions is observed after which the signal reaches a steady state between an ion
dose of 3 × 10¹³
ions/cm2 to 3.1 × 10
14 ions/cm
2. Arginine has also been previously
depth profiled using 20 keV C60+ primary ion beam at room temperature and in a frozen
hydrated state [Piwowar et al., 2009]. In both of these conditions molecular signal is
maintained with an increase in the primary ion dose with high yields being reported at
frozen hydrated state.
Upon depth profiling, the tetrapeptide (GGYR) with 40 keV C60+
in dc mode a
similar pattern is also observed in which the signal is maintained as a function of
primary ion dose, Figure 4.11.

145
Figure 4.10 Plot of secondary ion signal of arginine as a function of 40 keV C60+
primary ion fluence. Blue: [M+H]+ m/z 175. Pink: [C5H12N3O]
+ m/z 130. Yellow:
[C4H8N]+ m/z 70.
Figure 4.11 Plot of secondary ion signal of a tetrapeptide (GGYR) as a function of 40
keV C60+ primary ion fluence. Blue: [M+H]
+ m/z 425. Pink: [C6H15N4O2]
+ m/z 175.
Yellow: [C4H8N]+ m/z 70.

146
4.3.3 Conclusion
This study shows that the C60+ ion beam can be used in dc mode to molecular
depth profile organic samples. Additionally, higher secondary ion signals are obtained
which can be maintained as a function of primary ion dose. On the conventional ToF-
SIMS instrument, BioToF this experiment could only be accomplished by using
alternating analysis and etch cycles which would have wasted substantial amounts of
valuable sample resulting in decrease in sensitivity. Thus the benefits of performing
depth profile experiments on the J105 could be realised.
The depth profile experiment was stopped at ion dose 3.1 × 10¹³
ions/cm2 and
could have been carried until the substrate was reached.

147
4.4 Summary
In this chapter molecular depth profiling has been reviewed. Advances in the
instrumentation particularly polyatomic ion beams has extended the capability of ToF-
SIMS to molecular depth profile various biological molecules and is continuously
evolving to meet the needs of biological community. It has been shown that factors such
as type of beam, beam energy, beam angle and temperature greatly influence depth
profile results and these factors need to be carefully considered prior to the experiment
to obtain high quality results.
A dual beam approach is often used by the analyst in which monoatomic or
cluster ion beam is used for analysis and polyatomic beam for sputtering. However,
sputter rates calculated for the PCL study show that the dose required by the polyatomic
beam, C60+ to remove the damage caused by the monoatomic beam, corresponds to the
removal of 25-30 nm material from the sample. Although successfully implied for high
lateral resolution 3D imaging, it results in a large quantity of valuable sample to be
wasted during the etch cycles. Thus and an alternative approach is required where a
whole material can be sampled and detected.
The new instrument, the J105 allows using the polyatomic beam, C60+
in a dc
mode, thus sampling a whole material and increasing sensitivity. Furthermore, due to
low damage cross-section the molecular signal can be maintained as a function of
primary ion flunece and in-depth chemistry to be probed. The J105 allows exploiting
the capabilities of the polyatomic beams thoroughly making the prospect of rapid 3-D
molecular imaging of cells and tissue a reality.

148
References
Belu, A.; Mahoney, C.; Wormuth, K. Chemical imaging of drug eluting coatings:
Combining surface analysis and confocal Raman microscopy. Journal of Controlled
Release (2008), 126 (2), 111-121
Benninghoven, A. Analysis of monomolecular surface layers of solids by secondary
ion emission. Zeitschrift fuer Physik (1970), 230(5), 403-417
Benninghoven, A.; Steffens, P.; Niehuis, E.; Friese, T. Application of a new Time of
Flight. Annual Conference on Mass Spectrometry and Allied Topics (1983), 54-55
Bolotin, I.L.; Tetzler, S.H.; Hanley, L. Sputtering yields of PMMA films bombarded
by keV C60+ ions. Applied Surface Science (2006), 252 (19), 6533-6536
Brox, O.; Hellweg, S.; Benninghoven A. Dynamic SIMS of polymer films? Proc 12th
International Conference Secondary Ion Mass Spectrometry (2000), 12, 777–780
Cheng, J.; Kozole, J.; Hengstebeck, R.; Winograd, N. Direct Comparison of Au3+ and
C60+ Cluster Projectiles in SIMS Molecular Depth Profiling. Journal of the
American Society for Mass Spectrometry (2007), 18 (3), 406-412
Cheng, J.; Winograd, N. Depth profiling of peptide films with TOF-SIMS and a C60
probe. Analytical Chemistry (2005), 77 (11), 3651-3659
Cheng, J.; Wucher, A.; Winograd, N. Molecular depth profiling with cluster ion
beams. Journal of Physical Chemistry B (2006), 110 (16), 8329-8336
Fisher, G.L.; Dickinson, M.; Bryan, S.R.; Moulder, J. C60 sputtering of organics: A
study using TOF-SIMS, XPS and nanoindentation. Applied Surface Science (2008),
255 (4), 819-823
Fletcher, J.S.; Conlan, X.A.; Lockyer, N.P.; Vickerman, J.C. Molecular depth
profiling of organic and biological materials. Applied Surface Science (2006), 252,
6513–6516
Fletcher, J.S.; Xavier, A.C.; Jones, E.A.; Biddulph, G.; Lockyer, N.P.; Vickerman, J.C.
TOF-SIMS Analysis Using C60. Effect of Impact Energy on Yield and Damage.
Analytical Chemistry (2006), 78, 1827-1831
Gillen, G.; King, L.; Freibaum, B.; Lareau, R.; Bennett, J.; Chmara, F. Negative
caesium sputter ion source for generating cluster primary ion beams for secondary
ion mass spectrometry analysis. Journal of Vacuum Science and Technology, Part A:
Vacuum, Surfaces and Films (2001), 19 (2), 568-575
149
Gillen, G.; Roberson, S. Preliminary Evaluation of an SF5+ Polyatomic Primary
Ion Beam for Analysis of Organic Thin Films by Secondary Ion Mass
Spectrometry. Rapid Communication in Mass Spectrometry (1998), 12, 1303–1312
Hammond, J.S. Imaging Mass Spectrometry: Protocols for Mass Microscopy,
Chapter 18 Comparison of SIMS and MALDI for Mass Spectrometric Imaging,
Springer 2010
Hill, R.; Blenkinsopp, P., Everest, C.; Barber, A.; Vickerman, J.C.; Fletcher, J.S.;
Thompson, S.P. A New Instrument for 3-Dimensional Imaging SIMS. UK SAF
Meeting (2009), Private Communication
Iltgen, K.; Bendel, C.; Benninghoven, A. Optimized time-of-flight secondary ion
mass spectroscopy depth profiling with a dual beam technique. Journal of Vacuum
Science and Technology A (1997), 15 (3), 460-464
Jones, E.A.; Lockyer, N.P.; Vickerman, J.C. Mass spectral analysis and imaging of
tissue by ToF-SIMS—The role of buckminsterfullerene, C60+, primary ions.
International Journal of Mass Spectrometry (2007), 260 146–157
Kozole, J.; Willingham, D.; Winograd, N. The effect of incident angle on the C60+
bombardment of molecular solids. Applied Surface Science (2008), 255 (4), 1068-
1070
Mahoney, C.M.; Yu, J.; Fahey, A. ; Gardella Jr.; J.A. SIMS depth profiling of
polymer blends with protein based drugs. Applied Surface Science (2006), 252 (19),
6609-6614
Mahoney, C.M.; Fahey, A.J.; Gillen, G.; Xu, C.; Batteas, J.D. Temperature-controlled
depth profiling in polymeric materials using cluster secondary ion mass
spectrometry (SIMS). Applied Surface Science (2006), 252 (19), 6502-6505
Mahoney, C.M.; Fahey, A.J.; Gillen, G.; Xu, C.; Batteas, J.D. Temperature-controlled
depth profiling of poly(methyl methacrylate) using cluster secondary ion mass
spectrometry. 2. Investigation of sputter-induced topography, chemical damage,
and depolymerization effects. Analytical Chemistry (2007), 79 (3), 837-845
Mahoney, C.M.; Roberson, S.; Gillen, G. Dynamic SIMS utilizing SF5+ polyatomic
primary ion beams for drug delivery applications. Applied Surface Science (2004),
231-232, 174-178
Piwowar, A.M.; Fletcher, J.S.; Kordys, J.; Lockyer, N.P.; Winograd, N.; Vickerman,
J.C. Effects of Cryogenic Sample Analysis on Molecular Depth Profiles with TOF-
Secondary Ion Mass Spectrometry Analytical Chemistry (2010), published online
150
Miyayama, T.; Sanada, N.; Iida, S; Hammond, J.S.; Suzuki, M. The effect of angle of
incidence to low damage sputtering of organic polymers using a C60 ion beam.
Applied Surface Science (2008), 255 (4), 951-953
Postawa, Z. Sputtering simulations of organic overlayers on metal substrates by
monoatomic and clusters projectiles. Applied Surface Science (2004), 231-232, 22-28
Roberson, S.; Sehgal, A.; Fahey, A.; Karim, A. Time-of-flight secondary ion mass
spectrometry (ToF-SIMS) for high-throughput characterization of biosurfaces.
Applied Surface Science (2003), 203-204, 855-858
Shard, A.G.; Brewer, P.J.; Green, F.M.; Gilmore, I.S. Measurement of sputtering
yields and damage in C60 SIMS depth profiling of model organic materials.
Surface and Interface Analysis (2007), 39 (4), 294-298
Shard, A.G.; Green, F.M.; Gilmore, I.S. C60 ion sputtering of layered organic
materials. Applied Surface Science (2008), 255 (4), 962-965
Sjövall, P.; Rading, D.; Ray, S.; Yang, L.; Shard, A.G. Sample Cooling or Rotation
Improves C60 Organic Depth Profiles of Multilayered Reference Samples: Results
from a VAMAS Interlaboratory Study. Journal of Physical Chemistry B (2010), 114
(2), 769-774
Sostarecz, A.G.; Sun, S.; Szakal, C.; Wucher, A.; Winograd, N. Depth profiling
studies of multilayer films with a C60+ ion source. Applied Surface Science (2004),
231-232, 179-182
Sun, S.; Szakal, C.; Roll, T.; Mazarov, P.; Wucher, A.; Winograd, N. Use of C60
cluster projectiles for sputter depth profiling of polycrystalline metals. Surface and
Interface Analysis (2004), 36, 1367-1372
Sun, S.; Wucher, A.; Szakal, C.; Winograd, N. Depth profiling of polycrystalline
multilayers using a Buckminsterfullerene projectile. Applied Physics Letters (2004),
84 (25) 5177-5179
Wagner, M.S. Molecular depth profiling of multilayer polymers films using time-
of-flight secondary ion mass spectrometry. Analytical Chemistry (2005), 77 (3), 911-
922
Wikipedia http://en.wikipedia.org/wiki/Polycaprolactone accessed on 7-08-2009
Wong, S.C.C.; Hill, R.; Blenkinsopp, P.; Lockyer, N.P.; Weibel, D.E.; Vickerman, J.C.
Development of a C60+ ion gun for static SIMS and chemical imaging. Applied
Surface Science (2003), 203-204, 219-222

151
Wucher, A.; Cheng, J.; Winograd, N. Molecular depth profiling using a C60 cluster
beam: The role of impact energy. Journal of Physical Chemistry C (2008), 112 (42)
16550-16555
Yamada, I.; Matsuo, J.; Insepov, Z.; Akizuki, M. Surface modifications by gas cluster
ion beams. Nuclear Instrument and Methods in Physics Research, B (1995),
106 (1-4), 165-169
Zheng, L.; Wucher, A.; Winograd, N. Depth resolution during C60+ profiling of
multilayer molecular films. Analytical Chemistry (2008), 80 (19), 7363-7371

152
5 Sub-cellular imaging of cells using ToF-SIMS
5.1 Introduction
A cell is a basic, living, structural and functional unit of a body with the main
function of allowing material to move across the cell membrane, cell division and
protein synthesis. There are two types of cells, eukaryotes and prokaryotes, with the
major difference being the presence of a nucleus in eukaryotes and absent in
prokaryotes. In this project, a eukaryotic cell line was used and this will form the main
part of discussion.
Figure 5.1 shows a generalised view of a typical animal cell which can be divided
into three main parts; plasma membrane, cytoplasm and a nucleus. The plasma
membrane forms the outside boundary of the cell which separates the cell‟s internal
environment from outside as well as controlling the movement of substances into and
out of the cell. The fundamental structure of the plasma membrane is of a lipid bilayer
containing three types of lipid molecules; phospholipids, cholesterol and gylcolipids,
Figure 5.2. Table 5.1 presents the composition of the lipid species in the plasma
membrane of an average mammalian cell. Phospholipids form the major constituent of
the cell membrane and consist of a glycerol head-group which gives it a hydrophilic
character and two fatty acid tail groups that account for the hydrophobic non-polar part.
Figure 5.3, shows a general structure of a phospholipid with R1 and R2 representing the
fatty acid chains and X the different head-group which differentiates the lipids into
different classes. The lipids contained within the plasma membrane are distributed
asymmetrically as demonstrated in a study by Rothman et al. (1977) on human red

153
blood cell membrane in which the outer leaflet consists mainly of sphingomyelin (SM)
and phosphatidylcholine (PC); whereas the inner leaflet consists mainly of
phophatidylethanolamine (PE) and phosphatidylserine (PS), Figure 5.4.
The cytoplasm of a cell consists of cellular content between the plasma membrane
and nucleus which can be divided into two components; the cytosol and organelles. The
cytosol is a fluid mainly containing water and solutes. The organelles, ribosomes, the
endoplasmic reticulum, golgi complex, perxisomes, cytoskeleton, lysosomes and
mitochondria are highly organised sub-cellular structures within a cell, with each having
its own characteristic shape and particular function. Finally, the main part of the cell is
the nucleus which contains genes that control cellular structure and functions such as
the cell division and protein synthesis [Tortora et al., 2000].
Established imaging techniques such as optical, fluorescence, confocal, scanning
electron microscopy, transmission electron microscopy and more recently atomic force
microscopy are routinely utilized to identify and localise the distribution of biological
components in cells to understand the physiological processes taking place at the
surface and within the cells. However, the limitations associated with these techniques
are that they provide no chemical information and require the use of fluorescent labels
to image the molecules of interest, discussed in Chapter 1.
Lately, Mass Spectral imaging (MSI), particularly SIMS is becoming a powerful
technique to image the distribution of biological components within a single cell. SIMS
offers the benefits of high sensitivity, very high spatial resolution (<100 nm) and the
capability of label free monitoring of the distribution of native bio-molecules and
xenobiotics at the sub-cellular scale with high selectivity [Fletcher et al., 2010].

154
Imaging using SIMS can be performed by using either the microscope or the
microprobe modes, introduced earlier in Chapter 1. Briefly in the microscope mode, an
image of the selected secondary ion is generated using a broad beam over a large area;
whereas in the microprobe, the beam is focused to a small spot size and is rastered
across a defined area of analysis. In the latter mode, mass spectral data collected is
directly related to the position of the beam, which allows mapping the distribution of
the ions in the given area. The spatial resolution in this mode is dependent on the spot
size of the primary ion beam; while in the microscope mode the spatial localisation of
the secondary ions is preserved by the secondary ion optics system [Castaing et al.,
1981], [Liebl et al., 1967].
This chapter reviews the current literature on imaging of single cells using SIMS
and the factors limiting the technique reaching its full potential. Further, the ability of
operating the C60+ as a dc beam on the new instrument, J105 3D Chemical Imager to
image at sub µm spatial resolution and examine the chemistry below the surface is
explored. In addition to this, different sample preparation techniques, formalin fixed,
freeze-dried and freeze-fractured frozen-hydrated are also investigated using a novel
sample handling system on the J105, specifically designed for the biological samples.

155
Figure 5.1 Typical view of an animal cell. Reproduced from
http://asweknowit.net/images_edu/DWA%205%20eukaryote.jpg
Figure 5.2 Plasma membrane in fluid mosaic arrangement of lipids and proteins.
Reproduced from
http://www.colorado.edu/intphys/Class/IPHY3730/image/membrane.jpg.

156
Table 5.1 Membrane lipid composition in an average mammalian cell. Reproduced
from
http://employees.csbsju.edu/hjakubowski/classes/ch331/lipidstruct/oldynamicves.html
LIPIDS % Phospholipids
Phosphatidylcholine (PC) 45-55
Phosphatidyletanolamine (PE) 15-25
Phosphatidylinositol (PI) 10-15
Phosphatidylserine (PS) 5-10
Phosphatidic Acid (PA) 1-2
Sphingomyelin (SM) 5-10
Cardiolipin (bis-Phosphatidylglycerol) 2-5
Cholesterol 10-20
Figure 5.3 General structure of a phospholipid. R1 and R2 represent the fatty acid
chains, X represent the different head-groups.

157
Figure 5.4 Asymmetrical distribution of phospholipids in membranes of human red
blood cells. Abbreviations: TPL, total phospholipids; PC, phosphatidylcholine; SM,
sphingomyelin; PE, phosphatidylethanolamine; PS, phosphatidylserine; and PI,
phosphatidylinositol. Reproduced from Rothman et al. 1977.

158
5.2 Imaging of single cell using SIMS
5.2.1 Imaging of cells using Dynamic SIMS
The very first mass spectral images of cells were obtained using a dynamic
SIMS instrument based on „ion microscopy‟ technology that was commercialised by
Cameca [Morrison et al., 1975]. The instrument operates in the microscope mode, by
bombarding the sample with a defocused primary ion beam over a larger field of view.
The secondary ions emitted are accelerated in the same electrostatic field through an
immersion lens. This produces an unfiltered global image containing many ion images,
one for each isotope present in the sample. Thus, a filtering system was required to
separate ions based on their m/z to generate an image corresponding to the element
selected.
The Cameca instrument was successfully employed in a range of applications
such as geology, solid-state physics, environmental science and biology, particularly
imaging the distribution of biological significant element, calcium in transversal section
of an insect abdomen and dentine in the human tooth [Morrison et al., 1975].
Although at the time of analysis only one secondary ion species either atomic or
small fragment ion is detected, this approach offered the advantage of high spatial
resolution as demonstrated by studies on mapping the distribution of pharmaceutical
compounds within cells and tissues [Larras-Regard et al., 1995], [Clerc et al., 1997],
[Bennett et al., 1992].
A very successful application of this imaging SIMS technique has been in the
development of boron neutron capture therapy (BNCT) for the treatment of cancerous
cells, particularly brain tumours [Smith et al., 2001]. BNCT is based on the fission

159
reaction in which 10
B atoms capture a neutron and slowly decay to form alpha particles
and lithium nuclei causing the death of cancerous cells. Prior to the development of
SIMS ion microscopy, other techniques such as direct current plasma-atomic emission
spectroscopy (DCP-AES) and inductively coupled plasma-atomic emission
spectroscopy (ICP-AES) were used to detect boron in BNCT studies, but these methods
required pre-treatment of biological cells before analysis, which alters the native
distribution of chemical species in the cells. SIMS based ion microscopy offers the
advantages of high sensitivity and spatially resolved 3D images of isotopes without
manipulating the sample. 3D imaging on the microscope dynamic SIMS instruments is
performed by recording a series of secondary ion intensities versus time of impact with
the primary ion beam [Chandra et al., 2000].
A study by Chandra et al. (2007) investigated the boron uptake from two
different BNCT drugs p-boronophenylalanine (BPA-F) and sodium borocaptate (BSH)
in different co-cultured cell lines and it was possible to differentiate between the cells
lines from optical images as well as image uptake and accumulation of boron within the
cells. This was followed by another experiment by the same group where they treated
the cells with 13
C 15
N-labelled phenylalanine to compare the uptake of boron from
phenylalanine amino acids with the BPA-F drug. The SIMS images obtained show that
although the mechanism for up-taking boron from the two compounds is the same, the
processing is different, particularly in mitochondria. This study also investigated uptake
of boron from the BPA drug during different stages of the cell cycle. The cells were
treated with the BPA drug and bromodeoxyuridine (BrdU), a thymidine analogue that
binds to DNA during the s-phase of the cell cycle. The SIMS images illustrate the

160
capability of the instrument and show an increase in uptake and accumulation of boron
from BPA in nuclear region of cells in the s-phase compared to non replicating cells,
Figure 5.5.
Figure 5.5 Correlative reflected light (a) and SIMS imaging (b-f) of fractured freeze-
dried cells T98G human glioblastoma cells. SIMS images of inorganic 39
K, 23
Na, 40
C
81Br and
10B from the same cell shown in (b-f) respectively. The s-phase cells show
bright 81
Br- signal from the nucleus indicated with an arrow (e) which also contains high
level of 10
B+ (f, indicated with the arrow). Reproduced from Chandra et al. 2007.

161
Levi-Setti and co-workers used the ion microprobe imaging mode with spatial
resolution of 50 nm to map the distribution of halogens and calcium isotopes in
individual chromosomes bound to Mg2+
and 44
Ca [Levi-Setti et al., 2004], [Strissel et
al., 2004]. 3D imaging in the microprobe mode is completed by assembling the images
as they are acquired. The above studies demonstrate dynamic SIMS to be a valuable
tool to further our understanding on the mechanism of disease and the effect of drugs.
The development of new primary ion sources, Cs+, O2
-, In
+ and parallel mass
detection in the magnetic sector detector instrument led to the development of new
methods for imaging intercellular molecules. Nanometer-scale, secondary ion mass
spectrometry (NanoSIMS) is a technique developed for the analysis of trace elements
and isotope of fine features in animal tissues and cells [Slodzian et al., 1992]. It
operates in dynamic imaging microprobe mode and uses stable isotope markers such as
13C,
15N and
18O to label molecules and map their distribution within an animal tissue or
cells. It offers the advantage of high lateral resolution (50 nm) while maintaining
extremely high sensitivity (ppm in elemental imaging) and high mass resolution (M/∆M
= 5000 with 60% transmission, M/∆M = 7500 at 40% transmission and M/∆M = 15,000
with 10% transmission) [Guerquin-Kern et al., 2005], [Grovenor et al., 2006).
NanoSIMS 50 ion microprobe (Cameca) was used to image the membrane binding
protein B-subunit of Shiga toxin in Henrietta Lacks (HeLa) cells to investigate the sub-
cellular distribution and intracellular transport pathway [Römer et al., 2006].
A prototype of NanoSIMS was developed by Lechene et al. (2006) named
multi-isotope imaging mass spectrometry (MIMS) which combines SIMS with tracer
methods to determine and map the distribution of molecules labelled with stable

162
isotopes in sub-cellular compartments. Samples ranging from human hair cross-section
to tissue section were studied but the most impressive image generated was of a whole
single endothelial cell, Figure 5.6. An overlay of the images 12
C-,
12C
14N
- and
31P
- was
generated which shows clear differences within the cell. The region in red indicates the
nucleus and cytoplasm which contains high nitrogen signal with the periphery
(lamellipodium) being high in phosphorus and low in nitrogen. The outermost layer of
the cell contains more carbon than in the lamellipodium area. Small and thin protrusions
at the edge of the cells also contain high nitrogen which the authors suggest could be
filpodia.

163
Figure 5.6 Analysis of gross differences in composition within an unlabelled cell.
Endothelial cells were cultured on silicon supports, fixed on the support, dried, and
analysed with multi-isotope imaging mass spectrometry (MIMS). Quantitative mass
images of the surface of a whole endothelial cell were recorded in parallel at masses
12C
-,
12C
14N
- and
31P
-. An overlay of these images is shown, with
12C
14N in red,
12C in
green, and 31
P in blue. Scale bar = 10 µm. Reproduced from Lechene et al. 2006.
Although very impressive images can be generated using the dynamic SIMS
instrument with stable isotope markers, this technique is destructive causing severe
damage to organic molecules and only providing elemental and small fragment
information.
164
5.2.2 Imaging of cells using Static SIMS
With the development of static SIMS, ToF analysers and LMIS that can be
focused down to a spot size of 50 nm, it is now possible to probe the molecular
information from the cell surfaces. In recent years, a number of applications have been
published to show the ability of ToF-SIMS to spatially resolve the distribution of
biochemical species on the cell surfaces using LMIS sources.
Winograd and co-workers imaged hydrocarbon, inorganic and doped molecules
(cocaine and dimethylsiloxane (DMSO)) in a freeze-fractured frozen-hydrated single
Paramecium cell using a Ga+ primary ion beam, see Figure 2.1, Chapter 2, [Colliver et
al., 1997]. This was followed by a number of subsequent studies by the same group
using a Ga+ primary ion beam to image lipids in freeze-fractured freeze-dried human
red blood cells [Pacholski et al., 1998], and cellular sections of the fractured rat
pheochromocytoma (PC12) cells, as well as in combination with in situ fluorescence
microscopy using a fluorescent label DiI in the PC12 cells [Roddy et al., 2002].
As mentioned in Chapter 2, when performing high lateral resolution imaging on
ToF-SIMS the sensitivity to molecular species was extremely low. Thus, to increase the
signal levels, In+ [Ostrowski et al., 2004], Aun
+ [Davies et al., 2003] and Bin
+ [Kollmer
et al., 2004] LMIS were developed, where large impacting ions helped to improve the
sputter yields. Winograd and co-workers describe the use of ToF-SIMS to image lipid
composition of cryogenically preserved rat oligodendrocyte single cells [Piehowski et
al., 2008], as well show the change in lipid composition during Tetrahymena mating
[Ostrowski et al., 2004]. Furthermore, Ostrowski et al. (2007) used the In+ primary ion
beam to investigate the distribution of cholesterol between the plasma membrane of two

165
cells. Cholesterol is a sterol which is an important structural component of the cell
membrane required for maintaining membrane permeability and fluidity, discussed in
Chapter 3. Most of the cholesterol required by the body is synthesised by the body, but
it can also be ingested through diet. It is highly concentrated in lipids rafts and is a
crucial molecule for the normal cell functions such as metabolising fat soluble vitamins
and signal transduction. However, abnormal cholesterol levels within blood can
exacerbate many diseases such as heart disease and Alzheimer. Therefore, it is essential
to understand the role of cholesterol in mammalian cells. In this study, the cells
(macrophages cell line, J774) were treated with Chol-BCD solution and labelled with a
fluorescent tag, DiD and second population of J774 cells (control) were incubated only
in media and labelled with DiI fluorescent tag. The samples were fractured and only
cells that still had a membrane intact, as verified by the presence of fluorescence tag,
were imaged. This study provided a proof of concept in the identification of cells by
fluorescence in the vacuum system as well as mapping the distribution of cholesterol
using a characteristic peak [M+H-H2O]+ at m/z 369 on the cell surface, Figure 5.7. This
study shows the ability of ToF-SIMS to successfully detect cholesterol within cells, but
also yet again highlights low signal levels obtained using the technique.

166
Figure 5.7 Fluorescence and SIMS images of cholesterol-treated and control J774 cells
(100 ×100 µm2 field of view). Fluorescence and SIMS images were aligned manually
using imaging software. (a) In situ, two-colour fluorescence image of several freeze-
fractured J774 cells. The treated cells were arbitrarily coloured red, and the control cells
are shown in green. (b-d) Positive ion molecule-specific images of J774 cells that
correlate with the fluorescence image in (a). In all SIMS images, black pixels indicate
an absence of signal. (b) SIMS composite image for DiD (m/z 860; red) and DiI (m/z
834; green). (C) SIMS image for C5H9+ hydrocarbon (m/z 69; blue). (d) SIMS image for
cholesterol (m/z 366-370; white). Reproduced from Ostrowski et al. 2007.

167
Nygren and co-workers used a Ga+ primary ion beam to localise cholesterol and
lipids in the membrane of single cells. The authors used silver (Ag) printing to enhance
secondary ion yields and were able to localise cholesterol and phospholipids, Figure 5.8
[Sjövall et al., 2003]. Although imprinting increases secondary ion signals, it results in
a loss of lateral resolution as well as introducing artifacts into the images, mentioned
previously in Chapter 2.
Figure 5.8 Positive TOF-SIMS images from a cell-imprinted Ag surface obtained after
pre-moistened imprinting at 0.6 MPa. The images show the intensity distributions of (a)
phosphocholine C5H15NPO4+, (b) (cholesterol-Ag)
+ (c) (cholesterol2-Ag)
+. Field of
view, 77 × 77 µm2. Reproduced from Sjövall et al. 2003.
The Vickerman group developed a static SIMS instrument “BioToF” in
collaboration with the Winograd group (Penn State) and Kore Technology Ltd for the
analysis of biological samples [Braun et al., 1998]. This instrument was used by Cliff et
al. (2003) to demonstrate the application of ToF-SIMS as a valuable tool in
pharmacological studies. Clofazimine is an antibiotic used to treat various bacterial
infections including tuberculosis but the exact mechanism of action is unknown. ToF-

168
SIMS has been utilized to study yeast cells, C. glabrata incubated in Clofazimine to
determine whether the drug can be retained by the outer cell wall or incorporates into
phospholipid bilayer. The samples were freeze-fractured and ToF-SIMS images were
acquired using 15 keV Au+. Figure 5.9 shows the localisation of the Clofazimine drug
to the cell surface and does not penetrate through into the cell interior [Cliff et al.,
2003].
a ba b
Figure 5.9 ToF-SIMS images of intact Candida incubated in presence of drug
Clofazimine over an area of 50 × 50 µm2. (a) Total Ion; (b) Clofazimine m/z 473-475.
Adapted and reproduced from Cliff et al., 2003.
Furthermore, the group used this instrument to characterise prostate cancer cell
line (PC-3) cells. The cells were analysed in freeze-fractured and freeze-dried states
using Ga+ and Au2
+ ion beams. Various species including K, Ca, and Mg can be
localised to the cytoplasm with cholesterol and dipalmitoylphosphocholine (DPPC) to
the lipid membrane. In addition, an increase in the yields by a factor of 20 for DPPC
fragment m/z 184 is observed when changing the primary ion beam from Ga+ to Au2
+
[Gazi et al., 2004].
169
The Winograd group used the Au+ primary ion beam to map the distribution of
lipids in macrophages J774 and Glial cells in a trehalose matrix. The authors
successfully preserved the morphology and chemistry of these cells in the matrix and
images of the distribution of lipids in the sub-cellular regions were produced. Some of
the cell samples were deposited with Ag which although has been shown to enhance the
secondary ion signal, it also results in a loss of lateral resolution [Parry et al., 2005].
This was followed by another study on high lateral resolution imaging in which the
lipid response to phagocytosis on the macrophage cells was investigated using a Au+
primary ion beam [Parry et al., 2008].
The Bin cluster primary ion beam has been used extensively by Nygren and co-
workers for molecular imaging of lipids in cells and tissues to determine their
distribution and understand their function within cells [Börner et al., 2007]. Malm et al.
(2009) also used Bi3+ primary ion beam to investigate different sample preparation
techniques for ToF-SIMS, see below.
Although above studies show some of the extraordinary work produced in the
history of SIMS, it also highlights the challenges faced in the application of static SIMS
for the analysis of biological samples using monoatomic LMIS sources. This is because
the damage characteristics of these beams mean that the analysis has to be carried out
within the static limit which reduces sensitivity, described in detail in Chapter 2. The
development of cluster LMIS sources Aun+ and Bin
+ yielded a non-linear increase in the
secondary ion yields, while maintaining high spatial resolution, but the static limit still
has to be adhered to when using these beams, thus yet again limiting sensitivity.

170
With the introduction of polyatomic ion sources using C60+ [Wong et al., 2003],
and SF5+ [Kötter et al., 1998], a significant increase in the secondary ion yields was
observed with greatly reduced sample damage, described in Chapter 1. This allowed the
static limit to be relaxed and opened up the possibility of molecular depth profiling,
Chapter 4 and 3D chemical imaging, discussed below.
5.2.3 3D sub-cellular imaging of cells using SIMS
Cellular and sub-cellular analysis of cells is of great importance to understand
and follow the evolution of biochemistry with depth, hence the need for 3D imaging.
Current approaches adopted are to use optical microscopes such as confocal microscopy
to look inside the cell and construct 3D images from a series of 2D images recorded.
Although very powerful and successful, this technique requires fluorescent labelling of
the molecules of interest before analysis so they can be detected. ToF-SIMS offers the
advantage of being able to generate chemically specific images as a function of depth
without having to tag the molecules with active markers that can change the chemistry
of cells. Moreover, when using light microscopy one is limited in the number of
analogues that can be incorporated for one experiment, whereas with ToF-SIMS the
possibilities are much greater allowing simultaneous analysis of more than 5 tags at
once with monitoring of molecules and elemental halogens.
Chandra et al. (2004) used the dynamic SIMS instrument, described above to
perform 3D sub-cellular imaging of single cells, human T98G glioblastoma. The cells
were fractured freeze-dried in the mitotic stage and images of single masses 12
C+,
23Na
+,
24Mg
+,
39K
+ and
40Ca
+ were recorded. In this study, the distribution of
40Ca
+ was also
171
monitored as a function of depth to determine the concentration of 40
Ca+ in the mitotic
spindle region. This study highlights the importance of looking beneath the cell
surfaces.
The ability of cluster and polyatomic primary ion beams to successfully depth
profile organic systems, described in Chapter 4, opened up the prospect to depth profile
and image single cells using a dual beam approach on static SIMS instruments.
However, depth profiling of a preserved cell was challenging due to the complex nature
of the sample and the sputtering characteristics of these beams. A cell is a multi-
component system which when analysed produces variations in the intensity with depth
that represents changes in the chemistry. This is contrast to a single component system
where similar information is produced regardless of the depth [Jones et al., 2007]. Also,
the sputtering behaviour of the polyatomic beams differs when a single species is
analysed as compared to a complex biological system. To investigate this issue further,
Kozole et al. (2006) constructed a DPPC-sucrose multilayer system to be used as a
model for 3D molecular imaging of a biological cell. The DPPC was used as the plasma
membrane of the cell and the sucrose solution as a cell cytoplasm. The sample was
frozen in liquid nitrogen to preserve the native biological environment and depth
profiled using the C60+ primary ion beam. The depth profile plots show that the C60
+
beam can be used to remove a lipid film up to 20 nm and a molecular signal from the
underlying biological species can be detected. This study shows the potential of using
C60+ primary ion for the analysis of single cells in 3D. Over the years, a series of papers
have been published where the researchers have constructed membranes to mimic the

172
cells and depth profiled them [McQuaw et al., 2005, 2006], [Baker et al., 2008], [Zheng
et al., 2008].
Eventually a breakthrough came from the Manchester group when they published
a 3D molecular image from a cell, Xenopus laevis oocyte using the C60+ projectile
[Fletcher et al., 2007]. Xenopus laevis oocyte is a large frog egg about 1 mm in
diameter, whose cell organelles are easily visualised and analysed but the variation in
topography meant a loss in mass resolution during analysis due to the size and only the
outer section of oocyte could be analysed. Despite this limitation, the sample proved the
concept of molecular depth profiling of a single cell using the C60+ primary ion beam.
This study was completed on a conventional ToF-SIMS instrument equipped with a 40
keV C60+ primary ion beam which was used in a pulsed mode to sputter, etch and record
a series of 2D images to characterise chemical changes with depth. This analysis took a
number of days to complete and the data was collected in both positive and negative ion
modes, with the detection of masses up to m/z 1000, even after using the primary ion
dose of 1 × 10¹⁵
ions/cm2. The main organic peaks detected and imaged were
cholesterol m/z 369, diacylglyceride and phospholipids fragments and a series of
recorded 2D images were stacked to generate 3D images, Figure 5.10.

173
Figure 5.10 3D biochemical images of freeze-dried oocyte, showing changes in (a)
phosphocholine peaks m/z 58, 86, 166, and 184, (b) signal summed over the m/z range
540-650, (c) signal summed over the m/z range 815-960, and (d) cholesterol peak at m/z
369. Colour scale Normalised for total counts per pixel for each variable (m/z range).
Reproduced from Fletcher et al. 2007.
This experiment demonstrates the potential of using the C60+ polyatomic primary
ion beam as an imaging beam to map the distribution of bio-chemicals present laterally
and as a function of depth, even with high primary ion fluence that exceeds the static
limit. However, the C60+ polyatomic primary ion beam is a gas cluster ion source which
is difficult to focus to a spot size comparable to the LMIS while maintaining enough
current to allow analysis to be completed in a useful time. An approach which is often

174
adopted for imaging experiments on the conventional ToF-SIMS instrument is to
employ dual beams, in which a pulsed metal cluster beam such as Aun+ or Bin
+ is
applied to acquire an image and a continuous polyatomic beam such as SF5+ or C60
+ is
used to sputter the material. This interleaved dual beam approach allows the analysis to
be completed on a practical useful time scale [Nygren et al., 2008], [Malmerg et al.,
2008].
The dual beam approach was adopted by Brietenstein et al. (2007) to perform
3D imaging on smaller cells, normal rat kidney cells, using the C60+
for sputtering and
Bi3+ for imaging. The aim was to detect endogenous chemicals present in the cell and to
validate the 3D ToF-SIMS protocol using a well known cellular system. Six confluent
layers of cells were grown on glass cover-slips and chemically fixed with
gluteraldehyde before analysis. The cells are 20 µm in diameter and were analysed
using a ToF-SIMS IV instrument (ION-TOF, Germany) equipped with 25 keV Bi3+
used for imaging and 10 keV C60+
to remove the layers and in total 60 cycles were
acquired to go through 6 layers of cells. Images were acquired at nominal mass
resolution and the spectrum was recorded in bunched mode with mass resolution of
5000-10000. In this study, the authors were able to detect and image phospholipids and
amino acids as shown in Figure 5.11.

175
Figure 5.11 2D images of NRK cells after 45th sputter cycle. Summed signals of amino
acid fragment ions are represented in red (b), those of phospholipids in green (c), and
substrate-derived secondary ions are depicted in blue (a). The scale bar in (d)
corresponds to 20 µm. a)–d) Horizontal xy sections and e), f) vertical xz sections
through the sample. Reproduced from Brietenstein et al. 2007.
This was impressive work which showed that ToF-SIMS can be employed to
reconstruct 3D imaging of cells using the dual beam approach and without the need to
label with fluorophores. However, the limitation that lies with this approach is that
valuable sample is wasted in the sputter cycle and the analysis with Bi3+ has to be
restricted to static conditions limiting the yield per pixel. The authors predict that this
176
technique can be used to detect drugs in cells which are the ultimate aim for 3D SIMS
imaging. However, the approach adopted by these labs raises the issue whether there
will be enough sensitivity during the static analysis step to detect extremely low
concentration of these molecules [Fletcher et al., 2009].
In another study, a similar approach is adopted in which 3D imaging of freeze-
fractured freeze-dried thyroid carcinoma cell line is reported using C60+
for sputtering
and Bi3+ for imaging. The authors claim that they can image internal compartments of
the cell but they were only able to detect and image the PC head-group m/z 184,
inorganic ions Na m/z 23, K m/z 39 and m/z 86. A high intensity signal of m/z 86 was
observed in the centre as well as at the periphery part of the cells that could not be
identified but was said to be a fragment of PC or amino acids leucine/isoleucine
[Nygren et al., 2007].
In both of these studies, the images were acquired at low mass resolution by
using a long pulsed primary ion beam and the mass spectrum of the cell was recorded at
a high mass resolution using a bunched primary ion beam to assign the peaks. High
mass resolution imaging instruments are commonly operated in this mode. This is
because rapid pulsing results in a loss of focus of the primary ion beam and if the beam
is focused to a small spot size the current is so low that it can take few days to complete
an experiment. Therefore, the aim is usually to increase acquisition time by increasing
the current of primary ion beam which results in low quality mass spectrum.
From above studies, it can be concluded that while using a conventional ToF-
SIMS instrument, it is difficult to operate with high mass resolution and high spatial
resolution at the same time. This is because the instability of the pulsed primary ion

177
beam has to be overcome, forcing the analyst to use long pulses. The pulsed beam also
results in a low duty cycle and depth profiling and imaging experiments can take a long
time to complete. The dual beam approach in which a pulsed metal cluster beam such as
Aun+ or Bin
+ is used to acquire an image and a continuous polyatomic beam such as
SF5+ and C60
+ to sputter the material allows the analysis to be completed on a useful
time scale, but results in a loss of valuable data during sputtering, described in Chapter
4 [Nygren et al., 2008].
The J105 3D Chemical Imager was developed to further explore the capabilities
of ToF-SIMS in imaging of biological samples [Fletcher et al., 2008]. This instrument
has been described in detail in Chapter 2 but briefly, it differs from conventional ToF-
SIMS instrumentation in that the mass spectrometry is decoupled from the sputtering
process. This allows a polyatomic primary ion beam in dc mode to be used providing
optimum conditions for rapid 2D and 3D analysis. Also, the dc mode allows the
analysis to be performed at a high mass resolution while maintaining spatial resolution
irrespective of sample topography and sample type. Furthermore, using the polyatomic
beam in a dc mode on the J105 allows analysis of the whole sample without the need of
the dual beam experiment, see Figure 4.9 in Chapter 4.

178
5.3 Sample Preparation
Sample preparation plays a significant role in acquiring useful and meaningful
data when analysing samples using ToF-SIMS, particularly during sub-cellular imaging
of biological samples. This is because these samples contain a high water content which
if introduced directly into high vacuum causes the cells to rupture and molecules to
relocate during water evaporation in the vacuum. The main challenge that the SIMS
community is presented with is to maintain the biological integrity of these samples
when it is placed in the high vacuum instrument.
Over the years, different sample preparation approaches such as freeze-dried,
freeze-fractured, frozen-hydrated and fixative techniques have been developed in
various SIMS labs to address this issue, discussed below.
Freeze-drying involves rapidly freezing the sample in liquid nitrogen, propane
or isopentane and then transferred in vacuum for several hours for slow and controlled
warm up to a room temperature before analysis to allow the ice to sublime. Fast
freezing is essential to limit the relocation of small molecules or the formation of ice
crystals which can rupture or damage the cell. The sample can also be analysed in a
frozen hydrated state (discussed below) if a cryogenic stage is available [Grovenor et
al., 2006], [Kurczy et al., 2008].
Kurczy et al. (2008) used Tetrahymena cells to show that the cells retain their
two dimensional morphology when freeze-dried but this process causes residues from
media to deposit on and around the cells and when analysed the spectrum is dominated
by Na and polydimethylsiloxane (PDMS). This results in hindering the signal from
organic secondary ions, particularly the PC fragment m/z 184 which gives a high
179
intensity signal in SIMS. Berman et al. (2008) suggested using nonreactive gas such as
argon to gently blow away the media residues residing on the cell surfaces. However,
this protocol requires great care since vigorous drying can cause the cells to rupture and
a loss in molecular information. Furthermore, only blowing by the gas is not sufficient
to obtain interference free spectrum of cells and further washing is required before
freezing. Kurczy et al. (2008) used de-ionised water to remove all the contaminants
from the cells prior to freeze drying. Although, this increased the signal of the PC
fragment m/z 184, it caused the cells to swell due to osmotic pressure and resulted in
altering the morphology of the cells. This effect was also observed by Berman et al.
(2008) when they washed human breast cancer cells, MCF7 with de-ionised water.
As a result, Berman et al. (2008) suggested that an iso-osmotic wash solution is
required to preserve the morphology of the cells and they investigated a range of
washing solutions, 4-(2-hydroxyethyl)-1-piperazineethanesulfonic acid (HEPES),
magnesium acetate, sodium chloride and ammonium acetate. They found ammonium
acetate to work best due to the volatility of this solution, in removing the contaminants
from the cells surface, maintaining the physical morphology of the cells as well as
allowing depth profile of chemicals present in the cytosol.
Another volatile solution that is more routinely used in SIMS is ammonium
formate to remove salts accumulating on the biological sample particularly tissue
sections. This has been extensively used by Sjövall and co-workers and by washing the
samples with 0.15 M ammonium formate for 30s allows to depth profile samples with
characteristics molecular ion and lipids detected through the whole samples [Sjövall et
al., 2004], [Nygren et al., 2003]. This protocol washing in ammonium formate for

180
approx 10-15s followed by freeze-drying was adopted by Vickerman‟s group to
successfully analyse biological samples using ToF-SIMS [Jones et al., 2008], [Fletcher
et al., 2008].
Freeze-fractured, frozen-hydrated involves putting the sample between two
substrates with a spacer bead of same height as the cells, to prevent squashing them and
the sandwich is rapidly frozen in liquid propane, nitrogen or isopentane. Once frozen,
the top substrate is pulled away and the sample is fractured. This method exposes cell
interior for analysis without requiring the washing step or chemical pre-treatment
[Chandra, 2008]. The sample is immediately transferred and analysed on a cryogenic
stage i.e. frozen-hydrated. The freeze-fractured technique was first reported in early
1957 and has been widely used for cell analysis using microscopy. This concept was
adapted and modified by Chandra and Morrison for preparation of cell for imaging
using SIMS [Chandra et al., 1992]. The authors used this sample preparation to map the
distribution of Ca in cell undergoing mitosis and cytokinesis as well as localise boron in
brain tissue for BNCT [Chandra, 2005], [Chandra et al., 2000].
The Winograd group also developed the freeze-fractured sample preparation in
their laboratory in which a sample is placed onto a silicon wafer and is covered with a
silicon shard followed by rapidly freezing in liquid propane. The frozen cells are rapidly
transferred to the cryogenic stage and the sample is fractured in situ to expose the
fractured cell surface for analysis. The group have used this method to localise
membrane lipids in single cells as well as identified cellular sections following freeze-
fracture. This strategy is the most successful in maintaining the integrity and

181
morphology of the cell in 3D and has been regarded as a “gold standard” by Kurczy et
al. (2008).
However, it can be difficult to separate the two surfaces under cryogenic liquid
and fracturing can cause undesirable topography as well as produce low amount of
fractured cells. It can also result in high level of sample charging which cannot be
compensated, even with an electron flood gun. Furthermore, unless the sample can be
rapidly transferred from insertion chamber to the analysis chamber, it can warm up
swiftly resulting in chemical smearing of the sample [Berman et al., 2008].
Thus, to keep the sample preparation, simpler methods such as using a matrix,
trehalose and glycerol [Parry et al., 2005] to help keep the sample in its native have
been reported. Another method which is widely used in microscopy is chemically fixing
the cells. This involves using 70% ethanol, gultraldehyde [Malm et al., 2009] or 4%
formaldehyde to chemically fix the cells. However, by using this method there is danger
of changing the chemistry of the sample under analysis as well as destroying the native
composition of the living cell [Grovenor et al., 2006].
Sjövall and co-workers published a nice study in which they compare the
fixative and drying sample preparation and their effect on the morphology and chemical
structure of the human fibroblast cells. In this study, the authors show that the
morphology of the cells is preserved if the sample is cryo-fixed followed by freeze-
drying. This method is preferred over fixation with gulteraldehyde which is better than
alcohol-drying [Malm et al., 2009].
Another novel method currently under development in the Vickerman‟s group is
cytospinning which involves cytospinning cells or nuclei in solutions onto a clean

182
substrate. The data presented in this paper shows this sample preparation technique to
be robust, allowing biochemistry and architecture of cells to be maintained [Jackson et
al., 2010].
In summary, the literature shows that the best sample preparation method for
maintaining the cell morphology is to use the freeze-fractured, frozen-hydrated strategy.
However, due to the complexity associated with handling of these samples in vacuum
they are not routinely analysed using ToF-SIMS. The J105 has been specifically
designed for biological samples in that it has an automated sample handling system as
well as cryogenic analysis facilities. It has a novel ability to perform an automated
fracturing using a specially designed sample holder referred to as a “mousetrap”,
described in details in Chapter 2. This design has also been adapted by the group in
Sweden to design a “spring-loaded trap system” device for in situ freeze-fracturing
single cells. The group reported ToF-SIMS analysis of freeze-fractured rat
pheochromocytoma (PC12) cells using this device. A Bi+ primary ion beam was used to
generate single cell chemical images with sub-cellular lateral resolution [Lanekoff et
al., 2010].
This Chapter discusses the analysis of a model cell line (HeLa) to demonstrate
the functionality of the new instrument and to provide a comparison between three
different sample preparation techniques, formalin fixed, freeze-dried and freeze-
fractured cells analysed in frozen-hydrated state.
183
5.4 Analysis of a standard cell line, HeLa using ToF-SIMS
HeLa cells are an immortalised cell line that was derived from cervical cancer
cells taken from a patient called Henrietta Lacks, who later died from this disease in
1951. These cells were isolated and have since been cultured and are now extensively
used in research to gain an understanding and knowledge of biological processes. The
typical size of these cells is 20-25 µm with many different strains and they continue to
evolve by sub-culturing. Since, HeLa cells have a large nucleus they are widely used by
biologists to understand the cell cycle, particularly the deoxyribonucleic acid (DNA)
replication that occurs in the s-phase. Figure 5.12, shows the three stages of the s-phase
of HeLa cells acquired using Confocal Laser Scanning Microscope (LSCM) after
labelling the cells BrdU. The s-phase can be divided into three parts, early, mid and late
s-phase. In the early s-phase, Figure 5.12a, transcriptionally active regions become
replicated; in the mid phase transcriptional inactive regions replicate, Figure 5.12b and
in the late s-phase more condensed heterochromatin found at the centromeric region
replicate, Figure 5.12c, [Tortora et al., 2000]. The ultimate aim is to use ToF-SIMS to
study the organisation of DNA replication in HeLa cells and thus these cells were used
as a model system in this project.

184
Figure 5.12 Shows the DNA replication s-phase of HeLa cells labelled with 5-
bromodeoxyuridine acquired using Confocal Laser Scanning Microscope (LSCM). (a)
Early s-phase: most chromatin replicates; (b) Mid s-phase: replication foci appears as
discrete perinuclear sites; (c) Late s-phase: replication foci form large donout shapes
and (d) 3D image of late s-phase.

185
5.4.1 Experimental
5.4.1.1 Cell Culturing
Frozen HeLa cell lines were obtained from Dr D. Jackson and Prof. S. High at
the University of Manchester and were cultured and maintained during the research
project over the two years.
5.4.1.1.1 Thawing the cells
Two small cryogenic tubes containing frozen HeLa cells at -80 °C were placed
in a warm water bath at 37 oC for 1 min after which 1 ml of warm (37
oC) media
(Dulbecco‟s modified eagle medium (DMEM) with 10% fetal bovine serum (FBS)) was
added. The DMEM with 10% FBS is prepared by adding 5 ml of a mixture of penicillin
and streptomycin, 7.5 ml of non-essential amino acids, 7.5 ml of sodium pyruvate, 50
ml of bovine serum and 5 ml of L- glutamine to 500 ml of DMEM. The cells were re-
suspended slowly with a pipette and 0.5 ml of cell solution was transferred to four 25
ml flasks. An aliquot of the media (5ml) was added to each flask and placed in an
incubator at 37 oC and an atmosphere of 5% CO2. The cells were grown until 80%
confluence was obtained in each flask and the media was changed every two days. Once
enough confluence of cells was obtained, the cells were split (passage) every three
consecutive days. Some cells were frozen at -80 oC for future use because high number
of sub-culturing (passage) can cause the cell morphology to change over time. Thus, it
is recommended to passage one cell line 35 times.

186
5.4.1.1.2 Sub-culturing (passaging) and Freezing the cells
Old media was removed from the flask and the cells were washed with 3 ml of
phosphate buffer saline (PBS). 0.5 ml of trypsin was added to the cells and incubated
for 5 min. Once the cells have become detached 2 ml of fresh media was added and the
cells were homogenised, after which 0.5 ml is transferred to the new T 25 flasks. 5 ml
of fresh media was added to the flask and the cells were incubated until enough
confluence is achieved. Some cells were frozen for future use by transferring the
remaining solution containing cells to a 15 ml tube and spun down using a centrifuge at
185 g for 10 min. The media was aspirated and 2 ml of solution containing FBS + 10%
dimethyl sulfoxide (DMSO) was added slowly and the cells were re-suspended in this
solution. 0.5 ml of the cell solution was transferred to the cryogenic tubes and stored in
-80 °C freezer.
5.4.1.2 ToF-SIMS analysis of cells
The cells were grown on two substrates, Si wafers and steel (specifically
designed for the J105 instrument) after coating their surface with 0.1% poly-l-lysine for
15 min. Poly-lysine, a small peptide is routinely used in cell culture as an adhesive for
the attachment of cells and tissues to a solid surface. Polycationic molecules of the
poly-l-lysine bind to the solid surface, leaving the cationic sites to interact with anionic
surfaces of the cells. After aspirating the poly-l-lysine, the substrates were allowed to
dry before placing in the culture plate with cells and incubated for 24 hrs at 37 oC and
an atmosphere of 5% CO2.

187
Secondary electron microscopy (SEM) images were recorded on the J105 using
a 40 keV C60+ primary ion beam after focusing it to match pixel size as verified using a
transmission electron microscopy (TEM) grid. The SEM images show that the cells
grown on poly-l-lysine substrate spread with more defined structure and visible nucleus,
Figure 5.13a, whereas the cells grown on the substrate without any poly-l-lysine fold up
in a ball structure, Figure 5.13b.
Figure 5.13 SEM images of HeLa M cells grown on steel substrate recorded using 40
keV C60+ over an area of 256 × 256 µm
2. (a) Steel substrate coated with poly-l-lysine.
(b) Steel substrate not coated with poly-l-lysine.
Prior to the analysis of biological samples using ToF-SIMS, they have to be
washed in a volatile solution to remove salts that accumulate on the surface. Various
solutions have been investigated by different groups but ammonium formate was found
to work best and is now widely used within the SIMS community. Once a protocol for

188
growing cells on the substrate as well as removing salts from the surfaces was
developed, the cells were ready to be analysed by ToF-SIMS.
Following a wash in the ammonium formate, the cells were rapidly frozen and
freeze-dried in vacuum before analysis. The analysis was performed on the J105
instrument equipped with a 40 keV C60+ and 40 keV Au3
+ primary ion beam operating
in a d.c. mode with bombardment angle of 45◦. Two different mode of analysis were
performed. Firstly, a single 2D image was acquired in which a whole cell is consumed
using the 40 keV Au3+ primary ion beam with current of 250 fA over an area of 107 ×
107 µm2 and 256 × 256 pixels and total ion dose of 3 × 10
14 ions/cm
2. This was
followed by another experiment in which freshly prepared cells were analysed using the
40 keV C60+ primary ion beam over an area 256 × 256 μm
2 and 256 × 256 pixel with a
current of 6 pA. A single 2D image was acquired using a total ion fluence of 3 × 10¹⁴
ions/cm2.
In the second mode of analysis, a series of single image “slices” were acquired
using the primary ion fluency of 3 × 10¹³
ions/cm2 per layer to generate a 3D image. A
total of ten single images were acquired in which a total of 3 × 10¹⁴
ions/cm2
primary
ion fluence was used to remove the entire cell. These cells were prepared using three
different sample preparation techniques, formalin fixation, freeze-drying and frozen-
hydrated analysis following vacuum freeze-fracture of a cell sandwich.
1. Formalin fixed cells were prepared by aspirating the media from the cells
grown on a Si substrate and washed with PBS three times. Then the cells were
chemically fixed by incubating them with 4% formalin for 15 min at 4°C. After fixation

189
the cells were washed with PBS five times followed by Millipore water three times and
finally with 0.15 M ammonium formate for 1 minute to remove salts.
2. Freeze-dried cells were prepared by immediately freezing the cells grown on
a Si substrate in liquid nitrogen following a wash in 0.15 M ammonium formate for 1
min. Then the sample was transferred into the preparation chamber under Ar to prevent
water deposition and freeze-dried in vacuum for 2 hrs.
3. Frozen-hydrated cells were prepared by growing the cells for 24 hrs on poly-l-
lysine coated steel, a hinged two plate substrate specifically designed to fracture
biological samples. After aspirating the culture media and washing in 0.15 M
ammonium formate for 1 minute, the cells were sandwiched between the two metal
plates and rapidly frozen in liquid nitrogen-cooled propane. The frozen cells were
transferred to liquid nitrogen where the steel substrate is mechanically attached onto a
freeze-fractured device “mousetrap” and inserted into the instrument under Ar. The
device was then transferred to a pre-cooled preparation chamber (168 K) and the sample
was fractured in situ by pushing the trigger on the device. This action automatically
releases the top plate of the steel which flips backwards and the sample is fractured. The
fractured sample was transferred to the cryogenic analysis stage (148 K) and cells were
analysed in the frozen-hydrated state. The instrument also incorporates a cryo-shield
fixed above the sample preparation chamber to minimise re-condensation of water
vapour, once the sample is fractured.
The analysis software developed by the SAI Ltd allows viewing and generating
single ion images. Matlab routines have also been developed by A. Henderson in the
Vickerman‟s group to generate better contrast single ion images.

190
5.4.2 Results and Discussion
The main aim behind the development of this instrument was to fully exploit the
potential of ToF-SIMS for single cells imaging. Although, this is extensively being
researched in ToF-SIMS, the technique is confined to reaching its full prospective due
to the limitations associated with the pulsed primary ion beam. The J105 has been fitted
with two primary ion sources operating in a dc mode, Aunn+
cluster ion and the
polyatomic C60n+
projectile. The cells were analysed in 2D and 3D modes, discussed
below.
5.4.2.1 2D analysis
Firstly, the cells were analysed in a 2D mode in which a whole cell is consumed
using a dc primary ion beam, Au3+ cluster and polyatomic C60
+ to provide a comparison
between the two beams. The 2D image generated is more comparable to a bright-field
microscope image of a cell except that no labelling is required in ToF-SIMS.
Figure 5.14 show a single 2D ToF-SIMS total ion image of rapidly frozen
freeze- dried HeLa cells, acquired using Au3+
cluster primary ion beam, focused to 300
nm over 3.5 hrs. A 2D image of cells was also acquired using a 40 keV C60+ polyatomic
beam focussed to 700 nm with an ion fluence of 3 × 10¹⁴
ions/cm2
over 3.5 hrs (image
not shown). The figure shows that a highly focused total ion image can be obtained
using LMIS in which the beam can be focused to a smaller spot size as compared to the
gas cluster C60+ projectile.

191
Figure 5.14 2D total ion ToF-SIMS image of HeLa cells acquired on the J105 3D
Chemical Imager using acquired using the 40 keV Au3+
primary ion beam over a field
of view of 107 × 107 µm2, 256 × 256 pixels and total ion dose of 3 × 10
14 ions/cm
2.
Some of the ions commonly imaged in the cells and the tissues in ToF-SIMS
literature were selected to generate single images to map their distribution in the HeLa
cells. Firstly, fragment of lipids were selected, which form a major component of living
cells and tissues and are easily ionised relative to other bio-molecules. The PC head-
group m/z 184, a highly abundant lipid in the cell that has also been used as a biomarker
for cells is frequently imaged in cells and tissues following ToF-SIMS analysis
[Brietenstein et al. 2007], [Nygren et al., 2005]. Figure 5.15 shows the distribution of
the PC head-group m/z 184 and its associated fragments m/z 86 (which can also be
assigned to an immonium ion of leucine) and m/z 104, generated following Au3+ impact,
Figure 5.15 a-c and C60+, Figure 5.15 d-f. On examining the figure one can see
immediately a huge difference between the two beams. The PC head-group m/z 184
clearly localises to the plasma membrane of the HeLa cells when imaged following C60+

192
bombardment, Figure 5.15f; whereas when imaged using the Au3+ the signal is more
spread over the cells, Figure 5.15c.
Further, amino acid ions were also imaged using both beams, Figure 5.16. Again
it is evident that the distributions of amino acids m/z 120 fragment of phenylalanine,
glycine or methionine, Figure 5.16d; m/z 130 fragment of glutamic acid, glutamine or
tryptophan, Figure 5.16e; and m/z 170 fragment of tryptophan, Figure 5.16f, are
distributed inside the cells when imaged using the C60+. However, when these ions are
imaged using the Au3+, they appear to be scattered and localise at the same place as the
lipid fragments, Figure 5.16 a-c.
A similar result is seen when the DNA and ribonucleic acid (RNA) bases are
imaged, Figure 5.17. A cell consists of two types of nucleic acids; DNA which contains
genetic information and RNA which transmit instructions from genes for protein
synthesis. DNA is double strand polymer chains, composed of nucleotides which
consist of a nitrogen base, deoxyribose sugar and a phosphate group. There are four
different bases in DNA, adenine, guanine, cytosine and thymine. RNA differs from
DNA in that it is a single strand consisting of a ribose sugar and uracil base instead of
thymine. There are three different types of RNA, messenger RNA, ribosomal RNA and
transfer RNA and each possess a specific function in protein synthesis [Tortora et al.,
2000]. When the nitrogenous bases, adenine fragments m/z 119 [ C5H3N4]+, Figure
5.17a, m/z 136 [C5H6N5]+ (can also be assigned to an immonium ion of amino acid
tyrosine), Figure 5.17b, guanine fragments m/z 135 [C5H3N4O]+, Figure 5.17c, thymine
fragment 127 [C5H7N2O2]+, Figure 5.17d, cytosine 223 [C8H11N6O2]
+, Figure 5.17e and
uracil m/z 225 [C8H9N4O4]+, Figure 5.17f, are imaged using the C60
+ they localise to the

193
centre of the cells as they arise from the nuclear DNA and RNA. However, when these
ions are imaged using the Au3+ ion beam, the signal levels appears to be low and
dispersed over the whole cell , data not shown [Fletcher et al., 2008], [Rabbani et al.,
2010].
This effect is seen because upon impact the LIMIS, Au3+ sources penetrate
deeper than the polyatomic sources causing damage to the sub-surface region; and at
ion fluence higher than the static limit an increasingly damaged surface is analysed
resulting in a decrease in the signal levels of secondary ion
However, the polyatomic beam C60+ offers the advantages of higher secondary
ion signal and low sub-surface damage, allowing the static limit to be relaxed. By using
the C60+
beam at high ion dose, one can access a whole sample referred to as „voxels‟
rather than pixels which also increases the sensitivity. Thus, by analysing HeLa cells
using the C60+ primary ion beam a clear differentiation between the lipid membrane and
nuclear material can be made.

194
Figure 5.15 2D ToF-SIMS images of PC head-group m/z 184 and its fragments of
rapidly frozen freeze-dried HeLa cells acquired on the J105 with cluster LMIS Au3+ (a-
c) and polyatomic C60+ (d-f). (a) and (d) m/z 86.10 and (b) and (e) m/z 104.10 fragment
of PC head-group. (c) and (f) m/z 184.10 PC head-group. Maximum counts per pixel
(mc) for each mass is displayed.

195
Figure 5.16 2D ToF-SIMS images amino acids of rapidly frozen freeze-dried HeLa
cells acquired on the J105 with cluster Au3+ (a-c) and C60
+ (d-f). (a) and (d) m/z 120
fragment of phenylalanine, glycine or methionine; (b) and (e) m/z 130, fragment of
glutamic acid, glutamine or tryptophan; (c) and (f) m/z 170 fragment of tryptophan.
Maximum counts per pixel (mc) for each mass is displayed.

196
Figure 5.17 2D ToF-SIMS images of DNA and RNA nitrogenous bases of rapidly
frozen freeze-dried HeLa cells acquired on the J105 instrument using 40 keV C60+
primary ion beam. Adenine fragments (a) m/z 119 [C5H3N4]+, (b) m/z 136 [C5H6N5]
+;
guanine fragment (c) m/z 135 [C5H3N4O]+; thymine fragment (d) m/z 127 [C5H7N2O2]
+;
cytosine (e) m/z 223 [C8H11N6O2]+; and uracil (f) m/z 225 [C8H9N4O4]
+. Maximum
counts per pixel (mc) for each mass is displayed.
The 2D images of HeLa cells in which a whole cell is analysed using the 40 keV
C60+ on the J105 are more comparable to the 3D imaging of normal rat kidney cells
(NRK) reported by Hagenhoff and co-workers. In this study NRK cells were analysed
in 3D using C60+ beam as a sputtering and Bi3
+ as the analysis beam. The images

197
generated show PC head-group m/z 184 to localise to the cell membrane and amino
acids to the inside of the cell after 45th sputter cycle, Figure 5.11. Although similar
images are produced, the NRK study was completed using dual beam experiment in
which a valuable sample has been wasted during the etch cycle. This is where the J105
shows the potential benefits of analysing cells using a dc polyatomic beam in which a
whole sample is consumed without needing to etch. Further, this data also highlights
that the C60+ can now be used to detect molecular species on a sub-cellular scale over a
suitable time frame (3.5 hrs) by exceeding the static primary ion fluence.
HeLa cells were also analysed on the conventional ToF-SIMS, the BioToF using
monoatomic, Au+ primary ion beam, Figure 5.18. The analysis was completed under
static conditions in which it has not been possible to detect the nuclear material, Figure
5.18b and the PC signal is homogenous over the cell, characterised to the outer
membrane, Figure 5.18c. These images are similar to the images of cells found in
literature when analysed using conventional ToF-SIMS under static conditions. A study
by Ewing and Winograd show the PC head-group to homogenously localise to the top
surface of the Tetrahymena protozoa cells [Ostrowski et al., 2004].
Additionally, if a single beam experiment in which a whole cell is consumed
was repeated on the conventional ToF-SIMS system running at 10 kHz with 100 nsec
pulse would take 1000 times longer to accomplish due to the pulsed nature of the
primary beam.

198
Figure 5.18 2D surface image of HeLa cells acquired on the conventional ToF-SIMS
instrument, the BioToF using monoatomic 20 keV Au+ primary ion beam over a field of
view 105 × 105 µm2 and ion dose of 5 × 10
12 ions/cm
2.
5.4.2.2 3 D analysis
Although a whole cell analysis can be performed in a routinely workable
analysis time (3.5 hrs), there is still a need to follow the evolution in biochemistry with
depth, hence the need for 3D analysis. On the conventional ToF-SIMS, 3D imaging is
accomplished using the interleaved mode in which one beam based on a LMIS is used
for imaging and the second such as polyatomic ion is used to remove the damage
caused by the LMIS. These dual beams approach produces very successful results
although there is a loss of valuable sample during the etch cycle, motioned above.
However, on the J105 a continuous polyatomic primary ion beam is used which allows
all the material to be sampled and recorded, hence increasing the sensitivity.
Figure 5.19 shows 3D analysis of formalin fixed HeLa M cells in which the PC
signal m/z 184 is monitored with depth. This method of sample preparation is

199
extensively applied to fix live cells prior to analysis by microscopy. Fixation can either
be performed using organic solvent such as 70% ethanol or cross-linking agents such as
formalin. The former can result in dehydration of cells, eradication of lipids and
precipitate proteins on the cell surface. The latter, formalin fixation only fixes the
proteins by forming intermolecular bridges between the free amino acids but does not
fix the lipids or the carbohydrates. However, it can preserve the cell morphology better
than the organic solvent [IHC].
Under static conditions, the PC signal is distributed homogenously over the cell
as seen above, Figure 5.18. However, in 3D imaging the PC signal although is
homogenous in layer 1, Figure 5.19a, but it becomes localised to regions surrounding
nucleus, Figure 5.19d as the depth profile progresses. This increase in the signal is
attributed to the organelle membranes and lipid rich regions that extend from the
nucleus which specify the presence of the endoplasmic reticulum. This image shows
that one of the cells is at the dividing stage, mitosis, in the cell cycle as indicated by the
arrow. Only two of the three cells are fully consumed by layer 10. Clearly the dividing
cell will need higher ion fluence to be fully removed [Rabbani et al., 2010].
The ion at m/z 120 fragment of amino acids also follows the same distribution, it
is diffused at the surface in layer 1 but becomes localised to the centre of the cell as it is
sputtered by etching, Figure 5.20. This data demonstrates the benefits of 3D imaging as
it allows one to retrospectively examine the chemistry at every point of the cell as a
function of depth, which would not be possible if only 2D images are acquired at pre-
determined depths using the interleaved dual beam experiment described above.

200
Figure 5.19 3D analysis of formalin fixed HeLa cells on the J105 using continuous 40
keV C60+ primary ion beam in which m/z 184.06 is imaged from layer 1 (a) to layer 10
(j), each layer acquired with a fluence of 3 × 10¹³
ions/cm2, over a field of view of 256
× 256 µm2
and 256 × 256 pixels. Maximum counts per pixel (mc) for each layer is
displayed Reproduced from Rabbani et al. 2010.

201
Figure 5.20 3D analysis of formalin fixed HeLa cells on the J105 using continuous 40
keV C60+ primary ion beam in which m/z 120.10 is imaged from layer 1 (a) to layer 10
(j), each layer acquired with a fluence of 3 × 10¹³
ion/cm2, over a field of view of 256 ×
256 µm2
and 256 × 256 pixels. Maximum counts per pixel (mc) for each layer is
displayed.
Another feature of this instrument is that the analysis can be performed at a high
mass resolution as illustrated in Figure 5.21. At the nominal mass m/z 104 there are
three different peaks which when imaged localise at three different locations. The
inorganic peak m/z 103.95 is assigned to a salt NaKCNO+, Figure 5.21 d-f which
localises within the cell. An unknown organic m/z 104.05, Figure 5.21 a-c can be
localised both inside and at lower intensity, around the cell. Another organic ion at m/z
104.10, Figure 5.21 g-i localises around the lipid membrane which would suggest that it
is a fragment of the PC head- group m/z 184.06. This differentiation between the
organic peak m/z 104.05 and the PC fragment m/z 104.10 is achieved at mass resolution

202
of 4000, which demonstrate the ability to maintain good mass resolution along with
good spatial resolution. Furthermore, the spatial separation can only be visualised
because the data was acquired as a series of layers as part of a 3D analysis. The
inorganic peak m/z 103.95 appears broad compared to other peaks which suggest that
there are multiple species of similar masses present and mass resolution higher than
4000 is required to resolve them.
Figure 5.21 Illustrates the importance of maintaining high mass resolution during
analysis and 3D imaging. (a-c) m/z 104.05 unknown (d-f) m/z 103.95 NaKCNO+ and (g-
i) m/z 104.10 fragment of PC head-group. Maximum counts per pixel (mc) for each
mass and each layer is displayed. Reproduced from Rabbani et al. 2010.

203
Another aspect of this study was to investigate the different sample preparation
procedures, formalin fixed, freeze-dried and freeze-fractured analysed in frozen
hydrated state. As mentioned above, sample preparation plays a vital role in ToF-SIMS
analysis of biological samples as the integrity and distribution of chemical species has
to be maintained in a high vacuum. There are many different sample preparations under
investigation but yet there is no agreement on the optimum procedure the analyst can
follow during ToF-SIMS analysis of biological samples.
Figure 5.22 shows a comparison between the three different sample preparations
explored for the analysis of HeLa cells. Two ions m/z 184 and m/z 136 were used to
illustrate changes occurring in the distribution of nuclear and membrane as a function of
depth. The nuclei appear to be similar for all three sample preparations but there is
significant difference in the lipid distribution. The data shows that when the cells are
analysed in freeze-fractured frozen-hydrated state, the peak m/z 184 (green) can be
localised around the lipid membrane of the cell on layer 1, Figure 5.22a, whereas in the
freeze-dried and formalin fixed cells the m/z 184 is more diffuse and extends outside the
cells, Figure 5.22d and Figure 5.22g. This effect was observed because the formalin
fixation preserves the morphology of the cell through cross linking the proteins but does
not fix the lipids and carbohydrates. Thus, these molecules are free to move and when
the sample is placed in high vacuum they may become redistributed or migrate to the
top surface of the sample. Similar effect is also observed when the cells are analysed in
the freeze-dried state, Figure 5.22d. However, a clear localisation of the lipids initially
in the freeze-fractured frozen-hydrated state suggests that during the fracturing process
the top membrane may have been removed and the nucleus has been exposed, or the

204
redistribution of lipid membrane and other components is avoided by maintaining the
sample cold and fully hydrated. Following 1st layer acquisition, all samples show the
similar distribution of PC which increases around the nucleus as the depth profile
progresses until all the material is consumed.
The adenine fragment m/z 136 has been perceived to behave differently in the
three sample preparation methods. In the formalin and freeze-dried cells it spreads over
the whole cells, representing their shape. However, with respect to the freeze-fractured
frozen hydrated, the signal can be mapped to the centre of the cell which increases as
the profile progresses towards the nucleus.
Further observing the spectra of the three sample preparation techniques it can
be concluded that high signal levels are achieved when the sample is analysed in the
frozen hydrated state as compared to the formalin fixed and freeze-dried, Figure 5.23.
When 1st layer is acquired the intensity of m/z 184 is 1.6 × 10
6 for freeze-fractured
frozen hydrated, 5.0 × 10⁵ for fixed and 3.0 × 10
6 for freeze-dried. Overall high signal
levels are obtained when the cell is analysed in frozen-hydrated state as compared to the
other two sample preparation methods.
This increase in the signal levels could be due to increase in the ionisation
efficiency due to the presence of water matrix. In the presence of water matrix, an
increase in the amount of proton is seen during the sputtering process which helps to
promote the formation of [M+H]+, thus increasing the secondary ion signal. A number
of studies have been published which show that the presence of water matrix results in
an increase in the secondary ion yields of molecular species [Roddy et al., 2003],

205
[Piwowar et al., 2010]. Thus, the data validates that the spatial integrity and chemical
distribution of the cells is preserved when they are analysed in a frozen hydrated state.

206
Figure 5.22 A comparison of three different sample preparations, freeze-fracture
frozen-hydrated (a-c), freeze-dried (d-f) and formalin fixed (g-i) for the m/z 184.06
(green) and m/z 120.10 (red) shown in colour-overlay. The figure shows an increase in
primary ion fluence from left to right with each layer obtained using a fluence of 3 ×
1013
ions/cm2 acquired over a field of view 256 x 256 µm
2 and 256 x 256 pixels.
Maximum counts per pixel (mc) for each mass and each layer are: (a) m/z 184.06
mc:604; m/z 120.10 mc:401 (b) m/z 184.06 mc:552; m/z 120.10 mc:367 (c) m/z 184.06
mc:588; m/z 120.10 mc:402 (d) m/z 184.06 mc:1096; m/z 120.10 mc:301 (e) m/z 184.06
mc:481; m/z 120.10 mc:263 (f) m/z 184.06 mc:400; m/z 120.10 mc:285 (g) m/z 184.06
mc:687; m/z 120.10 mc:405 (h) m/z 184.06 mc:569; m/z 120.10 mc:286 (i) m/z 184.06
mc:550; m/z 120.10 mc:297. Reproduced from Rabbani et al. 2010.
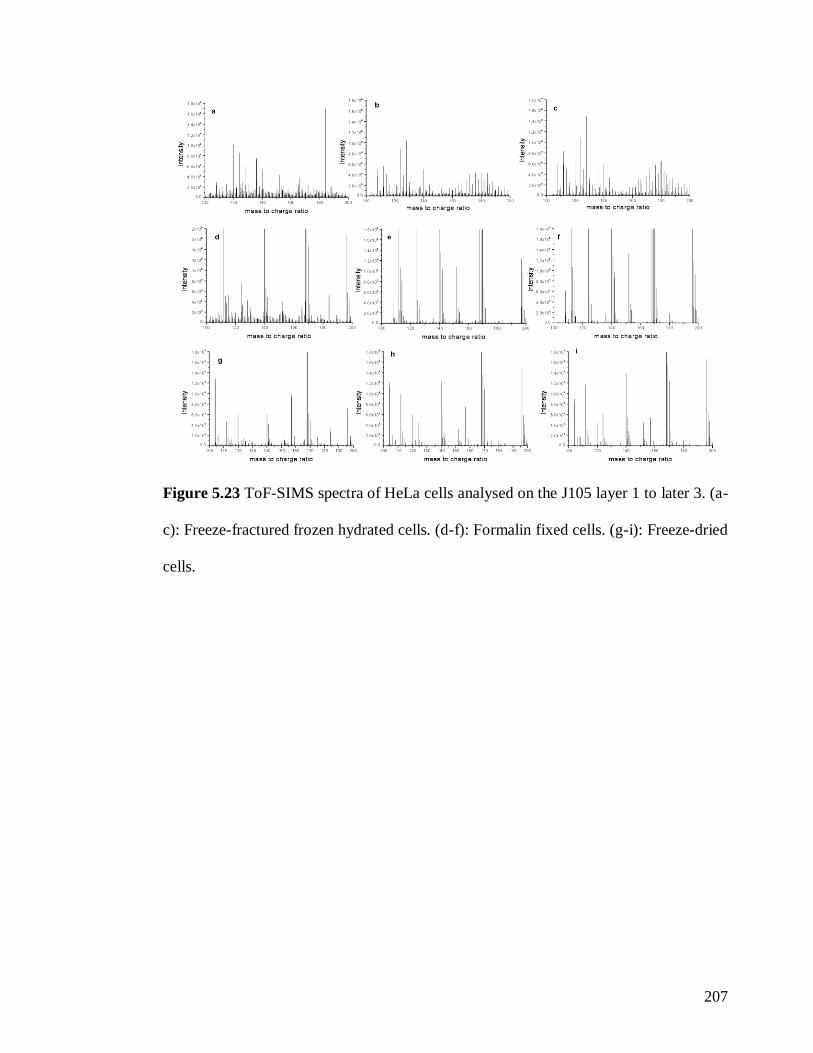
207
Figure 5.23 ToF-SIMS spectra of HeLa cells analysed on the J105 layer 1 to later 3. (a-
c): Freeze-fractured frozen hydrated cells. (d-f): Formalin fixed cells. (g-i): Freeze-dried
cells.
208
5.4.3 Data Analysis tools
The spectral data of the biological samples acquired on ToF-SIMS can be very
complex due to the complex nature of the sample and can present many challenges to
the analyst. Further, acquiring data at high mass and spatial resolution at the same time,
particularly with 3D analysis can be difficult to manipulate and visualise due to the
large size of the data set. Various data analysis tools are being developed to reduce the
dimensionality of the data set in which multivariate analysis is proving to be a
successful and is routinely being used.
Multivariate allows simplification of the data set so that valuable and
constructive information can be obtained from complex spectra and images. It allows
enhancement of image contrast, recognize and classify significant areas as well as
output the variables in m/z values associated with these areas so they can be chemically
identified [Fletcher et al., 2006], [Vaidyanathan et al., 2008], [Lee et al., 2008). A
number of studies have been published in which multivariate analysis has proven to be a
valuable tool to differentiate between ToF-SIMS data for categorising proteins [Wagner
et al., 2001], as well as identify different microorganisms [Thompson, et al., 2006] .
The two most common processing tools used in multivariate analysis include
principal component analysis (PCA) and maximum autocorrelation factor (MAF).
Comparative studies of PCA and MAF on SIMS data have indicted that for SIMS
imaging MAF generates better images. MAF transforms the data set by maximising
autocorrelation between the neighbouring pixels and offers the advantages of enhanced
image contrast as it is independent of pre-processing and recognises fine features that

209
can be visualised in single image peaks, often limited in the PCA [Tyler et al., 2007],
[Wagner et al., 2004], [Larsen, et al., 2002], [Nielsen, et al., 1998].
MAF was preformed on the HeLa cells data acquired using Au3+ ion beam.
MAF 5 is able to capture some variations in signal between the cell membrane and
nuclear material. However, the loading plot does not show any clear separation on the
peaks responsible for this variation due to the limitation of signal per pixel, Figure 5.24.
Conversely, MAF analysis on the C60+ image data generates better results. MAF
4 produces a variation in signal between the cell membrane and nuclear material, Figure
5.25. Since there is more signal per pixel, the loading plot can now be interpreted and
individual peaks can be imaged. Figure 5.25 shows that the two masses responsible for
the differentiation between the nucleus and the plasma membrane are, m/z 136 adenine
found in the nucleus and m/z 184 PC head-group present in the plasma membrane.
Figure 5.24 MAF performed on HeLa cells data acquired using 40 keV Au3+.

210
Figure 5.25 MAF performed on HeLa cells data acquired using 40 keV C60+.
New software, 4D ToF-SIMS for the visualisation and analysis of 3D data set
acquired on the J105 is currently being developed by the Vickerman group in
collaboration with Reichenbach and co-workers. Currently the J105 instrument
produces 3D data set with tens of thousands of ToF channels which cannot be managed
in a fast memory of normal computer system and general imaging software are limited.
Thus for 3D visualisation and analysis, software which is memory and computational
efficient is required. According to Reichenbach et al. (2009) there are three issues
which need to be addressed for rapid, real time visualisation of a large 3D hyperspectral
data:
Compression of the data set for rapid visualisation;

211
3D hyperspectral interactivity;
clustering and categorising of spatial and spectral information.
Two ions, m/z 184 and /z 120 were selected and imported into the 4D ToF-SIMS
software for 3D visualisation, Figure 5.26. This software is still under development and
new tools are being developed for enhanced visualisation of the 3D data set.
Figure 5.26 3D images visualised in 4D ToF-SIMS software, (a) PC head group m/z
184 and (b) fragment of amino acids m/z 120.

212
5.4.3 Conclusion
A model cell line, HeLa cells have been used to prove concept and the success
of the instrument J105 3D Chemical Imager for high mass resolution, high sensitivity
and sub-cellular imaging. The polyatomic primary ion beam C60+ offers the possibility
of much better if not good sensitivity in 2D imaging at sub-µm spatial resolution
together with the opportunity of delving into the chemistry below the surface over a
suitable time frame (3.5 hrs). Using a dc primary beam and decoupling it from the mass
spectrometry allows one to fully explore the potential of the C60+ for imaging and a
clear differentiation between the material within the nuclei and the lipid membrane can
be made. By maintaining high mass resolution during imaging enables much greater
chemical information to be obtained from the data, but this in turn will place greater
demands on data processing tools. 3D analysis of cells allows one to monitor the
distribution and change in chemistry with depth.
Sample preparation will be a key issue in future cell analyses and initial studies
suggest that the formalin fixed can preserve the cell to some degree but redistribution of
lipids may occur. Additionally, the analysis in frozen hydrated state reveals better
localisation of nuclear material with an increase in signal levels, thus is a preferable
method for the analysis of biological samples.
213
5.5 Summary
The aim of this chapter was firstly to highlight the limitations associated with
the conventional ToF-SIMS for single cell imaging and secondly how this can be
overcome by capitalising on the features of C60+ polyatomic ion for imaging on the new
instrument, J105 3D Chemical Imager. A standard cell line, HeLa cells have been used
to emphasise key features of the instrument: sensitivity, imaging at high mass resolution
with high spatial resolution and high throughput analysis with greatly reduced time. The
data presented shows the clear capability to produce mass spectrometric images of
single cells and identify cellular compartments such as the nucleus, the endoplasmic
reticulum and plasma membrane in 2D and 3D modes.
Three different sample preparation techniques, formalin fixed, freeze-dried and
freeze-fractured frozen hydrate were also investigated and the preliminary data suggests
that frozen-hydrated may be beneficial in analysing cells in a lifelike form.
Since a large data set is being generated on the J105, new tools and methods are
required for the manipulation and visualisation of the data which has been briefly
touched on.

214
References
Baker, M.J.; Zheng, L.; Winograd, N.; Lockyer, N.P.; Vickerman, J.C. Mass spectral
imaging of glycophospholipids, cholesterol, and glycophorin A in model cell
membranes. Langmuir (2008) 24 (20), 11803-11810
Bennett, B.D.; Zha, X.; Gay, I.; Morrison, G.H. Intracellular boron localization and
uptake in cell cultures using imaging secondary ion mass spectrometry (ion
microscopy) for neutron capture therapy for cancer. Biology of the Cell (1992), 74
(1), 105-108
Berman, E.S.F.; Fortson, S.L.; Checchi, K.D.; Wu, L.; Felton, J.S.; Wu, K.J.J.; Kulp,
K.S. Preparation of Single Cells for Imaging/Profiling Mass Spectrometry Journal
of the American Society for Mass Spectrometry (2008), 19 (8),1230-1236
Börner, K.; Malmberg, P.; Månsson, J.-E.; Nygren, H. Molecular imaging of lipids in
cells and tissues International Journal of Mass Spectrometry (2007),
260 (2-3), 128-136
Braun, R.M.; Blenkinsopp, P.; Mullock, S.J.; Corlett, C.; Willey, K.F.; Vickerman, J.C.;
Winograd, N. Performance characteristics of a chemical imaging time-of-flight
mass spectrometer. Rapid Communications in Mass Spectrometry (1998), 12 (8),
1246-1252
Breitenstein, D.; Rommel, C.E.; Möllers, R.; Wegener, J.; Hagenhoff, B. The chemical
composition of animal cells and their intracellular compartments reconstructed
from 3D mass spectrometry. Angewandte Chemie - International Edition (2007), 46
(28) 5332-5335
Castaing, R.; Slodzian, G. Analytical microscopy by secondary ion imaging
techniques. Journal of Physics E: Scientific Instruments (1981), 14 (10), 1119-1127
Chandra, S. 3D subcellular SIMS imaging in cryogenically prepared single cells.
Applied Surface Science (2004), 231–232, 467–469
Chandra, S. Quantitative imaging of subcellular calcium stores in mammalian
LLC-PK1 epithelial cells undergoing mitosis by SIMS ion microscopy. European
Journal of Cell Biology (2005), 84 (9), 783-797
Chandra, S.; Lorey II, D.R. SIMS ion microscopy imaging of boronophenylalanine
(BPA) and 13C15N-labeled phenylalanine in human glioblastoma cells: Relevance
of subcellular scale observations to BPA-mediated boron neutron capture therapy
of cancer International Journal of Mass Spectrometry (2007), 260 (2-3), 90-101

215
Chandra, S.; Morrison, G.H. Sample preparation of animal tissues and cell cultures
for secondary ion mass spectrometry (SIMS) microscopy. Biology of the Cell
(1992), 74 (1), 31-42
Chandra, S.; Smith, D.R.; Morrison, G.H. Subcellular Imaging by Dynamic SIMS
Ion Microscopy by imaging isotopes, the transport of ions, molecules, and
therapeutic drugs can be studied in single cells. Analytical Chemistry (2000), 72
(3),104A-114A
Chandra, S. Challenges of biological sample preparation for SIMS imaging of
elements and molecules at subcellular resolution Applied Surface Science (2008),
255 (4), 1273-1284
Clerc, J.; Fourré, C.; Fragu, P. Sims microscopy: Methodology, problems and
perspectives in mapping drugs and nuclear medicine compounds. Cell Biology
International (1997), 21 (10), 619-633
Cliff, B.; Lockyer, N.; Jungnickel, H.; Stephens, G.; Vickerman, J.C. Probing cell
chemistry with time-of-flight secondary ion mass spectrometry: Development and
exploitation of instrumentation for studies of frozen-hydrated biological material.
Rapid Communications in Mass Spectrometry (2003), 17 (19), 2163-2167
Colliver, T. L.; Brummel, C. L.; Michaeleen L. Pacholski, M. L.; Swanek, F. D.; Ewing,
A. G.; Winograd, N. Atomic and Molecular Imaging at the Single-Cell Level with
TOF-SIMS. Analytical Chemistry (1997), 69, 2225-2231
Davies, N.; Weibel, D.E.; Blenkinsopp, P.; Lockyer, N.; Hill, R.; Vickerman, J.C.
Development and experimental application of a gold liquid metal ion source.
Applied surface science (2003), 203-204, 223-227
Davies, S.G., Kurczy, M.E., Roddy, T.P., Winograd, N., Ewing, A.G. Secondary ion
MS imaging to relatively quantify cholesterol in the membranes of individual cells
from differentially treated populations. Analytical Chemistry (2007), 79 (10) 3554-
3560
Fletcher, J. S. Cellular imaging with secondary ion mass spectrometry. Analyst
(2009), 134, 2204–2215
Fletcher, J.S.; Lockyer, N.P.; Vaidyanathan, S.; Vickerman, J.C. TOF-SIMS 3D
biomolecular imaging of Xenopus laevis oocytes using buckminsterfullerene (C60)
primary ions Analytical Chemistry (2007) 79(6) 2199-2206
Fletcher, J.S.; Lockyer, N.P.; Vickerman, J.C. Developments in molecular SIMS
depth profiling and 3D imaging of biological systems using polyatomic primary
ions. Mass Spectrometry Reviews (2010)

216
Fletcher, J.S.; Vickerman, J.C. A news SIMS paradigm for 2D and 3D molecular
imaging of bio-systems. Analytical and Bioanalytical Chemistry (2010), 396, 85-104
Fletcher, J.S; Handerson, A; Jarvis, R.M; Lockyer, N.P; Vickerman, J.C; Goodacre, R.
Rapid discrimination of casual agents of urinary tract infection using ToF-SIMS
with chemometrics cluster analysis. Applied Surface Science (2006) 252 (19), 6869-
6874
Fletcher, J.S.; Rabbani, S.; Henderson, A.; Blenkinsopp, P.; Thompson, S.P.; Lockyer
N. P.; Vickerman, J.C. A new dynamic in mass spectral imaging of single biological
cells. Analytical Chemistry, (2008), 80 (23), 9058-9064
Gazi, E.; Dwyer, J.; Lockyer, N.; Gardner, P.; Vickerman, J.C.; Miyan, J.; Hart, C.A.;
Brown, M.; Shanks, J.H.; Clarke, N. The combined application of FTIR
microspectroscopy and ToF-SIMS imaging in the study of prostate cancer. Faraday
Discussions (2004), 126, 41-59
Grovenor, C.R.M.; Smart, K.E.; Kilburn, M.R.; Shore, B.; Dilworth, J.R.; Martin, B.;
Hawes, C.; Rickaby, R.E.M.; Specimen preparation for NanoSIMS analysis of
biological materials. Applied Surface Science (2006), 252 (19) 6917-6924
Guerquin-Kern, J.-L.; Wu, T.-D.; Quintana, C.; Croisy, A. Progress in analytical
imaging of the cell by dynamic secondary ion mass spectrometry (SIMS
microscopy). Biochimica et Biophysica Acta - General Subjects (2005), 1724 (3),228-
238
IHC website: http://www.ichworld.com/_protocols/general_ICC/fixation.htm
accessed on 6-08-2010
Jackson, E.R.J.; Vickerman, J.C.; Lockyer, N.P. A Systematic Evaluation of
Cytospinning as a Novel Technique for the preparation of Cells for ToF-SIMS
Analysis. Surface and Interface Analysis submitted
Jones, E.A.; Lockyer, N.P.; Vickerman, J.C. Depth profiling brain tissue sections
with a 40 keV C60+ primary ion beam. Analytical Chemistry (2008), 80 (6), 15,
2125-2132
Jones, E.A.; Lockyer, N.P.; Vickerman, J.C. Mass spectral analysis and imaging of
tissue by ToF-SIMS—The role of buckminsterfullerene, C60+, primary ions
International Journal of Mass Spectrometry (2007), 260, 146–157
Kollmer, F. Cluster Primary Ion Bombardment of Organic Materials. Applied
Surface Science (2004), 231-232, 153-158
Kötter, F.; Benninghoven, A. Secondary ion emission from polymer surfaces under
Ar+, Xe
+ and SF5
+ ion bombardment. Applied Surface Science (1998), 133, 47-57

217
Kozole, J.; Szakal, C.; Kurczy, M.; Winograd, N. Model multilayer structures for
three-dimensional cell imaging. Applied Surface Science (2006), 252 (19), 6789-
6792
Kurczy, M.E.; Piehowski, P.D.; Parry, S.A.; Jiang, M.; Chen, G.; Ewing, A.G.;
Winograd, N. Which is more important in bioimaging SIMS experiments-The
sample preparation or the nature of the projectile? Applied Surface Science (2008),
255 (4), 1298-1304
Lanekoff, I.; Kurczy, M.E.; Hill, R.; Fletcher, J.S.; Vickerman, J.C.; Winograd, N.;
Sjövall, P.; Ewing, A.G.; Time of flight mass spectrometry imaging of samples
fractured in situ with a spring-loaded trap system. Analytical Chemistry (2010),
82 (15) 6652-6659
Larras-Regard, E.; Mony, M.-C. Scanning ion images; analysis of pharmaceutical
drugs at organelle levels. International Journal of Mass Spectrometry and Ion
Processes (1995), 143 (C), 147-160
Larsen, R. Decomposition using maximum autocorrelation factors. Journal of
Chemometrics (2002), 16, 427-435
Lechene, C.; Hillion, F.; McMahon, G.; Benson, D.; Kleinfeld, A.M.; Kampf, J.P.;
Distel, D.; Luyten, Y.; Bonventre, J.; Hentschel, D.; Park, K.M.; Ito, S.; Schwartz, M.;
Benichou, G.; Slodzian, G. High-resolution quantitative imaging of mammalian
and bacterial cells using stable isotope mass spectrometry. Journal of Biology
(2006) 5
Lee, J.L.S; Gilmore, I.S; Seah, M.P. Quantification and methodology issues in
multivariate analysis of ToF-SIMS data for mixed organic systems. Surface
Interface Analysis (2008), 40 (1), 1-14
Levi-Setti, R.; Gavrilov, K.L.; Strissel, P.L.; Strick, R. Ion microprobe imaging of
44Ca-labeled mammalian chromosomes. Applied Surface Science (2004), 231-232,
479-484
Liebl, H.J. Ion microprobe mass analyser. Journal of Applied Physics (1967), 38(13),
5277-5283
Malm, J.; Giannaras, D.; Riehle, M.O.; Gadegaard, N.; Sjövall, P. Fixation and
drying protocols for the preparation of cell samples for time-of-flight secondary
ion mass spectrometry analysis Analytical Chemistry (2009), 81 (17), 7197-7205
Malm, J.; Giannaras, D.; Riehle, M.O.; Gadegaard, N.; Sjövall, P. Fixation and drying
protocols for the preparation of cell samples for time-of-flight secondary ion mass
spectrometry analysis. Analytical Chemistry (2009), 81 (17) 7197-7205

218
Malmberg, P.; Kriegeskotte, C.; Arlinghaus, H.F.; Hagenhoff, B.; Holmgren, J.;
Nilsson, M.; Nygren, H. Depth profiling of cells and tissues by using C60+ and SF5
+
as sputter ions. Applied Surface Science (2008), 255 (4), 926-928
McQuaw, C.M.; Sostarecz, A.G.; Zheng, L.; Ewing, A.G.; Winograd, N. Investigating
lipid interactions and the process of raft formation in cellular membranes using
ToF-SIMS. Applied Surface Science (2006), 252 (19), 6716-6718
McQuaw, C.M.; Sostarecz, A.G.; Zheng, L.; Ewing, A.G.; Winograd, N. Lateral
heterogeneity of dipalmitoylphosphatidylethanolamine - Cholesterol langmuir -
Blodgett films investigated with imaging time-of-flight secondary ion mass
spectrometry and atomic force microscopy. Langmuir (2005), 21 (3) 807-813
Morrison, G.H.; Slodzian G. The ion microscope opens new vistas in many fields of
science by its ability to provide spatially resolved mass analysis of solid surfaces,
Analytical Chemistry (1975), 47 (11)
Nielsen, A.A; Conradsena, K; Simpson, J.J. Multivariate Alteration Detection
(MAD) and MAF Postprocessing in Multispectral, Bitemporal Image Data: New
Approaches to Change Detection Studies. Remote Sensing of Environment (1998), 64
(1) 1-19
Nygren, H.; Börner, K.; Malmberg, P.; Tallarek, E.; Hagenhoff, B. Imaging TOF-
SIMS of rat kidney prepared by high-pressure freezing. Microscopy Research and
Technique (2005), 68 (6), 329-334
Nygren, H.; Eriksson, C.; Malmberg, P.; Sahlin, H.; Carlsson, L.; Lausmaa, J.; Sjövall,
P. A cell preparation method allowing subcellular localization of cholesterol and
phosphocholine with imaging TOF-SIMS. Colloids and Surfaces B: Biointerfaces
(2003), 30 (1-2), 87-92
Nygren, H.; Hagenhoff, B.; Malmberg, P.; Nilsson, M.; Richter, K. Bioimaging TOF-
SIMS: High resolution 3D imaging of single cells. Microscopy Research and
Technique (2007) 70 (11), 969-974
Nygren, H.; Malmberg, P.; Nilsson, M.; Kriegeskotte, C.; Arlinghaus, H.F. The
cytochemistry of anaplastic thyroid tumour cells and differentiated thyrocytes
analysed by TOF-SIMS and depth profiling. Applied Surface Science (2008), 255
(4), 1285-1288
Ostrowski, S.G.; Van Bell, C.T.; Winograd, N.; Ewing, A.G. Mass Spectrometric
Imaging of Highly Curved Membranes During Tetrahymena Mating. Science
(2004), 305, 71-73

219
Pacholski, M.L.; Cannon Jr, D.M.; Ewing, A.G.; Winograd, N. Static time-of-flight
secondary ion mass spectrometry imaging of freeze-fractured, frozen-hydrated
biological membranes. Rapid Communications in Mass Spectrometry (1998), 12 (18)
1232-1235
Parry, S.; Winograd, N. High-resolution TOF-SIMS imaging of eukaryotic cells
preserved in a trehalose matrix. Analytical Chemistry (2005) 77 (24), 7950-7957
Parry, S.A.; Kurczy, M.E.; Fan, X.; Halleck, M.S.; Schlegel, R.A.; Winograd, N.
Imaging macrophages in trehalose with SIMS. Applied Surface Science (2008), 255
(4), 929-933
Piehowski, P.D.; Kurczy, M.E.; Willingham, D.; Parry, S.; Heien, M.L.; Winograd, N.;
Ewing, A.G. Freeze-etching and vapor matrix deposition for ToF-SIMS imaging of
single cells. Langmuir (2008) 24 (15), 7906-7911
Piwowar, A.M.; Fletcher, J.S.; Kordys, J.; Lockyer, N.P.; Winograd, N.; Vickerman,
J.C. Effects of Cryogenic Sample Analysis on Molecular Depth Profiles with TOF-
Secondary Ion Mass Spectrometry Analytical Chemistry (2010), published online
Rabbani, S.; Fletcher, J.S.; Lockyer, N.P.; Vickerman, J.C. Exploring subcellular
imaging on the buncher-ToF J105 3D chemical imager. Surface and Interface Analysis
(2010), submitted
Reichenbach, S.E.; Tian, X.; Lindquist, R.; Tao, Q.; Henderson, A.; Vickerman, J.C.
Visualization and analysis of large three-dimensional hyperspectral images.
Proceedings of SPIE - The International Society for Optical Engineering (2009),
7341, Article number 734108
Roddy, T.P.; Cannon Jr. D.M.; Ostrowski, S.G.; Ewing, A.G.; Winograd, N. Proton
transfer in time-of-flight secondary ion mass spectrometry studies of frozen-
hydrated dipalmitoylphosphatidylcholine. Analytical Chemistry (2003), 75 (16)
4087-4094
Roddy, T.P.; Cannon Jr., D.M.; Meserole, C.A.; Winograd, N.; Ewing, A.G. Imaging
of freeze-fractured cells with in situ fluorescence and time-of-flight secondary ion
mass spectrometry. Analytical Chemistry (2002), 74 (16) 4011-4019
Römer, W.; Wu, T.-D.; Duchambon, P.; Amessou, M.; Carrez, D.; Johannes, L.;
Guerquin-Kern, J.-L. Sub-cellular localisation of a 15N-labelled peptide vector using
NanoSIMS imaging. Applied Surface Science (2006), 252 (19), 6925-6930
Rothman, J.E.; Lenard, J. Membrane asymmetry. The nature of membrane
asymmetry provides clues to the puzzle of how membranes are assembled. Science
(1977), 195 (4286), 743-753

220
Sjövall, P.; Lausmaa, J.; Johansson, B. Mass Spectrometric Imaging of Lipids in
Brain Tissue. Analytical Chemistry (2004), 76, 4271-4278
Sjövall, P.; Lausmaa, J.; Nygren, H.; Carlsson, L.; Malmberg, P. Imaging of
Membrane Lipids in Single Cells by Imprint-Imaging Time-of-Flight Secondary
Ion Mass Spectrometry. Analytical Chemistry (2003), 75, 3429-3434
Slodzian, G.; Daigne, B.; Girard, F.; Boust, F.; Hillion, F. Scanning secondary ion
analytical microscopy with parallel detection. Biology of the Cell (1992), 74 (1), 43-
50
Smith, D.R.; Chandra, S.; Barth, R.F.; Yang, W.; Joel, D.D.; Coderre, J.A.
Quantitative imaging and microlocalization of boron-10 in brain tumors and
infiltrating tumor cells by SIMS ion microscopy: Relevance to neutron capture
therapy. Cancer Research (2001), 61 (22), 8179-8187
Strissel, P.L.; Strick, R.; Gavrilov, K.L.; Levi-Setti, R. Specific Mg2+
binding at
human and Indian muntjac chromosomal Giemsa bands. Applied Surface Science
(2004), 231-232, 485-489
Thompson, C.E.; Ellis, J.; Fletcher, J.S.; Goodacre, R.; Henderson, A.; Lockyer, N.P.;
Vickerman, J.C. ToF-SIMS studies of Bacillus using multivariate analysis with
possible identification and taxonomic applications. Applied Surface Science (2006),
252 (19), 6719-6722
Tortora, G.J.; Grabowski, S.R. Tortora Grabowski Principles of Anatomy and
Physiology (2000), US: John Wiley
Tyler, B.J; Rayal, G.; Castner.D.G. Multivariate analysis strategies for processing
ToF-SIMS images of biomaterials. Biometrials (2007) 15, 2412-2423
Vaidyanathan, S; Fletcher, J.S; Henderson, A; Lockyer, N.P; Vickerman, J.C.
Exploratory analysis of TOF-SIMS data from biological surfaces. Applied Surface
Science (2008), 255, (4), 1599-1602
Wagner, M.S.; Castner, D.G. Characterization of adsorbed protein films by time-of-
flight secondary ion mass spectrometry with principal component analysis.
Langmuir (2001), 17 (15), 4649-4660
Wagner, M.S; Castner, D.G. Simplifying the interpretation of ToF-SIMS spectra
and images using careful application of multivariate analysis. Applied Surface
Science (2004), 231, 366-376
Wong, S.C.C.; Hill, R.; Blenkinsopp, P.; Lockyer, N.P.; Weibel, D.E.; Vickerman, J.C.
Development of a C60+ ion gun for static SIMS and chemical imaging. Applied
Surface Science (2003), 203-204, 219-222

221
Zheng, L.; McQuaw, C.M.; Baker, M.J.; Lockyer, N.P.; Vickerman, J.C.; Ewing, A.G.;
Winograd, N. Investigating lipid-lipid and lipid-protein interactions in model
membranes by ToF-SIMS. Applied Surface Science (2008), 255 (4), 1190-1192

222
6 Overall Conclusions and Future Work
Time of flight secondary ion mass spectrometry has progressed in the last
century and is now more widely utilized for a range of applications. Advances in the
instrumentation, particularly the development of cluster and polyatomic sources have
extended the capabilities of ToF-SIMS for the analysis of complex biological samples.
It has become a powerful technique to monitor the distribution of native biomolecules
and xenobiotics at a very high spatial resolution, <100 nm with high selectivity and
without need to label.
Chapter 1 and chapter 2 discuss the current state of ToF-SIMS instrumentation
and applications. It was identified that although high lateral resolution molecular
imaging can be obtained using the highly focused liquid metal ion sources, it results in
low secondary ion yields and causes damage to the surface of a sample. Thus, the ion
dose of these sources has to be kept at or below the static limit, which limits sensitivity.
The SIMS community has been looking into ways for increasing the sensitivity such as
using high mass primary ion beams, silver printing, matrix enhanced SIMS and laser
post-ionisation. Significant enhancement in the secondary ion yields was observed with
the introduction of polyatomic ion beams which also offer the benefit of low sub-
surface damage and analysis at high ion dose. However to take full advantage of the
polyatomic sources, the current ToF-SIMS instrumentation has to be customized. As a
result a new instrument, the Ionoptika J105 3D Chemical Imager was designed and
built which seeks to address these issues and allows the use of the polyatomic beam in a
dc mode. This instrument has been described in some detail in chapter 2.

223
In chapter 3, the concept of the new instrument is validated. Initially standard
organic samples were analysed and secondary ion signals were compared with a
conventional ToF-SIMS instrument, the BioToF. A more quantitative comparison can
be made by calculating the yields to evaluate the performance of both instruments.
The tandem MS capability of the new instrument was also demonstrated with
standard organic samples and a lipid mixture of brain extract. In this project it was only
possible to identify two unknown ions from the lipid mixture, but MS/MS of other ions
will need to be completed to identify them.
A sensitivity test was also undertaken using a standard organic sample, arginine
and it was established that currently the limit of detection on the J105 is 3 × 10⁻⁵
M
which is equivalent to 1.807 × 10¹³
molecules of arginine. This study could benefit from
examining a range of concentrations between 3 × 10⁻⁵
M and 3 × 10⁻⁶
M as well as
investigating a variety of samples.
In chapter 4 molecular depth profiling using ToF-SIMS was reviewed. It was
shown that the dual beam approach in which a highly focused liquid metal beam is used
for analysis and a polyatomic ion beam for sputtering is frequently utilized when
performing high lateral resolution 3D imaging. However, this method results in a loss
of valuable sample during etch cycles. It has been shown that the polyatomic C60 beam
can be used for molecular depth profiling in dc mode on the J105. This study could be
developed further by depth profiling multilayer systems to identify the depth resolution.
Furthermore, the experiments could be performed at different energies and temperature
to determine how these parameters affect the secondary ion yields, topographic
roughness and depth resolution.
224
In chapter 5, the ability of ToF-SIMS to map the distribution of biological
components in tissues and cells has been evaluated. It was identified that issues such as
low duty cycle and imaging at high spatial and mass resolution at the same time are
limiting this technique from reaching its full potential. The dual beam approach allows
analysis to be completed in reasonable time with high spatial resolution but results in
much of the material from a sample being wasted during etch cycles. These problems
can be addressed by using the polyatomic beam in a dc mode on the new instrument. A
standard cell line (HeLa) was used to show clearly the capability of the polyatomic
beam, C60 to produce mass spectrometric images of single cells. The data shows that it
is possible to identify and differentiate between lipid membrane and nucleus of single
cells in a single 2D image and as a function of depth via 3D imaging.
Three different cell preparation methods, formaldehyde fixing, freeze-dried and
freeze-fractured frozen hydrated were investigated. The data suggests that the freeze-
fractured frozen hydrated method is beneficial as compared to the other two. It is
intended that the systematic investigation of different sample preparations will be
extended to other cell lines to confirm these findings. Also multivariate analysis can be
performed on data generated from different sample preparations to identify the peaks
that are responsible for different observations. Furthermore, to determine if the cells
have been fractured, fluorescent reagents can be used to image sub-cellular structures
using complementary imaging methods.
It has been demonstrated through the work on HeLa cells that it is possible to
examine the evolution of biochemistry in the cells with depth using 3D imaging. This

225
presents the opportunity to begin to localise the distribution of drugs in the cells thereby
investigating whether a drug has been transported to its target within the sample.
The amount and the size of the data generated on the J105 are very high and new
data processing tools are required for the management, manipulation and interpretation
of the information. This includes tools such as multivariate analysis, data compression
and new software for visualisation of 3D data set.
In conclusion, imaging of cells and tissues has become the centre point of
research in the SIMS community. The work presented in this thesis shows the immense
potential of ToF-SIMS using the new instrumental configuration for the analysis of
tissues and single cells. However, issues such as the matrix effect, optimum sample
preparation and low ionisation still need to be addressed to progress forward and aid
research in wider biological problems.