advances in food dehydration
TRANSCRIPT


ADVANCES inFOOD DEHYDRATION
52527_C000.indd i52527_C000.indd i 10/17/2008 11:34:18 AM10/17/2008 11:34:18 AM
© 2009 by Taylor & Francis Group, LLC

Series Editor
Professor Da-Wen Sun, DirectorFood Refrigeration & Computerized Food Technology
National University of Ireland, Dublin(University College Dublin)
Dublin, Irelandhttp://www.ucd.ie/sun/
Advances in Food Dehydration, edited by Cristina Ratti (2009)
Optimization in Food Engineering, edited by Ferruh Erdogdu (2009)
Optical Monitoring of Fresh and Processed Agricultural Crops, edited by Manuela Zude (2009)
Food Engineering Aspects of Baking Sweet Goods, edited by Servet Gülüm Sumnu and Serpil Sahin (2008)
Computational Fluid Dynamics in Food Processing, edited by Da-Wen Sun (2007)
52527_C000.indd ii52527_C000.indd ii 10/17/2008 11:34:19 AM10/17/2008 11:34:19 AM
© 2009 by Taylor & Francis Group, LLC

ADVANCES inFOOD DEHYDRATION
Edited byCristina Ratti
CRC Press is an imprint of theTaylor & Francis Group, an informa business
Boca Raton London New York
52527_C000.indd iii52527_C000.indd iii 10/17/2008 11:34:19 AM10/17/2008 11:34:19 AM
© 2009 by Taylor & Francis Group, LLC

MATLAB® is a trademark of The MathWorks, Inc. and is used with permission. The MathWorks does not warrant the accuracy of the text or exercises in this book. This book’s use or discussion of MATLAB® software or related products does not constitute endorsement or sponsorship by The MathWorks of a particular pedagogical approach or particular use of the MATLAB® software.
CRC PressTaylor & Francis Group6000 Broken Sound Parkway NW, Suite 300Boca Raton, FL 33487-2742
© 2009 by Taylor & Francis Group, LLC CRC Press is an imprint of Taylor & Francis Group, an Informa business
No claim to original U.S. Government worksPrinted in the United States of America on acid-free paper10 9 8 7 6 5 4 3 2 1
International Standard Book Number-13: 978-1-4200-5252-7 (Hardcover)
This book contains information obtained from authentic and highly regarded sources. Reasonable efforts have been made to publish reliable data and information, but the author and publisher can-not assume responsibility for the validity of all materials or the consequences of their use. The authors and publishers have attempted to trace the copyright holders of all material reproduced in this publication and apologize to copyright holders if permission to publish in this form has not been obtained. If any copyright material has not been acknowledged please write and let us know so we may rectify in any future reprint.
Except as permitted under U.S. Copyright Law, no part of this book may be reprinted, reproduced, transmitted, or utilized in any form by any electronic, mechanical, or other means, now known or hereafter invented, including photocopying, microfilming, and recording, or in any information storage or retrieval system, without written permission from the publishers.
For permission to photocopy or use material electronically from this work, please access www.copy-right.com (http://www.copyright.com/) or contact the Copyright Clearance Center, Inc. (CCC), 222 Rosewood Drive, Danvers, MA 01923, 978-750-8400. CCC is a not-for-profit organization that pro-vides licenses and registration for a variety of users. For organizations that have been granted a photocopy license by the CCC, a separate system of payment has been arranged.
Trademark Notice: Product or corporate names may be trademarks or registered trademarks, and are used only for identification and explanation without intent to infringe.
Library of Congress Cataloging-in-Publication Data
Advances in food dehydration / edited by Cristina Ratti.p. cm. -- (Contemporary food engineering ; 5)
Includes bibliographical references and index.ISBN-13: 978-1-4200-5252-7ISBN-10: 1-4200-5252-71. Food--Drying. 2. Dried food industry. I. Ratti, Cristina. II. Title. III. Series.
TP371.5.A37 2009664’.0284--dc22 2008020691
Visit the Taylor & Francis Web site athttp://www.taylorandfrancis.com
and the CRC Press Web site athttp://www.crcpress.com
52527_C000.indd iv52527_C000.indd iv 10/17/2008 11:34:19 AM10/17/2008 11:34:19 AM
© 2009 by Taylor & Francis Group, LLC

To my patient husband and dear family
52527_C000.indd v52527_C000.indd v 10/17/2008 11:34:19 AM10/17/2008 11:34:19 AM
© 2009 by Taylor & Francis Group, LLC

52527_C000.indd vi52527_C000.indd vi 10/17/2008 11:34:19 AM10/17/2008 11:34:19 AM
© 2009 by Taylor & Francis Group, LLC

vii
Contents
Series Preface ...................................................................................................... ix
Series Editor ........................................................................................................ xi
Preface ................................................................................................................ xiii
Editor .................................................................................................................. xv
Contributors ....................................................................................................... xvii
Chapter 1 Dehydration of Foods: General Concepts .......................................... 1
Monica Araya-Farias and Cristina Ratti
Chapter 2 Glass-Transition Based Approach in Drying of Foods .................... 37
Bhesh Bhandari and Benu Adhikari
Chapter 3 Application of Image Analysis in Food Drying ............................... 63
Maturada Jinorose, Sakamon Devahastin, Silvia Blacher, and Angélique Léonard
Chapter 4 Dehydration and Microstructure .................................................... 97
Mohammad Shafi ur Rahman
Chapter 5 Convective Drying of Foods .......................................................... 123
María Elena Carrín and Guillermo Héctor Crapiste
Chapter 6 Advances in Spouted Bed Drying of Foods ................................... 153
S.C.S. Rocha and O.P. Taranto
Chapter 7 Application and Development of Osmotic Dehydration
Technology in Food Processing ..................................................... 187
John Shi and Sophia Jun Xue
Chapter 8 Fundamentals and Tendencies in Freeze-Drying of Foods ............ 209
J.I. Lombraña
52527_C000.indd vii52527_C000.indd vii 10/17/2008 11:34:19 AM10/17/2008 11:34:19 AM
© 2009 by Taylor & Francis Group, LLC

viii Contents
Chapter 9 Rehydration and Reconstitution of Foods ...................................... 237
Alejandro Marabi and I. Sam Saguy
Chapter 10 Dehydration Processes for Nutraceuticals and
Functional Foods ............................................................................ 285
Susan D. St. George and Stefan Cenkowski
Chapter 11 Drying of Microorganisms for Food Applications......................... 315
Janusz Adamiec
Chapter 12 Dryer Modeling .............................................................................. 355
Catherine Bonazzi, Bertrand Broyart, and Francis Courtois
Chapter 13 Nonconventional Heating Sources during Drying ......................... 401
Valérie Orsat and G.S. Vijaya Raghavan
Chapter 14 Energy Aspects in Food Dehydration ............................................ 423
Tadeusz Kudra
Chapter 15 Novel Food Dryers and Future Perspectives .................................. 447
Cristina Ratti
52527_C000.indd viii52527_C000.indd viii 10/17/2008 11:34:19 AM10/17/2008 11:34:19 AM
© 2009 by Taylor & Francis Group, LLC

ix
Series Preface
CONTEMPORARY FOOD ENGINEERING
Food engineering is the multidisciplinary fi eld of applied physical sciences combined
with the knowledge of product properties. Food engineers provide the technological
knowledge transfer essential to the cost-effective production and commercialization
of food products and services. In particular, food engineers develop and design pro-
cesses and equipment in order to convert raw agricultural materials and ingredients
into safe, convenient, and nutritious consumer food products. However, food engineering
topics are continuously undergoing changes to meet diverse consumer demands, and
the subject is being rapidly developed to refl ect the market needs.
In the development of food engineering, one of the many challenges is to employ
modern tools and knowledge, such as computational materials science and nano-
technology, to develop new products and processes. Simultaneously, improving food
quality, safety, and security remain critical issues in food engineering study. New
packaging materials and techniques are being developed to provide more protection
to foods, and novel preservation technologies are emerging to enhance food security
and defense. Additionally, process control and automation regularly appear among
the top priorities identifi ed in food engineering. Advanced monitoring and control
systems are developed to facilitate automation and fl exible food manufacturing.
Furthermore, energy saving and minimization of environmental problems continue
to be an important food engineering issue, and signifi cant progresses are being made in
waste management, effi cient utilization of energy, and reduction of effl uents and
emissions in food production.
Consisting of edited books, the Contemporary Food Engineering book series
attempts to address some of the recent developments in food engineering. Advances
in classical unit operations in engineering applied to food manufacturing are covered
as well as such topics as progress in the transport and storage of liquid and solid
foods; heating, chilling, and freezing of foods; mass transfer in foods; chemical and
biochemical aspects of food engineering and the use of kinetic analysis; dehydration,
thermal processing, nonthermal processing, extrusion, liquid food concen tration,
membrane processes and applications of membranes in food processing; shelf-life,
electronic indicators in inventory management, and sustainable technologies in food
processing; and packaging, cleaning, and sanitation. The books aim at professional
food scientists, academics researching food engineering problems, and graduate
level students.
The editors of the books are leading engineers and scientists from many parts of
the world. All the editors were asked to present their books in a manner that will
address the market need and pinpoint the cutting-edge technologies in food engineer-
ing. Furthermore, all contributions are written by internationally renowned experts
52527_C000.indd ix52527_C000.indd ix 10/17/2008 11:34:19 AM10/17/2008 11:34:19 AM
© 2009 by Taylor & Francis Group, LLC

x Series Preface
who have both academic and professional credentials. All authors have attempted
to provide critical, comprehensive and readily accessible information on the art and
science of a relevant topic in each chapter, with reference lists to be used by readers
for further information. Therefore, each book can serve as an essential reference
source to students and researchers in universities and research institutions.
Da-Wen SunSeries Editor
52527_C000.indd x52527_C000.indd x 10/17/2008 11:34:19 AM10/17/2008 11:34:19 AM
© 2009 by Taylor & Francis Group, LLC

xi
Series Editor
Born in Southern China, Pro fessor Da-Wen
Sun is a world authority in food engineering
research and education. His main research
activities include cooling, drying and refrig-
eration pro cesses and systems, quality and
safety of food products, bioprocess simulation
and optimization, and computer vision tech-
nology. Especially, his innovative studies on
vacuum cooling of cooked meats, pizza qual-
ity inspection by computer vision, and edible
fi lms for shelf-life extension of fruit and veg-
etables have been widely reported in national
and international media. Results of his work have been published in over 180 peer
reviewed journal papers and more than 200 conference papers.
He received a fi rst class BSc Honours and MSc in mechanical engineering, and
a PhD in chemical engineering in China before working in various universities in
Europe. He became the fi rst Chinese national to be permanently employed in an
Irish university when he was appointed college lecturer at National University of
Ireland, Dublin (University College Dublin) in 1995, and was then continuously
promoted in the shortest possible time to senior lecturer, associate professor and full
professor. Dr. Sun is now professor of Food Biosystems Engineering and director
of the Food Refrigeration and Computerized Food Technology Research Group at
University College Dublin.
As a leading educator in food engineering, Sun has contributed signifi cantly to
the fi eld of food engineering. He has trained many PhD students, who have made their
own contributions to the industry and academia. He has also given lectures on
advances in food engineering on a regular basis in academic institutions internation-
ally and delivered keynote speeches at international conferences. As a recognized
authority in food engineering, he has been conferred adjunct/visiting/consulting
professorships from ten top universities in China including Zhejiang University,
Shanghai Jiaotong University, Harbin Institute of Technology, China Agricultural
University, South China University of Technology, and Jiangnan University. In rec-
ognition of his signifi cant contribution to food engineering worldwide and for his
outstanding leadership in the fi eld, the International Commission of Agricultural
Engineering (CIGR) awarded him the CIGR Merit Award in 2000 and again in 2006.
The Institution of Mechanical Engineers (IMechE) based in the United Kingdom
named him Food Engineer of the Year 2004. In 2008 he was awarded the CIGR
52527_C000.indd xi52527_C000.indd xi 10/17/2008 11:34:19 AM10/17/2008 11:34:19 AM
© 2009 by Taylor & Francis Group, LLC

xii Series Editor
Recognition Award in honor of his distinguished achievements in the top one percent
of agricultural engineering scientists in the world.
He is a fellow of the Institution of Agricultural Engineers. He has also received
numerous awards for teaching and research excellence, including the President’s
Research Fellowship, and he twice received the President’s Research Award of
University College Dublin. He is a member of CIGR Executive Board and honorary
vice-president of CIGR, editor-in-chief of Food and Bioprocess Technology—
An International Journal (Springer), series editor of the Contemporary Food Engineering book series (CRC Press/Taylor & Francis), former editor of Journal of Food Engineering (Elsevier), and editorial board member for Journal of Food Engineering (Elsevier), Journal of Food Process Engineering (Blackwell), Sensing and Instru mentation for Food Quality and Safety (Springer) and Czech Journal of Food Sciences. He is also a chartered engineer registered in the U.K. Engineering
Council.
52527_C000.indd xii52527_C000.indd xii 10/17/2008 11:34:19 AM10/17/2008 11:34:19 AM
© 2009 by Taylor & Francis Group, LLC

xiii
Preface
Dehydration processes have been known and used in food preservation for centuries.
In spite of this, drying of foodstuffs is a complex heat and mass transfer process,
which consumes large amounts of energy and unfortunately does not always lead to
high-quality fi nal products. Its current understanding is still quite limited because of
the following factors: (1) the complex nature of food systems together with the deep
structural and physicochemical changes that foodstuffs undergo during processing,
(2) the diffi culty of defi ning quality quantitatively and developing appropriate
control techniques, and (3) the lack of realistic models and simulations to represent
the phenomena. Knowledge of food physicochemical, kinetics, and sorptional prop-
erties and their variation with water content and drying conditions is also required to
interpret this process correctly. In addition, recently there has been a clear need to
optimize natural resources to reduce energy requirements together with an increasing
demand for low-cost, high-quality products. This requires practical and advanced
knowledge on dehydration in the food processing industry.
Dehydration is a traditional food engineering area that has advanced signifi cantly
in the last 20 years. New methods of dehydration have been developed, new sophisti-
cated analytical techniques have been applied to drying to allow a better understanding
of the phenomena, mathematical modeling has been improved to simulate the various
driers under different conditions, and so forth. This new volume in food dehydration
consists of 15 chapters on traditional and novel aspects of food dehydration. Each
chapter will introduce the importance of the subject, followed by general concepts
and fi nally by the latest developments in the area.
I sincerely acknowledge the collaboration and hard work of each contributor to
this volume, the help of my graduate students and research assistant, and the valuable
advice and input from Dr. Tadeusz Kudra.
52527_C000.indd xiii52527_C000.indd xiii 10/17/2008 11:34:19 AM10/17/2008 11:34:19 AM
© 2009 by Taylor & Francis Group, LLC

52527_C000.indd xiv52527_C000.indd xiv 10/17/2008 11:34:19 AM10/17/2008 11:34:19 AM
© 2009 by Taylor & Francis Group, LLC

xv
Editor
Cristina Ratti, who is originally from Bahia Blanca, Argentina, graduated as a chem-
ical engineer from the National University of the South (Bahia Blanca) and began
her graduate studies in food engineering at the same institution under the supervision
of Enrique Rotstein and Guillermo Crapiste. She obtained a PhD in chemical engi-
neering in 1991 with her thesis on the “Design of batch air dryers for fruit and veg-
etable products.” Her three postdoctoral stages were undertaken at three academic
institutions in collaboration with Arun Mujumdar (chemical engineering, McGill
University, Canada) from 1991 to 1993, Vijaya Raghavan (bioresource engineering,
McGill University) from 1993 to 1995, and Guillermo Crapiste in PLAPIQUI (Bahia
Blanca) from 1995 to 1996.
In 1996 she joined the Department of Soils and Agri-Food Engineering at Laval
University (Québec, Canada) as a professor of food engineering. She is presently a
full professor, the coordinator of the Food Engineering Program at Laval University
(since 2001), and a member of the Institute of Nutraceutical and Functional Foods
(since 2003). Her research interests have always been related to food dehydration
(air drying, freeze-drying, osmotic dehydration) and physicochemical and quality
properties of foodstuffs related to drying. She has published numerous scientifi c
manuscripts and contributed to the training of many graduate and undergraduate
students on the science of food engineering and dehydration.
52527_C000.indd xv52527_C000.indd xv 10/17/2008 11:34:19 AM10/17/2008 11:34:19 AM
© 2009 by Taylor & Francis Group, LLC

52527_C000.indd xvi52527_C000.indd xvi 10/17/2008 11:34:19 AM10/17/2008 11:34:19 AM
© 2009 by Taylor & Francis Group, LLC

xvii
Contributors
Janusz AdamiecTechnical University of Lodz
Lodz, Wolczanska, Poland
Benu AdhikariSchool of Science and Engineering
University of Ballarat
Victoria, Australia
Monica Araya-FariasDepartment of Soils and Agri-Food
Engineering
Laval University
Québec, Québec, Canada
Bhesh BhandariSchool of Land, Crop and Food
Sciences
University of Queensland
Queensland, Australia
Silvia BlacherDepartment of Applied Chemistry
University of Liège
Liège, Belgium
Catherine BonazziNational Institute of Agronomic
Research
AgroParisTech
Massy, France
Bertrand BroyartNational Institute of Agronomic
Research
AgroParisTech
Massy, France
María Elena CarrínPlanta Piloto de Ingenieria
Quimica
Bahia Blanca, Argentina
Stefan CenkowskiDepartment of Biosystems
Engineering
University of Manitoba
Winnipeg, Manitoba, Canada
Francis CourtoisNational Institute of Agronomic
Research
AgroParisTech
Massy, France
Guillermo Héctor CrapistePlanta Piloto de Ingenieria
Quimica
Bahia Blanca, Argentina
Sakamon DevahastinDepartment of Food Engineering
King Mongkut’s University of
Technology
Bangkok, Thailand
Maturada JinoroseDepartment of Food Engineering
King Mongkut’s Institute of
Technology
Bangkok, Thailand
Tadeusz KudraCANMET Energy Technology Centre
Varennes, Québec, Canada
52527_C000.indd xvii52527_C000.indd xvii 10/17/2008 11:34:19 AM10/17/2008 11:34:19 AM
© 2009 by Taylor & Francis Group, LLC

xviii Contributors
Angélique LéonardDepartment of Applied Chemistry
University of Liège
Liège, Belgium
J.I. LombrañaDepartment of Chemical
Engineering
University of the Basque Country
Bilbao, Spain
Alejandro MarabiFood Science Department
Nestlé Research Center
Lausanne, Switzerland
Valérie OrsatDepartment of Bioresource
Engineering
Macdonald Campus of McGill
University
Ste-Anne de Bellevue, Québec,
Canada
G.S. Vijaya RaghavanDepartment of Bioresource
Engineering
Macdonald Campus of McGill
University
Ste-Anne de Bellevue, Québec,
Canada
Mohammad Shafi ur RahmanDepartment of Food Science and
Nutrition
Sultan Qaboos University
Al-Khod, Oman
Cristina RattiDepartment of Soils and Agri-Food
Engineering
Laval University
Québec, Québec, Canada
S.C.S. RochaState University of Campinas
Faculty of Chemical Engineering
Campinas, Sao Paulo, Brazil
I. Sam SaguyFood Science and Nutrition
Department
Hebrew University of Jerusalem
Revohot, Israel
John ShiGuelph Food Research Center
Agriculture and Agri-Food Canada
Guelph, Ontario, Canada
Susan D. St. GeorgeDepartment of Biosystems
Engineering
University of Manitoba
Winnipeg, Manitoba, Canada
O.P. TarantoState University of Campinas
Faculty of Chemical Engineering
Campinas, Sao Paulo, Brazil
Sophia Jun XueGuelph Food Research Center
Agriculture and Agri-Food Canada
Guelph, Ontario, Canada
52527_C000.indd xviii52527_C000.indd xviii 10/17/2008 11:34:20 AM10/17/2008 11:34:20 AM
© 2009 by Taylor & Francis Group, LLC

1
1 Dehydration of Foods: General Concepts
Monica Araya-Farias and Cristina Ratti
CONTENTS
1.1 Introduction ................................................................................................. 2
1.1.1 Historical Background on Food Drying .......................................... 2
1.2 Psychrometry in Relation to Drying ........................................................... 3
1.2.1 Theoretical Considerations of Air–Water Mixtures ........................ 3
1.2.1.1 Absolute Humidity ............................................................. 4
1.2.1.2 Saturation Absolute Humidity ............................................ 4
1.2.1.3 Relative Humidity .............................................................. 4
1.2.2 Psychrometric or Humidity Chart ................................................... 4
1.3 Dehydration Principles ................................................................................ 7
1.3.1 Dehydration Kinetics ....................................................................... 7
1.4 Physical and Thermal Properties .............................................................. 11
1.4.1 Thermal Properties ........................................................................ 11
1.4.1.1 Thermal Conductivity ...................................................... 11
1.4.1.2 Specifi c Heat .................................................................... 12
1.4.2 Physical Properties ......................................................................... 13
1.4.2.1 Apparent or Bulk Density ................................................ 13
1.4.2.2 True or Particulate Density .............................................. 13
1.4.2.3 Porosity ............................................................................. 13
1.4.3 Property Modeling ......................................................................... 13
1.4.3.1 Linear Models .................................................................. 14
1.4.3.2 Nonlinear Models ............................................................. 14
1.5 Drying Technologies ................................................................................. 15
1.5.1 Selection Criteria for Classifi cation of Dryers ............................... 15
1.5.2 Advantages and Disadvantages ...................................................... 17
1.6 Quality Aspects of Dehydrated Foods ...................................................... 20
1.6.1 Water Sorption Isotherms .............................................................. 20
1.6.1.1 Sorption Hysteresis Phenomenon ..................................... 22
1.6.1.2 Temperature Effect on Sorption Isotherms ...................... 22
1.6.1.3 Empirical and Theoretical Description of
Water Sorption Isotherms ................................................. 24
1.6.1.4 Infl uence of Drying Methods ........................................... 24
52527_C001.indd 152527_C001.indd 1 10/16/2008 4:19:50 PM10/16/2008 4:19:50 PM
© 2009 by Taylor & Francis Group, LLC

2 Advances in Food Dehydration
1.6.2 Physical Quality ............................................................................. 25
1.6.2.1 Color ................................................................................. 26
1.6.2.2 Shrinkage, Porosity, and Bulk Density ............................ 26
1.6.2.3 Rehydration Properties ..................................................... 29
1.6.3 Microbiological and Chemical Quality ......................................... 29
1.6.4 Nutritional Quality ......................................................................... 29
1.6.4.1 Infl uence of Drying Methods and Pretreatments ............. 30
1.6.5 Glass-Transition Temperature and Quality Considerations ........... 31
Nomenclature ....................................................................................................... 31
Variables ................................................................................................... 31
Greek Letters ............................................................................................ 32
References ............................................................................................................ 32
1.1 INTRODUCTION
Dehydration is probably the oldest and most frequently used method of food preser-
vation. It is currently a versatile and widespread technique in the food industry as well
as a subject of continuous interest in food research. The term dehydration refers to
the removal of moisture from a material with the primary objective of reducing
microbial activity and product deterioration (Ratti, 2001). In addition to preservation,
the reduced weight and bulk of dehydrated products decreases packaging, handling,
and transportation costs. Furthermore, most food products are dried for improved
milling or mixing characteristics in further processing. In contrast, with literally
hundreds of variants actually used in drying of particulates, solids, pastes, slurries,
or solutions, it provides the most diversity among food engineering unit operations
(Ratti and Mujumdar, 1995). At present, instant beverage powders, dry soup mixes,
spices, coffee, and ingredients used in food transformation are the major food products
that are dehydrated.
The wide variety of dehydrated foods available to the consumer and the concern
to meet the highest quality specifi cations emphasizes the need for a better understanding
of the drying process. General theoretical aspects, historical background, properties
of foods in regard to drying, types of drying methods, classifi cation of dryers, as well
as quality aspects in food dehydration will be discussed in this chapter.
1.1.1 HISTORICAL BACKGROUND ON FOOD DRYING
The removal of water has been used for centuries to preserve foods. Sun drying of
fruits and smoking of fi sh and meat are both well-known processes originated in
antiquity. In fact, Persian and Chinese people dried fruits and vegetables in the sun
as long as 5000 years ago. It is believed that chuño, which is prepared by freeze-drying
native potatoes, may have been invented 2000 or 3000 years ago in the Andean high-
lands; it is considered as the fi rst food product to be specially processed by humans.
Sun-dried dates, fi gs, raisins, and apricots were supposedly developed by the aborig-
inal habitants of the Mediterranean Basin and Near East (Salunkhe et al., 1991; Van
Arsdel and Copley, 1963). In addition to using the sun’s energy for drying, various
52527_C001.indd 252527_C001.indd 2 10/16/2008 4:19:50 PM10/16/2008 4:19:50 PM
© 2009 by Taylor & Francis Group, LLC

Dehydration of Foods: General Concepts 3
dehydration technologies were developed at the beginning of the 20th century based
on the use of an artifi cial heat source. The name dehydration was given to the drying
methods under controlled conditions.
The fi rst record of artifi cial drying of foods appears in the 18th century. Vegetables
treated in hot water were then placed in a hot stove for drying (Van Arsdel and Copley,
1963). Thereafter, development of drying technology for foodstuffs and agricultural
produce was accelerated during World War I and World War II. Intensive research
was conducted on vacuum drying of various foods, including meat and fi sh, during
World War I. Other methods were investigated and developed before World War II.
Drum drying was applied to whey and buttermilk, soup mixtures, and tomato powder.
Spray drying was used particularly in milk products and eggs (Van Arsdel and Copley,
1963). Space exploration in the 1960s increased studies on freeze-drying. However,
there was a slower pace in drying developments later.
Consumer demands for better quality, the need to economize energy, the initiation
of global meetings to exchange drying information (i.e., the International Drying
Symposium series), and the publication of thousands of technical papers on the
subject have forced the scientifi c and industrial communities to advance in the
multidisciplinary fi elds of drying technology. Numerous emerging technologies such
as microwaves, heat pumps, and superheated steam drying have been considered
recently in the food industry for the development of new products.
1.2 PSYCHROMETRY IN RELATION TO DRYING
1.2.1 THEORETICAL CONSIDERATIONS OF AIR–WATER MIXTURES
The dehydration process depends on understanding the relationship between the
water contained in a foodstuff and the water present in the drying medium, which is
usually air. The moisture contents are directly related to the chemical potentials and
thus to the driving force for the dehydration process. Air–water mixtures will be
discussed in this section, and the interaction and relationship between water and
food will be discussed in the section dedicated to sorption equilibrium.
Air–water relationships are normally referred to as humid air properties or
psychrometric properties. The term humidifi cation has been used to describe the
inclusion of pure liquid molecules in a gas phase. In dehydration applications, the gas
is normally air and the liquid is water. In the range of temperatures and pressures
used in dehydration, these mixtures behave as ideal gases (Barbosa-Canovas and
Vega-Marcado, 1996; Karel and Lund, 2003a; Vega-Mercado et al., 2001). Thus, the
ideal gas equations for air and water are as follows:
PaV � naRT (1.1)
for air and
PwV � nwRT (1.2)
for water, where Pa and Pw are the partial pressures of air and water in the mixture,
respectively; na and nw are the number of moles of air and water vapor, respectively;
52527_C001.indd 352527_C001.indd 3 10/16/2008 4:19:50 PM10/16/2008 4:19:50 PM
© 2009 by Taylor & Francis Group, LLC

4 Advances in Food Dehydration
V is the total volume; R is the gas constant; and T is the absolute temperature. If the
mixture consists only of air and water, the total pressure (Pt ) is the sum of the water
and air partial pressures (Dalton law):
Pt � Pa � Pw (1.3)
1.2.1.1 Absolute Humidity
The mass ratio of water to dry air is known as the absolute humidity, which can be
defi ned as the amount of moisture in the air at any condition (Y):
Y � nwMw _____ naMa
� PwMw __________
(Pt � Pw)Ma
� 0.6207 Pw ________
Pt � Pw
(1.4)
where Mw and Ma are the molecular weights of water and air, respectively. Dry air
(78% nitrogen, 21% oxygen, and 1% other gases) has an average Ma of 29 Da and
water has an Mw of 18 Da.
1.2.1.2 Saturation Absolute Humidity
Equilibrium is reached when the partial pressure of water vapor in the air equals the
water saturation pressure at a given temperature. Thus, the mass ratio of water to air
is called the saturation absolute humidity. This is the maximum amount of moisture
that the air can carry at that temperature, which can be expressed as
Ys � 0.6207 Pw0 ________
Pt � Pw0
(1.5)
where Pw0 is the saturation vapor pressure of water.
1.2.1.3 Relative Humidity
Relative humidity (RH) is defi ned as the ratio of Pw to Pw0 at the same temperature.
It is a relative measure of the amount of moisture that wet air can hold at a given
temperature:
RH � 100 Pw ___ Pw0
(1.6)
1.2.2 PSYCHROMETRIC OR HUMIDITY CHART
Changes in psychrometric properties are traditionally presented in a psychrometric chart. Many professional charts can be found in the literature (Treybal, 1980).
Psychrometric software is the current method that is frequently used to calculate
these properties (Ratti et al., 1989). A graph of the absolute air humidity ( y axis) as a
function of temperature (x axis) at varying degrees of saturation constitutes the main
element of a psychrometric chart (Toledo, 1991). The psychrometric chart is very
useful for heat and mass balance determinations involving air–water mixtures because
52527_C001.indd 452527_C001.indd 4 10/16/2008 4:19:50 PM10/16/2008 4:19:50 PM
© 2009 by Taylor & Francis Group, LLC

Dehydration of Foods: General Concepts 5
these properties can be graphically represented in the chart. Dry and wet bulb
temperatures, dew point temperature, absolute and relative humidity, and enthalpy
and specifi c volume are variables commonly encountered in this chart.
Figure 1.1 is a schematic representation of a psychrometric chart. Absolute
humidity is located on the vertical axis of the chart. The saturation line is identifi ed
as 100% relative humidity, and it represents the extreme left boundary of the graph.
Other relative humidity levels can be identifi ed with their respective percentage at
distances to the right of the saturation line.
Dry bulb temperature is the temperature measured using an ordinary thermometer
immersed in the air–vapor mixture. It is shown on the horizontal axis of the psychro-
metric chart in Figure 1.1. The dew point is the temperature at which an air–water
mixture reaches saturation at constant absolute humidity. If a given air–water mixture
in a closed system is cooled to a temperature just below its dew point, the water
contained in the mixture starts to condense. The dew point is read in the psychro-
metric chart on the temperature axis at the saturation (100% relative humidity) line.
Wet bulb temperature is the temperature determined by a thermometer placed in
moving air with its bulb covered with a wet cloth. Water evaporation from the cloth
cools the bulb to a temperature lower than the dry bulb temperature of the air if the
air is unsaturated. This temperature difference is known as the wet bulb depression,
a function of the relative humidity of air (Toledo, 1991). Wet bulb temperatures are
read on the slanted lines of the psychrometric chart.
FIGURE 1.1 Schematic representation of a psychrometric chart.
Y1 Saturation line
100%
RH
Wet bulb lines
Temperature (°C)
Ab
solu
te hu
mid
ity (kg w
ater/kg d
ry air)
RH lines
Tdp1 Twb1 T1
1
52527_C001.indd 552527_C001.indd 5 10/16/2008 4:19:50 PM10/16/2008 4:19:50 PM
© 2009 by Taylor & Francis Group, LLC

6 Advances in Food Dehydration
The enthalpy of air–water mixtures is the sum of the partial enthalpies of the
constituents, and it represents the heat content of the mixture. The humid enthalpy
can be defi ned as the enthalpy of a unit mass of dry air and its associated moisture
(Mujumdar and Menon, 1995). The lines representing the enthalpy of moist air are
almost parallel to the wet bulb lines on a psychrometric chart. If zero temperature (0°C)
is taken as the reference point, the enthalpy of an air–water mixture is expressed as
H � L0 Y � (Cpa � CpwY )T (1.7)
where L0 is the latent heat of water at 0°C (kJ/kg), Cpa is the specifi c heat of dry air
(kJ/kg °C), Cpw is the specifi c heat of water vapor (kJ/kg °C), and T is the tempera-
ture (°C).
Two variables are necessary to establish a point on the psychrometric chart
representing an air condition. In Figure 1.1, for instance, absolute humidity Y1 and
dry bulb temperature T1 are required to determine the air conditions at point 1. An
example of the use of the psychrometric chart in an adiabatic dehydration process, a
situation commonly encountered during drying, is provided in Figure 1.2. Point a in
the fi gure represents the ambient air condition, whereas point b is the air after being
heated (before entering the dryer). Point c represents the air exit condition (after
passing through the dryer), which is reached from point b by following the lines at
constant enthalpy because the dryer is adiabatic. The air temperature at point c is
lower than at point b and its absolute humidity is higher, because the air has lost heat
and picked up moisture from the product while passing through the dryer.
FIGURE 1.2 Adiabatic drying represented on a psychrometric chart.
Saturation line
100%
RH
Wet bulb lines
Temperature (°C)
Ab
solu
te hu
mid
ity (kg w
ater/kg d
ry air)
Ya = Yb
RH lines
Ta Tc Tb
Yc
b a
c
Enthalpy lines
52527_C001.indd 652527_C001.indd 6 10/16/2008 4:19:50 PM10/16/2008 4:19:50 PM
© 2009 by Taylor & Francis Group, LLC

Dehydration of Foods: General Concepts 7
Psychrometric properties change when total pressure decreases. Air relative
humidity, dew point, and wet bulb temperatures decrease as a vacuum is applied in
a dryer. For medium vacuum levels (i.e., vacuum drying), this variation should be
taken into account in order to calculate the driving force for mass transfer.
1.3 DEHYDRATION PRINCIPLES
A wet material placed in a medium having lower water partial pressure (at the same
temperature) will dehydrate until equilibrium is reached. The medium is usually air
at pressures ranging from a high vacuum to atmospheric (or higher), although super-
heated steam, hot oil, solvents, and solutions may also be used for this purpose (Karel
and Lund, 2003a).
Food dehydration is a complex phenomenon involving simultaneous mass and
energy transport in a hygroscopic and shrinking system (Mujumdar, 1997; Mujumdar
and Menon, 1995; Ratti, 2001). The rate of dehydration is governed by the rate at
which these processes take place. Heat transfer from the drying medium to the wet
solid can be a result of convection, conduction, or radiation effects and, in some
cases, a combination of them. Internal heat transfer is usually very rapid compared
to external transfer; therefore, heat transfer during drying is usually controlled exter-
nally. In contrast, mass transfer depends on either the movement of moisture within
the solid or the movement of water vapor from the solid surface to the bulk medium.
Depending on the specifi c process, water removal can be limited by either heat or
mass transfer or the resistances to these two transport phenomena can be coupled,
that is, they depend on each other (Karel and Lund, 2003a). Table 1.1 presents a
compilation of characteristics of commonly used drying methods. Note that heat and
mass transfer always take place during drying whether the process is done at atmo-
spheric or vacuum conditions or even when using different drying mediums.
Internal mass transfer is generally recognized to be the principal rate-limiting
step during drying. Because of the complexity of the process, however, no generalized
theory exists to explain the mechanism of internal moisture movement. The struc-
ture of food material being dried plays an important role in the mechanism of water
movement within a product. As pointed out by Rizvi (2005), in liquid materials and
gels, water transport is by molecular diffusion from the interior to the surface of the
product, where it is removed by evaporation. In contrast, in capillary-porous materials
the possible physical mechanisms are numerous and can be classifi ed as (1) liquid
movement caused by capillary and gravity forces, (2) liquid diffusion caused by a
difference in concentration, (3) surface diffusion, (4) water vapor diffusion caused
by partial pressure gradients, (5) water vapor fl ow under differences in total pressure,
and (6) fl ow caused by an evaporation–condensation sequence (Van Arsdel and Copley,
1963). Some of these mechanisms and theories involved during drying will be
explained in detail in other chapters of this book.
1.3.1 DEHYDRATION KINETICS
The drying kinetics of the product are the most important data required for the design
and simulation of dryers. They represent the ease with which a product dehydrates
52527_C001.indd 752527_C001.indd 7 10/16/2008 4:19:50 PM10/16/2008 4:19:50 PM
© 2009 by Taylor & Francis Group, LLC

8 A
dvan
ces in Fo
od
Deh
ydratio
n
TABLE 1.1Main Characteristics of Different Dehydration Methods
Operation Drying MediumExternal Driving
ForceInternal Mass Transfer
MechanismOther
Characteristics Operation VariablesMain Heat Transfer
Mechanism
Hot air drying Air at atmospheric
pressure
Difference in vapor
pressure
Vapor and/or liquid
diffusion, capillarity,
hydrodynamic fl ows,
etc.
— Medium: temperature, velocity,
relative humidity
Product: thickness, geometry,
density
Internal: conduction
External: convection
Vacuum drying Vacuum Difference in vapor
pressure
Liquid and/or vapor
diffusion
Possible boiling
depending on
conditions
Medium: pressure, temperature,
relative humidity
Product: thickness, geometry,
density
Internal: conduction
External: radiation,
conduction
Superheated
steam drying
(SSD)
Superheated steam Difference in vapor
pressure
Vapor diffusion Internal boiling
Possible vacuum
Medium: pressure, temperature
Product: thickness, geometry,
density
Internal: conduction
External: radiation,
conduction
Contact drying Heated solid — Vapor and/or liquid
diffusion
— Medium: surface temperature
Product: thickness, density
Internal: conduction
External: conduction
Freeze-drying Vacuum Difference in vapor
pressure
Vapor diffusion Sublimation
Subfreezing
temperatures
Medium: pressure, temperature
Product: thickness, geometry,
density
Internal: conduction
External: radiation,
conduction
Osmotic
dehydration
Osmotic solution Difference in
osmotic pressure
Liquid diffusion,
volumetric fl ow
— Medium: concentration,
temperature, velocity
Product: thickness, geometry
Internal: conduction
External: convection
52527_C001.indd 8
52527_C001.indd 8
10/16/2008 4:19:51 PM
10/16/2008 4:19:51 PM
© 2009 by T
aylor & Francis G
roup, LL
C

Dehydration of Foods: General Concepts 9
under specifi c drying conditions. Drying kinetics are affected by the external conditions
of the medium and the chemical and physical structure of the food (see Operation
Variables, Table 1.1). In the most general case, drying a food under constant condi-
tions is considered in order to obtain the kinetics curve. Under these conditions, the
medium is in large excess so that its properties can be considered constant.
The moisture content of a food sample must be measured as a function of time
in order to obtain the dehydration kinetics curve. The moisture content X is usually
calculated on a dry basis as the ratio of the amount of water in the sample to the
amount of dry solids:
s
s
m mX
m�
�
(1.8)
where m is the total mass of the sample at time t and ms is the mass of the dry solids.
The relationship between moisture content in dry and wet basis is given by
w 1
XX
X�
� (1.9)
where Xw is the water content on a wet basis. Figure 1.3 illustrates a typical drying
kinetics curve with the moisture content as a function of drying time. When a compari-
son of different drying kinetics curves is necessary, the ordinate of the curve is usually
the ratio of the moisture content (dry basis) at time t to that at initial time X/X0.
In Figure 1.3a, segment a–b is the start-up period, when the product comes into
contact with the medium and heats up. This period could be present or not during
drying of foods. Proper drying occurs during segment b–e. After long drying times,
the solid reaches equilibrium with the medium conditions and no further drying
takes place (point e, Figure 1.3a). The free moisture content Xf (i.e., the moisture that
is available for drying) can thus be determined as
Xf � X � Xe (1.10)
where Xe is the equilibrium moisture content, an important food property that will be
discussed later in this chapter.
The drying rate Nw (kg water/m2/h) is calculated from the kinetics curve by the
following equation:
s
w
m dXN
A dtÊ ˆÁ ˜Ë ¯
� �
(1.11)
where A is the area available for drying. The calculation of the derivative dX/dt in
Eq. (1.11) may cause some problems in the overall determination of the drying rate.
This is because a numerical derivation must be performed with the known associated
errors involved in such determinations. The easiest way of estimating the numerical
temporal derivative is by calculating the difference in water content at two drying
times. Although simple, this method can lead to signifi cant errors, especially in the
beginning of drying where the derivative is quite steep. Numerical errors involved
with this method can be decreased by increasing the number and frequency of
52527_C001.indd 952527_C001.indd 9 10/16/2008 4:19:51 PM10/16/2008 4:19:51 PM
© 2009 by Taylor & Francis Group, LLC

10 Advances in Food Dehydration
experimental data. A better estimation method for calculating the derivative dX/dt consists of the following two steps: a polynomial regression of X–t experimental data
and an analytical derivative of the resulting polynomial. This two-step method requires
trial and error in order to fi nd the best polynomial regression for the data, and some-
times curve X–t must be divided into sectors where different fi ttings instead of a unique
one are necessary. Although more laborious, the results obtained by this method are
more precise and realistic than those from applying the difference method.
Figure 1.3b shows the drying rate as a function of time, which presents the same
points as those in Figure 1.3a. Under constant conditions, the drying process can be
described in a number of steps characterized by different dehydration rates. Two
dehydration periods usually occur: an initial constant rate period (segment b–c)
during which drying occurs as if pure water is being evaporated, and one or several
falling rate periods (segments c–d and d–e) in which moisture movement is
FIGURE 1.3 Drying curves as a function of drying time: (a) drying kinetics and (b) drying rate.
Time (h)
X (
kg w
ater
/kg
dry
mas
s)
b
d
c
e
a
a
b c
d
e
(b)
Xe
Nw (
kg w
ater
/h) (a)
52527_C001.indd 1052527_C001.indd 10 10/16/2008 4:19:51 PM10/16/2008 4:19:51 PM
© 2009 by Taylor & Francis Group, LLC

Dehydration of Foods: General Concepts 11
controlled by combined external–internal resistances or by purely internal resistances
(Barbosa-Canovas and Vega-Mercado, 1996; Mujumdar, 1997; Toledo, 1991).
During the constant rate period the surface of the product is saturated with
water and the rate of drying is limited by the rate at which heat is transferred to the
product from air. The product temperature is usually the wet bulb temperature of the
drying air. In this period, the drying rate is independent of the material surface and
determined by the external conditions. Some foodstuffs do not present a constant
drying rate period. However, for food materials where the liquid movement appears
to be controlled by capillary and gravity forces, a constant rate period has been
found. In contrast, in structured food systems where liquid movement is by diffusion,
no constant rate period has been reported (Rizvi, 2005).
The constant rate period is followed by a period during which the rate of drying
progressively decreases, which is called the falling rate period. The point at which
the constant rate period ends and the falling rate period takes place is termed the
point of critical moisture content (Xc), which is indicated by point c in Figure 1.3b.
This point is represented in the drying rate curve as a sharp change of shape. At this
point, the moisture content of the food is not suffi cient to saturate the whole surface.
In the falling rate period, the movement is controlled either by a combined external
and internal mechanism or by internal mass transfer. Often during drying, one or
more of these mechanisms may occur with changing relative contributions. Two or
more falling rate periods could also exist in the case of hygroscopic materials.
In summary, it is evident that the drying rate of any of these periods depends on
the heat and mass transfer coeffi cients, diffusion coeffi cients, the nature of the food,
and the external drying conditions. Optimization of any or all of these factors would
result in increased drying rates.
1.4 PHYSICAL AND THERMAL PROPERTIES
The design and optimization of any process in which the transfer of heat is involved
requires knowledge of the thermal and physical properties of the materials being
processed. In food drying, the product specifi c heat, thermal conductivity, density,
and porosity are the most important thermophysical properties required for proper
modeling.
1.4.1 THERMAL PROPERTIES
1.4.1.1 Thermal Conductivity
Thermal conductivity (k) is one of the most important thermophysical properties
of foods that is used to estimate the rate of heat transfer by conduction in food
processes such as drying, cooking, or frying (Maroulis et al., 2002; Rahman et al.,
1997). It is a property that indicates how effective a material is as a heat conductor.
As stated in Fourier’s law for heat conduction, this constant is a proportionality
factor needed for calculations of heat conduction transfer processes (Welti-Chanes
et al., 2003).
Thermal conductivity depends mainly on food composition, but in some cases it
can vary with the physical orientation of food compounds, as in the case of meat
52527_C001.indd 1152527_C001.indd 11 10/16/2008 4:19:51 PM10/16/2008 4:19:51 PM
© 2009 by Taylor & Francis Group, LLC

12 Advances in Food Dehydration
products. Water content also plays a signifi cant role in the value of conductivity (and
thus should be taken into account during drying; Cuevas and Cheyran, 1978). Data
on the thermal conductivity of various food materials were reported previously
(Krokida et al., 2001; Rahman, 1995). The data found in the literature present a wide
variation, which is attributable to factors such as the composition or structure of the
material, different experimental methods, and processing conditions (temperature,
pressure, and mode of energy transfer). Table 1.2 provides a few values for the
thermal conductivity of foods.
1.4.1.2 Specifi c Heat
Specifi c heat (Cp ) can be defi ned as the amount of energy needed to increase the
temperature of one unit mass of a material by 1°. The specifi c heat of foods depends
strongly on the water content, because water has the highest specifi c heat of all food
compounds. Tables containing Cp data for various foodstuffs are available (ASHRAE,
1985; Rahman, 1995). Specifi c heat values for several foods are presented in Table 1.3.
TABLE 1.2Thermal Conductivity of Five Foods
Moisture X (Dry Basis) k (W/m K)
Food Min Max Min Max
Bread 0.00 0.82 0.040 3.559
Rice 0.10 0.43 0.080 0.336
Apples 0.10 19.00 0.000 2.270
Coffee 1.20 2.51 0.150 0.277
Cheese 0.50 2.94 0.340 0.548
Source: Adapted from Krokida, M.K. et al., Int. J. Food Prop., 4, 111–137,
2001. With permission.
TABLE 1.3Specifi c Heat of Five Foods
Food
Moisture Xw (Wet Basis) Cp (kJ/kg K)
Min Max Min Max
Carrots 0.001 0.145 1.439 2.272
Eggs 0.001 0.145 1.686 2.276
Soybeans 0.000 0.379 1.576 2.342
Paddy rice 0.113 0.203 1.606 1.986
Potatoes 0.001 0.159 1.301 2.151
Source: Adapted from Rahman, S., Food Properties Handbook, CRC Press, Boca
Raton, FL, 1995. With permission.
52527_C001.indd 1252527_C001.indd 12 10/16/2008 4:19:51 PM10/16/2008 4:19:51 PM
© 2009 by Taylor & Francis Group, LLC

Dehydration of Foods: General Concepts 13
1.4.2 PHYSICAL PROPERTIES
The structure of food materials can be characterized by density (apparent and true),
porosity, pore size distribution, specifi c volume, particle density shrinkage, and so on.
Among these, density and porosity are the most common structural properties reported
in the literature (Boukouvalas et al., 2006). Signifi cant changes in structural properties
can be observed as water is removed from the moist food during drying. These pro-
perties depend on various factors such as pretreatment, moisture content, processing
method, and process conditions (Krokida and Maurolis, 2000).
1.4.2.1 Apparent or Bulk Density
Bulk density ( rb) applies to powdered and porous materials. It is defi ned as the mass
of the sample (mt ) divided by its apparent volume (Vt ), which includes the volume of
dry solids, water, and air contained in the internal pores.
1.4.2.2 True or Particulate Density
Particulate density ( rp) is the density excluding all pores, and it is determined by the
ratio of the sample mass to its true volume (excluding air pores).
1.4.2.3 Porosity
This property characterizes the open structure of a material. Porosity (e) is the
fraction of the empty volume (void fraction) in a sample volume, and it is usually
estimated from the apparent and true density of a material (Boukouvalas et al., 2006;
Krokida and Philippopoulos, 2005). Experimental data of porosity and density have
been compiled by Rahman (1995) and more recently by Boukouvalas et al. (2006).
Table 1.4 lists the physical properties of several foods.
1.4.3 PROPERTY MODELING
It is important to note that the product composition and its temperature change
during drying. Therefore, to predict drying kinetics or to evaluate the quality changes
during drying, thermophysical properties should be available as continuous functions
TABLE 1.4Bulk Density ( rb) and Porosity (e) of Five Foods
Food
Moisture Xw (Wet Basis) rb (kg/m3) e
Min Max Min Max Min Max
Bread 0.000 0.428 161 974 0.000 0.790
Apples 0.000 0.900 80 1466 0.020 0.950
Nuts 0.027 0.350 57 792 0.339 0.664
Coffee 0.099 0.238 330 514 0.450 0.540
Milk 0.046 0.980 593 1020 0.477 0.477
Source: Adapted from Boukouvalas, Ch.J. et al., Int. J. Food Prop., 9, 715–746, 2006. With permission.
52527_C001.indd 1352527_C001.indd 13 10/16/2008 4:19:51 PM10/16/2008 4:19:51 PM
© 2009 by Taylor & Francis Group, LLC

14 Advances in Food Dehydration
of moisture content and/or temperature. There are several sources that present
theoretical and empirical equations to model these properties. However, because of
the diffi culty of using theoretical models in complex systems such as foods, empirical
models are more popular and widely used in food materials. Some of these models
will be presented in the following sections.
1.4.3.1 Linear Models
Water content plays a signifi cant role in the thermophysical properties of foods because
the properties of water are markedly different from those of other compounds such
proteins, fats, carbohydrates, and air. Therefore, thermophysical properties of foods are
frequently modeled as a function of moisture content, commonly through a linear
relationship if the moisture content is expressed on a wet basis. Moreover, thermal
conductivity may also be strongly dependent on temperature and thus is often modeled
as a function of both moisture content and temperature.
Sweat (1974) proposed a linear correlation for predicting the thermal conductivity
of fruits and vegetables that yielded predictive data within ±15% of its experimental
value. However, this model was limited to moisture content higher than 60% and the
temperature and porosity effects were not considered.
Phomkong et al. (2006) developed a linear mathematical model for thermophysical
properties of stone fruits. The thermal conductivity and specifi c heat were found to be
linear functions of moisture content whereas the apparent bulk density and porosity
were better represented by second-order polynomials. Specifi c heat and thermal
conductivity were also investigated by Vagenas and Marinos-Kouris (1990) for sultana
grapes and raisins, and these properties varied linearly with the moisture content
(14 to 80%). According to Madamba et al. (1995), moisture content had a marked
effect on the specifi c heat and thermal conductivity in garlic. Telis-Romero et al.
(1998) used a linear function of moisture content, temperature, and composition for
determination of specifi c heat in orange juice.
Changes of density, thermal conductivity, thermal diffusivity, and specifi c heat
of plums during drying as a function of moisture content was investigated by Gabas
et al. (2005). The apparent density of the fruits increased from 1042.9 to 1460.0 kg/m3
and the bulk density increased from 706.6 to 897.5 kg/m3 as the plums were dried.
In contrast, the effective thermal conductivity and specifi c heat increased from 0.154
to 0.4 W/m K and from 1796 to 3536 J/kg K, respectively, according to an increased
moisture content range of 14.2 to 80.4% (wet basis).
Shrivastava and Datta (1999) determined the specifi c heat and thermal conductivity
of mushrooms at various levels of moisture content, temperature, and bulk density. The
results of this investigation showed that changes in the moisture range (10.24 to 89.68%,
wet basis) had a strong linear correlation on these properties. However, Niesteruk
(1996) found that the thermal properties of fruit and vegetables vary linearly with the
moisture content but not for all ranges of humidity (0 to 100%). The study noted that
this effect was due to different properties of bound water in the product being dried.
1.4.3.2 Nonlinear Models
The applicability of the linear correlations mentioned earlier is sometimes limited to
a reduced range of water content. Their fi tting parameters also vary, depending on
52527_C001.indd 1452527_C001.indd 14 10/16/2008 4:19:51 PM10/16/2008 4:19:51 PM
© 2009 by Taylor & Francis Group, LLC

Dehydration of Foods: General Concepts 15
the type of food material. Efforts were thus carried out to develop generalized
correlations to predict all food properties by means of nonlinear regression models
(Rahman et al., 1997).
Lozano et al. (1979) and Mattea et al. (1989) developed nonlinear models in
exponential form for correlating conductivity data of apples and pears during drying.
The changes in bulk density, porosity, and bulk shrinkage during air dying of fruits
and vegetables were also investigated by Lozano et al. (1980, 1983). The bulk shrink-
age coeffi cient and porosity changes of these foods during drying were related to the
moisture content by empirical equations. In addition, Kim and Bhowmik (1997)
found that the bulk density of yogurt changed nonlinearly with moisture content, and
Marousis and Saravacos (1990) found that the particle density data of starch materials
correlated to the moisture content in a polynomial form.
Rahman et al. (1997) developed a generic correlation to predict thermal conduc-
tivity as a function of water, porosity, and temperature. The model was developed for
moisture contents from 14 to 88% (wet basis), temperatures from 5 to 100°C, and
porosities from 0.0 to 0.56. Maroulis et al. (2002) developed a structural generic
model to predict the effective thermal conductivity of fruits and vegetables during
drying. It combines a generic structural model for shrinkage and the distribution
factor concept for thermal conductivity.
Table 1.5 summarizes some models found in the literature on thermophysical
properties as a function of moisture content. In recent years, artifi cial neural network
modeling has gained increasing acceptance for the estimation and prediction of food
properties and processes (Mattar et al., 2004; Poonnoy et al., 2007; Sablani and
Rahman, 2003).
1.5 DRYING TECHNOLOGIES
This section will introduce and compare some conventional and new (nonconven-
tional) drying technologies and outline the principles and advantages/disadvantages
of their operations. A detailed description of these processes and the associated
equipment is well beyond the objective of this section.
1.5.1 SELECTION CRITERIA FOR CLASSIFICATION OF DRYERS
Drying technology has evolved markedly from the simple use of solar energy to
current technology (Vega-Mercado et al., 2001). The diversity of food products
generated the need for different types of dryers used in the industry. Dryers and
drying processes can be classifi ed in different ways. Kudra and Mujumdar (2002),
Mujumdar and Menon (1995), and Vega-Mercado et al. (2001), have given detailed
schemes for classifi cation of industrial dryers based on numerous selection criteria.
Among them, the most important criteria for evaluating a dryer system are the
following:
1. Mode of operation (batch or continuous)
2. Operating pressure (vacuum, atmospheric, and high pressure)
3. Mode of heat transfer (conduction, convection, radiation, dielectric heating,
and combination of different modes)
52527_C001.indd 1552527_C001.indd 15 10/16/2008 4:19:51 PM10/16/2008 4:19:51 PM
© 2009 by Taylor & Francis Group, LLC

16 A
dvan
ces in Fo
od
Deh
ydratio
n
TABLE 1.5Empirical Models Relating Food Thermophysical Properties with Moisture Content
Model Moisture Content Properties Material Ref.
k � 0.148 � 0.00493Xw Xw � 0.6 Thermal conductivity Strawberries, cherry tomatoes,
cucumbers, onions, beets,
and carrots
Sweat (1974)
k � 0.493 � 0.359 exp(-1.033X ) 1.0 � X � 7.0 Thermal conductivity Pears Mattea et al. (1989)
Cp � 1.52 � 0.028Xw 0.4 � Xw � 0.62 Specifi c heat Garlic Madamba et al. (1995)
Cp � 2.89 � 0.012Xw 0.3 � Xw � 0.83 Specifi c heat Nectarine Phomkong et al. (2006)
e � 1 - 0.852 - 0.462 exp(-0.66X )
______________________ 1.54 exp(-0.051X )
1.5 � X � 7.45 Porosity Apples Lozano et al. (1980)
e � 1 - 933.9 - 274Xw _______________________
1485.5 � 41.8Xw - 775.6X2 0.14 � Xw � 0.8 Porosity Plums and prunes Gabas et al. (2005)
rb � 0.852 - 0.462 exp(-0.66X ) 0 � X � 7.45 Bulk density Apples Lozano et al. (1980)
rb � 933.9 - 274.4X 0.14 � Xw � 0.8 Bulk density Plums Gabas et al. (2005)
rp � 1.54 exp(-0.051X) - 1.15 exp(-2.4X) X � 1.5 Particulate density Apples Lozano et al. (1980)
rp � 1442 � 837X - 3646X2 � 4481X3 - 1850X4 0 � X � 1.0 Particulate density Starch materials Marousis and Saravacos
(1990)
X (g water/g dry mass), Xw (g water/g wet mass).
52527_C001.indd 16
52527_C001.indd 16
10/16/2008 4:19:51 PM
10/16/2008 4:19:51 PM
© 2009 by T
aylor & Francis G
roup, LL
C

Dehydration of Foods: General Concepts 17
4. State of product being dried (stationary, moving, agitated, fl uidized, and
atomized)
5. Residence time (short � below 1 min, medium � 1–60 min, long � higher
than 60 min).
The previous classifi cation scheme gives an idea of the large number of dryers
and their potential confi gurations. One of the most appropriate methods of classifi cation
of dryers is related to the method of heat transfer (conduction, convection, radiation,
dielectric heating, etc.). Most dryers are operated at atmospheric pressure. Vacuum
operations are expensive and they are recommended only for heat-sensitive products.
On this basis, Figure 1.4 shows a classifi cation of atmospheric dryers according to
heat transfer mode. The list presented in the fi gure is brief; it is given as a simple
summary of types of dryers that can be used, depending on the mode of heat transfer.
As mentioned earlier, numerous other criteria can be considered for selecting a dryer
(see Kudra and Mujumdar, 2002, for details). The fi nal selection of the dryers will
usually represent a compromise between the total cost, product quality, safety con-
siderations, and convenience of installation (Mujumdar and Menon, 1995).
1.5.2 ADVANTAGES AND DISADVANTAGES
Many conventional methods are used in food drying including hot air drying, vacuum
drying, drum drying, spray drying, freeze-drying, and so forth. Numerous emerging
technologies have been developed recently as alternatives to more well-known methods.
For multiple reasons, there is an industry preference to use conventional dryers because
of simplicity of construction and operation as well as their mature status and familiarity.
Dryer vendors prefer such technologies because of the low risk factor in design and
scale-up (Kudra and Mujumdar, 2002). In addition, the high cost of some new technolo-
gies limits their application. New drying technologies must offer signifi cant advantages
over conventional technologies to fi nd industrial acceptance. The selection criteria for
the use of new technologies remain the same as those for conventional ones. Before a
particular process is selected, different factors should be considered, including the type
of product being dried (e.g., heat-sensitive materials), the desired quality of the fi nished
product, the energy effi ciency, and the cost of processing. Table 1.6 compares some
FIGURE 1.4 Classifi cation of dryers according to heat mode transfer.
Heat transfer mode
Flash dryerSpray dryerFluid bed dryerCabinet dryerTunnel dryerRotary dryerSpouted beddryer
Convection Conduction Radiation Dielectric Combined modes
Drum dryerAgitated pan dryerRotary dryerTrays dryer
Infrared shelf dryerSun dryer
Microwave ovenMicrowave tunnelRadiofrequency dryer
Microwave convective dryerMicrowave spouted bed dryerInfrared convective dryerRadiofrequency assisted heatpump dryer
DRYERS
52527_C001.indd 1752527_C001.indd 17 10/16/2008 4:19:52 PM10/16/2008 4:19:52 PM
© 2009 by Taylor & Francis Group, LLC

18 A
dvan
ces in Fo
od
Deh
ydratio
n
TABLE 1.6Conventional and New Technologies Used According to the Form Feed
Drying Technologies Feed Type Principle or Description Advantages Disadvantages
Sun drying Fruits, vegetables, meat, fi sh,
plants, and aromatic herbs
Direct exposure of food to sunlight Simple and low operating cost,
low temperature
Long drying time, large
areas of space, chemical
deterioration, microbial
contamination
Hot air drying Small particulates, vegetables
and fruit pieces, granular products
Food in contact with hot steam air,
drying occurs by convection
Simple and continuous process,
low operating cost
Nutritional quality loss,
shrinkage, long drying time
Drum drying Liquids, foods, slurry, pastelike or
sludge, pulps, and suspensions
Food dried on the surface of hollow
drums heated internally by steam
Continuous operation May require modifi cation
of liquid to ensure good
adhesion to the drying
surface
Spray drying Liquids foods and suspensions,
instant coffee, pharmaceuticals
Liquid atomized (sprayed) into a
drying chamber, where contacts
hot air
Uniform and rapid drying, low
cost, large-scale production
Some quality loss by thermal
degradation, high temperature
potential of agglomeration
Freeze-drying Fruit and vegetables, mushrooms,
instant coffee, pharmaceuticals,
high value-added products
Frozen water removed from food
by sublimation
High nutritional and sensorial
quality, no restriction on
particle size, utilization of
low temperatures
Slow and expensive process,
long drying time
52527_C001.indd 18
52527_C001.indd 18
10/16/2008 4:19:52 PM
10/16/2008 4:19:52 PM
© 2009 by T
aylor & Francis G
roup, LL
C

Deh
ydratio
n o
f Foo
ds: G
eneral C
on
cepts
19
Fluidized bed
drying
Small particulates, diced
vegetables and fruit granules,
fruit juice powders, high
value-added products
Material dried while suspended
in an upward fl owing gas
steam (hot air)
High thermal effi ciency, high
drying rates due to good gas
particle contact, low cost and
maintenance
May require relatively small,
uniform, and discrete
particles
Spouted bed drying Inert particles; paste and slurries;
granular products like wheat,
corn, oats, and cereal seeds;
heat-sensitive foodstuffs
Food suspended into a spouted
bed system where contacts
hot air
High drying rates and low drying
times, low drying temperature
Problem of scale-up and
control of the cyclic pattern
Superheated steam
drying (SSD)
Solid particles, value-added
products, high oxygen-sensitive
food and biomaterials
SSD transfers its sensible heat to
the product being dried and the
water to be evaporated; SSD acts
as heat source and drying medium
to take away the evaporated water
High drying rates, better product
quality (no product oxidation),
simple process control,
improved drying effi ciency
Appropriate insulation of the
steam drying process
necessary, construction of
dryer above condensation
temperature of SSD
Microwave (MW)
and radiofrequency
(RF) drying
Fruit and vegetables, high value-
added products, pasta products,
cookies
Food heated and dried by
electromagnetic energy; MW
drying frequencies from 300
to 3000 MHz; RF drying
frequencies from 1 to 300 MHz
Effi ciency of energy conversion,
uniformity of drying, short
drying times, desirable chemical
physical effects, better process
control
Expensive process,
nonuniformity of
electromagnetic fi eld, high
installation cost
52527_C001.indd 19
52527_C001.indd 19
10/16/2008 4:19:52 PM
10/16/2008 4:19:52 PM
© 2009 by T
aylor & Francis G
roup, LL
C

20 Advances in Food Dehydration
types of conventional and new drying technologies that can be used according to the
type of product to be dried. It also shows some of their advantages and disadvantages.
For more information on other new drying technologies, see Chapters 13 and 15.
1.6 QUALITY ASPECTS OF DEHYDRATED FOODS
Quality aspects require special attention in processes dealing with foodstuffs.
Unfortunately, it is well known that drying may partially or totally affect the quality
of a product (Bimbenet and Lebert, 1992; Karel, 1991; Ratti, 2001).
Up until recently, R&D efforts in drying were directed toward processes and
technology with the goal of extending shelf life, but little attention paid to conservation
of quality attributes. Efforts were made recently to develop dried foods of high quality.
This goal was attained by using innovative technologies and by improving and opti-
mizing existing techniques. Many quality parameters can be defi ned for dried foods.
These quality parameters can be categorized into three major groups: physical,
chemical (or biochemical), and microbiological. Table 1.7 summarizes some of the
quality changes that may occur in foods during drying, which include loss of aroma
and fl avors, changes in color and texture, and a decrease in nutritional value.
Furthermore, residual enzyme and microbial activities are also important parameters
that affect product quality and shelf life in a dehydrated material.
Food quality can be affected by other nondrying parameters such as pH; the
composition of the food; pretreatments; and the presence of salts, oils, or solvents
(Mujumdar, 1997). In contrast, analysis of processes affecting the physical, biochemical,
and microbiological stability of foods is largely based on sorption isotherms of the
materials involved (Tsami et al., 1990). Moreover, the removal of water during drying
affects the structural and compositional characteristics of the product and can cause
phase transitions.
1.6.1 WATER SORPTION ISOTHERMS
Water activity is defi ned as the ratio of the vapor pressure in a food material to that
for pure water at the same temperature. The relationship between the equilibrium
moisture content Xe and the corresponding water activity aw at a constant temperature
TABLE 1.7Food Quality Degradations Occurring during Drying
Physical Chemical or Nutritional Microbiological
Porosity changes Enzymatic reactions Microbial survival
Shrinkage Lipid oxidation Loss in activity
Change of solubility Vitamin and protein losses
Reduced rehydration Browning reaction
Hardening and cracking Degradation of nutraceutical compounds
Aroma and fl avor loss
52527_C001.indd 2052527_C001.indd 20 10/16/2008 4:19:52 PM10/16/2008 4:19:52 PM
© 2009 by Taylor & Francis Group, LLC

Dehydration of Foods: General Concepts 21
yields a water sorption isotherm. This isotherm is one of the most fundamental
parameters that infl uence many aspects of the dehydration process and the storage
stability of the dried product. For food systems, these isotherms also give useful infor-
mation about the sorption mechanism and the interaction of food biopolymers with
water (Chirife and Buera, 1994; Tsami et al., 1990).
The water sorption isotherms of most foods are nonlinear, generally exhibiting a
sigmoidal shape when graphically represented (Figure 1.5). Isotherms in food mate-
rials are usually obtained by exposing a small sample of food to various constant
relative humidity atmospheres. After equilibrium is reached, the water content of the
sample is determined gravimetrically or by other methods (Karel and Lund, 2003b).
Constant relative humidity is generally achieved by using salt solutions. An isotherm
obtained by exposing a dry solid to increasing water activities is an adsorption isotherm;
exposing a wet solid to decreasing water activities is a desorption isotherm. Adsorption
isotherms are used to describe the hygroscopic behavior of a product, whereas
desorption isotherms are useful for drying because the moisture content of the solid
progressively decreases during the process.
Figure 1.5 shows the general shape of the sorption isotherms for a food material
characterized by three different zones: A, B, and C. Zone A represents sorption of
water that is strongly bound to the sites, and it is unavailable to serve as a solvent. In
this region, there is essentially the formation of a monomolecular layer of water. The
enthalpy of the vaporization of water in this zone is higher than that of pure water.
Zone B is a zone in which the water is more loosely bound, so mainly double and
multiple layers are formed. In this zone, water is held in the solid matrix by capillary
condensation and multilayer adsorption. Some of the water may still be in the liquid
phase, but its mobility is signifi cantly limited because of attractive forces with the
solid phase. In zone C the water is even more loosely bound and available for partici-
pation in reactions and as a solvent (Mujumdar, 1997; Mujumdar and Menon, 1995;
Toledo, 1991).
The moisture content of the monomolecular layer (in zone A) is often considered
as a good fi rst approximation of the water content providing maximum stability of a
dehydrated material. The best model to estimate the moisture content of monomolecular
FIGURE 1.5 Water sorption isotherm of a foodstuff.
0 0.2 0.6 1
Adsorption
aw
A B C
Desorption
52527_C001.indd 2152527_C001.indd 21 10/16/2008 4:19:52 PM10/16/2008 4:19:52 PM
© 2009 by Taylor & Francis Group, LLC

22 Advances in Food Dehydration
layer is described by the Brunauer–Emmett–Teller (BET) equation (Brunauer et al.,
1938; Karel, 1973; Labuza, 1980):
aw ________
X(1 - aw) � 1 ____
XmC � C - 1 _____
XmC (aw) (1.12)
where X is the moisture content (g water/g dry mass); Xm is the water content corres-
ponding to the water molecules covering the surface of particles as a monolayer;
and C is a constant, which is temperature dependent. The plot of aw/(X(1 – aw)) versus
aw is known as the BET plot. For most foods, this plot is linear for low water con-
tents, and its slope and intercept can be used to determine the constants C and Xm.
Determining the moisture content for the maximum shelf stability of a dehydrated
material involves determining the sorption isotherm and calculating the value of Xm
in Eq. (1.12) (Toledo, 1991).
Moraga et al. (2006) found that the moisture content of the monomolecular layer
was similar in both whole or homogenized freeze-dried kiwi fruits, with values ranging
between 0.053 and 0.061 g water/g dry solids.
1.6.1.1 Sorption Hysteresis Phenomenon
Hysteresis is related to the nature and state of the components in a food. In many
cases, the process of sorbing or desorbing water may change the solid matrix and
consequently affect the sorption behavior. This is represented schematically in
Figure 1.5 where it is evident that the adsorption and desorption paths are different,
giving a so-called hysteresis loop (Kapsalis, 1987). Thus, more moisture is retained
in the desorption process compared to adsorption at a given water activity. Moisture
sorption isotherms of several foods exhibit hysteresis. Some known examples in food
technology include starchy foods and products with high protein or high sugar content.
This hysteresis effect is also observed to a different extent in almost all hygroscopic
products. Moraga et al. (2004) reported signifi cant differences in the adsorption–
desorption behavior of whole and pureed strawberries, indicating the hysteresis in
the sorption pathway of both kinds of samples. Nevertheless, the hysteresis was less
marked in the homogenized sample. The phenomenon of hysteresis has also been
observed in other fruits such as raisins, currants, fi gs, prunes, apricots (Tsami et al.,
1990), and bananas (Yan et al., 2008) and in starch–protein extrudates (Wlodarczyk-
Stasiak and Jamroz, 2008). However, the sorption behavior of grapes did not show
the phenomenon of hysteresis (Vazquez et al., 1999).
Many theories and hypotheses have been formulated to explain the phenomenon
of hysteresis. One such theory is that the hysteresis of dehydrated foods can vary
depending on the nature of the food, temperature, storage time, and adsorption–
desorption cycles. However, no model has been found to quantitatively describe the
hysteresis loop in foods (Rizvi, 2005).
1.6.1.2 Temperature Effect on Sorption Isotherms
Water activity changes with temperature. Thus, water sorption isotherms must also
exhibit temperature dependence. Temperature affects the mobility of water molecules
52527_C001.indd 2252527_C001.indd 22 10/16/2008 4:19:52 PM10/16/2008 4:19:52 PM
© 2009 by Taylor & Francis Group, LLC

Dehydration of Foods: General Concepts 23
and the equilibrium between the vapor and adsorbed phases (Kapsalis, 1987). In
principle, a temperature increase results in a decrease of the amount of water
adsorbed. However, at high water activities (aw � 0.8), foods with high sugar content
exhibit opposing temperature effects (i.e., equilibrium moisture content increases
with temperature) that is due to an increase in the solubility of sugars in water (Audu
et al., 1978). According to Rizvi (2005), the variation of water activity with temperature
can be determined by using either thermodynamic principles or the temperature terms
incorporated into sorption equations. The effect of temperature on water sorption
isotherms is often represented by the Clausius–Clapeyron equation:
w sln ( )
(1/ )
a QT R
∂È ˘Í ˙∂Î ˚
�
(1.13)
where Qs is the net isosteric heat or heat of sorption, which is defi ned as the difference
between the total molar enthalpy change and the molar enthalpy of vaporization, and
R is the universal gas constant. The Clausius–Clapeyron equation is commonly used
for the calculation of the isosteric heat of sorption (Iglesias et al., 1989; Kiranoudis
et al., 1993; Lim et al., 1995; Sinija and Mishra, 2008; Tsami et al., 1990).
Several studies have reported sorption data for different food materials and tem-
peratures (Cassini et al., 2006; Iglesias et al., 1986; Kiranoudis et al., 1993; Labuza
et al., 1985; Saravacos et al., 1986). A typical example of the temperature effect on
the isotherms is shown in Figure 1.6 for carrot samples. The binding forces decrease
FIGURE 1.6 Effect of temperature on water sorption isotherm for carrot. (Adapted from
Kiranoudis, C.T. et al., J. Food Eng., 20, 55–74, 1993. With permission.)
aw
0.0 0.2 0.4 0.6 0.8 1.0
X (
g w
ater
/100
g d
ry m
ass)
0
10
20
30
40
50
60
30°C45°C60°C
52527_C001.indd 2352527_C001.indd 23 10/16/2008 4:19:53 PM10/16/2008 4:19:53 PM
© 2009 by Taylor & Francis Group, LLC

24 Advances in Food Dehydration
with increasing temperature, that is, less moisture is adsorbed at higher temperatures
at the same water activity or the equilibrium relative humidity. Aside from temperature,
other factors that affect sorption isotherms are chemical composition, physical struc-
ture, and pretreatment of the sample, among others related to the method of handling
and drying the product (Van der Berg, 1986).
1.6.1.3 Empirical and Theoretical Description of Water Sorption Isotherms
Numerous empirical and semiempirical equations have been proposed for the cor-
relation of equilibrium moisture content with water activity. They require extensive
experimental data at each temperature in order to evaluate the parameters in the
model. Good compilations of sorptional data were presented by Iglesias and Chrife
(1982) and Wolf et al. (1985). Useful information on the sorption and desorption
enthalpies, as well as the microbiological stability of the product, can be obtained
from sorptional data (Wolf et al., 1985).
One of the most relevant equations used to represent sorption data of foods is the
Guggenheim–Anderson–de Boer (GAB) equation:
e w
m w w w(1 )(1 )
X CKaX ka ka Cka
�� � �
(1.14)
The GAB equation is based on BET theory and generally involves three coeffi -
cients: K, C, and Xm, where C and Xm are similar to those in the BET equation and K
is a third parameter that improves the fi t to a wider range of moisture contents.
Temperature effects can usually be determined by introducing a temperature
exponential function into coeffi cients C and K (Kiranoudis et al., 1993).
1.6.1.4 Infl uence of Drying Methods
The effect of drying methods on the sorption equilibrium isotherms of food powders
was demonstrated by various studies (Araya-Farias et al., 2007; Khallouffi et al.,
2000; Ratti et al., 2007; Tsami et al., 1999). Tsami et al. (1999) found that freeze-dried
gel adsorbed more water vapor than microwave-dried gel, which had a higher sorption
capacity than vacuum and conventionally dried products. The sorption isotherms
agreed with the reported shape for high sugar foodstuffs. Freeze- and vacuum-dried
pectin developed the highest porosity, whereas the lowest porosity was obtained
using conventional and microwave drying.
Figure 1.7 provides a comparison of sorption equilibrium isotherms at 20°C for
freeze-dried or hot air dried seabuckthorn fruits and garlic samples. Both curves had
the typical sigmoidal adsorption form. Freeze-dried powders showed higher water
adsorption than convective dried ones, indicating that the former powders will be more
hygroscopic than convective-dried powders during storage. The porous structure
generated in the products during freeze-drying can certainly explain their higher
water sorption. Nevertheless, the seabuckthorn freeze-dried samples were less hygro-
scopic than the garlic samples.
52527_C001.indd 2452527_C001.indd 24 10/16/2008 4:19:53 PM10/16/2008 4:19:53 PM
© 2009 by Taylor & Francis Group, LLC

Dehydration of Foods: General Concepts 25
1.6.2 PHYSICAL QUALITY
Physical properties such as color, texture, density, porosity, and rehydration capacity
are affected by the drying method. A tough and woody texture, slow and incomplete
rehydration, and loss of the typical fresh food juiciness are the most common defects
encountered during drying (Barbosa-Canovas and Vega-Mercado, 1996; Karel and
FIGURE 1.7 Sorption isotherms at 20°C for (a) seabuckthorn and (b) garlic powders. (Data
from Araya-Farias et al. (2007) for seabuckthorn and from Ratti et al. (2007) for garlic.)
X (
g w
ater
/g d
ry m
ass)
0.0
0.1
0.2
0.3
0.4
0.5
Freeze-drying Hot air drying
aw
0.0 0.2 0.4 0.6 0.8
aw
0.0 0.2 0.4 0.6 0.8 1.0
(a)
(b)
X (
g w
ater
/g d
ry m
ass)
0.00
0.05
0.10
0.15
0.20
0.25
0.30
0.35
Freeze-drying
Hot air drying
52527_C001.indd 2552527_C001.indd 25 10/16/2008 4:19:53 PM10/16/2008 4:19:53 PM
© 2009 by Taylor & Francis Group, LLC

26 Advances in Food Dehydration
Lund, 2003a). The physicochemical basis for these changes is complex, and its
understanding requires tedious lab measurements.
1.6.2.1 Color
Color is a major quality parameter in dehydrated food. During drying, color may
change because of chemical or biochemical reactions. Enzymatic oxidation, Maillard
reactions, caramelization, and ascorbic acid browning are some of the chemical reac-
tions that can occur during drying and storage (Perera, 2005). Ratti (2001) provided a
comparison of changes in color during air drying and freeze-drying of strawberries
at different temperatures. Changes in the color of air-dried samples was signifi cantly
higher compared to freeze-dried ones. Discoloration and browning during air drying
may be the result of various chemical reactions including pigment destruction (Garcia-
Viguera et al., 1998; Krokida et al., 1998). For more detailed information on color
measurements during drying, refer to Chapter 3.
1.6.2.2 Shrinkage, Porosity, and Bulk Density
One of the most important physical changes that foodstuffs undergo during drying is
the reduction of their volume, often called shrinkage. Shrinkage is caused by structural
collapse attributable to the loss of water (Prothon et al., 2003; Ratti, 1994). Changes
in shape and size, loss of rehydration capacity, surface cracking, and hardening of
food materials are among the most important physical phenomena associated with
shrinkage (Mayor and Sereno, 2004; Prothon et al., 2003; Ratti, 1994).
Three different types of shrinkage have been reported during drying: one
dimensional (i.e., when the volume change follows the direction of diffusion), isotropic
(or three dimensional), and anisotropic or arbitrary. In contrast, volume changes of
individual particles are normally expressed as the bulk shrinkage ratio of the sample
volume at any time to the initial volume (V/V0; Ratti and Mujumdar, 2005).
Shrinkage is rarely negligible in food systems, and it is necessary to take it
into account when predicting moisture content profi les in the material undergoing
dehydration (Mayor and Sereno, 2004). Modeling, design, and control of drying
operations require accounting for the changes in physical dimensions of the product,
moisture content, shrinkage, porosity, bulk density, and volume. For such purposes,
attempts to model shrinkage, porosity, and bulk density during drying have been
made by several researchers for different fruits and vegetables like apples, bananas,
carrots, potatoes, and garlic. An extensive compilation of those mathematical mod-
els for shrinkage was presented by Mayor and Sereno (2004). The most common way
to model shrinkage during drying is to adopt an empirical correlation between
shrinkage and moisture content, including in some cases the effects of temperature
and relative humidity of air. Some of the linear shrinkage models during air drying
are delineated in Table 1.8.
Porosity and bulk density are important physical properties in dried foods. These
two properties play an important role in rehydration of dried materials and their
handling and packaging aspects (Perera, 2005). The extent of shrinkage infl uences the
resulting changes in porosity during drying. Shrinkage and porosity changes during
air drying of fruits and vegetables were investigated by Lozano et al. (1980, 1983).
52527_C001.indd 2652527_C001.indd 26 10/16/2008 4:19:53 PM10/16/2008 4:19:53 PM
© 2009 by Taylor & Francis Group, LLC

Dehydration of Foods: General Concepts 27
The bulk shrinkage and the porosity changes were related to moisture content by
empirical correlations. It was demonstrated in apple tissue that both the overall
shrinkage of the sample and the cellular shrinkage cooperate, resulting in an increase
in porosity as the moisture content decreases (Lozano et al., 1980). Porosity in fruits
and vegetables increases during drying, depending on the initial moisture content,
composition, and size, as well as the type of drying (Saravacos, 1967).
The effects of drying methods on the shrinkage and porosity of fruits and vege-
tables were reported by Krokida and Maroulis (1997) and Krokida and Philippopoulus
(2005). Table 1.9 provides the volume shrinkage coeffi cients ( b�) estimated for
TABLE 1.9Effect of Drying Method on Volume Shrinkage Coeffi cient ( b�)
Material Drying Method b b �
Apples Convective
Vacuum
Microwave
Freeze
0.99
0.96
1.01
0.34
Bananas Convective
Vacuum
Microwave
Freeze
1.04
0.90
1.05
0.43
Potatoes Convective
Vacuum
Microwave
Freeze
1.03
1.03
0.81
0.29
Source: Adapted from Krokida, M.K. and Maurolis, Z.B., Dry. Technol., 15, 2441–2458, 1997. With permission.
TABLE 1.8Linear Empirical Models for Shrinkagea
Model Geometry Material Ref.
V ___ V0
� k1X � k2Cylinder Apples Lozano et al. (1980)
V ___ V0
� k8 � k9 X for X � XeCylinder Apples and
potatoes
Ratti (1994)
D ( V ___ V0
) � k13 � (k14 � k15RH � k16T )�X Sphere Wheat and canola Lang and Sokhansanj (1993)
V ___ V0
� (k17T � k18) � (k19T � k20)X Cylinder Potatoes McMinn and Magee (1997a)
a For reduced volume (current value/initial value).
Source: Adapted from Mayor, L. and Sereno, A.M., J. Food Eng., 61, 373–386, 2004. With permission.
52527_C001.indd 2752527_C001.indd 27 10/16/2008 4:19:53 PM10/16/2008 4:19:53 PM
© 2009 by Taylor & Francis Group, LLC

28 Advances in Food Dehydration
different drying methods. The shrinkage coeffi cient depends on the drying method
and the material. Its values approach unity for conventional, vacuum-, and microwave-
dried materials, but they are much less for freeze-dried materials. Less than 10%
shrinkage is normally expected in the fi nal products after freeze-drying compared to
80 to 90% when air dried (Ratti and Mujumdar, 2005). Volumetric changes in straw-
berries indicated that shrinkage attributable to freeze-drying was 8% for whole fruits
and less than 2% for slices (Shishehgarha et al., 2002). These results are similar to
those obtained for raspberries and blackberries (Jankovié, 1993), where shrinkage
of berries due to freeze-drying was minimal (5 to 15%) compared to 80% obtained
during air drying (Ratti, 2001).
Figure 1.8 shows the effects of drying methods on the porosity of tropical fruits.
Freeze-dried guava had the highest porosity, whereas heat pump dried (with normal
air) had the lowest porosity. In contrast, the porosity of freeze-dried papaya was lower
than that of the heat pump, and vacuum-dried samples had the largest porosity. The
possible reason is a visual “puff effect” observed in vacuum-dried papaya that causes
its largest porosity. Reduced pressure may have contributed to it (Hawlader et al.,
2006). However, freeze-drying generally produces materials with fragile structures
and higher porosity values (Krokida and Philippopoulus, 2005). In a study realized
by Krokida and Maroulis (1997), the porosity of freeze-dried fruits and vegetables
(80 to 90%) was always higher compared to all of the other dehydration processes
that were used. The porosity of microwave potatoes and carrots followed (75%),
but microwave-dried apples and bananas did not developed high porosities (60 and
25%, respectively). Vacuum-dried bananas and apples developed high porosity (70%),
FIGURE 1.8 Effect of drying method on porosity of tropical fruits. (Adapted from Hawlader,
M.N.A. et al., Dry. Technol., 24, 77–87, 2006. With permission.)
Drying method
Heat pump drying Vacuum drying Freeze-drying
Por
osity
(ε)
0.0
0.1
0.2
0.3
0.4
0.5
0.6
Guava Papaya
ε
52527_C001.indd 2852527_C001.indd 28 10/16/2008 4:19:53 PM10/16/2008 4:19:53 PM
© 2009 by Taylor & Francis Group, LLC

Dehydration of Foods: General Concepts 29
but vacuum-dried carrot and potato porosity values were lower (50 and 25%, respec-
tively). Krokida and Maroulis reported that the bulk density values during vacuum
drying were signifi cantly lower than those of conventional drying for all materials.
1.6.2.3 Rehydration Properties
As mentioned earlier, changes in the physical structure of foods take place during
drying. Thus, rehydration can be considered as a measure of the injury to the material
caused by drying and treatment preceding dehydration (Krokida and Philippopoulus,
2005). The rate and degree of rehydration depend on the drying conditions as well as
the drying method employed. The infl uence of the drying temperature (30 to 60°C)
on rehydration of potato samples was presented in several studies. McMinn and
Magee (1997b) observed a concurrent increase in rehydration capacity with air-drying
temperatures. Hawlader et al. (2006) observed that the rehydration rate of heat
pump dried samples was slightly higher compared to freeze-dried and vacuum-dried
samples. Similar behaviors were found in guava and papaya fruits. However, freeze-
drying generally produces materials with fragile structures and higher porosity values.
Products normally rehydrate faster when they are more porous (Krokida and
Philippopoulus, 2005).
1.6.3 MICROBIOLOGICAL AND CHEMICAL QUALITY
Dehydrated foods are preserved because their water activity is at a level where no
microbiological activity can occur and where deteriorative chemical and biochemical
reaction rates are reduced to a minimum. The relationships between aw and the
rate of deteriorative reactions in food can be found extensively in the literature
(Fennema, 1985). Beuchat (1983) reported minimal water activities required for
growth of a number of microorganisms. Reducing aw below 0.7 prevents microbio-
logical spoilage. Most oxidation reactions and enzyme reactions will be inhibited
as aw decreases. However, autooxidation of lipids could take place at very low aw
values (�0.2). The maximal rate of nonenzymatic browning reactions (Maillard
reaction) is achieved at intermediate aw values (0.4 to 0.65). These reactions result
in the loss of nutritive value, formation of brown pigments, as well as the formation
of off-fl avors, especially when the products are stored at high temperatures.
Therefore, the browning reactions can be prevented by an appropriate treatment
such as sulfur dioxide (SO2), a decrease of the pH (2 to 3), or lowering of aw (0.2
to 0.4) by drying. In contrast, short heat treatments such as blanching can be used
to inactivate enzymes and antioxidants are useful to prevent lipid oxidation. Dried
products are considered to be more stable at their monolayer moisture content
(Fennema, 1985; Perera, 2005).
1.6.4 NUTRITIONAL QUALITY
Many nutritional compounds in foods such as antioxidants (carotenoids and phenolic
compounds), vitamins, and essential fatty acids have recently been the subject of
growing interest because of their possible role in the prevention of human diseases,
including cancer and heart disease. Fruits and vegetables are essential foods in the
52527_C001.indd 2952527_C001.indd 29 10/16/2008 4:19:53 PM10/16/2008 4:19:53 PM
© 2009 by Taylor & Francis Group, LLC

30 Advances in Food Dehydration
human diet. Common dietary guidelines recommend increased intake of fruits and
vegetables, which contain low levels of fat and high levels of vitamins, minerals, and
fi ber. They are also considered as a rich source of antioxidants. Many health benefi ts
have been related to consumption of fruits and vegetables. However, nutritional quality
can be affected by handling, processing, and packaging. Aside from physical and
chemical changes, drying can also cause loss of nutritional value. The major losses
of vitamins and other substances take place because of solubility in water, enzymatic
oxidation, oxygen and heat sensitivity, and metal ion catalysis during processing. In
addition, sugar–amine interactions (Maillard reaction) can occur during drying and
storage, causing loss of nutrients. A survey of the literature reveals studies that suggest
means of reducing such losses: pretreatments, proper selection of drying methods,
new and innovative drying methods, and optimization of drying conditions.
1.6.4.1 Infl uence of Drying Methods and Pretreatments
Several studies focusing on the effect of drying on loss or retention of nutritional
quality were published in the last several years. Conventional and new technologies
were utilized in these studies. The effects of pretreatments as well as the operating
drying conditions on nutrient loss were also considered in these works. This information
was exhaustively surveyed by Sablani (2006) and Lewicki (2006). For further infor-
mation on this subject, the reader is encouraged to refer to Chapter 10.
Pretreatments are often used to accelerate the drying process as well as to
improve certain quality attributes of the fi nal dried product. The pretreatments
depend on the kind of material to be processed, such as liquids, pastelike foods, and
solids. Table 1.10 details some important pretreatments used prior to drying accord-
ing to food material. Useful details and information on those pretreatments are found
in Lewicki (2006).
TABLE 1.10Pretreatments Used prior to Drying according to Physical Form of Materiala
Material Type Pretreatments
Liquid foods Concentration, cryoconcentration, enzymatic treatments
Pastelike foods Whipped into foams
Chemical PhysicalSolid foods Sulfi ting Blanching at short times and high
temperatures or low temperatures and long
times; utilization of hot water or hot steam
Immersion in NaCl, CaCl2, or sugars
(osmotic treatment) or in acid solutions
Freezing
Use of surfactants (ethyloleate) High pressure
Impregnation with biopolymers (dextrans) Microwave
a According to Lewicki, P.P., Trends Food Sci. Technol., 17, 153–163, 2006. With permission.
52527_C001.indd 3052527_C001.indd 30 10/16/2008 4:19:54 PM10/16/2008 4:19:54 PM
© 2009 by Taylor & Francis Group, LLC

Dehydration of Foods: General Concepts 31
1.6.5 GLASS-TRANSITION TEMPERATURE AND QUALITY CONSIDERATIONS
The application of the knowledge of the glass transition of polymers to food systems
was successful for understanding and predicting the behavior of foodstuffs during
processing (Ratti, 2001). The glass-transition temperature (Tg) is defi ned as the tem-
perature at which an amorphous system changes from the glassy to the rubbery state
(Roos and Karel, 1991). Schenz (1995) reported that if the temperature of a product
is higher than Tg, at the correspondent water content, the quality of foodstuffs can be
seriously affected. The Tg is a function of moisture content as well as the concentration
of solutes such as sugars. The glass transition in foods may occur during drying and
can have dramatic effects on product quality (physical and chemical). It can affect
the diffusion of components or reactants, resulting in the loss of aroma as well as
affecting the nonenzymatic browning reactions (Mujumdar, 1997). Some studies on
the relationship of nonenzymatic browning and glass transition were reported by
Karmas et al. (1992) and Roos and Himberg (1994).
Shrinkage and Tg are interrelated and signifi cant structural changes may be
avoided if dehydration is carried out below the Tg. In experiments on freeze-drying
of strawberries, a high percentage of strawberries collapsed at temperatures higher
than the glass transition of the dry matrix (38°C). At heating temperatures higher
than 50°C, the percentage of collapse exceeded 20% (Shishehgarha et al., 2002). For
more detailed information on this subject, please read Chapter 2.
NOMENCLATURE
VARIABLES
A area available for drying (m2)
aw water activity
C BET constant
Cpa specifi c heat of dry air (kJ/kg °C)
Cpw specifi c heat of vapor water (kJ/kg °C)
Cp specifi c heat (kJ/kg K)
H enthalpy (kJ/kg dry air)
K GAB constant
k thermal conductivity (W/m °C)
L0 latent heat of water at 0°C (kJ/kg)
m wet mass (kg)
ms mass of dry solids (kg)
Mw molecular weight of water (Da)
Ma molecular weight of air (Da)
na number of moles of air
nw number of moles of water
Nw drying rate (kg water m2/h)
Pa partial pressure of air (kPa)
Pw partial pressure of water (kPa)
Pt total pressure (kPa)
52527_C001.indd 3152527_C001.indd 31 10/16/2008 4:19:54 PM10/16/2008 4:19:54 PM
© 2009 by Taylor & Francis Group, LLC

32 Advances in Food Dehydration
Pw0 saturation vapor of water (kPa)
Qs heat of sorption (kJ/kg)
R universal gas constant (J/K mol)
RH relative humidity
T temperature (°C)
Tg glass-transition temperature (°C)
X water content on dry basis (g water/g dry mass)
Xm water content of monomolecular layer (g water/g dry mass)
Xw water content on wet basis (g water/g wet mass)
Xf free moisture content (g water/g dry mass)
Xe equilibrium moisture content (g water/g dry mass)
V volume (m3)
V0 initial volume (m3)
Vt apparent volume (m3)
Y absolute humidity (kg water/kg dry air)
Ys saturation absolute humidity (kg water/kg dry air)
GREEK LETTERS
b� volume shrinkage coeffi cient
rb bulk density (g/cm3)
rp particle density (g/cm3)
e porosity
REFERENCES
Araya-Farias, M., Macaigne, O., and Ratti, C., Osmotic dehydration of seabuckthorn (Hippophaë rhamnoides L.) fruits, paper presented at the International Seabuckthorn Association
Conference (ISA2007), Québec City, Québec, Canada, August 12–16, 2007.
ASHRAE, ASHRAE Handbook of Fundamentals, American Society of Heating, Refrigerating
and Air-Conditioning Engineers, Inc., Atlanta, 1985.
Audu, T.O.K., Loncin, M., and Weisser, H., Sorption isotherms of sugars, Lebensm.-Wiss. Technol., 11, 31–34, 1978.
Barbosa-Canovas, G. and Vega-Marcado, H., Eds., Fundamentals of air–water mixtures and
ideal dryers, in Dehydration of Foods, Chapman & Hall, New York, 1996, pp. 9–27.
Beuchat, L.R., Infl uence of water activity on growth, metabolic activities and survival of
yeast and molds, J. Food Protect., 46, 135–141, 1983.
Bimbenet, J.J. and Lebert, A., Food drying and quality interactions, in Drying ’92,
Mujumdar, A.S., Ed., Elsevier Science, Amsterdam, 1992, pp. 42–57.
Boukouvalas, Ch.J., Krokida, M.K., Maroulis, Z.B., and Marinos-Kouris, D., Density and
porosity: Literature data compilation for foodstuffs, Int. J. Food Prop., 9, 715–746, 2006.
Brunauer, S., Emmett, H.P., and Teller, E., Adsorption of gases in multi-molecular layers,
J. Am. Chem. Soc., 60, 309–319, 1938.
Cassini, A.S., Marcsak, L.D.F., and Norena, C.P.Z., Water adsorption isotherms of texturized
soy protein, J. Food Eng., 77, 194–199, 2006.
Chirife, J. and Buera, M.P., Water activity, glass transition and microbial stability in concen-
trated semi-moist food systems, J. Food Sci., 59, 921–927, 1994.
Cuevas, R. and Cheyran, M., Thermal conductivity of liquid foods: A review, J. Food Process Eng., 2, 238–306, 1978.
52527_C001.indd 3252527_C001.indd 32 10/16/2008 4:19:54 PM10/16/2008 4:19:54 PM
© 2009 by Taylor & Francis Group, LLC

Dehydration of Foods: General Concepts 33
Fennema, O.R., Food Chemistry, Marcel Dekker, New York, 1985.
Gabas, A.L., Marra-Junior, W.D., Telis-Romero, J., and Telis V.R.N., Changes of density,
thermal conductivity, thermal diffusivity and specifi c heat of plums during drying,
Int. J. Food Prop., 8, 233–242, 2005.
Garcia-Viguera, C., Zarilla, P., Artes, F., Romer, F., Abelan, P., and Barberan, T., Colour and
anthocyanin stability of red raspberry jam, J. Food Sci. Agric., 78, 565–573, 1998.
Hawlader, M.N.A., Perera, C.O., Tian, M., and Yeo, K.L., Drying of guava and papaya: Impact
of drying methods, Dry. Technol., 24, 77–87, 2006.
Iglesias, H.A. and Chrife, J., Handbook of Food Isotherms, Academic Press, New York, 1982.
Iglesias, H.A., Chirife, J., and Ferro-Fortan, C., Temperature dependence of water sorption
isotherms of some foods, J. Food Sci., 51, 551–553, 1986.
Iglesias, H.A., Chirife, J., and Ferro-Fortan, C., On the temperature dependence of isosteric
heats of water sorption in dehydrated foods, J. Food Sci., 54, 1620–1631, 1989.
Jankovié, M., Physical properties of convectively dried and freeze-dried berrylike fruits,
Facul. Agric., 38, 129–135, 1993.
Kapsalis, J.G., Infl uence of hysteresis and temperature on moisture sorption isotherms, in
Water Activity Theory and Applications to Food, Rockland, L.B. and Beuchat, L.R.,
Eds., Marcel Dekker, New York, 1987, pp. 173–207.
Karel, M., Recent research and development in the fi eld of low moisture and intermediate-
moisture foods, Crit. Rev. Food Technol., 3, 329–373, 1973.
Karel, M., Physical structure and quality of dehydrated foods, in Drying ’91, Mujumdar, A.S.
and Filkova, I., Eds., Elsevier Science, Amsterdam, 1991, pp. 26–35.
Karel, M. and Lund, D.B., Dehydration, in Physical Principles of Food Preservation, 2nd ed.,
Marcel Dekker, New York, 2003a, pp. 378–460.
Karel, M. and Lund, D.B., Water activity, in Physical Principles of Food Preservation,
2nd ed., Marcel Dekker, New York, 2003b, pp. 117–169.
Karmas, R., Buera, M.P., and Karel, M., Effect of glass transition on rates of nonenzymatic
browning in food systems, J. Agric. Food Chem., 40, 873–879, 1992.
Khallouffi , S., Giasson, J., and Ratti, C., Water activity of freeze-dried berries and mushrooms,
Can. Agric. Eng., 41, 51–56, 2000.
Kim, S.S. and Bhowmik, S.R., Thermophysical properties of plain yogurt as functions of
moisture content, J. Food Eng., 32, 109–124, 1997.
Kiranoudis, C.T., Maroulis, E., Tsami, E., and Marinos-Kouris, D., Equilibrium moisture
content and heat of desorption of some vegetables, J. Food Eng., 20, 55–74, 1993.
Krokida, M.K. and Maroulis, Z.B., Effect of drying method and shrinkage and porosity,
Dry. Technol., 15, 2441–2458, 1997.
Krokida, M.K. and Maurolis, Z.B., The effect of drying method on viscoelastic behaviour
of dehydrated fruits and vegetables, Int. J. Food Sci. Technol., 35, 391–400, 2000.
Krokida, M.K., Panagoutou, N.M., Maroulis, Z.B., and Saravacos, G.D., Thermal conduc-
tivity: Literature data compilation for foodstuffs, Int. J. Food Prop., 4, 111–137, 2001.
Krokida, M.K. and Philippopoulos, C., Rehydration of dehydrated foods, Dry. Technol., 23,
799–830, 2005.
Krokida, M.K., Tsami, E., and Maroulis, Z.B., Kinetics on color changes during drying of
some fruits and vegetables, Dry. Technol., 16, 667–685, 1998.
Kudra, T. and Mujumdar, A.S., Advanced Drying Technologies, Marcel Dekker, New York,
2002.
Labuza, T.P., The effect of water activity on reaction kinetics of food deterioration, Food Technol., 34, 36–41, 1980.
Labuza, T.P., Kanane, A., and Chen, J.Y., Effect of temperature on the moisture sorption isotherms
and water activity shift of two dehydrated foods, J. Food Sci., 50, 358–391, 1985.
Lang, W. and Sokahansanj, S., Bulk volume shrinkage during drying of wheat and canola,
J. Food Process Eng., 16, 305–314, 1993.
52527_C001.indd 3352527_C001.indd 33 10/16/2008 4:19:54 PM10/16/2008 4:19:54 PM
© 2009 by Taylor & Francis Group, LLC

34 Advances in Food Dehydration
Lewicki, P.P., Design of hot air drying for better foods, Trends Food Sci. Technol., 17, 153–163,
2006.
Lim, L.T., Tang, J., and Jianshan, H., Moisture sorption characteristics of freeze-dried
blueberries, J. Food Sci., 60, 810–814, 1995.
Lozano, J.E., Rotstein, E., and Urbicain, M.J., Thermal conductivity of apples as a function
of moisture content, J. Food Sci., 44, 198–199, 1979.
Lozano, J.E., Rotstein, E., and Urbicain, M.J., Total porosity and open-pore porosity in the
drying of fruits, J. Food Sci., 45, 1403–1407, 1980.
Lozano, J.E., Rotstein, E., and Urbicain, M.J., Shrinkage, porosity and bulk density of
foodstuffs at changing moisture contents, J. Food Sci., 48, 1497–1553, 1983.
Madamba, P.S., Driscoll, R.H., and Buckle, K.A., Models for the specifi c heat and thermal
conductivity of garlic, Dry. Technol., 13, 295–317, 1995.
Maroulis, Z.B., Krokida, M.K., and Rahman, M.S., A structural generic model to predict
the effective thermal conductivity of fruits and vegetables during drying, J. Food Eng., 52, 47–52, 2002.
Marousis, S.N. and Saravacos, G.D., Density and porosity in drying starch materials, J. Food Sci., 55, 1367–1372, 1990.
Mattar, H.L., Minim, L.A., Coimbra, J.S.R., Minim, V.P.R., Sraiva, S.H., and Telis-Romero, J.,
Modeling thermal conductivity, specifi c heat, and density of milk: A neural network
approach, Int. J. Food Prop., 7, 531–539, 2004.
Mattea, M., Urbicain, M.J., and Rotstein, E., Effective thermal conductivity of cellular tissues
during drying: Prediction by a computer assisted model, J. Food Sci., 54, 194–197,
1989.
Mayor, L. and Sereno, A.M., Modelling shrinkage during convective drying of food materials:
A review, J. Food Eng., 61, 373–386, 2004.
McMinn, W.A.M. and Magee, T.R.A., Physical characteristics of dehydrated potatoes—
Part I, J. Food Eng., 33, 37–48, 1997a.
McMinn, W.A.M. and Magee, T.R.A., Physical characteristics of dehydrated potatoes—
Part II, J. Food Eng., 33, 49–55, 1997b.
Moraga, G., Martinez-Navarrete, N., and Chiralt, A., Water sorption isotherms and phase
transitions in strawberries: Infl uence of pretreatment, J. Food Eng., 62, 315–321, 2004.
Moraga, G., Martinez-Navarrete, N., and Chiralt, A., Water sorption isotherms and phase
transitions in kiwifruit, J. Food Eng., 72, 147–156, 2006.
Mujumdar, A.S., Drying fundamentals, in Industrial Drying of Foods, Baker, C.G.J., Ed.,
Blackie Academic and Professional, London, 1997, pp. 7–30.
Mujumdar, A.S. and Menon, A.S., Drying of solids: Principles, classifi cation, and selection of
dryers, in Handbook of Industrial Drying, 2nd ed., Vol. 1, Mujumdar, A.S., Ed., Marcel
Dekker, New York, 1995, pp. 1–39.
Niesteruk, R., Changes of thermal properties of fruits and vegetables during drying, Dry. Technol., 14, 415–422, 1996.
Perera, C., Selected quality attributes of dried foods, Dry. Technol., 23, 717–730, 2005.
Phomkong, W., Srzednicki, G., and Driscoll, R.H., Thermophysical properties of stone fruit,
Dry. Technol., 24, 195–200, 2006.
Poonnoy, P., Tansakul, A., and Chinnan M., Artifi cial neural network modelling for temper-
ature and moisture content prediction in tomato slices under microwave-drying, Food Eng. Phys. Prop., 72, E42–E47, 2007.
Prothon, F., Ahrné, L., and Inggerd, S., Mechanism and prevention of plant tissue collapse
during dehydration: A critical review, Crit. Rev. Food Sci. Nutr., 43, 447–479, 2003.
Rahman, M.S., Chen, X.D., and Perera, C., An improved thermal conductivity prediction
model for fruits and vegetables as a function of temperature, water content and porosity,
J. Food Eng., 31, 163–170, 1997.
Rahman, S., Food Properties Handbook, CRC Press, Boca Raton, FL, 1995.
52527_C001.indd 3452527_C001.indd 34 10/16/2008 4:19:54 PM10/16/2008 4:19:54 PM
© 2009 by Taylor & Francis Group, LLC

Dehydration of Foods: General Concepts 35
Ratti, C., Shrinkage during drying of foodstuffs, J. Food Eng., 23, 91–105, 1994.
Ratti, C., Hot air and freeze-drying of high value foods: A review, J. Food Eng., 49, 311–389,
2001.
Ratti, C., Araya-Farias, M., Mendez-Lagunas, L., and Makhlouf, J., Drying of garlic (Allium sativum) and its effect on allicin retention, Dry. Technol., 25, 349–356, 2007.
Ratti, C., Crapiste, G.H., and Rotstein, E., PSYCHR: A computer program to calculate
psychrometric properties, Dry. Technol., 7, 575–580, 1989.
Ratti, C. and Mujumdar, A.S., Infrared drying, in Handbook of Industrial Drying, 2nd ed.,
Vol. 1, Mujumdar, A.S., Ed., Marcel Dekker, New York, 1995, pp. 567–589.
Ratti, C. and Mujumdar A.S., Drying of fruits, in Processing Fruits, 2nd ed., Barret, D.M.,
Somogyi, L., and Ramaswamy, H., Eds. CRC Press, Boca Raton, FL, 2005, pp. 127–159.
Rizvi, S.S.H., Thermodynamic properties of foods in dehydration, in Engineering Properties of Foods, 3rd ed., Rao, M.A., Rizvi, S.S.H., and Datta, A.K., Eds., CRC Press, Boca
Raton, FL, 2005, pp. 239–325.
Roos, Y. and Himberg, M., Nonenzymatic browning behaviour as related to glass transition
of a food model at chilling temperatures, J. Food Agric. Food Chem., 42, 893–898,
1994.
Roos, Y. and Karel, M., Applying state diagrams to food processing and development, Food Technol., 45, 66–70, 107, 1991.
Sablani, S.S., Drying of fruits and vegetables, retention of nutritional/functional quality, Dry. Technol., 24, 123–135, 2006.
Sablani, S.S. and Rahman, M.S., Using neural networks to predict thermal conductivity of
food as a function of moisture content, temperature and apparent porosity, Food Res. Int., 36, 617–623, 2003.
Salunkhe, D.K., Bolin, H., and Reddy, N.R., Storage, Processing and Nutritional Quality of Fruits and Vegetables, 2nd ed., Vol. 1, CRC Press, Boca Raton, FL, 1991.
Saravacos, G.D., Effect of drying method on the water sorption of dehydrated apple and
potato, J. Food Sci., 3, 81–84, 1967.
Saravacos, G., Tsiourvas, A., and Tsami, E., Effect of temperature on the water adsorption
isotherms of sultana raisins, J. Food Sci, 51, 381–383, 1986.
Schenz, T.W., Glass transitions and product stability—An overview, Food Hydrocolloids, 9,
307–315, 1995.
Shishehgarha, F., Makhlouf, J., and Ratti, C., Freeze-drying characteristics of strawberries,
Dry. Technol., 20, 131–145, 2002.
Shrivastava, M. and Datta, A.K., Determination of specifi c heat and thermal conductivity of
mushrooms (Pleurotus fl orida), J. Food Eng., 11, 147–158, 1999.
Sinija, V.R. and Mishra, H.R., Moisture sorption isotherms and heat of sorption of instant
(soluble) green tea powder and green tea granules, J. Food Eng., 86, 494–500, 2008.
Sweat, V.E., Experimental values of thermal conductivity of selected fruits and vegetables,
J. Food Sci., 39, 1080–1083, 1974.
Telis-Romero, J., Telis, V.R.N., Gabas, A.L., and Yamashita, F., Thermophysical properties
of Brazilian orange juice as affected by temperature and water content, J. Food Eng., 38, 27–40, 1998.
Toledo, R.M., Dehydration, in Fundamentals of Food Process Engineering, 2nd ed.,
Van Nostrand Reinhold, New York, 1991, pp. 456–505.
Treybal, R.E., Mass Transfer Operations, McGraw-Hill, New York, 1980.
Tsami, E., Krokida, M.K., and Drouzas, A.E., Effect of drying method on the sorption charac-
teristics model fruit powders, J. Food Eng., 38, 381–392, 1999.
Tsami, E., Marinos-Kouris, D., and Maroulis, Z.B., Water sorption isotherms of raisins,
currants, fi gs, prunes and apricots, J. Food Sci., 55, 1594–1625, 1990.
Vagenas G.K. and Marinos-Kouris, D., Thermal properties of raisins, J. Food Eng., 11,
147–158, 1990.
52527_C001.indd 3552527_C001.indd 35 10/16/2008 4:19:54 PM10/16/2008 4:19:54 PM
© 2009 by Taylor & Francis Group, LLC

36 Advances in Food Dehydration
Van Arsdel, W. and Copley, M., Food Dehydration, Vol. 1, AVI Publishing, Westport, CT,
1963.
Van der Berg, C., Water activity, in Concentration and Drying Foods, MacCarthy, D., Ed.,
Elsevier, London, 1986, pp. 11–36.
Vasquez, G., Chenlo, F., Moreira, L., and Carballo, L., Desorption isotherms of muscatel and
aledo grapes and the infl uences of pre treatments on muscatel isotherms, J. Food Eng., 39, 409–414, 1999.
Vega-Mercado, H., Gongora-Nieto, M.M., and Barbosa-Canovas, G., Advances in dehydration
of foods, J. Food Eng., 49, 271–289, 2001.
Welti-Chanes, J., Mujica-Paz, H., Valdez-Fragoso, A., and Leon-Cruz, R., Fundamentals
of mass transport, in Transport Phenomena in Food Processing, Welti-Chanes, J.,
Velez-Ruiz, J.F., and Barbosa-Canovas, G., Eds., CRC Press, Boca Raton, FL, 2003,
pp. 3–22.
Wlodarczyk-Stasiak, M. and Jamroz, J., Analysis of sorption properties of starch–protein
extrudates with the use of water vapour, J. Food Eng., 85, 580–589, 2008.
Wolf, W., Spies, W.E.L., and Jung, G., Sorption Isotherms and Water Activity of Food Materials, Elsevier, New York, 1985.
Yan, Z., Sousa-Gallagher, M.J., and Oliveira, F.A.R., Sorption isotherms and moisture
sorption hysteresis of the intermediate moisture content banana, J. Food Eng., 86,
342–348, 2008.
52527_C001.indd 3652527_C001.indd 36 10/16/2008 4:19:54 PM10/16/2008 4:19:54 PM
© 2009 by Taylor & Francis Group, LLC

37
2 Glass-Transition Based Approach in Drying of Foods
Bhesh Bhandari and Benu Adhikari
CONTENTS
2.1 Introduction ............................................................................................... 38
2.2 Glass Transition: Theory, Measurements, and Correlations ..................... 38
2.2.1 Glass Formation ............................................................................. 39
2.2.2 Prediction of Glass-Transition Temperature of Food
Model Mixtures ............................................................................. 39
2.2.2.1 Gordon–Taylor (GT) Equation ......................................... 40
2.2.2.2 Couchman–Karasz Equation ............................................ 40
2.2.2.3 Couchman–Karasz Equation for
Ternary Systems ............................................................... 41
2.2.2.4 Truong et al.’s Analytical Equation .................................. 42
2.2.3 Application of Glass-Transition Temperature ................................ 42
2.3 Spray Drying ............................................................................................. 43
2.3.1 Problems Associated with Spray Drying of Sugar- and
Acid-Rich Foods ............................................................................ 45
2.3.1.1 Approaches to Remedy the Sticky Problem ..................... 45
2.4 Freeze-Drying and Structural Collapse .................................................... 51
2.5 Hot-Air Drying .......................................................................................... 51
2.6 Instantization ............................................................................................. 53
2.7 Other Glass-Transition Related Phenomena of
Dehydrated Foods ..................................................................................... 54
2.7.1 Caking ............................................................................................ 54
2.7.2 Diffusion and Reactions in a Dried Glassy Matrix ....................... 56
2.7.3 Crispness and Plasticity ................................................................. 57
Nomenclature ....................................................................................................... 58
Variables ................................................................................................... 58
Greek Letters ............................................................................................ 58
References ............................................................................................................ 58
52527_C002.indd 3752527_C002.indd 37 10/3/2008 3:36:51 PM10/3/2008 3:36:51 PM
© 2009 by Taylor & Francis Group, LLC

38 Advances in Food Dehydration
2.1 INTRODUCTION
Drying is one of the major operations in food processing. There are several drying
techniques, the most common being hot-air (fi xed and fl uidized bed), freeze-, and
spray drying. In most drying conditions, a signifi cant proportion of the dried product
remains in an amorphous state. In some slow drying processes such as tray and fl uid-
ized bed drying, the high molecular weight carbohydrates and proteins normally
remain amorphous but other low molecular weight sugars or organic acids may be
partially crystallized. This crystallization can be intentional or undesirable. In the
low temperature process (freeze-drying), almost all of the ingredients become
amorphous because of the rapid cooling or prefreezing. Subsequent sublimation is
followed by low temperature drying. The majority of spray-dried products are
amorphous because this process is rapid enough to hinder the relatively slower
crystallization process. In some cases pre- or postspray-drying crystallization of
sugars is also practiced. In all drying processes, the degree of amorphous fractions in
the powder is infl uenced by the processing conditions, compositions, and properties
of the individual ingredients.
There are many product quality attributes that are related to the physical state
(amorphous or crystalline) of the ingredients in dried products. Minor components,
such as fl avors, vitamins, enzymes, and microorganisms, in dried products are
encapsulated within the amorphous matrix. These products become unstable or lose
their quality in a certain environment defi ned by temperature and moisture content.
Any change in the physical state of the matrix or encapsulated compounds has the
propensity to affect their physicochemical characteristics. If stored above a certain
temperature, the amorphous part may undergo sudden structural changes. This is a
critical value, known as the glass-transition temperature (Tg), when a glassy solid
structure begins to change to a “rubbery” state. This state change is responsible for
the alteration of the physicochemical properties of the products, which is attributable
to a sudden change in the molecular mobility of the system.
The phenomenon of glass transition and its indicator (Tg) is important for formu-
lation, production, and quality control of products in all drying processes. It is more
important in drying operations, such as spray and freeze-drying. The Tg is intimately
associated with stickiness during spray drying and structural collapse during freeze-
drying. The glass-transition based material science approach in dehydration and dry-
ing of sugar- and acid-rich foods and the stability of powders have been extensively
illustrated by various research groups worldwide.
2.2 GLASS TRANSITION: THEORY, MEASUREMENTS, AND CORRELATIONS
Solid foods can be crystalline, amorphous (vitreous or glassy), or a mixture of the
two, depending on the process conditions. An amorphous state consists of a non-
aligned molecular structure. The crystalline state consists of a three-dimensional
ordered array of molecules in which there is periodicity and symmetry. The differ-
ences among amorphous, vitreous, and glassy materials are less well defi ned (Flink,
1983). A fully amorphous material can exist in the glassy state or in the viscous,
52527_C002.indd 3852527_C002.indd 38 10/3/2008 3:36:51 PM10/3/2008 3:36:51 PM
© 2009 by Taylor & Francis Group, LLC

Glass-Transition Based Approach in Drying of Foods 39
supercooled, liquid state (Roos, 1995). The term “glass” is used to show that the
physical characteristics of a material in its glassy state are molecularly or atomically
disordered and mechanically “brittle” and “hard” as seen in a glass in everyday life.
Therefore, glassy materials have the structure of a liquid but the property of a solid.
A glassy material may contain patches of a short-range molecular order that may not
be detectable by normal analytical procedures (Bhandari and Hartel, 2002).
2.2.1 GLASS FORMATION
A glass is described as any supercooled liquid with a viscosity greater than 1013 Pa s.
A typical viscosity–temperature curve is provided in Figure 2.1. This defi nition
accords well with the familiar meaning of the term glass, because a liquid of this
viscosity is capable of supporting its own weight (Allen, 1993; White and Cakebread,
1966). The glass is thermodynamically metastable and tends to convert to the
crystalline form if the molecules attain adequate mobility. An essential prerequisite
for glass formation from a solution is that the cooling rate or the removal of the
dispersed phase (such as water) should be suffi ciently fast to preclude nucleation and
crystal growth (Hemminga et al., 1993).
2.2.2 PREDICTION OF GLASS-TRANSITION TEMPERATURE OF FOOD MODEL MIXTURES
One of the important areas of immediate interest is how to predict the Tg of a mixture
(or a complex food system) from the known Tg values of its components. The mixtures
can be pure compound and water or a mixture of solid compounds and water. Some
equations that have been used widely in foods will be briefl y described.
FIGURE 2.1 Viscosity–temperature curve for a typical material. The viscosity is on the
order of 1013 to 1014 Pa s of a glass and the transition from solid to liquid is not sharp. The
intersection between the extrapolated glass and liquid lines is normally taken as the glass-
transition temperature.
13
Log
m
T (K)
Tg
Solid/glass
Liquid
Transition
52527_C002.indd 3952527_C002.indd 39 10/3/2008 3:36:51 PM10/3/2008 3:36:51 PM
© 2009 by Taylor & Francis Group, LLC

40 Advances in Food Dehydration
2.2.2.1 Gordon–Taylor (GT) Equation
The GT equation (Gordon and Taylor, 1952) was originally developed for polymer
blends. It was based on expansion coeffi cients (g � dV/dT) and the assumption of
volume additivity:
1 1 g1 2 2 g2
g
1 1 2 2
x T x TT
x x
g gg g
D DD D
��
�
(2.1)
where Dgi (i � 1 or 2) is the difference between the expansion coeffi cients of liquid
and glass of component i. The GT equation has been rewritten in the following form
(Jouppila and Roos, 1994):
1 g1 2 g2
g
1 2
x T Kx TT
x Kx
��
�
(2.2)
For an anhydrous system, subscript 1 is component 1 and subscript 2 is
component 2 (the one with a lower Tg). For an aqueous system, subscript 1 is solid
component 1 (or a dry mixture of various solid components), subscript 2 is water,
and x is either the mass or mole fraction. The empirical constant K can be obtained
by a least squares method, as shown in Eq. (2.3):
2
1 g1 2 g2
gm
1 21
0
ni i
ii ii
x T Kx TdT
dK x Kx
Ê ˆÁ ˜Ë ¯Â
�
�� �
�
(2.3)
where n is the number of data points; Tgmi is the measured Tg of model mixture i; and x1i and x2i are the fractions of components 1 and 2, respectively, of model
mixture i.The GT equation has been applied to polymer blends such as sucrose–maltodextrin
(Roos and Karel, 1991a), glucose–fructose (Arvanitoyannis et al., 1993), corn syrup
solids or maltodextrins (Gabarra and Hartel, 1998), sucrose–poly(vinylpyrrolidone)
(Shamblin et al., 1998); and to solute–diluent systems such as sucrose–water and
fructose–water (Roos, 1993; Roos and Karel, 1991a, 1991b).
2.2.2.2 Couchman–Karasz Equation
Couchman (1978) and Couchman and Karasz (1978) derived the relation between the
glass-transition temperature and composition in a compatible binary mixture using
classical thermodynamic theory. Below is a brief introduction to their derivation
based on the entropy of the systems. They started by expressing the mixed system
entropy S as a function of component entropy Si (i � 1 and 2):
S � x1S1 � x2S2 � �Sm (2.4)
52527_C002.indd 4052527_C002.indd 40 10/3/2008 3:36:51 PM10/3/2008 3:36:51 PM
© 2009 by Taylor & Francis Group, LLC

Glass-Transition Based Approach in Drying of Foods 41
where the entropy of component i at a given temperature T is the summation of the
entropy at the glass-transition temperature (Sio) and the entropy difference, Si �
Sio � (Si – Si
o) � Sio � �Si. It is known that
Q � mCp dT ___ dt
, Cpi � dQ
___ dt
� dSi ( T ___ dT
)
Therefore,
g g g
ln
i i i
T T Tpi
i i pi
T T T
CS dS dT C d T
TD Ú Ú Ú� � �
(2.5)
At the Tg of the mixture, T � Tg, so the entropy S for the glassy state is identical to
that for the liquid state. Thus, by subtraction of the entropy between the liquid and
glassy states of the form in Eq. (2.4), the following equation was obtained:
g g
g1 g 2
1 L1 G1 2 L2 G2 L G( ) ln ( ) ln 0
T T
p p p p m m
T T
x C C d T x C C d T S SD DÚ Ú� � � � � �
(2.6)
Assuming that the excess entropy at the glassy state (�SmG) is not far from that of
the liquid state (�SmL), together with the temperature independence of (CpLi – CpGi)
through the Tg region, and an approximation of ln(1 � y) � y, Eq. (2.6) becomes
1 1 g1 2 2 g2
g
1 1 2 2
p p
p p
x C T x C TT
x C x C
D DD D
��
�
(2.7)
where �Cpi � (CpLi – CpGi) is the change in heat capacity of component i between its
liquidlike and glassy states, which can be measured by differential scanning calo-
rimetry. Equation (2.7) is derived for a purely conformational system. It is identical
to the GT equation when K � �Cp2/�Cp1. The Couchman–Karasz equation has been
applied successfully for some polymer blends, especially for solid–solid mixtures
because the difference between the Tgi values of the components is rather small
(Tenbrinke et al., 1983). For a solid–liquid system, this difference can be high (e.g.,
sucrose Tg � 65°C and water Tg � –135°C), so the assumption of temperature inde-
pendence of (CpLi – CpGi) is no longer valid. Tenbrinke et al. (1983) discussed the
errors of Eq. (2.7) for cross-linked polymers and explained that the interaction
between the cross-links and liquid was signifi cant.
2.2.2.3 Couchman–Karasz Equation for Ternary Systems
This equation is an expansion of Eq. (2.7), where in an aqueous system subscripts
1, 2, and 3 refer to components 1, 2, and water, respectively. For polymer blends
of three components, subscript 3 refers to the component with the lowest Tg. This
distinction is for convenience because water always has the lowest Tg among the
52527_C002.indd 4152527_C002.indd 41 10/3/2008 3:36:52 PM10/3/2008 3:36:52 PM
© 2009 by Taylor & Francis Group, LLC

42 Advances in Food Dehydration
components. The application of Eq. (2.8) to a glucose–fructose–water mixture was
carried out by Arvanitoyannis et al. (1993). Equation (2.8) can be rewritten in the
following form by division of the numerator and denominator for �Cp1:
1 1 g1 2 2 g2 3 3 g3
g
1 1 2 2 3 3
p p p
p p p
x C T x C T x C TT
x C x C x C
D D DD D D
� ��
� �
(2.8)
1 g1 2 12 g2 3 13 g3
g
1 2 12 3 13
x T x K T x K TT
x x K x K
� ��
� �
(2.9)
Constants K12 and K13 can be estimated using the Simha–Boyer rule (Simha and
Boyer 1962), where r is the density of each component:
K12 � r1Tg1/r2Tg2 and K13 � r1Tg1/r3Tg3 (2.10)
Equation (2.9) is also considered to be a GT equation for ternary components.
When K12 � K13 � 1, Eq. (2.9) becomes a linear equation. Application of Eq. (2.9)
using constants K12 and K13 in Eq. (2.10) was carried out by Cantor (2000) for ternary
hydrocarbon blends. The equation was found to work well for this system.
2.2.2.4 Truong et al.’s Analytical Equation
Truong et al. (2002) developed an analytical equation to determine the mixture Tg of
a ternary system containing two sugars and one water. This equation was developed
by assuming that all of the binary mixtures of the components follow the GT equa-
tion and that the third-order interaction between the components can be neglected.
The fi nal form of the equation for prediction of the Tg for a ternary mixture is
described in Eq. (2.11):
3 g2 23 3 g3 3 g1 13 3 g312 2 1g123
12 2 1 3 23 3 12 2 1 3 13 3
(1 ) (1 )
1 1
x T K x T x T K x TK x xT
K x x x K x K x x x K x
- � � �� �
� � � � � �
(2.11)
where x1, x2, and x3 are the mass fractions of components 1, 2, and 3, respectively;
and K12, K13, and K23 are the K values in the GT equation for binary mixtures of
components 1–2, 1–3, and 2–3, respectively. A least squares method is used to deter-
mine these constants separately from data of binary mixtures. The interaction factors
in this equation are incorporated through the binary mixtures. The quantity (1 – x3)
in Eq. (2.11) is the total fraction of component 1 and 2 in the mixture.
2.2.3 APPLICATION OF GLASS-TRANSITION TEMPERATURE
The understanding of the Tg of wet and dried products is essential to predict and
optimize the conditions for drying and subsequent storage (Bhandari and Howes,
1999; Roos and Karel, 1991a). Because of very limited molecular mobility, a food
product in the glassy state is presumed not to deteriorate rapidly during storage.
52527_C002.indd 4252527_C002.indd 42 10/3/2008 3:36:52 PM10/3/2008 3:36:52 PM
© 2009 by Taylor & Francis Group, LLC

Glass-Transition Based Approach in Drying of Foods 43
In the Tg region, there is not only a sudden change in thermal and mechanical properties
of the system but also a sudden change in the rates of translational molecular diffusion
(Franks, 1985). As the product temperature exceeds the Tg, amorphous materials
enter the rubbery state and the decreasing viscosity induces fl ow and deformation.
Many thermophysical and physicochemical properties of food products that are related
to the glass-transition temperature are summarized in Figure 2.2 (Bhandari and Howes,
1999; Levine and Slade, 1988).
2.3 SPRAY DRYING
Spray drying is a widely used dehydration technique for the transformation of feed
from a fl uid state into a dry particulate form by spraying it into a hot drying medium
(Masters, 1994a). Spraying or atomization produces 10 to 500 μm droplets. Because
the surface–volume ratio of those droplets is very large, the drying process concludes
within a few seconds. Spray dryers are mechanically simple, operationally hygienic,
and automation friendly. These units use inexpensive means to produce dry air, which
makes them less expensive and thus a better choice compared with many competing
dehydration techniques such as freeze-, vacuum-, and microwave drying (Bonazzi
et al., 1996; King et al., 1984; Ranz and Marshall, 1952). Spray drying is a well-
established and broadly used dehydration technique for producing food and
FIGURE 2.2 Physicochemical changes likely to occur during processing and/or storage at
a temperature related to the Tg of foods.
GLASS
Limitedmolecularmobility
RUBBERY
Increasedmolecular mobility
1. Cohesiveness, sticking, agglomeration, sintering, lumping, caking, and flow of amorphous powders.2. Loss of functionality of dried powders.3. Crystallization in amorphous powders.4. Structural collapse in freeze-dried products after sublimation.5. Oxidation of encapsulated lipids in freeze-dried products.6. Loss of encapsulated volatiles in freeze- dried products.7. Enzymatic activity in dried foods.8. Maillard browning reactions in dried foods.9. Stickiness in spray drying and drum drying.10. Sucrose inversion in acid-containing amorphous powders.11. Loss of crispness of dry baked goods.12. Loss of bioactivity of proteins, peptides, or enzymes.
Glasstransition
52527_C002.indd 4352527_C002.indd 43 10/3/2008 3:36:52 PM10/3/2008 3:36:52 PM
© 2009 by Taylor & Francis Group, LLC

44 Advances in Food Dehydration
pharmaceutical powders, including delicate fl avor encapsulated foods. Furthermore,
spray drying is ideally suited to heat-sensitive food materials because the product
temperature usually remains well below 100°C, the exposure time is on the order of
seconds, and the product is already in a solid state in which the reaction rate is slow.
The change in the physical state of a drying droplet during spray drying is illus-
trated in Figure 2.3 (Bhandari, Datta, and Howes, 1997). The liquid feed is atomized
into swarms of droplets. The small droplets will dry completely within a short distance
from the atomizer, the medium-sized droplets will get caught in a circulating eddy,
and the relatively large droplets with suffi cient momentum avoid being entrained
in this eddy and reach the dryer wall (Langrish and Fletcher, 2001). The rapid evapo-
ration of water and the subsequent concentration of solutes in the droplets transform
them into syrup and fi nally to glassy particulates (Bhandari and Howes, 1999). If the
evaporation process is suffi ciently rapid so that the particle surface is glassy before
reaching the wall and the bottom of the dryer, the sticky problem can be avoided.
However, the particles containing a higher amount of low molecular weight sugars
and organic acids remain thermoplastic (because of their low Tg) even if they are
suffi ciently dry and have suffi ciently low moisture content. This is the reason why the
particulates containing high sugar and organic acid remain as soft and sticky particles
even at the end of the drying process (Bhandari et al., 1993).
FIGURE 2.3 Schematic presentation of physical changes on the drop surface during spray
drying. Dehydration I, II, and III represent three arbitrary drying stages along the drying
history; Tsurface is the surface temperature of a drying droplet or particle. The particle is in a
completely glassy form when it is fully dried.
Stage 1Atomization
Stage 4Productrecovery andair cleaning
Stage 3
evaporation
Dryingchamber
Stage 2Spray–aircontact
Scrubber
Cyclone
Product
Air
Feed
Plastic sticky surfaceTsurface >> Tg
Viscosity < 108 Pa s
Liquid feed
Atomization
Liquid surface
Dehydration I –Upper part of dryer
Plastic surface
Dehydration II –Middle part of dryer
Dehydration III –Lower part of dryer
Nonsticky surfaceTsurface < Tg + 30°CViscosity > 108 Pa s
Amorphous powder
(b) Particle surface behaviors(a) Drying stages
52527_C002.indd 4452527_C002.indd 44 10/3/2008 3:36:52 PM10/3/2008 3:36:52 PM
© 2009 by Taylor & Francis Group, LLC

Glass-Transition Based Approach in Drying of Foods 45
2.3.1 PROBLEMS ASSOCIATED WITH SPRAY DRYING OF SUGAR- AND ACID-RICH FOODS
The foods to be spray dried can be subjectively classifi ed into two broad groups:
nonsticky and sticky. In general, nonsticky materials can be dried using a simple drier
design and the fi nal products remain free fl owing. Materials such as skim milk, malto-
dextrins, gums, and proteins belong to this group. The glass-transition temperature of
these materials is high, and the particles are in a solid state at the lower part of the
spray dryer. Sticky materials are diffi cult to dry under normal spray-drying condi-
tions (Bhandari, Datta, and Howes, 1997). Natural sugar-rich and acid-rich foods such
as fruit juices, vegetable extracts, and honey belong to this group. The sticky behavior
of sugar-rich and acid-rich materials is attributed to low molecular weight sugars such
as fructose, glucose, and sucrose and organic acids such as citric, malic, and tartaric
acid, which constitute up to 90% of the solids (Dolinsky et al., 2000). During spray
drying, they form lumps or syrup and resist converting into powder. They stick to the
dryer wall or roof when the trajectory and recirculation allows them to reach it. Even
if they do not collide at the dryer chamber, they ultimately come in contact with each
other at the bottom of the dryer at the cyclone and conveying ducts and form unwanted
agglomerates. Their high hygroscopicity causes them to covert to a plastic mass that
is manifested as stickiness, even when the outlet temperature of the air is maintained
as low as 50°C. The resultant wall deposits cause lower product yields, operational
problems such as frequent plant shutdowns and cleanings, product handling diffi cul-
ties, and fi re hazards (Papadakis and Bahu, 1992).
2.3.1.1 Approaches to Remedy the Sticky Problem
Two approaches are commonly employed to overcome the sticky problem. The fi rst
approach, the process-based approach, manipulates the process parameters and
equipment designs such as introduction of cold air at the bottom of the drying
chamber (Lazar et al., 1956), control of the wall temperature (Bhandari et al.,
1993), frequent scraping or sweeping of the inner wall of the dryer chamber to
remove wall depositions (Karatas and Esin, 1990), and low temperature low
humidity dryers (Hayashi, 1989). The second approach, the material science based approach, introduces high molecular weight additives (carriers) such as maltodextrin
into the solution (Bhandari, Datta, Cooks, et al., 1997; Bhandari et al., 1993; Gupta,
1978) to raise the overall Tg of the mixture. The introduction of additives may
inevitably alter the strength of the natural fl avor, color, and taste of the resulting
powders. This may affect consumer acceptance of the fi nal product, particularly
if added in large amounts.
There are various fundamental issues that require attention to be able to
understand and make use of the materials science based method to overcome the
stickiness. First, the phenomenon that causes stickiness has to be identifi ed and
interpreted. Second, an objectively measured indicator has to be found that can be
used to optimize the drying process and amount of additives. In this aspect materials
science provides us with the fundamentals of the glass transition and its indicator,
the Tg. The glass transition is basic to all sugar- and acid-rich foods and the Tg can be
measured objectively. The glass transition and Tg can be used not only to overcome
52527_C002.indd 4552527_C002.indd 45 10/3/2008 3:36:52 PM10/3/2008 3:36:52 PM
© 2009 by Taylor & Francis Group, LLC

46 Advances in Food Dehydration
the stickiness problem but also to design and produce composite powders from sugar-
and acid-rich materials that are stable at the given handling and storage conditions.
2.3.1.1.1 Process-Based Approach to Remedy Stickiness2.3.1.1.1.1 Low Temperature and Humidity of Drying Air (Birs Dryer)In an attempt to dry the product at low temperature (30°C) and humidity (3% RH) to
avoid stickiness, a mammoth 15 × 60 m (diameter × height) drying tower was devel-
oped (Hayashi, 1989; Mizrahi et al., 1967). The principle was based on drying below
the stickiness temperature condition of the dried product. In this method, even if the
drying was successful, the powders that were obtained were still sticky (Mizrahi
et al., 1967). This is not an economically feasible system.
2.3.1.1.1.2 Cooling of the Dryer Chamber WallAs early as 1968, a cool wall spray dryer was used by Robe et al. (1968) to produce
tomato juice powder. Air was drawn through a hollow jacket surrounding the drying
chamber, maintaining a wall temperature of between 38 and 50°C. This range of
temperatures was well below the sticky point temperature (60°C) of tomatoes at 2%
moisture content as measured by Lazar et al. (1956). Brennan et al. (1971) conducted
experiments with orange juice by cooling the dryer wall. Similarly, Bhandari et al.
(1993) used a LEAFLASH spray dryer with a temperature controlled chamber wall.
Both of these studies found some improvement in the product yield (reduced
stickiness) compared to conventional drying methods. However, this method did not
improve the performance of the dryers to the required level because the cold chamber
wall cools the surrounding air while simultaneously producing localized high relative
humidity regions close to the wall. This increases the surface moisture content of the
powders (Bhandari, Datta, and Howes, 1997). This type of dryer in association with
a fl uidized bed at the bottom is used commercially for drying of tomato juice
(Masters, 1994b). The actual success of such a drier is still questionable.
2.3.1.1.1.3 Introduction of Cooling Air to the Bottom Dryer ChamberLazar et al. (1956) conducted experiments in which cooling air was introduced to the
lower part of the dryer chamber to cool the powder. This technique can result in decreases
in particle temperature and stickiness. The recovery was still low at 60 to 65%.
2.3.1.1.1.4 Secondary Air near the WallTo avoid deposition of the powder on the dryer walls, secondary air was inserted
near the walls through wall slots to maintain motion in the particles and prevent
powder settling onto the walls (Masters, 1994b). In this technique, the droplets are
retained in the central part of the chamber until moisture evaporation has been
completed. This method is useful for hygiene requirements. However, stickiness can
occur at the bottom part of the dryer if the surrounding air temperature is higher than
the sticky point temperature of the particles.
2.3.1.1.1.5 Using a Ceiling Air DisperserFor a concurrent spray dryer with a rotary atomizer, a ceiling air disperser with
rotation air can be used to eliminate the area of semiwet deposits on the top and side
walls (Masters, 1994a). However, the stickiness of the powder deposited on the
bottom walls remains unresolved. This is more of a localized problem as a result of
nonuniform airfl ow or droplet trajectory.
52527_C002.indd 4652527_C002.indd 46 10/3/2008 3:36:52 PM10/3/2008 3:36:52 PM
© 2009 by Taylor & Francis Group, LLC

Glass-Transition Based Approach in Drying of Foods 47
2.3.1.1.1.6 Partial Crystallization of SugarThis method is normally applied for relatively pure components such as lactose,
sucrose, or whey. A partially crystallized sugar solution is produced before spray
drying (Hansen and Rasmussen, 1977; Rheinlander, 1982). The particles may deposit
initially on the dryer walls, but the layers can loosen from the walls because of partial
crystallization within the particles. This method produces a nonhygroscopic powder
in semicrystalline form but does not solve the stickiness problem for the amorphous
fraction in the powder. This method to dry problematic fruit juices has not been
reported (Bhandari, Datta, Cooks, et al., 1997), which is probably attributable to the
inability to crystallize the main sugars (glucose or fructose) of fruit juices.
2.3.1.1.1.7 Recirculation of FinesRecirculation of fi ne particles recovered from the cyclone into the atomization zone
can cause agglomeration and produce a less sticky product (Bhandari, Datta, and
Howes, 1997). A selected amount of dried particles can be recycled to the feed inlet to
mix with the cloud of atomized product, and these particles may consist of recycled
material (Woodruff et al., 1971). In the case of sucrose, the fi nal products contain
about 45 to 85% crystalline material (Woodruff et al., 1971). This high crystallinity
also assists in minimizing stickiness. The particle size range is high (75 to 1000 μm),
which is due to agglomeration. The use of this method requires a high recycled portion
and a large volume of air in order to attain good contact between the recycled particles
and atomized droplets. Therefore, it is not economical (Hansen and Rasmussen, 1977).
There is no extension of this method to drying of fruit juices (Masters, 1994a).
2.3.1.1.1.8 Three-Stage Drying TechniqueA three-stage drying system with an integrated belt (Filtermat) is reported to be the
most suitable technique for fruit juices (Masters, 1994a; Rheinlander, 1982). The
product is initially dried in a wide tower for a short time (7 to 8 s) to a moisture con-
tent of 10 to 20% (fi rst stage) and then falls to a polyester moving belt for further
drying (second stage). After drying in the fi rst and second stages, the powder is
conveyed to the third drying stage where the drying is completed by means of low
temperature drying air. The fi nal product contains bigger agglomerates that must be
passed through a sifting system to break them into the desired particle size.
2.3.1.1.2 Approaches Based on Material PropertiesThe composition of the feed in this method is altered by introducing carriers in
order to increase the Tg of the product. Consequently, the sticky point temperature of
the products is increased. Carriers are normally high molecular weight polymers
such as maltodextrins or starch (Tg � 100 to 243°C) or dried milk powder. The other
high molecular weight carriers such as carboxymethyl cellulose, gum arabic, and
pectin have also been used without success. This is because those carriers do not
contribute signifi cantly to the increase in Tg of the products, because of the limited
amount of them that can be added due to the high viscosity of the solution limiting
atomization. Thus, the Tg of the product is the main factor governing the success
of the spray-drying process. In general, the addition of maltodextrin has become a
common practice because of its neutral color and taste and relative inexpensiveness.
Many types of fruit juices have been tried such as orange, black currant, cherry,
tomato, coconut, and tamarind. The fraction of the carrier is normally in the range
52527_C002.indd 4752527_C002.indd 47 10/3/2008 3:36:52 PM10/3/2008 3:36:52 PM
© 2009 by Taylor & Francis Group, LLC

48 Advances in Food Dehydration
of 40 to 45 wt% juice solids, but up to 70 wt% juice solids have been reported
(Masters, 1994a).
Brennan et al. (1971) found that the addition of 44 wt% glucose syrup in relation
to orange juice solids increased the sticky point temperature of the product to
44°C (at a moisture content of 2% dry basis) and improved the recovery dramatically
compared to nonadditives. However, wall deposition of 10 to 60% was still encoun-
tered depending on the drying air temperature. The wall deposition was minimal
when the wall temperature was controlled below the sticky point temperature
(Brennan et al., 1971). The stickiness point temperature was still low enough to be
accepted as a practical solution in drying of food products.
2.3.1.1.2.1 Empirical Relation between Stickiness and the Drying Aids Required in Spray Drying
For a given geometry of the spray dryer, the improvement in the drying performance
when a carrier is added to the feed can be related to the Tg of the feed. Busin et al.
(1996) conducted spray-drying experiments for different sugars (sucrose, glucose,
fructose) using maltodextrin with a different dextrose equivalent (DE) as the drying
aid and found that the recovery of the powder was proportional to the Tg of the
mixture. For a 50% recovery of powder of a sucrose–maltodextrin mixture (total
powder collected in the cyclone and dryer walls), the drying aids required were 16
and 18% for DE 6 (Tg � 164°C) and DE 21 (Tg � 135.5°C), respectively. It was
interesting that the fi nal Tgmix of the powder in the two cases was the same (75.5°C).
This means that, for a recovery of 50% of the sucrose–carrier mixture, the amount
of carrier can be calculated using the GT equation if the Tg of the carrier is known.
However, for drying of glucose and fructose using the same drying aids as for
sucrose, the Tgmix values of the fi nal product were 52.5 and ~51°C, respectively. There
was a difference between the Tgmix for glucose and fructose compared to sucrose even
if the drying condition was the same (inlet and outlet air temperatures were 180 and
100°C, respectively). This may be due to the difference in drying characteristics
among sugars that results in different fi nal moisture content of the product that
affects the Tgmix values. Thus, the drying performance (recovery, stickiness) in spray
drying of sugar-rich foods is governed not only by the Tg value but also by the drying
characteristic of the feed. This drying characteristic depends on the inlet drying
conditions and the interaction between the drying air and the atomization. The
interaction, in turn, is a function of the construction of the dryer and the mode of
feed–air contact, for example, concurrent, countercurrent, or mix fl ow type.
As a simple practical solution, Bhandari et al. (1997a) developed a drying index
model to determine the drying aid required for a 50% recovery of a food model
mixture:
1
n
i i I
i
I x YÂ �5
(2.12)
where Ii and xi are the respective drying index and weight fraction of component i in
the mixture and YI is the indicator for the degree of successful drying that is equal to 1
for 50% recovery. In the drying experiment using inlet and outlet air temperatures of
52527_C002.indd 4852527_C002.indd 48 10/3/2008 3:36:52 PM10/3/2008 3:36:52 PM
© 2009 by Taylor & Francis Group, LLC

Glass-Transition Based Approach in Drying of Foods 49
150 and 65°C, respectively, the drying indices of sucrose, glucose, fructose, and
citric acid were 0.85, 0.51, 0.27, and –0.40, respectively (Bhandari, Datta, and
Howes, 1997), where I � 1.6 was arbitrarily set for the index of malto dextrin DE 6.
The model was validated for honey and pineapple juices. In addition, the drying
index was linearly related to the Tg of the mixture. This is useful for the determina-
tion of the drying aid required for 50% recovery (total powder collected in the
cyclone and dryer chamber) in spray drying for any food model.
2.3.1.1.2.2 Control Based on Tg
The Tg is recognized as a fundamental parameter to explain stickiness (Bhandari and
Howes, 1999; Roos and Karel, 1991a) in sugar- and acid-rich foods. It is a fundamental
property of amorphous materials and polymers. When a glassy material is subjected
to moisture and heat and subsequently approaches the phase transition, the viscosity
of the system decreases dramatically from 1012–14 to 106–8 Pa s. The lowered viscosity
is unable to support the glassy microstructure, giving way to stickiness of the dried
materials (Flink, 1983; Wallack and King, 1988).
The material undergoing drying can be a mixture of low or high molecular weight
solids and water. The Tg values of starches, proteins, and gums (high molecular weight
materials) are higher than those of sugars, organic acids, and polyols (low molecular
weight materials). The Tg of water is the lowest at around –135°C. Therefore, the
infl uence of water in depressing the Tg of the mixture is signifi cant especially in the
early stages of drying. The Tg of materials increases as the drying progresses because
of the removal of water. The evolution of the glass-transition temperature of a material
that is diffi cult to dry with or without the addition of additives (such as maltodextrin)
is illustrated in Figure 2.4. In this case, the addition of maltodextrin raises the overall
Tg of the mixture. This results in a nonsticky powder at the exit of the drier. Note in
Figure 2.4 that the particle temperature should be lower than the sticky temperature
(curve) of the product to achieve the powder in a nonsticky state.
Tg curve
Drying
10–20°C
10–20°C
Particle temperature
Tem
pera
ture
(°C
)
20
40
60
Moisture (%)
5 40
Sticky curve
Tg curve (with dextrin)
Sticky curve (with dextrin)
FIGURE 2.4 Illustration of the sticky point temperature versus Tg of a drying product, with
or without the addition of maltodextrin to raise the overall Tg of the mixture.
52527_C002.indd 4952527_C002.indd 49 10/3/2008 3:36:52 PM10/3/2008 3:36:52 PM
© 2009 by Taylor & Francis Group, LLC

50 Advances in Food Dehydration
The critical viscosity of stickiness is reached at temperatures 10 to 20°C above
the measured Tg value of the material, according to reports. For skim milk powders,
Hennigs et al. (2001) and Ozmen and Langrish (2002) found that the differences
between the stickiness temperature and Tg were 23.3 and 14 to 22°C, respectively.
Chuy and Labuza (1994) reported that the differential temperature was 30 to 50°C
for dairy-based infant formula powders. The stickiness curve at 10 to 20°C above the
glass-transition curve is depicted schematically in Figure 2.4. Flow dynamics within
the dryer can also infl uence the stickiness property of the drop. Particles that are
tangentially directed toward the dryer wall can impact and stick easily onto the wall
even at their glass-transition temperature. In contrast, the inertia of mobile particles
and the kinetic energy of the moving air can loosen the contact point of the particles
from the wall, which eventually results in an increase in the sticky temperature.
Overall, the dominating effects of the fi lm-forming properties of the material along
with the dynamic conditions in the drier can locally elevate the stickiness tempera-
ture above the glass-transition temperature (Bhandari and Hartel, 2005).
Adhikari et al. (2003, 2004) demonstrated experimentally that the surface
stickiness of a drying droplet depends on the Tg based on the surface composition
rather than the average or bulk composition. They showed that a maltodextrin drop
exhibited peak stickiness at a mean moisture of around 50% (wet basis) and the drop
surface became completely nonsticky at 40% (wet basis) while drying at 63°C and
2.5% relative humidity. Further, the average Tg of the drop at those moisture levels
were –95.9 and –81.1°C, respectively, and the drop surface was completely nonsticky
even when the drop temperature was about 138°C higher than the glass-transition
temperature (Adhikari et al., 2005). These fi ndings cannot be explained based on the
classical sticky point concept that states that the sticky point temperature is about 10
to 20°C higher than the glass-transition temperature. This disparity can be explained
by accepting that there is a strong moisture gradient in a drying drop, so the composi-
tion of the surface layer (and hence the Tg value) can be quite different than the Tg
value based on the average moisture content. In some cases, the migration of surface
active proteins on the surface of the powder (water–air interface) during atomization
has infl uenced the stickiness property of the drying material. Despite these facts and
the diffi culty in measuring the composition of the particle surface layer and the surface
layer Tg experimentally, the glass-transition mechanism is the most successful one to
explain and quantify the droplet and particle stickiness.
We should also remember that the occurrence of stickiness of a very viscous
material is a time-dependent phenomenon. Even if such a material cannot show
stickiness in the drier, it can manifest it during storage. The time dependency is a
consequence of the slow viscous fl ow of the material in between the particles in
contact (discussed further in Section 2.7.1).
The trajectory of the drying air and the geometry of the dryer are also important
factors. Because of the design principle of the spray dryer, many air circulation zones
exist within the dryer chamber, especially at the corners and the intersection between
the cylindrical and conical parts. These air circulation zones entrap the particles. This
leads to a longer residence time and a higher probability of particle–particle contact
and/or particle–wall contacts (Oakley and Bahu, 1991). Both of these increase the risk
of stickiness. The trajectory of air and particles can be predicted by the computational
52527_C002.indd 5052527_C002.indd 50 10/3/2008 3:36:53 PM10/3/2008 3:36:53 PM
© 2009 by Taylor & Francis Group, LLC

Glass-Transition Based Approach in Drying of Foods 51
fl uid dynamic (CFD) technique (Oakley and Bahu, 1991; Kieviet, Raaij, De Moor,
et al., 1997; Kieviet, Raaij, and Kerkhof, 1997; Straatsma et al., 1999a, 1999b). The
CFD modeling suggests that the most likely areas of wall deposition are the annular
area of the roof, corresponding to the small recirculation eddy (medium-sized droplets)
and a region below the atomizer where large particles are likely to deposit (Langrish
and Fletcher, 2001).
2.4 FREEZE-DRYING AND STRUCTURAL COLLAPSE
Freezing-drying involves the removal of frozen water by sublimation followed by the
removal of unfrozen water by vacuum drying. During freezing, depending on the
composition of the food material, 65 to 90% of the initial water is in the frozen state
and the remaining 10 to 35% of the water is in the unfrozen (sorbed) state. The rate
and amount of ice formation during freezing is dependent on the composition and
viscosity of the unfrozen fraction. If the water concentration in the product is low, all
of the water remains in the unfrozen state. Water remained unfrozen in partially
dried strawberries when the water activity of the materials was below 0.75 (Roos,
1987) and water in honey (moisture ª 16% w/w, aw ª 0.6) was unfreezable (Sopade
et al., 2003).
The stickiness temperature (Tsticky) in the context of freeze-drying is termed the
collapse temperature (Tc ). Therefore, the stickiness during spray drying is analogous
to the collapse of the drying material during freeze-drying. Understanding the
collapse of the structure of a material undergoing freeze-drying is also important for
its subsequent storage and handling. Collapse is defi ned as a time-, temperature-, and
moisture-dependent viscous fl ow that results in a loss of structure and a reduction in
sample volume (Tsourofl is et al., 1976). This is particularly evident at the later stage
of freeze-drying when the majority of the ice is sublimed and the temperature of the
drying front is higher than the critical temperature. This is because the highly porous
solid matrix of the freeze-dried material can no longer support its structure against
gravity (Bellows and King, 1973; MacKenzie, 1975).
Collapse progresses in two stages. In the fi rst stage, collapse is localized to the
concentration of collapsed pores in certain areas. In the second stage, collapse of the
entire structure takes place. The collapse temperature is normally the temperature at
which the entire structure is collapsed because of the viscous fl ow of the solid matrix.
The viscosity during the initiation of collapse ( mc) can be estimated using the
Williams–Landel–Ferry (WLF) equation. The collapse temperatures of food products
in the dry and liquid states are presented in Table 2.1. To and Flink (1978a, 1978b)
reported that the collapse of dehydrated carbohydrates and the Tg of polymers were
related phenomena. As shown in Table 2.2, the Tc is equivalent to Tg�, which is the
glass-transition temperature of maximally concentrated nonfrozen liquid in the product
undergoing drying.
2.5 HOT-AIR DRYING
There are few published reports available on the consequences of the Tg on hot-air
drying. Nevertheless, the knowledge gained in other types of drying can be logically
52527_C002.indd 5152527_C002.indd 51 10/3/2008 3:36:53 PM10/3/2008 3:36:53 PM
© 2009 by Taylor & Francis Group, LLC

52 Advances in Food Dehydration
applied in this process (Ratti, 2001). Collapse during freeze-drying is analogous to
shrinkage during hot-air drying. Because the products during hot-air drying are dried
above the Tg, shrinkage or collapse is inevitable during hot-air drying. Hot-air drying
(fi xed or fl uidized bed) is normally employed to dry solid foods. Glass-transition
related problems exist during the drying of sugar-rich products such as fruit leathers
and other products that are extremely sticky. These products appear wet even at very
low moisture content. The leathery texture of these products even at lower moisture
content is due to the plasticizing effect of low molecular weight sugars that depress
the Tg. Drying of other fruits may pose problems, particularly if there is an excessive
disruption of skins or tissues, resulting in leaching of sugars out onto the surface.
Sticky products will not fl uidize well in a fl uidized bed system. This problem
may also be encountered while dehydrating thick pasty products and cut fruit pieces.
The same problem will exist during the coating of the product. The coating material
is normally sprayed in a liquid state. If it is sprayed in an aqueous solution, the
coating should be followed by drying. If the coating material has a very low Tg, it will
cause sticking of the coated particulates during the water removal in a fl uidized bed.
The stickiness will be very serious toward the later stage of drying when the viscosity
of the coating material will increase substantially at low moisture.
TABLE 2.1Collapse Temperature (Tc) of Freeze-Dried Anhydrous Food Powders and Fruit Juices during Freeze-Drying
Materials Tc (°C)
Lactose powder 101.1
Maltose powder 96.1
Sucrose powder 55.6
Maltodextrin DE 10 powder 248.9
Maltodextrin DE 15 powder 232.2
Maltodextrin DE 20 powder 232.2
Maltodextrin DE 25 powder 204.4
Orange juice/maltose (100 : 10) powder 65.6
Xylose, 25% –49
Orange juice, 23% –24
Grapefruit juice, 16% –30.5
Lemon juice, 9% –36.5
Apple juice, 22% –41.5
Pineapple juice, 10% –41.5
Prune extract, 20% –35.0
Coffee extract, 25% –20
Sodium citrate, 10% –40
Sodium ascorbate, 10% –37
Source: Compiled data from Tsouroufl is, S. et al., J. Sci. Food Agric., 27, 509–519, 1976;
Bellows, R. and King, C.J., AIChE Symp. Ser., 69, 33–41, 1973; and Fonseca, F.
et al., Biotechnol. Prog., 20, 229–238, 2004. With permission.
52527_C002.indd 5252527_C002.indd 52 10/3/2008 3:36:53 PM10/3/2008 3:36:53 PM
© 2009 by Taylor & Francis Group, LLC

Glass-Transition Based Approach in Drying of Foods 53
The shrinking phenomenon is dependent upon the physical pliability and micro-
structure of the material that should be infl uenced by the Tg and other factors.
Karathanos et al. (1993) demonstrated that continuous shrinkage occurred in celery
during drying. This was attributed to the drying air temperature that was well above
the Tg of celery undergoing drying. In high sugar products, if the dehydration
temperature is higher than the Tg, the product can be soft during drying (Del Valle
et al., 1998; Riva et al., 2005). Upon cooling they will then harden as the product
temperature drops below the Tg. A simple relationship may not be found between the
Tg and shrinkage because of the drying temperature being normally well above
the Tg at any time, the infl uence of the tissue structure of the biological materials,
the contribution of nonsoluble materials on the structure, and the large gradient of
moisture in the drying materials. The shrinkage, however, can continue even after
drying if the dehydrated product is still in the rubbery state (which is the case in
many dried fruits and vegetables). A reduced rate of shrinkage at a later stage of drying
of many food products is certainly related to the increased viscosity of the matrix,
when the material approaches the Tg.
2.6 INSTANTIZATION
Agglomeration followed by drying is a common process in food powder industries.
Agglomerate is composed of two or more individual primary particles, which are
bonded together by submicron particles, viscous amorphous materials between the
TABLE 2.2 Glass-Transition Temperature of Maximally Concentrated Solutions (Tg′ ) and Collapse Temperature (Tc) of Aqueous Solutions
Solution (w/w) Tg′ (°C) Tc (°C)
Sucrose, 10% –32 (–32.9)a –32 (–32)b
Maltose, 10% –30 (–29.5)c –30 (–30 to –35)b
Maltodextrin DE 5–8, 10% –9 (–9.5) –7 (–10)b
Sodium glutamate, 10% – 47 – 46 (–50)b
Sodium citrate, 10% – 43 (– 41)d – 40
Sodium ascorbate, 10% – 37 –37
Sorbitol, 10% – 45 (– 46.1)a – 46 (– 45)b
Sucrose 5% � maltodextrin (DE 5–8) 5% –24 –19 (–20)b
Sucrose 5% � sorbitol 5% – 41 –38 (– 40)b
a Compiled data from Her, L.M. and Neil, S.L., Pharmaceut. Res., 11, 54–59, 1994. With permission.b Compiled data from Fonseca, F. et al., Biotechnol. Prog., 20, 229–238, 2004; and MacKenzie, A.P.,
in Freeze-Drying and Advance Food Technology, Academic Press, New York, 1975, pp. 277–307.
With permission.c Compiled data from Levine, H. and Slade, L., Cryo-Letters, 9, 21–63, 1988. With permission.d Compiled data from Chang, B.S. and Randall, C.S., Cryobiology, 29, 632–656, 1992. With
permission.
52527_C002.indd 5352527_C002.indd 53 10/3/2008 3:36:53 PM10/3/2008 3:36:53 PM
© 2009 by Taylor & Francis Group, LLC

54 Advances in Food Dehydration
particles, or a binder. Agglomerates tend to offer an instantizing property to the
powder. They disperse and dissolve quickly into solvents such as water, milk, tea,
and so forth during reconstitution. The reconstitution performance of the agglomer-
ated powder is enhanced because the open porous structure of the agglomerate
allows solvent to penetrate and disperse throughout, forcing the agglomerate to sink
faster compared to individual particles. Agglomeration of the particles also provides
a dustless, free fl owing powder that facilitates handling.
Agglomeration is achieved by applying heat, rewetting, or a combination of both.
If the dried product with relatively higher moisture content is warmed to above its glass
transition, its surface becomes viscous and can form a bridge between adjacent parti-
cles that results in an agglomeration. The viscosity should be low enough to cause
virtually instantaneous sticking of the particles. The agglomeration generally involves
sticking of the powder particles followed by drying. The viscous liquid material respon-
sible for sticking the particles is converted to a solid during drying (Figure 2.5).
Few direct studies have been published on this process in relation to Tg. However,
the glass-transition concept can provide a better understanding and optimize desired
and undesired agglomeration of amorphous powders. The glass-transition tempera-
ture and its dependence on moisture content is a material property, which allows an
estimation of the mechanical properties of food products at varying moisture and
temperature conditions. Moisture–temperature and time combinations for agglome-
ration of raw materials and its mechanism can be defi ned (Palzer, 2005). It is also
possible to predict parameters for the blockage of a fl uidized bed that is sometimes
a problem in the powder industry.
2.7 OTHER GLASS-TRANSITION RELATED PHENOMENA OF DEHYDRATED FOODS
2.7.1 CAKING
The mechanism of caking is the same as agglomeration. The caking of an amor-
phous powder is a time-dependent phenomenon. The rate of caking attributable to
FIGURE 2.5 Agglomeration and drying of particulates as related to the surface Tg.
Viscousliquid (T < Tg)
Solid bridge(T < Tg)
Formation of liquid bridge Solidification of bridge
Drying
52527_C002.indd 5452527_C002.indd 54 10/3/2008 3:36:53 PM10/3/2008 3:36:53 PM
© 2009 by Taylor & Francis Group, LLC

Glass-Transition Based Approach in Drying of Foods 55
the viscous fl ow property of the material is a function of T – Tg, and the kinetics of
caking can be determined by using a WLF type relationship (Aguilera et al., 1995):
1 g
10
g 2 g
( )log
( )
C T Tt
t C T T
Ê ˆ -Á ˜Ë ¯
��
� �
(2.13)
where t is the time of caking, tg is the time to cake at the Tg, C1 and C2 are constants
(17.44 and 51.6 K, respectively), and T is the temperature (K). The WLF relationship
is also applicable to predict the crystallization of the glass as a function of temperature.
Note that crystallization is one of the causes of caking. The WLF equation is also
used to predict the viscosity of the material above its glass-transition temperature
[by replacing t with m in the right-hand side of Eq. (2.13)].
Downton et al. (1982) studied the following well-known Frenkel mechanistic
model [Eq. (2.14)] for estimating the mc (Pa s) that causes caking:
mc � kgt ___ KD
(2.14)
where k is the dimensionless proportionality constant of order unity; t is the contact
time (s); g is the surface tension, which for an interstitial concentrate � 0.07 N/m; K
is the fraction of the particle diameter required as the bridge width for a suffi ciently
strong interparticle bond, usually 0.01 to 0.001; and D is the particle diameter (m).
It is important to note that the caking event is time dependent whereas sticking
is a relatively instantaneous phenomenon (say, t � 1 s). Longer contact times increase
the tendency toward sticking and caking, when all other things are equal. Thus, the
dried product recovered during drying with a relatively free fl owing property could
also cake in a collection or packaging container over a period of time
if the surface viscosity is still relatively low because of higher temperature or mois-
ture levels (Bhandari, Datta, and Howes, 1997). For this reason, the dried product
needs to be cooled immediately to an appropriate temperature before packaging. The
interesting consequence of this is that the viscosity (and thus temperature) require-
ments for storage are much more stringent than those for processing; however, it is
still possible to estimate critical values for both. Many powders can be a mixture of
amorphous and crystalline materials. The proportion of the crystalline fraction
(which is the noncaking structure) will infl uence the overall caking behavior of the
powder (Fitzpatrick et al., 2007).
Caking is strongly infl uenced by compression that decreases the distance between
the particulates (Lloyd et al., 1996). The fi nal shrinkage of the product under com-
paction increases when increasing T – Tg. The storage of sugar-rich dried products
like fruit pieces or whole fruits such as sultanas in a bulk bin can cause clumping and
the formation of a hard block. This may be caused by several factors. The free sugar
can leach out onto the surface because of skin damage. Storing this product at low
temperature can cause the viscosity of highly concentrated sugar syrup to increase
substantially, which results in cementing the pieces together into a solid mass. There
could also be a partial crystallization of sugars and coalescence. This phenomenon
can be more prominent when the products are packed into a big mass that reduces the
52527_C002.indd 5552527_C002.indd 55 10/3/2008 3:36:53 PM10/3/2008 3:36:53 PM
© 2009 by Taylor & Francis Group, LLC

56 Advances in Food Dehydration
interparticulate distance and can also cause further leaching of the syrup from
internal tissues at the surface. To minimize this problem, the product is normally
surface coated with oil to avoid direct contact between sticky surfaces or further
dehydration (which will elevate the Tg).
2.7.2 DIFFUSION AND REACTIONS IN A DRIED GLASSY MATRIX
The glass-transition temperature is directly related not only to the molecular mobility
of the matrix but also to water and other components entrapped in the matrix. Volatile
components in a food system have very limited mobility in a glassy matrix. Flavors
encapsulated in carbohydrate and/or protein glasses are retained on drying and sub-
sequent storage until released by the addition of water or an increase in temperature
(Karel et al., 1993; Karel and Flink, 1983; King, 1988; Shimada et al., 1991). Above
the glass-transition temperature of the matrix, diffusion of the volatiles through the
matrix primarily occurs through its pores (Levi and Karel, 1995; Whorton and
Reineccius, 1995). Volatile diffusivity is greatly increased when the temperature
exceeds the Tg and continues to increase with an increase in temperature (Roos and
Karel, 1991a). The diffusivity of oxygen and mobility of the volatile compounds in
the matrix promotes an oxidation reaction. Shimada et al. (1991) found that methyl
linoleate encapsulated in a lactose–gelatin matrix does not oxidize below the Tg of
the matrix, but it oxidizes above it with oxidation proceeding more rapidly as �T
(T – Tg) increases. Labrousse et al. (1992) studied the oxidation of lipids (encapsulated
in sugars) at different storage temperatures and times. They found that there was no
oxidation of encapsulated lipid below the Tg of the matrix. The oxidation increased
when the storage temperature exceeded the Tg of the matrix. The retention of diacetyl
in spray-dried lactose and skim milk systems was also related to �T (Senoussi et al.,
1995). Karmas et al. (1992) and Buera and Karel (1993) found an increased rate of
nonenzymic reactions in dried vegetables stored above the Tg.
In an earlier study, To and Flink (1978a,b) found that the loss of volatiles was
very high at collapse temperatures during freeze-drying or during storage of the
dried product. Gejlhansen and Flink (1977) reported that the oxygen absorption into
a freeze-dried lipid–carbohydrate system was increased signifi cantly at the collapse
temperature, which is related to the Tg.
Relating the reactions on the basis of the glass-transition temperature has become
a controversy in recent days, particularly in complex food systems. A Maillard reac-
tion occurred in dry pasta systems (Fogliano et al., 1999) below their glass-transition
temperature. The creation of small mobile molecules because of deamidation of glu-
tamine was attributed to this reaction even below the Tg. Schebor et al. (1999) also
reported a Maillard reaction below the glass-transition temperature in anhydrous
milk powder systems. In this case, the authors suspected that other types of localized
mobility such as glass relaxation, intermixing of reactants increasing the proximity
of the molecules in concentrated state, and localized mobility near the pores might
have existed because there were no other components present in the milk. However,
the milk still contained some amount of fat that would have been mobile and the
protein that can be a part of the fat globule membrane will still have some mobility
at the interface of the solid–oil. It is not clear though if such factors can infl uence
52527_C002.indd 5652527_C002.indd 56 10/3/2008 3:36:53 PM10/3/2008 3:36:53 PM
© 2009 by Taylor & Francis Group, LLC

Glass-Transition Based Approach in Drying of Foods 57
aminocarbonyl condensation. Any preexisting smaller molecules (amino compounds)
can still have translational motion within the matrix. Dissolution of some protein or
peptides in lactose cannot be ruled out as causing this effect (localized b-relaxation
can accelerate the condensation of amino and carbonyl groups). In an early study,
Kamman and Labuza (1985) also found that the Maillard reaction was accelerated
by the presence of liquid-phase oil in a powder starch mix containing glucose and
glutamate. Their assumption was that the oil may act as a solvent for the reactants.
However, they did not explain how a hydrophobic oil can solubilize these polar reac-
tants. This is an important area that needs further investigation (Bhandari, 2007).
2.7.3 CRISPNESS AND PLASTICITY
Crispness and brittleness are some of the important attributes of dried products. Dried
products are normally brittle. In normal dried products, an increased amount of low
molecular weight sugars and water reduces the Tg of the product to below ambient
temperature and the textural attributes are lost (Figure 2.6). Some semidried products
are leathery or rubbery because the requirement is to make them chewy rather than
brittle or hard. Examples are dried fruits, fruit bars, fruit leathers, and so forth. Water
acts a plasticizer in such products. Addition of low molecular weight sugars and
polyols as humectants can maintain the plastic or chewy texture of intermediate dried
product even at relatively low moisture content by lowering the Tg of the product. The
common humectants used in food are glucose, fructose, sucrose, invert sugar, and
glycerol. Loss of crispness due to lowering of the Tg of dried extruded products was
also reported (Labuza and Katz, 1981; Nikolaidis and Labuza, 1996; Roos, 1995).
FIGURE 2.6 Illustration of the loss of crispness of the product during the glass–rubber
transition (either by moisture adsorption or increased temperature).
Moisture
Loss of brittleness
Glassy
13
Log
m
T (K)
Tg < Tambient
Brittle texture
Transition
Liquid
Rubbery
52527_C002.indd 5752527_C002.indd 57 10/3/2008 3:36:53 PM10/3/2008 3:36:53 PM
© 2009 by Taylor & Francis Group, LLC

58 Advances in Food Dehydration
NOMENCLATURE
VARIABLES
C1 and C2 constants
Cp heat capacity
ΔCpi = (CpLi – CpGi) change in heat capacity of component i between its liquidlike
and glassy states
D particle diameter (m)
Ii drying index
K fraction of particle diameter required as the bridge width for a
suffi ciently strong interparticle bond
n number of data points
S mixed system entropy
Si component entropy
ΔSmG excess entropy at the glassy state
ΔSmL excess entropy at the liquid state
t time of caking
tg time to cake at glass-transition temperature
T temperature (K)
ΔT change in temperature (K)
Tc collapse temperature
Tg glass-transition temperature
Tg¢ glass-transition temperature of maximally concentrated
nonfrozen liquid in the product undergoing drying
Tg123 glass-transition temperature of a ternary mixture
Tgmi measured glass-transition temperature of model mixture iTsticky sticky point temperature
Tsurface surface temperature of a drying droplet or particle
x mass or mole fraction
x1i, x2i fractions of components 1 and 2, respectively, of model mixture iYI indicator for the degree of successful drying
GREEK LETTERS
g surface tension
Dgi difference between the expansion coeffi cients of liquid and
glass of component ik dimensionless proportionality constant of order unity
mc viscosity during the initiation of collapse (Pa s)
r density
t contact time (s)
REFERENCES
Adhikari, B., Howes, T., Bhandari, B.R., and Truong, V., In situ characterization of stickiness
of sugar-rich foods using a linear actuator driven stickiness testing device, J. Food Eng., 58, 11–22, 2003.
52527_C002.indd 5852527_C002.indd 58 10/3/2008 3:36:53 PM10/3/2008 3:36:53 PM
© 2009 by Taylor & Francis Group, LLC

Glass-Transition Based Approach in Drying of Foods 59
Adhikari, B., Howes, T., Bhandari, B.R., and Truong, V., Effect of addition of maltodextrin
on drying kinetics and stickiness of sugar and acid-rich foods during convective drying:
Experiments and modelling, J. Food Eng., 62, 53–68, 2004.
Adhikari, B., Howes, T., Lecomte, D., and Bhandari, B.R., A glass transition temperature
approach for the prediction of the surface stickiness of a drying droplet during spray
drying, Powder Technol., 149, 168–179, 2005.
Aguilera, J.M., Valle, J.M., and Karel, M., Amorphous food powders, Trends Food Sci. Technol., 6, 149–155, 1995.
Allen, G., A history of the glassy state, in The Glassy State in Foods, Blanshard, J.M.V. and
Lillford, P.J., Eds., Nottingham University Press, Nottingham, U.K., 1993, pp. 1–12.
Arvanitoyannis, I., Blanshard, J.M.V., Ablett, S., Izzard, M.J., and Lillford, P.J., Calorimetric
of the glass transition occurring in aqueous glucose: Fructose solutions, J. Sci. Food Agric., 63, 177–188, 1993.
Bellows, R. and King, C.J., Product collapse during freeze drying of liquid foods, AIChE Symp. Ser., 69, 33–41, 1973.
Bhandari, B.R., Beyond water: Water-like functions of other biological compounds in water-
less system, paper presented at the 10th International Symposium on Properties of
Water, ISOPOW 2007, Bangkok, September 2–7, 2007.
Bhandari, B.R., Datta, N., Cooks, R., Howes, T., and Rigby, S., A semi-empirical approach to
optimize the quantity of drying aids required to spray dry sugar rich foods, Dry. Technol., 15, 2509–2525, 1997.
Bhandari, B.R., Datta, N., and Howes, T., Problems associated with spray drying of sugar-rich
foods, Dry. Technol., 15, 671–684, 1997.
Bhandari, B.R. and Hartel, R.W., Co-crystallization of sucrose at high concentration in the
presence of glucose and fructose, J. Food Sci., 67, 1797–1802, 2002.
Bhandari, B.R. and Hartel, R.W. Phase transitions during food powder production and powder
stability, in Encapsulated and Powdered Foods. Chapter 11, Onwulata, C., Ed., Taylor
and Francis, New York, 2005, pp. 261–291.
Bhandari, B.R. and Howes, T., Implication of glass transition for the drying and stability of
foods, J. Food Eng., 40, 71–79, 1999.
Bhandari, B.R., Senoussi, A., Demoulin, E.D., and Lebert, A., Spray drying of concentrated
fruit juices, Dry. Technol., 11, 33–41, 1993.
Bonazzi, C., Demoulin, E., Wack, A.L.R., Berk, Z., Bimbenet, J.J., Courtois, F., Trystram, G.,
and Vasseur, J., Food drying and dewatering, Dry. Technol., 14, 2135–2170, 1996.
Brennan. J. G., Herrera, J., and Jowitt, R., A study of some of the factors affecting the spray
drying of concentrated orange juice, on a laboratory scale, Food Technol., 6, 295–307,
1971.
Buera, M.D. and Karel, M., Application of the WLF equation to describe the combined effects
of moisture and temperature on nonenzymatic browning rates in food systems, J. Food Proc. Preserv., 17, 31–45, 1993.
Busin, L., Buisson, P., and Bimbenet, J.J., Notion of glass transition applied to the spray-
drying of carbohydrate solutions, Sci. Aliment., 16, 443–459, 1996.
Cantor, A.S., Glass transition temperatures of hydrocarbon blends: Adhesives measured by
differential scanning calorimetry and dynamic mechanical analysis, J. Appl. Polym. Sci., 77, 826–832, 2000.
Chang, B.S. and Randall, C.S., Use of subambient thermal analysis to optimize protein
lyophilization, Cryobiology, 29, 632–656, 1992.
Chuy, L. and Labuza, T.P., Caking and stickiness of dairy based food powders as related to
glass transition, J. Food Sci., 59, 43–46, 1994.
Couchman, P.R., Compositional variation of the glass transition temperature. Application
of the thermodynamic theory to compatible polymer blends, Macromolecules, 11,
1156–1161, 1978.
52527_C002.indd 5952527_C002.indd 59 10/3/2008 3:36:53 PM10/3/2008 3:36:53 PM
© 2009 by Taylor & Francis Group, LLC

60 Advances in Food Dehydration
Couchman, P.R. and Karasz, F.E., A classical thermodynamic discussion of the effect of
composition on the glass transition temperature, Macromolecules, 11, 117–119, 1978.
Del Valle, J.M., Cuadros, T.R.M., and Aguilera, J.M., Glass transitions and shrinkage during
drying and storage of osmosed apple pieces, Food Res. Int., 31, 191–204, 1998.
Dolinsky, A., Maletskaya, K., and Snezhkin, Y., Fruit and vegetable powders production
technology on the bases of spray and convective drying methods, Dry. Technol., 18,
747–758, 2000.
Downton, G.E., Flores-Luna, J.L., and King, C.J., Mechanism of stickiness in hygroscopic,
amorphous powders, Ind. Eng. Chem. Fundam., 21, 447–451, 1982.
Fitzpatrick, J.J., Hodnett, M., Twomey, M., Cerqueira, P.S.M., O’Flynn, J., and Roos, Y.H.,
Glass transition and the fl owability and caking of powders containing amorphous
lactose, Powder Technol., 178, 119–128, 2007.
Flink, J.M., Structure and structure transitions in dried carbohydrate materials, in Physical Properties of Foods, Peleg, M. and Bagley, E.B., Eds., AVI, Westport, CT, 1983,
pp. 473–521.
Fogliano, V., Monti, M.S., Musella, T., Randazzo, G., and Ritieni, A., Formation of coloured
Maillard reaction products in a gluten–glucose model system, Food Chem., 66,
293–299, 1999.
Fonseca, F., Passot, S., Cunin, O., and Marin, M., Collapse temperature of freeze-dried
Lactobacillus bulgaricus suspensions and protective media, Biotechnol. Prog., 20,
229–238, 2004.
Franks, F., Biophysics and Biochemistry at Low Temperatures, Cambridge University Press,
Cambridge, U.K., 1985.
Gabarra, P. and Hartel, R.W., Corn syrup solids and their saccharide fractions affect crystal-
lization of amorphous sucrose, J. Food Sci., 63, 523–528, 1998.
Gejlhansen, F. and Flink, J.M., Freeze-dried carbohydrate containing oil-in-water
emulsions—Microstructure and fat distribution, J. Food Sci., 42, 1049–1055, 1977.
Gordon, M. and Taylor, J.S., Ideal copolymers and the second-order transitions of synthetic
rubbers. I. Non-crystalline copolymers, J. Appl. Chem., 2, 493–500, 1952.
Gupta, A.S., Spray drying of orange juice, U.S. Patent 4,112,130, 1978.
Hayashi, H., Drying technologies of foods—Their history and future, Dry. Technol., 7,
315–369, 1989.
Hansen, O.R. and Rasmussen, S., Method of evaporation and spray drying of a sucrose
solution, U.S. Patent 4,099,982 (to A/s Niro Atomizer, Soborg, DK), 1977, pp. 1–8.
Hemminga, M.A., Roozen, M.J.G.W., and Walstra, P., Molecular motions and the glassy state,
in The Glassy State in Foods, Blanshard, J.M.V. and Lillford, P.J., Eds., Nottingham
University Press, Nottingham, U.K., 1993, pp. 157–171.
Hennigs, C., Kockel, T.K., and Langrish, T.A.G., New measurements of the sticky behavior
of skim milk powder, Dry. Technol., 19, 471–484, 2001.
Her, L.M. and Neil, S.L., Measurement of glass transition temperatures of freeze- concentrated
solutes by differential scanning calorimetry, Pharm. Res., 11, 54–59, 1994.
Jouppila, K. and Roos, Y.H., Glass transitions and crystallization in milk powders, J. Dairy Sci., 77, 2907–2915, 1994.
Kamman, J.F. and Labuza, T.P., A comparison of the effect of oil versus plasticized vegetable
shortening on rates of glucose utilization in nonenzymatic browning, J. Food Proc. Preserv., 9, 217–222, 1985.
Karatas, S. and Esin, A., A laboratory scrapped surface drying chamber for spray drying of
tomato paste, Lebensm.-Wiss.-Technol., 23, 354–357, 1990.
Karathanos, V., Angelea, S., and Karel, M., Collapse of structure during drying of celery,
Dry. Technol., 11, 1005–1023, 1993.
Karel, M., Buera, M.P., and Roos, Y.H., Effects of glass transition on processing and storage,
in The Glassy State in Foods, Blanshard, J.M.V. and Lillford, P.J., Eds., Nottingham
University Press, Nottingham, U.K., 1993, pp. 13–34.
52527_C002.indd 6052527_C002.indd 60 10/3/2008 3:36:53 PM10/3/2008 3:36:53 PM
© 2009 by Taylor & Francis Group, LLC

Glass-Transition Based Approach in Drying of Foods 61
Karel, M. and Flink, J.M., Some recent developments in food dehydration research, in
Advances in Drying, Vol. 2, Mujumdar, A.S., Ed., Hemisphere Publishing, New York,
1983, pp. 103–154.
Karmas, R., Buera, M.P., and Karel, M., Effect of glass-transition on rates of nonenzymatic
browning in food systems, J. Agric. Food Chem., 40, 873–879, 1992.
Kieviet, F., Raaij, J.V., De Moor, P.P.E.A., and Kerkhof, P.J.A.M., Measurement and modelling
of the air fl ow pattern in a pilot-plant spray dryer, Trans. IChemE, 75, 321–328, 1997.
Kieviet, F., Raaij, J.V., and Kerkhof, P.J.A.M., A device for measuring temperature and
humidity in a spray dryer chamber, Trans. IChemE., 75, 329–333, 1997.
King, C.J., Spray drying of food liquids, and volatiles retention, in Preconcentration and Drying of Food Materials, Bruin, S., Ed., Elsevier Science, Eindhoven, 1988, pp. 147–162.
King, C.J., Kieckbusch, T.G., and Greenwald C.G., Food quality factors in spray drying,
in Advances in Spray Drying, Vol. 3, Mujumdar, A.S., Ed., Hemisphere Publishing,
New York, 1984, pp. 71–120.
Labrousse, S., Karel, M., and Roos, Y.H., Collapse and crystallization in amorphous matrices
with encapsulated compounds, Sci. Aliment., 12, 757–769, 1992.
Labuza, T.P. and Katz E.E., Structure evaluation of 4 dry crisp snack foods by scanning
electron-microscopy, J. Food Proc. Preserv., 5, 119–127, 1981.
Langrish, T.A.G. and Fletcher, D.F., Spray drying of food ingredients and applications of
CFD in spray drying, Chem. Eng. Process., 40, 345–354, 2001.
Lazar, M.E., Brown, A.H., Smith, G.S., Wong, F.F., and Lindquist, F.E., Experimental
production of tomato powder by spray drying, Food Technol., 3, 129–134, 1956.
Levi, G. and Karel, M., Volumetric shrinkage (collapse) in freeze-dried carbohydrates above
their glass transition temperature, Food Res. Int., 28, 145–151, 1995.
Levine, H. and Slade, L., Principles of “cryostabilization” technology from structure/
property relationship of carbohydrate/water systems—A review, Cryo-Letters, 9,
21–63, 1988.
Lloyd, R.J., Chen, X.D., and Hargreaves, J.B., Glass transition and caking of spray-dried
lactose, Int. J. Food Sci. Technol., 31, 305–311, 1996.
MacKenzie, A.P., Collapse during freeze-drying: Qualitative and quantitative aspects,
in Freeze-Drying and Advanced Food Technology, Goldblith, S.A., Rey, L., and
Rothmayr, W.W., Eds., Academic Press, New York, 1975, pp. 277–307.
Masters, K., Spray Drying Handbook, Longman Scientifi c & Technical, New York, 1994a.
Masters, K., Scale-up of spray dryers, Dry. Technol., 12, 235–257, 1994b.
Mizrahi, S., Berk, Z., and Cogan, U., Isolated soybean protein as a banana spray-drying aid,
Cereal Sci. Today, 12, 322–325, 1967.
Nikolaidis, A. and Labuza, T.P., Glass transition state diagram of a baked cracker and its
relationship to gluten, J. Food Sci., 61, 803–806, 1996.
Oakley, D.E. and Bahu, R.E., Spray/gas mixing behaviour within spray dryers, in Drying ‘91,
Mujumdar, A.S. & Filkova, I., Eds., Elsevier Science, Amsterdam, 1991, pp. 303–313.
Ozmen, L. and Langrish, T.A.G., Comparison of glass transition temperature and sticky point
temperature for skim milk powder, Dry. Technol., 20, 1177–1192, 2002.
Palzer, S., The effect of glass transition on the desired and undesired agglomeration of
amorphous food powders, Chem. Eng. Sci., 60, 3959–3968, 2005.
Papadakis, S.E. and Bahu, R.E., Sticky issue of drying, Dry. Technol., 10, 817–837, 1992.
Ranz, W.E. and Marshall, W.R. Jr., Evaporation from drops, Am. Inst. Chem. Eng. J., 48,
141–146 and 173–180, 1952.
Ratti, C., Hot air and freeze-drying of high-value foods: A review, J. Food Eng., 49, 311–319,
2001.
Rheinlander, P., Drying of hydrolyzed whey, Nordeuro. Mej.-Tidsskrift., 48, 121–126, 1982.
Riva, M., Campolongo, S., Leva, A.A., Maestrelli, A., and Torreggiani, D., Structure–
property relationships in osmo-air dehydrated apricot cubes, Food Res. Int., 38,
533–542, 2005.
52527_C002.indd 6152527_C002.indd 61 10/3/2008 3:36:53 PM10/3/2008 3:36:53 PM
© 2009 by Taylor & Francis Group, LLC

62 Advances in Food Dehydration
Robe, K., Malvick, A., and Heid, J.L., First US installation is applicable to spray drying other
heat-sensitive, hygroscopic food products, Food Process. Market., 29, 48, 1968.
Roos, Y. and Karel, M., Plasticizing effect of water on thermal behavior and crystallization of
amorphous food materials, J. Food Sci., 56, 38–43, 1991a.
Roos, Y. and Karel, M., Phase transitions of amorphous sucrose and frozen sucrose solutions,
J. Food Sci., 56, 266–267, 1991b.
Roos, Y.H., Effect of moisture on the thermal behaviour of strawberries study using differen-
tial scanning colorimetry, J. Food Sci., 52, 146–149, 1987.
Roos, Y.H., Melting and glass transitions of low molecular weight carbohydrates, Carbohydr. Res., 238, 39–48, 1993.
Roos, Y.H., Phase Transitions in Foods, Academic Press, San Diego, CA, 1995.
Schebor, C., Buera, M.P., Karel M., and Chirife, J., Color formation due to non-enzymatic
browning in amorphous, glassy, anhydrous, model systems, Food Chem., 65, 427–432,
1999.
Senoussi, A., Dumoulin, E., and Berk, Z., Retention of diacetyl in milk during spray drying
and storage, J. Food Sci., 60, 894–905, 1995.
Shamblin, S.L., Taylor, L.S., and Zografi , G., Mixing behavior of colyophilized binary
systems, J. Pharm. Sci., 87, 694–701, 1998.
Shimada, Y., Roos, Y.H., and Karel, M., Oxidation of methyl linoleate encapsulated in
amorphous lactose-based food model, J. Agric. Food Chem., 39, 637–641, 1991.
Simha, R. and Boyer, R.F., On a general relation involving the glass temperature and
coeffi cients of expansion of polymers, J. Chem. Phys., 37, 1003–1007, 1962.
Sopade, P.A., Halley, P., Bhandari, B., D’Arcy, B., Doebler, C., and Caffi n, N., Application
of the Williams–Landel–Ferry model to the viscosity–temperature relationship of
Australian honeys, J. Food Eng., 56, 67–75, 2003.
Straatsma, J., Houwelingen, G.v., Steenbergen, A.E., and De Jong, P., Spray drying of food
products: 1. Simulation model, J. Food Eng., 42, 67–72, 1999a.
Straatsma, J., Houwelingen, G.v., Steenbergen, A.E., and De Jong, P., Spray drying of food
products: 2. Prediction of insolubility index, J. Food Eng., 42, 73–77, 1999b.
Tenbrinke, G., Karasz, F.E., and Ellis, T.S., Depression of glass transition temperatures of
polymer networks by diluents, Macromolecules, 16, 244–249, 1983.
To, E.C. and Flink, J.M., Collapse, a structural transition in freeze dried carbohydrates.
I. Evaluation of analytical methods, J. Food Technol., 13, 551–565, 1978a.
To, E.C. and Flink, J.M., Collapse, a structural transition in freeze dried carbohydrates.
II. Effect of solute composition, J. Food Technol., 13, 567–581, 1978b.
Truong, V., Bhandari, B.R, Howes, T., and Adhikari, B., Analytical model for the prediction
of glass transition temperature of food systems, in Amorphous Foods and Pharmaceutical Systems, Levine, H., Ed., RSC Publishing, London, 2002, pp. 31–47.
Tsouroufl is, S., Flink, J.M., and Karel, M., Loss of structure in freeze-dried carbohydrate
solutions: Effect of temperature, moisture content and composition, J. Sci. Food Agric., 27, 509–519, 1976.
Wallack, D.A., and King, C.J., Sticking and agglomeration of hygroscopic, amorphous carbo-
hydrate and food powders, Biotechnol. Prog., 4, 31–35, 1988.
White, G.W. and Cakebread, S.H., The glassy state in certain sugar-containing food products,
J. Food Technol., 1, 73–82, 1966.
Whorton, C. and Reineccius, G.A., Evaluation of the mechanisms associated with the release
of the encapsulated fl avor materials from maltodextrin matrices, in Encapsulation and Controlled Release of Food Ingredients, ACS Symposium Series 590, Risch, S.J.
and Reineccius, G.A., Eds., American Chemical Society, Washington, DC, 1995,
pp. 142–159.
Woodruff, E., Woodbine, M., Andersen, V., and Hackettstown, N., Sugar drying method,
U.S. Patent 3,706,599 (to W.R. Grace & Co.), 1971, pp. 1–8.
52527_C002.indd 6252527_C002.indd 62 10/3/2008 3:36:53 PM10/3/2008 3:36:53 PM
© 2009 by Taylor & Francis Group, LLC

63
3 Application of Image Analysis in Food Drying
Maturada Jinorose, Sakamon Devahastin, Silvia Blacher, and Angélique Léonard
CONTENTS
3.1 Introduction ............................................................................................... 63
3.2 Application of Image Analysis in Food Drying ........................................ 64
3.2.1 Color Evaluation ............................................................................ 64
3.2.2 Size and Shape Evaluation ............................................................. 71
3.2.3 Evaluation of Internal Characteristics ........................................... 72
3.3 Application of Combined Image and Fractal Analysis in Food Drying ........ 75
3.3.1 Introduction .................................................................................... 75
3.3.2 Applications in Food Drying ......................................................... 76
3.4 Application of X-Ray Microtomography in Food Drying ........................ 80
3.4.1 Introduction .................................................................................... 80
3.4.2 Image Reconstruction .................................................................... 85
3.4.3 X-Ray Microtomography and Food Drying .................................. 85
3.4.3.1 Shrinkage Determination ................................................. 85
3.4.3.2 Crack Detection and Quantifi cation ................................. 86
3.4.3.3 Internal Moisture Profi le Determination .......................... 86
3.4.3.4 Microstructure Characterization ...................................... 86
3.5 Closing Remarks ....................................................................................... 88
Nomenclature ....................................................................................................... 89
Variables ................................................................................................... 89
Greek Letters ............................................................................................ 90
Subscripts .................................................................................................. 90
Abbreviations ............................................................................................ 91
References ............................................................................................................ 91
3.1 INTRODUCTION
An image is a two-dimensional (2-D) or three-dimensional (3-D) reproduction of a
form of an object that can be captured by such optical devices as cameras and micro-
scopes. Although the human visual system is very fast in creating and capturing images
and very good in making qualitative judgments about image features, it is not suitable
52527_C003.indd 6352527_C003.indd 63 10/3/2008 3:44:14 PM10/3/2008 3:44:14 PM
© 2009 by Taylor & Francis Group, LLC

64 Advances in Food Dehydration
for making a quantitative measurement. In order to quantify image data, a biological
imaging system such as human eyes requires assistance from image analysis tools.
Image analysis is a means of obtaining meaningful information from an image,
mainly from a digital image (Plataniotis and Venetsanopoulos, 2000). The task can
be as simple as measuring the color (Louka et al., 2004; Mendoza et al., 2006) of a
product to something more sophisticated such as analysis of food microstructure
(Acevedo et al., 2008; Devaux et al., 2006; Kerdpiboon et al., 2007; Ramos et al.,
2004; Varela et al., 2008). Although basic tools such as a ruler, perimeter, and spot
densitometer can be used to analyze image data, the use of basic tools is a tedious
and time-consuming task. Therefore, computers (digital image processing) are used
to decrease the data analysis time.
Computer image analysis is indispensable for the analysis of large amounts of
data, especially for tasks that require complex computation or extraction of quantita-
tive or qualitative information from 2-D images as in computer vision or 3-D images
as in medical imaging applications (Jennane et al., 2007; Louka et al., 2004). The use
of computers to perform digital image processing allows a much wider range of
algorithms to be applied to analyze the input data and can avoid problems such as the
build-up of noise and signal distortion during processing (Imaging Research Inc.,
2007). It should be noted, however, that although computers are useful when the task
is too impractical to perform by hand, many important image analysis tools such as
edge detectors are inspired by human visual perception models, so human analysts
still cannot be completely replaced by computers.
A variety of image analysis systems are currently available from dozens of manu-
facturers; some of them are designed for specifi c applications and no programming is
required. The reduction in hardware costs allows the system to be built for more
general use in food research and applications.
There are currently a number of techniques and algorithms, which involve advanced
mathematics such as Fourier and wavelet transforms (Antonelli et al., 2004; Fernández
et al., 2005), probability and statistics (Dan et al., 2007; Ros et al., 1995), or discrete
topology and geometry (Chevalier et al., 2000) that can be applied to food research
applications. However, this chapter will focus only on selected techniques that have
proved useful in food drying applications. These techniques range from the use of a
simple computer vision system (CVS) to scanning electron microscopy (SEM) to
more advanced techniques such as magnetic resonance imaging (MRI), combined
image and fractal analysis, and x-ray microtomography. The coverage here is cer-
tainly not inclusive, and the choices of examples discussed are sometimes arbitrary.
However, these examples should nevertheless serve to illustrate the possible use of
image analysis in food drying research and quality control. Indeed, the use of image
analysis in food drying is still at an early stage and more efforts are certainly needed
to utilize the advantages of the technique to a higher level.
3.2 APPLICATION OF IMAGE ANALYSIS IN FOOD DRYING
3.2.1 COLOR EVALUATION
Because the visual (external) appearance of food is one of the major factors in deter-
mining product quality and consumer acceptance, as these are often the only direct
52527_C003.indd 6452527_C003.indd 64 10/3/2008 3:44:14 PM10/3/2008 3:44:14 PM
© 2009 by Taylor & Francis Group, LLC

Application of Image Analysis in Food Drying 65
information consumers receive when buying a product, the ability to assess the
external appearance (e.g., size, shape, and color) of a product qualitatively and
quantitatively is of great importance (Fernández et al., 2005; Locht, 2007; Yan et al.,
2008). Visual inspection has to be performed with consumer acceptance that
is often based on external features in mind. Until recently, this inspection has
been performed mostly by human eyes. Thus, it has been qualitative rather than
quantitative because it relies more on feeling (subjective) than on scientifi c
(objective) perspective.
Among the various properties, color is an important quality parameter that plays
a major role in the assessment of external (or apparent) quality of food because it
correlates well with other physical, chemical, and sensorial indicators of product
quality (Fernández et al., 2005; Louka et al., 2004; Mendoza et al., 2006). During
drying the color of food can change signifi cantly because of such reactions as
enzymatic browning, as in the case of dehydrated fruits, Maillard reactions, or other
oxidation reactions (Acevedo et al., 2008; Fernández et al., 2005). Browning discolo-
ration of a product lowers its quality value and is often accompanied by textural
changes, off-fl avors, decreased solubility, and loss of nutritional value.
Perception of color is a result of an interaction among a light source (daylight,
tungsten, etc.), the object (colorants, surface texture, etc.), and the observer (human
eye sensitivity, experience, etc.; HunterLab, 2007). Thus, in the assessment of dried
(or drying) food color the diffi culty lies in measuring the color of a heterogeneous
product because color changes of food during drying are not homogeneous (Fernández
et al., 2005; Louka et al., 2004). The fi rst and simplest method of color measurement
is the sensory perception by a group of trained people, which is imprecise and
subjective. In addition, this method cannot describe color in the form of color space,
which is a system for describing color numerically.
To build an instrument that can quantify color perception, the three elements of
a visual observing situation must be quantifi ed. The source must be quantifi ed by a
selection of illuminant, the object quantifi ed by measuring the refl ectance or trans-
mission curve, and the observer quantifi ed by CIE Standard Observer functions
(HunterLab, 2007). The conventional color specifi cation instruments (such as a
colorimeter), which usually provide readings in CIEXYZ, RGB, or LAB color space,
use fi lters in combination with a light source and detector to spectrally emulate the
standard observing functions of the eyes and can give direct evaluations of X, Y,
and Z. However, because the normal viewing area of these instruments is only 2 to
5 cm2, these instruments are inappropriate for discriminating the overall color changes
of a whole piece of a heterogeneous product. Therefore, many locations must be
measured to obtain a representative color profi le (Fernández et al., 2005; HunterLab,
2007; Mendoza et al., 2006).
The use of the CVS computerized image analysis technique for quality inspection
of food is now an established technique because of its simplicity and nondestructive
and time-saving nature. The system offers an alternative for measuring uneven color-
ation and it can be applied to the measurement of other attributes of food such as size
and shape, especially when dealing with irregular surfaces. It can also be easily
incorporated into any on-line processing tasks. Calibrated average color measure-
ments and other appearance features using CVS have been demonstrated to closely
correlate with those from visual assessment. Changes in average color and color
52527_C003.indd 6552527_C003.indd 65 10/3/2008 3:44:14 PM10/3/2008 3:44:14 PM
© 2009 by Taylor & Francis Group, LLC

66 Advances in Food Dehydration
patterns of whole foods during dehydration have been effectively determined by this
technique (Acevedo et al., 2008; Fernández et al., 2005).
An image acquisition system usually consists of four basic components: illumi-
nant (lighting system), camera, hardware, and software. Vision systems require the
use of a proper light source in order to avoid glitter and to obtain sharp contrasts at
the border of the sample image. Usually, most systems use one of the CIE standard
illuminants representing white light: illuminant A represents incandescent lamp, C
represents average daylight, and F2 represents cool white fl uorescent. However, the
most commonly used illuminant is D65, which represents noon daylight (HunterLab,
2007). It should be noted, however, that F7, a typical fl uorescent illuminant, which is
sometimes called D65 daylight, does not give the visual result that matches CIE D65
because the spectral power distributions are not the same as those of CIE illuminant
D65. Proper calibration should be performed if matching of measured color to a stan-
dard one is desired. Choosing an incorrect light may cause metamerism to happen; a
common case is that two color samples appear to match when viewed under a par-
ticular light but do not match when illuminated by different lights.
The setup of a camera and illuminant (viewing environment) is critical for image
acquisition and for obtaining meaningful and reproducible data. The angle between
the axis of a camera as well as between the axis of a light source and the axis of a
sample being observed is usually 45° in order to capture the refl ected light, which
occurs at that angle (Figure 3.1). Circumferential illumination via the use of a
FIGURE 3.1 Setup of a camera and illuminant with 45° refl ection.
45° 45°
Light sourceCamera
Light source
45°/0°
Instrument with bidirectional illumination
45° 45°
Camera
Light source asa ring
45°/0° Instrumentwith
circumferentialillumination
52527_C003.indd 6652527_C003.indd 66 10/3/2008 3:44:14 PM10/3/2008 3:44:14 PM
© 2009 by Taylor & Francis Group, LLC
Application of Image Analysis in Food Drying 67
number of lights set around the sample as a ring at 45° is also recommended because
it helps reduce the effect of the sample surface by providing more even lighting across
the surface than using only mono- or bidirectional illumination (see also Figure 3.1).
The surface texture of a sample also has an important role in color measurement.
Although the sample may have the same color, a shiny surface looks darker and more
saturated than a matte one. Thus, for dark glossy products, diffuse or 8° geometry or
“sphere” geometry is more suitable because a sphere coating (a substance with an
excellent capacity to diffuse light such as titanium dioxide) helps diffuse the light;
the sample is then illuminated diffusely from all directions.
Digital and video cameras, ranging from a consumer digital camera with one
charge-coupled device (CCD) to a high-end CCD camera with three CCDs (one each
for red, green, and blue light) are generally powerful enough for color studies because
the image analysis systems for color measurements have been developed in response
to low spatial resolution. The majority of color digital still cameras being used for
technical applications employ a single array of light-sensitive elements on a CCD
chip, with a fi lter array that allows some elements to see red, some green, and some
blue; the relative intensities could be manually or automatically adjusted by a func-
tion called “white balance.” Such cameras devote one half of the elements to green
sensitivity and one quarter each to red and blue, emulating human vision, which is
most sensitive to the green portion of the spectrum. A digital color image is
represented in RGB form with three components per pixel, conventionally stored
using 8 bits per color component, and electronically combined to produce a digital
color picture (Russ, 2005). It is obvious that signals generated by a CCD are device
dependent; each camera has its own color sensor characteristics and produces
different responses for the same image when it is displayed through hardware such
as a graphics card and monitor. This may not be too serious for gray-scale imaging,
but it is for color imaging, especially when colorimetric precision is important.
Another important issue is gamma correction. Gamma is the standard for device
encoding to match the eye nonlinearity. It helps minimize transmission noise in the
dark areas. The ITU-R BT.709 standard, in particular, defi nes the transformation
of CIEXYZ tristimulus values into a target RGB monitor space (ICC, 2007). The
resulting image is obviously not an exact match of the original scene but instead is a
preferred reproduction of the original scene, which is consistent with the limitations
of a monitor. Different computer platforms like Macintosh and PC use different
gamma values.
To obtain a device-independent color of a food sample using a digital or video
camera, it is necessary to correlate the camera RGB signals and CIEXYZ tristimulus
values using a power function with a suitable gamma value, which is applied to each
red, green, and blue signal. This process is known as camera characterization. The
most common technique for camera characterization consists of presenting the
camera with a series of color patches in a standardized reference chart with known
CIEXYZ values and recording the average RGB signals for each patch. Polynomial
fi tting techniques can then be applied to interpolate the data over the full range and
to generate inverse transformations (Mendoza et al., 2006).
The choice of background color also plays an important role in image processing.
White background is easily removed when performing image analysis via the use of
52527_C003.indd 6752527_C003.indd 67 10/3/2008 3:44:14 PM10/3/2008 3:44:14 PM
© 2009 by Taylor & Francis Group, LLC

68 Advances in Food Dehydration
a simple thresholding technique. However, if the background is too bright, the color
of the sample may be affected because of the chroma of the detectors in a camera
(Louka et al., 2004). A black background is thus suitable for general applications as
it helps reduce the shadow effect when analyzing an image. However, if a sample is
a transmit object, black backing will reduce its color gamut. When the product color
is very bright, it is more suitable to use a white backing for image analysis. A suitable
backing medium should not be fl uorescent; high brightness white ceramic tiles or
other materials whose surfaces are coated with similar colorants are recommended.
Mendoza et al. (2006) measured the color of bananas and found that the lightness
(L* value) of bananas was signifi cantly altered when the color of the background
changed from black to white.
In addition, the image should be taken in a closed environment (e.g., inside a
light box) to avoid external light and refl ections (a black body absorbs light at all
frequencies, hence no refl ections). The camera should be set to manual mode with no
zoom and no fl ash. The image should then be stored in a noncompressed or lossless
compression format such as TIFF, BMP, or RAW, but not in a lossless JPG, which is
not a lossless compression. Generally, a digital camera saves an image in a JPG
format by default. Switching the saving format to TIFF or RAW improves the quality
of an image. Nevertheless, the differences in the analysis results may be diffi cult to
observe if the image is analyzed manually with a photo editing program. Note that
loading the image into a graphics program and resaving it in JPG format will degrade
the image even without editing it. If a video camera is used, the still image should be
acquired with video editing or frame grabbing software.
Image analysis can be performed manually by common photo editing software
such as Adobe PhotoshopTM (Adobe System, Inc., San Jose, CA) or free graphic
editor software such as the GNU Image Manipulation Program (GIMP; The GIMP
Team, 2007), which is one of the most widely used bitmap editors in the printing and
graphics industries. The easiest way to measure color is to use a wand selection tool
to select the area to measure the average color. If using only the wand selection to
separate the object of interest from the background is diffi cult, converting the color
image to a gray-scale image by selecting the binary process through thresholding
should be performed before using the wand selection. The RGB values can be
converted to any color system such as the CIELAB color model, which is widely
used in food research and quality control, using mathematical formulas described in
any computer image analysis textbook (e.g., Plataniotis and Venetsanopoulos, 2000).
Free Java-based image analysis software such as ImageJ (National Institutes of
Health, 2007) or free image processing and analysis software such as UTHSCSA
ImageTool (University of Texas Health Science Center, 2007) may be helpful for
more accurate results.
MATLAB® (MathWorks, Inc., Natick, MA) software is widely used to analyze
images in food research. Segmentation of a sample image from the background by
the algorithms within MATLAB usually involves the following steps:
1. Convert a color image into a gray-scale image using the function rgb2gray.
2. Apply a threshold and perform background subtraction using an edge
detection technique based on such operators as Laplacian-of-Gauss or Sobel
52527_C003.indd 6852527_C003.indd 68 10/3/2008 3:44:14 PM10/3/2008 3:44:14 PM
© 2009 by Taylor & Francis Group, LLC

Application of Image Analysis in Food Drying 69
to obtain a binary image, where “0” (black) means background and “1”
(white) means object.
3. If necessary, close small noisy holes within the object of interest using such
function as medfi lt2.
4. Remove all objects surrounding the sample.
5. Overlap the contour of the binary image on the original color image and
extract the sample from the background (Mendoza et al., 2006).
However, thresholding a color image is not an easy task. There is no simple general-
ization for the thresholding technique; in other words, an appropriate threshold is
dependent on the image itself. For more information, refer to the Help section
of MATLAB.
Selection of an appropriate color space to measure the color of food is important
because this may cause the result to vary. Louka et al. (2004) compared the color
results of dried fi sh (cod fi let) obtained from image analysis to those obtained from
sensory analysis performed by a trained jury. Four different color systems (RGB,
CIELAB, HLC, and Aclc2) were used to defi ne the color of the fi sh. Although the
RGB system was unsuitable in this case, the instrumental measurement of color was
accurate, reliable, and reproducible. The relative errors of all measured parameters
remained low; the highest error belonged to chroma values in CIELAB, with its
variance close to 6%. Although chroma was less precise than the entire CIELAB
space, its variance was able to statistically distinguish the results from different
drying methods: hot-air drying (HAD), vacuum drying, freeze-drying, a novel DDS
(a process of dehydration by successive pressure drop), and DIC (a process of
dehydration by controlled instantaneous pressure drop). For continuous production
control, however, the use of CIELAB color space is recommended because chroma
variance cannot be used to study the color of a sample based on a single image and
requires that repeated measurements be made. Acevedo et al. (2008) also confi rmed
that CIELAB is more suitable for measuring food color.
Mendoza et al. (2006) studied the effect of the curved surface of a yellow sheet
on the measured sheet color. They examined the color profi le variation of the yellow
sheet when it was fl at and rolled. They noted that the curvature of the surface affected
the effi ciency of the system. RGB was most affected but the lightness (L* and V) of
CIELAB and the hue–saturation–value (HSV) model also seemed to be affected by
the curvature of the sample as well. This is because color is based on the surface
refl ectance of an object and the intensity of the light source shining on it. Later, when
analyzing the color of samples with curved surfaces (yellow and green bananas), it
was revealed that CIELAB was more appropriate for color representation of glossy
surfaces. This is because the color profi les were less affected by the degree of
curvature, shadows, and glossiness of the surfaces when comparing with the HSV
color system, as shown in Figure 3.2.
A CVS could be used to measure food color instead of a colorimeter as demon-
strated by Mendoza et al. (2006). Figure 3.3 shows a relationship between the
color scale values of the 125 Pantone® color sheets obtained from a CVS and those
obtained from a colorimeter. The plot of CIEXYZ values obtained from the two
measuring methods exhibited a linear relationship with a reasonable fi t (R2 � 0.97).
52527_C003.indd 6952527_C003.indd 69 10/3/2008 3:44:14 PM10/3/2008 3:44:14 PM
© 2009 by Taylor & Francis Group, LLC

70 Advances in Food Dehydration
Nor
mal
ized
val
ues
0.0
0.2
0.4
0.6
0.8
1.0
Yellow banana
(a)
Angle (degrees)
–80 –60 –40 –20 0 20 40 60 80
Angle (degrees)
–80 –60 –40 –20 0 20 40 60 80
Nor
mal
ized
val
ues
0.0
0.2
0.4
0.6
0.8
1.0L*a*b*HSV
L*a*b*HSV
Green banana
(b)
FIGURE 3.2 Color profi les expressed in CIELAB and HSV color scales for (a) yellow and
(b) green bananas. (From Mendoza, F. et al., Postharvest Biol. Technol., 41, 285–295, 2006.
With permission.)
Fernández et al. (2005) also mentioned that the color changes of apple tissue brown-
ing during drying as measured by image analysis and by a hand-held colorimeter
gave high average correlation coeffi cients in terms of the CIELAB color model.
Martynenko (2006) applied CVS via the use of a portable CCD camera with
an IEEE-1396 interface and LabViewTM 7.0 and IMAQ™ 6.1 software (National
52527_C003.indd 7052527_C003.indd 70 10/3/2008 3:44:14 PM10/3/2008 3:44:14 PM
© 2009 by Taylor & Francis Group, LLC

Application of Image Analysis in Food Drying 71
Instruments Corp., Austin, TX) to monitor the drying process for ginseng. A ginseng
sample was continuously monitored by extracting the green plane from the RGB
color space; this was followed by thresholding and pixel counting. The sample color
was monitored continuously as color intensity in the hue–saturation–intensity (HSI)
color space. The correlations between various image attributes (i.e., area, color, and
texture) and the physical parameters of drying (i.e., moisture content) were also
determined through the use of CVS. Color measurements demonstrated a high
correlation between the product quality and the drying conditions. A CVS therefore
has the potential to be a means to control a drying process on a real-time basis.
Image analysis can also be used to inspect browning reactions to attain results
that agree with other techniques including the ones involving chemical analysis.
Acevedo et al. (2008) used image analysis to study the effects of pretreatments and
processes (blanching, freezing, and drying), which affected the sample (apple disks)
structure at macroscopic and microscopic levels. The results showed that image
analysis provided reproducible values for browning changes without invasion of the
sample. The results were also in good agreement with those of White and Bell (1999)
who analyzed brown pigment formation via a Maillard reaction in low moisture
model food systems.
3.2.2 SIZE AND SHAPE EVALUATION
Shrinkage is one of the major physical changes during drying because it modifi es the
shape and dimension (size) of food. It is usually expressed in terms of the ratio
FIGURE 3.3 Plots of color scale values acquired by CVS against values measured by a
colorimeter on 125 Pantone color sheets. (From Mendoza, F. et al., Postharvest Biol. Technol., 41, 285–295, 2006. With permission.)
Computer vision system
0 20 40 60 80 100 120
Col
orim
eter
0
20
40
60
80
100
120
X
Y
Z
XDLange = 1.07sX
R2 = 0.97
YDLange = 1.07sY
R2 = 0.98
ZDLarne = 0.99sZ
R2 = 0.98
52527_C003.indd 7152527_C003.indd 71 10/3/2008 3:44:14 PM10/3/2008 3:44:14 PM
© 2009 by Taylor & Francis Group, LLC

72 Advances in Food Dehydration
between the volume of the sample before and after drying; the volume can be
measured either by the Archimedes principle or by any displacement techniques.
Shrinkage can also be expressed as a function of the change of selected dimensions
of a sample.
The shrinkage, shape, and size of a food sample have been quantifi ed mostly by
direct measurement with such instruments as a vernier caliper, digital caliper,
micrometer, or planimeter. However, the use of computer vision and image analysis
to quantify shrinkage and deformation of food products has been increasing during
the past decade because these techniques provide an alternative to manual inspec-
tion, have several advantages, and can be integrated directly with other on-line
processing tasks.
The basic idea in the evaluation of shrinkage, shape, and size is the use of shape
descriptors to represent the shape and size of a sample. One advantage of using
image analysis to evaluate shrinkage is the ease of comparing the sample before and
after drying. Software such as Image-ProTM (Media Cybernetics, Inc., Bethesda, MD)
provides ready to use geometrical parameters to identify objects, thus simpli fying
the task signifi cantly.
As an illustrative example, Fernández et al. (2005) developed a method based on
image analysis to determine the effect of drying on various physical properties of
apple disks. A pattern recognition program was developed in MATLAB using Fourier
descriptors, which represent the shape of the samples in terms of the 1-D or 2-D
signal, as a shape representation method. This program analyzed all of the sample
images, matching them with the prototype image and deciding to which class (degree
of dryness) the images belonged. Although it was diffi cult to identify classes after an
extended period of drying because the external images of the samples remained
almost unchanged, 95% of the samples were correctly classifi ed. The advantage of
this method is that it represents the quality factors perceived by the consumers better
than using other process parameters (i.e., rate of drying and moisture content), which
have limited signifi cance from the standpoint of product quality.
3.2.3 EVALUATION OF INTERNAL CHARACTERISTICS
During drying a food sample not only undergoes external changes but also obviously
suffers internal changes. It is indeed these internal changes that affect or lead to
many apparent changes of the sample (e.g., shrinkage, deformation, and textural
changes). The ability to assess various internal changes of a product undergoing
drying is thus of interest. There are a number of methods that can be used to charac-
terize the internal changes of food, ranging from the use of CVS to various micro-
scopic methods such as MRI as well as other techniques, for example, combined
image and fractal analysis or x-ray microtomography, which will be discussed in
later sections of the chapter. Note that the following brief review covers only selected
illustrative examples of the use of image analysis in characterizing various internal
changes of food. No attempt is made to discuss the fundamentals or principles behind
each technique. The reader is referred to some excellent resources on image analysis
(e.g., Russ, 2005) and microstructural principles (e.g., Aguilera and Stanley, 1999)
for more details.
52527_C003.indd 7252527_C003.indd 72 10/3/2008 3:44:14 PM10/3/2008 3:44:14 PM
© 2009 by Taylor & Francis Group, LLC

Application of Image Analysis in Food Drying 73
Techniques such as light microscopy (LM), SEM, or confocal laser scanning
microscopy (CLSM) are widely used to study the microstructure of a food sample.
Images obtained from a microscope are generally converted into a number of
matrixes (RGB) with the help of computer software. The matrixes can then be modi-
fi ed to obtain better images through such processes as contrasting, darkening, and
thresholding before an analysis be made.
Alamilla-Beltrán et al. (2005) described morphological changes, in terms of crust
(skin) formation as well as deformation, of maltodextrin particles during spray drying
using LM and after spray drying using SEM. The fractal dimension (FD) of the
projected perimeter of the particles (as observed by a scanning electron microscope)
was also calculated. During spray drying the samples were sampled out via the use of
a specially designed sampler at various vertical locations along the height of the dryer.
The calculated FD supported fi ndings related to morphology–temperature relations,
which are important to predict particle properties such as density, size distribution,
moisture content, and strength.
Varela et al. (2008) applied image analysis to quantify fracture pattern and
microstructural changes of almonds (Prunus amygdalus L.) during roasting. Image
analysis was used to characterize the fracture pattern of almonds roasted under
different conditions through the measurement of the particle size distribution after
compression (to the point of sample fracture), and LM and SEM were used to observe
microstructural changes of the samples during roasting. The microstructure of the
samples was then related to the sample compression and fracture behavior. A typical
digital camera was used to capture images of fractured samples and Image
Pro-PlusTM 4.5 imaging software was used to analyze the obtained images. The
software was also used to analyze the LM images of the tissue sections obtained
from the center of the samples. The proposed image analysis methods successfully
quantifi ed the features at both macroscopic and microscopic levels related to the
fracture of roasted almonds.
Ghosh et al. (2007) applied MRI to study moisture profi les in single rewetted
wheat kernels during drying, which is a rather diffi cult task using more traditional
determination techniques. A Magnex (Magnex Scientifi c Ltd., Yarnton, U.K.) 11.7-T
(500-MHz) superconducting vertical-bore magnet was used, which was equipped
with a Magnex SGRAD 123/72/S72 mm capable of producing a maximum gradient
strength of 550 mT/m. An Avance DRX console was interfaced to the magnet to
record the magnetic resonance images via ParaVisionTM software (Bruker BioSpin,
Billerica, MA). The MRI probe and coil (Helmholtz confi guration: 7-mm inner
diameter) were built by the authors. A schematic diagram of the experimental setup
is provided in Figure 3.4.
The obtained 2-D images were processed as 8-bit images in a 128 ¥ 4 ¥ 8 pixel
matrix with a fi eld of view of 1.28 ¥ 1.28 ¥ 0.4 cm, resulting in a pixel resolution of
100 ¥ 200 ¥ 500 μm. One-dimensional spectral data were obtained with a spectral
width of 50 kHz. Image analysis (image acquiring and visualization, normalization,
pixel selection, and thresholding) was performed with ImageJ and MATLAB.
Nitrogen was used as the drying medium instead of hot air because nitrogen is non-
corrosive to the instruments. A calibration curve of the magnetic resonance image
intensity versus the moisture content of the grains was obtained using nuclear
52527_C003.indd 7352527_C003.indd 73 10/3/2008 3:44:14 PM10/3/2008 3:44:14 PM
© 2009 by Taylor & Francis Group, LLC

74 Advances in Food Dehydration
magnetic resonance (NMR) spectra of wheat at different known moisture contents.
The calibration curve was needed because the magnetic resonance signal intensity
was not always directly proportional to the actual moisture content at different loca-
tions in an image of a wheat kernel.
The magnetic resonance images showed the variation in the internal distribution
of moisture both before and during drying. Moisture was concentrated mainly in the
embryo region and the embryo signal intensity remained high, even after some
period of drying at all test temperatures (30, 40, and 50°C). The results also showed
that moisture reduction was dependent on the moisture content of the kernels as well
as their compositions and regions (e.g., embryo, endosperm, and pericarp). The real-
time conditions obtained from these measurements form a basis for the development
of a more accurate grain drying models describing transport phenomena in individ-
ual kernels. Indeed, recent MRI results showed that the simple moisture receding
front assumption may not be realistic because no sharp front was observed in MRI
studies (Chen, 2006).
In addition to MRI and standard SEM or CLSM, microstructural analysis can be
performed using other optical techniques such as environmental SEM (ESEM). The
use of ESEM also allows the microstructure analysis to be done in situ and on a
real-time basis (Chen, 2006).
11.7 T Vertical boremagnet
Wheatkernel
MR imagingprobe
Bruker AvanceDRX console
Bruker BVT-1000variable temperature and
flow control unit
PowersupplyThermocouple
Heater
Hot N2
N2 gasWorkstation
FIGURE 3.4 A schematic diagram of MRI experimental setup with the dryer assembly.
(From Ghosh, P.K. et al., Biosyst. Eng., 97, 189–199, 2007. With permission.)
52527_C003.indd 7452527_C003.indd 74 10/3/2008 3:44:14 PM10/3/2008 3:44:14 PM
© 2009 by Taylor & Francis Group, LLC

Application of Image Analysis in Food Drying 75
3.3 APPLICATION OF COMBINED IMAGE AND FRACTAL ANALYSIS IN FOOD DRYING
3.3.1 INTRODUCTION
During drying the physical properties of food change mainly because of the loss of
its moisture. Attempts have been made to characterize these physical changes in
terms of such parameters as the changes in volume, area, and shape (Khraisheh
et al., 1997; Ochoa et al., 2002a,b; Panyawong and Devahastin, 2007; Ratti, 1994).
However, as mentioned in the previous section, these external changes are caused by
internal changes within a sample, which are directly related to the structure of the
drying material. Among many methods that could be used to describe the structural
and physical changes of materials, optical instruments such as light microscopes and
scanning electron microscopes are common (Aguilera and Stanley, 1999). However,
the microstructural images that are obtained cannot be easily quantifi ed without the
use of other appropriate evaluation techniques.
Because of the usefulness of image analysis, some researchers have applied this
technique in combination with a technique called fractal analysis to quantify the
various changes of food products undergoing different thermal and nonthermal
processing. Fractal analysis can be used to describe the surface, structure, and
morphology as well as the mechanical properties of foods. This combined technique
(fractal and image analysis) has been used successfully to characterize ruggedness
changes of tapped agglomerated food powders (Barletta and Canovas, 1993),
ruggedness of potatoes after deep fat frying (Rubnov and Saguy, 1997), as well as
food surfaces and microstructural changes of many raw food materials (Quevedo
et al., 2002), among others.
Fractals or fractal geometry refers to the geometry of irregular or fragmented
shapes of common natural materials such as shorelines, clouds, and plants (Mandelbrot,
1983). The FD contains three characteristics, which are described as self-similar
(a shape that has no characteristic length because the shape does not change with the
change of the observation scale; Rahman, 1997), described by recurrent dependencies
(not by a mathematical formula), and containing a dimension that is not an integer
(Dziuba et al., 1999). Fractals can be used to describe the geometry of complex particles
and to quantify the ruggedness of particles.
The FD can be calculated with many techniques, and each technique yields
different values from the same image (Rahman, 1997). It consists of dimensionless
units, and their value depends on the images being studied. The value is in the range
of 1 to 2 if the image has two dimensions, or the value is 2 to 3 if the image has three
dimensions. Many studies have applied different techniques to calculate FDs from
the same images (Pedreschi and Aguilera, 2000; Quevedo et al., 2002; Rahman,
1997). They found that the same images yielded different FD values when different
FD calculation techniques were used. Therefore, FD interpretation without physical
understanding could be misleading.
The box counting technique is one of the most popular algorithms used to
calculate the FD of signals and images (Turner et al., 1998). This technique applies
the size–measure relationships to calculate the FD. Cubic boxes of different sizes (r) are mounted on an image and the number of boxes intercepted (Nr) with the object in
52527_C003.indd 7552527_C003.indd 75 10/3/2008 3:44:14 PM10/3/2008 3:44:14 PM
© 2009 by Taylor & Francis Group, LLC

76 Advances in Food Dehydration
the image for each iteration of the r value is then counted. The FD is determined from
the slope of the least squares linear regression of the logarithmic plot of Nr and 1/r:
FD = log (Nr) _______ log (1/r)
(3.1)
The sizes of the boxes used to obtain the FD vary, depending on the application of
interest.
3.3.2 APPLICATIONS IN FOOD DRYING
Very few attempts have been made to apply fractal analysis to food drying. Among
the early attempts, Chanola et al. (2003) applied fractal analysis to the distribution of
the surface temperature of a model food (mixture of glucose syrup and agar gel) in
order to monitor the drying kinetics of the sample. In addition, the evolution of the
FD of the images of the sample surface was also monitored. Based on the fractal
analysis of the surface temperature distributions, different periods of drying could be
identifi ed. It was also observed that the FD of the images of the sample surface
increased with the drying time because of an increase in surface irregularity as drying
proceeded. Furthermore, higher air temperatures and velocities led to higher FD values
of the surfaces. However, fewer attempts have been made to use fractal analysis to
monitor physical and/or microstructural changes of food products.
Kerdpiboon and Devahastin (2007a,b) and Kerdpiboon et al. (2007) made the fi rst
attempts to apply fractal analysis to characterize the microstructure of food materials
undergoing drying and to correlate the microstructural changes of foods with their
apparent physical changes (e.g., volume shrinkage). In their studies the FD of the
microstructural images of model food materials (carrot and potato) was calculated
using the box counting method. Prior to being able to calculate the FD, however, several
steps were necessary and these are briefl y outlined here. For the detailed procedures,
refer to Kerdpiboon and Devahastin (2007a,b) and Kerdpiboon et al. (2007).
The process of microstructural imaging consists of fi xation, in which the sample
is preserved with formaldehyde prior to passing through the remaining steps. The
objective of the fi xation step is to immobilize cellular components to ensure that the
structure and tissue shown in the microstructural images refl ects the living state of
the sample as closely as possible. After fi xation, the sample is soaked with fl owing
distilled water before removing the remaining moisture within the sample cells by
fl ushing the sample with a series of isopropyl alcohol solutions. Isopropyl alcohol
within the sample is subsequently removed by fl ushing the sample with absolute
xylene. Finally, the pores of the sample are replaced with paraffi n (Aguilera and
Stanley, 1999; Humason, 1979).
The treated sample is then embedded in paraffi n wax. Each embedded sample is
sectioned with a microtome cutter, and the sliced sample is dried and then fi xed on a
glass slide. The fi nished slide is dyed to highlight the cell walls. Finally, microstruc-
tural images are obtained using a light microscope. A light microscopic image of the
sample is transformed from an RGB format to a black and white format before a
calculation of the FD is performed.
52527_C003.indd 7652527_C003.indd 76 10/3/2008 3:44:15 PM10/3/2008 3:44:15 PM
© 2009 by Taylor & Francis Group, LLC

Application of Image Analysis in Food Drying 77
The FD of a black and white image is calculated using the box counting method
(Quevedo et al., 2002). The boxes are composed of 4, 5, 10, 13, 26, 65, 130, and 260
pixels. The threshold values are between 0.5 and 0.8, and the value of the threshold
used for each image is chosen as the lowest value that can yield the clearest image
of the cell walls of the sample. Kerdpiboon and Devahastin (2007a,b) and Kerdpiboon
et al. (2007) performed FD calculations using MATLAB (version 6.5).
The normalized change of the FD was reported (Kerdpiboon and Devahastin,
2007a,b; Kerdpiboon et al., 2007) to compare the changing values of the FD of the
sample undergoing drying:
D ___
FD = DFD ____ FD0
(3.2)
�FD � FDt � FD0 (3.3)
where FD0 and FDt are the FDs of the fresh sample and the sample at any instant
(time) during drying, respectively.
Kerdpiboon and Devahastin (2007a,b) utilized two different drying methods, HAD,
and low-pressure superheated steam drying (LPSSD), to dry the sample (carrot
cube). Drying was performed at 60, 70, and 80°C and in the case of LPSSD at an
absolute pressure of 7 kPa. For each drying experiment, the drying process was
carried out up to a predetermined sampling time; that particular experiment was
terminated at that time. A new experimental run was then performed up to the next
predetermined sampling time. These steps were repeated until a complete drying
curve was obtained. At the end of each experimental run, the sample was taken out to
determine the moisture content, shrinkage (percentage change of the volume of the
sample compared with its original volume), and microstructural changes following
the steps described earlier.
Images from a light microscope (10¥ magnifi cation level) were used for FD
calculation. The FD of a fresh carrot (Figure 3.5a) was approximately 1.75, but the FD
of the sample increased upon drying. Initially, the cell walls of the carrot were round.
After a period of time, however, the moisture within the cells started to migrate to the
FIGURE 3.5 Microstructure of a carrot cube undergoing HAD at 60°C and 0.5 m/s after
(a) 0, (b) 150, and (c) 300 min.
52527_C003.indd 7752527_C003.indd 77 10/3/2008 3:44:15 PM10/3/2008 3:44:15 PM
© 2009 by Taylor & Francis Group, LLC

78 Advances in Food Dehydration
surface. As a result, moisture gradients started to develop, leading to internal stresses
and shrinkage of the cells (Figure 3.5b and c). The ruggedness of the cell walls
increased, leading to an increase in the FD of the cells, as expected.
The rates of change of the FD of carrot cubes undergoing HAD (Figure 3.6a
and b) and LPSSD (Figure 3.6c) were monitored. These rates were divided into
roughly two periods, consisting of linear and nonlinear rates of change. The drying
time that identifi ed the end point of the period where the FD rates of change were in
a linear fashion was also the same as the drying time that divided the drying curves
(not shown here) into the fi rst and second falling rate periods, which divided the
physical changes (in terms of the percentage of shrinkage) into rapid increase and
slow increase periods, respectively. However, the microstructural changes of the cell
walls of the carrots undergoing different drying techniques and conditions were
quite different (Figure 3.7). Carrots that were dried using HAD suffered more cell
structure deformation than with LPSSD.
To compare (and hence to generalize) the results, Kerdpiboon et al. (2007)
captured light microscopic images of potatoes at a 10¥ magnifi cation level. Each
image represented both cell walls and starch granules. However, because it was not
easy to describe the changes of the starch granules of potato cells through LM, the
starch granules were eliminated from every image. Thus, only the cell walls of the
potato were displayed within the images. Figure 3.8 represents the steps in treating
the images starting from an original image (Figure 3.8a), deleting the starch granules
image via the use of MATLAB (version 6.5; Figure 3.8b), and converting the image
without starch granules into a black and white format (Figure 3.8c). Some starch
granules that could not be deleted via the use of the program could be deleted
manually to allow better analysis of the image (Aguilera and Stanley, 1999).
The FD of fresh potato was approximately 1.61 and increased as the drying time
increased. For example, the FD of a potato cube undergoing drying at 60°C and an
air velocity of 1 m/s was approximately 1.70 and 1.73 at 180 and 420 min, respec-
tively. The FD of the potato cube did not change much compared to that of the carrot
cube undergoing HAD under the same conditions; the carrot FD varied between 1.75
and 1.91 (Kerdpiboon and Devahastin, 2007a,b).
The normalized changes of the FD could be used to monitor the physical changes
of carrots and potatoes during drying. For example, at an D ___
FD of approximately 0.06
the percentage of shrinkage of carrots was around 70 to 80% for all HAD (Figure 3.9)
and LPSSD cases (Figure 3.10). This type of relationship was also observed at other
D ___
FD and percentage of shrinkage values. These results are supported by the results
presented in Figure 3.11, which illustrates the microstructure of the samples at an
D ___
FD of 0.06 when drying with HAD at 60°C, 1 m/s, and 150 min; 70°C, 1 m/s, and
120 min; and 80°C, 1 m/s, and 90 min as well as with LPSSD at 60°C, 7 kPa, and
210 min; 70°C, 7 kPa, and 150 min; and 80°C, 7 kPa, and 90 min. All samples
displayed similar levels of shrinkage and had the same D ___
FD values. The deviations
in the percentage of shrinkage might have arisen from the errors that occurred during
the collection of the experimental data.
In comparison, the normalized changes of the FD were also used to monitor
the percentage of shrinkage of potatoes undergoing HAD at different conditions
52527_C003.indd 7852527_C003.indd 78 10/3/2008 3:44:15 PM10/3/2008 3:44:15 PM
© 2009 by Taylor & Francis Group, LLC

Application of Image Analysis in Food Drying 79
Drying time (min)
0 60 120 180 240 300
Drying time (min)
0 60 120 180 240 300
Drying time (min)
0 60 120 180 240 300 360 420
ΔFD
/FD
0
0.00
0.02
0.04
0.06
0.08
0.10
60°C, 0.5 m/s
70°C, 0.5 m/s
80°C, 0.5 m/s
ΔFD
/FD
0
0.00
0.02
0.04
0.06
0.08
0.10
60°C, 1 m/s
70°C, 1 m/s
80°C, 1 m/s
ΔFD
/FD
0
0.00
0.02
0.04
0.06
0.08
0.10
60°C 7 kPa
70°C 7 kPa
80°C 7 kPa
(a)
(b)
(c)
FIGURE 3.6 The �FD/FD0 of a carrot cube undergoing HAD at velocities of (a) 0.5 and
(b) 1 m/s and (c) LPSSD at 7 kPa.
52527_C003.indd 7952527_C003.indd 79 10/3/2008 3:44:15 PM10/3/2008 3:44:15 PM
© 2009 by Taylor & Francis Group, LLC

80 Advances in Food Dehydration
(Kerdpiboon et al., 2007). For instance, an D ___
FD value of ~0.06 again refers to around
70 to 80% shrinkage at all conditions of HAD. This therefore proved that the
D ___
FD could be used to monitor shrinkage (deformation) of both potatoes and carrots
undergoing HAD. Thus, it has the potential of being an indicator for describing
deformation of other products undergoing drying as well. Further investigation is
needed to confi rm this hypothesis.
3.4 APPLICATION OF X-RAY MICROTOMOGRAPHY IN FOOD DRYING
3.4.1 INTRODUCTION
X-ray tomography (from the Greek tomê, section and graphein, to describe) is a
nondestructive imaging technique that allows access to the internal structure of the
investigated object. The technique is based upon the local variation of the x-ray
attenuation coeffi cient of the object located along the x-ray path. Initially, x-ray com-
puted tomography was developed in the fi eld of medicine to allow nondestructive
examination of slices of the human body (Cormack, 1963). Since the fi rst system,
FIGURE 3.7 Microstructure of (a) fresh carrot cube and carrot cube dried until reaching
equilibrium moisture content using (b) HAD and (c) LPSSD.
FIGURE 3.8 Image processing of a potato cube: (a) original image, (b) image after deletion
of starch granules, and (c) black and white image.
52527_C003.indd 8052527_C003.indd 80 10/3/2008 3:44:15 PM10/3/2008 3:44:15 PM
© 2009 by Taylor & Francis Group, LLC

Application of Image Analysis in Food Drying 81
FIGURE 3.9 Relationship between the (�) percentage of shrinkage and (�) �FD/FD0 of
a carrot cube undergoing HAD at a velocity of 1 m/s and temperatures of (a) 60, (b) 70, and
(c) 80°C.
Drying time (min)
0 60 120 180 240 300
Drying time (min)
0 60 120 180 240 300
Drying time (min)
0 60 120 180 240 300
% S
hrin
kage
0
20
40
60
80
100
ΔFD
/FD
0
0.00
0.02
0.04
0.06
0.08
0.10
% S
hrin
kage
0
20
40
60
80
100
ΔFD
/FD
0
0.00
0.02
0.04
0.06
0.08
0.10
% S
hrin
kage
0
20
40
60
80
100
ΔFD
/FD
0
0.00
0.02
0.04
0.06
0.08
0.10
(b)
(a)
(c)
52527_C003.indd 8152527_C003.indd 81 10/3/2008 3:44:15 PM10/3/2008 3:44:15 PM
© 2009 by Taylor & Francis Group, LLC

82 Advances in Food Dehydration
built by the EMI Company in 1971 following Hounsfi eld’s design (Petrik et al.,
2006), the technique has been successfully applied in several domains such as
geology (Ueta et al., 2000) and hydrogeology (Wildenschild et al., 2002). In particu-
lar, it has been extensively applied in chemical engineering during the past decade to
determine the phase saturation spatial distribution within a process vessel (Marchot
et al., 1999; Toye et al., 1998).
FIGURE 3.10 Relationship between the (�) percentage of shrinkage and (�) �FD/FD0 of a
carrot cube undergoing LPSSD at temperatures of (a) 60, (b) 70, and (c) 80°C.
% S
hrin
kage
0
20
40
60
80
100
ΔFD
/FD
0
0.00
0.02
0.04
0.06
0.08
0.10
Drying time (min)
0 60 120 180 240 300 360 420
Drying time (min)
0 60 120 180 240 300 360 420
Drying time (min)
0 60 120 180 240 300 360 420
% S
hrin
kage
0
20
40
60
80
100
ΔFD
/FD
0
0.00
0.02
0.04
0.06
0.08
0.10
% S
hrin
kage
0
20
40
60
80
100
ΔFD
/FD
0
0.00
0.02
0.04
0.06
0.08
0.10
(b)
(a)
(c)
52527_C003.indd 8252527_C003.indd 82 10/3/2008 3:44:15 PM10/3/2008 3:44:15 PM
© 2009 by Taylor & Francis Group, LLC

Application of Image Analysis in Food Drying 83
Through the rapid development of microfocus x-ray sources and high-resolution
CCD detectors, the commercialization of microtomographs with improved resolution
(on the order of a few microns) has been realized, especially during the last 10 years.
Their main components are the x-ray source (usually of cone–beam type), rotating
stage, and detector (Figure 3.12a). At present, however, no x-ray microtomography
FIGURE 3.11 Microstructural images of a carrot cube at �FD/FD0 � 0.06.
52527_C003.indd 8352527_C003.indd 83 10/3/2008 3:44:16 PM10/3/2008 3:44:16 PM
© 2009 by Taylor & Francis Group, LLC

84 Advances in Food Dehydration
computed system has been integrated directly with laboratory drying equipment.
The follow-up of any drying process thus requires an interruption of the drying
process to scan the sample being dried.
For high-resolution (on the order of £1 μm) applications, an x-ray microtomo-
graphic investigation can be realized with the use of synchrotron facilities. The
x-ray beams produced in a synchrotron are parallel (Figure 3.12b), monochromatic,
and highly coherent. The main advantage of a monochromatic beam is the absence
of beam hardening artifacts, which results from preferential absorption of low energy
x-rays in the periphery of an object. The high spatial coherence of the beam produces
a phase contrast that can be exploited to detect material interfaces. For drying related
problems, the major drawback of synchrotron x-ray microtomography is the small
sample size that can be scanned. These systems are thus more suitable for the
characterization of the microstructure of a dried material than for the follow-up of
the drying process itself.
X-rays have the same wave–particle duality characteristics attributed to visible
light, that is, they can be described either as an electromagnetic wave or a particle or
FIGURE 3.12 Schematic views of (a) an x-ray microtomograph with cone–beam geometry
and (b) synchrotron microtomography.
(a)
(b)
Source
2-D detector
Source
Detector
52527_C003.indd 8452527_C003.indd 84 10/3/2008 3:44:16 PM10/3/2008 3:44:16 PM
© 2009 by Taylor & Francis Group, LLC

Application of Image Analysis in Food Drying 85
photon with energy proportional to frequency. For x-ray microtomography systems,
the source usually covers energies between 20 and 150 keV (1 eV corresponds to
1.602 ¥ 10–19 J). For the sake of brevity, the physical principles of x-rays are not
included here. Kak and Slaney (1988) and Brooks and Di Chiro (1976) provide
detailed physical principles of x-rays and x-ray tomography.
3.4.2 IMAGE RECONSTRUCTION
Once the transmission data, called projections, have been recorded at different angu-
lar positions, a reconstruction algorithm is used to produce 2-D cross-section images
of an object. The gray value of each pixel of the reconstructed image corresponds to
the linear attenuation coeffi cients (related to linear densities).
In the case of a planar parallel x-ray beam, a stabilized and discretized version of
the inverse radon transform known as the fi ltered backprojection algorithm (Brooks
and Di Chiro, 1976; Kak and Slaney, 1988) is used for image reconstruction. Parallel
geometry, as encountered within synchrotron facilities, leads to a shorter reconstruc-
tion time. In the cone–beam sources usually found in x-ray microtomographs, 3-D
reconstruction cone–beam algorithms such as Feldkamp’s (1984) are employed. The
resolution of the reconstructed images mainly depends on the source spot size, the
source–object–detector distance, and the defi nition of the detector.
Beam hardening artifacts can be observed when using polychromatic sources.
Because of preferential absorption of low energy x-rays in the periphery of an object,
the mean energy of the beam increases and leads to a decrease in the attenuation
coeffi cient. For a homogeneous object, the border of the reconstructed image will
appear denser than its center, giving rise to the so-called cupping effect. In addition,
strakes and fl ares can appear when the object contains hard elements or when strong
variations of the attenuation occur within the sample.
3.4.3 X-RAY MICROTOMOGRAPHY AND FOOD DRYING
3.4.3.1 Shrinkage Determination
Determining the level (and pattern) of shrinkage is of much importance to food
drying because the information on product shrinkage is necessary for many
subsequent calculations (e.g., calculation of drying rates) and for modeling purposes.
Shrinkage is also directly related to the acceptance of the product by consumers.
Except for some studies employing image analysis (Abud-Archila et al., 1999;
Fernandez et al., 2005; Lewicki and Piechnik, 1996; Mayor et al., 2005; Mulet et al.,
2000; Yan et al., 2008), most of the published works refer to the use of a caliper
(Moreira et al., 2002; Ratti, 1994) or volume displacement methods (Devahastin
et al., 2004; Ochoa et al., 2002a,b; Panyawong and Devahastin, 2007) to determine
shrinkage of food samples during drying. With its accuracy and its nondestructive
nature, x-ray tomo graphy coupled with image analysis constitutes an alternative for
an accurate 3-D determination of shrinkage (Lewicki and Witrowa, 1992; Lozano
et al., 1983; Ratti, 1994). To follow shrinkage, however, it is still necessary to inter-
rupt the drying process at different sampling periods to take the sample out of the
dryer for microtomographic analysis. However, these repeated interruptions have
52527_C003.indd 8552527_C003.indd 85 10/3/2008 3:44:17 PM10/3/2008 3:44:17 PM
© 2009 by Taylor & Francis Group, LLC

86 Advances in Food Dehydration
proved to have a negligible effect on the drying kinetics (Léonard et al., 2002). The
volume of the sample can then be obtained by applying image analysis algorithms on
the 2-D or 3-D reconstructed images (Léonard et al., 2004).
3.4.3.2 Crack Detection and Quantifi cation
When drying food materials, the fi nal quality of the products sometimes relies on the
absence of cracks or product breakage. This is especially true in rice (Abud-Archila
et al., 1999; Zhang et al., 2005), pasta (Andrieu and Stamatopoulos, 1986a; Andrieu
et al., 1988; Antognelli, 1980; Sannino et al., 2005), wheat grains (Wozniak et al.,
1999), or noodles (Inazu et al., 2005). Therefore, the detection and quantifi cation of
cracks during drying is essential for quality criteria estimation or model validation.
x-ray microtomography can be effi ciently used to follow crack formation (Job et al.,
2006; Léonard et al., 2004) and to help optimize the drying process. Following the
interrupted drying methodology described for shrinkage measurement, it is possible
to determine the drying time and the location corres ponding to crack onset. A simple
adaptation of the image analysis allows detection and quantifi cation of the crack
extent from the same set of 2-D reconstructed images (Léonard et al., 2003).
3.4.3.3 Internal Moisture Profi le Determination
In general, the determination of internal moisture profi les, which develop in a mate-
rial during drying, is rather complicated, especially when steep gradients are present
at the external sample surface. Moisture profi les within the drying material have been
mainly determined either by destructive techniques such as slicing (Andrieu and
Stamatopoulos, 1986b; Litchfi eld and Okos, 1992) or by a sophisticated nondestruc-
tive method such as NMR or MRI (Frias et al., 2002; Rongsheng et al., 1992; Ruan
et al., 1991; Ruiz-Cabrera et al., 2004). These technical diffi culties have limited pos-
sibility to validate many recently developed advanced mathematical models because
direct comparison between actual and predicted moisture profi les is almost impos-
sible (Waananen et al., 1993). In contrast, using x-ray microtomography together
with an appropriate calibration method makes it possible to accurately determine
internal moisture profi les, provided that the attenuation properties of the solid matrix
and those of moisture are suffi ciently different (Léonard et al., 2005). This measure-
ment can be performed simultaneously with the determination of shrinkage or cracks,
because the set of reconstructed images is the same.
3.4.3.4 Microstructure Characterization
One of the most interesting applications of x-ray microtomography in the context of
food drying is to characterize the microstructure of a sample after drying. Although
SEM is traditionally used to analyze the microstructure of dried food materials
(Aguilera and Stanley, 1999), the technique does not give reliable information on the
total pore volume and pore size distribution of the sample. Indeed, because only
small parts can be investigated at a time, measurements must be repeated in order to
give statistically relevant results. Moreover, SEM fails to describe the whole 3-D
morphology because only 2-D information is obtained.
52527_C003.indd 8652527_C003.indd 86 10/3/2008 3:44:17 PM10/3/2008 3:44:17 PM
© 2009 by Taylor & Francis Group, LLC

Application of Image Analysis in Food Drying 87
In contrast, there are several advantages of using x-ray microtomography to
characterize the microstructure of dried products. The technique does not require
any specifi c sample preparation and is nondestructive as opposed to SEM, which
requires cutting of a sample after impregnation. X-ray microtomography also yields
a 3-D characterization of the internal structure of the sample versus the 2-D struc-
ture obtained by SEM. The technique is particularly suitable to materials exhibiting
larger pore diameters (dp), for which classical measurement methods such as nitrogen
adsorption (2 nm � dp � 50 nm) or mercury porosimetry (7.5 nm � dp � 150 μm)
cannot be applied.
An illustrative example of the use of x-ray microtomography in microstructural
evaluation of a dried food product was provided by Léonard et al. (2008). They
applied the technique to evaluate the effects of different drying methods (LPSSD
and vacuum drying), as well as far-infrared radiation (FIR) to assist these drying
processes, on the microstructure of banana slices.
Projections (assembling of transmitted beams) were recorded for several angu-
lar positions by rotating the sample between 0 and 180°; the rotation step was fi xed
at 0.4°. Then, a backprojection algorithm was used to reconstruct 2-D or 3-D
images, depending on the method used. In the 2-D images, each pixel had a gray-
level value corresponding to the local attenuation coeffi cient. A Skyscan-1172
high-resolution desktop micro-CT system (Skyscan, Kontich, Belgium) was used
in Léonard et al.’s (2008) work. The cone–beam source was operated at 60 kV and
167 μA. The detector was a 2-D, 1048 ¥ 2000 pixel, 16-bit x-ray camera. The
source–object–camera distance was adjusted to produce images with a 15 μm pixel
size. Because of the sample height, three successive subscans had to be performed,
each corresponding to one third of the slice height. For each angular position,
a radiograph of the sample (instead of a 1-D projection of a cross section) was
recorded by a 2-D camera.
Figure 3.13 shows a typical radiograph obtained after the three subscans were
linked together. The Feldkamp backprojection algorithm was used to reconstruct
2-D images of the cross sections. For each banana slice, about 200 cross sections,
separated by 150 μm, were reconstructed. Figure 3.14a and b show typical gray-level
cross sections obtained for two vertical positions in the sample.
Three-dimensional images of the samples were built by stacking the 200 cross
sections. The 3-D image was preliminary segmented by assigning a value of 1 to
all pixels whose intensity was below a given gray tone value and 0 to the others,
which implies fi xing a threshold on the 3-D gray-level image. This threshold was
determined through the use of an automatic threshold based on the entropy of the
histogram (Sahoo et al., 1988) calculated for each 2-D cross section. After thresh-
olding, some small black holes were still present in the image and were removed by
applying a closing fi lter (Soille, 1999). Figure 3.14c and d show the result of the
segmentation process.
Porosity, which is defi ned as the fraction of voxels of the image that belong to the
pores, could be evaluated from the 3-D processed binary images. Because the 3-D
images of the banana slices presented a continuous and rather disordered pore struc-
ture in which it was not possible to assign a precise geometry to each pore, a standard
granulometry measurement could not be applied. To quantify the larger pores, the
52527_C003.indd 8752527_C003.indd 87 10/3/2008 3:44:17 PM10/3/2008 3:44:17 PM
© 2009 by Taylor & Francis Group, LLC

88 Advances in Food Dehydration
opening size distribution (Soille, 1999), which allows assigning a size to both con-
tinuous and individual particles, was calculated. When an opening transformation
was performed on a binary image with a structuring element of size λ, the image was
replaced by an envelope of all structuring elements inscribed in its objects. Spheres
of increasing radii λ (approximated by octahedra) were used. As the size of the sphere
increased, larger parts of the objects were removed by the opening transformation.
Opening could thus be considered as equivalent to a physical sieving process.
After the microtomographic and image analysis steps are performed, the micro-
structural and/or pore size and pore size distribution information can be obtained.
As an illustrative example, Figure 3.15a and b show the histograms comparing the
pore size distribution of the samples obtained at 80 and 90°C with LPSSD and
LPSSD-FIR, respectively. These fi gures clearly show that the pore sizes were non-
normally distributed but pores with sizes lower than 100 μm prevailed. The use of
FIR as well as a higher drying temperature resulted in a shift of the distribution
toward larger pore sizes for both drying techniques.
3.5 CLOSING REMARKS
Because of the many advantages of image analysis, it has been increasingly used in
food research and applications. More recently, the technique has also proved useful
in food drying research and applications. Image analysis, through the use of CVSs,
has been successfully applied to determine the changes in color, shape, and size
of different foods undergoing drying. More advanced techniques such as SEM or
MRI have been useful for the microstructural analysis of foods undergoing drying.
FIGURE 3.13 Radiograph of a dried banana slice.
52527_C003.indd 8852527_C003.indd 88 10/3/2008 3:44:17 PM10/3/2008 3:44:17 PM
© 2009 by Taylor & Francis Group, LLC

Application of Image Analysis in Food Drying 89
Other techniques including the combination of image and fractal analysis and x-ray
microtomography have also provided more accurate and comprehensive microstruc-
tural results than the more conventional microscopic methods in some cases. We hope
that this chapter has provided some ideas on how different image analysis techniques
can be applied to food drying research and applications and that the reader will fi nd
more ways to utilize the benefi ts of these techniques to a higher level.
NOMENCLATURE
VARIABLES
dp pore diameter
Nr number of boxes
r size of box
FIGURE 3.14 (a, b) Gray-level cross sections and (c, d) the corresponding binary images
after thresholding.
52527_C003.indd 8952527_C003.indd 89 10/3/2008 3:44:17 PM10/3/2008 3:44:17 PM
© 2009 by Taylor & Francis Group, LLC

90 Advances in Food Dehydration
GREEK LETTERS
l size of structuring element in a binary image
SUBSCRIPTS
0 initial or fresh sample
t time instant
Fre
quen
cy
0.0
0.1
0.2
0.3
0.4
0.5
(a)
Pore diameter (μm)0 100 200 300 400 500
Pore diameter (μm)0 100 200 300 400 500
Fre
quen
cy
0.0
0.1
0.2
0.3
0.4
0.5
80°C90°C
80°C90°C
(b)
FIGURE 3.15 Pore size distributions of the samples dried at 80 and 90°C with (a) LPSSD
and (b) LPSSD-FIR.
52527_C003.indd 9052527_C003.indd 90 10/3/2008 3:44:17 PM10/3/2008 3:44:17 PM
© 2009 by Taylor & Francis Group, LLC

Application of Image Analysis in Food Drying 91
ABBREVIATIONS
CCD charge-coupled device
CLSM confocal laser scanning microscopy
CVS computer vision system
ESEM environmental scanning electron microscopy
FD fractal dimension
�FD normalized change of fractal dimension
FIR far-infrared radiation
HAD hot-air drying
HSI hue–saturation–intensity
HSV hue–saturation–value
LM light microscopy
LPSSD low-pressure superheated steam drying
LPSSD-FIR low-pressure superheated steam drying with far-infrared radiation
MRI magnetic resonance imaging
NMR nuclear magnetic resonance
SEM scanning electron microscopy
REFERENCES
Abud-Archila, M., Bonazzi, C., Aichoune, H., and Heyd, B., Image analysis of shrinkage
and cracking of rice during convective drying, in Récents Progrès en Génie des Procédés, Bimbenet, J.J., Ed., Lavoisier Technique et Documentation, Paris, 1999,
pp. 411–418.
Acevedo, N.C., Briones, V., Buera, P., and Aguilera, J.M., Microstructure affects the rate
of chemical, physical and color changes during storage of dried apple discs, J. Food Eng., 85, 222–231, 2008.
Aguilera, J.M. and Stanley, D.W., Microstructural Principles of Food Processing and Engineering, Aspen Publishers, Gaithersburg, MD, 1999.
Alamilla-Beltrán, L., Chanona-Pérez, J., Jiménez-Aparicio, A., and Gutiérrez-López, G.,
Description of morphological changes of particles along spray drying, J. Food Eng., 67, 179–184, 2005.
Andrieu, J. and Stamatopoulos, A., Durum wheat pasta drying kinetics, Lebensm.-Wiss. Technol., 19, 448–456, 1986a.
Andrieu, J. and Stamatopoulos, A., Moisture and heat transfer modelling during durum wheat
pasta drying, in Drying ’86, Mujumdar, A.S., Ed., Hemisphere Publishing, Washington,
DC, pp. 492–498, 1986b.
Andrieu, J., Boivin, M., and Stamatopoulos, A., Heat and mass transfer modeling during
pasta drying, application to crack formation risk prediction, in Handbook of Preconcentration and Drying of Food Materials, Bruin, S., Ed., Elsevier Science,
Amsterdam, 1988, pp. 183–192.
Antognelli, C., The manufacture and applications of pasta as a food and as a food ingredient:
A review, J. Food Technol., 15, 125–145, 1980.
Antonelli, A., Cocchi, M., Fava, P., Foca, G., Franchini, F.C., Manzini, D., and Ulrici, A.,
Automated evaluation of food colour by means of multivariate image analysis coupled
to a wavelet-based classifi cation algorithm, Anal. Chim. Acta, 515, 3–13, 2004.
Barletta, B.J. and Canovas, V.B., An attrition index to assess fi nes formation and particle size
reduction in tapped agglomerated food powders, Powder Technol., 77, 89–93, 1993.
Brooks, R.A. and Di Chiro, G., Principles of computer assisted tomography, Phys. Med. Biol., 21, 689–732, 1976.
52527_C003.indd 9152527_C003.indd 91 10/3/2008 3:44:17 PM10/3/2008 3:44:17 PM
© 2009 by Taylor & Francis Group, LLC

92 Advances in Food Dehydration
Chanola, P.J.J., Alamilla, B.L., Farrera, R.R.R., Quevedo, R., Aguilera, J.M., and Gutierrez, L.G.F.,
Description of the convective air drying of a food model by means of the fractal theory,
Food Sci. Technol. Int., 9, 207–213, 2003.
Chen, X.D., Guest editorial, Dry. Technol., 24, 121–122, 2006.
Chevalier, D., Le Bail, A., and Ghoul, M., Freezing and ice crystals formed in a cylindrical
food model: Part I. Freezing at atmospheric pressure, J. Food Eng., 46, 277–285,
2000.
Cormack, A.M., Representation of a function by its line integrals, with some radiological
applications, J. Appl. Phys., 34, 2722–2727, 1963.
Dan, H., Azuma, T., and Kohyama, K., Characterization of spatiotemporal stress distribution
during food fracture by image texture analysis methods, J. Food Eng., 81, 429–436,
2007.
Devahastin, S., Suvarnakuta, P., Soponronnarit, S., and Mujumdar, A.S., A comparative study
of low-pressure superheated steam and vacuum drying of a heat-sensitive material,
Dry. Technol., 22, 1845–1867, 2004.
Devaux, M.-F., Taralova, L., Levy-Vehel, J., Bonnin, E., Thibault, J.-F., and Guillon, F.,
Contribution of image analysis to the description of enzymatic degradation kinetics for
particulate food material, J. Food Eng., 77, 1096–1107, 2006.
Dziuba, J., Babuchowski, A., Smoczynski, M., and Smietana, Z., Fractal analysis of caseinate
structure, Int. Dairy J., 9, 287–292, 1999.
Feldkamp, L.A., Practical cone–beam algorithm, J. Opt. Soc. Am., 1, 612–619, 1984.
Fernández, L., Castillero, C., and Aguilera, J.M., An application of image analysis to
dehydration of apple discs, J. Food Eng., 67, 185–193, 2005.
Frias, J.M., Foucat, L., Bimbenet, J.J., and Bonazzi, C., Modeling of moisture profi les in
paddy rice during drying mapped with magnetic resonance imaging, Chem. Eng. J., 86,
173–178, 2002.
Ghosh, P.K., Jayas, D.S., Gruwel, M.L.H., and White, N.D.G., A magnetic resonance imaging
study of wheat drying kinetics, Biosyst. Eng., 97, 189–199, 2007.
Humason, G.L., Animal Tissue Techniques, 4th ed., W.H. Freeman, San Francisco, CA,
1979.
HunterLab, http://www.hunterlab.com, November 2007.
ICC, http://www.color.org, November 2007.
Imaging Research Inc., http://www.imagingresearch.com, November 2007.
Inazu, T., Iwasaki, K., and Furuta, T., Stress and crack prediction during drying of Japanese
noodle (udon), Int. J. Food Sci. Technol., 40, 621–630, 2005.
Jennane, R., Harba, R., Lemineur, G., Bretteil, S., Estrade, A., and Benhamou, C.L.,
Estimation of the 3D self-similarity parameter of trabecular bone from its 2D projec-
tion, Med. Image Anal., 11, 91–98, 2007.
Job, N., Sabatier, F., Pirard, J.P., Crine, M., and Léonard, A., Towards the production of
carbon xerogel monoliths by optimizing convective drying conditions, Carbon, 44,
2534–2542, 2006.
Kak, A.C. and Slaney, M., Principles of Computerized Tomographic Imaging, IEEE Press,
New York, 1988.
Kerdpiboon, S. and Devahastin, S., Fractal characterization of some physical properties of a
food product under various drying conditions, Dry. Technol., 25, 135–146, 2007a.
Kerdpiboon, S. and Devahastin, S., Erratum to fractal characterization of some physical
properties of a food product under various drying conditions, Dry. Technol., 25, 1127,
2007b.
Kerdpiboon, S., Devahastin, S., and Kerr, W.L., Comparative fractal characterization of
physical changes of different food products during drying, J. Food Eng., 83, 570–580,
2007.
52527_C003.indd 9252527_C003.indd 92 10/3/2008 3:44:17 PM10/3/2008 3:44:17 PM
© 2009 by Taylor & Francis Group, LLC

Application of Image Analysis in Food Drying 93
Khraisheh, M.A.M., Cooper, T.J.R., and Magee, T.R.A., Shrinkage characteristics of potatoes
dehydrated under combined microwave and convective air conditions, Dry. Technol., 15, 1003–1022, 1997.
Léonard, A., Blacher, S., Marchot, P., and Crine, M., Use of x-ray microtomography to follow
the convective heat drying of wastewater sludges, Dry. Technol., 20, 1053–1069,
2002.
Léonard, A., Blacher, S., Marchot, P., Pirard, J.P., and Crine, M., Image analysis of x-ray
microtomograms of soft materials during convective drying, J. Microsc., 212, 197–204,
2003.
Léonard, A., Blacher, S., Marchot, P., Pirard, J.P., and Crine, M., Measurement of shrinkage
and cracks associated to convective drying of soft materials by x-ray microtomography,
Dry. Technol., 22, 1695–1708, 2004.
Léonard, A., Blacher, S., Marchot, P., Pirard, J.P., and Crine, M., Moisture profi les determina-
tion during convective drying using x-ray microtomography, Can. J. Chem. Eng., 83,
127–131, 2005.
Léonard, A., Blacher, S., Nimmol, C., and Devahastin, S., Effect of far-infrared radiation
assisted drying on microstructure of banana slice: An illustrative use of x-ray microto-
mography in microstructural evaluation of a food product, J. Food Eng., 85, 154–162,
2008.
Lewicki, P.P. and Piechnik, H., Computer image analysis of shrinkage during food dehydra-
tion, paper presented at the 10th International Drying Symposium, Krakow, Poland,
1996.
Lewicki, P.P. and Witrowa, D., Heat and mass transfer in externally controlled drying of
vegetables, in Drying ’92, Mujumdar, A.S., Ed., Elsevier, Amsterdam, 1992, pp.
884–891.
Litchfi eld, J.B. and Okos, M.R., Moisture diffusivity in pasta during drying, J. Food Eng., 17,
117–142, 1992.
Locht, http://www.machinevisiononline.org/public/articles/articles.cfm?cat=50 (November
2007).
Louka, N., Juhel, F., Fazilleau, V., and Loonis, P., A novel colorimetry analysis used to
compare different drying fi sh processes, Food Control, 15, 327–334, 2004.
Lozano, J.E., Rotstein, E., and Urbicain, M.J., Shrinkage, porosity and bulk density of food-
stuffs at changing moisture contents, J. Food Sci., 48, 1497–1553, 1983.
Mandelbrot, B.M., The Fractal Geometry of Nature, Freeman Press, New York, 1983.
Marchot, P., Toye, D., Crine, M., Pelsser, A.M., and L’Homme, G., Investigation of liquid
maldistribution in packed columns by x-ray tomography, Chem. Eng. Res. Design, 77,
511–518, 1999.
Martynenko, A.I., Computer-vision system for control of drying processes, Dry. Technol., 24,
879–888, 2006.
Mayor, L., Silva, M.A., and Sereno, A.M., Microstructural changes during drying of apple
slices, Dry. Technol., 23, 2261–2276, 2005.
Mendoza, F., Dejmek, P., and Aguilera, J.M., Calibrated color measurements of agricultural
foods using image analysis, Postharvest Biol. Technol., 41, 285–295, 2006.
Moreira, R., Figueiro, A., and Sereno, A.A., Shrinkage of apple disks during drying by warm
air convection and freeze drying, Dry. Technol., 18, 279–294, 2002.
Mulet, A., Garcia-Reverter, J., Bon, J., and Berna, A., Effect of shape on potato and caulifl ower
shrinkage during drying, Dry. Technol., 18, 1201–1219, 2000.
National Institutes of Health, http://rsb.info.nih.gov/ij, November 2007.
Ochoa, M.R., Kesseler, A.G., Pirone, B.N., Marquez, C.A., and De Michelis, A., Shrinkage
during convective drying of whole rose hip fruits (Rosa rubiginosa L.), Lebensm.-Wiss. Technol., 35, 400–406, 2002a.
52527_C003.indd 9352527_C003.indd 93 10/3/2008 3:44:17 PM10/3/2008 3:44:17 PM
© 2009 by Taylor & Francis Group, LLC

94 Advances in Food Dehydration
Ochoa, M.R., Kesseler, A.G., Pirone, B.N., Marquez, C.A., and De Michelis, A., Volume and
area shrinkage during dehydration of whole sour cherry fruits (Prunus cerasus) during
dehydration, Dry. Technol., 20, 147–156, 2002b.
Panyawong, S. and Devahastin, S., Determination of deformation of a food product under-
going different drying methods and condition via evolution of a shape factor, J. Food Eng., 78, 151–161, 2007.
Pedreschi, F. and Aguilera, J.M., Characterization of food surfaces using scale-sensitive
fractal analysis, J. Food Process Eng., 23, 127–143, 2000.
Petrik, V., Apok, V., Britton, J.A., Bell, B.A., and Papadopoulos, M.C., Godfrey Hounsfi eld
and the dawn of computed tomography, Neurosurgery, 58, 780–786, 2006.
Plataniotis, K.N. and Venetsanopoulos, A.N., Color Image Processing and Application,
Springer, Berlin, 2000.
Quevedo, R., Carlos, L.-G., Aguilera, J.M., and Cadoche, L. Description of food surfaces and
microstructural changes using fractal image texture analysis. J. Food Eng. 53, 361–371,
2002.
Rahman, M.S., Physical meaning and interpretation of fractal dimensions of fi ne particles
measured by different methods, J. Food Eng., 32, 447–456, 1997.
Ramos, I.N., Silva, C.L., Sereno, A.M., and Aguilera, J.M., Quantifi cation of microstructural
changes during fi rst stage air drying of grape tissue, J. Food Eng., 62, 159–164, 2004.
Ratti, C., Shrinkage during drying of foodstuffs, J. Food Eng., 23, 91–95, 1994.
Rongsheng, R., Litchfi eld, J.B., and Eckhoff, S.R., Simultaneous and non-destructive
measurement of transient moisture profi les and structural changes in corn kernels
during steeping using microscopic nuclear magnetic resonance imaging, Cereal Chem., 69, 600–606, 1992.
Ros, F., Guillaume, S., Rabatel, G., and Sevila, F., Recognition of overlapping particles in
granular product images using statistics and neural networks, Food Control, 6, 37–43,
1995.
Ruan, R., Schmidt, S.J., Schmidt, A.R., and Litchfi eld, J.B., Non-destructive measurement of
transient moisture profi les and moisture diffusion coeffi cient in a potato during drying
and absorption by NMR imaging, J. Food Process Eng., 14, 297–313, 1991.
Rubnov, M. and Saguy, I.S., Fractal analysis and crust water diffusivity of a restructured
potato product during deep-fat frying, J. Food Sci., 62, 135–154, 1997.
Ruiz-Cabrera, M.A., Gou, P., Foucat, L., Renou, J.P., and Daudin, J.D., Water transfer analy-
sis in pork meat supported by NMR imaging, Meat Sci., 67, 169–178, 2004.
Russ, J.C., Image Analysis of Food Microstructure, CRC Press, Boca Raton, FL, 2005.
Sahoo, P.K., Soltani, S., Wong, K.C., and Chen, Y.C., A survey of thresholding techniques,
Comput. Vision Graph. Image Process., 41, 233–260, 1988.
Sannino, A., Capone, S., Siciliano, P., Ficarella, A., Vasanelli, L., and Maffezzoli, A.,
Monitoring the drying process of lasagna pasta through a novel sensing device-based
method, J. Food Eng., 69, 51–59, 2005.
Soille, P., Morphological Image Analysis—Principles and Applications, Springer, Berlin,
1999.
The GIMP Team, http://www.gimp.org, November 2007.
Toye, D., Marchot, P., Crine, M., Pelsser, A.-M., and L’Homme, G., Local measurements of
void fraction and liquid holdup in packed columns using x-ray computed tomography,
Chem. Eng. Process., 37, 511–520, 1998.
Turner, M.J., Blackledge, J.M., and Andrews, P.R., Fractal Geometry in Digital Imaging,
Academic Press, New York, 1998.
Ueta, K., Tani, K., and Kato, T., Computerized x-ray tomography analysis of three-
dimensional fault geometries in basement-induced wrench faulting, Eng. Geol., 56,
197–210, 2000.
University of Texas Health Science Center, http://ddsdx.uthscsa.edu/dig, November 2007.
52527_C003.indd 9452527_C003.indd 94 10/3/2008 3:44:17 PM10/3/2008 3:44:17 PM
© 2009 by Taylor & Francis Group, LLC

Application of Image Analysis in Food Drying 95
Varela, P., Aguilera, J.M., and Fiszman, S., Quantifi cation of fracture properties and micro-
structural features of roasted Marcona almonds by image analysis, Food Sci. Technol., 41, 10–17, 2008.
Waananen, K.M., Litchfi eld, J.B., and Okos, M.R., Classifi cation of drying models for porous
solids, Dry. Technol., 11, 1–40, 1993.
White, K.L. and Bell, L.N., Glucose loss and Maillard browning in solids as affected by
porosity and collapse, J. Food Sci., 64, 1010–1014, 1999.
Wildenschild, D., Vaz, C.M.P., Rivers, M.L., Rikard, D., and Christensen, B.S.B., Using x-ray
computed tomography in hydrology: Systems, resolutions, and limitations, J. Hydrol., 267, 285–297, 2002.
Wozniak, W., Niewczas, J., and Kudra, T., Internal damage vs. mechanical properties of
microwave-dried wheat grains, Int. Agrophys., 13, 259–268, 1999.
Yan, Z., Sousa-Gallagher, M.J., and Oliveira, F.A., Shrinkage and porosity of banana,
pineapple and mango slices during air-drying, J. Food Eng., 84, 430–440, 2008.
Zhang, Q., Yang, W., and Sun, Z., Mechanical properties of sound and fi ssured rice kernels
and their implications for rice breakage, J. Food Eng., 68, 65–72, 2005.
52527_C003.indd 9552527_C003.indd 95 10/3/2008 3:44:17 PM10/3/2008 3:44:17 PM
© 2009 by Taylor & Francis Group, LLC

52527_C003.indd 9652527_C003.indd 96 10/3/2008 3:44:17 PM10/3/2008 3:44:17 PM
© 2009 by Taylor & Francis Group, LLC

97
4 Dehydration and Microstructure
Mohammad Shafi ur Rahman
CONTENTS
4.1 Introduction ............................................................................................. 98
4.2 Food Microstructure Parameters ............................................................ 98
4.2.1 Porosity ........................................................................................ 98
4.2.1.1 Open Pore Porosity ......................................................... 98
4.2.1.2 Closed Pore Porosity ...................................................... 99
4.2.1.3 Apparent Porosity ........................................................... 99
4.2.1.4 Bulk Porosity .................................................................. 99
4.2.1.5 Bulk Particle Porosity ..................................................... 99
4.2.1.6 Total Porosity ................................................................. 99
4.2.1.7 Pore Size Distribution .................................................... 99
4.2.2 Characteristics of Pores ............................................................... 100
4.3 Measurement Methods ............................................................................ 100
4.3.1 Porosity ........................................................................................ 100
4.3.1.1 Direct Method ................................................................ 100
4.3.1.2 Optical Microscopic Method .......................................... 100
4.3.1.3 Density Method .............................................................. 100
4.3.1.4 X-Ray Microtomography (XMT) ................................... 100
4.3.1.5 Mercury Porosimetry ..................................................... 101
4.3.1.6 Gas Adsorption Method ................................................. 105
4.4 Creation and Collapse of Microstructure by
Drying Methods ...................................................................................... 105
4.4.1 Mechanisms ................................................................................. 105
4.4.1.1 Mechanisms of Collapse ................................................ 105
4.4.1.2 Glass-Transition Concept ............................................... 108
4.4.1.3 Rahman Hypothesis ....................................................... 110
4.4.2 Prediction ..................................................................................... 111
4.4.3 Theoretical Predictions ................................................................ 113
4.4.3.1 Density and Shrinkage ................................................... 113
4.4.3.2 Porosity Prediction ......................................................... 115
4.5 Quality Creation and Deterioration by Microstructure .......................... 117
4.6 Conclusion ............................................................................................... 118
52527_C004.indd 9752527_C004.indd 97 10/3/2008 3:47:30 PM10/3/2008 3:47:30 PM
© 2009 by Taylor & Francis Group, LLC

98 Advances in Food Dehydration
Nomenclature ..................................................................................................... 119
Variables ................................................................................................. 119
Greek Letters .......................................................................................... 119
References .......................................................................................................... 120
4.1 INTRODUCTION
Structure is the manner or form of building of food components. In addition to
natural structures, man-made structured foods use assembly or structuring processes
to build product microstructure from the microscopic level details of each component
(such as water, starch, sugars, proteins, lipids, and salts) or cells up to the molecular
level. As food materials undergo different treatments or processes, their microstruc-
ture may be preserved or destroyed and develop useful processed products. Drying
methods create or destroy the microstructure of foods by specifi c distribution of
component phases. This chapter reveals the food microstructural parameters, porosity,
and characteristics of pores by defi ning the parameters and discussing their
measurement methods, mechanisms involved, prediction methods, and relevance to
the quality of dried food products.
4.2 FOOD MICROSTRUCTURE PARAMETERS
4.2.1 POROSITY
Porosity indicates the volume fraction of void space or air in a material, which is
defi ned as
porosity � air or void volume
_____ total volume
(4.1)
Different forms of porosity are also used in food process calculations and food
product characterization (Rahman, 1995, 2005). These are defi ned in the following
sections.
4.2.1.1 Open Pore Porosity
The open pore porosity (eop) is the volume fraction of pores connected to the exterior
boundary of a material:
eop � volume of open pore
____________________ total volume of material
� 1 � ra __ rp
(4.2)
where and ra and rp are the apparent and particle density (kg/m3), respectively.
There are two types of open pores: one type is connected to the exterior boundary
only (noninterconnected), and the other type is connected to the other open pores
and to the exterior geometric boundary (interconnected). Interconnected pores
are accessible on both ends, but noninterconnected pores are accessible from only
one end.
52527_C004.indd 9852527_C004.indd 98 10/3/2008 3:47:30 PM10/3/2008 3:47:30 PM
© 2009 by Taylor & Francis Group, LLC

Dehydration and Microstructure 99
4.2.1.2 Closed Pore Porosity
The closed pore porosity (ecp) is the volume fraction of pores closed inside the
material, which are not connected to the exterior boundary of the material. They are
also termed dead-end or blind pores and can be defi ned as
ecp � volume of closed pores
____________________ total volume of material
� 1 � rp
___ rm (4.3)
where rm is the material density (kg/m3). Inaccessible closed pores are enclosed
within a solid or liquid phase and in many instances behave as part of the solid.
4.2.1.3 Apparent Porosity
The apparent porosity (ea) is the volume fraction of total air or void space inside the
material boundary (ea � eop � ecp). It is defi ned as
ea � volume of all pores
____________________ total volume of material
� 1 � ra ___ rm
(4.4)
4.2.1.4 Bulk Porosity
The bulk porosity (eB) is the volume fraction of voids outside the boundary of
individual particles when packed or stacked as bulk:
eB � volume of voids outside material boundary
___________________________________ total bulk volume of stacked materials
� 1 - rB ___ ra
(4.5)
where rB is the bulk density (kg/m3).
4.2.1.5 Bulk Particle Porosity
The bulk particle porosity (eBP) is the volume fraction of voids outside the individual
particle and open pore when packed or stacked as bulk (eBP � eB � eop):
eBP � 1 - rB ___ rp
(4.6)
4.2.1.6 Total Porosity
The total porosity (eT) is the total volume fraction of air or void space (i.e., inside and
outside of the materials) when the material is packed or stacked as bulk.
eT � ea + eB � eop + ecp + eB � ecp + eBP (4.7)
4.2.1.7 Pore Size Distribution
Porosity is a global characteristics and it does not characterize a pore’s size, shape,
orientation, and population. When pore or particle size and population varies, size
distribution is most commonly used to characterize this variation.
52527_C004.indd 9952527_C004.indd 99 10/3/2008 3:47:30 PM10/3/2008 3:47:30 PM
© 2009 by Taylor & Francis Group, LLC

100 Advances in Food Dehydration
4.2.2 CHARACTERISTICS OF PORES
In addition to porosity and pore size distribution, other characteristics are used to identify
the types of pores, such as the shape, thickness of walls, and building structure of pores.
Microscopic as well as other instruments are used to explore these characterisitics.
4.3 MEASUREMENT METHODS
4.3.1 POROSITY
Porosity can be measured by a direct method or an optical microscopic method
followed by image analysis and estimated from density data.
4.3.1.1 Direct Method
In the direct method the bulk volume of a piece of porous material is measured after
compacting the material in order to destroy all of its voids and then measure the
volume. The porosity can be determined from the difference of the two volumes that
are measured. This method can be applied if the material is very soft and there is no
repulsive or attractive force present between the surfaces of solid particles.
4.3.1.2 Optical Microscopic Method
In the optical microscopic method the porosity can be determined from the micro-
scopic view of a random section of the porous medium. This method is reliable if the
sectional [two-dimensional (2-D)] porosity is same as the three-dimensional (3-D)
porosity. Image analysis techniques are used to estimate quantitative results. A novel
technique was also proposed for measuring the 3-D structure using a microsliced
image processing system (Sagara, 2003). This system constructs the 3-D image
based on the imaged data of exposed cross sections obtained by multislicing a sample
with a minimum thickness of 1 μm. Then the internal structure is displayed through
computer simulation.
4.3.1.3 Density Method
Porosity can also be estimated from the densities of the materials from Eqs. (4.2) to
(4.6). Alternatively, pore volume can be measured directly by liquid or gas displace-
ment methods. Interconnected pores can be identifi ed using one-dimensional (1-D)
to 3-D directions. In the case of a cube, a 1-D system can be achieved by coating all
fi ve sides of the sample before measurement. If all open pores are interconnected,
even when the fl uid is introduced in one direction, fl ow takes place in 3-D.
4.3.1.4 X-Ray Microtomography (XMT)
Low-resolution x-ray tomography or computerized axial tomography is widely used
in medicine to image body tissues in a noninvasive manner. This technology, which
originated in the 1970s, has a conventional resolution of ~100μm, which is insuffi -
cient to explore the microstructure of many types of foam. The use of very high
52527_C004.indd 10052527_C004.indd 100 10/3/2008 3:47:31 PM10/3/2008 3:47:31 PM
© 2009 by Taylor & Francis Group, LLC

Dehydration and Microstructure 101
energy x-rays from high intensity synchrotrons or other sources allows a resolution
of 1μm and enables the use of XMT (Coker et al., 1996). Two types of XMT are com-
mon: one based on the absorbance of x-rays and the other based on the phase shift
(or phase contrast) of incident x-rays produced by an object (Falcone et al., 2004;
Snigirev et al., 1995). Noninvasive imaging technology XMT can be used to visual-
ize and measure microstructural features. It allows noninvasive imaging of sample
cross sections at various depths and facilitates accurate and hitherto impossible mea-
surements of features like true cell size distribution (bimodal), average diameter,
open wall area fraction, cell wall thickness, presence or absence of an interconnected
network, and void fraction (Trater et al., 2005). All of these features are impossible
to ascertain using destructive, 2-D imaging techniques like light microscopy and
scanning electron microscopy (SEM). Another problem in SEM or optical imaging is
obtaining adequate contrast between the air and solid phases, in which the lighting
and angle of illumination play an important role. The XMT technique was used for
3-D visualization of the microstructural features of expanded extruded products
(Trater et al., 2005) and bread (Falcone et al., 2004).
4.3.1.5 Mercury Porosimetry
In addition to porosity, the pore’s characteristics and size distribution can be deter-
mined by mercury porosimetry. Modern mercury porosimetry can achieve pressures
in excess of 414 MPa, which translates into a pore size of 0.003 nm. This technique
involves constructing an isotherm of either pressure or intrusion volume. The total
open pores, characteristics of pores, and pore size distribution can be derived from
these isotherms.
4.3.1.5.1 Intrusion and Extrusion CurvesThe intrusion curve denotes the volume change with increasing pressure, and the
extrusion curve indicates the volume change with decreasing pressure (Figure 4.1).
FIGURE 4.1 Intrusion and extrusion curves of mercury porosimetry showing hysteresis.
Pressure
Vol
ume
(m3 /
g)
x
52527_C004.indd 10152527_C004.indd 101 10/3/2008 3:47:31 PM10/3/2008 3:47:31 PM
© 2009 by Taylor & Francis Group, LLC

102 Advances in Food Dehydration
Mercury intrusion and extrusion results were compared in order to assess capillary
hysteresis, which can be used to explore the characteristics of pores, such as shape
and structure. Most of the porosimetry curves exhibit hysteresis. The difference in
the curvatures of the intrusion and extrusion curves indicates that the path followed
by the extrusion curve is not the same as the intrusion path. At a given pressure the
volume indicated on the extrusion curve is lower than that on the intrusion curve,
and the difference in volume is the entrapped volume. The entrapped mercury
volume is indicated by x in Figure 4.1. The intrusion–extrusion cycle does not
close when the initial pressure is reached after extrusion, indicating that some
mercury is permanently entrapped by the sample, thereby preventing the loop
from closing. Often at the completion of an intrusion–extrusion cycle mercury
slowly continues to extrude, sometimes for hours (Lowell and Shields, 1984). The
maximum hysteresis volume (x) found for fresh apples was 0.135cm3/g (Rahman
et al., 2005). This indicated the amount of mercury entrapped in the sample after
a complete extrusion cycle and the complexity of the pore network. The total
volume of entrapped mercury was 0.135cm3/g, which was 85% of the total mercury
intruded. The shape of the intrusion and extrusion curves for dried apple samples
at 20 and 30h are different from those for the fresh apples. A completely different
extrusion curve was observed for the dried sample after 30h. These graphs created
by Rahman et al. (2005) indicated that the pore structure is changed in the course
of drying in addition to the porosity. Bread and cookie samples showed capillary
hysteresis (Hicsasmaz and Clayton, 1992). About 95% of the intruded mercury
was entrapped in bread samples, whereas 80% mercury was entrapped in cookies.
This indicated that both bread and cookie contain pores where narrow pore seg-
ments are followed by segments, which are larger in diameter. The reason that
mercury entrapment is lower in cookies than in bread is that bread is a highly
expanded product containing very large pores connected by narrow necks. This
phenomenon (narrow neck pores) was also supported by measurement of the
cellular structure by using SEM. Another cause could be due to the fi ltered out of
fi ne particles from the solid suspension tend to form agglomerates in the pores
during deposition.
4.3.1.5.2 Pore Size Distribution CurvesPore size distribution curves are characterized by different methods. In addition to
the intrusion–extrusion curve, other plots are used to characterize the pores:
• Derivative of the cumulative volume curve (dV/dP) versus pressure (P)
or diameter
• Volume distribution (dV/dr) versus P or diameter
• Pore size distribution function ( fv) versus P or pore diameter
Here, dV is the volume of intruded mercury in the sample (considered to be exactly
equal to the volume of pores) and P is the pressure (Pa). The term dV/dP is the fi rst
derivative (slope) of the volume versus pressure or diameter data. It is used in subse-
quent calculations of the volume distribution function, area distribution function,
and pore number fraction. The pore size distribution is the computed relation between
52527_C004.indd 10252527_C004.indd 102 10/3/2008 3:47:31 PM10/3/2008 3:47:31 PM
© 2009 by Taylor & Francis Group, LLC

Dehydration and Microstructure 103
the pore radius and pore volume, assuming cylindrical pores (Lowell and Shields,
1984). It can be defi ned as
fv � ( P __ r ) ( dV ___ dP
) (4.8)
where fv is the pore size distribution function (m3/m kg) and r is the pore radius (mm).
This function uses the slope times P/r; thus, it becomes increasingly susceptible to
minor fl uctuations in volume or pressure data or to slight changes in slope. These
slight variations in slope can result from actual discontinuities in the pore size distri-
bution, that is, some pore sizes may be absent or present in lesser volume than pores
immediately adjacent. This means that pore size distributions are usually not smooth
and continuous functions (Rahman et al., 2002).
Figure 4.2 shows pore size distribution curves of air-dried, vacuum-dried, and
freeze-dried tuna meat (Rahman et al., 2002). A pore size distribution curve is usually
characterized by the number, size, and shape of the peaks (Rahman and Sablani, 2003).
FIGURE 4.2 Pore size distribution cures of air-dried, vacuum-dried, and freeze-dried tuna
meat (Dv in the diagram should read as fv). (From Rahman, M.S. et al., J. Food Eng., 53,
301–313, 2002. With permission.)
Vacuum driedAir dried
1.43E–03
1.27E–03
1.11E–03
9.52E–04
7.93E–04
6.34E–04
DV
(d)
[cc/
(g–m
m)]
4.76E–04
3.17E–04
1.59E–04
0.00E+00
1.59E–031.59E–03
1.43E–03
1.27E–03
1.11E–03
9.52E–04
7.93E–04
6.34E–04
DV
(d)
[cc/
(g–m
m)]
4.76E–04
3.17E–04
1.59E–04
0.00E+00200 50 20
Pore diameter (μm)
5 3100 10
200 50 20
Pore diameter (μm)
5 3100 10
Freeze dried0.0529
0.0476
0.0423
0.0370
0.0317
0.0264
DV
(d)
[cc/
(g–m
m)]
0.0211
0.0159
0.0106
0.0053
0.0000200 50 20
Pore diameter (μm)
5 3100 10
52527_C004.indd 10352527_C004.indd 103 10/3/2008 3:47:31 PM10/3/2008 3:47:31 PM
© 2009 by Taylor & Francis Group, LLC

104 Advances in Food Dehydration
Although pore size distribution curves are presented in the literature, there is very little
information available on how this graph should be analyzed in order to explore the
characteristics of pores. The large peak in the fi gure indicates that most of the pores
exist in that size range, and the wider peak indicates that a relatively larger segment of
pores is followed by smaller ones. The sharp peak indicates the extent of similar size
pores; the higher the height is, the more pores at this size. A freeze-dried abalone
sample dried at –15°C showed only one large peak at 10 μm. Increased the freeze-dry-
ing temperature moved the peaks slightly lower than 10 μm (Rahman and Sablani,
2003). Karathanos et al. (1996) found three peaks for freeze-dried carrots: two sharp
peaks at 0.2 and 1.1 μm, and one shorter and wider peak at 21 μm. Two discrete peaks
were found for freeze-dried potatoes, cabbage, and apples. Completely different types
of distribution curves were observed for freeze-dried garlic samples when the samples
were dried at different shelf temperatures (Sablani et al., 2007). Rahman et al. (2002)
determined the pore size distribution graphs for tuna meat dried by different methods
and found more complex curves. They pointed that simply counting the peaks did not
characterize the entire curve. Moreover, the lines also showed signifi cant ruggedness
compared to the data for fruits and vegetables provided by Karathanos et al. (1996).
The ruggedness in the air-dried sample was to such an extent that it was very diffi cult
to count the number of peaks. The freeze-dried sample showed three major peaks (5.5,
13, and 30 μm) and there were many other small peaks, making the curve rugged at the
end of the graphs (at lower pore radius). Fresh apples showed two sharp peaks at 5.8
and 3.6 μm (Rahman et al., 2005). The second peak was so sharp that it was just a line.
An apple sample air dried for 20 h showed only one sharp peak at 3.6 μm; the sample
dried for 30 h showed three peaks at 10, 5.8, and 3.6 μm. The peak at 10 μm was much
wider and shorter, which may have been due to the formation of cracks or channels
during longer drying. In addition, all of the curves were extremely skewed to the right
(toward a lower pore diameter). The sharp peak indicated that most of the pores exist
in that size range, and the wider peak indicated that a relatively larger segment of pores
is followed by smaller ones. For Amioca starch containing 11% moisture, two peaks
were found when using low-pressure mercury porosimetry (one at 6 to 8 μm and one at
~1 to 3.5 μm) and another peak was seen from high-pressure mercury porosimetry at
very small pore sizes of 3 nm (Karathanos and Saravacos, 1993). Xiong et al. (1991)
studied the pore size distribution curves of regular pasta and puffed pasta and found
that regular pasta showed a horizontal line with no peak whereas puffed pasta showed
a large peak at 20 μm. Extruded regular pasta with mixtures of gluten and starch was
very dense and homogeneous, but the puffed pasta samples were porous. When the
gluten–starch ratio was 1, they found two peaks: one at 0.02 μm and one at 60 μm.
Similarly, when the gluten–starch ratio was 3, there were two peaks: 0.006 and 11 μm.
However, the peaks for a gluten–starch ratio of 3 were very sharp and high. This is
attributable to the cross-linking of protein through stronger covalent and hydrogen
bonds during extrusion. Fractal analysis was also used to characterize the pores
(Rahman et al., 2005). Pfeifer and Avnir (1983) derived a scaling equation for the pore
size distribution:
dV ___ dD
μ D2�d (4.9)
52527_C004.indd 10452527_C004.indd 104 10/3/2008 3:47:31 PM10/3/2008 3:47:31 PM
© 2009 by Taylor & Francis Group, LLC

Dehydration and Microstructure 105
where D is the pore diameter (m), V is the pore volume (m3), and d is the fractal
dimension. In terms of applied pressure, the scaling equation is
dV ___ dP
μ Pd�4 (4.10)
The fractal dimension can be estimated from the slope of the plot of log(dV/dP)
versus log P. Rahman et al. (2005) measured the fractal dimensions of fresh and
dried apples. Fractal dimensions of �2 and ~3 indicate the characteristics of pores
in fresh and dried apples, respectively. Dimensions increased with increasing drying
time, indicating the formation of micropores on the surface during air drying.
Rahman (1997) determined the fractal dimensions of native, gelatinized, and
ethanol deformed starches, which were 3.09, 3.10, and 2.45, respectively. Lower
values indicated the removal of micropores within the starch particles by ethanol
modifi cation.
4.3.1.5.3 Pore SizeMean and median pore diameters are usually calculated. The mean pore diameter is
the weighted arithmetic average of the distribution function, and the median pore
diameter is the diameter at which an equal volume of mercury is introduced into
larger and smaller pores than the median. Table 4.1 shows the pore diameter with
mercury porosimetry. The pore radius for strawberries was the largest (60.8 μm),
followed by apples (38.3 μm) and pears (28.7 μm) according to Khalloufi and Ratti
(2003). They also found that porosimetry gave a lower average pore diameter
compared to the microscopic techniques.
4.3.1.6 Gas Adsorption Method
In the gas adsorption method the sample is cooled, usually to cryogenic tempera-
tures, and then exposed to an inert adsorptive gas, typically nitrogen, at a series of
precisely controlled pressures. As the pressure increases a number of the gas mole-
cules are adsorbed on the surface of the sample. This volume of adsorbed gas is
measured using sensitive pressure transducers. As the pressure increases, more and
more gas is adsorbed. The very small micropores (�20 Å) are fi lled fi rst, followed
by the free surface and the rest of the pores. Each pressure corresponds to a pore
size, and the volume of these pores can be obtained from the volume of gas adsorbed.
A desorption isotherm as well as hysteresis can be derived by collecting data as the
pressure is reduced.
4.4 CREATION AND COLLAPSE OF MICROSTRUCTURE BY DRYING METHODS
4.4.1 MECHANISMS
4.4.1.1 Mechanisms of Collapse
Collapse is a result of a decrease in porosity, and it is caused by shrinkage of the
product. The factors affecting formation of pores can be grouped as intrinsic and
52527_C004.indd 10552527_C004.indd 105 10/3/2008 3:47:31 PM10/3/2008 3:47:31 PM
© 2009 by Taylor & Francis Group, LLC

106 A
dvan
ces in Fo
od
Deh
ydratio
n
TABLE 4.1Pore Size (Diameter) of Different Dried Foods
Mercury Porosimetry Microscopy
Material Drying Method Xw
ra (kg/m3)
rm (kg/m3) ea
Range ( mm)
Average ( mm)
Range ( mm)
Average ( mm) Ref.
Abalone Freeze-drying
(PT � 15°C)
— 664 — 0.664 — 8.8 (0.2) — — Rahman and Sablani
(2003)
Abalone Freeze-drying
(PT � –5°C)
— 715 — 0.715 — 9.3 (0.6) — — Rahman and Sablani
(2003)
Abalone Freeze-drying
(PT � –20°C)
— 737 — 0.737 — 7.6 (0.4) — — Rahman and Sablani
(2003)
Apple Air drying (80°C, 0 h) 0.860 849 1091 0.222 3.6–231 12.1 (2.7) — — Rahman et al. (2005)
Apple Air drying (80°C, 0 h) 0.304 660 1352 0.512 3.6–214 12.2 (1.7) — — Rahman et al. (2005)
Apple Air drying (80°C, 0 h) 0.103 560 1536 0.613 3.6–240 15.0 (1.0) — — Rahman et al. (2005)
Applea Freeze-drying �0.013 145 1478 0.902 — 76.6 (3.0) 46–416 146.4 (27.2) Khalloufi and Ratti (2003)
Garlic Freeze-drying
(PT � –5°C)
0.090 469 1534 0.690 4.0–249 12.0 (2.0) — — Sablani et al. (2007)
52527_C004.indd 106
52527_C004.indd 106
10/3/2008 3:47:31 PM
10/3/2008 3:47:31 PM
© 2009 by T
aylor & Francis G
roup, LL
C

Deh
ydratio
n an
d M
icrostru
cture
107
Garlic Freeze-drying
(PT�–15°C)
0.081 440 1517 0.710 4.0–227 12.0 (1.0) — — Sablani et al. (2007)
Garlic Freeze-drying
(PT�–25°C)
0.061 431 1504 0.710 4.0–224 12.0 (1.0) — — Sablani et al. (2007)
Pearb Freeze-drying �0.013 162 1049 0.845 — 57.4 (8.4) 44–240 96.0 (20.6) Khalloufi and Ratti (2003)
Pearc Freeze-drying �0.013 140 1148 0.878 — 75.4 (8.4) 32–224 103.2 (10.4) Khalloufi and Ratti (2003)
Peard Freeze-drying �0.013 187 844 0.779 — 25.8 — — Khalloufi and Ratti (2003)
Strawberrya Freeze-drying �0.013 117 910 0.898 — 121.6 (4.6) 82–378 183.8 (20.4) Khalloufi and Ratti (2003)
Strawberryd Freeze-drying �0.013 300 1476 0.797 — 121.0 — — Khalloufi and Ratti (2003)
Tuna meat Air drying (70°C) 0.114 960 1255 0.240 3.3–229 33.9 (3.1) — — Rahman et al. (2002)
Tuna meat Vacuum drying (70°C) 0.077 709 1309 0.460 3.3–241 30.1 (4.6) — — Rahman et al. (2002)
Tuna meat Freeze-drying
(PT � –20°C)
0.086 317 1259 0.760 3.3–220 27.2 (3.6) — — Rahman et al. (2002)
a Frozen at –27 and –17°C (hot plate temperature � 20–70°C).b Frozen at –27°C (hot plate temperature � 20–70°C).c Frozen at –17°C (hot plate temperature � 20–70°C).d Collapsed sample.
52527_C004.indd 107
52527_C004.indd 107
10/3/2008 3:47:31 PM
10/3/2008 3:47:31 PM
© 2009 by T
aylor & Francis G
roup, LL
C

108 Advances in Food Dehydration
extrinsic factors. The extrinsic factors are temperature, pressure, relative humidity,
gas atmosphere, air circulation, and electromagnetic radiation applied in the process.
The intrinsic factors are chemical composition, inclusion of volatile components
(such as alcohol and carbon dioxide), and initial structure before processing (Rahman,
2001, 2004). Genskow (1990) and Achanta and Okos (1995) mentioned several
mechanisms that affect the degree of collapse or shrinkage and formation of pores.
An understanding of these mechanisms aids in achieving the desired shrinkage or
collapse in the products. The following physical mechanisms play an important role
in the control of shrinkage or collapse (Rahman and Perera, 1999):
1. Surface tension: considers collapse in terms of the capillary suction created
by a receding liquid meniscus
2. Plasticization: considers collapse in terms of the plasticizing effect of
solvents on various polymer solutes
3. Electrical charge effects: considers collapse in terms of van der Waals
electrostatic forces
4. Mechanism of moisture movement in the process
5. Gravitational effects
The rate at which shrinkage occurs is related to the viscoelastic properties of a
matrix. The higher viscosity of the mixtures caused the lower rate of shrinkage and
vice versa (Achanta and Okos, 1996).
4.4.1.2 Glass-Transition Concept
Levine and Slade fi rst applied the concept of glass transition to identify or explain
the physicochemical changes in foods during processing and storage (Levine and
Slade, 1986; Slade and Levine, 1988, 1991). The glass-transition theory is one of the
concepts that have been proposed to explain the process of shrinkage, collapse,
fi ssuring, and cracking during drying (Cnossen and Siebenmorgen, 2000; Karathanos
et al., 1993, 1996; Krokida et al., 1998; Rahman, 2001). The hypothesis indicates that
there is signifi cant shrinkage during drying only if the temperature of the drying
or processing is higher than the glass transition of the material at that particular
moisture content (Achanta and Okos, 1996).
4.4.1.2.1 Support for Glass-Transition ConceptThe methods of freeze-drying and hot-air drying can be compared based on this
theory. In freeze-drying, with the drying temperature below or close to the maxi-
mally freeze-concentrated glass-transition temperature (Tg�, independent of solids
content) or Tg (glass transition as a function of solids content), the material is in the
glassy state. Hence, the shrinkage is negligible. As a result, the fi nal product is very
porous. In contrast, in hot-air drying with the drying temperature above Tg� or Tg, the
material is in the rubbery state and substantial shrinkage occurs causing a lower
level of pores. During the initial stage of freeze-drying, the composition of the
freeze-concentrated phase surrounding the ice dictates the Tg�. In the initial or early
stage of drying, the Tg� is very relevant and the vacuum must be suffi cient to ensure
that sublimation is occurring. At the end of the initial stage of drying the pore size
52527_C004.indd 10852527_C004.indd 108 10/3/2008 3:47:31 PM10/3/2008 3:47:31 PM
© 2009 by Taylor & Francis Group, LLC

Dehydration and Microstructure 109
and the porosity are dictated by the ice crystal size, if collapse of the wall of the
matrix that surrounded the ice crystal does not occur. Conversely, the secondary
stage of drying refers to removal of water from the unfrozen phase. After sublima-
tion is completed, the sample begins to warm up to the shelf temperature. At this
stage, the Tg of the matrix is related to the collapse and no longer to Tg�. This is
attributable to the Tg � Tg� (Tg increases from Tg� as the concentration of solids
increases during the process of drying). Karel et al. (1994) performed freeze-drying
under high vacuum (0.53 Pa) and reduced vacuum conditions (90.64 and 209.28 Pa)
to obtain varying initial sample temperatures that were –55, –45, and –28°C. Collapse
was determined by measuring the apparent shrinkage before and after freeze-drying
of apples, potatoes, and celery. Samples dried at –55°C showed no shrinkage (more
pores) but shrinkage increased with the increase of the drying temperature, justify-
ing the glass-transition concept.
4.4.1.2.2 Evidence against Glass-Transition ConceptsRecent experimental results indicated that the glass-transition concept is not valid
for freeze-drying of all types of biological materials, indicating the need for the
incorporation of other concepts (Sablani and Rahman, 2002). Thus, a unifi ed
approach needs to be used. In freeze-drying the pore formation in food materials
showed two distinct trends when shelf temperatures were maintained at a constant
level between –45 and 15°C (Sablani and Rahman, 2002). The materials in group I
(i.e., abalone, potatoes, and brown dates) showed a decreasing trend, whereas those
in group II (i.e., apples and yellow dates) showed an increasing trend in pore forma-
tion. This may be due to the structural affects of the materials. However, none of
the research measured the actual temperature and moisture history of the sample
passing through freeze-drying. The temperature and moisture history of the sample
during freeze-drying could provide more fundamental knowledge to explain the real
process of pore formation or collapse in freeze-drying. In many cases during
convection air drying, the observations related to collapse are just the opposite of the glass-transition concept (Del Valle et al., 1998; Rahman et al., 2005; Ratti, 1994;
Wang and Brennan, 1995). The mechanism proposed for this was the concept of case
hardening (Achanta and Okos, 1996; Rahman et al., 2005; Ratti, 1994). Bai et al.
(2002) studied surface structural changes in apple rings during heat-pump drying
with controlled temperature and humidity. Electron microscopy showed tissue
collapse and pore formation. Case hardening occurred in the surface of the dried
tissue when the apple slices were dried at 40 to 45 and 60 to 65°C, and in the extreme
case (at 60 to 65°C) cracks formed on the surface. Low case hardening was observed
in samples dried at 20 to 25°C.
Wang and Brennan (1995) utilized microscopy to study the structural changes in
potatoes during air drying (40 and 70°C). They found that shrinkage occurred fi rst
at the surface and then gradually moved to the bottom with an increase in drying
time. The cell walls became elongated. The degree of shrinkage at a low drying
temperature (40°C) was greater (i.e., less porosity) than that at high temperature
(70°C). At a low drying rate (i.e., at low temperature) the moisture content at the
center of a piece was never much higher than at the surface, internal stresses were
minimized, the material shrunk fully into a solid core, and shrinkage was uniform.
52527_C004.indd 10952527_C004.indd 109 10/3/2008 3:47:31 PM10/3/2008 3:47:31 PM
© 2009 by Taylor & Francis Group, LLC

110 Advances in Food Dehydration
At higher drying rates (i.e., higher temperature) the surface moisture decreased very
fast so that the surface became stiff, the outer layers of the material became rigid,
and the fi nal volumes were fi xed early in the drying. This caused the case hardening
phenomenon and limited subsequent shrinkage, thus increasing pore formation.
As the drying proceeded, the tissues split and rupture internally, forming an open
structure, and cracks were formed in the inner structure. When the interior fi nally
dried and shrunk, the internal stresses pulled the tissue apart. Thus, the increase of
surface case hardening was increased with the increase in drying temperature; at the
extreme case, cracks were formed on the surface and/or inside.
In case hardening the permeability and integrity of the crust play a role in main-
taining the internal pressure inside the material boundary. Internal pressure always
tries to puff the product by creating a force to the crust. During air drying stresses
are formed that are due to nonuniform shrinkage resulting from nonuniform moisture
and/or temperature distributions. This may lead to stress crack formation, when
stresses exceed a critical level. Crack formation is a complex process infl uenced
interactively by heat and moisture transfer, physical properties, and operational
conditions (Kowalski and Rybicki, 1996; Liu et al., 1997). Liu et al. (1997) identifi ed
the relative humidity and temperature of the air as the most infl uential parameters
that need to be controlled to eliminate the formation of cracks. Sannino et al. (2005)
used a DVS-1000 system to study the drying process of lasagna pasta at controlled
humidity and temperature with a sensing device to measure the electrical conductivity
of pasta during the drying process. An anomalous diffusion mechanism was
observed, typical of the formation of a glassy shell on the surface of the pasta slice
during drying at low relative humidity, which inhibits fast diffusion from the rubbery
internal portion. Internal stresses at the interface of the glassy–rubbery surfaces are
responsible for crack formation and propagation and thus lasagna sample and
breakage. Accurate control of the sample water activity and external environment
humidity needs to be maintained to avoid stress generation in the sample and crack
formation. The glass-transition concept cannot explain the effects of crust, case
hardening, cracks, and internal pressure. Vacuum drying of tuna meat produced
higher porosity compared to air drying when both samples were dried at 70°C
(Rahman et al., 2002). The porosity of dehydrated products is increased as the
vacuum pressure is decreased, which means shrinkage can be prevented by
controlling the pressure (Krokida and Maroulis, 2000). Microwaves create a massive
vaporization situation and cause puffi ng (Pere et al., 1998). This indicates that, in
addition to the temperature effect, environment pressure can also affect pore forma-
tion, and this effect cannot be explained by only a single glass-transition concept.
Similarly, in the case of extrusion, the higher the processing temperature is above
100°C, the higher the porosity, which is contrary to the glass-transition concept
(Ali et al., 1996). This is attributable to the rapid vaporization of the water vapor at
the exit of the die. Rahman et al. (2005) also found much higher pore formation with
105°C convection air drying compared to 50 or 80°C.
4.4.1.3 Rahman Hypothesis
After analyzing the experimental results from the literature, Rahman (2001) stated that
the glass-transition theory does not hold true for all products or processes. Other
52527_C004.indd 11052527_C004.indd 110 10/3/2008 3:47:31 PM10/3/2008 3:47:31 PM
© 2009 by Taylor & Francis Group, LLC

Dehydration and Microstructure 111
concepts, such as surface tension, pore pressure, structure, environment pressure, and
mechanisms of moisture transport, also play important roles in explaining the forma-
tion of pores. Rahman (2001) hypothesized that because capillary force is the main
force responsible for collapse, counterbalancing this force causes the formation of
pores and lower shrinkage. The counterbalancing forces are due to generation of inter-
nal pressure that is caused by vaporization of water or other solvents, variations in the
moisture transport mechanism, and pressure outside the material. Other factors could
be the strength of the solid matrix (i.e., ice formation; case hardening; surface crack
formation; the permeability of water through the crust; changes in the tertiary and
quaternary structures of the polymers; the presence or absence of crystalline, amor-
phous, and viscoelastic natures of solids; matrix reinforcement; and residence time).
Capillary force is related to the degree of water saturation of the porous matrix. In
apples with an initial porosity of 0.20, a fi nal porosity of 0.56 was achieved during air
drying for the dried sample. However, the fi nal porosity of dried samples was reduced
to around 0.30 (nearly half) if the initial porosity of the apple matrix was reduced to 0.0
to 0.023 by saturation with a vacuum infi ltration of water before air drying (Bengtsson
et al., 2003). Hussain et al. (2002) also identifi ed that the prediction accuracy improved
signifi cantly when the initial porosity was included in the generic prediction model of
porosity. This indicated that the initial air phase (related to pore or matrix pressure) has
signifi cant effects on the subsequent pore formation in the matrix.
4.4.2 PREDICTION
There are negligible theoretical methods to predict the porosity in foods during pro-
cessing. Lozano et al. (1980) proposed the geometric model of Rotstein and Cornish
(1978) to predict the porosity of fruits and vegetables. These authors mentioned that
the change in porosity is the result of two processes: the shrinkage of the overall
dimensions and the shrinkage of the cells themselves. The model is based on the
truncated spheres forming a cube. On the basis of geometry considerations, the
porosity at full turgor and dried conditions were proposed. However, it is diffi cult to
estimate two proposed geometric parameters for real foods. The formation of pores
in foods during drying can be grouped into two generic types: with (Figure 4.3) and
without an inversion point (Figure 4.4). Figure 4.3a shows that during drying initially
the pores are collapsed and reach a critical value, and a further decrease in moisture
causes the formation of pores until complete drying. An opposite condition exists in
Figure 4.3b. Figure 4.4 reveals that the level of pores is increased or decreased as a
function of the moisture content (Rahman, 2000, 2001). Usually the porosity of
foods increases but the moisture content decreases. The fi nal porosity depends on the
material’s structure as well as the drying conditions. Dried apples develop high
porosity while the shrinkage phenomenon seems to be intense. Bananas and carrots
seem to shrink intensely and develop lower porosity. Most of the porosity is predicted
from the density data or from empirical correlations of the porosity and moisture
content. Mainly empirical correlations are used to correlate the porosity. Rahman
et al. (1996) developed the following correlations for open and closed pores in
calamari meat during air drying up to zero moisture content as
eop � 0.079 � 0.164(Xw/ X w 0 ) � 0.099(Xw/ X w 0
)2 (4.11)
52527_C004.indd 11152527_C004.indd 111 10/3/2008 3:47:31 PM10/3/2008 3:47:31 PM
© 2009 by Taylor & Francis Group, LLC

112 Advances in Food Dehydration
ecp � 0.068 � 0.216(Xw / X w 0 ) � 0.138(Xw / X w 0
)2 (4.12)
where Xw and X 0 w are the moisture content at any time and the initial moisture
content (wet basis, fraction) before drying, respectively. Rahman (1991) developed
the apparent porosity of squid mantle meat during air drying up to zero moisture
content as
ea � 0.109 � 0.219(Xw/ X w 0 ) � 0.099(Xw/ X w 0
)2 (4.13)
Lozano et al. (1980) ascertained the correlation for the open pore porosity of
apples during air drying as (Xw � 0.89 to 0.0)
eop � 1 � 852.0 � 462.0[exp(�0.66Mw)]
____________________________________________ 1540.0[exp(�0.051Mw)] � {�1150.0[exp(�2.4Mw)]}
(4.14)
where Mw is the moisture content at any time (dry basis, fraction). They found a
peak at low moisture content (Figure 4.3b). Ali et al. (1996) studied the expansion
FIGURE 4.3 Change of porosity as a function of water content for inversion point. (From
Rahman, M.S., Dry. Technol., 19, 1–13, 2001. With permission.)
Por
osity
Water Content
Por
osity
Water Content
(a) (b)
FIGURE 4.4 Change of porosity as a function of water content for no inversion point. (From
Rahman, M.S., Dry. Technol., 19, 1–13, 2001. With permission.)
Por
osity
Water Content
(a) (b)
Por
osity
Water Content
52527_C004.indd 11252527_C004.indd 112 10/3/2008 3:47:31 PM10/3/2008 3:47:31 PM
© 2009 by Taylor & Francis Group, LLC

Dehydration and Microstructure 113
characteristics of extruded yellow corn grits in a single-screw extruder with various
combinations of barrel temperatures (100 to 200°C) and screw speeds (80 to 200 r/min).
They observed that the open and apparent pore volumes increased with the increase
of temperature and screw speed when the initial moisture content during extrusion
was 0.64 (wet basis). Ali et al. (1996) developed the multiple regression of porosity
as a function of the extrusion temperature and speed. Hussain et al. (2002) developed
generic porosity prediction models using regression analysis and a hybrid neural
network technique. They considered 286 data points of foods during convection air
drying. For the temperature and water content as two inputs, the best regression
model was the following:
ea � 0.5 X w 2 � 0.8Xw � 2.0 10�4t2 � 0.02t � 0.15 (4.15)
where t is the temperature (°C). This equation gave an average error of 34 ± 4%.
However, inclusion of the initial porosity in the input variables resulted an average
error of 24 ± 4%. In this case the regression equation was
ea � 0.5 X w 2 � 0.8Xw � 2.0 10�3t2 � 0.02t � 0.15(1 � e a
0 ) (4.16)
where e 0 a is the apparent porosity before drying. The type of product was then included
with the other three inputs by assigning a numerical value and then the error was
reduced to 14 ± 4%. The regression equation resulted in
ea � 0.5 X w 2 � 0.8Xw � 2.0 10�3t2 � 0.02t � 0.05(1 � e a
0 )F (4.17)
A number was given to each type of product: 1 for sugar-based products, 2 for
starch-based products, and 3 for other products. Hussain et al. (2002) also found that
the error could be further reduced to �1% by applying a hybrid neural network
technique. Although this approach was not based on a theoretical foundation, this
empirical approach could be considered as generic to some extent and easy to use.
Rahman et al. (1996) mentioned that further detailed studies beyond the empirical
correlations are necessary to understand the physicochemical nature of the
interactions of component phases and the collapse and formation of pores in food
materials during processing.
4.4.3 THEORETICAL PREDICTIONS
The theoretical prediction models are mainly based on the conservation of mass and
volume principle. However, further improved generic models need to be developed
that could be valid in real situations.
4.4.3.1 Density and Shrinkage
Most of the density prediction models in the literature are empirical in nature.
Fundamental models exist that are based on the conversion of both mass and volume.
52527_C004.indd 11352527_C004.indd 113 10/3/2008 3:47:31 PM10/3/2008 3:47:31 PM
© 2009 by Taylor & Francis Group, LLC

114 Advances in Food Dehydration
Thus, a number of authors have proposed models of this kind. When food is treated
as an ideal mixture (where the mixing process conserves both mass and volume),
the density of food can be predicted using fundamental models (Mannapperuma and
Singh, 1989). Rahman (1991) proposed a model using mass and volume conserva-
tion principles and a number of new terms to account for the interaction of the
phases and formation of the air phase during processing. Food materials can be
considered as multiphase systems (i.e., gas–liquid–solid systems). When the mixing
process conserves both mass and volume, then the density of the multiphase system
can be written as
T T1
1
( )
Ni
ii
Xx
r r=
= =Â
(4.18)
where (rT)i and rT are the true density of component i and composite mixture,
respectively; Xi is the mass fraction of component i; and N is the total number of
components present in the mixtures. Miles et al. (1983) and Choi and Okos (1985)
proposed the above equation for predicting the density of food materials. However,
this equation has limited uses in the cases where there is no air phase present and no
excess volume due to the interaction between the phases. Rahman (1991) extended
the theoretical model, introducing the pore volume and interaction term into the
above equation. The apparent density of a composite mixture can be divided into
three parts based on the conservation law for mass and volume:
apparent volume � actual volume of pure component phases � volume of pores or
air phase � excess volume due to interaction of phases
The excess volume can be positive or negative, depending on the physicochemical
nature of the process of concern, whereas the porosity is always positive. Equation
(4.18) can be written as
a ex
a T1
1
( )
Ni
ii
XV V
r r=
= + +Â
(4.19)
where Va is the specifi c apparent volume of the void or air phase (m3/kg) and Vex is
the specifi c excess volume (m3/kg). The apparent porosity, apparent volume, and
excess volume fraction (eex) are defi ned as
ea � Vv ___ Va
, Va � 1 __ ra , eex �
Vex ___ Va
(4.20)
Equation (4.19) can be transformed to Eq. (4.21) using the apparent porosity,
apparent volume, and excess volume fraction:
a ex a
1
1
xr e e�
� � (4.21)
52527_C004.indd 11452527_C004.indd 114 10/3/2008 3:47:32 PM10/3/2008 3:47:32 PM
© 2009 by Taylor & Francis Group, LLC

Dehydration and Microstructure 115
When the apparent porosity and excess volume fraction are negligible, Eq. (4.19)
is reduced to the following:
1 __ ra � 1 ___ rm
� 1 ___ rT � x (4.22)
The apparent porosity (or total air volume fraction) and excess volume fraction
can be calculated from the experimental density data as
ea � 1 � ra ___ rm
and eex � 1 � rm ___ rT
(4.23)
The apparent shrinkage (Sa) can be written as
a ex a
a 0 0 0 0
a ex a
(1 )
(1 )
VS
V
e exx e e
- -= = ¥
- -
(4.24)
In the case of organic liquid–liquid mixtures, a number of authors confi rmed
that there was a deviation in total volume, which might be positive or negative.
Positive means an increase and negative means a decrease in the net specifi c volume.
Excess volume and excess enthalpy of binary mixtures of liquids are also called
excess properties of mixtures. The excess volumes of binary mixtures showed a
range of behaviors: in some cases there was a single or double peak in the plot (excess
volume vs. mass fraction of one component) and in some cases there were positive
and negative lobes in the plots. For example, up to a mass fraction of 0.5 the excess
volume is positive and from 0.5 to 1.0 the excess volume is negative. The excess
properties and porosity are usually not easy to correlate in complex systems such as
foods (Rahman et al., 1996).
4.4.3.2 Porosity Prediction
Two concepts are applied to develop porosity prediction models: one is based on the
concept of the shrinkage–expansion coeffi cient, and one is based on the critical
moisture contents when material is transforming into different characteristics.
4.4.3.2.1 Rahman ModelRahman (2003) developed a theoretical model to predict the porosity based on the
conservation of mass and volume principle and defi ning a shrinkage–expansion
coeffi cient. A model for the ideal condition was derived, and then it was extended to
a nonideal condition.
4.4.3.2.1.1 Ideal ConditionA theoretical model (ideal condition) to predict the porosity in foods during drying
was developed based on the conservation of mass and volume principle and assum-
ing that the volume of pores formed is equal to the volume of water removed during
drying (Rahman, 2003). In this case there is no shrinkage (or collapse) or expansion
in the initial volume of the material. If no pores exist in the material before drying
52527_C004.indd 11552527_C004.indd 115 10/3/2008 3:47:32 PM10/3/2008 3:47:32 PM
© 2009 by Taylor & Francis Group, LLC

116 Advances in Food Dehydration
(i.e., initially), the volume fraction of pores in the material at any water level can be
expressed as
0
a aif 0ae e
a b¢ = =
+ (4.25)
where
0
w
w w m
1 1, ,
1
X
X
y yy a br r
- -= = =-
Here, y is the mass of the sample at any moisture content per unit initial mass before
processing (kg/kg), a is the volume of water removed per unit mass (m3/kg), and b is
the volume of water remaining and solids per unit mass (m3/kg). The material den-
sity of a multicomponent mixture can be estimated from the following equation:
w
m t w 1
1 1n
i
ii
X X
r r r r=
= = + Â
(4.26)
where Xi and ri are the mass fraction and density of other components except water,
respectively. The mass fraction of other components except water can be estimated
from the mass fraction of water:
Xi � X i
0 ___ y (4.27)
For a two component mixture, if the excess volume due to the interaction between
water and solids is zero, the material density can be expressed as
1 ___ rm � 1 ___ rT
� Xw ___ rw
� Xs __ rs
(4.28)
where rs is the substance density for dry solids at zero moisture content (kg/m3). For
a porous material, the ideal porosity can be written as
ea � e a 0 � (1 � e a
0 ) e a ¢ (4.29)
As expected, the ideal model may not be valid in many practical cases. Constant
porosity and no shrinkage are often stated as key assumptions in the model for dryer
design. Although the Eq. (4.29) does not predict the real situation, it can be used for
ideal conditions. In addition, it could be used as an initial estimation when experi-
mental results are missing in the case of nonideality and to assess which processes
of pore formation are closer to the ideal condition.
4.4.3.2.1.2 Nonideal ConditionsThe ideal model is then extended for nonideal conditions when there is shrinkage,
collapse, or expansion by defi ning a shrinkage–expansion coeffi cient as
a
f aef a b
≤ =+
(4.30)
52527_C004.indd 11652527_C004.indd 116 10/3/2008 3:47:32 PM10/3/2008 3:47:32 PM
© 2009 by Taylor & Francis Group, LLC

Dehydration and Microstructure 117
where f is the shrinkage–expansion coeffi cient for pore formation or collapse and
the porosity can be calculated as (Rahman, 2003)
ea � e a 0 � (1 � e a
0 ) e a ≤ (4.31)
The shrinkage–expansion coeffi cient can be estimated using Eqs. (4.30) and
(4.31) and applying the initial porosity and actual measured porosity using the values
of a and b:
0
a a
a
( )
( 1)
b e ef
a e-
=-
(4.32)
When the value of f is 1, the nonideal model is transformed to the ideal conditions, that
is, the volume of water loss is equal to the pores formed. A f value of 0 indicates
complete collapse of all pores, that is, no pore formation occurs. Values of f that are �1
show there is an expansion of the material’s boundary during the process. Values of f
that are �1 indicate that there is shrinkage of the material by collapse of the initial air
fi lled pores or collapse of water fi lled pores. When the moisture content of the product
is very close to the initial moisture content (e.g., only 2% change), this model may pro-
vide an unrealistic prediction. Future work needs to be targeted on estimating the values
of f for a wide variation of the material’s characteristics and processing conditions.
4.4.3.2.2 Sarma–Heldman ConceptSarma and Heldman (cited by Heldman, 2001) proposed a concept of the visual
structure of food particles as a function of the moisture content. There are three
critical moisture ranges: 0 � Mw £ 0.20, 0.20 £ Mw £ 0.60, and Mw ≥ 0.60. Based on
observations for starch and casein particles, six moisture content ranges were defi ned
by Heldman (2001). However, all of the critical moisture contents varied with prod-
uct types and their compositions, as well as the process used to manufacture the food
product. Thus, the generic concept transforms into an empirical nature unless criti-
cal conditions can be predicted from fundamental theoretical concepts.
4.5 QUALITY CREATION AND DETERIORATION BY MICROSTRUCTURE
Pores or bubbles occur in diverse solid food products, such as cakes; breads; wafers;
breakfast cereals; and puffed, extruded, and dried foods. The issue of pores in food
products is generic. Many foods possess complex microstructures. The safety and
quality of foods rely on the ability to control microbial growth in each microscopic
location. Variations in microenvironmental regions can affect colony formation as a
direct result of a restricted supply of nutrients or oxygen to the growing cells (Robins
and Wilson, 1994). The effect of oxygen on lipid oxidation is also closely related to
the product porosity. Freeze-dried tuna meat was found to be more susceptible to
oxygen because of its high porosity and exposed surface area compared to air-dried
and vacuum-dried samples (Rahman et al., 2002). The characteristics of pores affect
the fl ow of gas, thus controlling many processes and the safety of the products. Pore
size distribution affects the mass transfer in a product.
52527_C004.indd 11752527_C004.indd 117 10/3/2008 3:47:32 PM10/3/2008 3:47:32 PM
© 2009 by Taylor & Francis Group, LLC

118 Advances in Food Dehydration
Microstructure determines the mechanical properties, and thus the texture of
extruded food products. Many solid food materials are brittle and fragile, especially
when dry. The puffi ness of foods also depends on the porosity. Specifi c processing
can be applied to attain specifi c porosity for better texture and mouth feel of food.
Pores have affects on the sensory properties of foods. The perception of food fractur-
ability involves receptors sensitive to vibration. Vibrations are likely to be produced
when food is fractured because of the cellular nature of most fracturable foods (Vickers
and Bourne, 1976). Stiff-walled cells are fi lled with air in low moisture foods and
with liquid in high moisture foods. When suffi cient force is applied during crushing
by bite, there is a serial bursting of the cell walls. Thus, vibratory sensations by sound
are involved when cellular foods are crushed (Vickers and Bourne, 1976). A broad
frequency band of sound with irregularly varying amplitude was produced by crushing
low and high moisture foods, which is identifi ed as being crisp (Christensen, 1984).
Air bubbles enhance the creamy perception, thus low fat products can be developed.
The texture, density, wettability, rehydration capacity, and mechanical properties of
dried food products directly depend on drying process conditions. For example,
freeze-drying typically results in biological products with a porous crust and superior
rehydration capacity, whereas hot-air drying results in a dense product with an imper-
meable crust. Depending on the end use, these properties may be desirable or unde-
sirable. If a long bowl life is required for a cereal product, a crust product that prevents
moisture reabsorption may be preferred. If a product with good rehydration capacity
is required, a slow drying process, such as freeze-drying, may be preferred (Achanta
and Okos, 1995; Rahman and Perera, 1999). Raw materials may end up with com-
pletely different levels of shrinkage or collapse, depending on the type of process
applied. For example, drying at 5°C results in a porous product with good rehydra-
tion capacity whereas drying at 80°C results in a dense product with poor rehydration
capacity (Karathanos et al., 1993). Products baked at a low temperature have a different
texture than those baked at a higher temperature. The low-temperature product has a
crumbly texture, and the high-temperature product has a crispy crust.
Porosity is also important to estimate other properties, such as moisture
diffusivity, hardness, and thermal conductivity. Fat bloom is a physical defect, which
appears during chocolate storage. The grayish or white appearance results from the
formation of large fat crystals on the chocolate surface. It seems to be related to the
polymorphic forms of butter and recrystallization of solutes. A higher level of
crystallization could generate pores and microfractures in the matrix and release
part of the liquid phase. Loisel et al. (1997) analyzed the structure of dark chocolate
samples by mercury porosimetry to determine whether the formation of fat bloom
was related to the presence of pores. They found the presence of a porous matrix
partly fi lled with liquid cocoa butter fractions in dark chocolate. This matrix is likely
a network of cavities closed by multiple walls made by intermigrating fat crystals
impregnated with liquid fat (Loisel et al., 1997).
4.6 CONCLUSION
Different types of porosity can be defi ned to characterize pores. In addition to porosity
and pore size distribution, other characteristics are used to identify the types of pores,
52527_C004.indd 11852527_C004.indd 118 10/3/2008 3:47:32 PM10/3/2008 3:47:32 PM
© 2009 by Taylor & Francis Group, LLC

Dehydration and Microstructure 119
such as shape, thickness of pore wall, and structure of pores. Porosity is mainly
measured by density, mercury porosimetry, and microscopic techniques. Different
mechanisms of the creation and collapse of microstructures are being proposed. Most
generic hypotheses posit that capillary force is the main force responsible for collapse,
so counterbalancing this force causes the formation of pores and lower shrinkage.
Porosity is mainly predicted by empirical correlations because the theoretical models
are far from the reality of being applied as a generic approach.
NOMENCLATURE
VARIABLES
D pore diameter (m)
dV/dr volume distribution
fv pore size distribution function (m3/m kg)
Mw moisture content at any time (dry basis, fraction)
N total number of components present in the mixtures
P pressure (Pa)
r pore radius (mm)
Sa apparent shrinkage
t temperature (°C)
Tg glass-transition temperature
Tg� maximally freeze-concentrated glass-transition temperature
V pore volume (m3)
Va specifi c volume of void or air phase (m3/kg)
Vex specifi c excess volume (m3/kg)
Xi mass fraction of component iXw moisture content at any time
Xw0 initial moisture content (wet basis, fraction) before drying
GREEK LETTERS
a volume of water removed per unit mass (m3/kg)
b volume of water remaining and solids per unit mass (m3/kg)
d fractal dimension
ea apparent pore porosity (ea � eop � ecp)
e 0 a apparent porosity before drying
eB bulk porosity
eBP bulk particle porosity (eBP � eB � eop)
ecp closed pore porosity
eop open pore porosity
eT total porosity
f shrinkage–expansion coeffi cient
y mass of sample at any moisture content per unit initial mass before
processing (kg/kg)
ra apparent density (kg/m3)
52527_C004.indd 11952527_C004.indd 119 10/3/2008 3:47:32 PM10/3/2008 3:47:32 PM
© 2009 by Taylor & Francis Group, LLC

120 Advances in Food Dehydration
rB bulk density (kg/m3)
ri density of other components except water
rm material density (kg/m3)
rs substance density for dry solids at zero moisture content (kg/m3)
rT true density of composite mixture (kg/m3)
(rT)i true density of component i (kg/m3)
x true specifi c volume (m3/kg)
REFERENCES
Achanta, S. and Okos, M.R., Impact of drying on the biological product quality, in Food Preservation by Moisture Control. Fundamentals and Applications, Barbosa-Canovas,
G.V. and Welti-Chanes, J., Eds., Technomic Publishing, Lancaster, PA, 1995, p. 637.
Achanta, S. and Okos, M.R., Predicting the quality of dehydrated foods and biopolymers—
Research needs and opportunities, Dry. Technol., 14, 1329–1368, 1996.
Ali, Y., Hanna, M.A., and Chinnaswamy, R., Expansion characteristics of extruded corn
grits, Food Sci. Technol., 29, 702–707, 1996.
Bai, Y., Rahman, M.S., Perera, C.O., Smith, B., and Melton, L.D., Structural changes in apple
rings during convection air-drying with controlled temperature and humidity, J. Agric. Food Chem., 50, 3179–3185, 2002.
Bengtsson, G.B., Rahman, M.S., Stanley, R.A., and Perera, C.O., Apple rings as a model for
fruit drying behavior: Effect of surfactant and reduced osmolality reveal biological
mechanisms, J. Food Sci., 68, 563–566, 2003.
Choi, Y. and Okos, M.R., Effects of temperature and composition on the thermal properties
of foods, in Food Engineering and Process Applications. Transport Phenomena,
Le Maguer, M. and Jelen, P., Eds., Elsevier Applied Science, London, Vol. 1, 1985.
Christensen, C.M., Food texture perception, Adv. Food Res., 29, 159–199, 1984.
Cnossen, A.G. and Siebenmorgen, T.J., The glass transition temperature concept in rice
drying and tempering: Effect on milling quality, Trans. ASAE, 43, 1661–1667, 2000.
Coker, D.A., Torquato, S., and Dunsmuir, J.H., Morphology and physical properties of
Fontainebleau sandstone via a tomographic analysis, J. Geophys. Res., 101, 17497–
17506, 1996.
Del Valle, J.M., Cuadros, T.R.M., and Aguilera, J.M., Glass transitions and shrinkage during
drying and storage of osmosed apple pieces, Food Res. Int., 31, 191–204, 1998.
Falcone, P.M., Baiano, A., Zanini, F., Mancini, L., Tromba, G., and Montanari, F., A novel
approach to the study of bread porous structure: Phase-contrast x-ray microtomography,
J. Food Sci., 69, FEP38–FEP43, 2004.
Genskow, L.R., Consideration in drying consumer products, in Drying ’89, Mujumdar, A.S.
and Roques, M., Eds., Hemisphere Publishing, New York, 1990.
Heldman, D.R., Prediction models for thermophysical properties of foods, in Food Processing Operations Modeling. Design and Analysis, Irudayaraj, J., Ed., Marcel Dekker,
New York, 2001, pp. 1–23.
Hicsasmaz, Z. and Clayton, J.T., Characterization of the pore structure of starch based food
materials, Food Struct., 11, 115–132, 1992.
Hussain, M.A., Rahman, M.S., and Ng, C.W., Prediction of pores formation (porosity) in
foods during drying: Generic models by the use of hybrid neural network, J. Food Eng., 51, 239–248, 2002.
Karathanos, V., Anglea, S., and Karel, M., Collapse of structure during drying of celery, Dry. Technol., 11, 1005–1023, 1993.
Karathanos, V.T., Kanellopoulos, N.K., Belessiotis, V.G., Development of porous structure
during air drying of agricultural plant products, J. Food Eng., 29, 167–183, 1996.
52527_C004.indd 12052527_C004.indd 120 10/3/2008 3:47:32 PM10/3/2008 3:47:32 PM
© 2009 by Taylor & Francis Group, LLC

Dehydration and Microstructure 121
Karathanos, V.T., Saravacos, G.D., Porosity and pore size distribution of starch materials,
J. Food Eng., 18, 259–280, 1993.
Karel, M., Anglea, S., Buera, P., Karmas, R., Levi, G., and Roos, Y., Stability-related transi-
tions of amorphous foods. Thermochimica Acta., 246, 249–269, 1994.
Khalloufi , S. and Ratti, C., Quality determination of freeze-dried foods as explained by their
glass transition temperature and internal structure, J. Food Sci., 68, 892–903, 2003.
Kowalski, S.J. and Rybicki, A., Drying induced stresses and their control, paper presented at
the 10th International Drying Symposium (Drying ’96), Krakow, Poland, 1996.
Krokida, M.K., Karathanos, V.T., and Maroulis, Z.B., Effect of freeze-drying conditions on
shrinkage and porosity of dehydrated agricultural products, J. Food Eng., 35, 369–380,
1998.
Krokida, M. and Maroulis, Z., Quality changes during drying of food materials, in Drying Technology in Agricultural and Food Sciences, Mujumdar, A.S., Ed., Science
Publishers, Enfi eld, NH, 2000, pp. 61–106.
Levine, H. and Slade, L., A polymer physico-chemical approach to the study of commercial
starch hydrolysis products (SHPs), Carbohydr. Polym., 6, 213–244, 1986.
Liu, H., Zhou, L., and Hayakawa, K., Sensitivity analysis for hygrostress crack formation in
cylindrical food during drying, J. Food Sci., 62, 447–450, 1997.
Loisel, C., Lecq, G., Ponchel, G., Keller, G., and Ollivon, M., Fat bloom and chocolate struc-
ture studied by mercury porosimetry, J. Food Sci., 62, 781–788, 1997.
Lowell, S. and Shields, J.E., Powder Surface Area and Porosity, 2nd ed., Chapman & Hall,
London, 1984.
Lozano, J.E., Rotstein, E., and Urbicain, M.J., Total porosity and open-pore porosity in the
drying of fruits, J. Food Sci., 45, 1403–1407, 1980.
Mannapperuma, J.D. and Singh, R.P., A computer-aided method for the prediction of proper-
ties and freezing/thawing times of foods, J. Food Eng., 9, 275–304, 1989.
Miles, C.A., Beek, G.V., and Veerkamp, C.H., Calculation of thermophysical properties of
foods, in Thermophysical Properties of Foods, Jowitt, R., Escher, F., Hallstrom, B.,
Meffert, H.F.T., Spiess, W.E.L., and Vos, G., Eds., Applied Science Publishers, London,
1983, pp. 269–312.
Pere, C., Rodier, E., and Schwartzentruber, J., Effects of the structure of a porous material on
drying kinetics in a microwave vacuum laboratory scale dryer, paper presented at the
11th International Drying Symposium (IDS ’98), 1998.
Pfeifer, P. and Avnir, D., Chemistry in noninteger dimensions between two and three.
I. Fractal theory of heterogenous surfaces, J. Chem Phys., 79, 3558–3565, 1983.
Rahman, M.S., Thermophysical Properties of Seafoods, Ph.D. thesis, University of New
South Wales, Sydney, 1991.
Rahman, M.S., Food Properties Handbook, CRC Press, Boca Raton, FL, 1995.
Rahman, M.S., Physical meaning and interpretation of fractal dimensions of fi ne particles
measured by different methods, J. Food Eng., 32, 447–456, 1997.
Rahman, M.S., Mechanism of pore formation in foods during drying: Present status, in
Proceedings of the Eighth International Congress on Engineering and Food (ICEF-8), Welti-Chanes, J., Barbosa-Canovas, G.V., and Aguilera, J.M., Eds., Technomic
Publishing, Lancaster, PA, 2000, pp. 1111–1116.
Rahman, M.S., Toward prediction of porosity in foods during drying: A brief review. Dry. Technol., 19, 1–13, 2001.
Rahman, M.S., A theoretical model to predict the formation of pores in foods during drying,
Int. J. Food Prop., 6, 61–72, 2003.
Rahman, M.S., Prediction of pores in foods during processing: From regression to knowl-
edge development from data mining (KDD) approach, paper presented at the
International Conference on Engineering and Food (ICEF-9), Montpellier, France,
March 7–11, 2004.
52527_C004.indd 12152527_C004.indd 121 10/3/2008 3:47:32 PM10/3/2008 3:47:32 PM
© 2009 by Taylor & Francis Group, LLC

122 Advances in Food Dehydration
Rahman, M.S., Mass–volume–area-related properties of foods, in Engineering Properties of Foods, Rao, M.A., Rizvi, S.S.H., and Datta, A.K., Eds., CRC Press, Boca Raton, FL,
2005, pp. 1–39.
Rahman, M.S., Al-Amri, O.S., and Al-Bulushi, I.M., Pores and physico-chemical character-
istics of dried tuna produced by different methods of drying, J. Food Eng., 53, 301–313,
2002.
Rahman, M.S., Al-Zakwani, I., and Guizani, N., Pore formation in apple during air-drying as
a function of temperature: Porosity and pore-size distribution, J. Sci. Food Agric., 85,
979–989, 2005.
Rahman, M.S. and Perera, C.O., Drying and food preservation, in Handbook of Food Preservation, Rahman, M.S., Ed., Marcel Dekker, New York, 1999, pp. 173–216.
Rahman, M.S., Perera, C.O., Chen, X.D., Driscoll, R.H., and Potluri, P.L., Density, shrinkage
and porosity of calamari mantle meat during air drying in a cabinet dryer as a function
of water content, J. Food Eng., 30, 135–145, 1996.
Rahman, M.S. and Sablani, S.S., Structural characteristics of freeze-dried abalone:
Porosimetry and puncture, Trans. IChemE, 81C, 309–315, 2003.
Ratti, C., Shrinkage during drying of foodstuffs, J. Food Eng., 23, 91–105, 1994.
Robins, M.M. and Wilson, P.D.G., Food structure and microbial growth, Trends Food Sci. Technol., 5, 291–293, 1994.
Rotstein, A. and Cornish, A.R.H., Prediction of the sorption equilibrium relationship for the
drying of foodstuffs, AIChE J., 24, 966, 1978.
Sablani, S. and Rahman, M.S., Pore formation in selected foods as a function of shelf
temperature during freeze drying. Dry. Technol., 20, 1379–1391, 2002.
Sablani, S.S., Rahman, M.S., Al-Kuseibi, M.K., Al-Habsi, N.A., Al-Belushi, R.H.,
Al-Marhubi, I., and Al-Amri, I.S., Infl uence of shelf temperature on pore formation in
garlic during freeze-drying, J. Food Eng., 80, 68–79, 2007.
Sannino, A., Capone, S., Siciliano, P., Ficarella, A., Vasanelli, L., and Maffezzolo, A.,
Monitoring the drying process of lasagna pasta through a novel sensing device-based
method, J. Food Eng., 69, 51–59, 2005.
Slade, L. and Levine, H., Non-equilibrium behavior of small carbohydrate–water systems,
Pure Appl. Chem., 60, 1841–1864, 1988.
Slade, L. and Levine, H., A food polymer science approach to structure property relationships
in aqueous food systems: Non-equilibrium behavior of carbohydrate–water systems, in
Water Relationships in Food, Levine, H. and Slade, L., Eds., Plenum Press, New York,
1991, pp. 29–101.
Snigirev, A., Snigireva, I., Kohn, V., Kuznetsov, S., and Schelokov, I., On the possibilities of
x-ray phase contrast microimaging by coherent high-energy synchrotron radiation,
Rev. Sci. Instrum., 66, 5486–5492, 1995.
Trater, A.M., Alavi, S., and Rizvi, S.S.H., Use of non-invasive x-ray microtomography for
characterizing microstructure of extruded biopolymer foams, Food Res. Int., 38, 709–719,
2005.
Vickers, Z. and Bourne, M.C., A psychoacoustical theory of crispness, J. Food Sci., 41, 1158–
1164, 1976.
Wang, N. and Brennan, J.G., Changes in structure, density and porosity of potato during
dehydration, J. Food Eng., 24, 61–76, 1995.
Xiong, X., Narsimhan, G., and Okos, M.R., Effect of comparison and pore structure on binding
energy and effective diffusivity of moisture in porous food, J. Food Eng., 15, 187–208,
1991.
52527_C004.indd 12252527_C004.indd 122 10/3/2008 3:47:32 PM10/3/2008 3:47:32 PM
© 2009 by Taylor & Francis Group, LLC

123
5 Convective Drying of Foods
María Elena Carrín and Guillermo Héctor Crapiste
CONTENTS
5.1 Introduction ............................................................................................. 123
5.2 Basic Concepts Related to Convective Drying ....................................... 124
5.2.1 Basic Concepts and Properties Associated with
Water Vapor and Air Mixtures .................................................... 124
5.2.2 Terminology and Concepts Associated with Drying of
Food Materials ............................................................................. 125
5.3 Convective Drying Kinetics .................................................................... 126
5.4 Drying Time Calculations ....................................................................... 130
5.4.1 Constant Drying Rate Period (I) .................................................. 130
5.4.2 Falling Drying Rate Period (II) ................................................... 132
5.4.2.1 Graphical Resolution ...................................................... 132
5.4.2.2 Theoretical Models ......................................................... 133
5.4.3 Generalized Drying Curves ......................................................... 136
5.4.4 Other Methods ............................................................................. 139
5.5 Selective Drying of Foods ....................................................................... 139
5.6 Latest Advances in Convective Food Drying ......................................... 141
5.6.1 Time Variable Drying Schemes ................................................... 142
5.6.2 Heat Pump Drying (HPD) ........................................................... 142
5.6.3 Superheated Steam Drying under Vacuum .................................. 144
5.6.4 Modifi ed Fluidized Bed Drying (FBD) ....................................... 144
5.6.5 Optimization and On-Line Control Strategies ............................. 145
Nomenclature ..................................................................................................... 145
Variables and Abbreviations ................................................................... 145
Greeks ..................................................................................................... 146
References .......................................................................................................... 147
5.1 INTRODUCTION
Preserving food and agricultural products via air drying has been utilized worldwide
for centuries. At present, there is still increasing demand for high-quality shelf-stable
dried food products, especially fruits and vegetables. The design of drying equipment
52527_C005.indd 12352527_C005.indd 123 10/1/2008 11:42:27 AM10/1/2008 11:42:27 AM
© 2009 by Taylor & Francis Group, LLC

124 Advances in Food Dehydration
and the selection of dryer operating conditions for food products must be done on the
basis of raw material characteristics, quality requirements for the fi nal dry product,
and economic analysis.
Convective drying of foods is a combined heat and mass transfer operation. Its
modeling and optimization require understanding of the transport mechanisms
inside and between the solid food and the drying air, as well as knowledge of the
thermophysical, equilibrium, and transport properties of both systems (Crapiste,
2000; Crapiste and Rotstein, 1997).
5.2 BASIC CONCEPTS RELATED TO CONVECTIVE DRYING
Calculations in convective drying are based on the air and material properties. The
transfer of energy mainly depends on air and food temperatures, air-fl ow rate, and
exposed area of food material. Internal transfer of moisture is governed by the nature
of the food, including composition and structure, temperature, pressure, and particu-
larly moisture content. The transfer of moisture from solid to air mainly depends
on the surface water activity, air humidity, air-fl ow rate, exposed area of the food
material, and pressure.
5.2.1 BASIC CONCEPTS AND PROPERTIES ASSOCIATED WITH WATER VAPOR AND AIR MIXTURES
Humidity (H) and relative humidity (RH) are calculated according to the following:
H � Pw _______
P � Pw
Mw ___ Mg
(5.1)
where Mw is the molecular weight of the moisture vapor, Mg is the molecular weight
of dry air (gas), P is the total pressure, and Pw is the partial pressure of water vapor.
When the partial pressure of the vapor in the gas phase equals the vapor pressure
of the liquid at the temperature of the system (T), the gas is saturated. The relative
humidity is a measure of moisture saturation. It is defi ned as the ratio of the partial
pressure of water vapor in a gaseous mixture with air to the saturated vapor pressure
of water at a given temperature. The relative humidity is expressed as a percentage
and is calculated in the following manner:
RH � Pw ___ P w 0
100 (5.2)
where P w 0 is the saturated vapor pressure.
The dry bulb temperature (Tdb ) is the temperature of the air as measured by a
thermometer freely exposed to the air but shielded from radiation and moisture.
The wet bulb temperature (Twb ) is measured by a gas passing rapidly over a wet
thermometer bulb. It is used along with dry bulb temperature to measure the relative
humidity of a gas.
The relationships between air and water vapor and the psychrometric properties
of moist air are commonly found in the form of psychrometric tables and charts
52527_C005.indd 12452527_C005.indd 124 10/1/2008 11:42:27 AM10/1/2008 11:42:27 AM
© 2009 by Taylor & Francis Group, LLC

Convective Drying of Foods 125
(Keey, 1978; Mujumdar, 1987; Perry and Green, 1999), computer programs (Ratti
et al., 1989), or calculating equations (ASAE, 1982). For more detailed information on
psychrometric charts, please refer to Chapter 1.
5.2.2 TERMINOLOGY AND CONCEPTS ASSOCIATED WITH DRYING OF FOOD MATERIALS
The moisture content of a material is the weight of water per weight of wet solid (wet
basis, Xw) or the weight of water per weight of dry solid (dry basis, X). They are
related in the following manner:
Xw � X ______ X � 1
and X � Xw ______
1 � Xw
(5.3)
The moisture ratio (MR) is the moisture content of a material during drying. It is
usually expressed in a dimensionless form as
MR � X � Xe _______ X0 � Xe
(5.4)
where X is the moisture content at any time t, Xe is the equilibrium moisture content,
and X0 is the initial moisture content.
Water activity (aw) is an index of the availability of water for chemical reactions
and microbial growth. It can be defi ned by the following equation:
aw � Pw ___ P w 0
� RH ____
100 (5.5)
Moisture content can be classifi ed according to its availability in the food matrix.
1. Bound moisture: Bound moisture is the amount of water tightly bound to
the food matrix, mainly by physical adsorption on active sites of hydro-
philic macromolecular materials such as proteins and polysaccharides, with
properties signifi cantly different from those of bulk water.
2. Free moisture content: Free moisture content is the amount of water
mechanically entrapped in the void spaces of the system. Free water is not
in the same thermodynamic state as liquid water because energy is required
to overcome the capillary forces. Furthermore, free water may contain
chemicals, especially dissolved sugars, acids, and salts, altering the drying
characteristics.
An important value is the equilibrium moisture content, which is the moisture
content of a product in equilibrium with the surrounding air at given temperature
and humidity conditions. Theoretically, it is the minimum moisture content to which
a material can be dried under these conditions. A plot of the equilibrium moisture
content versus the relative humidity or water activity at constant temperature, which
is called sorption isotherm, is used to illustrate the degree of water interactions with
foods. The value of the equilibrium moisture content for some solids depends on the
52527_C005.indd 12552527_C005.indd 125 10/1/2008 11:42:27 AM10/1/2008 11:42:27 AM
© 2009 by Taylor & Francis Group, LLC

126 Advances in Food Dehydration
direction from which equilibrium is approached, and the desorption equilibrium is
of particular interest for drying calculations.
Although several models have been proposed to estimate the equilibrium moisture
content of food materials, experiments are still needed to determine the correct values
because water binding is affected not only by temperature but also by composition
and structure. Theoretical predictions and empirical models are not generalized. Iglesias
and Chirife (1982) provide water sorption parameters for many foods. Figure 5.1
presents sorption isotherms for typical food products.
The equilibrium moisture content for biological materials generally increases
rapidly with a relative humidity above ~60 to 80% because of capillary and dissolution
effects. The equilibrium moisture content of food materials high in soluble solids
(apples in Figure 5.1) increases slowly at low water activity and shows a steep rise at
high relative humidities. At low relative humidities, the equilibrium moisture content
is greater for food materials with a high content in high molecular weight polymers,
such as potatoes, which have more active sites for sorption, and lower for food mate-
rials high in soluble solids.
For more information on sorption isotherms and their models, please refer to
Chapter 1.
5.3 CONVECTIVE DRYING KINETICS
Drying kinetics refer to the changes in the average material moisture content and
temperature with time. They are needed to calculate the amount of evaporated mois-
ture, drying time, energy consumption, and product quality. The change of material
moisture content and temperature is usually controlled by heat and mass transfer
among the solid surface, the surroundings, and the inside of the drying material.
0
0.2
0.4
0.6
0.8
0 0.2 0.4 0.6 0.8 1aw
X
FIGURE 5.1 Desorption isotherms for typical food products at 40∞C: ( ) apple (Román et al.,
1982), ( ) potato (Crapiste and Rotstein, 1986), and ( ) garlic (Pezzutti and Crapiste, 1997).
52527_C005.indd 12652527_C005.indd 126 10/1/2008 11:42:28 AM10/1/2008 11:42:28 AM
© 2009 by Taylor & Francis Group, LLC

Convective Drying of Foods 127
A drying process is well illustrated in diagrams based on the material moisture
content and drying time (drying curve), the drying rate and drying time (drying
rate curve), and the material temperature and drying time (temperature curve). The
process can also be represented for similar curves by replacing the drying time with
the moisture ratio.
The drying rate is defi ned as the amount of moisture removed from the dried
material in unit time per unit of drying surface. It is calculated from the time derivative
of the moisture content, as will be shown later.
Representative curves of the drying process are constructed from data obtained
under laboratory conditions by measuring the mass and temperature changes of the
food sample with time. Experiments are carried out at the steady state of external
conditions (constant air temperature, velocity, and humidity) using hot air as the
drying agent.
An illustration of a typical drying process for convective drying with constant
external conditions is presented in Figure 5.2 for the case when the initial product
temperature is lower than the air wet bulb temperature. The entire process can be
divided into three characteristic periods:
1. Initial drying period (line A to B): The material is heated while surface
evaporation occurs.
2. First drying period (line B to C): The moisture content decreases linearly
with time, so the drying rate that is proportional to the slope of this line is
constant. This behavior, called the constant drying rate period, takes place
until critical point C is reached.
3. Second drying period (line C to E): The MR functionality with time becomes
a curve at the critical point that approaches the equilibrium moisture content
Xe asymptotically. This period is called the falling drying rate period.
The explanation for the drying curve shapes shown in Figure 5.2 must be focused
on heat and mass transfer phenomena. Initially, the solid surface is totally covered by
a thin liquid layer that behaves as unbound moisture. Thus, the drying rate is usually
independent of the solid and is essentially the same as the evaporation rate from a
free liquid surface under the same air conditions. However, the roughness of the
solid surface and shrinkage may affect the drying rate during this period.
In the initial drying period, the solid (including its surface covered with a liquid
layer) has a lower temperature than the equilibrium temperature Twb. The drying rate
in the range between points A and B in Figure 5.2 increases with the solid temperature
until the surface temperature reaches the Twb value (corresponding to the line B to C).
An opposite effect, cooling of the solid, can be observed when the initial temperature
is higher than Twb. The initial drying period is usually very short and can be neglected
in practice.
No constant drying rate period appears during the drying of hygroscopic solids
or when the process is controlled by internal mass transport.
Temperature curves are important in the development of drying techniques
because the quality of the dry material depends considerably on the product
temperature during the drying process. In the constant drying rate period (B to C in
52527_C005.indd 12752527_C005.indd 127 10/1/2008 11:42:28 AM10/1/2008 11:42:28 AM
© 2009 by Taylor & Francis Group, LLC

128 Advances in Food Dehydration
Figure 5.2) the material temperature usually equals the wet bulb temperature,
allowing the use of higher temperatures for the drying air.
The falling drying rate period begins when the moisture ratio has reached the
critical value. The critical moisture point greatly depends on the material properties
and external conditions. High drying rates will raise the critical point, and low drying
rates will decrease it (Okos et al., 1992). The complex and nonuniform structure of
dried porous materials creates diffi culties in calculating the critical moisture content,
which must be determined by drying experiments performed under conditions
similar to those used in industrial practice. Then, when the drying rate is represented
FIGURE 5.2 Typical behavior for convective drying at constant external conditions;
MRc, critical moisture ratio; nwc, constant drying rate; Tg, gas temperature; Twb, wet bulb
temperature.
Time (t)
Tem
pera
ture
(T
)D
ryin
g ra
te (
n w)
Moi
stur
e ra
tio (
MR
)
A B C D E
MRc
nwc
Tg
Twb
52527_C005.indd 12852527_C005.indd 128 10/1/2008 11:42:28 AM10/1/2008 11:42:28 AM
© 2009 by Taylor & Francis Group, LLC

Convective Drying of Foods 129
as a function of the moisture content in a fi gure, the lower X value fi tting the initial
horizontal line corresponds to the critical moisture content.
At this point the amount of moisture at the drying surface begins to decrease
gradually. Thus, the vapor pressure above the material surface also decreases and the
drying rate decreases. Depending on the drying conditions and material properties,
internal and external resistance can be important. At the beginning of this period the
entire surface is no longer wetted, and the wetted area continually decreases until the
surface is completely dry at point D (Figure 5.2). The second falling rate period
begins at this point when the surface is completely dry. The plane of evaporation
slowly recedes from the surface.
As the moisture content decreases, the internal resistance for mass transfer
increases and may become the prevailing step while the product temperature
approaches the dry bulb temperature. The moisture content asymptotically reaches
the equilibrium value at the relative humidity and temperature of the air.
The shape of the falling drying rate period curve depends on the type of the
material being dried and on the mass transfer conditions. In some cases no sharp
discontinuity occurs at point D (Figure 5.2), and the change from partially wetted to
completely dry conditions at the surface is so gradual that no sharp change is detect-
able. Strumillo and Kudra (1986) presented six types of drying rate curves versus
moisture content in the falling drying period distinguished for the material charac-
teristics: a straight line or concave downward curve for capillary–porous bodies with
large specifi c evaporation surfaces, a concave upward curve for capillary–porous
bodies with small specifi c evaporation surfaces, and more complex curves for
colloidal–capillary–porous bodies.
In convective drying, moisture evaporation from the exposed surface of the food
material occurs because moisture moves from the inside of the solid to the surface.
Geankoplis (1993) briefl y reviewed the principles of two of the theories explaining
the various types of falling rate curves: liquid diffusion and capillary movement in
porous solids. Liquid diffusion occurs when there is a concentration difference
between the inside of the solid and the surface. This mechanism of moisture trans-
port is usually found in nonporous solids. Conversely, when granular and porous
materials are being dried, unbound or free moisture moves through the capillaries
and voids of the solids because of a difference in capillary pressure. At the beginning
of the falling rate period (point C in Figure 5.2) the water moves to the surface by
capillary action, but the water surface layer starts to recede as drying proceeds.
As the water is continuously removed and replaced by air, a point is reached where
there is insuffi cient water left to maintain continuous fi lms across the pores and the
rate of drying suddenly decreases, starting the second falling rate period (point D).
Then, diffusion of water vapor in the pores may become the prevailing mechanisms
of mass transfer.
Several other mechanisms of internal mass transfer have been proposed for
drying: surface diffusion of water, suggesting that molecules hop from one adsorp-
tion site to another; thermal diffusion, which is due to a temperature gradient; or
vapor mass transfer (Knudsen diffusion, effusion, hydrodynamic fl ow, slip fl ow,
etc.). More than one mechanism may contribute to the total fl ow, and the contribu-
tion of different mechanisms may change as the drying process proceeds (Bruin and
52527_C005.indd 12952527_C005.indd 129 10/1/2008 11:42:28 AM10/1/2008 11:42:28 AM
© 2009 by Taylor & Francis Group, LLC

130 Advances in Food Dehydration
Luyben, 1980). At temperatures approaching and exceeding the boiling point of
water, rapid vapor generation may produce signifi cant total pressure gradients in
addition to partial vapor pressure gradients. Total pressure-driven fl ow may occur
in moderate temperature vacuum drying, high temperature convective and contact
drying, and superheated steam drying.
Crapiste et al. (1988) developed a complete theory of drying for cellular material
based on water activity as the driving force. They concluded that most of these
mechanisms of water migration can be lumped together into a diffusion-like
equation.
The drying rate curve in the second falling rate period in fi ne porous solids may
conform to the diffusion law and the curve is concave upward. The drying rate
curve in this period is often straight for very porous solids with large pores, and the
diffusion equations do not apply. In drying of many food materials, the movement
of water in the falling rate period has been represented by a diffusion theory. The
effective diffusivity (Deff) is usually lower than that of the fi rst falling rate period
although the temperature increases to Tdb, because vapor diffusion is the prevailing
mechanism in this stage.
When more than one driving force is present in a process, cross-effects can
occur. Development of drying models accounting for cross-effects between different
driving forces was performed using irreversible thermodynamics theory. Okos et al.
(1992) summarized the results of different studies utilizing the irreversible thermo-
dynamics framework to model heat and mass transfer in a porous medium and drying
of porous food material. They concluded that cross-effects are negligible compared
to direct transport mechanisms.
5.4 DRYING TIME CALCULATIONS
The drying rate (nw) can be calculated from
nw � � ms ___ As
dX ___ dt
� � rs __ av
dX ___ dt
(5.6)
where ms is the mass of the dry solid, rs is the density of the dry solid, As is the
external area exposed to drying, and av is the area per unit volume.
Drying times should be determined separately for the constant and falling rate
drying periods because of the different characters of the drying rate curves.
5.4.1 CONSTANT DRYING RATE PERIOD (I)
The drying rate in this period is constant and depends on the convective heat (h) and
mass (kg) transfer coeffi cients between the air and the solid surface. Thus, this period
is strongly dependent on the drying agent velocity.
During the constant rate period, the temperature and moisture profi les inside
the product are approximately fl at because the moisture movement rate within the
solid is suffi cient to keep the surface saturated. Therefore, the drying rate is
controlled by the rate of heat transfer to the surface that supplies the latent heat
for evaporation.
52527_C005.indd 13052527_C005.indd 130 10/1/2008 11:42:28 AM10/1/2008 11:42:28 AM
© 2009 by Taylor & Francis Group, LLC

Convective Drying of Foods 131
By considering only heat transfer to the solid surface by convection from hot air
and moisture transfer from the surface to the air (Figure 5.3), it is possible to obtain
the following equation:
s ws w s g wb
s s v
( ) ( )gk A P P hA T TdXdt m m H
- -= - = - D
(5.7)
where Pws and Pw represent the water vapor partial pressure at the surface of the
material and at the air, respectively; Tg is the gas temperature; Twb is the surface
material temperature; and �Hv is the heat of vaporization of water at the drying
temperature. The vapor pressure at the product surface can be evaluated from the
sorption isotherm according to Eq. (5.5).
The heat transfer coeffi cient (h) can be predicted using correlations given in the
literature in terms of dimensionless numbers (Table 5.1). Mass transfer coeffi cients
can be derived from direct correlations or from the better-known heat transfer
coeffi cients using mass energy transfer analogies (Crapiste and Rotstein, 1997).
During the constant drying rate period, the rate of evaporation between points B
and C (Figure 5.2) will be constant and equal to nwc. In classical drying theory it is
assumed that nwc is equal to the evaporation rate from a free surface. Nevertheless,
Strumillo and Kudra (1986) referred to more thorough observations showing that
the value of nwc depends on the type of dried material. They found that it is usually
up to 30% lower than the values obtained in the process of liquid evaporation from a
free surface.
Although the rate of drying nw can be calculated using the heat transfer equation
or the mass transfer equation, it is more reliable to use the heat transfer equation,
because an error in determining the interface temperature Twb affects the driving
force (T – Twb) much less than it affects the difference (Pws – Pw) (Geankoplis, 1993).
To estimate the drying time during the constant rate period, integration of
Eq. (5.7) led to
Is v s
I 0 c 0 c0 s g wb s ws w
( ) ( )( ) ( )
t
g
m H mt dt X X X X
A h T T A k P PD
= = - = -- -Ú
(5.8)
FIGURE 5.3 Scheme of heat and mass transfer in constant rate drying.
Food product
Drying agentTg, H, Pw
q nwSurface atTwb, Hw, Pws
52527_C005.indd 13152527_C005.indd 131 10/1/2008 11:42:28 AM10/1/2008 11:42:28 AM
© 2009 by Taylor & Francis Group, LLC

132 Advances in Food Dehydration
where Xc is the critical moisture content. It is important to take into account that the
thickness of the dried material is present in Eqs. (5.7) and (5.8) through the relation
ms/As (�rs/av).
5.4.2 FALLING DRYING RATE PERIOD (II)
The shape of the drying rate curve in this period depends mainly on the type of material.
The drying conditions used in the constant drying rate period can produce physical
modifi cations on the material that infl uence moisture transport properties. As the
drying rate decreases, the infl uence of external conditions becomes less pronounced.
5.4.2.1 Graphical Resolution
The drying time in the falling drying rate period can be calculated from Eq. (5.6) in
its integrated form,
f
I c
s
IIs w
t X
t X
m dXt dt
A n= = -Ú Ú
(5.9)
where Xf is the fi nal material moisture content. However, in this period the drying
rate is variable and cannot be eliminated from the integral.
TABLE 5.1Correlations for Heat Transfer Coeffi cients
Correlation Conditions Ref.
Single Particles
Nu � 0.664 Re0.5 Pr1/3 Parallel to fl at sheet, 103 � Re � 3 × 10⁵ Perry and Green (1999)
Nu � 0.0366 Re0.8 Pr1/3 Parallel to fl at sheet, Re � 3 × 10⁵ Geankoplis (1993)
Nu � 0.683 Re0.466 Pr1/3 Cylinder, 40 � Re � 4 × 10³ Perry and Green (1999)
Nu � 2.0 � 0.6 Re0.5 Pr1/3 Single sphere, Re � 7 × 10⁴ Perry and Green (1999)
Nu � 0.036 Re0.8 Pr1/3 Drying, Re � 1.5 × 10⁵ Treybal (1980)
Nu � 0.249 Re0.64 Drying food particles Ratti and Crapiste (1995)
Particle Beds
Nu � 1.95 Re0.49 Pr1/3 Packed bed, Re � 350 Perry and Green (1999)
Nu � 1.064 Re0.59 Pr1/3 Packed bed, Re � 350 Perry and Green (1999)
Nu � 2.0 � 1.1 Re0.6 Pr1/3 Packed bed, steady and unsteady state Wakao et al. (1979)
Nu � 0.33 Re0.6 Rotary dryers Bakker-Arkema (1986)
Nu � 0.0133 Re1.6 Fluidized beds, Re � 80 Strumillo and Kudra (1986)
Nu � 0.316 Re0.8 Fluidized beds, 80 � Re � 500 Strumillo and Kudra (1986)
Nu � 2.0 � a Re0.6Pr1/3 Spray dryers, a � 0.5–0.6 Masters (1979)
Nu � hLc /k, Re � GLc /m, Pr � cpm /k, where h is the heat transfer coeffi cient, Lc is the characteristic
dimension of the material, k is the gas thermal conductivity, G is the gas mass fl ux, m is the gas viscosity,
and cp is the heat capacity of air.
52527_C005.indd 13252527_C005.indd 132 10/1/2008 11:42:29 AM10/1/2008 11:42:29 AM
© 2009 by Taylor & Francis Group, LLC

Convective Drying of Foods 133
For any shape of the falling rate drying curve, Eq. (5.9) can be graphically
integrated by plotting 1/nw versus X and determining the area under the curve. The
drying time of the falling drying rate period can be obtained by substituting the
values of the integral obtained in Eq. (5.9).
5.4.2.2 Theoretical Models
As stated, in many instances the moisture transfer rate in the falling rate period is
governed by the internal movement of moisture via diffusion or via capillary
movement.
5.4.2.2.1 Diffusive ModelsWhen liquid or vapor diffusion of moisture controls the rate of drying in the falling
rate period, the equations for diffusion can be used:
∂X ___ ∂t � —z (Deff —z X) (5.10)
where Deff represents an effective transport coeffi cient and z represents the spatial
coordinate.
Drying curves for several foods have been fi tted by diffusion equations. This
type of diffusion is often characteristic of relatively slow drying in nongranular
materials such as gelatin, and in the later stages of drying of bound water in foods,
starches, and other hydrophilic solids.
During diffusion drying, the resistance to mass transfer of water vapor from
the surface is usually very small, and the diffusion in the solid controls the rate
of drying. However, in some cases both internal and external resistance should be
considered.
Crank (1967) gave analytical solutions of Fick’s law [Eq. (5.10)] with different
boundary conditions, which are valid for one-dimensional transport, regular geome-
tries, constant diffusivity, and uniform initial moisture distribution (X0 uniform at
initial time t � t0). The solutions of Fick’s law for internal mass transfer control are
the following:
1. For a sphere of radius R:
2 2 eff 0
2 2 2
1
( )6 1MR exp
n
D t tn
n Rp
p
•
=
-Ê ˆ= -Á ˜Ë ¯Â
(5.11)
Examples of products modeled as spheres include agricultural products
(Alves-Filho and Rumsey, 1985), carrots (Doymaz, 2004), and parboiled
wheat (Mohapatra and Rao, 2005).
2. For a slab of thickness L and moisture loss occurring from both sides:
2 2 eff 0
2 2 2
0
( )8 1MR exp (2 1)
(2 1)n
D t tn
n Lp
p
•
=
-Ê ˆ= - +Á ˜Ë ¯+Â
(5.12)
52527_C005.indd 13352527_C005.indd 133 10/1/2008 11:42:29 AM10/1/2008 11:42:29 AM
© 2009 by Taylor & Francis Group, LLC

134 Advances in Food Dehydration
Foods modeled using a slab geometry include apples (Wang et al., 2007),
pumpkins (Doymaz, 2007), potatoes (Hassini et al., 2007), bananas (Nguyen
and Price, 2007), and yogurt (Hayaloglu et al., 2007).
3. For a cylinder of radius R:
2
eff 02 2
1
8 1MR exp( ( ))
( )n
nn
D t tR
bb
•
=
= - -Â (5.13)
where bn2 are the Bessel function roots of the fi rst kind and zero order. Pasta
(Andrieu and Stamatopoulos, 1986) and garlic (Sharma and Prasad, 2004)
were modeled using the solution of Fick’s law for a cylinder.
At suffi ciently large times, only the leading term in the series expansion [Eqs. (5.11)
to (5.13)] needs to be taken. The falling period time of drying for a slab, for example,
can be obtained from Eq. (5.12) using only the fi rst term as follows:
2
0 2 2
eff
4 8ln MR
Lt t
Dp pÊ ˆ- = Á ˜Ë ¯
(5.14)
This equation states that when internal diffusion controls the process, the drying
time varies directly as the square of the thickness. For more exact calculations,
Eq. (5.10) must be solved by numerical methods.
Diffusion coeffi cients are typically determined from the slope of the linear
segments when experimental drying data are plotted in terms of ln MR versus time.
Experiments should be carried out under drying conditions, particularly with air
velocity, in which the external resistance to mass transfer is negligible.
Various research groups have made efforts to include other important parameters
in the diffusion model. Rotstein et al. (1974) studied the effects of the sample shape
and size on the diffusivity constant. They concluded that the cross-sectional area
should be incorporated into an analytical model to describe diffusivity. Steffe and
Singh (1980) used a more complex model to incorporate shape effects with constant
diffusivity and without heat transfer and shrinkage effects.
Equations (5.11) to (5.13) can be used to predict the drying curves only for small
changes in moisture, because the effective diffusivity changes with moisture and
temperature. However, these equations are widely employed with average effective
diffusivity values as a good approximation to represent the drying curves of most
food products.
The dependence of the effective diffusivity on temperature and moisture is
generally described by an Arrhenius type equation as follows:
a
eff 0
c
( )( )exp
E XD D X
R T
Ê ˆ= -Á ˜Ë ¯ (5.15)
where Ea is the activation energy that may depend on the type of solid and the
moisture content, D0 is a preexponential term, and T is the absolute temperature.
52527_C005.indd 13452527_C005.indd 134 10/1/2008 11:42:29 AM10/1/2008 11:42:29 AM
© 2009 by Taylor & Francis Group, LLC

Convective Drying of Foods 135
Table 5.2 provides the effective diffusivity and activation energy data reported
for various food products as an example of the great applicability of the diffusion
model found in the literature. Bruin and Luyben (1980) and Okos et al. (1992)
conducted reviews of these parameters for several foods at different moisture contents
and external conditions.
Xiong et al. (1991) developed a model based on the postulation that the decrease
in the effective diffusivity at lower moisture contents is a result of a decrease in the
availability of water molecules for diffusion.
5.4.2.2.1.1 Simplifi ed ModelsSimplifi ed equations for diffusion at a suffi ciently long period of processing can be
rewritten as
MR � A exp(�Kt) (5.16)
where K is a drying rate constant. This equation has been applied to represent experi-
mental data on drying of grains (Brooker et al., 1974) and tropical fruits (Nguyen
and Price, 2007). Krokida et al. (2004) reviewed the drying experimental data for
cereal products, fi sh, fruits, legumes, nuts, vegetables, and model foods. They obtained
TABLE 5.2Effective Water Diffusivities (Deff) and Activation Energies (Ea) for Food Products
Product T (°C) Deff ¥ 1010 (m2/s) Ea (kJ/mol) Ref.
Apple pomace 75–105 11.48–21.95
(fi rst period)
68.05–12.82
(second period)
23.951
25.492
Wang et al. (2007)
Banana 30–70 1.3–7.8 39.8 Nguyen and Price (2007)
Black tea 80–120 0.114–0.298 406.02 Panchariya et al. (2002)
Broccoli 50–75 131.85–182.56 Mrkic et al. (2007)
Carrot 50–70 13.04–24.18 28.36 Doymaz (2004)
Carrot (core) 50–70
40–70
8.64–13.73
6.42–14.7 24.78
Srikiatden and Roberts (2006)
Carrot (cortex) 50–70
40–70
8.32–11.53
6.68–11.83 16.53
Srikiatden and Roberts (2006)
Garlic 45–75 0.34–0.59 16.92 Pezzutti and Crapiste (1997)
Mint leaves 35–60 30.7–194.1 62.96 Doymaz (2006)
Parboiled wheat 40–60 1.218–2.861 37.013 Mohapatra and Rao (2005)
Pasta (regular) 44–71 0.166–0.358 21.757 Xiong et al. (1991)
Potato 50–70
40–70
5.94–9.69
4.68–10.2 23.61
Srikiatden and Roberts (2006)
Pumpkin 50–60 3.88–9.38 78.93 Doymaz (2007)
Yogurt 40–50 9.5–13 26.07 Hayaloglu et al. (2007)
52527_C005.indd 13552527_C005.indd 135 10/1/2008 11:42:29 AM10/1/2008 11:42:29 AM
© 2009 by Taylor & Francis Group, LLC

136 Advances in Food Dehydration
an empirical equation to represent the functionality of drying rate constant K with
the temperature, air velocity, water activity, and particle diameter.
Kiranoudis et al. (1992) applied this phenomenological mass transfer model to
represent the drying behavior of vegetables such as potatoes, onions, carrots, and green
peppers. They proposed that the drying constant varied with the material characteristic
dimension, air temperature, humidity, and velocity. Kiranoudis and colleagues compared
the behavior of this phenomenological model with mechanistic mass transfer, including
moisture diffusion in the solid phase toward its external surface plus vaporization and
convective transfer of the vapor into the air stream. They found that the mechanistic
mass transfer improved the representation of the experimental moisture content.
5.4.2.2.1.2 Capillary Flow ModelDepending on the pore sizes of granular materials, water can fl ow by capillary action
rather than by diffusion from regions of high concentrations to regions of low con-
centrations. Capillary forces provide the driving force for moving the water through
the pores of the material to the drying surface.
Geankoplis (1993) derived an equation for the drying time when the fl ow is by
capillary movement in the falling rate period, assuming that rate of drying nw varies
linearly with X through the origin:
s c e c e s v c e c e
wc e w e
( ) ( ) ( ) ( )ln ln
( ) ( ) ( )
L X X X X L H X X X Xt
n X X h T T X X
r r- - D - -= =
- - -
(5.17)
where L is the thickness of the material.
Equation (5.17) states that when capillary fl ow controls the falling rate period,
the drying time varies directly with the thickness and depends on the gas velocity,
temperature, and humidity, contrary to the diffusion process.
Moyers and Baldwin (1999) explained how to elucidate what the mechanism
of drying in the falling rate period is. The experimental drying data expressed as
ln[(X – Xe)/(Xc – Xe)] are plotted versus time. If a straight line is obtained, then diffu-
sion or capillary fl ow occurs. If the relation for capillary fl ow applies, the slope of this
line is related to Eq. (5.17), which contains constant drying rate nwc. The value of nwc
is calculated from the measured slope of the line. If it agrees with the experimental
value in the constant drying period, the moisture movement is by capillary fl ow. If the
values of nwc do not agree, the moisture movement is by diffusion.
These forms of calculations allow the determination of the drying time necessary
to obtain the desired fi nal moisture content by adding the duration of the constant
drying rate period (tI) to the corresponding falling drying rate period (tII).
5.4.3 GENERALIZED DRYING CURVES
One possible mass transfer model is the use of a characteristic drying curve. This
approach assumes that at each volume-averaged free moisture content value there is
a corresponding specifi c drying rate relative to the unhindered drying rate in the fi rst
drying period that is independent of external drying conditions. Van Meel (1958)
developed the characteristic drying curve method to obtain a normalized drying
52527_C005.indd 13652527_C005.indd 136 10/1/2008 11:42:29 AM10/1/2008 11:42:29 AM
© 2009 by Taylor & Francis Group, LLC

Convective Drying of Foods 137
curve for each material while avoiding the necessity of descriptions of the heteroge-
neous structure and various compositions throughout the food samples. This method
is based on a normalized evaporation rate f, a function of a normalized moisture
content, which is characteristic for each product being dried and independent of the
external drying conditions (Crapiste and Rotstein, 1997), so that
w e
wc c e
n X Xf
n X X
Ê ˆ-= Á ˜-Ë ¯
(5.18)
Thus, the drying curve is normalized to pass through the point (1, 1) at the criti-
cal point of transition in drying behavior and the point (0, 0) at equilibrium. This
representation is attractive because it leads to a simple lumped parameter expression
for the drying rate:
nw � fnwc � fkg(Pws � Pw) (5.19)
In particular, the concept of a characteristic drying curve states that the shape of
the drying rate curve for a given material is unique and independent of the gas
temperature, humidity, and velocity. Drying rate curves for the same material under
different operating conditions should be geometrically similar, according to this
hypothesis. Equation (5.19) has been used extensively as the basis for understanding
the behavior of industrial drying plants because of its simplicity and the separation
of the parameters that infl uence the drying process: the material itself ( f) and the
design of the dryer, and the process conditions (kg, Pws, and Pw).
Function f is obtained by plotting the normalized drying rate (nw nwc) versus MR
according to Eq. (5.18) (Figure 5.4). The falling rate period is then represented with
a concave curve. A single linear characteristic drying curve appears in the limit of
the slow drying of thick, fairly impervious materials. Because the constant drying
rate does not appear clearly for most biological materials, the short period where the
drying rate is maximum is often considered as the fi rst period. Fornell et al. (1980)
suggested using theoretical calculations for free evaporation to evaluate nwc when the
constant drying period is absent.
Keey (1972, 1978, 1992) and Keey and Suzuki (1974) discussed fundamentals and
applications for which a characteristic curve might apply, using a simplifi ed analysis
based on an evaporative front receding through a porous mass. Their analysis shows
that there is a unique curve when the material is thin and the effective moisture
diffusivity is high. Characteristic drying curves might then be expected for small,
microporous particles dried individually. The concept worked well for modest ranges
of air temperature, humidity, and velocity. There is a suffi cient body of data to
suggest that a characteristic drying curve may be found to describe the drying of
discrete particles over a range of conditions that normally exist within a commercial
dryer. This method has been used to represent the drying behavior of several food
materials, such as milk powder (Langrish and Kockel, 2001), bananas (Jannot et al.,
2004), and spirulina (Desmorieux and Decaen, 2005). Keey (1992) reviewed some
agricultural products, and Laws and Parry (1983) provided an example of the
52527_C005.indd 13752527_C005.indd 137 10/1/2008 11:42:29 AM10/1/2008 11:42:29 AM
© 2009 by Taylor & Francis Group, LLC

138 Advances in Food Dehydration
application of a characteristic drying curve to other agricultural products. However,
Baini and Langrish (2007) found that the concept of the characteristic drying curve
method was not applicable to describe the intermittent drying of bananas.
Ratti and Crapiste (1992) extended those formulations to shrinking food systems
and found the following expression for nw:
ws w
w
0 m
( )
1 ( / )
gk P Pn
X Biq�
��
(5.20)
where q is the generalized drying parameter only as a function of water content and
Bim is the mass transfer Biot number. On this basis, the drying process can be modeled
as a coupled mass and heat transfer mechanism by using Eq. (5.20) as follows:
0
s w w w
g
s m 0
( )( )
(1 ) ( / )(1 ( / ))p g
H a P PdT hAT T
dt m X C h k Bi XqÈ ˘D -
= - -Í ˙+ +Í ˙Î ˚
(5.21)
s m 0(1 ( / ))
gAkdX
dt m Bi Xq=
+
(5.22)
Predictions of this model compared properly with experimental drying data for
potatoes, apples, and carrots (Ratti and Crapiste, 1992). This model was later used
Normalized moisture ratio (MR/MRc)
Nor
mal
ized
dry
ing
rate
(n w
/nw
c)
0 1
1
0
FIGURE 5.4 Typical characteristic drying curves for food convective drying.
52527_C005.indd 13852527_C005.indd 138 10/1/2008 11:42:29 AM10/1/2008 11:42:29 AM
© 2009 by Taylor & Francis Group, LLC
Convective Drying of Foods 139
for accurate prediction of the air-drying kinetics of grapes, white mushrooms, and
bananas under diverse drying conditions (Fontaine and Ratti, 1999).
5.4.4 OTHER METHODS
Strumillo and Kudra (1986) described a method of calculating the total drying time
including both the constant and falling drying rate periods, based on a single kinetic
equation. The principle of this method is based on the generalized mass transfer
equation written for the drying process in the form
dX ___ dt
� K(X0 - X)(X - Xe ) (5.23)
where K is assumed to be constant in the fi rst and second drying periods and the
expression (X0 – X) (X – Xe) represents the driving force of drying. Drying rate coef-
fi cient K includes the structural parameters as well as thermal and thermodynamic
properties of the drying materials. Integration of Eq. (5.23) from the initial equilibrium
moisture content X0e, where the temperature at the material surface is equal to Twb,
to the fi nal moisture content X gives the following relationship:
t � z _________
K (X0 - Xe ) with z � ln
(X0 - X)(X0e - Xe) _______________ (X0 - X0e)(X - Xe)
(5.24)
The drying curves depicted in coordinates t–z give a straight line with the slope
related to the drying rate coeffi cient and the intercept on the z axis equal to X0e.
The mass transfer coeffi cient for the falling drying rate period can be
expressed as
kg � ms ___ As
K(X0 - Xe ) (5.25)
Thus, if the mass transfer coeffi cient is known, K can be obtained from Eq. (5.25)
and the drying time can be calculated on the basis of Eq. (5.24) without any experi-
mental drying curve.
Among semitheoretical and empirical thin layer drying models, Table 5.3 lists
other equations that have been used widely in drying of food products.
5.5 SELECTIVE DRYING OF FOODS
In industrial manufacturing of many products the moisture to be removed does not
consist of one component but is of a mixture of two or more solvents. Multicomponent
moisture removal has been applied to a broad spectrum of pharmaceutical products
and aroma retention in food drying. Desolventization of humid food products or
by-products after solvent extraction is another case of multicomponent drying.
Because most liquid mixtures are thermodynamically nonideal liquids, this nonideal
behavior has to be considered in process simulation and design. In some cases
the liquid mixture is only partially miscible, as occurs in water and essential oils
mixtures, and some multicomponent systems may form two liquid phases.
52527_C005.indd 13952527_C005.indd 139 10/1/2008 11:42:30 AM10/1/2008 11:42:30 AM
© 2009 by Taylor & Francis Group, LLC

140 Advances in Food Dehydration
The favorable removal of one component, in which one component of the
moisture is removed preferentially during drying of a product, is called selective drying. A well-known example is aroma retention in the drying of foodstuffs where
it is important to remove only the water and some aroma compounds should remain
inside the material.
As illustrated, the drying process of single component moisture is divided into
periods of constant and falling drying rates, each period being the result of interac-
tions between diffusion or convection in the gas and liquid or vapor diffusion and
capillary movement in the solid. The direction and intensity of each process are
governed by the appropriate driving force resulting from the difference between the
equilibrium value of the partial pressure of moisture at the interface and its value in
the bulk of the gas or a difference in capillary potential between regions of the solid.
In multicomponent moisture removal, each of these processes is also complicated
by the interrelationship of the individual components of the mixture as well as the
sorption behavior of each solvent in the solid. The gas mass transfer, the solid mass
transfer, and the multicomponent vapor–liquid equilibrium govern the selectivity of
drying. Some particular issues are observed in the process of multicomponent mois-
ture drying, that is, the wet bulb temperature changes during the process or the initial
composition of moisture can infl uence what component evaporates preferentially.
Pakowski (1992) presented a detailed description of theoretical models for
multicomponent moisture drying processes and concluded that the major problem is
that the selectivity of drying is not only dependent on the identity and initial compo-
sition of the liquid system but also on the characteristics of the solid and the method
of drying.
Thijssen (1971, 1979) was one of the fi rst who reported the selectivity of drying.
He studied aroma retention during the drying of foodstuffs and spray dried a solution
of water, alcohol, and sugar, fi nding water selective diffusion.
TABLE 5.3Other Mathematical Models for Representing Drying Curves
Model Name Model MR Ref.
Lewis exp(–kt) Wang et al. (2007)
Page exp(–ktn) Doymaz (2004)
Modifi ed Page exp(–kt)n Wang et al. (2007)
Modifi ed Page equation II exp(–c(t/ L c 2 )n) Wang et al. (2007)
Henderson and Pabis a exp(–kt) Doymaz (2004)
Logarithmic a exp(–kt) � c Togrul and Pehlivan (2002)
Two-term model a exp(–k0t) � b exp(–k1t) Henderson (1974)
Approximation of diffusion a exp(–kt) � (1 – a) exp(–kat) Apkinar (2006)
Wang and Singh 1 � at � bt2 Wang et al. (2007)
Quadratic equation atn � btn–1 � . . . � d Srinivasa et al. (2004)
Simplifi ed Fick’s diffusion a exp(–c(t/Lc
2)) Wang et al. (2007)
Midilli–Kucuk a exp(�ktn) � bt Apkinar (2006)
52527_C005.indd 14052527_C005.indd 140 10/1/2008 11:42:30 AM10/1/2008 11:42:30 AM
© 2009 by Taylor & Francis Group, LLC

Convective Drying of Foods 141
Thurner and Schlünder (1986) investigated the drying characteristics of a porous
material wetted with a binary liquid mixture. They demonstrated the dependence of the
selectivity and drying rate on the drying conditions and the properties of the porous
material. Quite often the drying process is nonselective because of the controlling
solid or liquid mass transfer. However, at the early stages of drying, selectivity might
be expected, because the gas mass transfer is in control at the beginning. This so-called
initial selectivity can be extended to the whole drying process by intermittent drying
(Heimann et al., 1986).
Sorptional equilibria of solvent mixtures in foodstuffs become key data in
selective drying. Carrín et al. (2004) determined and modeled binary equilibrium
sorption isotherms of water–ethanol over different food-related solids, reporting
nonadditive equilibrium behavior.
The drying behavior of a solid material wetted with a ternary miscible liquid
mixture was studied experimentally and modeled (Martinez and Setterwall, 1991;
Vidaurre and Martinez, 1997). The infl uence of the transport of gas and liquid in the
pores of the material and of the properties of the material itself was not investigated
by these researchers.
Steinbeck and Schlünder (1998) examined the evaporation of a ternary liquid
mixture, which forms two liquid phases, with respect to drying. They fi rst conducted
experimental and theoretical investigations of the evaporation of a ternary partially
miscible liquid mixture. The selectivity of the process is controlled by the vapor–
liquid equilibrium and the gas mass transfer. They carried on the work with studies
on the infl uence of a liquid moisture that forms two liquid phases during the drying
process. Steinbeck (1999) investigated the infl uence of two-phase moisture on the
drying characteristics of a nonhygroscopic capillary porous material. He reported
that the drying rate was not signifi cantly infl uenced by the two-phase moisture and
the selectivity could be shifted by the temperature of the drying air and by the pore
size of the porous solid.
5.6 LATEST ADVANCES IN CONVECTIVE FOOD DRYING
The air temperature, humidity, and velocity in convective drying have a signifi cant
effect not only on the drying kinetics but also on the quality of food products. Most
food materials are heat sensitive, so drying at relatively high temperatures implies
structural, organoleptic, and nutritional changes during dehydration (Crapiste, 2000).
The most important product quality parameters such as color (pigments, nonenzy-
matic browning) and nutritive value (antioxidants, vitamins) are often manifested by
a progressive loss with increasing temperature. The dependence of the reaction rate
constants on temperature implies that a low temperature drying process would result
in less quality degradation. A longer constant drying rate period increases the
nutrient retention because, due to evaporative cooling, the product is at a lower
temperature (Chou and Chua, 2001). As technology advances, more options will be
available to improve product quality by controlling the drying conditions.
The necessity of improving the drying characteristics of the food product during
convective drying has caused the derivation of hybrid drying technologies, such as
heat pump drying (HPD) or a combination of different drying equipment.
52527_C005.indd 14152527_C005.indd 141 10/1/2008 11:42:30 AM10/1/2008 11:42:30 AM
© 2009 by Taylor & Francis Group, LLC

142 Advances in Food Dehydration
5.6.1 TIME VARIABLE DRYING SCHEMES
By employing time varying temperature and/or air-fl ow profi les during drying of food
products it is possible to reduce the degradation of quality among another advantages.
Several investigations have been carried out to study different time-dependent drying
schemes with different foods: dry aeration of corn in a thin layer (Sabbah et al., 1972),
intermittent drying of corn (Zhang and Litchfi eld, 1991), intermittent drying of pea-
nuts with air-fl ow interruption (Troger and Butler, 1980), intermittent drying of maize
in a bin dryer (Harnoy and Radajewski, 1982), sinusoidal heating of wheat in a fl uid-
ized bed (Giowacka and Malczewski, 1986), intermittent drying of carrot pieces in a
vibrated bed batch (Pan et al., 1999), and drying of guava pieces under isothermal as
well as time varying air temperatures (Chua, Chow, et al., 2000).
Devahastin and Mujumdar (1999) studied a mathematical model demonstrating
the feasibility and advantages of operating a dryer by varying the temperature of the
inlet drying air and reducing the drying time by up to 30%.
Chua, Mujumdar, Chou, Ho, et al. (2000) and Chua, Mujumdar, Chou, Howlader,
et al. (2000) studied the effect of nonuniform temperature drying on color changes
of food products. They found that color changes can be reduced by using different
temperature profi les. Products with a high sugar content favor a time varying profi le
with a low starting temperature. Products with a low sugar content such as potatoes
allow the use of higher temperature profi les to yield higher drying rates without any
pronounced change in the overall color change. Prescribing the appropriate cyclic
temperature variation schemes, Chua and colleagues showed that the reductions in
the overall color change for potatoes and bananas were 87 and 67%, respectively.
Another time varying drying scheme is through the use of a pressure-regulatory
system with an operating pressure range from above vacuum to 1 atm. The operation
may be worked at lower pressure continuously at a fi xed level, intermittently, or
following a prescribed cyclic pattern, depending principally on the drying kinetics of
the product and its thermal properties. Maache-Rezzoug et al. (2001) used a
pressure-swing drying mechanism, consisting of dehydration by successive decom-
pressions, for food products requiring the production of homogeneous thin sheets.
The recommended process involves cycles during which the material is placed in
desiccated air at a given pressure and then subjected to an instantaneous (200 ms)
pressure drop to a vacuum (7 to 90 kPa), repeating this procedure until the desired
moisture is obtained. The drying time savings using this pressure-swing drying
process could be as high as 480 and 700 min in comparison to vacuum and hot-air
drying systems.
The principal characteristics of time-dependent drying found in these studies are
thermal energy savings, shorter effective drying time, higher drying rates, lower
product surface temperature, and higher product quality (improved color and nutrient
retention, reduced shrinkage, cracking, and brittleness).
5.6.2 HEAT PUMP DRYING (HPD)
Heat-sensitive high value products are often freeze-dried, which is an extremely
expensive drying process. A heat pump can be coupled with the drying unit to increase
the air temperature of the process and reduce energy consumption. Integration of the
52527_C005.indd 14252527_C005.indd 142 10/1/2008 11:42:30 AM10/1/2008 11:42:30 AM
© 2009 by Taylor & Francis Group, LLC

Convective Drying of Foods 143
heat pump and the dryer is known as a heat pump dryer or heat pump assisted dryer.
There has been great interest in the HPD system when low-temperature drying
and well-controlled drying conditions are required to enhance the quality of food
products. Their ability to convert the latent heat of condensation into sensible heat at
the hot gas condenser makes them unique in drying applications.
In addition to the higher energy effi ciency obtained with HPD compared with
conventional hot-air drying, the dry product quality may be improved because of the
special temperature and humidity conditions obtained during the process. The higher
volatile retention in heat-pump dried samples is probably attributable to their reduced
degradation when lower drying temperatures are employed compared to the higher
temperatures of commercial dryers. Because HPD is conducted in a closed chamber,
any compound that volatilizes will remain within the drying chamber, building its
partial pressure up within the chamber, thus retarding further volatilization from the
product (Perera and Rahman, 1997). Table 5.4 presents a summary of recent work on
HPD of selected food products. A more detailed description about HPD is provided
in Chapter 13.
TABLE 5.4Examples of Recent Works Conducted on HPD of Food Products
Application and Results Ref.
Herbs (Jew’s mallow, spearmint, and parsley): maximum dryer
productivity was obtained at 55°C, air velocity of 2.7 m/s, and
dryer surface load of 28 kg/m2.
Fatouh et al. (2006)
Apple, guava, and potato (modifi ed environment with nitrogen
and carbon dioxide): better physical properties were obtained
at 45°C and 10% RH.
Hawlader et al. (2006)
Papaya and mango glace (effects of initial moisture content,
cubic size, and effective diffusion coeffi cient of products on
the optimum conditions, modeled and optimized): the physical
properties of the product signifi cantly affect the optimum
air-fl ow rate and evaporator bypass air ratio.
Teeboonma et al. (2003)
Chicken meat (two multistage drying technologies): superheated
steam drying � HPD was the most suitable method.
Nathakaranakule et al. (2007)
Potato slice: optimization of a two-stage evaporator system Ho et al. (2001)
Agricultural and marine products: scheduling drying conditions
let the quality of the products be improved.
Chou et al. (1998)
Banana: HPD resulted was suitable and cheap for drying high
moisture materials.
Prasertsan and Saen-saby (1998),
Prasertsan et al. (1997)
Onion slices: shorter processing time implied energy savings
and better product quality in comparison to a conventional
hot air system.
Rossi et al. (1992)
Fish: Dried products were high quality. Product properties
(porosity, rehydration rates, strength, texture, and color) were
regulated by programming temperature.
Strømmen and Krammer (1994)
52527_C005.indd 14352527_C005.indd 143 10/1/2008 11:42:30 AM10/1/2008 11:42:30 AM
© 2009 by Taylor & Francis Group, LLC

144 Advances in Food Dehydration
When only a marginal amount of convection air is needed to evaporate moisture,
as happens during drying of foods with large falling rate periods, the drying cham-
bers can be operated in sequence as a multiple dryer system. The air from the heat
pump can be directed sequentially to two or more chambers or can be divided up
according to a preprogrammed schedule to two or more drying chambers. This makes
it possible to dry the same or different products at the same time. Thus, the heat pump
can be operated at a near optimal level at all times (Chou and Chua, 2001).
In addition to the advantages of HPD, the principal advantages of operating a
dryer with multiple drying chambers are focused on cost: improved energy effi ciency
with proper channeling of conditioned air to chambers and reduced capital cost in
equipment and fl oor space requirements.
5.6.3 SUPERHEATED STEAM DRYING UNDER VACUUM
An interesting alternative to using hot air is low-pressure superheated steam (LPSS).
Because heat-sensitive foods are damaged at the saturation temperature of super-
heated steam corresponding to atmospheric or higher pressures, one possible way to
avoid or moderate that problem is to operate the dryer at reduced pressure. Several
groups found that it results in signifi cantly less damage to the dried food material
because it works at lower temperatures and there is no oxygen present. In general, the
resulting product keeps its original color and shape and shows a highly porous struc-
ture that makes it easily rehydrated. From an economical point of view, LPSS
requires less energy than hot-air drying for the same duty.
Elustondo et al. (2001) conducted experimental and theoretical studies applying
LPSS to dry shrimp, bananas, apples, potatoes, and cassava slices. They developed a
semiempirical mathematical model to calculate the drying rate of a given product
assuming that the water removal is carried out by evaporation in a moving boundary
that allows the vapor to fl ow through the dry layer that is built as drying proceeds.
Despite its simplicity, the model adequately predicted the drying kinetics of the
tested materials.
The use of LPSS as the drying agent during the drying of aromatic leaves rendered
a product with higher retention of the original volatile compounds and lower modifi -
cation of the composition percentage. The LPSS drying technique allows the recovery
of a substantial amount of the aroma compounds withdrawn from the product, increasing
the economic advantages of the new method (Barbieri et al., 2004).
A more detailed description of superheated steam drying is provided in Chapter 15.
5.6.4 MODIFIED FLUIDIZED BED DRYING (FBD)
This method has been used in many applications of granular solid foods with size
particles in the range of 50 to 2000 μm, when uniformity in product drying is required.
The FBD technique is most suitable for temperature-sensitive matter applications
(Chaplin and Pugsley, 2005; Walde et al., 2006). Although high heat and mass transfer
rates between the air and solid are obtained in FBD, avoiding product overheating,
high power consumption, high potential for attrition, and low fl exibility are some of
the disadvantages (Mujumdar and Devahastin, 1999).
52527_C005.indd 14452527_C005.indd 144 10/1/2008 11:42:30 AM10/1/2008 11:42:30 AM
© 2009 by Taylor & Francis Group, LLC

Convective Drying of Foods 145
Modifi ed fl uidized bed dryers have been studied to dry different products and to
look for more advantages: FBD plus HPD for heat-sensitive food materials (Alves-
Filho and Strømmen, 1996; Strømmen and Jonassen, 1996), vibrofl uidized bed drying
for reducing gas velocities (Cabral et al., 2007; Goyel and Shah, 1992), FBD plus inert
particles as energy carriers (Hatamipour and Mowla, 2003), pulsed FBD of beans for
lowering pumping requirements (Nitz and Pereira Taranto, 2007), and a cross-fl ow
fl uidized bed dryer for moisture reduction and quality of paddy (Soponronnarit et al.,
1995, 1999).
5.6.5 OPTIMIZATION AND ON-LINE CONTROL STRATEGIES
Drying process optimization based on reduction of quality degradation is diffi cult.
Modern food technology makes it imperative that solutions be found that will allow opti-
mization of complex processes with respect to complex quality factors (Karel, 1988).
Important advances in the knowledge of convective drying of foods have been
made during the last decade, which allow better modeling and simulation of the
process. Computer-assisted numerical simulation allows the prediction of the drying
behavior of complex food systems under different conditions and the analysis of the
infl uence of design and operating variables on process effi ciency. By combining
simulation and optimization techniques, with constraints on some quality para-
meters, it is possible to obtain optimum operating conditions, including time variable
schemes. These new developments are essential to improve the drying of foods,
obtaining higher quality products with more effi cient energy use.
Real-time process control strategies have been investigated to minimize quality
degradation of the product. Chou et al. (1997) and Chua, Mujumdar, Chou, Ho, et al.
(2000) used the strategy of measuring the drying product temperature and, based on
these real-time values and predefi ned constraints, a controller tuned the temperature
of the drying air to minimize the degradation of dried product quality.
NOMENCLATURE
VARIABLES AND ABBREVIATIONS
a, b, c, d coeffi cients (Table 5.3)
av external solid area exposed to drying per unit volume (m–1)
aw water activity
A coeffi cient
As external solid area exposed to drying (m2)
Bim mass transfer Biot number
Cp heat capacity (J/kg K)
Deff effective moisture diffusivity (m2/s)
D0 preexponential coeffi cient (m2/s)
Ea activation energy (kJ/mol)
f normalized evaporation rate
G gas mass fl ux (kg/s m2)
h heat transfer coeffi cient (W/m2 K)
52527_C005.indd 14552527_C005.indd 145 10/1/2008 11:42:30 AM10/1/2008 11:42:30 AM
© 2009 by Taylor & Francis Group, LLC

146 Advances in Food Dehydration
H air humidity (kg moisture vapor/kg dry air)
k coeffi cient (Table 5.3)
k gas thermal conductivity (W/m K)
kg external mass transfer coeffi cient (kg/m2/s Pa)
K drying rate constant (s–1)
L thickness (m)
Lc characteristic dimension of material (m)
ms mass of dry solid (kg)
Mg molecular weight of dry air (kg/mol)
Mw molecular weight of moisture vapor (kg/mol)
MR moisture ratio
MRc critical moisture ratio
n coeffi cient (Table 5.3)
nw drying rate (kg/m2/s)
nwc constant drying rate (kg/m2/s)
Nu Nusselt number
Pw moisture vapor partial pressure at air (Pa)
P w 0 saturated moisture vapor pressure (Pa)
Pws moisture vapor partial pressure at material surface (Pa)
P total pressure (Pa)
Pr Prandtl number
q heat fl ow (W)
R sphere or cylinder radius (m)
Rc universal gas constant (kJ/mol K)
Re Reynolds number
RH relative humidity
t time (s)
tI duration of the constant drying rate period (s)
tII duration of the falling drying rate period (s)
t0 initial time (s)
T absolute temperature (K)
Tdb dry bulb temperature (K)
Tg gas temperature (K)
Twb wet bulb temperature (K)
X material moisture content (dry basis) (kg water/kg dry solid)
Xc critical moisture content (kg water/kg dry solid)
Xe equilibrium moisture content (kg water/kg dry solid)
Xf fi nal moisture content (kg water/kg dry solid)
X0 initial moisture content (kg water/kg dry solid)
Xw material moisture content (wet basis) (kg water/kg material)
z spatial coordinate (m)
GREEKS
m gas viscosity (Pa s)
�Hv latent heat of vaporization (J/kg)
bn Bessel function roots of the fi rst kind and zero order
52527_C005.indd 14652527_C005.indd 146 10/1/2008 11:42:30 AM10/1/2008 11:42:30 AM
© 2009 by Taylor & Francis Group, LLC

Convective Drying of Foods 147
rs density of dry solid (kg/m3)
q generalized drying parameter
REFERENCES
Alves-Filho, O. and Rumsey, T.R., Thin layer drying and rewetting models to predict mois-
ture diffusion in spherical agricultural products, in Drying ’85, Mujumdar, A.S., Ed.,
Hemisphere Publishing, New York, 1985, pp. 434–437.
Alves-Filho, O. and Strømmen, I., Performance and improvements in heat pump dryers, in
Drying ’96, Strumillo, C. and Pakowski, Z., Eds., Lodz Technical University, Lodz,
Poland, 1996, pp. 405–415.
Andrieu, J. and Stamatopoulos, A., Durum wheat pasta drying kinetics, Lebensm.-Wiss. Technol., 19, 448, 1986.
Apkinar, E.K., Determination of suitable thin layer drying curve model for some vegetables
and fruits, J. Food Eng., 73, 75–84, 2006.
ASAE, Agricultural Engineers Yearbook, American Society of Agricultural Engineers,
St. Joseph, MI, 1982.
Baini, R. and Langrish, T.A.G., Choosing an appropriate drying model for intermittent and
continuous drying of bananas, J. Food Eng., 79, 330–343, 2007.
Bakker-Arkema, F.W., Heat and mass transfer aspects and modeling of dryers—A critical
review, in Concentration and Drying of Foods, MacCarthy, D., Ed., Elsevier, London,
1986, pp. 165–202.
Barbieri, S., Elustondo, M., and Urbicain, M., Retention of aroma compounds in basil dried
with low pressure superheated steam, J. Food Eng., 65, 109–115, 2004.
Brooker, D.B., Baker-Arkema, F.W., and Hall, C.W., Drying Cereal Grains, AVI Publishing,
Westport, CT, 1974.
Bruin, S. and Luyben, K., Drying of food materials: A review of recent developments, in
Advances in Drying, Vol. 1, Mujumdar, A.S., Ed., Hemisphere Publishing, New York,
1980, pp. 155–215.
Cabral, R.A., Telis-Romero, J., Telis, V., Gabas, A., and Finser, J., Effect of apparent viscosity
on fl uidized bed drying process parameters of guava pulp, J. Food Eng., 80, 1096–1106,
2007.
Carrín, M.E., Ratti, C., and Crapiste, G., Vapor–solid equilibrium of ethanol–water mixtures
in food-related solids, paper presented at ICEF9, 2004.
Chaplin, G. and Pugsley, T., Application of electrical capacitance tomography to the fl uidized
bed drying of pharmaceutical granule, Chem. Eng. Sci., 60, 7022–7033, 2005.
Chou, S.K. and Chua, K.J., New hybrid drying technologies for heat sensitive foodstuffs,
Trends Food Sci. Technol., 12, 359–369, 2001.
Chou, S.K., Chua, K.J., Hawlader, M.N., and Ho, J.C., A two-stage heat pump dryer for better
heat recovery and product quality, J. Inst. Eng., 38, 8–14, 1998.
Chou, S.K., Hawlader, M.N., and Chua, K.J., Identifi cation of the receding evaporation front
in convective food drying, Dry. Technol., 15, 1353–1376, 1997.
Chua, K.J., Chou, S.K., Ho, J.C., Mujumdar, A.S., and Hawlader, M.N., Cyclic air tempera-
ture drying of guava pieces: Effects on moisture and ascorbic acid contents, T. I. Chem. Eng. Lond., 78, 28–72, 2000.
Chua, K.J., Mujumdar, A.S., Chou, S.K., Hawlader, M.N., and Ho, J.C., Convective drying of
banana, guava and potato pieces: Effect of cyclical variations of air temperature on
convective drying kinetics and color change, Dry. Technol., 18, 907–936, 2000.
Chua, K.J., Mujumdar, A.S., Chou, S.K., Ho, J.C., and Hawlader, M.N., Heat pump drying
systems: Principles, applications and potential, in Developments in Drying, Vol. 2,
Mujumdar, A.S. and Suvachittanont, S., Eds., Kasetsart University Press, Bangkok,
Thailand, 2000, pp. 95–134.
52527_C005.indd 14752527_C005.indd 147 10/1/2008 11:42:30 AM10/1/2008 11:42:30 AM
© 2009 by Taylor & Francis Group, LLC

148 Advances in Food Dehydration
Crank, J., The Mathematics of Diffusion, Oxford University Press, London, 1967.
Crapiste, G.H., Simulation of drying rates and quality changes during the dehydration of food-
stuffs, in Trends in Food Engineering, Lozano, J.E., Añón, C., Parada-Arias, E., and
Barbosa-Cánovas, G.V., Eds., Technomic Publishing, Lancaster, PA, 2000, pp. 135–148.
Crapiste, G.H. and Rotstein, E., Sorptional equilibrium at changing temperatures, in Drying of Solids: Recent International Developments, Mujumdar, A.S., Ed., John Wiley & Sons,
New York, 1986, pp. 41–45.
Crapiste, G.H. and Rotstein, E., Design and performance evaluation of dryers, in Handbook of Food Engineering Practice, Valentas, K.J., Rotstein, E., and Singh, R.P., Eds., CRC
Press, New York, 1997, pp. 125–166.
Crapiste, G.H., Whitaker, S., and Rotstein, E., Drying of cellular material. I. A mass transfer
theory. II. Experimental and numerical results, Chem. Eng. Sci., 43, 2919–2936, 1988.
Desmorieux, H. and Decaen, N., Convective drying of spirulina in thin layer, J. Food Eng., 66, 497–503, 2005.
Devahastin, S. and Mujumdar, A.S., Batch drying of grains in a well-mixed dryer—Effect of
continuous and stepwise change in drying air temperature, Trans. ASAE, 42, 421–425,
1999.
Doymaz, I., Convective air drying characteristics of thin layer carrots, J. Food Eng., 61,
359–364, 2004.
Doymaz, I., Thin-layer drying behaviour of mint leaves, J. Food Eng., 74, 370–375, 2006.
Doymaz, I., The kinetics of forced convective air-drying of pumpkin slices, J. Food Eng., 79,
243–248, 2007.
Elustondo, D., Elustondo, M., and Urbicain, M., Mathematical modeling of moisture evapora-
tion from foodstuffs exposed to subatmospheric pressure superheated steam, J. Food Eng., 49, 15–24, 2001.
Fatouh, M., Metwally, M.N., Helali, A.B., and Shedid, M.H., Herb drying using a heat pump
dryer, Energ. Convers. Manage., 47, 2629–2643, 2006.
Fontaine, J. and Ratti, C., Lumped-parameter approach for prediction of drying kinetics in
foods, J. Food Process Eng., 22, 287–305, 1999.
Fornell, A., Bimbenet, J.J., and Amin, Y., Experimental study and modelization for air drying
of vegetable products, Lebensm.-Wiss. Technol., 14, 96–100, 1980.
Geankoplis, C.J., Transport Processes and Unit Operations, 3rd ed., Prentice Hall, Englewood
Cliffs, NJ, 1993.
Giowacka, M. and Malczewski, J., Oscillating temperature drying, in Drying of Solids: Recent International Developments, Mujumdar, A.S., Ed., John Wiley & Sons, New
York, 1986, pp. 77–83.
Goyel, S.K. and Shah, R.M., Drying of desiccated coconut on vibrating fl uidised bed dryer,
in Drying ’92, Mujumdar, A.S., Ed., Elsevier Science, Amsterdam, 1992, pp. 815–826.
Harnoy, A. and Radajewski, W., Optimization of grain drying with rest periods, J. Agric. Eng. Res., 27, 291–307, 1982.
Hassini, L., Azzouz, S., Peczalski, R., and Beighith, A., Estimation of potato moisture diffu-
sivity from convective drying kinetics with correction for shrinkage, J. Food Eng., 79,
47–56, 2007.
Hatamipour, M.S. and Mowla, D., Correlations for shrinkage, density and diffusivity for
drying of maize and green peas in a fl uidized bed with energy carrier, J. Food Eng., 59, 221–227, 2003.
Hawlader, M.N.A., Perera, C.O., and Tian, M., Properties of modifi ed atmosphere heat pump
dried foods, J. Food Eng., 74, 392–401, 2006.
Hayaloglu, A.A., Karabulut, I., Alpaslan, M., and Kelbaliyev, G., Mathematical modeling of
drying characteristics of strained yoghurt in a convective type tray-dryer, J. Food Eng., 78, 109–117, 2007.
Heimann, F., Thurner, F., and Schlünder, E.U., Intermittent drying of porous materials
containing binary mixtures, Chem. Eng. Process., 20, 167–174, 1986.
52527_C005.indd 14852527_C005.indd 148 10/1/2008 11:42:30 AM10/1/2008 11:42:30 AM
© 2009 by Taylor & Francis Group, LLC

Convective Drying of Foods 149
Henderson, S.M., Progress in developing the thin layer drying equation, Trans. ASAE, 17,
1167–1172, 1974.
Ho, J.C., Chou, S.K., Mujumdar, A.S., Hawlader, M.N., and Chua, K.J., An optimization
framework for drying of heat-sensitive products, Appl. Therm. Eng., 21, 1779–1798, 2001.
Iglesias, H.A. and Chirife, J., Handbook of Food Isotherms, Academic Press, New York, 1982.
Jannot, Y., Talla, A., Nganhou, J., and Puiggali, J.-R., Modeling of banana convective drying
by the drying characteristics curve (DCC) method, Dry. Technol., 22, 1949–1968,
2004.
Karel, M., Optimizing the heat sensitive materials in concentration and drying, in Preconcen-tration and Drying of Food Materials, Briun, S., Ed., Elsevier Science, Amsterdam,
1988, pp. 217–234.
Keey, R.B., Drying: Principles and Practice, Pergamon Press, Oxford, U.K., 1972.
Keey, R.B., Introduction to Industrial Drying Operations, Pergamon Press, Oxford, U.K.,
1978.
Keey, R.B., Drying of Loose and Particulate Materials, Hemisphere Publishing, New York,
1992.
Keey, R.B. and Suzuki, M., On the characteristic drying curve, Int. J. Heat Mass Transfer, 17,
1455–1464, 1974.
Kiranoudis, C.T., Maroulis, Z.B., and Marinos-Kouris, D., Model selection in air drying of
foods, in Drying ’92, Mujumdar, A.S., Ed., Elsevier, Amsterdam, 1992, pp. 785–793.
Krokida, M.K., Foundoukidis, E., and Maroulis, Z., Drying constant: Literature data compi-
lation for foodstuffs, J. Food Eng., 61, 321–330, 2004.
Langrish, T.A.G. and Kockel, T.K., The assessment of a characteristic drying curve for milk
powder for use in computational fl uid dynamics modeling, Chem. Eng. J., 84(2), 69–74,
2001.
Laws, N. and Parry, J.L., Mathematical modeling of heat and mass transfer in agricultural
grain drying, Proc. Roy. Soc. Lond. A Mater., 385(1788), 169–187, 1983.
Maache-Rezzoug, Z., Rezzoug, S.A., and Allaf, K., Development of a new drying process
particularly adapted to thermosensitive products: Dehydration by successive pressure
drops application to the drying of collagen gel, Dry. Technol., 19, 961–974, 2001.
Martinez, J. and Setterwall, F., Gas-phase controlled convective drying of solids wetted with
multicomponent liquid mixtures, Chem. Eng. Sci., 46, 2235–2252, 1991.
Masters, K., Spray Drying Handbook, George Godwin Ltd., London, 1979.
Mohapatra, D. and Rao, P.S., A thin layer drying model of parboiled wheat, J. Food Eng., 66, 513–518, 2005.
Moyers, C.G. and Baldwin, G.W., Psychrometry, evaporative cooling, and solid drying, in
Perry’s Chemical Engineers Handbook, 7th ed., Perry, R.H., Green, D.W., and Maloney,
J.O., Eds., McGraw-Hill, New York, 1999.
Mrkic, V., Ukrainczyk, M., and Tripalo, B., Applicability of moisture transfer Bi-Di correla-
tion for convective drying of broccoli, J. Food Eng., 79, 640–646, 2007.
Mujumdar, A.S., Handbook of Industrial Drying, Marcel Dekker, New York, 1987.
Mujumdar, A.S. and Devahastin, S., Fluidized bed drying, in Developments in Drying: Food Dehydration, Vol. 1, Mujumdar, A.S. and Suvachittanont, S., Eds., Kasetsart University
Press, Bangkok, Thailand, 1999, pp. 59–111.
Nathakaranakule, A., Kraiwanichkul, W., and Soponronnarit, S., Comparative study of dif-
ferent combined superheated-steam drying techniques for chicken meat, J. Food Eng., 80, 1023–1030, 2007.
Nguyen, M.H. and Price, W.E., Air-drying of banana: Infl uence of experimental parameters,
slab thickness, banana maturity and harvesting season, J. Food Eng., 79, 200–207,
2007.
Nitz, M. and Pereira Taranto, O., Drying of beans in a pulsed fl uid bed dryer: Drying kinetics,
fl uid-dynamic study and comparisons with conventional fl uidization, J. Food Eng., 80,
249–256, 2007.
52527_C005.indd 14952527_C005.indd 149 10/1/2008 11:42:30 AM10/1/2008 11:42:30 AM
© 2009 by Taylor & Francis Group, LLC

150 Advances in Food Dehydration
Okos, M.R., Narsimhan, G., Singh, R.K., and Weitnauer, A.C., Food dehydration, in Handbook of Food Engineering, Heldman, D.R. and Lund, D.B., Eds., Marcel Dekker, New York,
1992, pp. 437–562.
Pakowski, Z., Drying of solids containing multicomponent moisture, in Advances in Drying,
Vol. 5, Mujumdar, A.S., Ed., Hemisphere Publishing, Washington, DC, 1992,
pp. 145–202.
Pan, Y.K., Zhao, L.J., Dong, Z.X., Mujumdar, A.S., and Kudra, T., Intermittent drying of
carrots: Effect on product quality, Dry. Technol., 17, 2323–2340, 1999.
Panchariya, P.C., Popovic, D., and Sharma, A.L., Thin-layer modeling of black tea drying
process, J. Food Eng., 52, 349–357, 2002.
Perera, C.O. and Rahman, M.S., Heat pump dehumidifi er drying of foods, Trends Food Sci. Technol., 8, 75–79, 1997.
Perry, R.H. and Green, D., Perry’s Chemical Engineers Handbook, 6th ed., McGraw-Hill,
New York, 1999.
Pezzutti, A. and Crapiste, G.H., Sorptional equilibrium and drying characteristics of garlic,
J. Food Eng., 31, 113–123, 1997.
Prasertsan, S. and Saen-saby, P., Heat pump drying of agricultural materials, Dry. Technol., 16, 235–250, 1998.
Prasertsan, S., Saen-saby, P., Prateepchaikul, G., and Ngamsritrakul, P., Heat pump dryer part
3: Experiment verifi cation of the simulation, Int. J. Energ. Res., 21, 1–20, 1997.
Ratti, C. and Crapiste, G.H., A generalized drying curve for shrinking food materials,
in Drying ‘92, Mujumdar, A.S., Ed., Elsevier, New York, 1992, pp. 864–873.
Ratti, C. and Crapiste, G.H., Determination of heat transfer coeffi cients during drying of
foodstuffs, J. Food Process Eng., 18, 41–53, 1995.
Ratti, C., Crapiste, G.H., and Rotstein, E., PSYCHR: A computer program to calculate
psychrometric properties, Dry. Technol., 7, 575–580, 1989.
Román, G.N., Urbicain, M.J., and Rotstein, E., Moisture equilibrium in apples at several
temperatures: Experimental data and theoretical considerations, J. Food Sci., 47,
1484–1488, 1982.
Rossi, S.J., Neues, I.C., and Kicokbusch, T.G., Thermodynamics and energetic evaluation of
a heat pump applied to drying of vegetables, in Drying ’92, Mujumdar, A.S., Ed.,
Elsevier, Amsterdam, 1992, pp. 1475–1483.
Rotstein, E., Laura, P.A., and Cemborain, M.E., Analytical prediction of drying performance
in unconventional shapes, J. Food Sci., 39, 627, 1974.
Sabbah, M.A., Foster, G.H., Hauge, C.G., and Peart, R.M., Effect of tempering after drying
on cooling shelled corn, Trans. ASAE, 15, 763–765, 1972.
Sharma, G.P. and Prasad, S., Effective moisture diffusivity of garlic cloves undergoing
microwave-convective drying, J. Food Eng., 65, 609–617, 2004.
Soponronnarit, S., Wetchacama, S., Swasdisevi, T., and Poomsa-ad, N., Managing moist
paddy by drying, tempering and ambient air ventilation, Dry. Technol., 17, 335–344,
1999.
Soponronnarit, S., Yapha, M., and Prachayawarakorn, S., Cross-fl ow fl uidized bed paddy:
Prototype and commercialization, Dry. Technol., 13, 2207–2216, 1995.
Srikiatden, J. and Roberts, J.S., Measuring moisture diffusivity of potato and carrot (core and
cortex) during convective hot air and isothermal drying, J. Food Eng., 74, 143–152,
2006.
Srinivasa, P.C., Ramesh, M.N., Kumar, K.R., and Tharanathan, R.N., Properties of chitosan
fi lms prepared under different drying conditions, J. Food Eng., 63, 79–85, 2004.
Steffe, J.F. and Singh, R.P., Liquid diffusivity of rough rice components, Trans. ASAE, 23,
767–774, 1980.
Steinbeck, M.J., Convective drying of porous material containing a partially miscible
mixture, Chem. Eng. Process., 38, 487–502, 1999.
52527_C005.indd 15052527_C005.indd 150 10/1/2008 11:42:30 AM10/1/2008 11:42:30 AM
© 2009 by Taylor & Francis Group, LLC

Convective Drying of Foods 151
Steinbeck, M.J. and Schlünder, E.U., Convective drying of porous material containing a
partially miscible mixture, Chem. Eng. Process., 37, 79–88, 1998.
Strømmen, I. and Jonassen, O., Performance tests of a new 2-stage counter-current heat pump
fl uidized bed dryer, in Drying ’96, Strumillo, C., Pakowski, Z., and Mujumdar, A.S.,
Eds., Elsevier, Amsterdam, 1996, pp. 563–568.
Strømmen, I. and Kramer, K., New applications of heat pumps in drying process, Dry. Technol., 12, 889–901, 1994.
Strumillo, C. and Kudra, T., Drying kinetics, in Drying: Principles, Applications and Design,
Hughes, F., Ed., Gordon and Breach Science Publishers, Geneva, 1986, pp. 67–98.
Teeboonma, U., Tiansuwan, J., and Soponronnarit, S., Optimization of heat pump fruit dryers,
J. Food Eng., 59, 369–377, 2003.
Thijssen, H.A.C., Flavor retention in drying preconcentrated food liquids, J. Appl. Chem. Biotechnol., 21, 372–377, 1971.
Thijssen, H.A.C., Optimization of process conditions during drying with regard to quality
factors, Lebensm.-Wiss. Technol., 12, 308–317, 1979.
Thurner, F. and Schlünder, E.U., Progress towards understanding the drying of porous
material wetted with binary mixtures, Chem. Eng. Process., 20, 2–25, 1986.
Togrul, I.T. and Pehlivan, D., Mathematical modeling of solar drying of apricots in thin
layers, J. Food Eng., 55, 209–216, 2002.
Treybal, R.E., Mass-Transfer Operations, 3rd ed., McGraw-Hill, New York, 1980.
Troger, J.M. and Butler, J.L., Drying peanuts with intermittent airfl ow, Trans. ASAE, 23,
197–199, 1980.
Van Meel, D.A., Adiabatic convection batch drying with recirculation of air, Chem. Eng. Sci., 9, 36–44, 1958.
Vidaurre, M. and Martinez, J., Continuous drying of a solid wetted with ternary mixtures,
AIChE J., 43, 681–692, 1997.
Wakao, N., Kaguei, S., and Funazkri, T., Effect of fl uid dispersion coeffi cients on particle-to-
fl uid heat transfer coeffi cients in packed beds, Chem. Eng. Sci., 34, 325–336, 1979.
Walde, S.G., Velu, V., Jyothirmayi, T., and Math, R.G., Effects of pretreatments and drying
methods on dehydration of mushroom, J. Food Eng., 74, 108–115, 2006.
Wang, Z., Sun, J., Liao, X., Chen, F., Zhao, G., Wu, J., and Hu, X., Mathematical modeling on
hot air drying of thin layer apple pomace, Food Res. Int., 4, 39–46, 2007.
Xiong, X., Narsimhan, G., and Okos, M.R., Effect of composition and pore structure on binding
energy and effective diffusivity of moisture in porous food, J. Food Eng., 15, 187–208,
1991.
Zhang, D. and Litchfi eld, J.B., An optimization of intermittent corn drying in a laboratory
scale thin layer dryer, Dry. Technol., 9, 383–395, 1991.
52527_C005.indd 15152527_C005.indd 151 10/1/2008 11:42:30 AM10/1/2008 11:42:30 AM
© 2009 by Taylor & Francis Group, LLC
153
6 Advances in Spouted Bed Drying of Foods
S.C.S. Rocha and O.P. Taranto
CONTENTS
6.1 The Spouted Bed ..................................................................................... 153
6.2 Drying of Pastes and Suspensions in Spouted Beds with Inerts ............. 157
6.3 Drying of Tropical Fruit Pulps ................................................................ 163
6.4 Drying of Grains ..................................................................................... 168
6.5 Latest Advances in Spouted Bed Drying ................................................ 176
6.5.1 Product Quality in Spouted Bed Drying of Pastes
or Suspensions .............................................................................. 177
6.5.2 Novel and Combined Equipment ................................................. 178
6.5.3 Modeling, Simulation, and Control ............................................. 180
Nomenclature ..................................................................................................... 182
Variables ................................................................................................. 182
Greek Symbols ........................................................................................ 182
Subscripts ................................................................................................ 183
References .......................................................................................................... 183
6.1 THE SPOUTED BED
The dynamic fl uid–solid system developed by Mathur and Gishler in 1954, which
they named spouted bed, has a wide range of applications for processing coarse
particles, such as grains and tablets, which are not easily treated in a fl uidized bed.
The equipment consists of a cylindrical column with a conical base fi tted with an
orifi ce through which the spouting fl uid is injected.
High fl uid fl ow rates create a fl ow of ascending particles as a central channel
inside the bed of solids. After reaching the top of the bed, these particles form a
fountain directed to the outer part of the bed surface and fall into the annular region
between the channel and the bed walls. The particles fl ow down the base of the
vessel where they reach the central channel air fl ow, thus allowing a continuous and
cycling systematic movement of particles in a unique hydrodynamic system that is
called the spouted bed (Mathur and Epstein, 1974).
Figure 6.1 illustrates the three distinct regions that constitute the spouted bed:
the spout, the annulus, and the fountain.
52527_C006.indd 15352527_C006.indd 153 10/3/2008 3:49:12 PM10/3/2008 3:49:12 PM
© 2009 by Taylor & Francis Group, LLC

154 Advances in Food Dehydration
The central channel in this system is called the spout and the peripheral region
is known as the annulus. The term fountain is used to determine the mushroom form
above the annulus, where the particles move in a decelerated regime, falling into
the annulus.
In the spout region the particles move in the same direction as the gas fl ow, as in
a pneumatic conveyor, because of the high velocity of the gas. It is characterized as
a diluted-phase region with high porosity.
In the annular region the particles move countercurrent to the gas. It is a dense
region with low porosity.
Mathur and Epstein (1974) refer to spouting as a visible phenomenon that occurs
for a determined range of fl uid velocity, which is a function of the particle diameter
and the height and the geometry of the vessel.
Fountain
Bed surface
Spout
Annulus
Conical base
Fluid inlet orifice
FIGURE 6.1 Schematic diagram of a spouted bed.
52527_C006.indd 15452527_C006.indd 154 10/3/2008 3:49:12 PM10/3/2008 3:49:12 PM
© 2009 by Taylor & Francis Group, LLC

Advances in Spouted Bed Drying of Foods 155
From the standpoint of gas–solid contact, the spouted bed is considered to be a
combination of a moving bed and a fl uidized bed, because it promotes good mixing
and circulation of particles.
The main characteristics of the spouted bed are a high rate of solids circulation,
intense mixing of particles, intimate fl uid–particle contact, and high rates of mass
and heat transfer.
The transition mechanism from packed to spouted bed can be verifi ed in the
fl uid dynamics curves, that is, the pressure drop versus the fl uid fl ow rate. With an
increase in fl uid fl ow rate, the particles in the vicinity of the gas entry orifi ce move
and form a cavity surrounded by a compact layer of solids, causing the bed pressure
drop to increase. The pressure drop increases continuously up to a maximum value
�pmax. From this point on, the effect of internal spouting becomes more signifi cant
than the solid layer that surrounds the cavity and the pressure drop begins to diminish
as the fl uid fl ow rate is raised, down to the point of minimum spout (�pms and Qms),
from which a small rise in the fl uid fl ow rate results in the establishment of the spout.
Then, the bed pressure drop (�ps) remains constant and any rise in the fl uid fl ow rate
only causes the fountain height to increase. Therefore, the important fl uid dynamic
parameters of the spouted bed regime are �pmax, �pms, Qms, and �ps. Because of the
instability caused by the rupture of the jet stream in the bed, the point of minimum
spout is not easily reproducible. Thus, it is determined using the fl uid dynamics
curve obtained with the inverse process, that is, slowly diminishing the gas fl ow rate
from the steady spout regime down to the collapse of the spout.
In addition to the experimental determination, several empirical correlations
are available to obtain these parameters (Mathur and Epstein, 1974; Strumillo and
Kudra, 1986).
The spouted bed technique was initially developed for drying wheat, but it was
later utilized with several other types of solid particles. This made it possible to
check process effi ciency. It is also currently utilized in the processes of particle
coating, granulation, heat transfer, and so forth.
The following limitations have restricted the application of the spouted bed on a
large scale: high head loss before attaining the steady spout regime, gas fl ow limited
by the demands of the spout stability rather than by necessities of heat and mass
transfer during drying, narrow operation range, limitation of a maximum particle
bed height for steady spouting (Hmax), and diffi culties in scaling up.
The main limitations are the existence of a maximum bed height for steady
spouting and the inability to scale up for vessels with a diameter �1 m. Some
modifi cations have been proposed to overcome the restrictions in the use of the
spouted bed. Attempts are reported for conical spouted beds (Oliveira and Passos,
1997; Reyes and Massarani, 1993; Reyes et al., 1996, 1997) and for a jet spouted bed
with high porosity (Markowski and Kaminski, 1983; Tia et al., 1995). In addition,
the introduction of a draft tube at some distance above the inlet nozzle and different
designs, like the two-dimensional spouted bed and the slot spouted bed, are
modifi cations on the conventional spouted bed that eliminate the former limitation
(Kalwar and Raghavan, 1992, 1993; Kalwar et al., 1991; Mujumdar, 1989).
The introduction of a draft tube promotes the separation between the spout and
the annular region, avoiding the continuous reentry of particles into the spout region.
52527_C006.indd 15552527_C006.indd 155 10/3/2008 3:49:13 PM10/3/2008 3:49:13 PM
© 2009 by Taylor & Francis Group, LLC

156 Advances in Food Dehydration
Thus, the circulation of particles begins at lower pressure drops, the bed height and
diameter can be substantially altered, and lower gas fl ow rates are required. However,
some disadvantages of the draft tube are notable, such as the reduction in quality of
particle mixing, the possibility of particles becoming stuck at the beginning or end
of the process, and lower mass and heat transfer rates.
The spouted bed dryer (SBD) can operate in a batch or a continuous regime. The
batch operation consists of loading the bed with wet particles and then injecting
heated air until the desired particle moisture content is reached.
Figure 6.2 is a schematic diagram of an SBD with a draft tube in continuous
operation. The fl ow of particles in the annular region can be considered as plug fl ow,
promoting a uniform distribution of residence time in the dryer.
It is important to note that the SBD can be used for solids having constant and/
or decreasing drying rates. Utilizing an inert material in order to obtain and maintain
Gas
Gas
Dry product
Wet material
FIGURE 6.2 Schematic diagram of a continuous spouted bed dryer with draft tube.
52527_C006.indd 15652527_C006.indd 156 10/3/2008 3:49:13 PM10/3/2008 3:49:13 PM
© 2009 by Taylor & Francis Group, LLC

Advances in Spouted Bed Drying of Foods 157
the fl uid dynamic regime, the SBD has been successfully applied for drying pastes
and suspensions.
Generally, the appropriate particles for obtaining the spouted bed regime have
an average diameter �1 mm. The Geldart diagram (Geldart, 1986) classifi es different
types of particulate materials based on the size and density of the particles, which is
very useful for the choice of appropriate equipment to process a specifi c material.
For the SBD, particles in group D, called spoutable, are the most appropriate, that is,
particles in group D are appropriate for the process of steady spouting and do not
present good fl uidization quality (coarse particles promote channeling and dead
zones in fl uidized beds). Examples of particles belonging to group D are corn, oats,
beans, rice, paddy, and some seeds.
The application of the SBD in food drying is not only restricted to the mentioned
materials, but it can also be economically and effi ciently applied to the drying of
pastes and suspensions.
6.2 DRYING OF PASTES AND SUSPENSIONS IN SPOUTED BEDS WITH INERTS
The technique of drying pastes and suspensions on inert solids was developed in the
former USSR and was industrially applied to dry chemicals and biological materials.
The technique is suitable for drying a large variety of pastes and suspensions, producing
fi ne and homogeneous powders, and can compete with the spray drying technique.
However, it did not arouse interest in other countries until the 1980s. Since then, R&D in
this area has become important in many countries of the Americas, Europe, and Asia.
Spouted bed systems (dryers, granulators, and coaters) with throughputs from
200 g to 3000 kg/h can be found on the market today (Glatt, 2007).
Figure 6.3 illustrates a simple schematic diagram of a spouted bed utilized for
the drying of pastes and suspensions. The paste or suspension is fed in batches or
continuously over the bed of inert particles already moving in a steady spouting
regime. The drying gas is the spouting gas itself. The following mechanisms take
place in this type of drying. The suspension fed into the bed coats the particles of the
inert material with a thin fi lm. As the fi lm becomes fragile, because of the inter-
particle collisions inside the bed, it fractures and releases the inert particles being
carried by the drying gas stream. This powder is then collected by a cyclone or other
separation equipment installed in the upper part of the dryer.
Some studies refer to making use of this technique for drying food pastes and
extracts: tomato paste (Kachan and Chiapetta, 1988); artichoke vegetable extracts,
guarana, and cascara sagrada (Ré and Freire, 1988); nonhomogenized low-fat milk
(Martinez et al., 1993); low-fat and whole milk, orange and carrot juices, and coffee
(Martinez et al., 1995); beets (Lima et al., 1998); acerola pulp (Alsina et al., 1996);
tropical fruit pulps (Medeiros et al., 2002); vegetable starch (Benali and Amazouz,
2006); and mango pulp (Cunha et al., 2006), among others.
The process of deposition, drying, and removal of the fi lm occurs only if the
movement of the spout is not jeopardized by agglomeration of particles.
As a rule of thumb, the removing rate must always be greater than or equal to the
suspension feed rate. Thus, two factors govern the dryer performance: heat and mass
52527_C006.indd 15752527_C006.indd 157 10/3/2008 3:49:13 PM10/3/2008 3:49:13 PM
© 2009 by Taylor & Francis Group, LLC

158 Advances in Food Dehydration
transfer and the friability of the fi lm adhered to the particle surface. One of these two
factors can be limiting when process stability is concerned, because it depends upon
the drying rate as well as the mechanical properties of the fi lm, which can continue
to grow if it is strongly attached to the particle. Surface properties, such as superfi cial
energy and wettability, are also important for the defi nition of particle coating and
suspension drying processes. The adhesion characteristics defi ne the tendency of
the particle– suspension pair to go in a coating or drying process. Therefore, the
appropriate choice of inert particle is strongly related to the performance of the paste
or suspension drying.
High-density polyethylene (HDPE), low-density PE (LDPE), polypropylene (PP),
polystyrene (PS), Sangel®, Tefl on, glass, and silica, among others, are possible inert
particles only if they have diameters that defi ne them as spoutable (Geldart, 1986).
All of these materials had already been tested as inert in the spouted bed. Their per-
formance is a function of the paste or suspension inert surface and physical properties.
LDPE has already shown some problems when pastes with high lipid concen-
tration are processed. The inert particles become breakable soon after the drying of
such materials.
An important consideration for the inert particles used in food industries is
that the effects of attrition due to the intense motion of the particles may cause
FIGURE 6.3 Schematic diagram of a spouted bed dryer of pastes.
12 3 4
5
7
9
6
1-Blower2-Valve3-Orifice plate4-Silica gel bed5-Heater6-Spouted bed
8-Thermohygrometer9-Pressure taps10-Paste feeder (atomizer)11-Compressed air line12-Peristaltic pump13-Paste recipient14-Valve15-Manometer16-Cyclone
7-Thermohygrometer
9
108
1213
14 15
11
16
52527_C006.indd 15852527_C006.indd 158 10/3/2008 3:49:13 PM10/3/2008 3:49:13 PM
© 2009 by Taylor & Francis Group, LLC

Advances in Spouted Bed Drying of Foods 159
contamination of the powder produced, especially after having been used for a long
time. Thus, the possibility of contamination and its hazard to health must be
critically analyzed.
The analysis of the drying performance using this technique is based on two
approaches. The fi rst approach is the evaluation of the effi ciency of powder production
(hpo), defi ned in Eq. (6.1) as the ratio between the mass of powder (mpo ) collected in
the cyclone and the mass of paste fed into the bed (mpaste), and the evaporation rate
(Wev) given in Eq. (6.2), both expressed on a dry basis (db):
(6.1)
Wev � mar (Uo � U0) (6.2)
where Xpo and Xpaste are the moisture content of the powder and paste, respectively;
m· ar is the mass fl ow rate of air; and Yo and Y0 are the outlet and initial absolute humidity,
respectively.
The second approach refers to the paste or suspension effects on the hydrody-
namic parameters of the spouted bed, which is of great relevance to effi cient spouted
bed drying.
Modifi cations of the fl uid dynamic parameters by adding liquid to the inert
particles have been evaluated (Medeiros et al., 2002; Passos et al., 1997; Patel et al.,
1986; Schneider and Bridgwater, 1993; Spitzner Neto and Freire, 1997). Patel et al.
(1986) reported a reduction in the value of the minimum spout fl ow rate because of
the presence of liquid or paste by adding water and glycerol to the bed. Lima and
Alsina (1992) also came to this conclusion when analyzing the drying of the pulp of a
tropical fruit, umbu (Spondias tuberosa). The decrease in the minimum spouting fl ow
rate was attributed to a decrease in the number of particles in the spout region. The
increase in moisture content of the particles in the annulus region caused a decrease
in the circulation velocity and fewer particles entered the spout region, resulting in a
more dilute spout region. Lima and Alsina (1992) also observed an increase in the
stable spout pressure drop with the increase in amount of pulp in the bed.
An important work on this topic is by Schneider and Bridgwater (1993), who
analyzed the dynamic stability of the spouted bed with the addition of glycerol. The
results were somehow different from those of Lima and Alsina (1992) and Patel et al.
(1986). The stable spout pressure drop decreased with the increasing amount of liquid
in the bed and with higher liquid viscosity. The minimum spouting fl ow rate initially
increased and then decreased as a function of the addition of liquid to the bed.
Variations in the hydrodynamic behavior of the spouted bed that are due to
continuous water feeding into the bed are also evidenced in the study by Spitzner
Neto and Freire (1997). The assumptions for variations in the fl uid dynamic parame-
ters are based on the increase in the adhesion forces between the particles produced
by the presence of liquid in the bed and on the shear stress forces caused by the liquid
viscosity, in agreement with the study conducted by Passos et al. (1997).
Although the results presented in different works are apparently contradictory
concerning the fl uid dynamic parameters, all of them account for the infl uence of the
po po
po
paste paste
(1 ) 100
(1 )
m X
m Xh
� �
�
52527_C006.indd 15952527_C006.indd 159 10/3/2008 3:49:14 PM10/3/2008 3:49:14 PM
© 2009 by Taylor & Francis Group, LLC

160 Advances in Food Dehydration
presence of the liquid, paste, or suspension on the spouted bed hydrodynamics.
In some cases, this presence compromises the spout stability, causing it to collapse.
The main conclusions concerning the effects of the introduction of paste on the
bed dynamics are as follows:
1. A critical paste feed rate exists (above this critical value, interparticle cohe-
sion forces caused by liquid bridges are signifi cant).
2. The cohesion forces depend on the paste and inert properties.
3. If the cohesion forces can be neglected, the minimum spouting fl ow rate
decreases with the feeding of paste (fi ne paste layers on the inert promotes
particle slipping, enhancing the spout regime).
The change in the bed behavior and in the drying effi ciency for different suspen-
sions or pastes also suggests the importance of an investigation on the relationship
of the adhesion characteristics of the particle–suspension or paste with the drying
process, yielding effi cient powder production. In other words, the drying of a paste
with effi cient production or coating of particles is a function of the characteristics of
particle–suspension adhesion, which is related to the particle wettability by the paste.
Wettability is described as the ability of a drop to wet and spread upon the
surface of a particle. It is what governs the adhesion and growing rate of particles in
coating processes (Iveson et al., 2001; Link and Schlünder, 1997; Pont et al., 2001;
Tenou and Poncelet, 2002).
The wettability of a solid by a liquid depends on the contact angle between the
three phases: solid, liquid, and gas. The contact angle (q) is a property of the solid–
liquid–gas system and depends on the characteristics of the solid particle and paste
or suspension (liquid), such as hygroscopicity, roughness, and surface tension.
Adhesion is correlated with wettability and occurs due to physical, chemical,
and/or mechanical bonds in the solid–liquid interface. Under some conditions (plain,
homogeneous, isotropic, and nondeformed surface) the adhesion energy can be
quantifi ed by adhesion work (tad) defi ned as
tad � s lv (1 � cos q ) (6.3)
where slv is the liquid–vapor surface tension.
High values of adhesion work indicate good wetting and low values indicate bad
wetting for each solid–fl uid set (Adamson, 1990; Iveson et al., 2001; Neumann and
Kwok, 1999).
When q is 0°, the work of adhesion of solid to liquid reaches a maximum and is
equal to the work of liquid cohesion, which can spread indefi nitely on the surface
because the system is energetically indifferent to whether the liquid is in contact with
itself or with the solid. In contrast, if q is 180° then tad is 0 and there is no loss of
Gibbs energy to separate the solid from liquid. The liquid does not wet the solid and
does not spread over it.
Typical spouted bed equipment with inert particles used for the drying of paste,
like the one shown in Figure 6.3, can also be utilized for particle coating. Inert
particles of different sizes, shapes, densities, and fl owabilities, as well as suspensions
52527_C006.indd 16052527_C006.indd 160 10/3/2008 3:49:14 PM10/3/2008 3:49:14 PM
© 2009 by Taylor & Francis Group, LLC

Advances in Spouted Bed Drying of Foods 161
with different formulations were used by Marques (2007) to analyze the infl uence of
particle–suspension adhesion during the atomization of the suspension over a bed
of inert particles. The inert particles used were characterized by shape, average
diameter, sphericity, repose angle, bulk, real and apparent densities, porosity,
fl owability, and surface energy (Table 6.1). Three different formulations of aqueous
polymeric suspensions were used, which showed differences in their properties of
surface tension, solids concentration, density, and apparent viscosity obtained at a
deformation rate of 1000/s (Table 6.2). The particle contact angle values for the three
suspensions analyzed are presented in Table 6.3. The operating conditions were set
after a fl uid dynamic analysis and some preliminary experiments, and they were also
based on the results of previous works (Donida et al., 2005; Table 6.4).
Through the analysis of the process behavior it is possible to sort the particles
into two groups: glass particles and ABS, which were coated by the suspensions
because of their characteristics of wettability (contact angles �70°), and particles of
TABLE 6.1Physical Properties of Inert Particles
Material Glass beads ABS® PP PS
Shape Round Round Irregular Wedge
dp (mm) 2.13 2.90 2.91 4.58
f 0.81 ± 0.05 0.77 ± 0.06 0.74 ± 0.06 0.90 ± 0.07
� (°) 31.03 ± 1.15 40.27 ± 2.22 37.67 ± 2.12 36.67 ± 1.22
rtrue (kg/m3) 2491.5 ± 0.4 1022.1 ± 0.8 905.3 ± 0.6 1060 ± 0.6
rap (kg/m3) 2491.7 1013.6 905.3 1049.1
ep (%) 0 0.83 0 1.03
FI (mm) 18 14 18 10
sp ¥ 103 (N/m) 85 34 30 32
TABLE 6.2Physical Characteristics of Suspensions
Characteristics
Suspension
1 2 3
Cs (kg/kg) 0.1270 ± 0.006 0.1050 ± 0.001 0.1024 ± 0.003
rsusp (kg/m3) 1042.8 ± 5.70 1054.5 ± 5.8 1015.1 ± 3.0
s ¥ 103 (N/m) 60.09 ± 1.20 46.27 ± 0.61 67.50 ± 0.65
n 0.8754 ± 0.021 0.8226 ± 0.024 0.8330 ± 0.059
m (Nsn/m2) 0.3235 ± 0.004 0.1220 ± 0.010 0.1109 ± 0.035
map (Ns/m2) 0.1368 0.0358 0.0349
52527_C006.indd 16152527_C006.indd 161 10/3/2008 3:49:14 PM10/3/2008 3:49:14 PM
© 2009 by Taylor & Francis Group, LLC

162 Advances in Food Dehydration
PS and PP, which promoted drying of the suspension (contact angle �76°) that is
due to their superfi cial characteristics.
These results are in agreement with those of Adeodato et al. (2004), who investi-
gated the adhesion of an aqueous polymeric suspension to several inert particles
(glass, ABS, placebo, PP, PS, and LDPE) in a spouted bed with the suspension
atomized at the top. They observed that the suspension did not adhere to particles
with large angles of contact with the suspension (≥80°), such as PS, PP, and LDPE;
therefore, the suspension was elutriated. The particles that were coated by the suspension
(glass, ABS, and placebo) had contact angles <80°. Figure 6.4 shows the results.
For PP and PS there is no formation of a coating layer because of the weak
adhesion between the particle and suspension. The fi lm formed on the PP particles is
not uniform and can be easily removed by interparticle attrition. The fi lm formed on
the PS surface is more homogeneous, which must be related to the strong infl uence
of the solid surface energy on the process effi ciency. The PS particles have higher
surface energy that favors particle–liquid interaction and the above behavior
(Marques et al., 2006).
It can be concluded that the effi ciency of the inert particle (and therefore of the
drying operation) is directly related to the surface characteristics of the particle–
paste pair and the choice of the inert particle must be based on these characteristics.
(The 80° limit of the contact angle is a good indication of the good effi ciency of inert
particles for a drying operation.) Studies about the infl uence of solid surface energy
TABLE 6.4Spouted Bed Operating Conditions
Bed height (m) 0.155
Spout velocity (m/s) 1.15 ¥ Ujm
Spouting air temperature (°C) 60
Suspension fl ow rate (ml/min) 6.0
Atomization pressure (psig) 20
Process time (min) 30
TABLE 6.3Particle–Suspension Contact Angles
Material
Contact Angle
Suspension 1 Suspension 2 Suspension 3
Glass 37.82 ± 1.42 34.94 ± 2.44 37.86 ± 2.34
ABS 70.35 ± 1.35 54.29 ± 3.48 70.0 ± 1.45
PS 76.68 ± 2.38 57.50 ± 3.31 79.5 ± 1.57
PP 78.98 ± 2.33 70.98 ± 2.41 80.9 ± 1.21
52527_C006.indd 16252527_C006.indd 162 10/3/2008 3:49:14 PM10/3/2008 3:49:14 PM
© 2009 by Taylor & Francis Group, LLC

Advances in Spouted Bed Drying of Foods 163
combined with the friability of the fi lm on the effi ciency of powder production are
challenges for further investigations.
Once the inert particles have been chosen, their properties (size, shape, rest
angle, density, and porosity) and the conditions of operation will directly infl uence
process performance. Optimization of the process may be carried out for each case.
6.3 DRYING OF TROPICAL FRUIT PULPS
A signifi cant amount of fruit production is wasted every year throughout the world
(mainly in developing countries) because of the lack of adequate and low-cost
processing (mainly drying) that would permit its industrialization and marketing.
In Brazil, the loss is up to 40% for some cultivations (it should typically not
exceed 10%).
The drying of fruit pulps in a spouted bed is a lower cost alternative to spray
drying. This method is appropriate for small-scale processing, can process different
kinds of pulps (even mixed pulps) in the same equipment, and has the same level of
product quality as spray drying.
Knowledge of the chemical composition of fruit pulps, mainly the reducing
sugars and lipids, is essential to obtain an effi cient drying process. Lima et al. (2000)
identifi ed the infl uence of reducing sugars, lipids, and fi bers on the drying effi ciency
of the following tropical fruit pulps: umbu (Spondias tuberosa), cajá (Spondia lutea),
cajá-manga (Spondias dulcis), pinha (Armona squamosa), seriguela (Spondia pupurea), mango (Mangifera indica), West Indian cherry (Malpighia punicifolia),
FIGURE 6.4 Infl uence of contact angle on the particle–suspension adhesion.
100
90
80
70
60
50
40
30
20
10
0Glass
Con
tact
ang
le (
°)
ABS
Particlescoating
Suspensiondrying
Placebo PS PP LDPE
52527_C006.indd 16352527_C006.indd 163 10/3/2008 3:49:14 PM10/3/2008 3:49:14 PM
© 2009 by Taylor & Francis Group, LLC

164 Advances in Food Dehydration
and avocado (Persea americana). Martinez et al. (1996) observed the infl uence of
reducing sugars and lipids on the performance of milk drying.
Medeiros et al. (2002) attempted to determine the infl uence of paste composition
on spouted bed hydrodynamics and on drying performance. The effect of varying the
chemical composition of the pulp was directly related to variations in physical properties
and surface properties, which causes the spouted bed drier behavior to change.
Taking natural mango pulp as the basis, modifi ed pulps with controlled concen-
trations of reducing sugars, lipids, fi bers, starch, and pectin were obtained. Starch, fi bers,
and pectin were included in the analysis of the process because of the important infl u-
ence of these components on the physical properties of liquid foods and the presence
of starch and pectin in almost all tropical fruit pulps (with high concentrations of
starch in some of the pulps).
The effects that the concentration of these components in the pulps had on the
fl uid dynamics of the spouted bed and on the drying process were investigated using
a factorial design for the experiments. The operating conditions were fi xed in all
experiments. The effi ciency of powder production, the stable spout pressure drop,
and the minimum spouting fl ow rate were the responses analyzed. Details of the
experimental procedure and materials utilized to control the pulps compositions can
be found in Medeiros et al. (2002). HDPE particles (group D in Geldart’s diagram)
with a diameter of 3 ¥ 10–3 m were used as the inert material (density � 950 kg/m3,
sphericity � 0.76, static bed porosity � 0.29, apparent density � 679 kg/m3). The
concentrations levels utilized in the factorial design of the experiments are provided
in Table 6.5. The operating conditions were the following: air inlet temperature of
70 ± 1°C, 2.5 ± 0.1 kg load of inert particles, 50 ± 0.5 g pulp feeding, 40-min drying
time, an 1.25 ± 0.05 ratio of air-fl ow rate to minimum spouting fl ow rate.
Examples of drying curves are presented in Figure 6.5 (absolute humidity at the
outlet of the bed as a function of time) and Figure 6.6 (evaporation rate as a function
of time). Very fast evaporation occurs in the initial minutes of the drying procedure,
as can be observed. Later the absolute humidity of the air at the outlet of the bed
reaches the value of absolute humidity entering the bed and the evaporation rate is
brought down to zero. This behavior was seen in most of the experiments, and total
evaporation occurred in the fi rst 10 min of drying.
The evaporation rates were not infl uenced by pulp composition or physical
properties. Some small differences in the values of the air humidity at the outlet and
TABLE 6.5Concentration Levels of Components
Concentration Levels (C/Cwater ¥ 100%)
C1 Reducing Sugars C2 Lipids C3 Fibers C4 Starch C5 Pectin
–1 7.67 0.78 0.50 0.52 0.67
0 13.81 3.81 1.25 2.59 1.25
�1 19.95 6.84 2.00 4.66 1.82
52527_C006.indd 16452527_C006.indd 164 10/3/2008 3:49:14 PM10/3/2008 3:49:14 PM
© 2009 by Taylor & Francis Group, LLC

Advances in Spouted Bed Drying of Foods 165
evaporation rates were noted that were attributable to noncontrolled changes in
psychrometric conditions (Medeiros et al., 2002).
By integrating the curves for the evaporation rates as a function of time we can
obtain the mass of water evaporated during the drying, considering for each
experiment the time interval in which water evaporation is occurring. Figure 6.7
FIGURE 6.5 Absolute air humidity as a function of time for runs 16, 18, and 19. Run 16:
C1 � 19.95, C2 � 6.84, C3 � 2.00, C4 � 4.66, C5 � 1.82. Run 18: C1 � 13.81, C2 � 3.81,
C3 � 1.25, C4 � 2.59, C5 � 1.25. Run 19: C1 � 13.81, C2 � 3.81, C3 � 1.25, C4 � 2.59,
C5 � 1.25. (Adapted from Medeiros, M.F.D. et al., Dry. Technol., 20, 855–881, 2002. With
permission of Taylor & Francis.)
0.030
Run 18
Run 19
Run 16
0.028
0.026
0.024
0.022
Y (
kg/k
g)
0.020
0.018
0.016
0.0140 2 4 6 8
Time (min)
10 12 14 16
FIGURE 6.6 Evaporation rates as a function of time for runs 16, 18, and 19. Run 16: C1 �
19.95, C2 � 6.84, C3 � 2.00, C4 � 4.66, C5 � 1.82. Run 18: C1 � 13.81, C2 � 3.81, C3 � 1.25,
C4 � 2.59, C5 � 1.25. Run 19: C1 � 13.81, C2 � 3.81, C3 � 1.25, C4 � 2.59, C5 � 1.25.
(Adapted from Medeiros, M.F.D. et al., Dry. Technol., 20, 855–881, 2002. With permission
of Taylor & Francis.)
16
14
12
10
8
W ×
103
(kg/
min
)
6
Run 18
Run 19
Run 16
4
16 181412108
Time (min)
64
2
20
0
52527_C006.indd 16552527_C006.indd 165 10/3/2008 3:49:14 PM10/3/2008 3:49:14 PM
© 2009 by Taylor & Francis Group, LLC

166 Advances in Food Dehydration
exemplifi es cumulative curves for water evaporated as a function of time in several
experiments of fruit pulp drying at different compositions.
Independent of the pulp composition, the masses of water evaporated in the fi rst
2 min varied from 30 g (experiment 13) to 38 g (experiments 10 and 19), which
corresponds to fractions of evaporation between 84.5 and 95.8% (Figure 6.7). The
evaporation rate after that period is very low, showing the high capacity of evaporation
of the spouted bed with inerts.
Concerning the fl uid dynamics, the feeding of pulps followed by intense modifi -
cation of the fl uid dynamic behavior of the bed was characterized by variations in
pressure drop, air velocity, fountain height, and expansion in the annulus. Depending
on the intensity of these variations, the bed can undergo serious instability problems
and spout collapse. In some experiments, the problems with instability, although
attenuated by evaporation of water, persisted even when the evaporation rates were
zero. Note that composition infl uences the bed fl uid dynamics not only during feeding
but also instability problems caused by the presence of pulp can persist even when the
bed is practically dry. In this case, the bed is modifi ed by the presence of fi ne solids.
The degree of saturation and stability of the bed during drying of pastes in
spouted beds, when the inert particles are coated with liquid fi lms, is referred to in
the most important works on the fl uid dynamic changes of the bed (Passos and
Mujumdar, 2000; Schneider and Bridgwater, 1993; Spitzner Neto and Freire, 1997).
Thus, the models and equations proposed in these works to estimate cohesion forces,
correlated with the degree of bed saturation and with other fl uid dynamic variables
of the bed at minimum spouting conditions, are not appropriate to simulate the bed
dynamic behavior when the fi lm adhering to the inert dries very fast (as in the drying
of fruit pulps).
Modifi cations of the physical properties of the pulps (density, apparent viscosity,
and surface tension) due to water evaporation and material heating make it unviable
FIGURE 6.7 Cumulative curves for evaporated water mass as a function of time.
(Adapted from Medeiros, M.F.D. et al., Dry. Technol., 20, 855–881, 2002. With permission of
Taylor & Francis.)
45
40
35
30
25
20
mev
× 1
03 (k
g)
15
10
5
00 2 4 6 8
Time (min)
10 12 14 16
Run 7Run 4Run 3Run 19Run 18Run 15Run 14Run 12Run 11Run 10Run 9Run 16Run 13
52527_C006.indd 16652527_C006.indd 166 10/3/2008 3:49:14 PM10/3/2008 3:49:14 PM
© 2009 by Taylor & Francis Group, LLC

Advances in Spouted Bed Drying of Foods 167
to discuss the effects of these properties (evaluated for the pulps at their original
moisture content) on the bed fl uid dynamic and drier performance.
Figure 6.8 illustrates the changes caused in bed pressure drop by the feeding of
different pulps, water, and natural mango pulp relative to the dry bed. All of the
results show a sudden decrease in pressure drop at the moment when the pulps were
added to the bed. The decrease can be explained by agglomeration, which along with
the viscosity of the paste affects particle circulation as well as the passage of air
through the bed, increasing the air fraction that crosses the spout region and
consequently the air velocity in this region. Because there is a lower resistance to the
air passage, the pressure drop decreases. The same effect was observed by Spitzner
Neto and Freire (1997) with continuous feeding of paste.
After the pulps dry on the inert particle surface, the pressure drop is not restored
to its initial value but stabilizes at a lower value. The solid fi lms covering the particle
surface give rise to solid bridges, which increase the adhesion forces between the
particles. Thus, the infl uence of the dried pulp on the bed fl uid dynamics is evident.
Simultaneous changes in the bed by the addition of pastes (pulps) can usually be
found, which are characterized by an increase in superfi cial air velocity, a decrease
in pressure drop, and a more expanded fountain and annulus. These phenomena were
observed in every experiment, except for experiment 2 (presence of reducing sugars),
in which chance of collapse was characterized by a lower and less dense fountain
than the one observed with the bed of inert particles (Medeiros et al., 2002). The
adhesion characteristics prevailed and caused different behavior in the case of the
presence of reducing sugars.
A statistical analysis of the results demonstrated that the composition of all of
the components had signifi cant effects on the effi ciency of powder production,
except for the concentration of fi bers. The concentration of fi bers did not have
FIGURE 6.8 Infl uence of pulp feeding with a higher concentration of pectin (pulp 1),
reducing sugars (pulp 2), lipids (pulp 3), fi ber (pulp 5), starch (pulp 9), natural mango, and
water on the bed pressure drop.
1.2
1
0.8
0.6
ΔP/Δ
P0
0.4
0.2
00 2 4 6
Time (min)
8 10
Pulp 1
Pulp 2Pulp 3Pulp 5Pulp 9MangoWater
52527_C006.indd 16752527_C006.indd 167 10/3/2008 3:49:15 PM10/3/2008 3:49:15 PM
© 2009 by Taylor & Francis Group, LLC

168 Advances in Food Dehydration
signifi cant effects on any of the response variables analyzed in the fl uid dynamic
and drying experiments.
Sugar causes a decrease in effi ciency, and its effect is the most important. Lipids,
starch, and pectin favor powder production. Among the variables that favorably
infl uence effi ciency, the concentration of starch is the most important. The combined
effects of reducing sugars–lipids and starch–pectin on the effi ciency of powder
production are signifi cant. The results on the infl uences of lipids and reducing sugars
are in agreement with those found in Martinez et al. (1996).
Medeiros et al. (2002) utilized statistical analysis of the dynamic parameters to
show that the composition variables do not have signifi cant effects on the minimum
spouting fl ow rate, but the effects of sugar and starch concentrations on the stable
spout pressure drop are signifi cant. Beyond the individual effects of reducing sugar
and starch on the stable spout pressure drop, the interactions of reducing sugars–
lipids, lipids–starch, and lipids–starch–pectin also had signifi cant effects on �ps.
Thus, interactions between the composition variables can cancel or decrease the
main effects of the isolated concentrations.
This analysis pointed out the possibility of using a mix of fruit pulps to optimize
the fl uid dynamic behavior of the spouted bed, resulting in higher drying effi ciency
due to the synergy of the components of different pulps.
6.4 DRYING OF GRAINS
Seeds and grains, which have high nutritional value, are important products in the
food industry. Grains, in general, are harvested in the fi eld and have high moisture
contents. For storage and conditioning, it is essential to decrease the moisture content
of the grain by an effi cient drying process. The choice and design of the dryer, the
operating conditions, and the infl uence of these parameters on the fi nal product
quality are very important characteristics to take into account in an analysis of grain
drying (Inprasit and Noomhorm, 2001; Sangkram and Noomhorm, 2002).
The main grain drying applications for the SBD are beans and paddy.
Investigations show good results in terms of fi nal moisture content. Good quality
products with homogeneous moisture content and material temperature were
obtained by various studies (Lima and Rocha, 1998; Madhiyanon et al., 2001a, 2002;
Robins and Fryer, 2003; Wiriyaumpaiwong and Devahastin, 2005; Wiriyaumpaiwong
et al., 2003).
However, because of the limitation of its scale of production, the spouted bed has
received limited attention for application on a large scale. One of the few industrial-
scale spouted beds was built and tested by Madhiyanon et al. (2001b) for the
continuous drying of paddy. The dryer capacity was around 3500 kg/h of paddy with
initial moisture contents in the range of 14 to 25%. They evaluated the consumption
of thermal energy, which was in the range of 3.1 to 3.8 MJ/kg of evaporated water,
comparable to that of other commercial dryers. In addition to the diffi culty of scale-
up, most grains become fragile when submitted to a moving, fl uidized, or SBD,
which is due to exposure to severe attrition conditions. Thus, the use of an intermit-
tent drying process could be profi table and even necessary to maintain product quality
(especially when dealing with grain seeds).
52527_C006.indd 16852527_C006.indd 168 10/3/2008 3:49:15 PM10/3/2008 3:49:15 PM
© 2009 by Taylor & Francis Group, LLC

Advances in Spouted Bed Drying of Foods 169
Intermittence in the operation is when the air supply to the bed or the active fl uid
dynamic regime is stopped from time to time (e.g., decreasing the air-fl ow rate from
stable spouting to a value that establishes a fi xed bed regime). Therefore, the bed of
grains is not continuously under the active hydrodynamic regime; consequently, less
grain damage and energy savings are achieved. Nevertheless, it is necessary to
analyze the infl uence of intermittence on the fi nal grain water content.
Oliveira (1999) analyzed the behavior and effi ciency of bean drying in the
intermittent spouted or fi xed bed and in the completely intermittent spouted bed
or rest regimes and compared the results to those obtained in a conventional
spouted bed without intermittence. Phaseolus vulgaris L. beans (commonly
called carioca beans) were utilized, which is the most common variety of beans,
responsible for about 95% of the world production. They are a very important
source of calories in the human diet, mainly in the underdeveloped countries of
tropical and subtropical regions.
A simple spouted bed drying system and bed dimensions used by Oliveira (1999)
are demonstrated in Figure 6.9a and b, respectively. Two types of intermittent pro-
cesses were conducted: spouted or fi xed bed (process I) and spouted bed or rest
(process II). In process I the bed (after attaining thermal equilibrium) is loaded with
grain and the air-fl ow rate adjusted to a stable spout condition. The air-fl ow rate is
then decreased from time to time until the spout collapses and the bed of beans
remains fi xed. The air-fl ow rate is maintained constant under the fi xed bed condition
for a period of time defi ned as the intermittence time (ti). After that time, the bed is
again spouted by increasing the air-fl ow rate to the previous value of a stable spout
condition for the same period ti. The same procedure is repeated during a 240-min
drying process.
Process II is similar to process I, but at the ti the air fl ow to the bed is totally
interrupted. After the ti of interruption of air to the bed, the air supply is restored
under the stable spout condition. This procedure is repeated during 240 min of
drying time.
The values of the initial moisture content of the grains (X0) loaded onto the bed
correspond to freshly picked beans at different times of the year (20 and 30% db). The
drying air temperatures (Tar) were 60 and 80°C, and the ti values were 20 and 40 min.
The lowest value of the fi nal moisture content (Xf) of the beans obtained for
process I is 9.02% db, which corresponds to operating conditions in which Tar is
80°C, X0 is 20% db, and ti is 20 min. For process II the lowest fi nal moisture content
was 11.58% db for operating conditions of Tar at 80°C, X0 at 20% db, and ti at 40 min.
For both processes, the lowest moisture content was obtained at the highest
temperature, as expected. Although higher fi nal moisture content values were
obtained for the spouted bed or rest intermittent process, both values of the lowest Xf
(9.02 and 11.58% db) are in the range specifi ed for good conditions of carioca bean
storage (9.0% ≤ Xf ≤ 13.0% db; Cavalcanti Mata, 1997). Figures 6.10 and 6.11 are
examples of drying curves and grain temperature curves, respectively (all experiments
showed the same qualitative behavior).
The Tar had a signifi cant infl uence on the drying curves, especially for drying
times above 40 min. These results were expected, because temperature has a
signifi cant infl uence on the falling rate period in drying processes.
52527_C006.indd 16952527_C006.indd 169 10/3/2008 3:49:15 PM10/3/2008 3:49:15 PM
© 2009 by Taylor & Francis Group, LLC

170 Advances in Food Dehydration
FIGURE 6.9 Spouted bed (a) drying system and (b) dimensions.
12 4 5
3
7
6
1-Blower2-Heater3-On–off controller4-Valve5-Orifice plate6-Spouted bed7-Differential pressure transmitter8-Absolute pressure transmitter9-Acquisition board10-Computer
5 cm
(a)
(b)
7 cm
7.5 cm
30 cm
20 cm
60°
45°
13 cm
7 cm
9
8
10
52527_C006.indd 17052527_C006.indd 170 10/3/2008 3:49:15 PM10/3/2008 3:49:15 PM
© 2009 by Taylor & Francis Group, LLC

Advances in Spouted Bed Drying of Foods 171
It is important to point out that some experiments have drying curves showing
rewetting points attributable to vapor condensation inside the bed during the
intermittence period. These points occurred particularly for process II, where the air
supply is totally interrupted in the intermittence period. These rewetting points are
shown more explicitly mainly in the drying runs that operated under conditions of a
high initial moisture content of the grains of around 30% db.
Figures 6.12 to 6.15 show comparisons of the drying of beans in fi xed, spouted,
and intermittent spouted beds, respectively. Lower grain temperatures are obtained
when intermittent process II is applied, which is a satisfactory result, because lower
grain temperatures are required to maintain their unchanged physical and chemical
FIGURE 6.10 Infl uence of air temperature on the drying kinetics for drying process I:
spouted or fi xed bed. Conditions: ti � 40 min, X0 � 30% db.
1.0
0.8
0.6
0.4
0.2
0.00 40 80 120 160 200
Tar = 80°CTar = 60°C
240
00
10
20
30
40
40
50
60
70
80
80
120
Drying time (min)
Drying time (min)
(a)
(b)
Gra
in te
mpe
ratu
re (
°C)
X/X
0
160 200 240
Tar = 80°C
Tar = 60°C
52527_C006.indd 17152527_C006.indd 171 10/3/2008 3:49:15 PM10/3/2008 3:49:15 PM
© 2009 by Taylor & Francis Group, LLC

172 Advances in Food Dehydration
properties. The drying kinetics is almost the same for the fi xed and spouted beds, but
different behaviors are observed for intermittent processes I and II.
Points of rewetting appear for intermittent process II (spouted bed or rest).
Consequently, the bean moisture content is higher at the same drying time for this
type of intermittence. For intermittent process I (spouted or fi xed bed) the rewetting
points are not as evident. However, a higher moisture content is still observed for the
same drying time compared to the drying conducted in the spouted bed without
intermittence or the fi xed bed.
FIGURE 6.11 Infl uence of air temperature on grain temperature for drying process II:
spouted bed or rest. Conditions: ti � 40 min, X0 � 30% db.
1.0
0.8
0.6
0.4
0.2
0.0
0
10
20
30
40
Gra
in te
mpe
ratu
re (
°C)
X/X
0
50
60
70
80
0 40 80 120
Drying time (min)
(a)
(b)
160 200
Tar = 80°C
Tar = 60°C
Tar = 80°C
Tar = 60°C
240
0 40 80 120
Drying time (min)
160 200 240
52527_C006.indd 17252527_C006.indd 172 10/3/2008 3:49:15 PM10/3/2008 3:49:15 PM
© 2009 by Taylor & Francis Group, LLC

Advances in Spouted Bed Drying of Foods 173
The fi nal moisture contents at 240 min of drying are close in all cases under the
same operating conditions, especially when comparing spouted bed and spouted or
fi xed bed (process I).
In addition to the advantage of intermittent drying in terms of product quality, it
is important to evaluate whether intermittent drying promotes more energy savings
than spouted bed drying. The energy evaluation in a drying process can be made
FIGURE 6.12 Comparison of drying curves for carioca beans in fi xed and spouted beds
with and without intermittence (Tar � 80°C, X0 � 20% db, ti � 40 min).
1.0
0.8
0.6
0.4
X/X
0
0.2
Intermittencespouted/fixed bed
Spouted bedFixed bed
0.00 40 80 120
Drying time (min)
160 200 240
FIGURE 6.13 Comparison of drying curves for carioca beans in fi xed and spouted beds
with and without intermittence (Tar � 80°C, X0 � 30% db, ti � 40 min).
1.0
0.8
0.6
0.4
Intermittencespouted/rest bed
Spouted bed
Fixed bed
X/X
0
0.2
0.00 40 80 120
Drying time (min)
160 200 240
52527_C006.indd 17352527_C006.indd 173 10/3/2008 3:49:16 PM10/3/2008 3:49:16 PM
© 2009 by Taylor & Francis Group, LLC

174 Advances in Food Dehydration
based on energy coeffi cients presented in the literature (Dewettinck et al., 1999;
Lima and Rocha, 1998; Pakowski and Mujumdar, 1995).
Drying effi ciency (DE) is defi ned as the energy fl ux necessary to heat the grains
and to evaporate the water in relation to the total energy fl ux supplied to the operation
[Eq. (6.4)]. The drying coeffi cient (DC) is defi ned as the amount of water evaporated
by the amount of energy supplied to the operation [Eq. (6.8)]. The fl uid dynamic
FIGURE 6.14 Comparison of grain temperature of carioca beans in fi xed and spouted beds
with and without intermittence (Tar � 80°C, X0 � 20% db, ti � 40 min).
80
70
60
50
40
Gra
in te
mpe
ratu
re (
°C)
30
20
10
00 40 80 120
Drying time (min)
160
Intermittencespouted/fixed bed
Spouted bed
Fixed bed
200 240
FIGURE 6.15 Comparison of grain temperature of carioca beans in fi xed and spouted beds
with and without intermittence (Tar � 80°C, X0 � 30% db, ti � 40 min).
80
70
60
50
40
Gra
in te
mpe
ratu
re (
°C)
30
20
10
00 40 80 120
Drying time (min)
Intermittencespouted/rest bed
Spouted bed
Fixed bed
160 200 240
52527_C006.indd 17452527_C006.indd 174 10/3/2008 3:49:16 PM10/3/2008 3:49:16 PM
© 2009 by Taylor & Francis Group, LLC

Advances in Spouted Bed Drying of Foods 175
drying coeffi cient (FC) is the ratio between the energy spent to vaporize the water
and the mechanical energy required to pump the air [Eq. (6.9)]. It was used to
compare the fl uid dynamic aspects of drying processes I and II.
h,g v,wDE 100
ET
E E��
(6.4)
The necessary energy fl ux to heat the grain from its initial temperature to the
fi nal temperature (Eh,g) can be calculated as proposed by Strumillo and Kudra (1986):
Eh,g � mg,dry (cgf ¥ Tgf - cg0 ¥ Tg0)/th,g (6.5)
The necessary energy fl ux for evaporation of the moisture (Ev,w) is
Ev,w � �Hv,w ¥ (mg,w /td) (6.6)
The total energy fl ux supplied to the operation (ET) is considered as the sum of
the thermal and mechanical energy fl uxes.
The thermal energy fl ux (Eter) supplied to the operation was calculated as
Eter � ◊mar ¥ (car ¥ Tar - camb ¥ Tamb) (6.7)
DC � mg,w /td _____
ET (6.8)
v,wFC 100
EM
E= ¥
(6.9)
A comparison of the energy analysis for intermittent processes I and II and
for spouted bed drying of beans without intermittence are presented in Tables 6.6
TABLE 6.6Drying Effi ciency and Energy Coeffi cients: Spouted or Fixed Bed and Spouted Bed or Rest Regimes
Drying Process I: Spouted or Fixed Bed Drying Process II: Spouted Bed or Rest
Run DE (%) DC (kg/kJ) ¥ 105 FC (%) DE (%) DC (kg/kJ) ¥ 105 FC (%)
1 14.81 1.33 3.59 21.06 1.98 5.37
2 11.83 1.32 3.57 17.18 1.72 4.67
3 5.19 1.51 3.94 7.39 2.10 5.47
4 7.04 1.06 2.76 7.76 1.63 4.25
5 10.60 1.08 2.94 15.69 1.27 3.49
6 9.21 1.06 2.88 11.15 1.43 3.93
7 10.35 0.95 2.47 23.47 1.34 3.47
8 12.66 0.94 2.46 16.02 1.19 3.09
52527_C006.indd 17552527_C006.indd 175 10/3/2008 3:49:16 PM10/3/2008 3:49:16 PM
© 2009 by Taylor & Francis Group, LLC

176 Advances in Food Dehydration
and 6.7, respectively. Higher DE values were obtained at Tar of 80°C, X0 of 20 or
30% db, and ti of 40 min for processes I and II. A high intermittence time causes a
decrease in the total energy supplied to the grains whereas the high air temperatures
and initial grain moisture content cause an increase in the mass of moisture evapo-
rated, thus increasing the energy effi ciency of drying. It can also be verifi ed that a
high DE value was obtained at Tar of 60°C, X0 of 20 or 30% db, and ti of 20 min in
the case of process II. This result indicates that the low total energy input (low air
temperature and interruption of the air to the dryer in the ranges analyzed) does not
jeopardize the evaporation of moisture. Comparing processes I and II, the energy
effi ciency of drying was higher for process II under all operating conditions.
The highest DC and FC coeffi cients were obtained for conditions consisting of
Tar at 60°C, X0 at 30% db, and ti at 40 min. Higher values for the coeffi cients were
obtained with ti at 40 min. The long intermittence time causes a decrease in the total
energy input and resulted in a decrease in mechanical energy, thus favoring the
increase in DC and FC coeffi cients.
The general rule applying to drying effi ciency is spouted bed or rest � spouted
or fi xed bed � spouted bed, which results in the choice of the intermittent
process spouted bed or rest to obtain the lowest energy consumption or high energy
effi ciencies.
The numbers obtained for energy effi ciency and coeffi cients are close to the
values found for industrial continuous convective dryers (Raghavan et al., 2004;
Vieira et al., 2005).
6.5 LATEST ADVANCES IN SPOUTED BED DRYING
The following sections present a summary of recent developments in spouted bed
technology. Quality, novel equipment designs, computational simulation, and control
are the main focus of the recent research applying this drying technique.
TABLE 6.7Comparison of Drying Processes in Spouted Bed without and with Intermittence
Process: Spouted Bed
Tar (°C) X0 (% db) Grain Mass (g) m. ar (kg/min) Xf (% db) DE (%) DC (kg/kJ) ¥ 105 FC (%)
83 20 3000 2.27 9.13 7.56 1.6 1.04
83 30 3000 2.33 9.25 9.29 2.5 1.66
Intermittent Drying Process I: Spouted or Fixed Bed
80 20 3200 2.44 9.02 11.83 1.32 3.57
80 30 3200 2.44 9.17 14.81 1.33 3.59
Intermittent Drying Process II: Spouted Bed or Rest
80 20 3200 2.44 11.58 17.18 1.72 4.67
80 30 3200 2.44 11.85 21.06 1.98 5.37
52527_C006.indd 17652527_C006.indd 176 10/3/2008 3:49:16 PM10/3/2008 3:49:16 PM
© 2009 by Taylor & Francis Group, LLC

Advances in Spouted Bed Drying of Foods 177
6.5.1 PRODUCT QUALITY IN SPOUTED BED DRYING OF PASTES OR SUSPENSIONS
The quality of food products must follow specifi cations for esthetics and nutritional
properties. Because of the thermal sensitivity of biological materials, such as food-
stuffs, the operating conditions of drying are limited. Beyond an analysis of the
drying process, knowledge of the changes in and degradation of the product as a
consequence of drying is among the main objectives of recent works on drying
technology. In addition, diffi culties in the drying process due to modifi cation of the
material inside the dryer (i.e., shrinkage) were recently studied (Almeida et al., 2006).
The quality of foodstuffs is characterized by fl avor, texture, and color. If color is
unacceptable to the consumer, the product is rejected, regardless of its taste and tex-
ture, and modifi cations of protein and variations in physical properties may be
quickly recognized by color changes. Quantifi cation of important components that
are present in a determined product (e.g., vitamins, carotenoids, etc.) complements
its qualifi cation. Standard methodologies for their determination are available in the
specialized literature.
Ascorbic acid (vitamin C) is an important nutrient in fruits and vegetables. It is
more sensitive to heat, oxygen, and light than other compounds, such as vitamins
A and E and some phenolic compounds. Therefore, vitamin C content is usually
utilized as the parameter that defi nes the best drying method or condition for
retaining the nutritional quality of fruits and vegetables. The loss of vitamin C during
drying depends on the type of process, the physical properties of the product, and the
time–temperature conditions utilized in each type of dryer. In addition, quality
requirements according to the fi nal use of the product (such as particle size
distribution, rehydration capacity, fi nal moisture content, storing possibilities, etc.)
are also very important.
The drying of fruit pulps can result in browning reactions and pigment destruction
(Abers and Wrolstad, 1979). Recent works on product quality in the spouted bed
drying of pastes and suspensions can be found in current research.
Cunha et al. (2006) evaluated the infl uence of operating conditions on the
effi ciency of powder production in the drying of mango pulp. The effects of air
temperature, feed rate, and annulus and spout gas fl ow rate were evaluated using a
full factorial design for the experiments. In addition, the powder morphology as well
as vitamin C and carotenoid contents of some samples were analyzed after drying.
A two-dimensional spout fl uidized bed (0.05 ¥ 0.32 m) with a square inlet air orifi ce
(0.05 ¥ 0.05 m) was utilized. The remaining area was dedicated to annulus aeration
and fl uidization.
Although temperature has the greatest infl uence on the maintenance of quality
in fruit drying (high temperature jeopardizes the maintenance of nutritional
properties) for the range analyzed by Cunha et al. (2006), higher drying tempera-
tures favored the retention of carotenoids, in addition to diminishing product
browning and moisture content. The ranges utilized for mango pulp drying were
temperatures of 55 to 75°C, feed rates of 0.5 to 2.5 g/min, and spout and annulus air
velocities (or fl ow rates) of 6–6.6 m/s (or 15–16.4 l/s) and 1.81–1.9 m/s (or 22.6–
24.1 l/s), respectively. Tests were conducted with intermittent feeding, because the
mango pulp could not be fed continuously. The elevated concentration of sugars
caused the bed dynamics to collapse. Temperature was the variable that had the
52527_C006.indd 17752527_C006.indd 177 10/3/2008 3:49:16 PM10/3/2008 3:49:16 PM
© 2009 by Taylor & Francis Group, LLC

178 Advances in Food Dehydration
greatest infl uence on the process, and it was directly proportional to the product pow-
der effi ciency. Higher feed mass and air-fl ow rates at the annulus also contributed to
an improvement in product quality and process effi ciency.
Benali and Amazouz (2006) also investigated product quality aspects for the
drying of vegetable starch solutions in a continuous conical jet spouted bed with
inert particles of Tefl on. The Tefl on load varied from 8 to 12 kg and the starch solution
feed rate was in the range of 60 to 120 kg/h. Color and level of starch damage were
utilized to defi ne the quality of the dry product. Method 76-31 of the American
Association for Cereal Chemists was applied to measure starch damage. For the
material tested, the damage index should be �2.5% and the lightness should be ≥93.
The results showed very good performance for drying in the continuous conical jet
spouted bed, resulting in a product with lightness and damage indexes in the ranges
established as industrial targets for vegetable starch (95.0–96.1 and 1.86–1.88,
respectively, for bottom atomization and 94.1–94.4 and 1.98–2.22, respectively, for
top atomization of the starch solution). In addition, a comparison of the proposed
dryer with a commercial fl ash dryer (90–92 and 3.5–5.1, respectively) indicated its
competitiveness in terms of product quality.
6.5.2 NOVEL AND COMBINED EQUIPMENT
The objectives of the design of new equipment or the utilization of combined drying
techniques are to improve drying effi ciency and to enable the use of the spouted bed
on a real scale.
Some of the most recent research dealing with new equipment and techniques is
for a mechanically spouted bed (MSB; Pallai et al., 2001), triangular and hexagonal
spouted beds (TSB and HSB; Hung-Nguyen et al., 2001), a combined microwave spouted
bed (MWSB; Nindo et al., 2003), and a sorption drying technique in a jet spouted bed
(Wachiraphansakul and Devahastin, 2007).
The new construction of the previous MSB (Pallai et al., 1995) includes an
internal tube of varying length, providing intensive drying and well-controlled heat
and mass transfers (Pallai et al., 2001). In the modifi ed equipment, alterations of
screw length and bed height can be made to control the particle size distribution and
to decrease the bed pressure drop when drying pastes or suspensions. Increasing the
screw length and maintaining an unchanged bed height results in an improvement of
wearing and grinding effects; decreasing the spouted bed height, maintaining the
screw length, and including the internal tube above the bed surface results in a
decrease in the bed pressure drop; and increasing the screw length together with a
decrease in spouted bed height result in both improvement of the wearing effect and
a decrease in the bed pressure drop. One of the most important advantages of the
modifi ed dryer construction is the possibility to decrease the spouted bed height and
thereby also the pressure drop without a reduction in the wearing time and without
affecting the drying effi ciency. Details of the original MSB and the modifi ed recent
construction can be found in Pallai et al. (2001).
The TSB has a different design (Hung-Nguyen et al., 2001), whose main aim is
scaling up. Satisfactory laboratory results on drying grains were determined for the
building of a pilot plant with a capacity of 500kg/batch. The pilot-scale TSB dryer,
which was designed and constructed by Hung-Nguyen et al. (2001), basically consists
52527_C006.indd 17852527_C006.indd 178 10/3/2008 3:49:16 PM10/3/2008 3:49:16 PM
© 2009 by Taylor & Francis Group, LLC

Advances in Spouted Bed Drying of Foods 179
of three plane walls connected to a 60° slanted base. A moveable draft plate is installed
in one corner in order to control the separation distance and thus determine the fl ow rate
of grains entering the spout region and to separate the spout and downward fl owing
grains. For the pilot TSB, a separation distance kept below 150mm worked the best.
An HSB dryer formed of a combination of six TSB units, which can work in
continuous or batch operation, was proposed by Hung-Nguyen et al. (2001). Evaluating
process performance and product quality when drying paddy with high moisture
content, the authors expected that paddy (moisture content � 24 to 27%) can reach
18 to 20% moisture in continuous drying in an HSB. The results point to a potential
application of the HSB dryer as a fi rst stage in grain treatment in a two-stage drying
method. The second stage of drying may apply a low air temperature so as not to
jeopardize the grain quality (temperatures above 80°C are not recommended for
grains having moisture contents lower than 20%).
Combined drying methods are important alternatives to take advantage of and
implement different drying technologies. One application for the combination of
drying in spouted beds with microwave application (MWSB) is the drying of
asparagus slices (Pallai et al., 1995). MWSB drying at a power level of 4 W/g was faster
than tray drying, increased retention of the benefi cial bioactive compounds in the dried
asparagus, and had the highest rehydration ratio when compared to tray, spouted bed,
Refractance Window®, and freeze drying. For drying processes with hot air, the
highest retention of total antioxidant activity was verifi ed for an MWSB at 60°C and
2 W/g. The results show the promising potential of the combined MWSB drying tech-
nique as an effi cient and fast process for obtaining good quality dried food products.
An alternative to deal with sticky and pulpy products, reducing agglomeration
and improving drying effi ciency, is the sorption drying technique. The use of an
adsorbent facilitates mass transfer from the moisture material and consequently
agglomeration is reduced; in addition, lower temperatures can be employed in
sorption drying. In the spouted bed drying of a sticky material, the addition of
spoutable adsorbent particles enhances the stable spout dynamic regime. Sorption
drying was applied to dry okara (soy milk residue) in a jet spouted bed
(Wachiraphansakul and Devahastin, 2007).
Soy milk residue (okara) is widely utilized as animal feed and in the East as
human food because of its large quantity of proteins and fi bers. The residue is a highly
cohesive mass with a complex chemical composition. In addition, okara protein is
considered to be of higher quality than that of other soy products. Its moisture content
is around 75 to 80%, which makes it highly perishable and sticky (Taruna and Jindal,
2002; Wachiraphansakul and Devahastin, 2005), thus being a candidate for the
sorption drying technique. High temperature drying of okara at 90 to 130°C was
conducted in a jet spouted bed of silica gel (sorbent) to produce okara for animal feed,
and low temperature drying (55 to 65°C) was performed to obtain dried okara to be
used as an ingredient in human foods (Wachiraphansakul and Devahastin, 2007).
The combined effects of the operating conditions infl uenced the drying rate, and
the effect of temperature was stronger for high superfi cial air velocities and low
silica heights. The particle circulation in the bed increased under these conditions.
In comparing the drying with and without adsorbent, higher drying rates were
obtained with the inclusion of silica, mainly due to higher temperatures (90°C).
At low temperatures the material moisture diffusivity is lower and the moisture may
52527_C006.indd 17952527_C006.indd 179 10/3/2008 3:49:16 PM10/3/2008 3:49:16 PM
© 2009 by Taylor & Francis Group, LLC

180 Advances in Food Dehydration
not be available for absorption; at high temperatures the effect of convection prevails
and competes with the effects of sorption.
Drying rates increase with higher absorbent mass/wet material mass ratios.
Nevertheless, there is a limit above which some segregation problems may occur. For
okara drying, Wachiraphansakul and Devahastin (2007) observed segregation when
the ratio was 0.3, mainly for lower drying air temperature and velocity and higher
initial bed heights. Thus, process optimization when using the sorption drying
technology implies not only the analysis of operating conditions but also the quantity
of adsorbent utilized.
Concerning the specifi c energy consumption, the inclusion of adsorbent tends to
reduce index values.
Summarizing the results on application of this drying technology to okara
drying, the following should be pointed out:
1. Adding sorbent particles to the spouted bed enhanced the drying process in
terms of the drying kinetics and quality of the dried okara.
2. The convection–sorption drying of okara in the jet spouted bed resulted in
better quality in terms of oxidation level, rehydration ability, and protein
solubility.
3. Addition of sorbent particles did not modify the results for urease activity
(signifi cance level of 95%).
4. The operating conditions must be optimized together with the percentage of
adsorbent added to the bed to enhance the results for the drying rates, qual-
ity indexes, and energy consumption.
6.5.3 MODELING, SIMULATION, AND CONTROL
Mathematical modeling, simulation methods, and control are reported in recent work
on SBD technology. Two types of approaches are encountered for modeling the SBD
processes: the fi rst approach includes models and simulations that utilize commercial
codes, mainly applying the computational fl uid dynamics (CFD) technique, and the
second approach involves models that do not apply commercial codes.
Because it is not the objective of this chapter to detail mathematical modeling,
simulation, and control of the SBD, a summary of the recent advances in this area
is provided.
An example of the second type of mathematical modeling can be found in Costa
et al. (2001). A mathematical model and a computer program (Fortran language) are
presented to simulate the drying of suspensions in conical spout–fl uid beds of inert
particles. Mass and energy balances for three phases (air, inert particles, and
suspension), air fl ow and particle circulation models, and an equation for the drying
kinetics comprise the model. The effects of cohesive forces were also included in the
model. Previously developed models were adopted for fl uid fl ow (Silva et al., 1997)
and solids (Oliveira, 1997) circulation. The basic assumptions of this model are as
follows. The column is thermally isolated and the suspension is injected at the top of
the column. The inlet air-fl ow rates are high enough to maintain the stable spouting
regime and promote inert particle attrition. Drying occurs only in the annulus and
52527_C006.indd 18052527_C006.indd 180 10/3/2008 3:49:17 PM10/3/2008 3:49:17 PM
© 2009 by Taylor & Francis Group, LLC

Advances in Spouted Bed Drying of Foods 181
fountain regions; as a consequence, the air humidity and the suspension moisture
content are constant in the spout region. In this spout region, the dry suspension layer
that covers the inert particles is brittle enough to break off because of particle attrition
and collision; and the powder produced in the spout region is in thermal equilibrium
with the spout air. As soon as this powder is produced, it is carried by air to a fi lter
or cyclone attached to the dryer exit. At the dryer exit, air and powder are in thermal
equilibrium. Temperature gradients inside the inert particles are neglected (validated
by the heat transfer model developed previously). In the annulus and fountain regions,
the water vapor concentration at the suspension layer surface is given by the
suspension sorption equilibrium curve.
Data from the literature on evaporation of water and drying of blood were applied
in the simulations to validate the model. Interparticle forces were neglected in these
data. The results showed that the simulations described the experimental values well.
CFD modeling can be applied to describe fl uid dynamics and heat and mass
transfers in SBD. An example of this technique is encountered in the work of
Szafran and Kmiec (2004) for the drying of grains in a spouted bed with a draft
tube. Drying kinetics is described by classical and diffusional models for constant
and falling rate periods. Conditions assumed for the simulations are as follows: a
continuous phase treated as an ideal gas, an incompressible solid phase, an incom-
pressible fl ow, adiabatic walls and nonslip wall conditions for all phases, an inlet
condition considered as a uniform velocity profi le, a pressure boundary condition
considered at the outlet, and axisymmetric boundary conditions applied along the
axis of symmetry. The heat and mass transfer models were added to FLUENT 6.1
as a compiled executable program.
CFD modeling provides detailed information about transient fl ow behavior,
distributions of solid-phase volume fractions, temperatures in the fl uid and solid
phases, Nusselt number, zones of high heat transfer rates in the column, mass fractions
in the fl uid and solid phases, and zones in the column where different periods of
drying occur. To evaluate the CFD technique, simulations were performed using inlet
conditions obtained in a spouted bed column 0.7 m high, having a diameter of 0.17 m
(cylindrical part) and an inlet orifi ce of 0.03 m. The cone base angle was 50° and a
draft tube was fi xed inside the column (internal diameter � 0.027 m, height � 0.116 m,
distance from bottom � 0.068 m). Even when dealing with highly wetted particles,
the results showed zones where internal mass transfer resistances were predominant
as well as zones with no mass transfer. CFD simulations predicted the mass-transfer
rate well but underpredicted the heat transfer rate, with the values being close to those
in the experimental data. To overcome the problem of a long computational time with
the CFD technique, the so-called point-by-point procedure can be used, mainly for
long drying time batch processes (Szafran and Kmiec, 2005). This procedure cannot
predict short-time transient dependences (e.g., the preliminary period of drying).
Detailed information about fl ow behavior in two-dimensional and cylindrical
spouted beds obtained from CFD modeling can be found in Duarte et al. (2004). The
simulations used data obtained from the literature for both bed geometries that were
analyzed: cylindrical utilizing glass beads and two-dimensional utilizing soybean
seeds. The simulated results for the velocity and voidage profi les showed good
agreement with the experimental ones.
52527_C006.indd 18152527_C006.indd 181 10/3/2008 3:49:17 PM10/3/2008 3:49:17 PM
© 2009 by Taylor & Francis Group, LLC

182 Advances in Food Dehydration
For drying process control when using SBD to dry pastes, an adaptive control
algorithm, generalized predictive control (GPC), has shown good performance as an
advanced control strategy.
Corrêa et al. (2002) obtained a robust and stable controller by applying a self-
tuning control using the GPC algorithm for spouted bed drying of egg paste. The
manipulated variables were the paste fl ow rate and the electric power of the heat
exchanger to maintain the air humidity and temperature set points. The ratio of egg
powder moisture to the difference between inlet and outlet air humidity was effi cient
as a tool to estimate product moisture, and the GPC control strategy maintained the
specifi ed product quality (moisture content of the egg powder of up to 4%).
NOMENCLATURE
VARIABLES
c specifi c heat (J/kg °C)
Cs solids concentration (kg/kg)
DC drying coeffi cient (kg/J)
DE drying effi ciency (%)
d diameter (m)
db dry basis
E energy fl ux (W)
FC fl uid dynamic coeffi cient (%)
FI fl owability index (m)
H height (m)
�H latent heat of vaporization (J/kg)
m mass (kg)
m mass fl ow rate (kg/s)
k power law rheology parameter (Nsn/m2)
n power law rheology parameter
�p pressure drop (N/m2)
Q fl ow rate (m3/s)
T temperature (°C)
t time (s)
W evaporation rate (kg/s)
X moisture content (kg/kg)
Y absolute humidity (kg/kg)
GREEK SYMBOLS
e porosity (%)
f sphericity
� angle of repose (°)
h effi ciency (%)
m viscosity (Ns/m2)
� contact angle (°)
r density (kg/m3)
52527_C006.indd 18252527_C006.indd 182 10/3/2008 3:49:17 PM10/3/2008 3:49:17 PM
© 2009 by Taylor & Francis Group, LLC

Advances in Spouted Bed Drying of Foods 183
s surface tension (N/m)
t work (N/m)
SUBSCRIPTS
ad adhesion
amb ambient
ap apparent
ar air
bulk bulk
d drying
ev evaporated
f fi nal
g grain
g,dry dry grain
g,w wet grain
h,g grain heating
i intermittence
lv liquid–vapor
M mechanical
max maximum
ms minimum spout
o outlet
p particle
paste paste
po powder
s spout
T total
true true
v,w water evaporation
0 initial
REFERENCES
Abers, J.E. and Wrolstad, R.E., Causative factors of color deterioration in strawberry preserves
during processing and storage, J. Food Sci., 44, 75–78, 1979.
Adamson, A.W., Physical Chemistry of Surfaces, John Wiley & Sons, New York, 1990.
Adeodato, M.G., Donida, M.W., and Rocha, S.C.S., Adhesion of an aqueous polymeric
suspension to inert particles in a spouted bed, Dry. Technol., 22, 1069–1086, 2004.
Almeida, M.M., Silva, O.S., and Alsina, O.L.S., Fluid-dynamic study of deformable materials
in spouted bed dryer, Dry. Technol., 24, 499–508, 2006.
Alsina, O.L.S., Lima, L.M.R., and Morais, V.L.M., Fluid-dynamic variables study of spouted
bed drying of acerola pulp, in Proceedings of the XXIV Brazilian Congress of Particulate Systems (in Portuguese), Vol. 1, Barrozo, M.A.S. and Damasceno, J.J.R.,
Eds., Federal University of Uberlândia, Uberlândia, Brazil, 1996, pp. 289–294.
Benali, M. and Amazouz, M., Drying of vegetable starch solutions on inert particles: Quality
and energy aspects, J. Food Eng., 74, 484–489, 2006.
Cavalcanti Mata, M.E.R.M., Effect of high temperature–short time stationary bed drying on
the conditioning of bean seeds (Phaseolus vulgaris L.), “carioca” variety: Experimental
52527_C006.indd 18352527_C006.indd 183 10/3/2008 3:49:17 PM10/3/2008 3:49:17 PM
© 2009 by Taylor & Francis Group, LLC

184 Advances in Food Dehydration
analyzes modeling and simulation (in Portuguese), Ph.D. thesis, State University of
Campinas, Campinas, Brazil, 1997.
Corrêa, N.A., Corrêa, R.G., and Freire, J.T., Self-tuning control of egg drying in spouted bed
using GPC algorithm, Dry. Technol., 20, 813–828, 2002.
Costa, E.F. Jr., Cardoso, M., and Passos, M.L., Simulation of drying suspensions in spout–
fl uid beds of inert particles, Dry. Technol., 19, 1975–2001, 2001.
Cunha, R.L., de la Cruz, A.G., and Menegalli, F.C., Effects of operating conditions on the
quality of mango pulp dried in a spout fl uidized bed, Dry. Technol., 24, 423–432, 2006.
Dewettinck, K., Messens, W., Deroo, L., and Huyghebaert, A., Agglomeration tendency
during top-spray coating with gelatin and starch hydrolysate, Lebensm.-Wiss. Technol., 32, 102–106, 1999.
Donida, M.W., Rocha, S.C.S., and Bartholomeu, F., Infl uence of polymeric coating suspension
characteristics on the particle coating in a spouted bed, Dry. Technol., 23, 1–13, 2005.
Duarte, C.R., Murata, V.V., and Barrozo, M.A.S., Study of the spouted bed fl uid dynamics
using CFD, in Drying 2004—Proceedings of the 14th International Drying Symposium (IDS 2004), Silva, M.A. and Rocha, S.C.S., Eds., Ourograf, Campinas, Brazil, 2004,
pp. 581–588.
Geldart, D., Gas Fluidization Technology, John Wiley & Sons, New York, 1986.
Hung-Nguyen, L., Driscoll, R.H., and Srzednicki, G., Drying of high moisture content paddy
in a pilot scale triangular spouted bed dryer, Dry. Technol., 19, 375–387, 2001.
Inprasit, C. and Noomhorm, A., Effect of drying air temperature and grain temperature of
different types of dryer and operation on rice quality, Dry. Technol., 19, 389–404, 2001.
Iveson, S.M., Litster, J.D., Hapgood, K., and Ennis, B.J., Nucleation, growth and breakage
phenomena in agitated wet granulation process: A review, Powder Technol., 117, 3–39,
2001.
Kachan, G.C. and Chiapetta, E., Dehydration of tomato paste in a spouted bed dryer
(in Portuguese), in Proceedings of the VIII Brazilian Congress of Chemical Engineering, Vol. 2, Pires, J.L.C., Ed., University of São Paulo, São Paulo, Brazil, 1988, pp. 510–523.
Kalwar, M.I., Kudra, T., Raghavan, G.S.V., and Mujumdar, A.S., Drying of grains in a drafted
two dimensional spouted bed, J. Food Process Eng., 13, 321–332, 1991.
Kalwar, M.I. and Raghavan, G.S.V., Spouting of two-dimensional beds with draft plates, Can. J. Chem. Eng., 70, 887–894, 1992.
Kalwar, M.I. and Raghavan, G.S.V., Batch drying of shelled corn in two-dimensional spouted
beds with draft plates, Dry. Technol., 11, 339–354, 1993.
Lima, A.C.C. and Rocha, S.C.S., Bean drying in fi xed, spout and spout–fl uid beds: Comparison
and empirical modeling, Dry. Technol., 16, 1881–1902, 1998.
Lima, M.F.M. and Alsina, O.L.S., Drying of umbu pulp in spouted bed: Characteristic curves,
in Drying ’92, Mujumdar, A.S., Ed., Hemisphere Publishing, New York, 1992,
pp. 1508–1515.
Lima, M.F.M., da Mata, A.L.M., Lima, L.M.F., and Moreno, M.T.S., Dehydration of beetroot
(Beta vulgaris L.) in spouted bed, in Proceedings of the XII Brazilian Congress of Chemical Engineering (in Portuguese), Brazilian Association of Chemical Engineers,
Ed., Federal University of Rio Grande do Sul, Porto Alegre, Brazil, CD, 1998.
Lima, M.F.M., Rocha, S.C.S., Alsina, O.L.S., Jerônimo, C.E.M., and da Mata, A.L.M.,
Infl uence of the material chemical composition on the spouted bed drying of fruit pulps
performance, in Proceedings of the XIII Brazilian Congress of Chemical Engineering
(in Portuguese), Maciel Filho, R. and Rocha, S.C.S., Eds., Sonopress-Rimo Ind. Com.
Fonográfi ca Ltda., São Paulo, Brazil, CD, 2000.
Link, K.C. and Schlünder, E.U., Fluidized bed spray granulation and fi lm coating. A new
method for the investigation of the coating process on a single sphere, Dry. Technol., 15, 1827–1843, 1997.
Madhiyanon, T., Soponronnarit, S., and Tia, W., A two-region model for batch drying of
grains in a two-dimensional spouted bed, Dry. Technol., 19, 389–404, 2001a.
52527_C006.indd 18452527_C006.indd 184 10/3/2008 3:49:17 PM10/3/2008 3:49:17 PM
© 2009 by Taylor & Francis Group, LLC

Advances in Spouted Bed Drying of Foods 185
Madhiyanon, T., Soponronnarit, S., and Tia, W., Industrial-scale prototype of continuous
spouted bed dryer, Dry. Technol., 19, 207–216, 2001b.
Madhiyanon, T., Soponronnarit, S., and Tia, W., A mathematical model for continuous drying
of grains in a spouted bed dryer, Dry. Technol., 20, 587–614, 2002.
Markowski, A.S. and Kaminski, W., Hydrodynamic characteristics of jet spouted beds, Can. J. Chem. Eng., 61, 377–381, 1983.
Marques, A.M.M., Infl uence of particle–suspension adhesion on the spouted bed coating with
bottom atomization (in Portuguese), M.S. thesis, State University of Campinas,
Campinas, Brazil, 2007.
Marques, A.M.M., Donida, M.W., and Rocha, S.C.S., Effect of solid surface energy on
particles coating and suspension drying, in Drying 2006—Proceedings of the 15th International Drying Symposium, Farkas, I., Ed., Szent István University Publisher,
Gödölló, Hungary, 2006, pp. 177–183.
Martinez, O.L.A., Brennam, J.G., and Nirajam, K., Spouted bed dryer for liquid foods, Food Control, 4, 41–45, 1993.
Martinez, O.L.A., Brennam, J.G., and Nirajam, K., Study on drying of food in a spouted bed with
inert particles, in Proceedings of the 1st Ibero American Food Congress (in Spanish),
Ortega-Rodríguez, E., Ed., Brazilian Society of Food Science and Technology, Campinas,
Brazil, 1995, pp. 73–81.
Mathur, K.B. and Epstein, N., Spouted Beds, Academic Press, New York, 1974.
Medeiros, M.F.D., Rocha, S.C.S., Alsina, O.L.S., Medeiros, U.K.L., and da Mata, A.M.L.,
Drying of pulps of tropical fruits in spouted bed: Effect of composition on dryer
performance, Dry. Technol., 20, 855–881, 2002.
Mujumdar, A.S., Spouted beds: Principles and recent developments, in Proceedings of the XVII Brazilian Congress of Particulate Systems, Vol. 1, Sartori, D.J.M. and Silveira,
A.M., Eds., Federal University of São Carlos, São Carlos, Brazil, 1989, pp. 3–13.
Neumann, A.W. and Kwok, D.Y., Contact angle measurement and contact angle interpretation,
Adv. Colloid Interface Sci., 81, 167–249, 1999.
Nindo, C.I., Sun, T., Wang, S.W., Tanga, J., and Powers, J.R., Evaluation of drying technologies
for retention of physical quality and antioxidants in asparagus (Asparagus offi cinalis L.). Lebensm.-Wiss. Technol., 36, 507–516, 2003.
Oliveira, C.A., Study of bean (Phaseolus vulgaris L.) drying in spouted bed with intermittent
operating conditions (in Portuguese), M.S. thesis, State University of Campinas,
Campinas, Brazil, 1999.
Oliveira, I.M. and Passos, M.L., Simulation of drying suspension in a conical spouted bed,
Dry. Technol., 15, 593–604, 1997.
Oliveira, J., Theoretical and experimental studies of solids and fl uid fl ow in conical spouted
beds (in Portuguese), M.S. Thesis., Federal University of Minas Gerais, Belo Horizonte,
Brazil, 1997.
Pakowski, Z. and Mujumdar, A.S., Basic process calculations in drying, in Handbook of Industrial Drying, Mujumdar, A.S., Ed., Marcel Dekker, New York, 1995,
pp. 71–112.
Pallai, E., Szentmarjay, T., and Mujumdar, A.S., Spouted bed drying, in Handbook of Industrial Drying, Mujumdar, A.S., Ed., Marcel Dekker, New York, 1995, pp. 453–488.
Pallai, E., Szentmarjay, T., and Szijjártó, E., Effect of partial processes of drying on inert
particles on product quality, Dry. Technol., 19, 2019–2032, 2001.
Passos, M.L., Massarani, G., Freire, J.T., and Mujumdar, A.S., Drying of pastes in spouted beds
of inert particles: Drying criteria and modeling, Dry. Technol., 15, 605–624, 1997.
Passos, M.L. and Mujumdar, A.S., Effect of cohesive forces on fl uidized and spouted beds of
wet particles, Powder Technol., 110, 222–238, 2000.
Patel, K., Bridgwater, J., Baker, C.G.J., and Schneider, T., Spouting behaviour of wet solids,
in Drying ’86, Mujumdar, A.S., Ed., Hemisphere Publishing, New York, 1986,
pp. 183–189.
52527_C006.indd 18552527_C006.indd 185 10/3/2008 3:49:17 PM10/3/2008 3:49:17 PM
© 2009 by Taylor & Francis Group, LLC

186 Advances in Food Dehydration
Pont, V., Saleh, K., Steinmetz, D., and Hemati, M., Infl uence of the physicochemical properties
on the growth of solids particles by granulation in fl uidized bed, Powder Technol., 120,
97–104, 2001.
Raghavan, V.G.S., Rennie, T.J., Sunjka, P.S., Orsat, V., Phaphuangwittayakul, W., and Terdtoon,
P., Energy aspects of novel techniques for drying biological materials, in Drying 2004—Proceedings of the 14th International Drying Symposium (IDS 2004), Silva,
M.A. and Rocha, S.C.S., Eds., Ourograf, Campinas, Brazil, 2004, pp. 1021–1028.
Ré, M.I. and Freire, J.T., Drying of pastelike materials in spouted beds, in Proceedings of the 6th International Drying Symposium (IDS88), Roques, M.A. and Mujumdar, A.S.,
Eds., Hemisphere Publishing, New York, 1988, pp. 426–431.
Reyes, A.E., Diaz, G., and Blasco, R., Experimental studies of slurries on inert particles in
spouted bed and fl uidized bed dryers, in Drying ’96, Mujumdar, A.S., Ed., Hemisphere
Publishing, New York, 1996, pp. 605–612.
Reyes, A.E., Diaz, G., and Blasco, R., Experimental studies of slurries drying on inert
particles in fl uid–particles contact equipment, in Proceedings of the Inter-American Drying Conference (IADC), Silva, M.A. and Rocha, S.C.S., Eds., Gráfi ca Paes,
Campinas, Brazil, 1997, pp. 150–157.
Reyes, A.E. and Massarani, G., Evaluation of pastes drying in conical spouted beds, in Proceedings of the XXI Brazilian Congress on Particulate Systems (in Spanish), Vol. 2, Passos, M.L.,
Ed., Federal University of Minas Gerais, Belo Horizonte, Brazil, 1993, pp. 479–483.
Robins, P.T. and Fryer, P.J., The spouted bed roasting of barley: Development of a predictive
model for moisture and temperature, J. Food Eng., 59, 199–208, 2003.
Sangkram, U. and Noomhorm, A., The effect of drying and storage of soybean on the quality
of bean, oil and lecithin production, Dry. Technol., 20, 2041–2054, 2002.
Schneider, T. and Bridgwater, J., The stability of wet spouted beds, Dry. Technol., 11,
277–301, 1993.
Silva, C.M., Rodrigues, M.E. Jr., and Passos, M.L., Simulation of the fl uid fl ow in conical
spout–fl uid beds (in Portuguese), Sci. Eng. J., 6, 55–62, 1997.
Spitzner Neto, P.I. and Freire, J.T., Study of pastes drying in spouted beds: Infl uence of the
paste presence on the process, in Proceedings of the XXV Brazilian Congress of Particulate Systems, Vol. 1, Ferreira, M.C. and Freire, J.T., Eds., Federal University of
São Carlos, São Carlos, Brazil, 1997, pp. 185–190.
Strumillo, C. and Kudra, T., Drying: Principles, Applications and Design, Gordon and
Breach Science Publishers, Montreux, France, 1986.
Szafran, R.G. and Kmiec, A., CFD modeling of heat and mass transfer in a spouted bed dryer, Ind. Eng. Chem. Res., 43, 1113–1124, 2004.
Szafran, R.G. and Kmiec, A., Point-by-point solution procedure for the computational fl uid
dynamics modeling of long-time batch drying, Ind. Eng. Chem. Res., 44, 7892–7898, 2005.
Taruna, I. and Jindal, V.K., Drying of soy pulp (okara) in a bed of inert particles, Dry. Technol., 20, 1035–1051, 2002.
Tenou, E. and Poncelet, D., Batch and continuous fl uid bed coating—Review and state of the
art, J. Food Eng., 53, 325–340, 2002.
Tia, S., Tangsatitkulchai, C., and Dumronglaohapun, P., Continuous drying of slurry in a jet
spouted bed, Dry. Technol., 13, 1825–1840, 1995.
Vieira, M.G.A., Estrella, L., and Rocha, S.C.S., Energy effi ciency and drying kinetics of
recycled paper in convective drying, in Proceedings of the 3rd Inter-American Drying Conference (IADC 2005), Orsat, V., Raghavan, G.S.V., and Kudra, T., Eds., Montreal,
Canada, CD, 2005.
Wachiraphansakul, S. and Devahastin, S., Drying kinetics and quality of soy residue (okara)
dried in a jet spouted bed dryer, Dry. Technol., 23, 1229–1242, 2005.
Wachiraphansakul, S. and Devahastin, S., Drying kinetics and quality of okara dried in a jet
spouted bed of sorbent particles, Food Sci. Technol., 2, 207–219, 2007.
Wiriyaumpaiwong, S., Soponronnarit, S., and Prachayawarakorn, S., Soybean drying by
two-dimensional spouted bed, Dry. Technol., 21, 1735–1757, 2003.
52527_C006.indd 18652527_C006.indd 186 10/3/2008 3:49:17 PM10/3/2008 3:49:17 PM
© 2009 by Taylor & Francis Group, LLC

187
7 Application and Development of Osmotic Dehydration Technology in Food Processing
John Shi and Sophia Jun Xue
CONTENTS
7.1 Introduction ............................................................................................. 187
7.2 Principles of Osmotic Dehydration ......................................................... 189
7.3 Industrial Application of Osmotic Treatment in Fruit and
Vegetable Processing ............................................................................... 190
7.4 Mechanics of Mass Transfer in Osmotic Dehydration Process .............. 194
7.4.1 Mass Transfer Phenomena ........................................................... 196
7.4.2 Modeling Approach ..................................................................... 197
7.4.2.1 Pure Water Flow in Cells ............................................... 198
7.4.2.2 Mass Fluxes Relative to Interface .................................. 198
7.4.2.3 Structure Shrinking Condition ....................................... 199
7.5 Material Properties of Cellular Material in Osmotic Treatments ........... 200
7.6 Future Development ................................................................................ 203
Nomenclature ..................................................................................................... 204
Variables ................................................................................................. 204
Greek Symbols ........................................................................................ 205
Subscripts ................................................................................................ 205
Superscripts ............................................................................................ 205
References .......................................................................................................... 205
7.1 INTRODUCTION
Dehydration is an important processing procedure to preserve raw food material and
products in the food industry. The basic objective in dehydration of foods is the
removal of water from the raw material to extend the shelf life or reduce the load for
the following operations. Preservation methods like drying, canning, and freezing
52527_C007.indd 18752527_C007.indd 187 10/3/2008 3:54:14 PM10/3/2008 3:54:14 PM
© 2009 by Taylor & Francis Group, LLC

188 Advances in Food Dehydration
have been applied to prolong the shelf life of foods, but these methods produce food
products that are low in quality compared to their original fresh state. A tough and
woody texture, slow or incomplete rehydration, and loss of juiciness typical of fresh
food, as well as unfavorable changes in color and fl avor are the most common quality
defects of dehydrated food (Karel, 1975). It is generally well known that the highest
quality dry food products are produced by freeze-drying. However, this technique is
one of the most expensive unit operations. Freezing of plant materials such as fruits
and vegetables is an energy intensive process. The large amount of energy spent in
this process includes the energy involved in freezing, packaging, transportation, and
storage of the large amount of water present in the fresh material (Rao, 1977). One
way to deal with this problem is to partially concentrate or dehydrate the product
before freezing so that the overall energy requirement of the process is reduced
(Huxsoll, 1982). During the few last decades many studies have been conducted to
remove water from fresh food materials for longer shelf life and better handling
properties; to decrease transport and storage costs by volume and weight reduction;
and to improve the quality of the food products, which has been the subject of inten-
sive research in the food engineering fi eld.
Researchers have looked for new ways to process foods to improve the quality of
preserved food products. One of these new methods is osmotic dehydration. Osmotic
dehydration has shown the potential to obtain better food products by removing
water at low temperature using economical means (Bolin et al., 1983) and by the
quality improvement of the fi nal products (Fito et al., 1998; Flink, 1975). Although
osmosis is a well-known process, in recent years there has been increasing interest
in it. Osmotic dehydration consists of immersing a water-containing cellular material
in an aqueous solution of osmotic agents and allowing part of the natural water to
transfer from the product to the osmotic solution. Solutions of osmotic agents have
high osmotic pressure and low water activity. The most commonly used osmotic
agents are sucrose and sodium chloride (NaCl). Other osmotic agents such as lactose,
maltodextrin, ethanol, glucose, glycerine, and corn syrups have also been used
(Giangiacomo et al., 1987; Hawkes and Flink, 1978). From an organoleptic point of
view, sugar solutions have been used for the dehydration of fruits and salts have been
used for vegetables and meat. Aqueous solutions of mixed osmotic agents have also
been utilized to dehydrate fruits, vegetables, and meat, such as sucrose with lactose,
maltodextrin, and sodium chloride for apple and papaya ring dehydration (Argaiz
et al., 1994); NaCl with sucrose for diced potato dehydration (Lenart and Flink,
1984); and solutions of NaCl and ethanol in water for dehydration of diced carrots
(Le Maguer and Biswal, 1984).
In the last two decades fresh fruits and vegetables have been increasing in popu-
larity for consumption compared to canned and frozen fruits (Shewfelt, 1987).
A growing trend is emerging, however, as many of the large food processing compa-
nies have decided to market living, respiring plant tissue. To satisfy the growing
market demand for commodities in a “freshlike” state, minimal processing, such
as low-level irradiation, packaging, and so forth, will be increasingly used. Initial
contamination has been of primary importance in such processes, but good quality
shelf-stable products have been obtained. The use of an osmotic treatment as a unit
operation has already been widely applied in the food area.
52527_C007.indd 18852527_C007.indd 188 10/3/2008 3:54:14 PM10/3/2008 3:54:14 PM
© 2009 by Taylor & Francis Group, LLC

Application and Development of Osmotic Dehydration 189
Most previous studies have focused attention on rapid and effective removal of
desired amounts of water from food materials such as fruits. A high osmotic rate
would make the process more effi cient and practical. Some methods have been
employed to speed up water transfer, such as using a high concentration of osmotic
solution, high solution temperature, prolonging treatment time, and so forth. However,
intensifi cation by increasing the temperature and concentration gradient is limited
because the nutrient content of processed foods has become an important consumer
concern. The benefi ts of reduced heat processing are being realized in a wide range
of processed fruit products. There is increasing demand for processed fruits with
quality very similar to fresh fruits.
7.2 PRINCIPLES OF OSMOTIC DEHYDRATION
The principle of osmosis as a natural phenomenon of water removal from biological
material has been known for a long time. In recent years there has been an increase
in interest in this process. Osmotic treatment is actually a combination of dehydration
and impregnation processes, which can minimize negative modifi cations of fresh food
components. This process may provide the possibility of modifying the functional
properties of food material, improving the overall quality of the fi nal products,
creating attractive new products, and potential energy saving.
After immersing a water-rich fresh food material in a hypertonic solution (sugar,
salt, etc.), the driving force for water removal is the concentration gradient between
the solution and the intracellular fl uid. If the membrane is perfectly semipermeable,
the solute is unable to transfer through the membrane into the cells. However, it is
diffi cult to obtain a perfect semipermeable membrane in food material because of their
complex internal structure and possible damage during processing. Thus, osmotic
dehydration is actually a multicomponent transfer process of two simultaneous,
countercurrent solution fl ows and one gas fl ow. The solution fl ow out of food mate-
rial is water mixed with solutes such as organic acids, reducing sugars, minerals, and
fl avor compounds that affect the organoleptic and nutritional characteristics of the
fi nal products. Soluble solids present in the osmotic solution are taken up by the food
material. Gas fl ow is also out of intercellular space (Figure 7.1).
During osmotic dehydration, the cell walls act as semipermeable membranes,
which allow small molecules such as water to pass through, but not larger molecules
such as sugar. Water continues to pass through the cell wall membrane until the
concentration of water molecules is the same on both sides. Differences in chemical
potentials of water and solutes in the solid–solution system result in fl uxes of several
components of the material and solution. The osmotic pressure gradient is imposed
by a concentrated external solution (sugar, salt, etc.). Through the control of main
variables in the process, mass transfer behavior will appear in different patterns:
osmotic dehydration (dewatering) or impregnation soaking (swelling). By using a
highly concentrated osmotic solution (usually 50 to 80 g solute/100 g solution), water
fl ows intensively out of the product into the osmotic solution. The transport of the
product’s natural solutes is always accompanied by water transfer. In contrast, other
natural solutes transfer from the osmotic solution into the food product. Water
removal in this situation is much greater than osmotic solute uptake. Under these
52527_C007.indd 18952527_C007.indd 189 10/3/2008 3:54:14 PM10/3/2008 3:54:14 PM
© 2009 by Taylor & Francis Group, LLC

190 Advances in Food Dehydration
circumstances, the process is under an “osmotic dehydration situation” as shown in
Figure 7.1. During the osmotic process, the product’s solution removal and osmotic
solute uptake are simultaneous and countercurrent fl ows and isothermal without
any phase change, but they are accompanied by structural changes such as shrinkage
or swelling.
If the food product is immersed in a low concentration osmotic solution, the
osmotic solution uptake is greater than water removal. Thus, the process is in an
“impregnation soaking situation” (or swelling and rehydration). Under this particular
situation, the gradient of moisture concentration drives the osmotic solution into the
product while the gradient of solutes transfers them into the osmotic solution.
Therefore, some pigments, fl avors, and nutrients are usually transferred out of the
product during soaking and rehydration processes. After the absorbing solution, the
product becomes swollen and rehydrated. There is a mixture of various transport
mechanisms, and the contributions of the different mechanisms to the total transport
vary as a function of the position within the solid and the solution, changing as
drying progress (Bruin and Luyben, 1992). Research on osmotic dehydration has
come a long way since Ponting and collaborators pioneered it (Ponting, 1973; Ponting
et al., 1966). Numerous studies have been performed on a variety of food materials.
This application has been utilized on fruits, vegetables, and fi sh as an effective
preservation method. The past few decades have brought signifi cant developments
in the process of osmotic treatments and their importance in the food processing
industry. Researchers have covered many different aspects to further the under-
standing and applications of this preprocessing technique.
7.3 INDUSTRIAL APPLICATION OF OSMOTIC TREATMENT IN FRUIT AND VEGETABLE PROCESSING
Recently, there has been increasing interest in the food industry about the possibility
of modifying the functional properties of food materials and improving the overall
quality of the products. The osmotic dehydration method shortens the drying time
FIGURE 7.1 Schematic cellular material tissue representation and mass transfer pattern.
Cell Water
Physical interface
Osmotic solution
Homogeneous cellular structure
Modified tissue surface
Sugar
Gas
Tissue matrix
52527_C007.indd 19052527_C007.indd 190 10/3/2008 3:54:14 PM10/3/2008 3:54:14 PM
© 2009 by Taylor & Francis Group, LLC

Application and Development of Osmotic Dehydration 191
and reduces the ascorbic acid loss during drying (Uzuegbu and Ukeka, 1987).
Fresh fruits are increasing in popularity compared to canned and frozen fruits
(Shewfelt, 1987). In order to satisfy the growing market demands for commodities
in a freshlike state, for minimal processing, and for “natural food,” osmotic
dehydration as a unit operation in fruit processing has been widely applied in the
fruit industry.
The process of osmosis has often been proposed as a fi rst step followed by any
kind of drying operation such as air drying, vacuum drying, or freeze-drying. The
plant material is immersed in an aqueous solution of compounds such as glycerol,
ethanol, sugar, or/and salt to partially dehydrate the food in order to reduce the load
of water at further drying steps and to improve the quality of the fi nal product.
Osmotic dehydration generally will not give a product with suffi ciently low moisture
content to be considered self-stable. Thus, this process is considered as a pretreat-
ment or as an intermediate step prior to conventional stabilizing processes such as
air, vacuum, or freeze-drying or freezing, chilling, pasteurization, or other processes
for fruit, vegetable, fi sh, and meat products.
Ponting et al. (1966) suggested a process for a 50% weight reduction of apples by
osmotic dehydration after which the apples were either frozen, air dried, or vacuum
dried. Sucrose and invert sugar were used in solution. The apple products had supe-
rior quality and did not need sulfur dioxide treatment. Ponting (1973) also pointed
out that partially dehydrating fruit pieces or slices by osmosis followed by vacuum
drying produces products with better fl avor than freeze-dried ones. This combina-
tion process should cost less. Farkas and Lazar (1969) studied the feasibility of
osmotic dehydration of apples prior to freezing. Good quality apple products were
obtained by a dehydrofrozen process. Hope and Vitale (1972) described the applica-
tion of osmotic dehydration for concentration of bananas, plaintain, and ripe mangoes
using a 67% (w/w) sucrose solution and green mangoes using a 25% (w/w) sodium
chloride solution. Hawkes and Flink (1978) used osmotic dehydration preconcentration
prior to air or vacuum drying, which retained the structural integrity of the tissue.
Garcia and McFelley (1978) found that pretreatment in a 65∞Bx sucrose solution did
not affect fruit quality. Dixon et al. (1976) applied a combination of osmotic dehydration
and vacuum drying to produce dry apple slices.
Flink (1975) and Chirife et al. (1973) found that the dried product fl avor quality
depended primarily on the initial solids content. If the solids concentration was
increased, the retention of volatiles was greatly improved. An osmotic treatment of
fruits in a 60 to 65∞Bx sugar solution was used to increase the initial solids content
prior to freeze-drying. Hawkes and Flink (1978) investigated osmotic dehydration as
an initial step in freeze dehydration and emphasized that the organoleptic quality of
freeze-dried fruit products can be improved by increasing the solids content. This
also results in a reduction of the water content of the sample to be freeze-dried,
which reduces processing time. They also studied the possibility of adding sucrose,
lactose, salt, and so forth into the solution. Flink (1980) pointed out that osmotic
dehydration can be used as a step prior to freeze-drying to yield fruit products with
improved stability. Thus, less freeze-drying time was required. Le Maguer and
Biswal (1984) suggested a dehydrocooling process, which would simultaneously
cool and remove water from vegetables before they are frozen by traditional methods.
52527_C007.indd 19152527_C007.indd 191 10/3/2008 3:54:14 PM10/3/2008 3:54:14 PM
© 2009 by Taylor & Francis Group, LLC

192 Advances in Food Dehydration
The coolant–dehydrant used in this process is a solution of sodium chloride and
ethanol in water. A methodology has been developed for measuring the movement
of solutes and water in the vegetable pieces to better understand the nature of dehy-
drocooling. This process is appropriate for continuous operation using existing
designs in such closely related areas as extraction and other separation process.
Specifi c applications of dehydrocooling include processing of carrots, peas, sweet
corn, snap beans, and so forth. Experimental results indicate that approximately 22%
of the water can be removed from carrots using a 15% NaCl–water solution at room
temperature, thus reducing the energy requirements for freezing by 22% (Le Maguer
and Biswal, 1984).
Andreotti et al. (1985) proposed a combination of osmotic dehydration with
appertization to improve canned fruit preserves. Torreggiani et al. (1988) assessed
the feasibility of a process for obtaining high quality fruit in a sugar solution on a
plant production scale. Karel (1975) noted that intermediate moisture foods have
received attention since the development of new products based on technological
principles such as lowering water activity, retarding microbial growth by adding
antimicrobial agents, and so forth. Intermediate moisture foods can be produced
with satisfactory quality using an osmotic dehydration treatment. Maltini and
Torreggiani (1986) examined the possibility of obtaining shelf-stable products with
no need for further treatments and less preservatives by means of an osmotic treat-
ment in a sucrose solution. The fruit products tasted like fresh ones. They were shelf
stable with water activity between 0.94 and 0.97 and water content in the range of 65
to 75% after vacuum packaging and pasteurization and remained stable for many
months at ambient temperature. This process causes minimal changes in the sensory
and physical–chemical characteristics of fruits. Compared to traditional intermediate
moisture foods that usually have water activity between 0.65 and 0.90 and water
content from 20 to 50%, good quality and shelf-stable fruit products were obtained
by the osmotic dehydration process.
Thus, the simplicity of the osmotic dehydration process without the use of expen-
sive equipment and requirements for less or no energy makes it suitable for large-scale
fruit preservation, particularly where sugar is abundantly available. The potential
industrial applications of osmotic dehydration are given in the Figure 7.2. Various
industrial applications of osmotic dehydration on fruit processing and preservation
are provided in Figure 7.3.
Osmotic treatments often provide better quality intermediate moisture fruits
than air drying, especially in fruits and vegetables that sensitive to heat (Torreggiani,
1995). An example is osmotically dehydrated fruit pieces that have been successfully
used to avoid the presence of synergized whey in yogurt (Giangiacomo et al., 1994).
The dehydration levels that are reached depend on specifi c needs, but products
between 80 and 50% moisture can be obtained through this treatment (Torreggiani
et al., 1999). The solutes in the solution diffuse into the material simultaneously,
contributing to the depression of water activity. Because no phase change is involved
and osmotic dehydration is usually carried out at temperatures below 50°C, the
products suffer less damage than those treated with conventional direct dehydration
methods (Raoult-Wack, 1994). Osmotically dehydrated products are better quality
after further drying or freezing.
52527_C007.indd 19252527_C007.indd 192 10/3/2008 3:54:14 PM10/3/2008 3:54:14 PM
© 2009 by Taylor & Francis Group, LLC

Application and Development of Osmotic Dehydration 193
Some new technologies have also been introduced into the osmotic dehydration
process such as the combined method of heat treatment and acoustic oscillation,
the combined method of alternating heating and cooling of fruits (Rogachev and
Kislenko, 1972), and vacuum osmotic dehydration (Fito, 1994; Fito et al., 1996).
A pilot-scale belt-type osmotic contactor was designed and used in a continuous
osmotic dehydration process to attain maximum water removal from fresh fruits and
vegetables with minimum contact time. The carrot was chosen as a representative
vegetable and the osmotic solution was a ternary sucrose–NaCl–water mixture with
a total solids concentration of about 50 to 55% (w/w) (Azuara et al., 1998). A continu-
ous cross-current coupled with a countercurrent osmotic dehydration process is very
effective and effi cient. A substantial reduction of the processing time is the most
signifi cant improvement in osmotic dehydration. The optimum condition was 44%
sucrose/7% NaCl for a 16-min contact time with 26% water loss, 24% mass loss,
2.1% sugar gain, and 0.7% salt gain. The application of a continuous osmotic operation
gave very satisfactory design parameters for the dehydration of carrot cubes from
the initial water concentration to the desired fi nal concentration in the range studied.
A continuous osmotic contactor may encourage the study of a greater variety of
vegetables or other foods. Some countercurrent equipment is available for contacting
RawMaterial
OsmoticProcess
OsmoticSolution
OsmoticallyTreated Product
DilutedSolution
Concentration
Solute Incorporation
Other Uses
Microwave Drying
Convective Drying
Pasteurization
High Pressure Treatment
Freezing
Combined Processes Unit Operation Solution Management
FIGURE 7.2 Osmotic treatment in food processing. (Modifi ed from Spiess, W.E.L., Osmotic Treatments for the Food Industry. Proceedings of the 1st Osmotic Treatment Seminar, FEUP
Ediçoes, Porto, Portugal, 1999, pp. 9–17. With permission.)
52527_C007.indd 19352527_C007.indd 193 10/3/2008 3:54:14 PM10/3/2008 3:54:14 PM
© 2009 by Taylor & Francis Group, LLC

194 Advances in Food Dehydration
operations. This equipment has the additional advantage that it can be part of an
on-line production system.
7.4 MECHANICS OF MASS TRANSFER IN OSMOTIC DEHYDRATION PROCESS
Research on the mass transfer mechanism of osmotic treatment of food material is being
carried out on different aspects of the osmotic process to study the mass transfer
kinetics. Mass transport in a food–osmotic solution system is affected by numerous
complicated and often interactive physical and chemical processes. Operation parameters
FIGURE 7.3 Various industrial applications of osmotic dehydration on fruit processing and
preservation.
Fruits(pieces or whole)
Pretreatment(blanching, disinfecting, etc.)
Osmotic dehydration
Osmotically dehydrated fruits
Jam processing(jam)
Canning(canned fruits)
Drying(air drying, vacuum
drying, etc.)(dried fruits)
Freezing(dehydrofrozen
fruits)
Moderate drying(intermediate moisture
fruits)
Pasteurization(dehydropasteurized
fruits)
Sugar syrupSugar syrup
Cooling storage(raw materialpreservation)
52527_C007.indd 19452527_C007.indd 194 10/3/2008 3:54:15 PM10/3/2008 3:54:15 PM
© 2009 by Taylor & Francis Group, LLC

Application and Development of Osmotic Dehydration 195
(temperature, time, pressure, concentration, and composition of solution), material
properties (porosity, geometry, and microstructure), and multicomponent mass
transfer characteristics (fl uxes and their interaction) are recognized as the main process
variables affecting the mass transfer property.
Models have been developed in the last 15 years for describing the osmotic
process and for evaluating the transport of interacting solutes in porous materials
(Fito, 1994; Fito and Chiralt, 2000; Fito et al., 1996, 1998; Marcotte and Le Maguer,
1991; Marcotte et al., 1991; Shi and Le Maguer, 2002a, b, 2003). Most of these
models are based on the assumption that the mass transfer is the rate limiting step,
and its rate can be approximately predicted by appropriate mathematical solutions of
the simplifi ed unsteady-state second Fickian equation as a diffusion process. Osmotic
treatment may be defi ned as a solid–liquid contacting operation in which a solid food
material is immersed in a concentrated aqueous solution. Differences in the chemical
potential of water and various solutes in the system result in fl uxes of the components
between the material and solution. There is an internal exchange and interaction of
components with their network. Moreover, the transfer mechanism, diffusion rates,
and equilibrium moisture content for each of these components are generally very
different, which affects the kinetics and fi nal equilibrium of the system.
There are two major mass transfer phenomena involved in osmotic dehydration:
the movement of solute into the material and the fl ow of water out of the tissue. The
kinetics of mass transfer is usually described through water loss and solids or solutes
gain and weight reduction. Water loss and solids gain can be measured through the
rate of water and solute fl ow, respectively, over time or through the amount of water
lost or solute gained after a certain period of time based on the amount of initial
material. Solids gain can also be studied through solute penetration techniques that
determine the amount of solute uptake by the material with time. Studies on model
agar cubes were also performed to describe the “dewatering” and “impregnation”
processes (Raoult-Wack, Guilbert, et al., 1991; Raoult-Wack, Jourdain, et al., 1991;
Raoult-Wack et al., 1992). Some models described not only water loss and solids gain
but also reduction of water activity and shrinkage of the samples (Hough et al.,
1993). Water loss and solids gain were modeled using different approaches.
Several investigations have dealt with different aspects of the osmotic process to
study the mass transfer kinetics. The concentration and composition of the osmotic
solution, temperature, time, pressure, natural material properties, and shrinkage are
recognized as the main process variables in developing mass transfer modeling.
If the concentration of the osmotic solution remains constant and the resistance at
the surface is negligible, Fick’s second law can be applied (Magee et al., 1983). Other
studies (Conway et al., 1983) also modeled these phenomena with Crank’s equation
(Crank, 1975). This approach however is limited to processes in which the rate of
mass transfer is simply diffusion, so the fl ow is unidirectional and there are negligi-
ble interactions between the components in the tissue and the solute during diffusion
(Fito, 1994; Fito and Chiralt, 2000; Fito et al., 1996, 1998; Le Maguer, 1997; Marcotte
and Le Maguer, 1991; Marcotte et al., 1991). Osmotic dehydration requires accurate
prediction of water removal from foods for industrial applications. Simultaneous
fl ow of solutes and water and interactions between components require a theoretical
approach based on the application of linear irreversible thermodynamic processes.
52527_C007.indd 19552527_C007.indd 195 10/3/2008 3:54:15 PM10/3/2008 3:54:15 PM
© 2009 by Taylor & Francis Group, LLC

196 Advances in Food Dehydration
The estimation of the moisture diffusion from drying data of food materials was
accomplished by different models proposed from the slopes of the drying curves by
computer optimization, which reported a wide variation of values because of the
complexity of the food material and the different methods of estimation. Most of
these studies focused on the formulation of appropriate mass balance (partial differ-
ential) equations governing solute transport, the derivation of appropriate analytical
or numerical solutions of those equations, and the relation of the transport equations
with observed solute distributions versus time.
In the kinetic models, the driving force is based on the concentration gradients
of solutes and water in the system. This approach ignores processes of mass transfer
that may have an important impact on water and solute exchanges between the food
material and the external solution. Osmotic treatment is a much more complicated
process than one controlled by mass transfer under a concentration gradient. The
processes that are independent of the concentration gradients can play an important
role in the impregnation with solutes and the resulting functional modifi cation of the
food material.
Modifi cation of the composition of the food material produces structural changes
(shrinkage, porosity reduction, and cell collapse) and modifi es the mass transfer behav-
ior in the cellular tissue. The complexity of the nonequilibrium state inside the food
solid (consisting of gases, extracellular liquid, intercellular liquid, and solid matrix)
also affects the mechanisms and kinetics of the transfer phenomena. Depending on the
physical characteristics of the cellular tissue and the operating conditions (tempera-
ture, pressure), osmosis (providing that membrane integrity exists), diffusion, fl ux
interactions, and shrinkage can all be acting at the same time and contributing to
the complexity of the process to different extents. Models involving the concepts of
irreversible thermodynamics in order to integrate the contribution of each component
and a description of natural tissue action were studied recently (Fito and Chiralt, 2000;
Shi and Le Maguer, 2002a, b, 2003; Yao and Le Maguer, 1996).
7.4.1 MASS TRANSFER PHENOMENA
When a piece of tissue is placed in contact with an osmotic solution, the solute begins
to diffuse into the extracellular space and water begins to diffuse in the opposite
direction. If there was no transmembrane fl ow, equivolumetric diffusion would take
place. As long as the mass transfer coeffi cient at the solution side is large enough, the
concentration at the subsurface of the tissue can be considered to become almost
immediately equal to the concentration of the solution. After the initial fast changing
period, a slow changing quasi-steady state is eventually reached. The water transfer
property in the food material immersed in osmotic solution may be described by
several different transport mechanisms, depending on the nature of the material, type
of moisture bonding, moisture content, temperature, pressure in the capillary pores,
and so forth (Fish, 1958). In general, liquid diffusion occurs in nonporous solids
whereas capillary movement occurs in porous solids. Transport of water in liquid
solution takes place only by molecular diffusion, a relatively simple phenomenon.
In capillary–porous biological materials, mass transfer occurs in gas-fi lled cavities,
capillaries, cell walls, and extracellular and intracellular spaces. Biological material
52527_C007.indd 19652527_C007.indd 196 10/3/2008 3:54:15 PM10/3/2008 3:54:15 PM
© 2009 by Taylor & Francis Group, LLC

Application and Development of Osmotic Dehydration 197
contains a variety of individual soluble components. When cellular biological mate-
rials are immersed in a high concentration of osmotic solution, osmotic treatment is
actually a multicomponent transfer process in which simultaneous, countercurrent
solution fl ows with a combination of dehydration, leaching, and impregnation pro-
cesses occurring in the biological tissue matrix. The mass transfer process of each
component in the solid–liquid system is affected by operation parameters and by the
presence of other components.
When a cellular solid material is immersed in hypertonic solution (sucrose
solution), the cells in the fi rst layer of the material contact the hypertonic solution
and begin to lose water because of the concentration gradient between the cells and
hypertonic solution; then, they begin to shrink (Figure 7.1). After the cells in the fi rst
layer lose water, a “chemical potential difference of water” between the fi rst layer of
cells and second layer of cells is established. Subsequently, the second layer cells
begin to pump water to the fi rst layer cells and then shrink. The phenomena of mass
transfer and tissue shrinkage are spread from the surface to the center of the material
as a function of operation time. Finally, the cells in the material center lose water and
the mass transfer process tends to equilibrate after a long period of solid–liquid
contact. Mass transfer and tissue shrinkage occur simultaneously. Thus, for a certain
operating time, mass transfer and tissue shrinkage are only related to a specifi c part
of the whole material (Fito and Chiralt, 2000; Shi and Le Maguer, 2002a, b, 2003;
Yao and Le Maguer, 1996).
7.4.2 MODELING APPROACH
The study of multicomponent mass transfer has been important in many areas of
chemical engineering for a long time. A wide variety of multicomponent fl ux equations
have been proposed either on the basis of a physical model or from an irreversible
thermodynamic model. Interest in multicomponent mass transfer phenomena in
osmotic treatment is relatively recent in food engineering. Multicomponent mixtures
display a number of unusual interaction phenomena such as osmosis, diffusion barriers,
and reverse diffusion that can occur in mass transfer processes, but not present in a
binary system. After food material is immersed in osmotic solution, the water is trans-
ported by several mechanisms simultaneously: molecular diffusion, liquid diffusion,
vapor diffusion (through gas fl ow), hydrodynamic fl ow, capillary transport, surface
diffusion, and most frequently a combination of these mechanisms. The transfer
processes of food material can be considered as follows:
1. Water and solutes are transported by diffusion in the osmosis process
because of concentration gradients.
2. Water and solutes are transported by capillary fl ow because of differences
in the total system pressure caused by external pressure, shrinkage, and
capillarity.
3. Hydrodynamic fl ow occurs in pores.
4. Water vapor diffusion occurs within partly fi lled pores because of the
capillary–condensation mechanism.
5. Water diffusion occurs at pore surfaces because of gradients at the surfaces.
52527_C007.indd 19752527_C007.indd 197 10/3/2008 3:54:15 PM10/3/2008 3:54:15 PM
© 2009 by Taylor & Francis Group, LLC

198 Advances in Food Dehydration
A number of modeling approaches may be classifi ed according to what fl uxes
are assumed to occur internally and how the model deals with the process of a simul-
taneous, countercurrent internal transport mechanism of water removal and solute
uptake. Mass transfer kinetics depend on both the process parameters and the struc-
tural properties of products. In biological materials such as fruits, vegetables, fi sh,
and meat, the water content, cell maturity, tissue structure, porosity, and geometry of
pieces are related to water removal, product solute loss, and osmotic solute uptake.
Mass transfer occurs far from equilibrium and is accompanied by signifi cant shrink-
age and deformation and probably by fl ow interaction (Fito and Chiralt, 2000; Lenart
and Dabrowska, 1999; Shi and Le Maguer, 2002a, b). A two-fi lm model based on
generalized multicomponent mass transfer theories is a good approach to analyze the
coupled mass transfer at an isothermal solid–liquid interface, based on the knowl-
edge of concentration gradients and the relation with cell structure in an isothermal
solid–liquid contacting system (Shi and Le Maguer, 2002a, b).
7.4.2.1 Pure Water Flow in Cells
As shown in Figure 7.1, when cells in the fi rst layer are contacted with hypertonic
solution, the fi rst layer cells lose water because of the concentration gradient. However,
at this moment, the second layer cells are still turgid. The cell wall and membrane
exert pressure (turgid pressure) on the cellular solution and cause water transport to
neighboring cells through the plasmalemma. According to Nobel (1983), the chemical
potential difference of water inside the cellular volume (at a full turgid condition) and
extracellular space can be considered as
�mw � RT (ln a w c � ln a w L
) � Vw(P c � P0) (7.1)
where �mw is the chemical potential difference of water inside the cellular volume
and extracellular volume, R is the gas constant, T is the absolute temperature, awc is
the water activity of the cellular solution inside the cells, awL is the water activity of
the cellular solution in the extracellular space, Vw is the water partial molar volume,
P c is the hydrostatic pressure (turgid pressure) inside the cells above atmospheric
pressure, and P0 is the atmospheric pressure in extracellular space. The pure water
fl ux across the cell membrane is expressed by
J 1 0 � y [ RT _
Mw
(Xsu � X ss c ) �
Vw _ Mw
( P c � P0 1 _ 2 ) ] (7.2)
where y is a parameter related to water permeability across the cell membrane, Xss
c
is the soluble solid concentration in the cell, and Xsu is the sugar concentration in
extracellular space.
7.4.2.2 Mass Fluxes Relative to Interface
In the description of the interface mass transfer process, the mass transfer fl ux Ji of
component i relative to interface I is considered as (Cussler, 1984)
JI i � ri(vi � vI ) (7.3)
52527_C007.indd 19852527_C007.indd 198 10/3/2008 3:54:15 PM10/3/2008 3:54:15 PM
© 2009 by Taylor & Francis Group, LLC

Application and Development of Osmotic Dehydration 199
where ri is the mass concentration of component i, ni is the velocity of component i with
respect to a stationary coordinate reference frame, and n I is the interface velocity.
The velocity of the interface with reference to the center of material is consid-
ered to be
nI � 1 ___ A0
dV ___ dt
(7.4)
where V is the total volume of solid material immersed in the liquid and A0 is the
surface area of the interface.
7.4.2.3 Structure Shrinking Condition
If n3 is the velocity of component 3 at the surface of the cellular material with respect to
a fi xed frame of reference (center of the solid), the mass fl uxes of component 1 (water)
and 2 (osmotic solute) can be written as the following equations (King, 1970):
v3 � � J 1 3 V1 � J
2 3 V2 (7.5)
In such conditions, mass fl uxes Ji3 and J i
v are relative to the fi xed coordinate or v
of component 3 (solid frame). The following expression is for the mass fl uxes of
water and osmotic solute transfer in one dimension:
J 1 v � J
1 3 � r1( J
1 3 V1 � J
2 3 V2) (7.6)
J 2 v � J
2 3 � r2( J
1 3 V1 � J
2 3 V2) (7.7)
J i 3 � ri (vi � v3) � J i
v � ( ri __ r3 ) J
3 v (7.8)
J 3 v � � J
1 v ( V1 ___
V3
) � J 2 v ( V2 ___
V3
) (7.9)
The mass fl uxes of water and osmotic solute transfer related to the solid frame
velocity of component 3 in one dimension are as follows:
J 1 3 � J
1 v ( 1 �
r1V1 ____ r3V3
) � J 2 v ( r1V2 __ r3V3
) (7.10)
J 2 3 � J
1 v ( r2V1 ____ r3V3
) � J 2 v ( 1 � r2V2 ____
r3V3
) (7.11)
Two-fi lm theory assumes that equilibrium exists at the interface, with resistance
to mass transfer in both the solid product and the liquid phases. Experiments and
analyses showed that interface mass transfer may play an important role in solid–
liquid contacting operations, thus exchanging mass across their common interface
(Shi and Le Maguer, 2003). Despite the great efforts made, one of the problems in
modeling the osmotic process is still the lack of a full understanding of the funda-
mentals of mass transfer in biological cellular structures.
52527_C007.indd 19952527_C007.indd 199 10/3/2008 3:54:15 PM10/3/2008 3:54:15 PM
© 2009 by Taylor & Francis Group, LLC

200 Advances in Food Dehydration
7.5 MATERIAL PROPERTIES OF CELLULAR MATERIAL IN OSMOTIC TREATMENTS
Biological structures and behavior are diffi cult to describe in quantitative terms.
Thornley (1976) stated that the central problem of biology for the quantitative
description of a structure is that the rate of change of a structure is determined by the
environment and by the structure itself. In osmotic dehydration of plant tissues, these
complex structures pose a challenge to food scientists and engineers in the optimization
process and design of equipment. The structure and properties of the tissues affect
the mass transfer phenomena occurring in plant tissues during osmotic dehydration.
There is a wide variation in the physical nature of cellular materials. The eventual
cellular dehydration will strongly depend on the fruit’s initial biological microstruc-
tural characteristics, especially the intercellular space present in the fruit tissue (Islam
and Flink, 1982; Lenart and Flink, 1984). The complex cell wall structure of plant
materials acts as a permeable membrane. In contrast, membranes are a major resistance
to mass transfer (Le Maguer and Yao, 1995). Upon removal of some initial water,
shrinkage is most likely to occur during the osmotic treatment process. Shrinkage
of biological materials during osmotic treatment takes place simultaneously with mois-
ture loss and solute gain, and thus may affect the mass transfer rate because of gradient
effects. Structural changes occur when fresh fruit material is immersed in osmotic
solution, as shown in Figure 7.4. A cell unit consists of a cell, extracellular space, and
cell wall. The phenomena of volume change and mass transfer (water loss and solids
gain) can affect the different physical properties of the cellular material.
The data sets used for the analysis of materials that have more or less the same
experimental conditions (e.g., same temperature, solute concentration) are listed in
Table 7.1. The distribution of the data is determined using a histogram analysis.
From the initial fl ux, rate of water loss, or solids gain, J at t � 0 is described as fast,
average, or slow in a simple model proposed by Azuara et al. (1996).
The values of the kinetic constant for water loss (S1), kinetic constant for osmotic
solute gain (S2), water fl ux (Jw, the rate of mass transfer of the substance per unit
area), and fl ux of the solids (Js ) of seven kinds of fresh fruit materials are presented
in Tables 7.2 and 7.3. Apple “a” had the highest S1 value and the peach exhibited the
Water
OsmoticSolute
Fresh Material Osmotically Dehydrated Material
FIGURE 7.4 Mass transfer and structure changes of cells.
52527_C007.indd 20052527_C007.indd 200 10/3/2008 3:54:15 PM10/3/2008 3:54:15 PM
© 2009 by Taylor & Francis Group, LLC

Application and Development of Osmotic Dehydration 201
highest S2 value. In terms of fl uxes, peaches showed the highest value for both water
and solids initial fl uxes. The values for apricots and apples stayed at the lower end of the
range. From the rates and fl uxes of water and solids obtained in Tables 7.2 and 7.3,
several correction parameters can be calculated including the mass transfer coeffi -
cient (Kx*) and the cell osmotic behavior constant (fc ), as shown in Table 7.4.
The classifi cation of the mass transfer behavior of seven different materials based
on the osmotic constant of the cell fc is provided in Figure 7.5. The classifi cation was
based on the values of the osmotic behavior constant of the cell (fc ). The values of the
fc ratio describe the bulk fl ow (water loss) transport over the diffusion (solids gain)
for every material at the initial time. If the ratio fc is �1, there is more dehydration than
impregnation of solids. The higher this value is, the faster the rate of dehydration.
If the ratio fc is �1, there is more impregnation than dehydration because diffusion
TABLE 7.1List of Materials and Their Osmotic Treatments and Conditions
Material Variety Osmotic Solution Temp. (°C) Dimensions Ref.
Peach Baby Gold 50% (w/w) corn syrup/
sucrose, 70°Bx
25 2 cm thick slices Giangiacomo et al.
(1987)
Cherry Bianca di
Verona
50% (w/w) corn syrup/
sucrose, 70°Bx
25 1.8-cm diameter Giangiacomo et al.
(1987)
Apricot (a) Reale Sucrose, 70°Bx 25 1 cm thick halves Giangiacomo et al.
(1987)
Apricot (b) Reale Fructose � glucose �
sucrose, 65.2°Bx
25 1 cm thick halves Giangiacomo et al.
(1987)
Apple (a) Golden Sucrose, 70% 30 2 ¥ 1 cm thick disks Azuara et al. (1996)
Apple (b) Macintosh Sucrose, 60% 23 3–4 mm thick slices Hawkes and Flink
(1978)
Apple (x) Granny
Smith
Sucrose, 60% 30 2 cm ¥ 2 mm thick
disks
Experimental
material
TABLE 7.2Results of Water Flux Analysis
MaterialMw-• (%)
S1 (l/s)
Volume (m3)
Area (m2)
Density (kg/m3)
M/A (kg/m2)
Jw [kg/(m2 s)]
Peach 0.47 3.17E-04 6.78E-05 1.04E-02 1012 6.57 9.77E-04
Cherry 0.40 1.57E-04 2.77E-06 2.86E-04 1067 10.34 6.48E-04
Apricot a 0.44 1.00E-04 2.44E-06 1.47E-03 1048 1.75 7.76E-05
Apricot b 0.51 1.00E-04 2.44E-06 1.47E-03 1048 1.75 8.82E-05
Apple a 0.49 1.31E-03 1.57E-06 9.42E-04 787 1.31 8.41E-04
Apple b 0.56 2.45E-04 5.00E-06 4.52E-03 800 0.89 1.21E-04
Apple x 0.58 6.96E-04 6.28E-07 7.54E-04 1001 0.83 3.35E-04
Source: From Le Maguer, M. et al., Food Sci. Technol. Int., 187–192, 2003. With permission.
52527_C007.indd 20152527_C007.indd 201 10/3/2008 3:54:15 PM10/3/2008 3:54:15 PM
© 2009 by Taylor & Francis Group, LLC

202 Advances in Food Dehydration
dominates over the bulk fl ow. Materials with a fc of �1 are in class I (fast). Those
with a fc of �1 are in class III (slow). Those with fc values around 1 were classifi ed
as having an average rate of dehydration and are in class II. As with the behavior of
Jw, Js, and S2, the peach still exhibits a fast rate of mass transfer. However, the cherry
has a faster rate of dehydration than the peach. Apple “a” followed in class II with the
two apricots. They have an average rate of dehydration. Apples “x” and “b” are at the
end of the graph in class III and are classifi ed as slow (Le Maguer et al., 2003).
This classifi cation allows the determination of the processing conditions that
should be employed on a material, depending on the quality of the end product. For
example, if the purpose of osmotic dehydration is to reduce the moisture content, the
appropriate osmotic concentration must be chosen so that it facilitates dehydration
more than impregnation. If the dehydration capacity of the material is slow, then
TABLE 7.3Results of Solids Flux Analysis
MaterialMss-• (%)
S2 (l/s)
Volume (m3)
Area (m2)
Density (kg/m3)
M/A (kg/m2)
Js [kg/(m2 s)]
Peach 0.049 2.35E-03 6.78E-05 1.04E-02 1012 6.57 7.55E-04
Cherry 0.063 1.62E-04 2.77E-06 2.86E-04 1067 10.34 1.06E-04
Apricot a 0.250 6.05E-04 2.44E-06 1.47E-03 1048 1.75 2.64E-04
Apricot b 0.228 5.90E-04 2.44E-06 1.47E-03 1048 1.75 2.35E-04
Apple a 0.221 3.95E-04 1.57E-06 9.42E-04 787 1.31 1.14E-04
Apple b 0.263 6.55E-04 5.00E-06 4.52E-03 800 0.89 1.53E-04
Apple x 0.524 3.70E-04 6.28E-07 7.54E-04 1001 0.83 1.62E-04
Source: From Le Maguer, M. et al., Food Sci. Technol. Int., 187–192, 2003. With permission.
TABLE 7.4Mole Fraction of Jw and Js at the Interface with Corrected Mass Transfer Coeffi cient (K *x)
MaterialJw [kmol/
(m2 s)]Js [kmol/(m2 s)] Ci R �
K *x [kmol/(m2 s)] f
fc (Corrected)
Peach 5.43E-05 2.21E-06 0.0612 0.116 0.946 4.5E-04 1.06 5.41
Cherry 3.60E-05 3.10E-07 0.0652 0.107 0.950 3.3E-04 0.73 5.98
Apricot a 4.31E-06 7.72E-07 0.0691 0.014 0.993 2.5E-04 0.07 1.21
Apricot b 4.90E-06 6.88E-07 0.0672 0.026 0.987 1.6E-04 0.09 0.98
Apple a 4.67E-05 3.34E-07 0.0431 0.598 0.784 7.8E-05 0.95 1.35
Apple b 6.74E-06 4.46E-07 0.0558 0.137 0.937 4.6E-05 0.13 0.41
Apple x 1.86E-05 4.73E-07 0.0424 0.448 0.826 4.0E-05 0.37 0.51
Source: From Le Maguer, M. et al., Food Sci. Technol. Int., 187–192, 2003. With permission.
52527_C007.indd 20252527_C007.indd 202 10/3/2008 3:54:15 PM10/3/2008 3:54:15 PM
© 2009 by Taylor & Francis Group, LLC

Application and Development of Osmotic Dehydration 203
using very high concentrations may not be necessary. The same considerations
should also be applied for impregnation purposes (such as in candying).
7.6 FUTURE DEVELOPMENT
Research in applications of osmotic dehydration to food processing in technology and in
component transfer mechanisms is being carried out in several countries. The technol-
ogy of osmotic dehydration is useful to provide consumers with safe products of excel-
lent quality. The new osmotically dehydrated products and industrial applications require
appropriate manufacturing equipment and procedures at the industrial level (Fito and
Chiralt, 2000). When analyzing the results of water transfer obtained from normal pres-
sure treatment and vacuum treatment in osmotic dehydration, water transfer was much
faster with a vacuum operation (Fito, 1994; Fito et al., 1996, 1998; Dalla Rosa et al.,
1982; Lerici et al., 1985). Fito and Chiralt (1995, 2000) described this mass transfer
mechanism under vacuum treatment during osmotic dehydration of fruits as a “hydro-
dynamic penetration mechanism.” Analyses of this mechanism in osmotic dehydration
of fruits provided a better understanding of mass transfer phenomena in porous fruit
tissues that are immersed in a sugar solution. Osmotic dehydration studies were also
carried out using ultrasound to increase the mass transfer rates (Rastogi and Niranjan,
1998). The use of high- pressure pretreatment enhanced mass transfer rates in pine-
apples. This was attributed to the breaking up of the cell walls, thus speeding up water
loss. Cell wall break-up was observed with differential interference contrast micros-
copy (Rastogi et al., 1999). A high intensity electrical fi eld pulse was also applied to
increase mass transfer rates in carrots (Spiess, 1999). Knowledge of the characteristics
of the materials and the mass transfer relationships needs to be further understood.
Integration of advances in the combined processes (raw materials and osmosis
dehydrated products), unit operation, and solution management should be through
complete system analysis. This will make technical and economic evaluations closer
FIGURE 7.5 Classifi cation of materials based on fc values. (Modifi ed from Le Maguer, M.
et al., Food Sci. Technol. Int., 187–192, 2003. With permission.)
52527_C007.indd 20352527_C007.indd 203 10/3/2008 3:54:15 PM10/3/2008 3:54:15 PM
© 2009 by Taylor & Francis Group, LLC

204 Advances in Food Dehydration
to industrial applications (Bolin et al., 1983; Dalla Rossa and Giroux, 2001; Valle,
Aranguiz et al., 1998; Valle, Cuadros et al., 1998). It is necessary to set up pilot or
bench prototypes to develop products for industry and to upgrade the modeling to a
design level (Qi et al., 1999). Design of multicomponent and countercurrent processes
must be optimized for the desired dehydration or impregnation rates. Incorporation of
the glass-transition concept into the stabilization of osmotically treated products also
needs more studies (Valle, Aranguiz et al., 1998; Valle, Cuadros et al., 1998).
An evaluation of the distribution of phases in the tissue will provide clear knowl-
edge of the phenomena that control most of the mass transfer processes. The devel-
opment of practical techniques and the advent of improved imaging tools will make
this procedure more feasible. It will be important to link the microscopy fi ndings to
the processing parameters of the operation and other compositional and mechanical
characteristics of the tissues. The structure of the tissue and its role in the kinetics,
in addition to the equilibrium, still require a more specifi c approach (Barat et al.,
1999; Islam and Flink, 1982).
The osmotic solution becomes diluted because of loss of sugar as well as uptake of
water from fresh food material. In practical applications, one problem for large-scale
production using an osmotic concentration process is a large quantity of diluted syrup
left at the end of the process. The syrup needs to be reconcentrated and reused in order
to make the procedure economically feasible. Sugar solutions tend to darken and cara-
melize when heated for concentration. It is preferable simply to concentrate the sugar
solution by adding more sugar without heating. Sugar solutions also cannot be kept
more than 1 week at room temperature because they are likely to ferment. It is possible
to integrate the osmotic dehydration process with other processes, such as canning and
bottling of fruits, alcoholic production, and other fermentation processes as possible
means of economically utilizing the spent sugar solution, in which the spent sugar solu-
tion can be satisfactorily used. Thus, the economic feasibility of this process probably
depends on the availability of cheap sugar and reuse of spent sugar solution.
However, osmotic dehydration requires accurate prediction of water removal from
foods for industrial applications. Osmotic dehydration of food materials is a less under-
stood area of food dehydration. Simultaneous fl ow of solutes and water and interaction
between components requires a theoretical approach based on the application of linear
irreversible thermodynamic processes. Despite the great achievements made in the
fundamental research and industrial applications around the world, simultaneous fl ows
of solutes and water and interaction between components require a further theoretical
approach to allow this technique to be applied on a large scale in the food industry.
NOMENCLATURE
VARIABLES
a water activity
A surface area (m2)
I interface
J mass fl ux (kg m2/s)
K mass transfer coeffi cient (kg/m2/s)
M total mass (kg)
52527_C007.indd 20452527_C007.indd 204 10/3/2008 3:54:16 PM10/3/2008 3:54:16 PM
© 2009 by Taylor & Francis Group, LLC

Application and Development of Osmotic Dehydration 205
P pressure (kg/m2)
n molecular average velocity (m/s)
V water partial specifi c volume (m3)
R gas constant
S kinetic constant
t time (s)
T temperature (°C)
X transfer direction (m)
GREEK SYMBOLS
m chemical potential
r density (kg/m3)
f osmotic behavior constant
y cell wall elastic modulus constant (N/m2)
SUBSCRIPTS
i, j index denoting component number
I interface
0 initial
ss soluble solid
su sugar
w water
infi nity
1, 2, 3 components 1, 2, and 3
SUPERSCRIPTS
c cell
L equilibrium in liquid phase
0 initial
v fi xed volume frame of reference
REFERENCES
Andreotti, R., Tomasicchio, M., de Giorgi, A., and Palmas, D., Conservazione di pesche
parzialmente disidratate per osmosi diretta, Ind. Conserve., 60, 96–103, 1985.
Argaiz, A., Lopez-Malo, A., Paou, E., and Welti, J., Osmotic dehydration of papaya with corn
syrup solids, Drying Technol., 12, 1709–1725, 1994.
Azuara, E., Beristain, C.I., and Garcia, H.S., Development of a mathematical model to predict
kinetics of osmotic dehydration, J. Food Sci. Technol., 29, 239–242, 1996.
Azuara, E., Beristain, C.I., and Gutierrez, G.F., A method for continuous evaluation of
osmotic dehydration, Lebensm.-Wiss. Technol., 31, 317–321, 1998.
Barat, J.M., Albors, A., Chiralt, A., and Fito, P., Equilibration of apple tissue in osmotic
dehydration: Microstructural changes, Dry. Technol., 17, 1375–1386, 1999.
Bolin, H.R., Huxsoll, C.C., Jackson, R., and Ng, K.C., Effect of osmotic agents and concentra-
tion on fruit quality, J. Food Sci., 48, 202–212, 1983.
52527_C007.indd 20552527_C007.indd 205 10/3/2008 3:54:16 PM10/3/2008 3:54:16 PM
© 2009 by Taylor & Francis Group, LLC

206 Advances in Food Dehydration
Bruin, S. and Luyben, K.C., Drying shrinkage and stresses, Proc Eighth International Drying Symposium IDS ’92, Quebec, 155–216, 1992.
Chirife, J., Karel, M., and Flink, J., Studies on mechanisms of retention of volatile in freeze-
dried food models: The system PVP-n-propanol, J. Food Sci., 38, 671–678, 1973.
Conway, J., Castaigne, F., Picard, G., and Vovan, X., Mass transfer considerations in the
osmotic dehydration of apples, Can. Inst. Food Sci. Technol. J., 16, 25–22, 1983.
Crank, J., The Mathematics of Diffusion, Clarendon Press, Oxford, U.K., 1975.
Cussler, E.L., Diffusion: Mass Transfer in Fluid System, Cambridge University Press,
Cambridge, U.K., 1984.
Dalla Rossa, M. and Giroux, F., Osmotic treatments and problems related to the solution
management, J. Food Eng., 49, 223–236, 2001.
Dalla Rosa, M., Pinnavaia, G., and Lerici, C.R., La disidratazione della frutta mediante
osmosi diretta. Ind. Conserve., 57, 3–12, 1982.
Dixon, G.M., Jen, J.J., and Paynter, V.A., Tasty apple slices result from combined osmotic
dehydration and vacuum drying process, Food Prod. Dev., 10, 60–67, 1976.
Farkas, D.-F. and Lazar, M.-E., Osmotic dehydration of apple pieces: Effect of temperature
and syrup concentration on rates, Food Technol., 23, 90–92, 1969.
Fish, B.P., Diffusion and thermodynamics of water in potato starch, paper presented at the
Conference on Fundamental Aspects of the Dehydration of Foodstuffs, Aberdeen,
Scotland, 1958.
Fito, P., Modelling of vacuum osmotic dehydration of food, J. Food Eng., 22, 313–328, 1994.
Fito, P., Andres, A., Chiralt, A., and Pastor, R., Coupling of hydrodynamic mechanism and
deformation–relaxation phenomena during vacuum treatments in solid porous food–
liquid system, J. Food Eng., 21, 229–240, 1996.
Fito, P. and Chiralt, A., An update on vacuum osmotic dehydration, in Food Preservation by Moisture Control: Fundamentals and Applications, ISOPOW Practicum II, Barbosa-
Cánovas, G.V. and Welti-Chanes, J., Eds., Technomic Publishing Company, Lancaster,
PA, 1995, p. 351.
Fito, P. and Chiralt, A., Vacuum impregnation of plant tissues, in Design of Minimal Processing Technologies for Fruits and Vegetables, Alzamora, S.M., Tapia, M.S., and
Lopez-Malo, A., Eds., Aspen Publishers, Gaitherburg, MD, 2000.
Fito, P., Chiralt, A., Barat, J., Salvatori, D., and Andres, A., Some advances in osmotic
dehydration of fruit, Food Sci. Int., 4, 329–338, 1998.
Flink, J.M., Process conditions for improved fl avor quality of freeze dried foods, J. Agric. Food Chem., 23, 1019–1026, 1975.
Flink, J.M., Dehydration of carrot slices: Infl uence of osmotic concentration on drying
behaviour and product quality, in Food Process Engineering, Vol. 1, Linko, P., Malkki, Y.,
Olkku, J., and Larinkari, J., Eds., Applied Science, London, 1980, p. 412.
Garcia, R., and McFelley, J.C., Determining the cellular concentration and osmotic potential
of plant tissues, Am. Biol. Bull., 40, 119–128, 1978.
Giangiacomo, R., Torreggiani, D., and Abbo, E., Osmotic dehydration of fruit. 1. Sugars exchange
between fruit and extracting syrups, J. Food Process. Preserv., 11, 183–195, 1987.
Giangiacomo, R., Torreggiani, D., Erba, M.L., and Messina, G., Use of osmodehydrofrozen
fruit cubes in yoghurt, Int. J. Food Sci., 3, 345–350, 1994.
Hawkes, J. and Flink, J.M., Osmotic concentration of fruit slices prior to freeze-dehydration,
J. Food Process. Preserv., 2, 265–284, 1978.
Hope, G.W. and Vitale, D.G., Osmotic dehydration, a cheap and simple method of preserving
mangoes, bananas and plantains (IDRC-004c), Food Research Institute, Canada
Department of Agriculture, Ottawa, 1972.
Hough, G., Chirife, J., and Marini, C., A simple method for osmotic dehydration of apples,
Lebensm.-Wiss. Technol., 26, 151–155, 1993.
Huxsoll, C.C., Reducing the refrigeration load by partial concentration of food prior to
freezing. Food Technol., 5, 98–102, 1982.
52527_C007.indd 20652527_C007.indd 206 10/3/2008 3:54:16 PM10/3/2008 3:54:16 PM
© 2009 by Taylor & Francis Group, LLC

Application and Development of Osmotic Dehydration 207
Huxsoll, C.C., Bolin, H.L., and King, A.D., Jr., Physicochemical changes and treatments for
lightly processed fruits and vegetables, in Quality Factors of Fruit and Vegetables, American Chemical Society Series No. 405, Jen, J.J., Ed., American Chemical Society,
Washington, DC, 1989, pp. 203–215.
Islam, M.N. and Flink J.N., Dehydration of potato II. Osmotic concentration and its effect on
air drying behaviour, J. Food Technol., 17, 387–403, 1982.
Karel, M., Osmotic drying, in Principles of Food Science—Part II, Fennema, O.R., Ed.,
Marcel Dekker, New York, 1975.
King, C.J., Freeze Drying of Foods, CRC Press, Cleveland, OH, 1970.
Le Maguer, M., Mass transfer modeling in structured foods, in Food Engineering, Fito, P.,
Ortega-Rodríguez, E., and Barbosa-Cánovas, G.V., Eds., Chapman & Hall, New York,
1997.
Le Maguer, M. and Biswal, R.N., Multicomponent diffusion and vapour–liquid equilibria
of dilute organic components in aqueous sugar solutions, Am. Inst. Chem. Eng. J., 18,
513–519, 1984.
Le Maguer, M., Shi, J., and Fernandez, C., Characterization of mass transfer behavior of plant
tissues during osmotic dehydration, Food Sci. Technol. Int., 9, 187–192, 2003.
Le Maguer, M. and Yao, Z.M. Mass transfer during osmotic dehydration at the cellular level,
in Food Preservation by Moisture Control: Fundamentals and Applications, ISOPOW Practicum II, Barbosa-Cánovas, G.V. and Welti-Chanes, J., Eds., Technomic Publishing
Co. Inc., Lancaster, 216–222, 1995.
Lenart, A. and Dabrowska, R., Kinetics of osmotic dehydration of apples with pectin coat-
ings, Dry. Technol., 17, 1359–1373, 1999.
Lenart, A. and Flink, J.M., Osmotic concentration of potato. I. Criteria for the end-point of
the osmosis process, J. Food Technol., 19, 45–63, 1984.
Lerici, C.R., Pinnavaia, G., Dalla Rosa, M., and Bartolucci, L., Osmotic dehydration of fruit:
Infl uence of osmotic agents on drying behavior and product quality, J. Food Sci., 50,
1217–1219, 1985.
Magee, T.R.A., Hassaballah, A.A., and Murphy, W.R., Internal mass transfer during osmotic
dehydration of apple slices in sugar solutions, Ir. J. Food Sci. Technol. (Dublin), 7,
147–155, 1983.
Maltini, E. and Torreggiani, D., A new application of osmosis: The production of shelf-stable
fruits by osmosis, paper presented at the Progress in Food Engineering 246th Event for
European Food Chemistry and Engineering, Milan, Italy, 1986.
Marcotte, M. and Le Maguer, M., Repartition of water in plant tissues subjected to osmotic
processes, J. Food Proc. Eng., 13, 297–320, 1991.
Marcotte, M., Toupin, C., and Le Maguer, M., Mass transfer in cellular tissues. Part I: The
mathematical model, J. Food Eng., 13, 199–220, 1991.
Nobel, P.S., Biophysical Plant Physiology and Ecology, W.H. Freeman, San Francisco, 1983.
Ponting, J.D., Osmotic dehydration of fruits—Recent modifi cations and applications, Process. Biochem., 8, 18–23, 1973.
Ponting, J.D., Watters, G.G., Forrey, G.G., Jackson, R.R., and Stanley, R., Osmotic dehydration
of fruits, Food Technol., 20, 125–131, 1966.
Qi, H., Le Maguer, M., and Sharma, S.K., Design and selection of processing conditions of a
pilot scale contactor for continuous osmotic dehydration of carrots, J. Food Process. Eng., 21, 75–88, 1999.
Rao, M.A., Energy consumption for refrigerated, canned and frozen peas, J. Food Process. Eng., 1, 149–155, 1977.
Raoult-Wack, A.L., Recent advances in the osmotic dehydration of foods, Trends Food Sci. Technol., 5, 255–259, 1994.
Raoult-Wack, A.L., Guilbert, S., Le Maguer, M., and Rios, G., Simultaneous water and solute
transport in shrinking media—Part 1. Application to dewatering and impregnation
soaking processes analysis, Dry. Technol., 9, 589–612, 1991.
52527_C007.indd 20752527_C007.indd 207 10/3/2008 3:54:16 PM10/3/2008 3:54:16 PM
© 2009 by Taylor & Francis Group, LLC

208 Advances in Food Dehydration
Raoult-Wack, A.L., Jourdain, P., Guilbert, S., and Rios, G., Technique de fl uidisation inverse
appliquee aux procedes de dehydration impregnation par immersion (DII), Coll. Recentes Progres Genie Proced., 5(14), 329–334, 1991.
Raoult-Wack, A.L., Lenart, A., and Guilbert, S., Recent advances in dewatering through
immersion in concentrated solutions (“osmotic dehydration”), in Drying of Solids,
Mujumdar, A.S., Ed., VSP International Science Publishers, Zeist, The Netherlands,
1992.
Rastogi, N.K., Eshtiaghi, M.N., and Knorr, D., Accelerated mass transfer during osmotic
dehydration of high intensity electrical fi eld pulse pretreated carrots, J. Food Sci., 64,
1020–1023, 1999.
Rastogi, N.K. and Niranjan, K., Enhanced mass transfer during osmotic dehydration of high
pressure treated pineapple, J. Food Sci., 63, 508–511, 1998.
Rogachev, V.I. and Kislenko, I.I., Combined methods of decreasing water activity in fruits
under preservation, Acta Aliment., 2, 245–252, 1972.
Shewfelt, R.L., Quality of minimally processed fruits and vegetables, J. Food Qual., 10,
143–149, 1987.
Shi, J. and Le Maguer, M., Mass transfer in cellular material at solid–liquid contacting inter-
face, Lebensm.-Wiss. Technol., 35, 367–372, 2002a.
Shi, J. and Le Maguer, M., Analogical cellular structure changes in solid–liquid contacting
operations, Lebensm.-Wiss. Technol., 35, 444–451, 2002b.
Shi, J. and Le Maguer, M., Mass transfer fl ux at solid–liquid contacting interface, Food Sci. Technol. Int., 9, 193–197, 2003.
Spiess, W.E.L., Improvement of overall food quality by application of osmotic treatments in
conventional and new processes: Concerted action FAIR-CT96-1118, in Osmotic Treatments for the Food Industry. Proceedings of the 1st Osmotic Treatment Seminar, Sereno, A.M., Ed., FEUP Ediçoes, Porto, Portugal, 1999, pp. 9–17.
Thornley, J.H.M., Mathematical Models in Plant Physiology. A Quantitative Approach to Problems in Plant and Crop Physiology, Academic Press, London, 1976.
Torreggiani, D., Technological aspects of osmotic dehydration in food, in Food Preservation by Moisture Control: Fundamentals and Applications, ISOPOW PRACTICUM II, Barbosa-Cánovas, G.V. and & Welti-Chanes, J., Eds., Technomic Publishing Co. Inc.,
Lancaster, 281–304, 1995.
Torreggiani, D., Forni, E., Maestrelli, A., and Quadri, F., Infl uence of osmotic dehydration on
texture and pectic composition of kiwifruit slices, Dry. Technol., 17, 1387–1397, 1999.
Torreggiani, D., Maltini, E., and Forni, E., Osmotic pre-treatments: A new way to directly
formulate fruit and vegetable ingredients, in Osmotic Treatments for the Food Industry. Proceedings of the 1st Osmotic Treatment Seminar, Sereno, A.M., Ed., FEUP Ediçoes,
Porto, Portugal, 1999, pp. 19–28.
Torreggiani, D., Forni, E., and Rizzolo, A., Osmotic dehydration of fruit. Part II. Infl uence of
the osmotic time on the stability of processed cherries, J. Food Process. Preserv., 12,
27–31, 1988.
Uzuegbu, J.O. and Ukeka, C., Osmotic dehydration as a method of preserving fruits to mini-
mize ascorbic acid loss, J. Food Agric., 1, 187–193, 1987.
Valle, J.M. del, Aranguiz, V., and Leon, H., Effects of blanching and calcium infi ltration
on PPO activity, texture, microstructure and kinetics of osmotic dehydration of apple
tissue, Food Res. Int., 31, 557–569, 1998.
Valle, J.M. del, Cuadros, T.R.M., and Aguilera, J.M., Glass transitions and shrinkage during
drying and storage of osmosed apple pieces, Food Res. Int., 31, 191–204, 1998.
Yao, Z. and Le Maguer, M., Mathematical modelling and simulations of mass transfer in
osmotic dehydration processes. Part I: Conceptual and mathematical models, J. Food Eng., 29, 349–360, 1996.
52527_C007.indd 20852527_C007.indd 208 10/3/2008 3:54:16 PM10/3/2008 3:54:16 PM
© 2009 by Taylor & Francis Group, LLC

209
8 Fundamentals and Tendencies in Freeze-Drying of Foods
J.I. Lombraña
CONTENTS
8.1 Introduction ............................................................................................. 209
8.2 Fundamentals .......................................................................................... 210
8.3 Mathematical Description of Freeze-Drying .......................................... 213
8.3.1 Secondary Drying ........................................................................ 220
8.4 Physical Properties and Freeze-Drying Control ..................................... 221
8.5 Microwave Freeze-Drying ...................................................................... 223
8.6 Industrial Freeze-Drying ......................................................................... 226
8.6.1 Lab or Pilot Plant Freeze-Dryers ................................................. 227
8.6.2 Batch Freeze-Dryers .................................................................... 227
8.6.3 Continuous or Tunnel Freeze-Dryers ........................................... 228
8.6.4 Special Freeze-Dryers .................................................................. 229
8.7 Freeze-Drying Costs ............................................................................... 230
Nomenclature ..................................................................................................... 232
Variables ................................................................................................. 232
Greeks ..................................................................................................... 233
Superscript .............................................................................................. 233
Subscripts ................................................................................................ 233
References .......................................................................................................... 234
8.1 INTRODUCTION
The ancient Peruvian Incas of the Andes knew the basic process of freeze-drying
food. Freeze-drying or lyophilization is the sublimation or removal of water content
from frozen food. The dehydration occurs under a vacuum, and the wet zone is frozen
during the whole process so that nearly perfect preservation results. The Incas stored
their potatoes and other food crops on the mountain heights above Machu Picchu
(Carter, 1964). The cold mountain temperature froze the food and the water inside
slowly vaporized under the low air pressure of the high altitudes; basically, the foods
were freeze-dried.
52527_C008.indd 20952527_C008.indd 209 10/3/2008 3:56:35 PM10/3/2008 3:56:35 PM
© 2009 by Taylor & Francis Group, LLC

210 Advances in Food Dehydration
During freeze-drying, the solvent (generally water) is removed from the frozen
product under a vacuum. Sublimated vapor is evacuated by the action of mechanical
pumps or steam ejectors.
As a general rule, lyophilization produces the best quality dehydrated foods.
This is attributable to the rigidity of the frozen state during water removal because it
is essentially a sublimation process. The result is the apparition of a porous matrix
that keeps the initial structure and enables rapid complete rehydration, reestablishing
the original food. In the application to foods, freeze-drying presents the additional
advantage of avoiding losses of volatiles and fl avors. Moreover, the low processing
temperature and the rapid transition of the whole product from an initial hydrated
structure to the nearly complete dehydrated matrix minimizes the deterioration
reactions that occur during conventional drying, such as nonenzymatic browning,
enzymatic reactions, and protein denaturation. A small amount of water, called bound
water, inevitably remains in foods after freeze-drying. The process temperature
should be kept below the glass-transition temperature of the food, corresponding to
bound water, to avoid undesirable effects (Mellor, 1978). The high running costs of
the freeze-drying process is compensated by the lack of postoperation treatments
like freezing or refrigeration during storage.
Two characteristics are necessary for the application of lyophilization as a drying
method: the food value and the quality of the dehydrated food. The presence of these
two factors leads to a wide application of freeze-drying to biological and biomedical
products such as blood plasma, hormone solutions, serum, surgical transplants
(arteries, bones, skin), and living cells (bacteria, yeasts).
In addition, freeze-drying is especially interesting for processing foods that present
drying diffi culties (coffee, soups, extracts, and some fruits) where the quality of the
freeze-dried products (i.e., aroma, rehydration, bioactivity, etc.) is considerable higher
than those processed by other drying techniques.
Freeze-drying requires very low pressure (vacuum) to obtain acceptable drying
rates. If the product has water as a solvent, freeze-drying can be performed at
4.58 mmHg pressure and 0∞C. Nevertheless, for foods with bound water the process
requires temperatures below 0∞C for its complete solidifi cation. Most foods can be
freeze-dried at a pressure below 2 mmHg and a temperature below –10∞C.
Lyophilization from a processing point of view can be considered as the sequence
of three operations: freezing to low temperatures below the melting point, drying by
sublimation at a pressure lower than that corresponding to triple point, and desorption
of bound water. Finally, storage should be carried out under controlled conditions
(inert atmosphere and humidity) in opaque containers.
If these operations are performed under controlled optimized conditions, freeze-
dried foods can thus be kept for long periods of time while maintaining their physical,
chemical, and organoleptic properties, similar to those of fresh products and for
indefi nite periods.
8.2 FUNDAMENTALS
The most remarkable characteristic of freeze-drying is the high quality of the
dehydrated foods, which is incomparable to any other drying process. Freeze-dried
52527_C008.indd 21052527_C008.indd 210 10/3/2008 3:56:36 PM10/3/2008 3:56:36 PM
© 2009 by Taylor & Francis Group, LLC

Fundamentals and Tendencies in Freeze-Drying of Foods 211
foods are characterized by their rapid rehydration and their texture and fl avor that is
similar to fresh foods. These quality properties are derived from (1) the low tempera-
ture involved in the process avoids chemical alterations and (2) moisture is mostly
removed as vapor from a frozen solid leaving behind a dehydrated porous matrix,
which avoids undesirable reactions and allows rapid rewetting.
Lyophilization is essentially a sublimation process. The basic elements for a
freeze-drying installation are the vacuum chamber, an evacuating system, and a heating
device to supply the necessary heat for sublimation and vaporization (Gutcho, 1977).
Figure 8.1 shows the basic combination of these elements that usually are comple-
mented with monitoring and operation control devices.
Several kinds of equipment are used for vapor evacuation from steam ejectors to
numerous kinds of mechanical pumps. The gas volumes that are required to move at
the low pressures of freeze-drying are enormous. For example, a drying rate of only
1 kg/h gives rise to vapor volumes of about 3000 m3/h, which is well over the ability
of gas-ballast mechanical pumps. Steam ejectors could be a solution when the plant
has large amounts of economical steam and cold water available. These steam ejectors
were often found in the fi rst big freeze-drying installations (Cotson and Smith, 1963).
Nevertheless, when using ejectors the vacuum level attained is only moderate. The
basic typical equipment for vacuum systems consists of a mechanical pump after a
condenser system to retain vapor, which means additional consumption of energy
for refrigeration. It is thus necessary to obtain suffi cient pressures to provoke the
FIGURE 8.1 Scheme of a freeze-drying installation showing the basic elements.
Vacuum pump
OperationVariables
ControlOn/Off signals
Air
V1 V2
Tp
Pt
Tp
Pt
A/D converters
Tcond
Ts
Tf
Mass
Condenser
D/A convertersMonitoringand control
Heatingshelves
LoadVacuum cavity
52527_C008.indd 21152527_C008.indd 211 10/3/2008 3:56:36 PM10/3/2008 3:56:36 PM
© 2009 by Taylor & Francis Group, LLC

212 Advances in Food Dehydration
necessary driving force between the product and the condenser coil surface, conse-
quently increasing the product temperature to the maximum allowed (near melting
temperature) and lowering the condenser temperature to the minimum to obtain the
most favorable drying rate. Therefore, the condenser temperature should be kept
well below the sublimation temperature of the product (– 45∞C) and even lower
(up to –90∞C) in some research prototypes. This requires the use of special refrigera-
tion systems with two or more refrigerants working in combined refrigerating cycles
(Gutcho, 1977).
Freeze-drying is a mass transfer controlled operation during nearly all of the
primary drying. Nevertheless, in some occasions it could be a problem to supply a
certain amount of heat, as it is when applying mainly radiant heat. Heat transfer
resistance of a dry layer as well as a vacuum are primary factors conditioning the
heat supply up to the sublimation front.
The fi rst freeze-dryers tried to reduce the dry layer and resistance by applying
heat directly by conduction from the product surface closely in contact with the
heating source. The product was disposed in thin layers between two heating plates.
The equipment proposed by Smithies (1959) was equipped with this kind of heating
device that consisted of an ingenious system of spiked metal plates pushed into meat.
This system presents great advantages in reducing the resistance to heat transfer,
intensifying the heat application by conduction. At the same time, by drilling holes
down the spikes, the resistance of water fl ow also decreased. The idea of a food layer
between heating plates applied to both surfaces of a product is illustrated in Figure 8.2.
This device reportedly gave a substantial reduction in drying time. However, the
hygienic and mechanical disadvantages were an insurmountable barrier in modern
freeze-dryers in spite of the good results obtained in meat and fi sh processing.
FIGURE 8.2 Section of a freeze-dried food heated by a double contact system. (From
Cotson, S. and Smith, D.B., Freeze Drying of Foodstuffs, Columbia Press, Manchester, U.K.,
1963. With permission.)
Heating plate
Tray cover
Expanded metal
Dry material
Ice front
Frozen material
Expanded metal
Tray
Heating plate
52527_C008.indd 21252527_C008.indd 212 10/3/2008 3:56:36 PM10/3/2008 3:56:36 PM
© 2009 by Taylor & Francis Group, LLC

Fundamentals and Tendencies in Freeze-Drying of Foods 213
The heat transfer resistance could be reduced to a great extent by using
radiofrequency heating (microwave energy). This technique, which will be treated in
detail later, was already investigated in the early 1950s (Harper and Tapel, 1957) and
it is currently adopted in certain drying facilities because of its enormous advantages.
However, the diffi culties of the temperature control of the frozen nucleolus are still a
serious drawback for the application of microwaves in the food industry.
Radiant heat is present to a greater or smaller extent in lyophilization facilities
currently used for different industrial applications, not only in foods but also in
biomedicals and pharmaceuticals. The amount of heat supplied by radiation is given
by the Stefan–Boltzman law. In accordance with it, the energy removed is proportional
to the difference between the fourth power of the absolute temperature of the heat
source (plate) and the product. This heating mechanism presents certain advantages
with respect to others because it is independent of the media properties (pressure and
position) because it supplies heat through the free surface of the product and makes the
subsequent mass fl ux easy. Radiant energy in the wavelength range from 104 to 105 Å
has better penetration, resulting in shorter drying cycles (Levinson and Oppenheimer,
1948). Nevertheless, radiation heating is strongly affected by the color and texture
of the absorbing surface, often a characteristic of raw foods, which could give rise to
nonuniform heating problems.
8.3 MATHEMATICAL DESCRIPTION OF FREEZE-DRYING
Products undergoing lyophilization can be very different in size and type. This is the
case of solutions in vials (Boss et al., 2004), such as extracts and infusions. Other
cases are granulated products and even raw foods. Thus, a general approach to allow
the description and application of freeze-drying physics to different common situations
encountered during food processing will be made in this section, and disposition and
thermophysical properties will be taken into account. In most situations, the applica-
tion of theoretical models is done on a product amount that represents the load in the
drying cabinet. In this case, a general situation representing a fi nite amount of any
geometry will be treated. Because of easiness of the treatment, the amount of product
will be related to the sphere geometry through the sphericity parameter. Thus, many
geometrical aspects of the advancing sublimation front can be followed with a sole
dimension parameter analogous to the radius in a same volume spherical particle of
radius req. The sphericity of a body is defi ned as the ratio of the surface of a sphere
having the same volume to the surface of that body. As an example, sphericity y of a
cube of side L is
y � L ____ 2req
� E ___ req (8.1)
Generalizing, any body can be defi ned by electric fi eld E (� y req), a geometrical
parameter characteristic of the solid in a spherical analogy, so that its volume V
having an outer surface S would be
V � S __ 3 E � 4 __
3 p r eq
3 y (8.2)
52527_C008.indd 21352527_C008.indd 213 10/3/2008 3:56:36 PM10/3/2008 3:56:36 PM
© 2009 by Taylor & Francis Group, LLC

214 Advances in Food Dehydration
Figure 8.3 shows a cross section of a particle of irregular geometry and a sphere
of radius req with the same volume. At the beginning of freeze-drying, the whole volume
is frozen. As freeze-drying progresses, a dry layer of thickness d appears, so
d � E f 0 - Ef (8.3)
Consequently, the velocity of sublimation front advance � and that of the reference
sphere with the same volume can be related as
� � ∂Ef ___ ∂t � y
∂req,f ____ ∂t
(8.4)
The dry layer thickness advances up to the complete disappearance of the
frozen nucleus. Moisture removal is performed by sublimation, which in most of
the cases represents more than half of the drying duration and more than 90%
moisture. Once the frozen nucleus has been sublimated, secondary drying arises in
which the low residual moisture that remains on the porous matrix will be removed
by evaporation.
A very important characteristic of freeze-drying is the apparition of an outer dry
zone and an inner frozen one. Many authors (Liapis and Bruttini, 1994; Millman,
1985; Song et al., 2005) consider two well-defi ned zones separated by a moving
interface of infi nitesimal thickness. This physical model is quite realistic in the
freeze-drying of solutions in vials. In this case, the dried product would present a
structure originated from the perfect dispersion of solute within the solvent. Thus, in
FIGURE 8.3 Analogy parameters of the cross section of an irregular particle and sphere:
(a) irregular body, (b) equivalent sphere volume, (c) analogous spherical body of the same
volume and geometry, and (d) expanded detail of surface.
52527_C008.indd 21452527_C008.indd 214 10/3/2008 3:56:36 PM10/3/2008 3:56:36 PM
© 2009 by Taylor & Francis Group, LLC

Fundamentals and Tendencies in Freeze-Drying of Foods 215
such a circumstance it is possible to consider rigorously a direct transition of solid to
vapor. Nevertheless, many raw food materials, such as meat, fi sh, fruits, and vegetables,
have a characteristic structure. Consequently, their dry zone would not be homo-
geneously distributed (anisotropy), depending on the corresponding texture of the
product: cells, fi bers, and other typical formations. In these cases, water is not com-
pletely free but bound. Thus, it seems reasonable that in those circumstances water
could not pass directly to vapor because they would be retained in the corresponding
structure (Kochs et al., 1993). Moreover, ice dendritic formations appear at certain
freezing rates (Kochs et al., 1991; Kurz and Fisher, 1989). In summary, it can be
concluded that a sublimation interface of infi nitesimal thickness could be a reason-
able assumption, although in many cases important discrepancies would arise with
respect to its application in reality. This leads to the consideration of a more realistic
“diffuse” sublimation front, in which moisture decreases gradually outward.
Primary drying is characterized by the presence of frozen water, and a majority of
it is removed from the product matrix by sublimation. Secondary drying appears once
there is no frozen water left in the porous matrix and the dry zone is extended over
the whole product. Here, the mechanism for moisture removal is by desorption of
bound water and the subsequent transport as vapor through channels present in the
dry porous matrix.
During drying, the energy required for sublimation and desorption of bound
water must be supplied by an adequate heating source. In many cases it consists of a
radiant plate at high temperature placed in the top side of the product load or from
the bottom side by conduction. If the global heating fl ux supplied by the heating
mechanisms over the surface of the product is constant and no restrictions exist for
the vapor fl ow, the decrease of the frozen nucleus will progress, keeping a geometrical
similarity to the original form and being placed in the geometrical center of the
product. Nevertheless, uniformly distributed heating is very diffi cult to fi nd in most
cases and there are often great differences in the heating supply according to the
freeze-dryer design, position, and arrangement of the load within the vacuum cabinet.
The decrease of the ice nucleus would thus depend on the heating fl ux in each spatial
direction, which is especially important in the freeze-drying of products contained
in vials (Schelenz et al., 1995).
Good running of the freeze-drying operation involves keeping the temperatures
of the dry and frozen zones below certain prefi xed levels, assuring good quality in the
dehydrated product. Thus, depending on the type of product, it is necessary to defi ne
its proper constraint temperatures for the dry and frozen product, which would be the
scorch temperature and the melting point, respectively. Keeping the product tempera-
ture below these levels during the operation is the most important rule to follow for
achieving a correct freeze-drying process. If not, vaporization of the melted ice would
take place, which in turn would produce a collapsed structure and shrinkage of the
affected zones, with negative effects on the quality properties of the dehydrated
product (i.e., physicochemical alterations and dehydration diffi culties). The melting
point of many foods is around –10∞C because it depends on the amount of bound
water, which is similar for a great variety of foods (Lombraña and Díaz, 1987).
Conversely, the scorch temperature can be quite different depending on the product.
In addition, the temperature of the dry zone must be kept below the scorching
52527_C008.indd 21552527_C008.indd 215 10/3/2008 3:56:36 PM10/3/2008 3:56:36 PM
© 2009 by Taylor & Francis Group, LLC

216 Advances in Food Dehydration
temperature during both primary and secondary drying. The value for the scorch
point oscillates habitually between 10 and 50∞C, depending on the criteria used to
determine such temperatures. There are several studies on the quality of freeze-dried
production that were performed on measurable parameters such as color, vitamin,
protein, and nutritional compounds contents. Once the constraint temperatures are
determined, a good strategy would consist of achieving the freeze-drying operation
in a minimum operating cycle. Effi cient running of the operation requires the appli-
cation of the maximum heat supply at each moment, taking into account the constraints
of the product and limitations of the installation. Keeping the product under the thermal
limitations requires careful regulation of the heating supply or pressure (Lombraña
et al., 1997). In some cases where heat transfer limits the process, the scorch tempera-
ture will be the restriction temperature limiting the process; in other cases where mass
transfer is in control, the melting point will be the temperature to watch more closely.
Both situations may be controlled by reducing the heating power, but in mass transfer
limited cases it should be accompanied by a reduction of pressure within the
possibilities of the vacuum equipment, positively infl uencing the mass transfer and
subsequently decreasing the frozen core temperature.
Numerous researchers have used mathematical modeling to describe freeze-drying
on the basis of applying heat and mass transfer laws and balances (Liapis and Bruttini,
1995). Most of the freeze-drying models are hardly conditioned by geometry aspects.
This is the case of lyophilization in vials, a situation frequently treated in the literature
because of its importance for some food and pharmaceutical industrial processes
(Kochs, 1991; Nastaj, 1991; Song, 2005). Because of the great variety of situations and
products in which freeze-drying is applied, a general approach to describe most freeze-
drying situations will be explained here. The most common suppositions in previous
works (Liapis and Litchfi eld, 1979; Sadikoglu and Liapis, 1997) follow:
1. Sublimation of frozen moisture happens at the interface between frozen and
dry zones.
2. Vapor pressure is in equilibrium at the sublimation temperature of the
product.
3. To a lesser degree than vapor, moisture can migrate in the liquid state either
during primary or secondary drying.
4. Vaporized water diffuses through the porous matrix of the dry layer, which
is fi lled with low-pressure stagnant air. The net fl ux of air is assumed to be
negligible.
5. Shrinkage of the material is assumed to be negligible.
6. The bound water content in the dry porous matrix is in equilibrium with the
local temperature.
7. Properties such as the density, heat capacity, and thermal conductivity vary
with the moisture content following a linear relationship.
Taking into account the assumptions just indicated, the energy balance during
primary drying can be expressed according to the following:
Nwm Cp1 —T + Nwg Cpg —T + ∂Mm ____ ∂t
( fv rdDHs) + rCp ∂T ___ ∂t
+ T ∂(rCp)
______ ∂t � ke — 2T (8.5)
52527_C008.indd 21652527_C008.indd 216 10/3/2008 3:56:36 PM10/3/2008 3:56:36 PM
© 2009 by Taylor & Francis Group, LLC

Fundamentals and Tendencies in Freeze-Drying of Foods 217
In this equation, Cpl, Cpg, and Cp are the specifi c heat capacities of water in liquid
phase, of vapour and of food, respectively. The equation distinguishes between the
fl ux of water in the solid matrix (Nwm) and that of water vapour (Nwg). The third term
express the energy to sublimate the ice through the variation of the ice content in the
solid matrix (Mm). Parameter fv indicates the degree of moisture removed by subli-
mation, in a certain location, respect to the total (Nw) according to:
fv � Nwg
____ Nw
(8.6)
The continuity equations for moisture removal can be expressed by the following
equation:
∂M ___ ∂t � De1— 2M (8.7)
Water fl uxes in gas and liquid forms must be considered in Eq. (8.5):
Nwg � -Dg—pw (8.8)
Nwm � -Dm1—Mm rd (8.9)
Nw � Nwg + Nwm � -De1—Mm rd (8.10)
According to the last equation, global moisture is referred to the water content
either as gas or associated with the solid matrix:
M � e pw Mw _______ RTrd
� Mm (8.11)
The moisture retained in the solid matrix or Mm content varies sharply from the
dry zone to the frozen zone. In the former, the Mm is very low and composed only of
the bound water (Mb ) whereas in the frozen zone it is the initial moisture (M0). The
residual moisture (MR) at each location of the solid can be defi ned as
MR � M - Mb _______ M0 - Mb
(8.12)
which is equal to 1 in the frozen zone.
A third zone of variable thickness could be considered, depending on the type of
product, in which the MR would vary gradually from 0 to 1. The thickness of this
hybrid zone, in which moisture may be present in the three states, would be practi-
cally nonexistent for a uniformly retreating ice front (URIF model) or extended all
along the piece (Lombraña and Villarán, 1993).
To solve the mathematical model formulated by the former equations, the
following initial (t � 0) conditions will be considered in the whole product vapor,
pressure, moisture, and temperature: pw � p w 0 , T � T 0, and M � M0.
The boundary conditions (at the external surface of the product and the geomet-
rical center) necessary to solve the characteristic equations of the energy balance and
the continuity equation are the following:
(—T )center � 0 (8.13)
52527_C008.indd 21752527_C008.indd 217 10/3/2008 3:56:36 PM10/3/2008 3:56:36 PM
© 2009 by Taylor & Francis Group, LLC

218 Advances in Food Dehydration
(—pw)center � 0 (8.14)
ke—T |surf � q |surf (8.15)
Nw |surf � Nwg |surf (8.16)
Derd—M |surf � Nw |surf (8.17)
De rd—M |surf � Nw |surf � Km( pw |surf - pw |cond) (8.18)
M |surf � e pw |surf Mw __________ RT rd
� Mb (8.19)
The transition zone from the frozen to dried layers where the sublimation of
ice takes place is assumed to be in equilibrium with the temperature at the
corresponding location. Consequently, the vapor pressure at the sublimation
interface will be obtained by means of the corresponding thermodynamic solid–
vapor equilibrium function for water (see Table 8.1) depending on the sublimation
temperature.
pw � fw(T) when Mm > Mb (8.20)
TABLE 8.1Values and Estimations of Thermophysical and Transport Properties of Skim Milk in Freeze-Drying
C1 (m) 3.865 10-4 kd (W/m K) 2.596 10-4 P + 3.9806 10-2
C2 0.921 kw (W/m K) 2.56
Cpg (J/kg K) 1616.6 M b
0 0.645 (at 233.15 K)
Cpd (J/kg K) 2590Mb
0exp{2.6[1.36 0.036( )]}
100
T T� �Cpw (J/kg K) 1930
Dg (m2/s) k1 � k2 pw
—P ____ —pw
Mw
Min
18.00
29.80
Dw � 2.16 ____ P
( T ______ 273.15
) 1.8
R (J/kmol K) 8314
D w 0 � Dw P Tm (K)
Tscor (K)
263.15
313.15
Kw � C1 ( RT ___ Mw
) 0.5
fw(T) 133.3224 {exp(�2445.56/T � 8.23121 log10 T � 0.01670T � 1.20514
10�5 T 2 � 6.757169)}
Kin � C1 ( RT ___ Min
) 0.5
e 0.785
Kmx � yin Kw � yw Kin rd (kg/m3) 328 ( 1 + Mb ______ 1+ M
b
0 )
k1 � C2 D w
0 Kw ____________
C2 D w 0 + Kmx P
rd (kg/m3) 1030
k2 � C2 D w
0 Kw ___________
C2 D w 0 + KmxP
+ Co1 ___ mmx
�Hs (J/kg)
�Hs (J/kg)
2840 103
2687 103
52527_C008.indd 21852527_C008.indd 218 10/3/2008 3:56:36 PM10/3/2008 3:56:36 PM
© 2009 by Taylor & Francis Group, LLC

Fundamentals and Tendencies in Freeze-Drying of Foods 219
The equation for fw(T ) can be found in Table 8.1. Although the sublimation zone
could be variable in thickness, here it is treated as an infi nitesimal sublimation front
and positioned through parameter Ef. This facilitates the velocity analysis of the
retreating ice front as shown later, when searching a spherical equivalency in which
the outer surface is that of the solid.
Thermophysical properties such as r and Cp and properties of transport (i.e., ke
and effective diffusivity for primary and secondary drying, De1 and De2) change
strongly with moisture. Thus, for the estimation of such properties one can use the
following equations:
ke � kd � MR(kw - kd) (8.21)
r � rd � MR( rw - rd) (8.22)
Cp � Cpd � MR(Cpw - Cpd) (8.23)
where MR is defi ned in Eq. (8.12) and Mb is the bound water of the foodstuff, which
is a function of the temperature of the porous matrix. During primary drying, the
free water content is removed and bound water remains in the solid matrix. This
changes with temperature and, once all free water has been removed, heating is
employed for increasing the solid porous matrix temperature from that of sublima-
tion to the temperature corresponding to the outer surface of the product. As the
sublimation front retreats, the temperature of a certain location increases with the
subsequent decrease in bound water content.
With respect to the diffusion coeffi cients, either De1 or De2 are infl uenced by
moisture through the diffusivity components in the porous matrix (Dm1 and Dm2)
according to Eqs. (8.8) to (8.10). The values of Dm1 and Dm2 would be taken as
constant during the primary and secondary drying periods, respectively.
From a macroscopic point of view, it is interesting to know where the
theoretical position of the sublimation front is. This position can be estimated
using a spherical analogy through the sphericity and parameter E, according to
Eq. (8.1). Such a position would be coincident with the real one in the case of
freeze-drying solutions or completely isotropic materials. Nevertheless, in the
case of raw foods with textured structures, as is the case of fruits and meats, it is
not realistic to consider a clear sublimation front. In the case of fuzzy sublimation,
the theoretical position could be considered as an averaged representative position.
Thus, the theoretical dry zone volume in a freeze-drying particle is expressed as a
function of time by
Vd � V f 0 - Vf �
S0 - Sf ______ 3 (E0 - Ef) �
S0 - Sf ______ 3 d (8.24)
being
Vf � V f 0 MR (8.25)
reqf
___ Sf
� req
___ S � y (8.26)
52527_C008.indd 21952527_C008.indd 219 10/3/2008 3:56:37 PM10/3/2008 3:56:37 PM
© 2009 by Taylor & Francis Group, LLC

220 Advances in Food Dehydration
where E f 0 and Ef are the initial and fi nal characteristic dimensions of the clear-front
frozen nucleus, respectively, and d is the thickness of the dried zone. Equations (8.3)
and (8.4) would thus be formulated for the outer dried layer of thickness d and for the
velocity of the retreating ice front, respectively.
The velocity of the retreating ice front of the piece could be expressed in terms
of the mass or drying rate:
um � Nw |surf S � u Sf __ 3 rd M 0 (8.27)
where Sf is the real surface of the frozen nucleus, taking into account Eq. (8.4).
Moreover, if the average moisture of the solid (Mav) is known, then
(M 0 - Mav)Vrd � ∫0
t
um dt (8.28)
8.3.1 SECONDARY DRYING
The essential characteristic during secondary drying is that the frozen zone has been
removed completely. The transport equations for heat and mass formulated previously
continue to be valid in this case except that the residual moisture corresponds only
to the bound water. Consequently, the energy balance is given by Eq. (8.5) with the
following remarks:
1. The enthalpy of sublimation must be substituted by that of evaporation.
2. Physical properties can be considered constant during the entire period
( rd � rd and Cp � Cpd).
3. Transport properties take the value corresponding to the second drying
period:
ke � kd (8.29)
De2 � Dg Mw ___ RT
—pw ____ —M � Dm2 rd
—Mm _____ —M
(8.30)
There is an important difference between effective diffusivities De1 and De2.
In the secondary drying period, diffusivity is basically coincident with the diffu-
sivity of water vapor in the gas phase (Dg) whereas during primary drying, the total
fl ux of water relative to the porous matrix (Nwm) could be important in the zone near
sublimation where the gradient �Mm is high.
The initial conditions at the beginning of secondary drying (temperature, pressure,
and moisture content) would correspond to the profi les of such variables at the end of
primary drying. It is important to know these profi les to initiate secondary drying.
The moisture of the porous matrix decreases from the values at the end of
primary drying to that of equilibrium, depending on the temperature. In contrast, the
concentration of water in the solid matrix is coincident to the bound water content all
along the process:
Mm � Mb � f(T) (8.31)
52527_C008.indd 22052527_C008.indd 220 10/3/2008 3:56:37 PM10/3/2008 3:56:37 PM
© 2009 by Taylor & Francis Group, LLC

Fundamentals and Tendencies in Freeze-Drying of Foods 221
The previous equation system describing freeze-drying either in primary or
secondary drying can be solved using different methods of fi nite differences. In the
case of microwave heating, an internal heat generation term (see dielectric heating
section) must be added to the right side of the energy balance [Eq. (8.5)].
8.4 PHYSICAL PROPERTIES AND FREEZE-DRYING CONTROL
When controlling the freeze-drying process, physical properties (density, specifi c heat,
and thermal conductivity) and transport properties (diffusivity and mass transfer
coeffi cient) must be taken into account. Both kinds of properties undergo strong changes
during the process in accordance with the MR [Eqs. (8.12) and (8.21) to (8.23)].
Table 8.1 provides the more signifi cant properties during freeze-drying of skim
milk as an example. This product has been studied by several groups (Boss et al.,
2004; Sheehan and Liapis, 1998; Song et al., 2005). Approximate equations for
estimation of the properties and data from review articles can be used for other foods
(Maroulis and Saravacos, 2003; Saravacos and Kostaropoulos, 2002).
The pressure in the chamber and the heating plate temperature should be
considered as the control variables for running a lyophilization process. In the case of
microwaves, the heating plate temperature is substituted by the electric power input.
Excessively long drying cycles is one of the main drawbacks that signifi cantly
affect running costs and subsequently the economical viability of the freeze-drying
operation. Thus, an important objective in running a lyophilization process is to
minimize the drying time and reduce costs, increasing its application possibilities.
Depending on the food and the application, variables such as the product geometry
and size modifi cation by pretreatments must be defi ned together with an adequate
operating strategy whereby it is possible to modify the control variables (pressure
and heating temperature or power).
The aim of every control strategy is to run the operation searching optimization.
This requires adequately varying the control variables, achieving freeze-drying of the
product in a minimum amount of time but without altering quality. Such parameters
should be prefi xed according to the food type and within the characteristic limitations
of the installation: the minimum pressure attained by the vacuum equipment and the
heating power or temperature for a certain drying facility.
Generally, optimization criteria are applied to primary drying because it presents
more alternatives in the control of process variables. Most of the water removal is
also achieved in this period, around 90% in most cases.
A rigorous optimization of freeze-drying requires a continuous variation of the
pressure and heating intensity while searching for an instantaneous maximum drying
rate during the entire process. There are references of optimization strategies in the
literature for freeze-drying of soluble coffee (Boss et al., 2004) using optimization
routines like that of Schittkowski (1985), which are based on the solution of nonlinear
programming problems. Boss et al. (2004) searched for an optimization on the basis
of fi nding the best combination of plate temperature, pressure, and thickness of a
product (not variable but constant during primary drying). Nevertheless, a higher
reduction in the process time can be obtained with strategies based on varying the
heating and pressure along the process (Lombraña, 1997).
52527_C008.indd 22152527_C008.indd 221 10/3/2008 3:56:37 PM10/3/2008 3:56:37 PM
© 2009 by Taylor & Francis Group, LLC

222 Advances in Food Dehydration
The minimum processing time requires the maximum possible heat supply but
avoiding the imposed constraints. These are defi ned through the melting point (Tm)
and scorch point (Tscor), which refer to the wet–frozen and dried zones, respectively,
which must be taken into account to assure a minimum quality level. Depending on
which is the active constraint (Tm or Tscor), two well-defi ned periods can be distin-
guished: the mass transfer controlled period and the heat transfer controlled period.
In the mass transfer controlled period, apart from the transitory initial period in
which the product temperature increases to the prefi xed value corresponding to the
operational policy imposed, the drying rate is adjusted during primary drying to
avoid exceeding Tm. Thus, the heat supply must be controlled to equilibrate heat
demand corresponding to the maximum mass fl ux for the cabinet pressure and
condenser temperature of the installation. During this period, the cabinet pressure is
at a rather high level with a slight tendency to decrease. In such circumstances, the
pressure value is the result of the high drying rate and the pumping ability of the
installation. Operation takes place as described earlier until all of the frozen moisture
is removed at the end of primary drying.
Figure 8.4 shows how during the primary period plate temperature is decreased
sharply in a short interval to avoid the temperature of the frozen product overtaking
the Tm in the freeze-drying of skim milk in vials (Sheehan and Liapis, 1998). This is
a consequence of the mass transfer conditions imposed in the cabinet. Better evacua-
tion conditions or equivalent lower pressure lead to the possibility of increasing the
FIGURE 8.4 Typical profi les of the process variables in freeze-drying. (Adapted from
Sheehan, P. and Liapis, A.I., Biotechnol. Bioeng., 60, 712–728, 1998. With permission.)
0 5 10 15 20
230
240
250
260
220
0.25
0.5
0.75
1
0
0.5
1
1.5
2
0240
280
320
360
400
Pressure
Plate temperature
Frozen temperature
Moisture
Tem
pera
ture
(K
)
Pre
ssur
e (m
m/H
g)M
RPrimary drying
Secondary dryingSecondary drying
Time (h)
52527_C008.indd 22252527_C008.indd 222 10/3/2008 3:56:37 PM10/3/2008 3:56:37 PM
© 2009 by Taylor & Francis Group, LLC

Fundamentals and Tendencies in Freeze-Drying of Foods 223
plate temperature with the subsequent increase of the drying rate. Once primary
drying is fi nished, constraint Tm will no longer be active and the heating temperature
can be increased with the only limitation of the scorch point of the dried product.
The heat transfer controlled period corresponds basically to secondary drying.
Once the moisture of the wet–frozen zone is removed, there is no restriction referring
to Tm and the plate temperature can be increased immediately to higher values with
the sole restriction imposed by Tscor. The plate temperature will be kept at a constant
value that is high enough to accelerate drying but without overtaking the Tscor constraint
up to the complete removal of bound water. The plate temperature in this period is
usually very similar to the scorch temperature and varies depending on the heat
transfer characteristic between the heating plate and product. As seen in Figure 8.4,
during this period the plate temperature is kept constant at an intermediate value
between the maximum and the minimum corresponding to primary drying while the
pressure decreases slightly, reaching a minimum at the end of the process.
In summary, constraint Tm is usually active during the primary period and limits
the drying rate within the characteristics of the installation. During secondary
drying, it is Tscor that is the active constraint and will be directly responsible for the
drying rate during the last part of freeze-drying.
8.5 MICROWAVE FREEZE-DRYING
Microwave heating is treated separately from the other methods because it repre-
sents a signifi cant change in the method of running the freeze-drying operation.
Moreover, despite its great possibilities that were known a long time ago (Cotson and
Smith, 1963; Rey, 1975), it is currently a technology neither completely applied nor
developed in many aspects. In a microwave fi eld, the amount of heat applied to the
product depends on the dielectric properties of the product and its variation as a
function of temperature.
Another important favorable aspect for this kind of heating is that an inverse
temperature gradient from the sublimation temperature to the free surface appears.
This situation is not a problem when the product is heated through the dry layer,
which happens in most cases, except when the vapor exit is limited as in freeze-
drying of solutions in vials. In these cases rigorous temperature control at the frozen
core is required to avoid melting. This inverse temperature gradient, if compared to
a conventional thermal gradient, favors mass transfer because it progresses in the
same direction as the moisture gradient.
The selective character of the product for absorbing dielectric energy is also
favorable to the drying process. The absorbing capacity of dielectric energy is
strongly affected by the moisture content. Thus, the loss factor (� �), one of the most
important properties that defi ne the microwave absorption of materials, is extremely
low in dried foods compared to ice or water. When employing microwave heating,
a peripheral dried zone will stay at a lower temperature while the wet frozen zone
will absorb the energy more intensively at the dried–frozen interface. Nevertheless,
there are problems related to the great increase of the loss factor with temperature
and the phase change from ice to liquid. Therefore, a tendency for the frozen zone to
melt if vapor removal is not adequate (i.e., evacuated at the same speed) could arise.
52527_C008.indd 22352527_C008.indd 223 10/3/2008 3:56:37 PM10/3/2008 3:56:37 PM
© 2009 by Taylor & Francis Group, LLC

224 Advances in Food Dehydration
Correct and controlled microwave heating will avoid thawing of the inner frozen
zone and make possible a regular advancing of the dried–frozen interface following
the geometry of the retreating nucleus up to complete removal of the frozen zone at
the end of primary drying.
Good control of the frozen nucleus temperature is a very important aspect for
success in running freeze-drying under microwave heating. The most recent research
on microwave drying and its industrial applications has incorporated adequate
techniques for correct monitoring of the temperature of the frozen nucleus and the
product, within an electric fi eld, based on optic fi ber and infrared thermometry. Using
such techniques, the product temperature can be followed precisely at the dried and
frozen zones during freeze-drying. The collected information can be used to adequately
regulate the process with a computerized control system (Rodríguez et al., 2005).
In the application of microwave heating it is necessary to explain some fundamental
aspects of this heating method. Microwave heating employs high frequency alternate
current from 300 MHz to 3 GHz. As a consequence of the polarization movement
at such frequencies, in which polar molecules of dielectric compounds (i.e., water)
attempt to align themselves with the rapidly alternating fi eld, great frictional heat is
developed that constitutes a heat source by itself that is not dependent on the thermal
gradient. In this case, the product placed in the dielectric active zone would generate
heat, which is distributed internally by conduction. The capacity of absorbing heat
per unit product volume (Pmw) is obtained by the Lambert’s law equation:
Pmw � 2pf �0 �� E 2 (8.32)
where f is the wave frequency (Hz), � is the permittivity, �0 is the vacuum permittivity,
and E is the electric fi eld (V/m) of the microwave at a certain location. Electric fi eld
E is expressed with respect to that of a reference E0 by
E � E0 exp(-xL/dp) (8.33)
where xL is the distance with respect to the electric reference fi eld E0.
The penetration depth (dp) and the loss tangent (tan d) are the most signifi cant
properties responsible for microwave heating. Moreover, the loss factor (� �) is
obtained from the dielectric constant (��) by
� � � tan d ◊ �� (8.34)
The penetration depth is defi ned as the depth below the surface of the material at
which the electrical fi eld strength is 1/e (e � 2.3010) that of free space (Ohlsson,
1989; Von Hippel, 1954):
o
p 2 0.5
2
2 [(1 tan ) 1]d
lp d¢
�� � �
(8.35)
Dielectric properties �� and � � constitute the real and imaginary components of
the known complex permittivity that gives an overall view of the capacity to transform
the electric energy of a microwave generator.
52527_C008.indd 22452527_C008.indd 224 10/3/2008 3:56:37 PM10/3/2008 3:56:37 PM
© 2009 by Taylor & Francis Group, LLC

Fundamentals and Tendencies in Freeze-Drying of Foods 225
Permittivity � or tan d are two forms that together express dielectric properties
�� and � �. Property �� indicates the material’s ability to capture energy, and property
� � is a measure of its ability to dissipate electrical energy into heat. Table 8.2 shows
the infl uence of temperature on the principal dielectric properties at two frequencies
that are often used.
Frequency has a big impact on penetration depth, which is higher at 913 MHz than
at 2.45 MHz. Nevertheless, when the temperature increases the difference of dp with
TABLE 8.2Values of Characteristic Dielectric Properties for Raw Potato as a Function of Temperature
Temp. (∞C)
� � ≤ tan d dp (cm)
915 MHz 2.54 GHz 915 MHz 2.54 GHz 915 MHz 2.54 GHz
0 16 21 0.23 0.3 5.5 1.6
20 19 15 0.29 0.23 4.5 2.2
40 24 13 0.41 0.23 3.4 2.2
60 31 14 0.58 0.27 2.5 2
80 35 17 0.8 0.34 2 1.7
10 48 18 1.06 0.41 1.6 1.5
Source: From Mudgett, R.E., Food Technol., 20, 84–98, 1986. With permission.
FIGURE 8.5 Scheme of a microwave freeze-dryer showing basic elements. (From Cotson, S.
and Smith, D.B., Freeze Drying of Foodstuffs, Columbia Press, Manchester, U.K., 1963. With
permission.)
Magnetrons
Condenser
Stirrermode
Vacuumchamber
Coolingsystem
Vacuumpump
Microwavecavity
52527_C008.indd 22552527_C008.indd 225 10/3/2008 3:56:37 PM10/3/2008 3:56:37 PM
© 2009 by Taylor & Francis Group, LLC

226 Advances in Food Dehydration
frequency becomes minimal. Although several frequencies have been used (Schmidt,
1958), the frequency of 2.45 GHz is almost the only one used in industrial and
commercial prototypes. Figure 8.5 provides a scheme of a microwave freeze-dryer.
A glass pipe is introduced into the vacuum chamber, which maintains the vessel at a
pressure as low as 200 or 300 μm (26 or 39.5 Pa). A condensation system is included
in the freeze-dryer.
The same equations used for mathematical freeze-drying can be used for the
mathematical description of lyophilization with microwave heating. In addition, the
heat generated per unit volume must be introduced through Eq. (8.32), taking into
account the electric fi eld for a certain coordinate given by Eq. (8.2). In it, xd would
be the distance to the electric fi eld of the outer adjoining volume.
A serious drawback can arise when applying a microwave under vacuum, that is,
gaseous ionization that may derive the phenomena of arch discharge with unfavor-
able consequences of scorching at the surface of freeze-dried materials (Arsem and
Ma, 1985). This can be avoided by reducing the power input or varying the total
pressure. Figure 8.6 shows the boundary lines that, depending on the frequency,
separate the upper or gas discharge zone from the lower one, where such a phenomenon
can be avoided.
8.6 INDUSTRIAL FREEZE-DRYING
There are no data about the fi rst freeze-drying installation. Meryman (1976) and
Jennings (1999) refer to Sackell as the fi rst person who used the term of freeze-drier
in an experimental apparatus used to dehydrate samples for biomedical purposes.
Nevertheless, there was no real freeze-drying installation until the 1930s, when
biologist Greaves designed a freeze-drier to dehydrate blood serum. However, the
big installations to create freeze-dried coffee, for example, appeared later with
companies like Nestlé and Taster’s Choice Coffee.
FIGURE 8.6 Combinations of electric fi eld and pressure for zone arch discharge risk.
0.01 0.1 1 10
E (
V/c
m)
Pressure (mm/Hg)
Ecr
Gas ionization
(Arch discharge)
52527_C008.indd 22652527_C008.indd 226 10/3/2008 3:56:37 PM10/3/2008 3:56:37 PM
© 2009 by Taylor & Francis Group, LLC

Fundamentals and Tendencies in Freeze-Drying of Foods 227
Later, several patents related to freeze-drying were attributable to the Canadian
engineer James Mercer between 1966 and 1972 (Mercer and Rowell, 1972; Tagashi
and Mercer, 1966). Such patents have been fundamental in the design of continuous
freeze-drying installations for the largest food companies during the last 40 years.
More than 400 different types of freeze-dryers were designed for industrial
purposes since the 1960s. There are references to a great variety of freeze-dried foods
such as fruits, meats, and extracts. Other foods (e.g., lettuce and watermelon) are not
recommended for freeze-drying because of their high water content and poor freeze-
drying properties. Freeze-dryers can be classifi ed into any of the following types.
8.6.1 LAB OR PILOT PLANT FREEZE-DRYERS
Lab or pilot plant freeze-dryers are employed in the food and pharmaceutical
industries to research the possibilities for preserving different kinds of foods or
medicines. In other cases, the target is tested on a pilot scale before full-scale
production. Most of these freeze-dryers are compact and have facilities for
refrigerating, heating, and vacuum in a sole cavity. Usually the condenser coils are
incorporated in the cavity (Figure 8.7). The food is introduced inside the cabinet in
carts whose shelves are connected to the corresponding fl exible conduits to enable
the passing of heating fl uid. The production of a pilot freeze-dryer does not usually
exceed 20 kg of frozen loaded product, and it can operate at a pressure of around
200 μm (26 Pa) or lower in the research prototypes.
8.6.2 BATCH FREEZE-DRYERS
These are the most extended and often found prototypes for industrial purposes.
There are two fundamental versions: trays and multicabinets. These cover product
FIGURE 8.7 Scheme of a pilot plant freeze-dryer. (From Gutcho, M.H., Freeze Drying Processes for the Food Industry, Noyes Data, Park Ridge, NJ, 1977. With permission.)
Refrigerantoutlet–inlet
Vacuummanifolds
To vacuumaspiration
Condenserplates
Place forcart food
Flexibleconduits in–outheating fluid
(a)
(b)
52527_C008.indd 22752527_C008.indd 227 10/3/2008 3:56:37 PM10/3/2008 3:56:37 PM
© 2009 by Taylor & Francis Group, LLC

228 Advances in Food Dehydration
abilities up to 2000 kg in a case where the tray surface is near 150 m2. The heating
device is usually incorporated into the trays, and its surface is a fundamental
production parameter. Consequently, depending on the heating surface, the following
prototypes can be considered: low production (from 7 to 27 m2), medium production
(up to 70 m2), and high production (up to 140 m2). This type of equipment can reach
drying capacities of around 300 kg/h, but the duration of the drying cycles will
depend on the maximum product temperature.
The design of a batch freeze-dryer has characteristics similar to the pilot one
but with bigger dimensions according to the production capacity. It consists of the
following essential elements:
Vacuum cabinet (vessel) with internal radiant plates and condenser coils•
Aluminum product trays and rack for easy loading and unloading•
External services for panel heating, vacuum generation, thawing of the •
condenser, and refrigerant separation
Control system•
Refrigerant system for the condenser, usually ammonia based•
The machines having low and medium capacities condensate all the sublimated
water without stopping the operation. However, those of greater production could
incorporate some deicing devices. The function of such a special condenser is
thawing and releasing the sublimated vapor during operation.
A batch plant is usually programmed to minimize drying time and to attain the
highest possible production. In some cases, a single cabinet cannot reach certain
production levels. Such a diffi culty could be augmented in plants processing many
special or complex products. Thus, when major production and fl exibility for treating
a great variety of foods are required, other batch prototypes are used. A good solution
for these cases are multibatch freeze-dryers that consist of a number of batch cabinets
programmed with staggered, overlapping drying cycles. Each cabinet can be loaded
with product of similar or different characteristics and served by a centralized system
for tray heating, refrigeration of condensers, and vacuum pumping. The process can
be individually controlled for each cabinet from an external control panel. Numerous
industrial freeze-dryers have been used for a long time in this way as multicabinet
batch plants (Goldblith et al., 1975).
8.6.3 CONTINUOUS OR TUNNEL FREEZE-DRYERS
Continuous installations can be used to process any product, depending on its nature
and where the economics of scale and operation require large production rates. This
type of freeze-dryer commonly uses radiant heating combined with automatic loading,
transport, and unloading of the product tray that passes through a tunnel cabinet. The
frozen product is continuously loaded onto portable trays (trolleys), which are then
placed into an automated control lock. The air lock is rapidly evacuated and the trays
are immediately moved into the vacuum vessel and transported between the radiant
heating panels so that sublimation occurs at the optimum rate for the product. The
heating panels are controlled from the outside. Thus, the heat history of the product
52527_C008.indd 22852527_C008.indd 228 10/3/2008 3:56:37 PM10/3/2008 3:56:37 PM
© 2009 by Taylor & Francis Group, LLC

Fundamentals and Tendencies in Freeze-Drying of Foods 229
can be adjusted to its specifi c needs during processing. A discharge air lock in the
other end releases the dry product from the vacuum tunnel and equalizes the pressure
vessel to the atmospheric one (Figure 8.8).
There are installations with two transport lines that can reach over an 800 m2
tray area. No contact of the product load with the equipment elements takes place
inside the vessel. Therefore, the freeze-dryer installation can operate uninterrupted
for different types of foods without opening up the machine for cleaning. Consequently,
adequate systems for tray fi lling and emptying must be provided in the installation.
Manufacturing techniques based on the use of continuous equipment have been
developed for instant coffee (Liapis and Bruttini, 1995).
8.6.4 SPECIAL FREEZE-DRYERS
Vacuum spray dryers are mentioned in this section because these facilities are espe-
cially used for processing beverages and liquid extracts such as coffee, tea infusions,
and milk. Liquids are fed and sprayed at the top of a cylindrical vacuum tower at
about 0.5 mmHg pressure. Drops of sprayed liquid will freeze into 150-mm diameter
particles during falling because they lose about 15% of their original moisture by
evaporation. Freeze-drying occurs in these frozen particles once collected in the
vacuum cabinet at the bottom of the tower (Figure 8.9).
The installation operates in continuous mode, and it is especially suitable for high
production of freeze-dried liquids. The most remarkable drawback in certain cases is
that considerable losses of fl avors and volatiles occur that are related to the fl ash
evaporation during the fi rst part of the process. This problem can present considerable
Gate valve
Vapor constriction plate
Electricalcontroller
Vacuumgauge
Aftvacuumlocks
Condensingchamber
To vacuum pumpVacuum joint(tunnel sections)
Food trolley movingbetween fixed heatingplatens
Forwardvacuumlocks
1 2 3 4 5
FIGURE 8.8 Continuous processing in a tunnel freeze-drier. (From Liapis, A.I. and Bruttini, R.,
in Handbook of Industrial Drying, Marcel Dekker, New York, 1995. With permission.)
52527_C008.indd 22952527_C008.indd 229 10/3/2008 3:56:37 PM10/3/2008 3:56:37 PM
© 2009 by Taylor & Francis Group, LLC
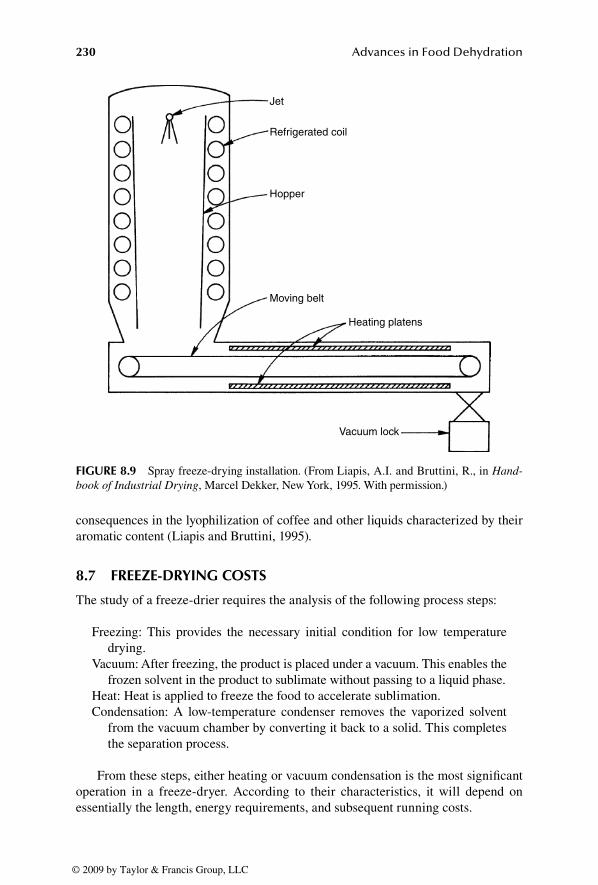
230 Advances in Food Dehydration
consequences in the lyophilization of coffee and other liquids characterized by their
aromatic content (Liapis and Bruttini, 1995).
8.7 FREEZE-DRYING COSTS
The study of a freeze-drier requires the analysis of the following process steps:
Freezing: This provides the necessary initial condition for low temperature
drying.
Vacuum: After freezing, the product is placed under a vacuum. This enables the
frozen solvent in the product to sublimate without passing to a liquid phase.
Heat: Heat is applied to freeze the food to accelerate sublimation.
Condensation: A low-temperature condenser removes the vaporized solvent
from the vacuum chamber by converting it back to a solid. This completes
the separation process.
From these steps, either heating or vacuum condensation is the most signifi cant
operation in a freeze-dryer. According to their characteristics, it will depend on
essentially the length, energy requirements, and subsequent running costs.
Jet
Refrigerated coil
Hopper
Moving belt
Heating platens
Vacuum lock
FIGURE 8.9 Spray freeze-drying installation. (From Liapis, A.I. and Bruttini, R., in Hand-book of Industrial Drying, Marcel Dekker, New York, 1995. With permission.)
52527_C008.indd 23052527_C008.indd 230 10/3/2008 3:56:38 PM10/3/2008 3:56:38 PM
© 2009 by Taylor & Francis Group, LLC

Fundamentals and Tendencies in Freeze-Drying of Foods 231
In estimating the effi ciency and costs of a freeze-drying plant, the following
circumstances must be thoroughly analyzed because of their great signifi cance: operating
reliability, loss of products, easy and good quality process control, and effi cient vapor
retention to facilitate vacuum operation. Depending on the freeze-dryer installation,
such aspects could have more or less signifi cance. Independent of the prototype, the
condensation temperature is an essential factor that directly affects the two most
important operations (heat transfer and vapor removal) involved in lyophilization.
The condensation temperature requires regulation to attain equilibrium between
the heat and mass fl uxes according to the possibilities of the heating supply and vacuum
ability of the facility. If the latter is large enough to obtain high vacuum levels (or
very low absolute pressure), the required condensation temperature does not need to
be extremely low except in the case of high drying rates and heating supplies. As a
rule, the higher the heat absorbed by the load is, the lower the temperature.
In any process an economic study requires knowledge of the interrelation of
operating variables and costs. A good analysis of costs is necessary to select the most
adequate variables for optimization purposes while searching for a compromise
between effi ciency and quality.
Fixed costs are mostly related to capital depreciation, loan charges, maintenance,
insurance, and taxes. These could exceed running costs twofold (Mellor, 1978; Saravacos
and Kostaropoulos, 2002). Because fi xed costs are independent of production and
type of foods, they are not usually taken into account in design analysis.
Variable costs in a food process are composed of storage, packaging, raw
material, energy, and investment. Among these costs the last three (running costs)
can change signifi cantly, depending on the type of food and characteristic of
installation. Moreover, their signifi cance will be higher with the value of the food. In
the freeze-drying of high value foods, the raw materials part does not usually exceed
66% of the variable costs whereas in low value foods this same cost fraction hardly
reaches 20% (Ratti, 2001). In low value foods, the running costs can reach an
important level (~70 or 80%) within the variable costs. Thus, the economic viability
of freeze-drying requires an in-depth analysis of all factors to compete against other
drying technologies, also taking into account the advantage of the excellent quality
of freeze-dried products.
The following fundamentals factors should be considered to enhance the
effi ciency of freeze-drying in order to extend its applicability not only to high value
foods but also to other less valuable foods:
1. Investments of the installation should not be excessive. Very expensive
installations leading to important depreciation costs above 30% would not
be recommendable.
2. The running costs are related to the operating characteristics of installation.
All those installations, operating in continuous, with an important degree
of automation, would be recommendable so that the costs related to
operations of loading, cleaning and emptying will be minimal.
3. Use of effi cient operational strategies that lead to reasonable lengths of
drying cycles and, consequently, with subsequent decrement of energy costs
for refrigeration of the condenser, heating, and vacuum pumping.
52527_C008.indd 23152527_C008.indd 231 10/3/2008 3:56:38 PM10/3/2008 3:56:38 PM
© 2009 by Taylor & Francis Group, LLC

232 Advances in Food Dehydration
In conclusion, the quality of dehydrated foods obtained by freeze-drying is a
very important factor to take into account in conjunction with the running costs.
Thus, a moderate or even high cost could be justifi ed when considering the advantages
of the quality of freeze-dried products with respect to other low quality products
obtained by low cost drying techniques.
NOMENCLATURE
VARIABLES
Co1 constant dependent only upon structure of porous matrix for D’Arcy fl ow
permeability
C1 constant dependent upon structure of porous medium (m) for relative
Knudsen permeability
C2 constant dependent upon structure of porous medium (m) for free gas bulk
diffusivity
Cp specifi c heat capacity of food (J/kg K)
De effective diffusivity of moisture during freeze-drying (m2/s)
Dg diffusivity of water vapor in gas phase (m2/s)
Dm diffusivity of liquid water through solid matrix (m2/s)
dp penetration depth (m)
Dw free gas diffusivity of water in air (m2/s)
D w 0 D w 0
= Dw P (N/s)
E electric fi eld (V/m) and characteristic dimension in spherical analogy (m)
E0 reference electric fi eld (V/m)
fv local fraction of vapor fl ux
fw(T) liquid–vapor equilibrium function (N/m2)
k thermal conductivity of product (W/m K)
ke effective thermal conductivity of product (W/m K)
Km external mass transfer for water vapor (kg/N s)
Kin Knudsen diffusivity for air (W/m K)
Kmx Knudsen diffusivity for binary mixture (W/m K)
Kw Knudsen diffusivity for water vapor (W/m K)
L side of cube (m)
M moisture content of product (kg water/kg dry basis)
Mb bound water of product (kg water/kg dry basis)
Min molecular weight of air (kg/kmol)
Mw molecular weight of water (kg/kmol)
MR moisture ratio or remaining frozen moisture, Eq. (8.12)
Nw total fl ux of water (kg/m2 s)
pw partial pressure of water vapor (N/m2)
P absolute pressure (N/m2)
Pmw heat dissipated by microwave heating (J/m3)
q heat fl ux (W/m2)
req equivalent radius of sphere (m)
R ideal gas constant (J/kmol K)
52527_C008.indd 23252527_C008.indd 232 10/3/2008 3:56:38 PM10/3/2008 3:56:38 PM
© 2009 by Taylor & Francis Group, LLC

Fundamentals and Tendencies in Freeze-Drying of Foods 233
S external surface of particle (J/kmol K)
t time (s)
T temperature (K)
Tg glass-transition temperature (K)
Tm melting temperature (K)
Tscor scorch temperature (K)
V volume of particle (m3)
xL distance from reference electric fi eld (m)
GREEKS
d thickness of dried layer (m) and loss angle
�Hs sublimation heat (J/kg)
�Hv vaporization heat (J/kg)
e porosity of dried product
� permittivity
� � dielectric constant
� � loss factor
k1 bulk diffusivity constant (m2/s)
k2 self diffusivity constant (m2/s)
lo wavelength in free space (m)
mmx viscosity of vapor phase in porous of dried layer (kg/ms)
r density of food (kg/m3)
tan d loss tangent
u velocity of retreating ice front (m/s)
um velocity of retreating ice front in terms of mass (kg/s)
y sphericity
SUPERSCRIPT
0 initial value
SUBSCRIPTS
av average value
center center of freeze-drying piece
cond surface of condenser coils
surf outer surface of freeze-drying piece
f frozen nucleus
g relative to water in gas phase
d relative to dried layer
l relative to liquid water
m relative to porous matrix
w relative to frozen water for r, Cp, and kd relative to dry layer
1 primary drying
2 secondary drying
52527_C008.indd 23352527_C008.indd 233 10/3/2008 3:56:38 PM10/3/2008 3:56:38 PM
© 2009 by Taylor & Francis Group, LLC

234 Advances in Food Dehydration
REFERENCES
Arsem, H.B. and Ma, Y.H., Aerosol formation during the microwave freeze dehydration of
beef, Biotechnol. Progr., 1, 104–110, 1985.
Boss, E.A., Filho, R.M., and Vasco de Toledo, E.C., Freeze drying process: Real time model
and optimization, Chem. Eng. Process., 43, 1475–1485, 2004.
Carter, G.F., A Cultural Geography, Holt, Rinehart and Winston, New York, 1964.
Cotson, S. and Smith, D.B., Eds., Freeze Drying of Foodstuffs, Columbia Press, Manchester,
U.K., 1963.
Goldblith, S.A., Rey, L., and Rothmayr, W.W., Freeze Drying and Advanced Technology,
Academic Press, London, 1975.
Gutcho, M.H., Freeze Drying Processes for the Food Industry, Noyes Data, Park Ridge,
NJ, 1977.
Harper, J.C. and Tapel, A.L., Freeze-drying of foods products, Adv. Food Res., 7, 171, 1957.
Jennings, T.A., Lyophilization: Introduction and Basic Principles, Interpharm Press, Denver,
CO, 1999.
Kochs, M., Körber, C., Heschel, I., and Nunner, B., The infl uence of the freezing process on
vapour transport during sublimation in vacuum freeze drying of macroscopic samples,
Int. J. Heat Mass Transfer, 36, 1727–1738, 1993.
Kochs, M., Körber, C., Nunner, B., and Heschel, I., The infl uence of the freezing process on
vapor transport during sublimation in vacuum freeze drying, Int. J. Heat Mass Transfer, 34, 2395–2408, 1991.
Kurz, W. and Fisher, D., Fundamentals of Solidifi cation, 3rd ed., Trans Tech Publications,
Aedermannsdorf, Switzerland, 1989.
Levinson, S.O. and Oppenheimer, F., Drying of frozen material by heat radiation, U.S. Patent
2,445,120, 1948.
Liapis, A.I. and Bruttini, R., Theory for the primary and secondary drying stages of the
freeze drying of pharmaceutical crystalline and amorphous solutes: Comparison
between experimental data and theory, Sep. Technol., 4, 144–155, 1994.
Liapis, A.I. and Bruttini, R., Freeze drying, in Handbook of Industrial Drying, 2nd ed.,
Mujumdar, A.S., Ed., Marcel Dekker, New York, 1995, pp. 309–343.
Liapis, A.I. and Litchfi eld, R.J., Optimal control of a freeze dyer. I: Theoretical development
and quasi steady state analysis, Chem. Eng. Sci., 34, 975–981, 1979.
Lombraña, J.I., De Elvira, C., and Villarán, M.C., Analysis of operating strategies in the
production of special foods in vials by freeze drying, Int. J. Food Sci. Technol., 32,
107–115, 1997.
Lombraña, J.I. and Díaz, J.M., Solute redistribution during the freezing of aqueous solutions
under instability conditions, Cryo-Letters, 8, 244–259, 1987.
Lombraña, J.I. and Villarán, M.C., Kinetic modeling of sublimation and vaporization in
low-temperature dehydration processes, J. Chem. Eng. Jpn., 26, 389–394, 1993.
Maroulis, Z.B. and Saravacos, G.D., Food Process Design. Food Science and Technology Series, Vol. 126, CRC Press, New York, 2003.
Mellor, J.D., Fundamentals of Freeze Drying, Academic Press, London, 1978.
Mercer, J.L. and Rowell, L.A., Continuous freeze drying system, U.S. Patent 3,648,379,
1972.
Meryman, H.T., Historical recollections of freeze drying, Dev. Biol. Stand., 36, 29–32,
1976.
Millman, M.J., Laipis, A.I., and Marchelo, J.M., An analysis of the lyophilization process
using a sorption–sublimation model and various operational policies, AIChE J., 31,
1594–1604, 1985.
Mudgett, R.E., Microwave properties and heating characteristics of foods, Food Technol., 40(6), 84–98, 1986.
52527_C008.indd 23452527_C008.indd 234 10/3/2008 3:56:38 PM10/3/2008 3:56:38 PM
© 2009 by Taylor & Francis Group, LLC

Fundamentals and Tendencies in Freeze-Drying of Foods 235
Nastaj, J., A mathematical modelling of heat transfer in freeze drying, in Drying ’91,
Mujumdar, A.S. and Filková, I., Eds., Elsevier Science Publishers, Amsterdam, 1991,
pp. 405–413.
Ohlsson, T., Dielectric properties and microwave processing, in Food Properties and Computer-Aided Engineering of Food Processing Systems, Singh, R.P. and Medina, A.,
Eds., Kluwer Academic, Amsterdam, 1989. pp. 7–92.
Ratti, C., Hot air and freeze-drying of high-value foods: A review, J. Food Eng., 49, 4, 311–319,
2001.
Rey, L., Advances in Freeze-Drying: Lyophilisation; Recherches et Applications Nouvelles,
Hermann, Paris, 1975.
Rodríguez, R., Lombrana, J.I., and Kamel, M., Kinetic and quality study of mushroom drying
under microwave and vacuum, Dry. Technol., 23, 2197–2213, 2005.
Sadikoglu, H. and Liapis, A.I., Mathematical modeling of the primary and secondary drying
stages of bulk solution freeze drying in trays: Parameter estimation and model discrim-
ination by comparison of theoretical results with experimental data, Dry. Technol., 15,
791–810, 1997.
Saravacos, G.D. and Kostaropoulos, A.E., Handbook of Food Processing Equipment, Springer, New York, 2002.
Schelenz, G., Engel, J., and Rupprecht, H., Sublimation during lyophilization detected by
temperature profi le and x-ray technique, Int. J. Pharm., 113, 133–140, 1995.
Schittkowski, K., NLPQL: A FORTRAN-subroutine for solving constrained non-linear
programming problems, Ann. Operat. Res., 5, 485–500, 1985.
Schmidt, W., Microwave generators coupled to a loaded cavity for dielectric heating of
foodstuffs, Electron. Appl., 19, 147–164, 1958.
Sheehan, P. and Liapis, A.I., Modeling of the primary and secondary drying stages of the
freeze drying products in vials: Numerical results obtained from the solution of a
dynamic and spatially multidimensional lyophilization model for different operational
strategies, Biotechnol. Bioeng., 60, 712–728, 1998.
Smithies, W.R., Design of freeze drying equipment for the dehydration of foodstuffs, Food Technol., 13, 610–614, 1959.
Song, C.S., Nam, J.H., Kim, C.J., and Ro, S.T., Temperature distribution in a vial during
free-drying of skim milk, J. Food Eng., 67, 467–475, 2005.
Tagashi, H.J. and Mercer, J.L., Freeze dried product and method, U.S. Patent 3,293,766,
1966.
Von Hippel, A.R., Dielectric and Waves, MIT Press, Cambridge, MA, 1954.
52527_C008.indd 23552527_C008.indd 235 10/3/2008 3:56:38 PM10/3/2008 3:56:38 PM
© 2009 by Taylor & Francis Group, LLC

52527_C008.indd 23652527_C008.indd 236 10/3/2008 3:56:38 PM10/3/2008 3:56:38 PM
© 2009 by Taylor & Francis Group, LLC

237
9 Rehydration and Reconstitution of Foods
Alejandro Marabi and I. Sam Saguy
CONTENTS
9.1 Introduction ............................................................................................. 237
9.2 Rehydration of Foods .............................................................................. 239
9.3 Rehydration Measurements and Indices Utilized ................................... 241
9.4 Mathematical Modeling .......................................................................... 242
9.4.1 Diffusion Model ........................................................................... 243
9.4.2 Empirical and Semiempirical Models ......................................... 244
9.4.3 Capillary Flow in Porous Media .................................................. 246
9.5 Utilizing Weibull Distribution in Modeling Rehydration Process .......... 248
9.6 Pretreatments and Their Effects on Food Structure ............................... 250
9.7 Drying Methods and Their Effects on Product’s Physical Properties .... 253
9.8 Rehydration Conditions and Their Effects on Process Kinetics ............. 256
9.9 Physical Properties of Dried Foods and Their Effect on Rehydration ....... 262
9.10 Leaching of Solids .................................................................................. 267
9.11 Sensory Aspects ...................................................................................... 269
9.12 New Approaches and Recent Advances .................................................. 272
9.13 Research Needs ....................................................................................... 274
9.14 Conclusions ............................................................................................. 275
Nomenclature ..................................................................................................... 275
Abbreviations and Variables ................................................................... 275
Greeks ..................................................................................................... 276
References .......................................................................................................... 277
9.1 INTRODUCTION
In the last decade, there has been a continuous rise in the demand for convenience
foods, including dehydrated products, that is mainly attributable to modern lifestyles.
This trend has been accompanied by a decrease in the ability, desire, or time to
prepare food and an increase in fi nancial means, leading consumers to choose foods
that are readily available and convenient and require only minimal or no preparation
before consumption (Tillotson, 2003). One of the methods utilized to produce
convenience foods is dehydration of fresh products. The resulting dried foods present
52527_C009.indd 23752527_C009.indd 237 10/3/2008 3:58:53 PM10/3/2008 3:58:53 PM
© 2009 by Taylor & Francis Group, LLC

238 Advances in Food Dehydration
important advantages, such as low transportation costs, extended shelf-life stability,
and ease of use. The latter represents an important consumer expectation, and it is
often translated as the need to add only hot or cold water to the dry ingredients and
mix or simmer for a short period of time in order to achieve rehydration and recon-
stitution of the product. High quality and fl avor, nutritional value, and resemblance
to the fresh product are typical important traits that need to be taken into account in
order to meet consumer expectations and quality standards. Safety, nutritional, and
sensory aspects of foods are often related to the rehydration process as well as to the
severity of the drying process used. To achieve maximum quality and the desired
hedonic and food characteristics, optimum processing conditions should be targeted,
namely, those that result in minimal nutritional losses and optimal sensory traits
(Rahman, 2005).
Numerous dried products are either consumed or further utilized for various
industrial applications. Today, dried vegetables are used extensively in instant dry
soups, ready-to-eat meals, snack foods, and seasoning blends, to name only a few.
Vegetables that are commonly dehydrated and used for rehydration include carrots,
potatoes, peppers, mushrooms, corn, onions, beets, parsley, horseradish, garlic,
green beans, and celery. Fruits, legumes, cereal grains, fi sh, pasta, meat, and extruded
breakfast cereals, among others, are also used in dried form or after rehydration,
usually in water or milk.
During the rehydration process, the dry material, which is submerged in water or
some other aqueous medium, undergoes several simultaneous physicochemical changes
(e.g., in moisture and solids content, porosity, volume, temperature, gelatinization,
and texture). The rehydration involves various processes running in parallel, including
imbibition of liquid into the dried material, transport of the liquid through the porous
network and diffusion through the solid matrix, swelling of certain domains in the
solid matrix, and leaching of soluble solids into the external liquid. As a result of all
of these processes, rehydration of dry foods is a very complex phenomenon that
involves several different, simultaneously occurring physical mechanisms.
An important distinction needs to be made between two terms that are often used
in the literature; although similar, their meaning should be clearly stated. The fi rst
term is rehydration, which relates to the amount of water a dry food is able to absorb
in a given period of time. This term is usually associated with the kinetics and tech-
nological aspects of the process. The second term is reconstitution, which denotes
the state of the product after the uptake of liquid and is related to the sensory aspects
of the process; that is, how much the reconstituted sample resembles the original
fresh product before it was dried. Note that in most cases (breakfast cereals being a
typical exception, an al dente product may be another such exception) the aim is to
shorten the rehydration and reconstitution time and minimize the effort required by
the consumer to achieve a fast, convenient, and tasty meal.
Past studies of the rehydration process were carried out in conjunction with, and
by analogy to, studies of drying kinetics. However, in the last decade, it has been fre-
quently demonstrated that the rehydration process is not the reverse of dehydration.
Consequently, the need to better understand different aspects of the rehydration of
dried foods has been reemphasized. This trend is clearly evidenced by a signifi cant
increase in the number of publications focusing on rehydration (Figure 9.1).
52527_C009.indd 23852527_C009.indd 238 10/3/2008 3:58:53 PM10/3/2008 3:58:53 PM
© 2009 by Taylor & Francis Group, LLC

Rehydration and Reconstitution of Foods 239
The objective of this chapter is to highlight the most relevant issues related to the
rehydration and reconstitution of dried foods. In addition, detailed information is
provided on measurement techniques, microstructural properties of dried foods and
changes during rehydration, effects of various rehydration conditions on the kinetics
and sensory aspects of the process, and mathematical modeling of the rehydration
kinetics. A special section also deals with recent advances in the fi eld and specifi c
recommendations for future research. However, the wetting, dissolution, and
rehydration of powders, as well as other related topics, are not covered here because
they require special attention and are beyond the scope of this chapter. Hence, our
treatment focuses on the rehydration and reconstitution of nondissolving solid foods
in liquid media.
9.2 REHYDRATION OF FOODS
The rehydration of dried foods is a fundamental unit operation in the food industry.
It is also performed on the consumer scale, for which a fast and easy process is often
of the utmost importance. The quality of rehydrated and reconstituted products is
affected by the drying conditions and rehydration processes utilized, ultimately
infl uencing consumer acceptance. During the drying process, physicochemical
changes, including textural and structural modifi cations, migration of solutes, and
loss of volatiles and nutrients, occur in an irreversible manner and have an impact on
the quality of the fi nal product. Therefore, the drying process needs to be understood
and controlled in order to create a dried product with optimal nutritional, sensorial,
and rehydration characteristics. Other chapters in this book provide detailed
descriptions of the different drying methods utilized in the food industry and their
Year
Num
ber
of p
ublic
atio
ns
01997 1998 1999 2000 2001 2002 2003 2004 2005 2006
10
20
30
40
50
60
70
FIGURE 9.1 Number of studies published in books, journals, and conference proceedings
during the last 10 years according to the FASTA database in June 2007 (keyword: rehydration).
52527_C009.indd 23952527_C009.indd 239 10/3/2008 3:58:53 PM10/3/2008 3:58:53 PM
© 2009 by Taylor & Francis Group, LLC

240 Advances in Food Dehydration
effects on the fi nal product, and they are therefore not detailed here. Note, however,
that in order to obtain satisfactory rehydration and reconstitution properties, the
drying and rehydration conditions need to be mutually optimized. The rate and
extent of rehydration may be used as an indicator of the quality of the dried product:
foods that are dried under optimum conditions suffer less damage and rehydrate
more rapidly and completely than poorly dried foods.
Food rehydration is a topic of extensive interest, particularly in the case of
legumes, fruits and vegetables, cereal grains, dried fruits, extruded cereal products,
pasta, breakfast cereals, fi sh, and so forth. This interest is refl ected in the steady
increase in the number of studies published in the last few years (Figure 9.1) that seek
to better understand and improve the process. Nevertheless, the number of articles is
quite small relative to those relating to the drying of food products or to other unit
operations, such as deep-fat frying.
The most fundamental aspect of rehydrating a dried food is related to water
absorption, and it is expressed by the ratio commonly termed the rehydration capacity
(RC; Lewicki, 1998b):
RC � Xt ___ X0
(9.1)
where Xt is the weight after a given rehydration time and X0 is the initial weight of
the dry sample. Typical values for the rehydration capacity range between ~2 and 7.
The other criterion utilized to describe reconstitution (RE) is defi ned as
RE � Xt __ Xi
(9.2)
where Xi is the initial weight of the sample before drying.
Typical values are often lower than 1, mainly because of the changes occurring
during the drying process. For samples dried under optimal conditions, a value very
close to 1 can be achieved in a relatively short time if the rehydration conditions are
also optimized.
As might be expected (and discussed further on), during rehydration, solids can
leach from the food product to the medium. To overcome this problem, the concept
of nondissolvable solids (NDS), defi ned as the amount of solids after all dissolvable
solids have leached out, was proposed (Marabi, Dilak et al., 2004). The amount of
NDS can be determined when adequate time has passed, allowing the establishment
of quasiequilibrium: at this stage, the solids remaining in the sample are practically
nondissolvable. For realistic situations, the NDS should be determined after the
shortest time possible to ensure sample integrity and avoid its disintegration (Marabi,
Dilak et al., 2004). Thus, the rehydration ratio (RR) can be defi ned as
RR � Wt � W0 _______ W � W0
(9.3)
where Wt, W0, and W are the water contents at time t, initial time t0, and infi nite
time t , respectively.
Typical RR values for short rehydration times (e.g., 3 min) range from 0.2 to 0.6
for air-dried (AD) and freeze-dried (FD) carrots, respectively. Values of ~0.3 were
52527_C009.indd 24052527_C009.indd 240 10/3/2008 3:58:53 PM10/3/2008 3:58:53 PM
© 2009 by Taylor & Francis Group, LLC

Rehydration and Reconstitution of Foods 241
observed for FD peas, whereas FD corn, potatoes, and beets yielded RR values close
to 0.8. The equilibrium RR value is usually independent of the drying method and
asymptotically reaches a value close to 1.
The principal factors affecting the rehydration kinetics and reconstitution may
be divided into two main groups: those related to the dry particulate solid, and those
related to the external rehydration medium. In the fi rst group, the particle geometry,
water content, porosity, tortuosity, density, and physical state of the sample can play
a paramount role, affecting the speed and quality of the reconstitution. In the second
group, the medium temperature, mixing regime, density, viscosity, composition, and
presence of insoluble matter can play a determining role.
The most common approach to describing the mechanism of liquid uptake during
the rehydration of dry foods is diffusion. By making several assumptions and solving
Fick’s laws, the value of the effective diffusivity (Deff) can be derived from experi-
mental data. However, in one study the derived values included, in addition to trans-
port due to diffusion, contributions of all other mechanisms (e.g., bulk fl ow, capillary
fl ow) that play a signifi cant role during the process and take place simultaneously
(see Waananen et al., 1993, for the possible mechanisms occurring during drying).
One of these mechanisms may prevail in each specifi c case, depending mainly on the
microstructure of the product and the physicochemical properties of the liquid
(Saguy et al., 2005b).
Typical Deff values for moisture in foods range from 10–8 to 10–12 m2/s, generally
being closer to 10–10 m2/s (Doulia et al., 2000; Maroulis et al., 2001), and they are
infl uenced by temperature (Bello et al., 2004; Cunningham et al., 2007; Garcia-
Pascual et al., 2005, 2006; Kaymak-Ertekin, 2002; Sanjuan, Carcel et al., 2001;
Sanjuan, Clemente et al., 2001), water content (Maroulis et al., 2001; Vagenas and
Karathanos, 1991), pressure (Karathanos et al., 1991), physical properties (Marousis
et al., 1991; Waananen and Okos, 1996), and the dried food’s structure (Ruiz-
Cabrera et al., 1997). In turn, the latter is signifi cantly affected by the pretreatments
and drying processes utilized in its production. It is generally accepted that the main
resistance to liquid ingress is usually encountered in the dried food’s matrix.
However, increased viscosity of the liquid medium and the presence of nondissolved
and/or dispersed particles, as well as fat, may also have detrimental effects on
rehydration rates.
Rehydration is a complex phenomenon that requires careful consideration.
Previous data have not been consistent and include various methods to describe both
rehydration and reconstitution. Careful consideration is needed when data from
various sources are compared.
9.3 REHYDRATION MEASUREMENTS AND INDICES UTILIZED
As mentioned earlier, in the last few years the study of the rehydration process of
dried foods has attracted a great deal of attention. When comparing published works
on rehydration, it is common to fi nd inconsistencies in the measuring procedures and
calculations of the rehydration indices for dried foods. The most signifi cant sources
of variability in the experimental procedures when measuring the rehydration of
dried foods reside in the ratio between the dry sample and the liquid, ranging from
52527_C009.indd 24152527_C009.indd 241 10/3/2008 3:58:53 PM10/3/2008 3:58:53 PM
© 2009 by Taylor & Francis Group, LLC

242 Advances in Food Dehydration
1:5 to 1:50; the temperature of the rehydrating media, ranging from 5 to 100°C; the
time of the experiment, usually between a few minutes and 24 h; and the hydrody-
namic conditions, which vary from stagnant liquid to high-mixing regimes. Moreover,
different studies examine either one or several particles, which are returned, or not,
to the rehydration liquid after weighing, according to the method utilized. The
samples are sometimes blotted on paper, drained in a sieve, or centrifuged to remove
excess liquid on their surface (Lewicki, 1998b). These differences make compari-
sons between different studies diffi cult. Consequently, use of the calculated rehydra-
tion indices in a modeling attempt might lead to erroneous results.
Compilations of data for drying methods and weight ratios, temperature, and
time of immersion have shown that the rehydration process can be expressed by a
variety of different indices (e.g., g H2O/g dried product, g H2O/g dry solids, g
rehydrated product/g dried product, g H2O/g rehydrated product, g H2O/g fresh
product, etc.; Oliveira and Ilincanu, 1999). Another common reason for discrepan-
cies in the reported values is the leaching of soluble solids, which takes place while
the liquid is being absorbed into the dried food sample. A number of studies (Ilincanu
et al., 1995; Lewicki, 1998a; Lucas et al., 2007; Machado et al., 1997, 1998; Marabi,
Dilak et al., 2004; Oliveira and Ilincanu, 1999; Vidal et al., 1992) have demonstrated
the magnitude of this phenomenon. Thus, it is clear that it should be considered when
reporting values based on the weights of the sample before, during, or after
rehydration.
These examples clearly demonstrate the need to standardize the way in which
the data are collected and presented. It is therefore recommended that information
be provided on a dry-weight basis, taking into consideration the possibility of solids
leaching out from the original dried product. This is further discussed in Section
9.10 [see also Eq. (9.3)]. Alternatively, the solids leached during the rehydration
process have not been considered, and the consequent error in the mass of the rehy-
drated sample, which is not entirely due to water uptake, should be addressed.
9.4 MATHEMATICAL MODELING
As pointed out previously, the rehydration and reconstitution of dried foods is a
complex process. Experimental data for the rehydration of a large number of foods
under different conditions exist in the literature and can be utilized to model the
process. The use of different mathematical models facilitates the understanding of
some of the process characteristics, provides insight into the governing mechanisms
taking place, and could ultimately lead to improved processing conditions and end-
user products. Liquid uptake is typically modeled by applying an empirical and/or
quasimechanistic approach based on a physical model, which can be exemplifi ed in
the application of the Weibull distribution function and Fick’s second law of diffusion,
respectively. The latter is mathematically formulated from the process’s basic physical
principles. It requires an in-depth understanding of the process, together with a careful
evaluation of the physical properties of the food matrix. The effi ciency of these models
is typically limited to approximations because of the complex process interrelation-
ships that are very diffi cult to quantify. In contrast, the development of empirical
models requires considerably less effort. The basic idea of empirical-process
52527_C009.indd 24252527_C009.indd 242 10/3/2008 3:58:54 PM10/3/2008 3:58:54 PM
© 2009 by Taylor & Francis Group, LLC

Rehydration and Reconstitution of Foods 243
characterization is to consider the process as a “black box,” varying specifi c input
setup parameters, measuring output quantities, and deriving the adequate correlations.
In this way, statistically designed experiments offer a valid basis for developing an
empirical model, which establishes a formal relation between the input and output
quantities. However, empirical models are limited by their boundary conditions and
are nontransferable (Saguy et al., 2005b).
In recent years, the fi eld of food science has been experiencing an encouraging
transition from an empirically based approach to physically based models that basi-
cally consider food as a porous medium (see Sections 9.12 and 9.13). Nevertheless,
most rehydration studies reported in the literature still include physically based and
empirical models to describe the mechanisms of liquid uptake, solids leaching, and
the kinetics of the processes. Fick’s laws of diffusion and their derived equations
account for the vast majority of the models utilized in food science, as can be
observed from recent publications (e.g., Ade-Omowaye et al., 2002; Bello et al.,
2004; Bilbao-Sainz et al., 2005; Cunningham et al., 2007; Debnath et al., 2004;
Falade and Abbo, 2007; Garcia-Pascual et al., 2005, 2006; Kaymak-Ertekin, 2002;
Nayak et al., 2006; Sanjuan, Carcel et al., 2001; Sanjuan et al., 1999). Diffusivity
values for various foods undergoing several processes can be found in different com-
pilations (Doulia et al., 2000; Saravacos and Maroulis, 2001). However, recent data
indicate that the actual mass-transport process may not be restricted to diffusion and
could include several other mechanisms. Other theories, based mainly on the
Washburn equation, are being used to model liquid movement into dried foods
(Aguilera et al., 2004; Moreira and Barrufet, 1998; Saguy et al., 2005a; Weerts et al.,
2003a,b), which are described in more detail in Section 9.12. The close similarities
between dried foods and porous media, and the fact that other scientifi c fi elds (e.g.,
soil and petroleum sciences, chemical engineering) utilize well-established physi-
cally based models for describing transport processes, are leading food scientists to
undertake a multidisciplinary approach to further develop their understanding of the
transport phenomena occurring in different processes.
Application of the diffusion model and a few other empirical models used for
studying the rehydration process is reviewed in the following subsections.
9.4.1 DIFFUSION MODEL
The diffusion model is a combination of physical and empirical approaches, founded
on Fick’s fi rst and second laws:
Jx � �Deff dW ___ dx
(9.4)
∂W ___ ∂t � Deff
∂ 2W ____ ∂x2 (9.5)
where Jx is the fl ux (kg H2O/m2 s), W is the moisture content (kg H2O/m3), x is the
spatial coordinate (m), t is the time (s), and Deff is the effective diffusion coeffi cient
of water (m2/s).
The Deff is derived from Fick’s second law and is an apparent value that comprises
all of the factors involved in the process. This approach is quite common and allows
52527_C009.indd 24352527_C009.indd 243 10/3/2008 3:58:54 PM10/3/2008 3:58:54 PM
© 2009 by Taylor & Francis Group, LLC

244 Advances in Food Dehydration
the straightforward derivation of Deff. However, it is well documented that mechanisms
of mass transfer other than molecular or Fickian diffusion may also occur. One of the
main drawbacks of utilizing Fick’s laws is that most assumptions made for solving
the partial differential equation [Eqs. (9.4) and (9.5)] are at best only partially valid.
As a consequence, valuable insight is lost or cannot be retrieved from the experimental
data. Some of the common assumptions and simplifi cations often made for solving
Fick’s second law include the following:
The process is controlled by diffusion and no other transport mechanisms •
are active.
Fick’s law holds for the diffusion of unreacted water.•
The diffusion coeffi cients are independent of moisture concentration.•
The matrix is uniform and isotropic.•
The initial moisture content is uniform in the sample and the surface attains •
saturation moisture instantly.
The boundary-layer resistance is much smaller than the internal resistance.•
Mass-diffusivity and reaction-rate constants are independent of concentration.•
Shrinkage and swelling during the process are negligible.•
The sample is considered an approximation of a sphere, cylinder, or slab •
and is representative of the actual geometry.
Heat transfer equations are ignored.•
Despite the fact that these assumptions are only partially valid, at best, the
Fickian approach is frequently utilized to model a wide range of transport phenomena
in foods, including drying (Doymaz, 2007; Falade and Abbo, 2007; Jambrak et al.,
2007; Kaymak-Ertekin, 2002), rehydration (Cunningham et al., 2007; Falade and
Abbo, 2007; Garcia-Pascual et al., 2006; Meda and Ratti, 2005; Nayak et al., 2006;
Sanjuan, Clemente et al., 2001), and leaching of soluble solids (Debnath et al., 2004),
among others. These phenomena include both the transport of liquids in solids and
the movement of solutes in the liquid phase. Modeling of the rehydration process by
means of Fick’s laws of diffusion provides some insight into the rehydration process
and allows a comparison of how different process parameters affect the overall
transport phenomena. The utilization of Fick’s laws will probably continue in the
future, because it is a solidly based method. However, the pitfalls should be carefully
considered when utilizing this approach in order to obtain a more accurate description
of the underlying processes.
9.4.2 EMPIRICAL AND SEMIEMPIRICAL MODELS
Several other empirical and semiempirical mathematical models are utilized when
studying the rehydration process. In particular, there are six models that are often
used, the equations for which are found in Table 9.1:
1. Exponential model [Eq. (9.6); Misra and Brooker, 1980]
2. Peleg’s model [Eq. (9.7); Abu-Ghannam and McKenna, 1997; Bilbao-
Sainz et al., 2005; Cunningham et al., 2007; Garcia-Pascual et al., 2006;
52527_C009.indd 24452527_C009.indd 244 10/3/2008 3:58:54 PM10/3/2008 3:58:54 PM
© 2009 by Taylor & Francis Group, LLC

Rehydration and Reconstitution of Foods 245
Giraldo et al., 2006; Hung et al., 1993; Machado et al., 1998; Maskan, 2002;
Peleg, 1988; Planinic et al., 2005; Ruiz-Diaz et al., 2003; Sacchetti et al.,
2003; Sopade et al., 1992; Turhan et al., 2002]
3. First-order kinetics [Eq. (9.8); Chhinnan, 1984; Gowen et al., 2007; Krokida
and Marinos-Kouris, 2003; Krokida and Philippopoulos, 2005; Machado
et al., 1998; Maskan, 2001; Pappas et al., 1999]
4. Becker’s model [Eq. (9.9); Becker, 1960; Fan et al., 1963; Lu et al.,
1994]
5. Weibull distribution function [Eq. (9.10); Cunha, Oliveira, and Ilincanu,
1998; Cunha, Oliveira, and Oliveira, 1998; Cunningham et al., 2007; Garcia-
Pascual et al., 2006; Machado et al., 1997, 1998, 1999; Ruiz-Diaz et al.,
2003; Sacchetti et al., 2003]
6. Normalized Weibull distribution function [Eq. (9.11); Marabi, Dilak et al.,
2004; Marabi, Jacobson et al., 2004; Marabi and Saguy, 2004, 2005; Marabi
et al., 2003]
Among the empirical models, the Weibull distribution function is frequently
used and has recently been improved to describe the rehydration of dried foods
(see Section 9.5).
All of these empirical models provide an excellent basis for curve fi tting and
allow process representation as a function of the physical properties and conditions
of both the rehydration medium and the rehydrating food particles. However, they
offer rather limited insight into the fundamental principles involved, hindering an
understanding of the transport mechanisms that are actually taking place.
TABLE 9.1Empirical Models Frequently Used in Curve Fitting of Rehydration Data
Model Formula Eq.
Exponential model Mt � Me _______ M0 � Me
� exp(�P1tP2) (9.6)
Peleg’s model Mt � M0 � t __________ (P3 + P4 ¥ t)
(9.7)
First-order kinetics Mt � Me _______ M0 � Me
� exp(�P5t) (9.8)
Becker’s model Mt � M0 � �M0 � 2 ___ √
__ p (Ms � M0) ( S __
V ) √
___ Deff √
__ t (9.9)
Weibull distribution function Mt ___ Me
� 1� exp [ � ( t __ a ) b ] (9.10)
Normalized Weibull distribution function Wt � W0 ________ We � W0
� 1� exp [ � ( t Deff Rg ___________ L2
) b ] (9.11)
Note: See Nomenclature for terms.
Source: Reprinted from Saguy, I.S. et al., Trends Food Sci. Technol. 16, 495–506, 2005b. Copyright 2005
Elsevier. With permission.
52527_C009.indd 24552527_C009.indd 245 10/3/2008 3:58:54 PM10/3/2008 3:58:54 PM
© 2009 by Taylor & Francis Group, LLC

246 Advances in Food Dehydration
9.4.3 CAPILLARY FLOW IN POROUS MEDIA
In an attempt to study the rehydration process further without having to rely on the
common postulation that it is governed by Fickian diffusion, numerous investiga-
tions have been conducted on the utilization of mathematical models based on
capillary fl ow in porous media to describe the data obtained experimentally. These
models are derived from the well-known Washburn equation (also referred to as the
Lucas–Washburn or Washburn–Rideal equation). Rehydration studies of dried plant
tissues reveal a very complex phenomenon involving different transport mecha-
nisms, including molecular diffusion, convection, hydraulic fl ow, and capillary fl ow
(Saravacos and Maroulis, 2001). Several research groups have also suggested that
the ingress of liquid into a dried food sample occurs by various mechanisms occurring
in tandem (Chiralt and Fito, 2003; Hallstrom, 1990; Marabi and Saguy, 2005; Marabi
et al., 2003; Martinez-Navarrete and Chiralt, 1999; Oliveira and Ilincanu, 1999). The
contribution of mechanisms involving mass fl ux attributable to a temperature
gradient (Soret effect) is considered insignifi cant and is therefore often disregarded
(Datta, 2007a). Several studies utilizing the Washburn equation to represent the
movement of liquids into porous food matrices are reviewed here. Some of the most
common models that are based on the Washburn equation and that have been applied
in food science are listed in Table 9.2 along with their equations.
A model of capillary rise in porous media was used to explain the linear relation-
ship between oil uptake and contact angle for deep-fat fried foods (Pinthus and
Saguy, 1994). A similar approach was used later (Moreira and Barrufet, 1998) to
analyze the mechanism of oil absorption of tortilla chips during cooling after frying.
The assumption was that a “microscopically uniform” porous medium is formed,
TABLE 9.2Washburn-Based Models Frequently Utilized in Rehydration of Foods
Model Formula Eq.
Horizontal capillary (short time) h � √ ________
r g cos(d)
________ 2t2m t (9.12)
Equilibrium liquid rise (long time) y(t) � k1 __ k2
[ 1 – exp ( – k2y(t)
_____ k1
) exp ( – k
2 2 t ___
k1
) ] (9.13)
k1 � r g cos(d )
________ 4m k2 �
r2gr ____ 8m
Capillary imbibition (initial slope
of uptake vs. ÷t)C �fr √ _________
r g cos(d) _________ 2m
(9.14)
Porous media (mixed-form
unsaturated capillary fl ow)
∂y
___ ∂t �—(K—h) � —[K sin(j)] (9.15)
Note: See Nomenclature for terms.
Source: Reprinted from Saguy, I.S. et al., Trends Food Sci. Technol., 16, 495–506, 2005b. Copyright
2005 Elsevier. With permission.
52527_C009.indd 24652527_C009.indd 246 10/3/2008 3:58:54 PM10/3/2008 3:58:54 PM
© 2009 by Taylor & Francis Group, LLC

Rehydration and Reconstitution of Foods 247
that is, a simplifi cation was made by assuming that an average pore-size distribution
existed. More recently, the rates of sunfl ower oil penetration into beds of chocolate
crumbs were measured from the oil front observed in a horizontal position. In
contrast to the two previous studies, the time dependency of the process was studied
by means of the Washburn model, which agreed with the measured data. It was
concluded that the penetration rates were solely governed by the Laplace capillary
pressure (Carbonell et al., 2004). Another study showed that fat migration in choco-
late conforms to the general shape of the capillary-rise curve predicted by the
Washburn equation (Aguilera et al., 2004). For the imbibition of water into dried
porous foods, it was also shown that the process followed the general Washburn
equation (Lee et al., 2005; Saguy et al., 2005a). However, discrepancies related to the
utilization of a single “effective” cylindrical capillary and a constant contact angle
were also reported (Saguy et al., 2005a). An additional factor that may be responsible
for the inaccuracies encountered when comparing experimental data with the
Washburn equation may be related to the tortuosity of the pores within the food
sample. The pore network is often regarded as a bundle of cylindrical and straight
capillaries with a determined effective radius. Thus, the Washburn equation may be
utilized in its original form (Aguilera et al., 2004) or otherwise corrected with a
tortuosity factor [e.g., Eq. (9.12) in Table 9.2; Carbonell et al., 2004].
A few other studies arrived at similar conclusions with regard to the mechanisms
of water movement during various common processes in the food industry. For
instance, it was proposed that during vacuum osmotic drying (VOD) the water trans-
fer results from a combination of traditional Fickian diffusion and vacuum capillary
fl ow, especially during the fi rst few hours. Shi and Fito-Maupoey (1994) proposed
that the capillary fl ow function was closely related to the porosity of the apricot fruit
being tested. Hills et al. (1996) used a radial nuclear magnetic resonance (NMR)
microimaging technique to study rehydration of pasta, and they concluded that the
rehydration was a non-Fickian process. Transport mechanisms other than diffusion
were reported during OD of apples. The proposed alternatives included capillary
penetration or another fast transport mechanism occurring near the interface of the
samples (Salvatori et al., 1999).
More recently, and as a consequence of the these fi ndings, a further step was
undertaken in which various groups started applying the theory of capillary imbibi-
tion for modeling the rehydration of foods. A capillary-fl ow approach was utilized
(Weerts et al., 2003a,b) to model the temperature and anisotropy effects during the
rehydration of tea leaves according to Eq. (9.15) in Table 9.2. The predicted values
agreed well with the experimental data derived from NMR measurements, leading
to the conclusion that the physically based constitutive relationships of water activity
and hydraulic conductivity could be utilized to overcome the simplifi cation of
modeling water transport as a process governed by Fick’s laws. The approach could
be extended to include gravity and osmotic pressure effects and also coupled with
heat and solute transport in porous media for modeling heat, water, and chemical
transport in general hydration and drying operations of porous food materials.
Singh et al. (2004) noted in their study that one of the salient features of fl uid
transport through biological systems is the complex fl ow path presented by the bio-
polymeric matrix, thus expanding the approach. Similarly, it was recently proposed
52527_C009.indd 24752527_C009.indd 247 10/3/2008 3:58:54 PM10/3/2008 3:58:54 PM
© 2009 by Taylor & Francis Group, LLC

248 Advances in Food Dehydration
that use of an “effective” single cylindrical capillary radius is the simplest possible
model to describe capillary penetration into a porous medium and that this model
may be insuffi cient in many cases (Saguy et al., 2005a), especially when a signifi cant
distribution of pore sizes exists (Marmur and Cohen, 1997), as previously shown for
dried foods (Karathanos et al., 1996). More specifi cally, and depending upon the
type of food and its processing history, it may contain pores ranging in radius from
0.1 to 300 μm, but pores in the 10 to 300 μm range are the most common (Bell and
Labuza, 2000).
Note that in the fi eld of chemical engineering the capillary model has also been
widely studied and is continuously being improved. One such work by Marmur and
Cohen (1997) utilized the kinetics of liquid penetration to characterize various porous
media. They showed that it is possible to independently evaluate the effects of the pore
radius (r) and cosine contact angle [cos(d )], thus offering a possible solution for the
cited discrepancies. This was demonstrated for the case of a single vertical cylindrical
capillary and for the case of a parallel assembly of vertical cylindrical capillaries
(i.e., when a signifi cant distribution of pore sizes exists). The developed model might
be extended to evaluate the capillary mechanism taking place during the rehydration
of food samples, leading to more accurate and representative results. Studies of
vertical liquid penetration were recently presented based on Eq. (9.14) (Saguy et al.,
2005a) and Eq. (9.13) (Lee et al., 2005), which are provided in Table 9.2. However,
in neither case was the contact angle value appropriately resolved.
Although numerous models have been proposed and frequently applied,
additional improvements are required before modeling of the process based on the
real mechanisms that are occurring becomes possible. Nevertheless, recent studies
toward more fundamental physically based approaches have taken on a central role.
Hence, signifi cant progress is anticipated.
9.5 UTILIZING WEIBULL DISTRIBUTION IN MODELING REHYDRATION PROCESS
The Weibull distribution function (Rosin and Rammler, 1933; Weibull, 1939) is a
model that is quite useful to fi t experimental data describing the rehydration of dried
food products. Basically, it describes the process as a sequence of probabilistic
events. This empirical approach followed a previous model suggested by Rosin and
Rammler (1933) and used for the description of particle-size distributions. Typically,
the Weibull distribution function is described by two parameters: the scale parame-
ter (�), which is related to the reciprocal of the process rate constant, and the shape
parameter (�). The scale parameter defi nes the rate and represents the time needed
to accomplish approximately 63% of the process. When � is 1, the Weibull distribu-
tion function reduces to fi rst-order kinetics. Many attempts have been made to utilize
the shape parameter of the Weibull distribution function as an indicator of the mech-
anism (e.g., diffusion, external resistance, or matrix relaxation) of liquid uptake
during rehydration because different values of � lead to different curves and as such
can describe the mechanisms taking place (Cunha, Oliveira, and Ilincanu, 1998;
Marabi et al., 2003). Utilization of the Weibull distribution showed excellent fi t in
52527_C009.indd 24852527_C009.indd 248 10/3/2008 3:58:54 PM10/3/2008 3:58:54 PM
© 2009 by Taylor & Francis Group, LLC

Rehydration and Reconstitution of Foods 249
describing the rehydration of a variety of dried foods, and it adequately described
rehydration processes controlled by different mechanisms (Ilincanu et al., 1995;
Machado et al., 1997, 1998, 1999). For a sphere geometry, the diffusion process was
clearly identifi ed when the � value is 0.6, whereas processes controlled by external
resistance or relaxation phenomena could not be differentiated from the values of �
that were close to 1 (Cunha, Oliveira, and Ilincanu, 1998).
The Weibull two-parameter distribution function is described as (Cunha,
Oliveira, and Ilincanu, 1998)
Mt - M0 ________
M � M0
� 1 � exp [ � ( t __ a ) b ] (9.16)
where Mt, M0, and M are the moisture content at time t, time 0, and infi nite time,
respectively.
The left-hand side of Eq. (9.16) is also equivalent to the defi ned rehydration ratio.
Note that the use of NDS is recommended.
Some studies that have applied the Weibull distribution (Ilincanu et al., 1995;
Oliveira and Ilincanu, 1999) did not consider factors such as the sample thickness,
which is a paramount variable in any practical rehydration processes. Other factors
that could affect the derived Weibull parameters also need to be considered, including
the effect of water uptake at equilibrium, the experimental error of the acquired data,
the geometry of the sample, and so forth. To account for these effects, a normalized
Weibull distribution was proposed by Marabi et al. (2003). The Weibull distribution
[Eq. (9.16)] was modifi ed and the rate parameter was normalized with a characteristic
dimension for the thickness:
Mt - M0 ________
M � M0
� 1 � exp [ � ( t ___ a ¢ ) b ] (9.17)
and
a ¢ � L2
____ Dcalc
(9.18)
where �� is the normalized scale parameter (s), L is the half-slab thickness or radius
for spherical and cylindrical samples (m), and Dcalc is the calculated diffusion coeffi -
cient of water (m2/s).
The Deff could then be derived from
Deff � R g �1 Dcalc (9.19)
where Rg is the geometry factor (dimensionless).
This model was utilized to show that for rehydrating AD carrots the derived �
value closely agreed with the value representing diffusion (~0.8 for a planar geometry).
In contrast, the values of � obtained for FD carrots did not match any of the modeled
values corresponding with these mechanisms. Thus, it was proposed that liquid uptake
may also occur via capillary fl ow, which is due to the very high porosity of the samples
(Marabi et al., 2003).
52527_C009.indd 24952527_C009.indd 249 10/3/2008 3:58:54 PM10/3/2008 3:58:54 PM
© 2009 by Taylor & Francis Group, LLC

250 Advances in Food Dehydration
An extensive summary of the different derived values for the parameters of the
Weibull model are presented in work by Saguy and Marabi (2005). They found that
the shape parameter describing the rehydration process of different dried foods ranges
from ~0.4 to 0.8, depending mainly on the drying method utilized and the type of
food (vegetable, fruit, cereal, etc.) analyzed. The rate parameter also ranged from a
few seconds to several hours. The excellent fi t of the normalized Weibull distribution
function to experimental data was observed in many different cases (e.g., Marabi et al.,
2003; Marabi, Jacobson et al., 2004; Marabi and Saguy, 2004, 2005).
In recent years, an increasing amount of work has made use of the Weibull
distribution function to model the rehydration kinetics of foods (Cunningham et al.,
2007; Garcia-Pascual et al., 2005, 2006). This is mainly because of its ease of appli-
cation, the fl exibility of the model, and the derived excellent fi t. However, special
caution is needed because this is a fi tting model and it cannot replace the physically
based model required for a better understanding of the mechanisms involved.
9.6 PRETREATMENTS AND THEIR EFFECTS ON FOOD STRUCTURE
The physical properties and microstructure of dried food products play a key role in
determining the kinetics of the rehydration process and should be carefully considered
during the predrying and drying steps. Because these might be the only processes
used to produce the dry foods, they determine their fi nal quality by affecting the
microstructure of the material and consequently, the overall transport phenomena
taking place. In general, two contrasting needs can be described in relation to the
rehydration process: (1) fast water or medium uptake and reconstitution (typically
encountered in instant products such as soups with vegetables and noodles) to a state
as similar as possible to that of the predrying food conditions, or (2) slow water or
medium uptake and the maintenance of attributes such as crispiness for longer
periods, as in breakfast cereals and the like. Some examples of treatments applied
before drying that could potentially affect the fi nal structure of the dried product
include blanching, osmotic dehydration (OD), utilization of sulfi tes, high-intensity
electrical fi eld pulses (HELP/PEF), high pressure (HP), vacuum impregnation (VI),
and application of ultrasound and �-irradiation.
Blanching is probably the most commonly used physical pretreatment before
drying. Its main goals are inactivation of the enzymes that can cause deterioration in
the quality of the dried product (e.g., enzymatic browning), partial softening of the
tissues, a decrease in drying time, and removal of intercellular air (Lewicki, 1998a).
The main effect on product texture is related to the activity of the pectin methyl
esterase enzyme. Blanching may cause modifi cations in the fi nal structure of the
dried food, affecting its texture and rehydration characteristics. For instance,
blanching of potato slices yields a signifi cantly more compact, less porous structure
with lower effective water diffusivity (Mate et al., 1998). Higher apparent diffusivity
values were found during rehydration of dried peppers blanched in water and treated
with a sulfi te solution compared to nontreated samples. Peppers placed in an osmotic
salt solution also had a lower apparent diffusivity compared to the nontreated
samples. However, in this case, the derived values were not signifi cantly different,
52527_C009.indd 25052527_C009.indd 250 10/3/2008 3:58:54 PM10/3/2008 3:58:54 PM
© 2009 by Taylor & Francis Group, LLC

Rehydration and Reconstitution of Foods 251
indicating the need for further study (Kaymak-Ertekin, 2002). By contrast, the
blanching temperature signifi cantly affected the equilibrium moisture content in
broccoli fl orets. Conventional blanching resulted in the highest equilibrium moisture
contents whereas stepwise blanching treatments at 55, 60, and 65°C yielded the
lowest (Sanjuan, Clemente et al., 2001). Water blanching was also compared with
freezing of green beans and carrots prior to drying: this resulted in lower water
uptake after 20 min of rehydration in boiling water. In contrast, HP treatment before
drying resulted in lower water uptake (Eshtiaghi et al., 1994), suggesting that micro-
structure plays an important role.
Another study that looked at a combination of several pretreatments reported the
optimization of blanching time and preservative (sodium chloride, potassium metabi-
sulfi te, sodium benzoate) and its pretreatment concentration levels (0.5, 1.0, and
1.5%) for solar-dehydrated caulifl ower (Kadam et al., 2006). Blanching time was
found to signifi cantly affect the rehydration ratio, whereas it was nonsignifi cant in
terms of the evaluated sensory attributes (color, odor, taste, and overall acceptability)
of the rehydrated caulifl ower. The authors reported that dehydrated caulifl ower
obtained from a combined treatment consisting of 3 min of blanching and dipping in
1.0% potassium metabisulfate was optimal with respect to all aspects of the physico-
chemical properties as well as the sensory attributes.
The effect of microwave (MW) heating on the physical properties and micro-
structure of apples before air dehydration showed that this pretreatment results in
very hard, rather collapsed samples with a high bulk density. However, the rehydra-
tion capacity increased by 25 to 50% for these samples compared to apples dehy-
drated in air only (Funebo et al., 2000). These data show that, although the apple
structure collapsed, it maintained its structural memory and was able to better absorb
water compared to its AD counterparts.
The use of HELP/PEF as a predrying treatment has attracted a great deal of
attention because it is generally recognized to increase the permeability of the plant’s
cell walls with a concomitant positive infl uence on mass transfer in further pro-
cesses. Indeed, as expected, a combination of HELP and OD resulted in an increased
rehydration capacity over prolonged periods compared to shorter OD times (Taiwo
et al., 2002b). The enhanced rehydration capacity of HELP plus OD treated apple
slices was attributed to their less compact structure, due to the absorbed sugar. When
the samples were treated with HELP alone, the lower rehydration capacity was partly
attributed to greater shrinkage: this, in turn, was due to faster water loss during air
drying as a result of increased membrane permeabilization (Angersbach and Knorr,
1997; Taiwo et al., 2002a).
Another example of the effect of OD was demonstrated with carrot cubes. The
parameters were different concentrations of sodium chloride solution, the tempera-
tures, and different process durations; water loss and solute gain were monitored.
However, this study also looked at other attributes that play an important consumer
role. Hence, the process was optimized by response surface methodology not only
for maximum water loss but also for the rehydration ratio and overall acceptability,
minimum solute gain, and shrinkage of the rehydrated product. The optimum condi-
tions for the various process parameters were an 11% salt concentration, a 30°C
osmotic-solution temperature, and a 120-min process duration of (Singh et al., 2006).
52527_C009.indd 25152527_C009.indd 251 10/3/2008 3:58:54 PM10/3/2008 3:58:54 PM
© 2009 by Taylor & Francis Group, LLC

252 Advances in Food Dehydration
In a subsequent study, the effects of ternary solutions of water, sucrose, and sodium
chloride at different solution concentrations, temperatures, and process durations
were investigated. In this case, the optimum conditions of various process parame-
ters were found to be 50°Bx and 10% (w/v) aqueous sodium chloride, a 46°C solution
temperature, and a 180-min process duration (Singh et al., 2007). This example
highlights the need to look at the whole process of drying and rehydration using a
systematic approach.
Other effects of various pretreatments on the structural changes in different
fruits were studied. In particular, the glass-transition temperature (Tg) of the dried
samples was related to different structural features. These investigations included
the effect of VI and MW application on structural changes that occurred during air
drying of apples (Contreras et al., 2005) and the infl uence of osmotic pretreatment
and MW application on properties of AD strawberries (Contreras et al., 2007). For
apples, the Tg was affected by the type of drying and generally showed higher values
for VI samples. In non-VI samples, an increase in Tg was observed when MWs were
applied and when the air temperature increased. However, no clear correlations
between the Tg values and the mechanical parameters of the samples were estab-
lished (Contreras et al., 2005). In the case of AD strawberries, pulsed VOD (PVOD)
pretreatment and the changes in pectin solubility that occurred during drying affected
both the average molecular weight of the solutes present in the fruit’s aqueous phase
and the cell-bonding forces supporting the cellular structure. These two factors had
a great impact on the Tg of the samples and on the mechanical response of the dried
and rehydrated products. All samples with 10% water content obtained from the
different treatments were in a rubbery state at the usual temperatures of storage and
commercialization, which inhibited sample fracture during handling but increased
sample deterioration rate. MW-treated samples, which showed higher Tg values,
therefore provided maximum stability. These samples were also the most fi rm and
rigid when dried, although their structure became seriously affected during the
drying process, which gave rise to a very soft texture after rehydration. PVOD-treated
samples showed the lowest Tg values and higher susceptibility was therefore observed,
but their structure was much better preserved during drying and they showed the
best mechanical behavior after rehydration (Contreras et al., 2007).
The effects of calcium chloride and osmotic treatment on drying kinetics and
rehydration properties of tomatoes were investigated (Lewicki et al., 2002). Dried
tomatoes from all treatments showed a poor capacity for rehydration, which was
attributed to the restrictive effect of the Ca2� bridges formed in the tomato tissue on
polymer hydration and swelling. The increase in mass (weight) during rehydration was
hindered by the pretreatment with calcium chloride. Raw tomatoes dried by convection
increased in mass more than fourfold during rehydration, whereas tomatoes pretreated
with calcium chloride increased only 2.7-fold. A combination of calcium treatment
and osmosis resulted in an even lower increase in mass, not exceeding a factor of 2.
Tomatoes dried by convection absorbed only 30% of the water that had been present in
the raw material. Pretreatment with calcium chloride reduced this value to 20%, and a
combination of calcium treatment with osmosis resulted in 15% water absorption.
The effects of osmotic pretreatments (10% NaCl for 1 h or 50% sucrose for 3 h)
on the rehydration kinetics of dried onions over a range of temperatures (25 to 65°C)
52527_C009.indd 25252527_C009.indd 252 10/3/2008 3:58:54 PM10/3/2008 3:58:54 PM
© 2009 by Taylor & Francis Group, LLC

Rehydration and Reconstitution of Foods 253
were reported by Debnath et al. (2004). The effective diffusion coeffi cients for water
and solute were determined by considering the rehydration process to be governed
by Fickian diffusion. The osmotic pretreatment resulted in a decrease in the diffusion
coeffi cient of water as well as an increase in the diffusion coeffi cient of solute during
rehydration. The decrease in the diffusion coeffi cient of water was related to an
increase in the proportion of ruptured and shrunken cells caused by the osmotic
treatment, which in turn resulted in a reduced ability of the dried onion tissue to
absorb water. The increase in the diffusion coeffi cient for solids during rehydration
was higher in the case of osmotic-pretreated material, because some of the solids
absorbed during OD were not retained in the cell matrix and dissolved faster than the
constitutive onion dry matter. The microstructures of untreated, osmotic-pretreated,
and AD samples were also compared by means of scanning electron microscopy
(SEM). The osmotic pretreatment resulted in compactness in the microstructures,
especially in the 50% sucrose-treated sample, compared to the control, leading to a
decreased rate of water absorption during rehydration.
More recently, the effect of ultrasound and blanching pretreatments on weight and
moisture loss or gain upon drying and rehydration of Brussels sprouts and caulifl ower
were reported by Jambrak et al. (2007). The drying time after ultrasound treatment
was shortened for all samples, relative to the untreated ones. The rehydration properties
were improved for the combination of FD and ultrasound-treated samples.
These studies clearly highlight the impact of several pretreatments on both
drying and rehydration. Although no general rules are available, the need for a
system approach in which the whole process is considered is obvious. In this
approach, the consumer has already been integrated. Thus, combining the drying or
rehydration processes and the resulting sensory attributes to meet consumer needs
and expectations is not only recommended but it is also probably the only way to
truly optimize the process.
9.7 DRYING METHODS AND THEIR EFFECTS ON PRODUCT’S PHYSICAL PROPERTIES
Selection of the most adequate drying method for a given food product is usually
based on several different considerations. A few of main factors include the eco-
nomic aspects, raw material characteristics, availability of drying facilities and their
proximity to the raw materials, and fi nal product quality. The fi nal moisture content
of the dried product can also dictate the method selection. The moisture content of
the fi nal product usually needs to be close to or below 5% to ensure adequate shelf-
life stability for long periods. It is well established that the process conditions selected
to dry fresh foods have a signifi cant infl uence on the physical properties of the fi nal
product (Krokida and Maroulis, 1997). The drying method employed determines
most of the particle characteristics that will affect the rehydration kinetics, as well as
nutritional value, sensory perception, and consumer acceptance. The most common
drying method used is the removal of water by means of forced-air drying convec-
tion. A signifi cant number of research groups have studied the parameters related to
this method and affecting product quality, such as cell shrinkage and tissue damage,
case hardening, porosity, density, color changes, and so forth (Karathanos et al.,
52527_C009.indd 25352527_C009.indd 253 10/3/2008 3:58:54 PM10/3/2008 3:58:54 PM
© 2009 by Taylor & Francis Group, LLC

254 Advances in Food Dehydration
1996; Lewicki, 2006; Lewicki and Pawlak, 2005; Mayor and Sereno, 2004; Nieto
et al., 1998; Ramos et al., 2004; Zogzas et al., 1994). Other investigations have
compared the properties of the dried products obtained by different drying methods
or their combination, including freeze-drying, air drying, and vacuum-puffed drying
(VPD), MW heating, and fl uidized-bed drying (Gowen, Abu-Ghannam, Frias, Barat
et al., 2006; Gowen, Abu-Ghannam, Frias et al., 2006; Krokida and Maroulis, 1997;
Lin et al., 1998; Litvin et al., 1998; Maskan, 2000, 2001; Ravindra and Chattopadhyay,
2000; Ruiz-Diaz et al., 2003; Torringa et al., 2001).
The main advantage of air drying is its reduced cost and the relatively simple
equipment required (i.e., a cabinet or continuous conveyor-belt dryers). The disad-
vantages of this method are related to the irreversible changes that take place, for
example, loss of nutrients due to their thermal degradation and the shrunken, low-
porosity product obtained, often resulting in very slow rehydration kinetics. More
expensive drying methods, such as freeze-drying, are needed in the case of dried
particles intended for use in premium products with high added value. The main
advantage of these methods is that collapse is almost completely avoided because the
initial structure of the solid matrix is retained during sublimation of the water. The
FD product is characterized by its low bulk density, high porosity, very fast rehydra-
tion kinetics, and improved consumer acceptance. Other drying methods, such as
fl uidized beds and drum dryers, are also used for fruits and vegetables. Some of
these, as well as novel food dryers, are discussed elsewhere in this book.
Physical characterization of the microstructure of the dried material is usually
carried out with techniques such as pycnometry, mercury porosimetry, SEM, trans-
mission electron microscopy (TEM), and confocal laser scanning microscopy. These
techniques provide both quantitative and qualitative information on the density; open,
closed, and total porosity; pore-size distribution; damage produced on the cellular
tissue during drying; and so forth. The very powerful x-ray microcomputerized
tomography (x-ray MCT) technique has recently become commercially available.
This technique provides very useful information, both quantitative and qualitative,
on the internal structure of the dried material and some of its remarkable features.
It has been reviewed and compared to traditional imaging methods (Trater et al.,
2005). Several recent publications have utilized this technique to successfully char-
acterize the microstructure of different food products (Babin et al., 2006; Falcone
et al., 2004, 2005; Trater et al., 2005; Haedelt et al., 2005; Lim and Barigou, 2004;
Mousavi et al., 2007), providing quantitative information that can be used to model
different transport phenomena. One of the main advantages of this technique is that
it circumvents the need for sample preparation in contrast to SEM or TEM. However,
the imaging time needed to obtain high-quality images and the processing time
needed to obtain relevant quantitative data such as porosity, connectivity, tortuosity,
and so forth, might be rather long and demanding in terms of computational resources.
Images obtained by x-ray MCT for three different drying methods (AD, FD, and
VPD) applied to carrots are presented in Figure 9.2. High-density areas (solid matrix)
are white, and the pores are black.
Figure 9.2a is a slice through an AD carrot sample. The dark pores in the middle
of the sample are internal and do not connect directly to the outer regions. The gray
strips on the left side of the sample are low-density regions. The AD carrot sample is
52527_C009.indd 25452527_C009.indd 254 10/3/2008 3:58:54 PM10/3/2008 3:58:54 PM
© 2009 by Taylor & Francis Group, LLC

Rehydration and Reconstitution of Foods 255
shrunken as a consequence of the drying conditions utilized and becomes very dense
in some locations. In contrast, the FD carrot (Figure 9.2b) retains its original web
structure, revealing very highly interconnected porosity. The VPD sample (Figure 9.2c)
shows a dense outer shell enclosing an inner region. In most of the VPD samples,
there is also a connecting pore between the inner total volume and the external
domain. However, in some particles, the internal volume is completely isolated.
Moreover, there are detectable pores that are isolated inside the wall of the VPD
sample, but their volume fraction is not signifi cant in comparison to the inner volume.
The collapse of the sample can also be appreciated, as refl ected by irregular shapes
compared to the FD sample, in which the initial shape is preserved.
Figure 9.3 provides three-dimensional renditions of portions of different carrot
samples. Signifi cantly different carrot microstructures can be clearly observed for
the three different drying methods. The pore size, spatial distribution, and wall
structure are affected by the treatments, which in turn have a great impact on the
rehydration kinetics (see Section 9.9). Figure 9.4a shows the internal pores that are
not connected to the external space around the AD sample. The closed pores in the
sample are not evenly distributed throughout the volume, a feature that is not revealed
by other conventional imaging methods and one that might have a signifi cant effect
FIGURE 9.2 Single slices through three individual carrot samples: (a) AD, (b) FD, and (c)
VPD. High-density areas (solid matrix) are white, and pores are black. (From Grader, A.S.,
Marabi, A., Wallach, R., and Saguy, I.S., unpublished results, 2007.)
FIGURE 9.3 Three-dimensional renditions of carrot samples: (a) AD, (b) FD, and (c) VPD.
(From Grader, A.S., Marabi, A., Wallach, R., and Saguy, I.S., unpublished results, 2007.)
52527_C009.indd 25552527_C009.indd 255 10/3/2008 3:58:54 PM10/3/2008 3:58:54 PM
© 2009 by Taylor & Francis Group, LLC

256 Advances in Food Dehydration
on the rehydration properties. The same analysis was performed on the FD sample
(Figure 9.4b). In this case the connected porosity makes up most of the volume of the
sample, and the unconnected porosity value is minimal.
These data indicate that x-ray MCT is a very powerful tool for detailed observa-
tions of the microstructure of porous foods. Moreover, it is expected to become a
pertinent method in the near future to obtain detailed information that can be further
utilized in computational simulations of the imbibition of liquids into porous media.
These data will open new avenues for ultimately quantifying and modeling internal
changes during both drying and rehydration, thereby providing the necessary infor-
mation for studying the mechanisms involved and enabling better control and quality
improvements.
9.8 REHYDRATION CONDITIONS AND THEIR EFFECTS ON PROCESS KINETICS
As previously stated, the conditions under which the rehydration process takes place
have a signifi cant effect on the fi nal characteristics of the reconstituted product and
will ultimately determine its consumer acceptability. These conditions can be con-
trolled and optimized in some given processes and for some food products. However,
in other cases it is not possible to change or optimize the conditions for rehydration
and reconstitution of the dried food, for example, in vending machines where the
mixing or contact time between the particles and water is limited, in products
intended for reconstitution at low temperatures, or when consumption occurs after a
short period of reconstitution. Some process parameters that can be controlled
include the temperature, composition of the liquid media (density, viscosity), presence
of insoluble matter, and mixing regime.
The effect of the medium temperature on reconstitution [RE, Eq. (9.2)], water
uptake [RR, Eq. (9.3)], and process kinetics has been extensively studied (Krokida
and Marinos-Kouris, 2003; Lewicki et al., 1998; Lin et al., 1998; Machado et al.,
1999; Meda and Ratti, 2005; Neubert et al., 1968; Sanjuan et al., 1999). It has been
shown that higher temperatures lead to an increased rehydration rate but usually only
marginally affect the rehydration capacity (i.e., the fi nal amount of liquid absorbed by
FIGURE 9.4 X-ray MCT images of dried samples of (a) AD carrot and (b) FD carrot. (From
Grader, AS., Marabi, A., Wallach, R., and Saguy, I.S., unpublished results, 2007.)
52527_C009.indd 25652527_C009.indd 256 10/3/2008 3:58:54 PM10/3/2008 3:58:54 PM
© 2009 by Taylor & Francis Group, LLC

Rehydration and Reconstitution of Foods 257
the dry food). The effect of temperature on the rehydration rate is due to both the
decreased viscosity of the immersion medium and its impact on the product’s structure.
The overall effect of temperature is typically described by an Arrhenius-type
relationship (Cunningham et al., 2007; Oliveira and Ilincanu, 1999).
The composition of the rehydration medium is another important factor affecting
the process. Most studies utilize water as the rehydrating medium, whereas a few
have utilized more complex rehydration media (del Valle et al., 1992; Horn and
Sterling, 1982; Marabi, Jacobson et al., 2004; Marabi and Saguy, 2005; Neubert
et al., 1968). A higher liquid viscosity is often a desired characteristic in such products
as soups, providing improved mouth feel. This effect is often achieved with thickening
agents, such as natural or modifi ed starches or gums. Consequently, the liquid media
may contain nondissolved particles, which in addition to increasing the viscosity, could
potentially hinder the ingress of liquid into the solid dry matrix. It has been demon-
strated that both increased viscosity and the presence of particles lead to slower
rehydration kinetics of dry vegetables (Marabi and Saguy, 2005). One possible way
of overcoming this effect is to utilize thickening agents with a delayed build-up of
the viscosity, allowing for faster liquid uptake during the initial steps, which usually
accounts for the biggest proportion of absorbed liquid.
The presence of ionic species in the dissolution media may also hinder the rehy-
dration of dry particles. Lewicki (1998a) proposed that ions orient water molecules
around them and decrease their availability to hydrate the dry food particles.
An additional factor infl uencing the rehydration process is the hydrodynamic
conditions of the media. The rehydration process is usually performed either with no
stirring or under constant mixing. It is generally recognized that the foremost resis-
tance to water or liquid transfer into the dried matrix lies within the food material
itself, and agitation is therefore not expected to play a major role, except with highly
viscous immersion media (Oliveira and Ilincanu, 1999).
Some specifi c examples of these effects are presented here. For instance, mass
transfer and physicochemical characteristics of FD strawberries rehydrated in sugar
solutions showed that increased concentrations lead to a decrease in both water
uptake and soluble solids losses (Mastrocola et al., 1997). A similar study on dehy-
drated apple cubes reconstituted in sugar solutions demonstrated that increasing the
concentration of the rehydrating solution results in a decrease in water uptake and a
loss of soluble solids in FD and AD apple cubes (Mastrocola et al., 1998). The
rehydration capacity of apples in water and in yogurt yielded signifi cantly higher
uptake in the former medium (Prothon et al., 2001). Breakfast cereals immersed in
water showed a faster rate of moisture uptake relative to that obtained in milk, which
was attibutable to easier hydration in water. Furthermore, the equilibrium moisture
content for immersion in water was almost twice that obtained with milk. This
process was reported to markedly affected by temperature (Machado et al., 1997).
Another study on breakfast cereals immersed in whole and skimmed milk at three
different temperatures showed the key role played by milk fat. For short immersion
times, uptake proceeded at a similar rate in both skimmed and whole milk, although
the sorption mechanisms differed (Machado et al., 1999). Textural changes in ready-
to-eat breakfast cereals during immersion in semiskimmed milk were also reported
(Sacchetti et al., 2003).
52527_C009.indd 25752527_C009.indd 257 10/3/2008 3:58:55 PM10/3/2008 3:58:55 PM
© 2009 by Taylor & Francis Group, LLC

258 Advances in Food Dehydration
The drying method has a signifi cant impact on rehydration. To demonstrate this,
we consider the effects of air drying and freeze-drying on the rehydration of carrots
(Marabi, Jacobson et al., 2004). An almost eightfold higher bulk density of the AD
sample compared to its FD counterpart was measured (1.28 and 0.16 g/cm3, respec-
tively). This signifi cant difference was attributable to the structural collapse and
shrinkage that occur during air drying. The porosity of the FD samples was mainly
composed of open pores and was about sixfold higher than its AD counterpart (0.90
and 0.15, respectively). It is interesting to note that the closed porosity for FD carrots
was quite low (~0.02) because the sample maintained its structure during dehydration.
In contrast, the closed porosity in the AD samples was signifi cantly higher (~0.24),
probably caused during shrinkage and structure collapse. The closed porosity could
play an important role in slowing down the rehydration rate. The drying method
markedly affected the rehydration ratio of the dried particles, resulting in much faster
water uptake by the porous FD samples (Figure 9.5). The RR values after rehydration
for 180 s were ~0.15 and 0.55 for AD and FD carrots, respectively. The much higher
water uptake of the FD samples was expected and previously documented (Farkas
and Singh, 1991; Karathanos et al., 1993; Lin et al., 1998; Marabi et al., 2003; Saca
and Lozano, 1992). Apart from the clear effect of porosity, Figure 9.5 also reveals
that the mixing speed (0 to 1500 r/min) had only a marginal effect on the kinetics of
water uptake for both AD and FD samples. The RR values were not signifi cantly
affected by increasing the speed. Thus, we concluded that the resistance to liquid
uptake for low-viscosity media lies within the food material itself, and the rate-limit-
ing factor in that case is not related to the rehydration medium or mixing speed.
However, given the signifi cant difference in the porosity of the samples, capillary
FIGURE 9.5 Effect of revolutions per minute on the rehydration kinetics of AD and FD
carrot samples in water at 85°C. Lines depict values derived by the normalized Weibull
model. (From Marabi, A., Jacobson, M. et al., Eur. Food Res. Technol., 218, 339–344, 2004.
With permission from Springer Science and Business Media.)
Time (s)
0.0
0.1
0.2
0.3
Reh
ydra
tion
ratio
(1/
m)
0.4
0.5
0.6
0.7
0 20 40 60 80 100 120 140 160 180 200
FD 0 r/minFD 500 r/minFD 1000 r/minFD 1500 r/minAD 0 r/minAD 500 r/minAD 1000 r/minAD 1500 r/min
52527_C009.indd 25852527_C009.indd 258 10/3/2008 3:58:55 PM10/3/2008 3:58:55 PM
© 2009 by Taylor & Francis Group, LLC

Rehydration and Reconstitution of Foods 259
imbibition could play an important role at the early stages, leading to an almost
instantaneous uptake of water (Benavente et al., 2002; Weerts et al., 2003a). Except
for viscous immersion media and a few potentially unique cases, mixing is not
expected to play a major role in rehydration kinetics.
As expected, the average effective diffusivity in the FD carrots was ~2 orders of
magnitude higher than in their AD counterparts (1.2 10–9 and 5.2 10�11 m2/s,
respectively). This difference is probably attributable to the dissimilar porosity. The
derived values were not affected by mixing, as expected when water uptake is an
internally controlled phenomenon.
Another example provided by Marabi, Jacobson et al. (2004) is the effect of mixing
on liquid uptake of FD and AD carrots in a medium containing 3% starch and having
an apparent viscosity of 110 mPa s at 85°C (Figure 9.6). The data showed markedly
different behavior in comparison with water (Figure 9.5). In the viscous medium,
increased mixing speed signifi cantly improved uptake in both AD and FD samples.
The differences between the samples are still obvious; however, under conditions of no
mixing, liquid uptake by the FD sample was signifi cantly reduced and was quite simi-
lar to that of the AD sample at the higher mixing speed (1000 r/min).
Marabi and Saguy (2005) provided another example also highlighted here that
considered the effect of nondissolved particles. When FD carrots were rehydrated in
four different starch solutions (Figure 9.7), the fastest rehydration was obtained with
water. Medium uptake in the presence of native corn or potato starches showed very
similar kinetics, although it was signifi cantly lower than that for water, followed by
native rice starch; a pregelatinized, commercial starch (Ultra Sperse 2000, National
Starch and Chemicals Co., Bridgewater, NJ) resulted in the slowest rehydration.
FIGURE 9.6 Effect of revolutions per minute on the rehydration kinetics of AD and FD
carrot samples in a 3% starch solution (110 mPa s) at 85°C. Lines depict values derived by the
normalized Weibull model. (From Marabi, A., Jacobson, M. et al., Eur. Food Res. Technol., 218, 339–344, 2004. With permission from Springer Science and Business Media.)
Time (s)
Reh
ydra
tion
ratio
(1/
m)
0.00 20 40 60 80 100 120 140 160 180 200
0.1
0.2
0.3
0.4
0.5FD 0 r/minFD 500 r/minFD 1000 r/minFD 1500 r/minAD 0 r/minAD 500 r/minAD 1000 r/min
52527_C009.indd 25952527_C009.indd 259 10/3/2008 3:58:55 PM10/3/2008 3:58:55 PM
© 2009 by Taylor & Francis Group, LLC

260 Advances in Food Dehydration
Note that the presence of starch in the rehydrating media dampened the benefi ts of
the FD sample by drastically reducing the rate of liquid uptake.
The effect of processing conditions is also expressed via changes in the Deff (also
termed water diffusivity). This important parameter is derived from Fick’s second
law and is an apparent value that comprises all of the factors involved in the process.
The theoretical aspects are discussed separately later. However, at this point, we will
cover the changes observed due to the rehydration process parameters.
For instance, a comparison of the effective diffusivities (Figure 9.8) revealed a
signifi cantly higher value for rehydration in water relative to all starches. Rehydration
in potato and corn starch solutions yielded almost identical effective diffusivities,
followed by rice starch and Ultra Sperse 2000. Note that the effective diffusivity in
water was sixfold higher than in medium containing Ultra Sperse 2000. This fi nding
could be signifi cant when designing a rehydration process for ready-to-eat products.
Moreover, the choice of the most appropriate thickening agent should take into
account the effect of rehydration kinetics, not merely the physical and sensory
properties obtained with a particular product. Correlating the viscosity of the starch
solutions with the derived effective diffusivity did not yield a clear trend. The solu-
tion containing Ultra Sperse 2000 had the highest apparent viscosity (129 mPa s) and
the slowest liquid uptake (Figure 9.7) or effective water diffusivity (Figure 9.8).
However, although the viscosity of the solution containing corn starch (37 mPa s)
was almost twofold those of solutions with either potato starch (20 mPa s) or rice
starch (19 mPa s), it demonstrated faster liquid uptake (Figure 9.7). Thus, viscosity
probably plays a lesser role in affecting rehydration kinetics. Nevertheless, it is also
possible that because the viscosity of the solution containing Ultra Sperse 2000 was
Time (s)
Reh
ydra
tion
ratio
(1/
m)
0.00 20 40 60 80 100 120 140 160 180 200
0.1
0.2
0.3
0.4
0.5
0.6WaterCornPotatoRiceUltra Sperse 2000
FIGURE 9.7 Rehydration of FD carrots in different starch solutions (30 g/kg, 30°C,
500 r/min) and water. Symbols indicate experimental data and lines indicate the normalized
Weibull distribution model. (Reproduced from Marabi, A. and Saguy, I.S., J. Sci. Food Agric., 85, 700–706, 2005. Copyright Society of Chemical Industry. With permission.)
52527_C009.indd 26052527_C009.indd 260 10/3/2008 3:58:55 PM10/3/2008 3:58:55 PM
© 2009 by Taylor & Francis Group, LLC

Rehydration and Reconstitution of Foods 261
3.5- to 6.7-fold higher (i.e., 129 vs. 19 to 37 mPa s), it was the primary factor affect-
ing the rehydration kinetics. In contrast, a trend could be observed with regard to the
particle size of the starch. Rice starch, which has the smallest average particle diam-
eter (11 μm), yielded the slowest liquid uptake. Potato starch showed two peaks (35
and 70 μm). The granule size of the starch as the limiting factor could explain
the similar uptake kinetics for the solution containing corn starch (Figure 9.7), based
on the quite similar average particle diameters (41 and 47 μm for potato and corn,
respectively). Thus, apart from very viscous solutions, the particle size of the thick-
ening agent could play a signifi cant role in the rehydration process.
In this respect, we hypothesized that small particles can clog the penetration of
the liquid into the capillaries of the FD samples whereas bigger particles are unable
to penetrate the pores, and therefore can act as a fi lter aid. This theory is supported
by the fact that most of the pores of FD carrots are smaller than 30 μm, with two
peaks at 1.1 and 21 μm (Karathanos et al., 1996).
No correlation was found between the rehydration uptake kinetics and the 10th,
50th (median), and 90th percentiles of the gelatinized starch particle diameters. Thus,
it seems that more than just one mechanism is responsible for the observed differ-
ences in the liquid uptake kinetics, leading to a complex interaction of factors.
The effect of mixing and medium viscosity on the values of the derived Deff
showed marked differences (Marabi, Jacobson et al., 2004). The Deff values of both
the AD and FD carrots rehydrated in water were higher than the corresponding
values in starch for all mixing speeds tested. Furthermore, mixing had a signifi cant
Rehydration medium
Def
f (m
2 /s)
2.0e-9
4.0e-9
6.0e-9
8.0e-9
1.0e-8
1.2e-8
1.4e-8
a
b b
c
d
Water Potato Corn Rice UltraSperse2000
0.0
FIGURE 9.8 Effects of different starches (30 g/kg) on the Deff (30°C, 500 r/min). Different
letters indicate signifi cant differences (p � .05). (Reproduced from Marabi, A. and Saguy,
I.S., J. Sci. Food Agric., 85, 700–706, 2005. Copyright Society of Chemical Industry. With
permission.)
52527_C009.indd 26152527_C009.indd 261 10/3/2008 3:58:55 PM10/3/2008 3:58:55 PM
© 2009 by Taylor & Francis Group, LLC

262 Advances in Food Dehydration
effect on uptake for the viscous media, implying that an external resistance model
prevails (see following).
9.9 PHYSICAL PROPERTIES OF DRIED FOODS AND THEIR EFFECT ON REHYDRATION
As shown earlier and in other publications (e.g., Aguilera, 2000, 2004; Aguilera
et al., 2003; Chiralt and Fito, 2003; Fito and Chiralt, 2003; Marousis et al., 1991), the
structure of foods and biological materials has a sizeable effect on the transport
phenomena taking place in different processes. The physical properties of the dried
foods that affect the rehydration process include the sample’s size and geometry,
chemical composition and physical state, moisture content, porosity, tortuosity, and
density. These properties are affected by the predrying treatments, dehydration
methods, and conditions under which they are produced.
One of the most important parameters is porosity, and its infl uence on rehydration
has been widely studied (Farkas and Singh, 1991; Karathanos et al., 1993; Krokida
and Maroulis, 1997, 2001; Machado et al., 1998; Saca and Lozano, 1992; Witrowa-
Rajchert and Lewicki, 2006). Typically, the bulk volume of a food sample can be
measured by different methods, including volume displacement by immersion in
n-heptane, toluene, sand, or glass beads, or it can be derived from the outer geometric
dimensions. The application of sophisticated image analysis can also be considered.
The solid volume of the sample is often measured using a pycnometer, utilizing
helium gas displacement. Helium is capable of penetrating all open pores up to the
diameter of the gas molecule (~3 Å); therefore, all larger pores can be quantifi ed. The
solid density is then obtained by grinding and sieving dry samples and determining
the true volume with a gas pycnometer. The pore-size distribution in a dried food is
often quantifi ed with a mercury porosimeter. Tortuosity is also a fundamental physi-
cal property of a product, but it is seldom reported and/or included in the modeling of
transport processes through porous foods. It is the factor that compensates for the
path through longer pores. Typical values for the tortuosity are between 1.5 and 5. In
porous solids, the Deff is an important parameter that is defi ned as (Gekas, 1992)
Deff � eD ___ t (9.20)
where e is the porosity, D is the true diffusion coeffi cient of water (m/s2), and t is the
tortuosity.
Thus, a method that enables quantifi cation of the tortuosity of dried foods is
paramount for enhancing the accuracy of modeling water-transport phenomena and
may also reveal other transport mechanisms involved during the rehydration process.
As mentioned in Section 9.7, three-dimensional virtual samples obtained by x-ray
MCT can serve as the basis for developing fl ow models that include the impact of
tortuosity on mass transport.
Water transport is an important physical process during drying, storage, and rehy-
dration, signifi cantly affecting the quality and utilization of many food products. Of
particular importance is the transport of water within porous foods. Principles of heat
and mass transfer during drying are typically applied, mainly because external mass
52527_C009.indd 26252527_C009.indd 262 10/3/2008 3:58:55 PM10/3/2008 3:58:55 PM
© 2009 by Taylor & Francis Group, LLC

Rehydration and Reconstitution of Foods 263
transfer is well understood and can be analyzed more readily (Saravacos and Maroulis,
2001). The water transport mechanisms will be covered separately. This section focuses
on the porous structure of the dehydrated materials that plays a paramount role in the
modeling of mass transfer applications in dehydrated foods (Vagenas and Karathanos,
1991). The porosity of a dried material is specifi c for each product and can be related
to the extent of drying, shrinkage, and possible collapse. The latter could lead to a
signifi cant reduction in the number and size of the pores (Lewicki, 1998a), with a
consequent unfavorable impact on the rehydration properties. The effect of drying
on product porosity has been studied quite intensively (Farkas and Singh, 1991;
Karathanos et al., 1993, 1996; Krokida and Maroulis, 1997, 1999). However, it is
interesting to note that most studies report only bulk porosity.
To demonstrate the effect of porosity on the rehydration kinetics (Marabi and
Saguy, 2004), carrots were dehydrated to a fi nal moisture content of ~3% (wet basis)
by using one or a combination of drying processes (air and freeze-drying). The
combination of these two drying methods and various processing times furnished a
wide range of porosities from ~0.90 to 0.14 for the fully FD or AD samples, respec-
tively. The bulk and open porosities decreased with the amount of time for the AD
process. These data are quite important because the rehydration kinetics are probably
directly linked to the open porosity rather than to the sample’s overall bulk porosity,
if the presence of the closed porosity is signifi cant. Note that the decrease in open
pores may also be involved in determining the pertinent mechanisms (e.g., diffusion,
imbibition, capillary fl ow) controlling the water uptake. Hence, although the closed
and open porosities are important product characteristics, only open pores are
important for water uptake. The rehydration data obtained for the samples with
different initial porosities (Figure 9.9) depict faster rehydration for samples with
Time (s)
Reh
ydra
tion
ratio
(1/
m)
0.00 20 40 60 80 120100 140 160 180 200
0.1
0.2
0.3
0.4
0.5
0.6
0.70.9010.8700.8060.7140.6210.1630.139
FIGURE 9.9 Rehydration of carrots with different initial bulk porosities (water, 85°C,
500 r/min). Symbols indicate experimental data and lines indicate the normalized Weibull
distribution model. (Reproduced from Marabi, A. and Saguy, I.S., J. Sci. Food Agric., 84,
1105–1110, 2004. Copyright Society of Chemical Industry. With permission.)
52527_C009.indd 26352527_C009.indd 263 10/3/2008 3:58:55 PM10/3/2008 3:58:55 PM
© 2009 by Taylor & Francis Group, LLC

264 Advances in Food Dehydration
higher bulk porosity. The effective diffusivity was derived utilizing the normalized
Weibull distribution (Marabi et al., 2003). The values were then plotted as a function
of bulk, open, and closed porosities. A clear and similar trend was only observed
with the fi rst two porosities (Figure 9.10). These data show that the effective moisture
diffusivity increases with the porosity. In fact, the values obtained for the FD carrots
were ~2 orders of magnitude higher than those for their AD counterparts, and they
were not affected by the closed porosity. We therefore concluded that the main factor
affecting water uptake during rehydration was the carrot’s initial open porosity
(Marabi and Saguy, 2004).
The mechanism of capillary imbibition plays an important role in the early stages
of rehydration, leading to almost instantaneous water uptake (Benavente et al., 2002;
Weerts et al., 2003a). This is probably the case when comparing the rehydration
curves of FD versus AD samples. However, it is logical to assume that there is a critical
porosity value above which the mechanism of water uptake is more similar to a porous
medium than the one represented by Fickian diffusion.
The overall impact of the drying methods on the porosity, physical properties,
and appearance was also studied and advantageous effects were found in terms
of structure and rehydration kinetics. For instance, a combination of MW energy
with convective air drying resulted in a more porous dehydrated chickpea. It improved
the porosity of the fi nal dehydrated product and samples experienced less shrinkage
than those dried by convective hot air, leading to faster rehydration kinetics
(Gowen, Abu-Ghannam, Frias, Barat et al., 2006). Another study utilized four
different methods (hot-air drying, MW-assisted convective drying, freeze-drying,
and vacuum-drying) to dehydrate cranberries (Beaudry et al., 2004). Hot-air drying
produced dried cranberries with the best visual appearance, FD cranberries had
the highest rehydration ratios, and the other methods presented similar RR values.
Porosity (s)
Def
f (m
2 /s)
10–11
0.0 0.2 0.4 0.6 0.8 1.0
10–10
10–9
10–8
Bulk porosityOpen porosityClosed porosity
FIGURE 9.10 Effect of bulk, open, and closed porosity on the Deff of the samples. (Repro-
duced from Marabi, A. and Saguy, I.S., J. Sci. Food Agric., 84, 1105–1110, 2004. Copyright
Society of Chemical Industry. With permission.)
52527_C009.indd 26452527_C009.indd 264 10/3/2008 3:58:55 PM10/3/2008 3:58:55 PM
© 2009 by Taylor & Francis Group, LLC

Rehydration and Reconstitution of Foods 265
The greater rehydration capacity of the FD samples was because the internal struc-
ture of the fruit remained quite undisturbed. This, in turn, was attributable to the
structural rigidity of the frozen product, which prevents the collapse of the solid
matrix remaining after drying. Therefore, FD products tend to have a porous and
nonshrunken structure with excellent rehydration capacity.
The drying kinetics and rehydration characteristics of MW–vacuum dried and
convective hot-air dried mushrooms were also reported (Giri and Prasad, 2007).
MW–vacuum drying resulted in a 70 to 90% decrease in drying time, and the dried
products had better rehydration characteristics than their convective AD counterparts.
The rehydration properties were improved by drying at lower system pressure and
higher MW power. As the pressure level decreased the rehydration ratio increased,
which was due to the increased drying rate and the creation of pores induced by the
vacuum conditions. The higher rehydration ratio at higher MW power was attributed
to the development of greater internal stresses during drying at higher power levels.
The quick MW-energy absorption caused rapid evaporation of water, creating a fl ux
of rapidly escaping vapor that helps in preventing shrinkage and case hardening, thus
ultimately improving the rehydration characteristics (Giri and Prasad, 2007).
The use of g-irradiation in combination with air drying and its effects on the
rehydration properties of potatoes were also investigated (Wang and Chao, 2003;
Wang and Du, 2005). Higher irradiation doses (between 0 and 10 kGy) resulted in
lower rehydration ratios in AD potatoes. The authors concluded that irradiation
pretreatment does not improve the rehydration quality of potatoes. Similarly, another
study reported the combined effect of g-irradiation and osmotic treatment on mass
transfer during the rehydration of carrots (Nayak et al., 2006). An increase in
g-irradiation dose resulted in a decrease in water and an increase in solute diffusion
during rehydration. This was attributed to the permeabilization of the cell membranes
upon exposure to g-irradiation. The pretreatment with water, as opposed to the
osmosed samples (50°Bx), resulted in increased water gain and reduced solute loss
during rehydration for irradiated samples. The equilibrium moisture and solids
contents were dependent on the treatment conditions.
The drying and rehydrating characteristics of carrots dried in a solar cabinet,
fl uidized bed, and MW ovens were also reported (Prakash et al., 2004). The
rehydration ratio of carrots dried by a fl uidized bed oven at 70°C was the highest
whereas that of carrots dried in the solar cabinet was the lowest. There was a
decrease in the rehydration ratio with increasing storage time. This was attributed
to the dried carrot’s absorption of moisture from the environment during storage.
Drying at higher temperature or MW power was improved the rehydration proper-
ties, because of less shrinkage of the dried carrots. Carrots were also dried in MW
and halogen lamp–MW combination ovens and the rehydration properties of the
samples were evaluated (Sumnu et al., 2005). These samples were reported to have
higher rehydration capacities than those subjected to hot-air drying, because of the
high internal pressure produced by MW heating that can cause the carrot slices to
expand and puff up.
Methods of drying have also been reported to affect the behavior of apple cubes
upon rehydration. Convection-dried apples imbibed water and swelled during rehy-
dration, with a collapse in structure observed at the beginning of the wetting process.
52527_C009.indd 26552527_C009.indd 265 10/3/2008 3:58:56 PM10/3/2008 3:58:56 PM
© 2009 by Taylor & Francis Group, LLC

266 Advances in Food Dehydration
An analysis of both mass and volume increases showed that at the beginning of
rehydration the capillaries and pores were fi lled with water and thereafter swelling
of the biopolymers occurred. FD samples increased in mass much faster than those
dried by convection. Rehydration caused collapse of the structure, which was not
rebuilt during further wetting (Lewicki and Wiczkowska, 2006).
The effects of three different drying methods on the samples’ physical structure
(Figure 9.3) and rehydration kinetics (Figure 9.11) were also compared. The different
structures and solid porosities had a signifi cant impact on the rehydration process for
short times. These samples were the same as those studied by x-ray MCT and shown
in Figures 9.2 and 9.3. The FD sample showed the fastest uptake of water, followed
by the VPD and AD samples, in that order. However, with the information derived
from the x-ray MCT analysis, it might be possible not only to correlate the physical
properties of the samples with kinetics parameters derived from rehydration curves
but also to develop more accurate models of fl ow in porous media, which are scarce
in the fi eld of food science. This topic is currently under investigation by several
groups, and new breakthroughs are anticipated (see Section 9.12).
Xu et al. (2005) applied a two-stage convective-air and vacuum freeze-drying
technique to bamboo shoots in order to optimize the cost of the drying process. They
combined hot air fl ow with vacuum freeze-drying in two different ways: hot air-fl ow
drying (FAD) followed by vacuum freeze-drying (VFD), and vacuum freeze-drying
followed by hot air-fl ow drying. The combination of these two methods can over-
come the disadvantages of AD products, that is, extremely hard texture, severe
browning, low rehydration rate, low nutritive value, and so forth, while still retaining
Time (s)
Reh
ydra
tion
ratio
(1/
m)
0.00 20 40 60 80 100 120 140 160 180 200
0.1
0.2
0.3
0.4
0.5
0.6
0.7
0.8
0.9
1.0
FDVPDAD
FIGURE 9.11 Rehydration kinetics (up to 3 min) for three test samples. Symbols indicate
experimental data and lines indicate fi tting of the normalized Weibull distribution. (From
Marabi, A. and Saguy, I.S., unpublished data.)
52527_C009.indd 26652527_C009.indd 266 10/3/2008 3:58:56 PM10/3/2008 3:58:56 PM
© 2009 by Taylor & Francis Group, LLC

Rehydration and Reconstitution of Foods 267
the benefi ts of vacuum freeze-drying, that is, preservation of characteristics such as
color, aroma, taste, and shape of food and agricultural products. The quality of AFD
products was worse than FD and FAD products, and FAD was found to be a suitable
combined drying method for dehydration of bamboo shoots. Furthermore, its struc-
ture, rehydration, sensory, and nutritional characteristics were better than for AFD
and AD and energy consumption was reduced.
These data show that the drying method and accompanying conditions play a
paramount role in affecting the physical properties of the food products and conse-
quently the rehydration process. Porosity is one of the most important parameters;
yet, other properties such as the tortuosity, cell-size distribution, cell-wall thickness
distribution, connectivity, voidage, and degree of anisotropy of the samples are also
important. Signifi cant breakthroughs are expected as x-ray MCT becomes more
affordable. More data and information will provide the basis for insights and new
understanding of the mechanisms taking place during both drying and rehydration.
9.10 LEACHING OF SOLIDS
During the rehydration process, substantial amounts of soluble solids that are
initially present in the dried food may leach into the liquid medium while liquid is
entering the solid matrix. Both the nutritional quality of the food product and its
water uptake can be affected during this process. Complete solvation of the mass
that has leached out is associated with relatively high amounts of water, and it can be
expected that the smaller the amount of leaching is the higher the ability of the
rehydrating material to absorb water (Lewicki, 1998a). Dry food products with
highly porous structures will allow more water penetration that can also provoke the
leaching of soluble solids in appreciable amounts. However, increased porosity does
not always promote the leaching of soluble solids. This process is affected in part by
the mass transfer taking place inside the solid matrix (e.g., inside the pores), with the
soluble solids passing into solution, and the subsequent diffusion of the dissolved
solids, transported against the current into the liquid, where they are absorbed into
the bulk liquid.
Here we will review a few studies that demonstrate the leaching phenomenon.
Leaching of soluble solids during the rehydration of dried onions at room and boiling
temperatures was quite signifi cant, in some cases reaching more than 70% of the
initial dry matter. Predrying treatments were also led to signifi cant differences in
soluble solids loss during rehydration, and samples undergoing osmosis lost the most.
However, the temperature of the rehydration medium did not infl uence the fi nal
retention of the dry matter (Lewicki et al., 1998). When AD and explosion-puffed
(EP) bananas were rehydrated in boiling water for 20 min, more solids were leached
from the AD samples, which showed a lower porosity, than from the EP product
(Saca and Lozano, 1992). In another study, signifi cantly lower dry-matter losses
during rehydration was observed for dry peaches blanched for 5 min (Levi et al., 1988)
compared with no blanching or longer blanching times (9 or 15 min, respectively).
This effect was attributed to the integrity of the tissues that was probably affected by
the heat treatment, leading to an increase in the leaching of water-soluble solids to
the surrounding medium. In this case, the water-soluble solids were identifi ed as
52527_C009.indd 26752527_C009.indd 267 10/3/2008 3:58:56 PM10/3/2008 3:58:56 PM
© 2009 by Taylor & Francis Group, LLC

268 Advances in Food Dehydration
sugars, acids, galacturonic acid monomers, short oligomers, and water-soluble pectin.
As expected, increasing the concentration of glucose or corn syrup in the rehydrating
solution led to decreased water uptake and loss of soluble solids in FD strawberry
pieces (Mastrocola et al., 1997). In contrast, when the rehydration solution contains
a relatively high concentration of solids, the direction of the solids’ movement can be
reversed, as was detected when rehydration was carried out in solutions containing
more than 15% sugar. The rehydrating medium also has an impact on the amount of
leached solids. For instance, more soluble solids were lost during the rehydration of
breakfast cereals in water than in milk (Machado et al., 1999). The effect of tempera-
ture on the extent of solids leaching was also reported for cereals. The rate of solids
leaching increased with temperature for both corn and peanut butter breakfast cereals
(Machado et al., 1998).
Frosting on puffed breakfast fl akes reduced water uptake compared to an
unfrosted sample (Sacchetti et al., 2003). By contrast, the frosted product showed the
highest loss of soluble solids during the soaking process in semiskimmed milk.
Leaching of solutes from Rice Crispies into water at 40°C was also studied by NMR
(Lucas et al., 2007). The leached solutes represented less than 0.6% of the immer-
sion water (g dry matter/100 g immersion water). Nevertheless, in relation to the dry
matter initially contained in the Rice Crispies, it represented 6.2 and 12.5% at 6 and
58 min of soaking, respectively. Clearly, such amounts cannot be disregarded because
mass balances may be biased.
Despite the importance of the leaching process and its effect on the rehydration
process, a signifi cant number of studies do not take the leaching of solids to the
surrounding solution into account in their calculations. As indicated, to overcome
some of these drawbacks, the concept of NDS was defi ned and utilized in Eq. (9.3).
Predrying treatments (e.g., HELP, OD, HP, freezing, and blanching) infl uence
dry-matter loss during rehydration (Rastogi et al., 2000; Taiwo et al., 2002a,b).
Untreated samples lost more solids than HELP- and HP-treated ones. Other studies
(Oliveira and Silva, 1992; Schwartzberg, 1975; Schwartzberg and Chao, 1982;
Tomasula and Kozempel, 1989) included mathematical analyses of the leaching
process, under the assumption that it could be described by Fick’s second law. The
dependence of the effective diffusivity on temperature was described by an Arrhenius-
type equation for raw and previously frozen carrot cortex tissue (Oliveira and Silva,
1992). Recently, the Weibull probabilistic distribution was used to model both the
water uptake and the soluble solids losses during rehydration (Ilincanu et al., 1995;
Machado et al., 1997, 1998, 1999; Marabi et al., 2003). However, the nature of the
leaching of soluble solids during short rehydration processes was not studied.
Determination of the composition of the soluble-solids leaching from legumes and
vegetables using high-performance liquid chromatography (HPLC) was reported
(Rodriguez et al., 1999; Vidal et al., 1992, 1993).
More recently, the solids leaching from rehydrated AD and FD carrots was
analyzed by HPLC and total organic carbon determination (Marabi, Dilak et al.,
2004). Leaching of solids was signifi cant at short rehydration times and amounted to
up to ~35 and 40% of the initial sample weights for AD and FD samples, respectively
(Figure 9.12). The leaching kinetics of AD and FD carrots during rehydration in
85°C water showed that sucrose was the main sugar that leached from both samples,
52527_C009.indd 26852527_C009.indd 268 10/3/2008 3:58:56 PM10/3/2008 3:58:56 PM
© 2009 by Taylor & Francis Group, LLC

Rehydration and Reconstitution of Foods 269
whereas a minor difference between the AD and FD samples was observed in the
case of fructose and glucose. The higher concentration of sucrose in the rehydrating
medium was in accordance with its initial concentration in the dry samples.
In conclusion, the leaching of solids may play a signifi cant role during rehydration,
especially for prolonged processes. Hence, it needs to be taken into consideration,
especially when studying the kinetics of the process.
9.11 SENSORY ASPECTS
When considering dried foods that need to be reconstituted, it is essential to bear in
mind that the utmost requirement is to meet consumers’ expectations with respect to
the sensory aspects of the fi nal product. These may include color, texture, hardness,
fl avor, and even particle distribution in the fi nal product. It is therefore essential to
optimize the reconstitution conditions for each specifi c product, because predrying
treatment, drying, and rehydration processes induce many changes in the structure
and composition of dried foods (Marabi, Dilak et al., 2004; Marabi and Saguy,
2004). For rehydrated vegetables, the most pertinent properties are related to the
texture and fl avor of the particles. Typical tests of consumer affect are employed to
quantify the product attributes and overall acceptance, and these tests can be adapted
to assess the acceptability of the reconstituted foods.
Organoleptic characteristics and textural softening of carrots were affected or
progressed at different rates, depending on the physicochemical mechanisms that
were used. Therefore, the impact of the dehydration process on the overall quality
Time (s)
Sug
ar lo
ss (
% o
f sam
ple
initi
al w
eigh
t)
00 200 400 600 800 1000 1200 1400 1600 1800
10
20
30
40
50
FDAD
FIGURE 9.12 Total sugar (glucose � fructose � sucrose) loss as a function of rehydration
time. (Reproduced from Marabi, A., Dilak, C. et al., J. Food Sci., 69, FEP91–FEP96, 2004.
With permission from Blackwell Publishing.)
52527_C009.indd 26952527_C009.indd 269 10/3/2008 3:58:56 PM10/3/2008 3:58:56 PM
© 2009 by Taylor & Francis Group, LLC

270 Advances in Food Dehydration
and acceptability should be considered in establishing the optimal process (Paulus
and Saguy, 1980). The effect of low-temperature blanching on the texture and
rehydration of dehydrated carrots was studied using an analytical method to measure
the mechanical properties (Quintero-Ramos et al., 1992). The sensory evaluation of
rehydrated carrots was reported, showing no signifi cant difference in overall accept-
ability and texture for AD, FD, and vacuum–MW dried carrots rehydrated at 100°C
for 10 min (Lin et al., 1998). In contrast, the data on aroma or fl avor, appearance, and
color revealed the importance of the different drying methods utilized. The rehydra-
tion kinetics of dried carrots was affected by several factors (e.g., drying method,
rehydration medium composition, time, mixing speed, and porosity; Marabi, Dilak
et al., 2004; Marabi, Jacobson et al., 2004; Marabi and Saguy, 2004, 2005; Marabi
et al., 2003). For instance, FD carrots rehydrated faster than their AD counterparts
while a high amount of carbohydrates leached out simultaneously. The combination
of these factors and processes could lead to rehydrated products with diverse physical
properties that, in turn, might translate to different and signifi cant sensory character-
istics. Hence, assessing such differences is an important step in merging the process
with consumer preferences.
In one such study, a consumer test was designed to assess the overall product
acceptability and relevant attributes that drive it as a function of the rehydration time
for carrots dried by two different methods (AD and VPD). Water uptake was increased
with soaking time and was higher for the VPD samples, even though no signifi cant
differences were found in the amount of water absorbed. Therefore, any differences
observed in the sensory parameters must be attributable to the drying process used
and its effects on the structure of the samples. Indeed, the evaluated trait descriptor
values differed signifi cantly between the AD and VPD carrots (Figure 9.13), except
for fl avor (150 s) and fl avor intensity (120 s). In addition, immersion time showed
different effects (Figure 9.13). AD samples were signifi cantly affected by rehydration
time for overall acceptability, texture, and hardness. By contrast, VPD carrots showed
a signifi cantly higher overall acceptability for all rehydration times (Figure 9.13a).
The texture score of the AD carrots increased signifi cantly with rehydration time
(Figure 9.13b). As expected, greater differences in consumer acceptability were
found for hardness, with the AD carrots being perceived as very hard. Rehydration
time considerably softened the samples, and VPD carrots exhibited signifi cantly
lower hardness in comparison to their AD counterparts (Figure 9.13d). However, the
hardness of the VPD samples remained unchanged. Flavor acceptance was only
signifi cantly higher for the VPD carrots at 60 and 120 s (Figure 9.13c). Flavor inten-
sity was higher for the shortest immersion of the VPD carrots and decreased signifi -
cantly with rehydration time only for these samples (Figure 9.13e). The decrease in
fl avor intensity for VPD samples might be a consequence of the high amount of sol-
ids leaching during the rehydration process (Marabi et al., 2006).
The data clearly indicated that the VPD sample was an acceptable product.
Moreover, at the shortest rehydration time tested, only VPD samples enjoyed
consumer acceptance. In contrast, AD samples needed to be rehydrated for longer
than 150 s and thus may not be suitable for some types of products for which a
shorter reconstitution time is expected. The hardness was also inversely correlated
with the overall acceptability, texture, and fl avor, indicating that this parameter
52527_C009.indd 27052527_C009.indd 270 10/3/2008 3:58:56 PM10/3/2008 3:58:56 PM
© 2009 by Taylor & Francis Group, LLC

Rehydration and Reconstitution of Foods 271
should be optimized to produce an appealing product. Optimizing the rehydration
time and dehydration process is therefore most important for AD products. The
longer rehydration time needed to achieve an acceptable hardness for the AD
carrots has signifi cant commercial impact. The rehydration time is not very fl exible
because of consumers’ demand for a rapidly reconstituting product, so the need to
optimize the hydration process is paramount (Marabi et al., 2006).
FIGURE 9.13 Average sensory scores for rehydrated AD and VPD carrots: (a) overall accept-
ability, (b) texture, (c) hardness, (d) fl avor, and (e) fl avor intensity. *Signifi cant differences
between samples ( p � .05). Different letters indicate signifi cant differences within samples
( p � .05). (Reprinted from Marabi, A. et al., J. Food Eng., 72, 211–217, 2006. Copyright 2006
Elsevier. With permission.)
9(a)
aab b
** *
8
7
6
5
4
Ove
rall
acce
ptab
ility
3
2
160 120
Rehydration time (s)150
(d)
a ab
* **
9
8
7
6
5
4Har
dnes
s
3
2
160 120
Rehydration time (s)150
(c)
* *
9
8
7
6
5
4
Fla
vor
acce
ptab
ility
3
2
160 120
Rehydration time (s)150
AD VPD
9(b)
aab
b*
* *
8
7
6
5
4
Text
ure
acce
ptab
ility
3
2
160 120
Rehydration time (s)150
(e)
**
ab
c
9
8
7
6
5
4
Fla
vor
inte
nsity
3
2
160 120
Rehydration time (s)150
52527_C009.indd 27152527_C009.indd 271 10/3/2008 3:58:56 PM10/3/2008 3:58:56 PM
© 2009 by Taylor & Francis Group, LLC
272 Advances in Food Dehydration
Another study evaluated the effects of four drying methods on the quality of OD
cranberries with respect to their rehydration characteristics and sensory aspects
(Beaudry et al., 2004). In this case as well, the rehydration ratio of FD cranberries
was signifi cantly greater than that of the fruits dried by other methods. However,
conventional hot-air drying seemed to confer a slight advantage over the other meth-
ods based on the overall appearance of the dried samples, probably due to their
uniformity. Cranberries dried with MW produced a few darker fruits and a few fruits
dried under vacuum were less aesthetic, probably because of excessive bleeding of
the fruits during drying. In this case, the data obtained based on the taste of the
samples showed no difference among the different drying methods.
The sensory characteristics of blanched carrots dried by three different methods
were also evaluated (Prakash et al., 2004). Carrots subjected to fl uidized-bed drying
showed better color and rehydration properties, greater �-carotene retention, and
higher overall sensory acceptability than those dried by MW oven or solar methods.
Moreover, the sensory score decreased with increased storage time.
Sensory characteristics, which are designed to meet consumer expectations and
acceptability, constitute the ultimate test for rehydrated products. Optimization is
possible if all of the process aspects are considered and understood. A paradigm
shift is needed so that a system approach is utilized. Such an approach should be
designed to optimize each and every stage, namely, the raw material, drying, storage,
and rehydration conditions that are utilized.
9.12 NEW APPROACHES AND RECENT ADVANCES
The rehydration of dried foods involves different physical mechanisms, among them
water imbibition, internal diffusion (in the solid and in the pores), convection and
diffusion at the surface and within large open pores, hydraulic fl ow, capillary fl ow,
and relaxation of the solid matrix. The previous sections describe the most relevant
factors affecting the rehydration of dried food particles. In addition, the various
approaches frequently utilized to model this process are highlighted. Two main
approaches are often used to describe liquid transport into the dried solid matrix:
empirical or semiempirical models (e.g., Peleg’s model, Weibull distribution
function) and the application of Fick’s laws of diffusion. Despite the signifi cant
and valuable insights these models have provided, several research groups have
recently proposed that the rehydration of dry food particles cannot be explained
and/or modeled solely by a Fickian mechanism. A growing body of data indicates
that this simplifi cation may not be fully warranted, or in some cases, might even
result in misleading conclusions (Datta, 2007a,b; Saguy et al., 2005b; Weerts et al.,
2003a,b). This realization is relatively new and important insights are coming to
light from the merging of different scientifi c disciplines, including food and soil
sciences, biophysics, environmental sciences, and petroleum and chemical engineering.
The ultimate goal of these interdisciplinary efforts is to provide more advanced
and accurate physical models describing the mechanisms taking place during the
rehydration process.
The models recently developed and successfully applied to the fl ow of liquids
into dried foods are based on theories that are usually termed the “capillary-fl ow
52527_C009.indd 27252527_C009.indd 272 10/3/2008 3:58:56 PM10/3/2008 3:58:56 PM
© 2009 by Taylor & Francis Group, LLC

Rehydration and Reconstitution of Foods 273
approach” and/or “fl ow in porous media.” The theories are already well developed in
other fi elds, as are the methodologies needed to generate the required experimental
data. However, there is still a considerable lack of data and, of more importance,
standard methods allowing collection of the relevant physical properties of the food
matrix and its interaction with the liquid. We anticipate that collaborative studies in
the near future will provide the information needed to apply these theories.
The starting point for developing models that account for fl uid fl ow in porous
media is Darcy’s equation and its Navier–Stokes analog (Datta, 2007a; Saguy et al.,
2005b; Weerts et al., 2003b). In addition, the main roles of the food particles’ physical
properties (e.g., pore-size distribution, heterogeneity, tortuosity), the embedding
liquid (e.g., density, viscosity, temperature), and the interface (e.g., contact angle) are
also considered in order to quantify the changes occurring during drying and to
facilitate the modeling of the rehydration process. These studies on fl uid fl ow in
porous media have presented adequate detail on the development of the models, and
the reader is referred to them for more detailed information.
Some of the recent studies focusing on the various transport mechanisms taking
place in porous media include the following:
1. Molecular diffusion of gases, including water vapor; Darcy fl ow of gases
due to pressure; and Darcy fl ow of liquid due to gas and capillary pressures
were studied (Datta, 2007a).
2. A variation of the Lucas–Washburn equation was also utilized to model the
rehydration of dried foods (Saguy et al., 2005a; Lee et al., 2005).
3. The complexity of utilizing these mechanisms together with the input
parameters that need to be derived from experimental data was investigated
(Datta, 2007a,b; Saguy et al., 2005b). This category includes (a) density,
porosity, thermal conductivity, and specifi c heat of the solid material;
(b) molecular, capillary, and effective diffusivities; (c) moisture isotherms;
(d) vapor and liquid permeability; and (e) water-potential curves. Data in
(d) and (e) are either nonexistent for foods or very diffi cult to obtain.
Consequently, future research should address these topics.
To utilize the theory of fl ow in porous media, a characteristic water curve
(analogous to a food-sorption isotherm, also known as a moisture-retention curve)
is needed. The characteristic curve describes the functional relationship between
water content and matric potential under equilibrium conditions. This curve is an
important property related to the distribution of pore space (sizes, interconnected-
ness), which is strongly affected by texture and structure, as well as by other related
factors, including organic-matter content. The retention curve indicates the amount
of water in the porous medium at a given matric potential. It is also a primary
hydraulic property required for modeling water fl ow in porous media. Retention
curves are highly nonlinear functions and are relatively diffi cult to obtain with any
accuracy. They are measured experimentally. The traditional method of determining
the water-retention curve involves establishing a series of equilibria between water
in the porous-medium sample and a body of water at known suctions. Continuous
retention-curve functions are needed to solve the fl ow equations. Numerous
52527_C009.indd 27352527_C009.indd 273 10/3/2008 3:58:56 PM10/3/2008 3:58:56 PM
© 2009 by Taylor & Francis Group, LLC

274 Advances in Food Dehydration
well-known empirical functions (e.g., Brooks and Corey, 1966; van Genuchten,
1980) have been developed, and similar functions and relationships will probably
continue to be developed in the near future.
9.13 RESEARCH NEEDS
Future research needs to focus on the accomplishment of three main goals. The fi rst
could be described as a “system approach,” whereby the drying and rehydration pro-
cesses are combined. It is crucial to realize that rehydration is signifi cantly affected
by drying, and these therefore need to be studied by a unifi ed approach. The second
goal is to apply physically based models. Multidisciplinary research is needed in which
theories and knowledge developed in other fi elds will be assimilated and integrated.
The third goal is the development of new methods and the utilization of advanced
equipment to quantify in situ changes in the microstructure of the food matrix and
enable the collection of physical data.
More specifi cally, the following recommendations are proposed:
1. Additional studies are required to elucidate the various mechanisms occur-
ring during the ingress of water or other liquids into a dry food. Capillary
imbibition is very important in the early stages, leading to almost instanta-
neous uptake. Knowledge in this domain is evolving and will probably have
a signifi cant impact on our understanding of rehydration. The cooperation
and transfer of know-how among numerous disciplines with more developed
knowledge of transport phenomena and the physical mechanisms underlying
such processes (e.g., soil sciences and physics, civil and petroleum engineer-
ing, geology, printing, etc.) and food science and engineering should lead to
signifi cant advances in our understanding of this important subject.
2. Application of porous-media theory to the modeling of food rehydration
requires the use of a characteristic curve, which is time consuming and
cumbersome. Bridging between sorption isotherms commonly utilized in
food science and water-characteristic curves employed in soil physics could
furnish a novel and integrated approach that would overcome some of the
immense complexity that has hampered previous modeling attempts and open
new avenues for studying and optimizing food rehydration. Development
of the relevant data and, of more importance, standard methods enabling
collection of the relevant parameters is required.
3. Computational fl uid dynamics software must be developed specifi cally for
foods. Such software would include specifi c problems such as evaporation,
deformation of the solid matrix, and multiphase fl ow; development of meth-
ods to directly measure water-retention curves (drying and hydration) for
food particles; validation of the Kelvin equation; examination of different
methods for indirect determination of hydraulic conductivity; development
of a database on food permeability; and the utilization of advanced imaging
techniques to quantify the complex microstructure of dried foods, furnishing
information on the porosity, pore-size distribution, and tortuosity (Datta,
2007b; Saguy et al., 2005b).
52527_C009.indd 27452527_C009.indd 274 10/3/2008 3:58:57 PM10/3/2008 3:58:57 PM
© 2009 by Taylor & Francis Group, LLC

Rehydration and Reconstitution of Foods 275
4. The fi nal recommendation is the utilization of advanced techniques such as
NMR and X-ray MCT to measure in situ and real-time changes within the
food-matrix microstructure.
9.14 CONCLUSIONS
The overall objective of this chapter was to describe our present understanding of the
rehydration process and to highlight the existing state of the art. Food rehydration
was depicted as a complex process that involves numerous mechanisms. Collaborative
multidisciplinary studies are required to provide the relevant information for applying
new theories and modeling the phenomena. The vastness of the data summarized in
this chapter calls for a new way of thinking and further development of advanced
methods for measuring physical properties in order to provide a better understanding
of the changes the product undergoes during both drying and rehydration. The fi eld
is entering a new era in which technology and scientifi c data can provide new insights
and deeper knowledge. This will ultimately lead to much better food products that
benefi t from enhanced consumer appeal and acceptability.
NOMENCLATURE
ABBREVIATIONS AND VARIABLES
AD air dried
AFD hot air-fl ow drying followed by vacuum freeze-drying
C liquid uptake coeffi cient (kg/m2 s0.5)
D true diffusion coeffi cient of water (m2/s)
Dcalc calculated diffusion coeffi cient of water (m2/s)
Deff effective diffusion coeffi cient of water (m2/s)
EP explosion puffed
FAD vacuum freeze-drying followed by hot air-fl ow drying
FD freeze-dried
g acceleration due to gravity (m/s2)
h pressure head (m)
HELP/PEF high-intensity electrical fi eld pulses
HP high pressure
HPLC high-performance liquid chromatography
Jx fl ux (g H2O/m2 s)
K hydraulic conductivity (m/s)
L half-slab thickness or radius for spherical and cylindrical samples (m)
M0 moisture content at time 0 (kg H2O/kg dry substance)
Me moisture content at equilibrium (kg H2O/kg dry substance)
Mt moisture content at time t (kg H2O/kg dry substance)
Ms surface moisture content (kg H2O/kg dry substance)
MW microwave
NDS nondissolvable solids
NMR nuclear magnetic resonance
52527_C009.indd 27552527_C009.indd 275 10/3/2008 3:58:57 PM10/3/2008 3:58:57 PM
© 2009 by Taylor & Francis Group, LLC

276 Advances in Food Dehydration
OD osmotic dehydration
P1, P2 parameters in thin-layer rewetting equation (exponential model)
P3 constant related to initial rate of sorption (kg dry substance/kg H2O)
P4 constant related to equilibrium moisture content (kg dry substance/
kg H2O)
P5 rehydration rate (min–1)
PVOD pulsed-vacuum osmotic dehydration
r pore radius (m)
RC rehydration capacity
RE reconstitution
Rg geometry factor (dimensionless)
RR rehydration ratio
S surface area (m2)
SEM scanning electron microscopy
t time (s)
TEM transmission electron microscopy
Tg glass-transition temperature
V volume (m3)
VI vacuum impregnation
VOD vacuum osmotic drying
VPD vacuum-puffed drying
W water content (kg H2O/m3)
W g H2O/g NDS at time t (s) (measured after ~18 to 24 h at ambient
temperature)
W0 g H2O/g NDS at time t0 (s)
Wt g H2O/g NDS at time t (s)x spatial coordinate (m)
X0 initial weight of dry sample (g)
Xi initial weight of sample before drying (g)
Xt weight after a given rehydration time (g)
X-ray MCT X-ray microcomputerized tomography
y distance traveled by liquid meniscus at time t (m)
GREEKS
a scale parameter (s)
a� normalized scale parameter (s)
b shape parameter (dimensionless)
g surface tension (N/m)
d contact angle (°)
e porosity
m viscosity (N s/m2)
r density (kg/m3)
t tortuosity
j negative pressure head (water suction; m)
52527_C009.indd 27652527_C009.indd 276 10/3/2008 3:58:57 PM10/3/2008 3:58:57 PM
© 2009 by Taylor & Francis Group, LLC

Rehydration and Reconstitution of Foods 277
REFERENCES
Abu-Ghannam, N. and McKenna, B., The application of Peleg’s equation to model water
absorption during the soaking of red kidney beans (Phaseolus vulgaris L.), J. Food Eng., 32, 391–401, 1997.
Ade-Omowaye, B.I.O., Rastogi, N.K., Angersbach, A., and Knorr, D., Osmotic dehydration
behavior of red paprika (Capsicum annuum L.), J. Food Sci., 67, 1790–1796, 2002.
Aguilera, J.M., Microstructure and food product engineering, Food Technol., 54, 56–58,
2000.
Aguilera, J.M., Why food microstructure? J. Food Eng., 67, 3–11, 2004.
Aguilera, J.M., Chiralt, A., and Fito, P., Food dehydration and product structure, Trends Food Sci. Technol., 14, 432–437, 2003.
Aguilera, J.M., Michel, M., and Mayor, G., Fat migration in chocolate: Diffusion or capillary
fl ow in a particulate solid? A hypothesis paper, J. Food Sci., 69, R167–R174, 2004.
Angersbach, A. and Knorr, D., High intensity electric fi eld pulses as pretreatment for affecting
dehydration characteristics and rehydration properties of potato cubes, Nahrung 41,
194–200, 1997.
Babin, P., Della Valle, G., Chiron, H., Cloetens, P., Hoszowska, J., Pernot, P., Reguerre, A.L.,
Salvo, L., and Dendievel, R., Fast x-ray tomography analysis of bubble growth and
foam setting during breadmaking, J. Cereal Sci., 43, 393–397, 2006.
Beaudry, C., Raghavan, G.S.V., Ratti, C., and Rennie, T.J., Effect of four drying methods on
the quality of osmotically dehydrated cranberries, Dry. Technol., 22, 521–539, 2004.
Becker, H.A., On the absorption of liquid water by the wheat kernel, Cereal Chem., 37,
309–323, 1960.
Bell, L.N. and Labuza, T.P., Moisture Sorption—Practical Aspects of Isotherm Measurement and Use, 2nd ed., American Association of Cereal Chemists, St. Paul, MN, 2000.
Bello, M., Tolaba, M.P., and Suarez, C., Factors affecting water uptake of rice grain during
soaking, Lebensm.-Wiss. Technol., 37, 811–816, 2004.
Benavente, D., Lock, P., Del Cura, M.A.G., and Ordonez, S., Predicting the capillary imbibition
of porous rocks from microstructure, Transp. Porous Media, 49, 59–76, 2002.
Bilbao-Sainz, C., Andres, A., and Fito, P., Hydration kinetics of dried apple as affected by
drying conditions, J. Food Eng., 68, 369–376, 2005.
Brooks, R.H. and Corey, A.T., Properties of porous media affecting fl uid fl ow, J. Irrig. Drain. Am. Soc. Civil Eng., IR2, 61–68, 1966.
Carbonell, S., Hey, M.J., Mitchell, J.R., Roberts, C.J., Hipkiss, J., and Vercauteren, J.,
Capillary fl ow and rheology measurements on chocolate crumb/sunfl ower oil mixtures,
J. Food Sci., 69, E465–E470, 2004.
Chhinnan, M.S., Evaluation of selected mathematical models for describing thin-layer drying
of in-shell pecans, Trans. ASAE, 27, 610–615, 1984.
Chiralt, A. and Fito, P., Transport mechanisms in osmotic dehydration: The role of the
structure, Food Sci. Technol. Int., 9, 179–186, 2003.
Contreras, C., Martin, M.E., Martinez-Navarrete, N., and Chiralt, A., Effect of vacuum
impregnation and microwave application on structural changes which occurred during
air-drying of apple, Lebensm.-Wiss. Technol., 38, 471–477, 2005.
Contreras, C., Martin-Esparza, M.E., Martinez-Navarrete, N., and Chiralt, A., Infl uence of
osmotic pre-treatment and microwave application on properties of air dried strawberry
related to structural changes, Eur. Food Res. Technol., 224, 499–504, 2007.
Cunha, L.M., Oliveira, F.A.R., and Ilincanu, L.A., Application of the probabilistic Weibull
distribution to rehydration kinetics: Relationship between the model parameters and
the underlying physical mechanisms, in Proceedings of the 3rd Workshop of the Copernicus Project, Oliveira, J.C. and Oliveira, F.A.R., Eds., Porto, 1998, pp. 9–13.
52527_C009.indd 27752527_C009.indd 277 10/3/2008 3:58:57 PM10/3/2008 3:58:57 PM
© 2009 by Taylor & Francis Group, LLC

278 Advances in Food Dehydration
Cunha, L.M., Oliveira, F.A.R., and Oliveira, J.C., Optimal experimental design for estimating
the kinetic parameters of processes described by the Weibull probability distribution
function, J. Food Eng., 37, 175–191, 1998.
Cunningham, S.E., McMinn, W.A.M., Magee, T.R.A., and Richardson, P.S., Modelling water
absorption of pasta during soaking, J. Food Eng., 82, 600–607, 2007.
Datta, A.K., Porous media approaches to studying simultaneous heat and mass transfer in
food processes. I: Problem formulations, J. Food Eng., 80, 90–95, 2007a.
Datta, A.K., Porous media approaches to studying simultaneous heat and mass transfer in
food processes. II: Property data and representative results, J. Food Eng., 80, 96–110,
2007b.
Debnath, S., Hemavathy, J., Bhat, K.K., and Rastogi, N.K., Rehydration characteristics of
osmotic pretreated and dried onion, Food Bioprod. Process., 82, 304–310, 2004.
del Valle, J.M., Stanley, D.W., and Bourne, M.C., Water absorption and swelling in dry bean
seeds, J. Food Process. Preserv., 16, 75–98, 1992.
Doulia, D., Tzia, K., and Gekas, V., A knowledge base for the apparent mass diffusion coeffi -
cient (Deff) of foods, Int. J. Food Prop., 3, 1–14, 2000.
Doymaz, I., Air-drying characteristics of tomatoes, J. Food Eng., 78, 1291–1297, 2007.
Eshtiaghi, M.N., Stute, R., and Knorr, D., High-pressure and freezing pretreatment effects on
drying, rehydration, texture and color of green beans, carrots and potatoes, J. Food Sci., 59, 1168–1170, 1994.
Falade, K.O. and Abbo, E., Air-drying and rehydration characteristics of date palm (Phoenix dactylifera L.) fruits, J. Food Eng., 79, 724–730, 2007.
Falcone, P.M., Baiano, A., Zanini, F., Mancini, L., Tromba, G., Dreossi, D., Montanari, F.,
Scuor, N., and d. Nobile, M.-A., Three-dimensional quantitative analysis of bread
crumb by x-ray microtomography, J. Food Sci., 70, E265–E272, 2005.
Falcone, P.M., Baiano, A., Zanini, F., Mancini, L., Tromba, G., Montanari, F., and d. Nobile,
M.-A., A novel approach to the study of bread porous structure: Phase-contrast x-ray
microtomography, J. Food Sci., 69, FEP38–FEP43, 2004.
Fan, L.T., Chu, P., and Shellenberger, J.A., Diffusion of water in kernels of corn and sorghum,
Cereal Chem., 40, 303–313, 1963.
Farkas, B.E. and Singh, R.P., Physical properties of air-dried and freeze-dried chicken white
meat, J. Food Sci., 56, 611–615, 1991.
Fito, P. and Chiralt, A., Food matrix engineering: The use of the water–structure–functionality
ensemble in dried food product development, Food Sci. Technol. Int., 9, 151–156, 2003.
Funebo, T., Ahrne, L., Kidman, S., Langton, M., and Skjoldebrand, C., Microwave heat
treatment of apple before air dehydration—Effects on physical properties and micro-
structure, J. Food Eng., 46, 173–182, 2000.
Garcia-Pascual, P., Sanjuan, N., Bon, J., Carreres, J.E., and Mulet, A., Rehydration process of
Boletus edulis mushroom: Characteristics and modelling, J. Sci. Food Agric., 85,
1397–1404, 2005.
Garcia-Pascual, P., Sanjuan, N., Melis, R., and Mulet, A., Morchella esculenta (morel)
rehydration process modelling, J. Food Eng., 72, 346–353, 2006.
Gekas, V., Transport Phenomena of Foods and Biological Materials, CRC Press, Boca Raton,
FL, 1992.
Giraldo, G., Vazquez, R., Martin-Esparza, M.E., and Chiralt, A., Rehydration kinetics and
soluble solids lixiviation of candied mango fruit as affected by sucrose concentration,
J. Food Eng., 77, 825–834, 2006.
Giri, S.K. and Prasad, S., Drying kinetics and rehydration characteristics of microwave–
vacuum and convective hot-air dried mushrooms, J. Food Eng., 78, 512–521, 2007.
Gowen, A., Abu-Ghannam, N., Frias, J., and Oliveira, J., Modeling the water absorption
process in chickpeas (Cicer arietinum L.)—The effect of blanching pre-treatment on
water intake and texture kinetics, J. Food Eng., 78, 810–819, 2007.
52527_C009.indd 27852527_C009.indd 278 10/3/2008 3:58:57 PM10/3/2008 3:58:57 PM
© 2009 by Taylor & Francis Group, LLC

Rehydration and Reconstitution of Foods 279
Gowen, A., Abu-Ghannam, N., Frias, J., and Oliveira, J., Optimisation of dehydration and
rehydration properties of cooked chickpeas (Cicer arietinum L.) undergoing microwave–
hot air combination drying, Trends Food Sci. Technol., 17, 177–183, 2006.
Gowen, A.A., Abu-Ghannam, N., Frias, J.M., Barat, J.M., Andres, A.M., and Oliveira, J.C.,
Comparative study of quality changes occurring on dehydration and rehydration of
cooked chickpeas (Cicer arietinum L.) subjected to combined microwave–convective
and convective hot air dehydration, J. Food Sci., 71, E282–E289, 2006.
Haedelt, J., Leo Pyle, D., Beckett, S.T., and Niranjan, K., Vacuum-induced bubble formation
in liquid-tempered chocolate, J. Food Sci., 70, E159–E164, 2005.
Hallstrom, B., Mass transport of water in foods—A consideration of engineering aspects,
J. Food Eng., 12, 45–52, 1990.
Hills, B.P., Babonneau, F., Quantin, V.M., Gaudet, F., and Belton, P.S., Radial NMR micro-
imaging studies of the rehydration of extruded pasta, J. Food Eng., 27, 71–86, 1996.
Horn, G.R. and Sterling, C., Studies on the rehydration of carrots, J. Sci. Food Agric., 33,
1035–1041, 1982.
Hung, T.V., Liu, L.H., Black, R.G., and Trewhella, M.A., Water absorption in chickpea
(C. arietinum) and fi eld pea (P. sativum) cultivars using the Peleg model, J. Food Sci., 58, 848–852, 1993.
Ilincanu, L.A., Oliveira, F.A.R., Drumond, M.C., Machado, M.F., and Gekas, V., Modeling
moisture uptake and soluble solids losses during rehydration of dried apple pieces, in
Proceedings of the 1st Workshop of the Copernicus Project, Oliveira, J.C., Ed., Escola
Superior de Biotecnologia, Porto, Portugal, 1995, pp. 64–69.
Jambrak, A.R., Mason, T.J., Paniwnyk, L., and Lelas, V., Accelerated drying of button
mushrooms, Brussels sprouts and caulifl ower by applying power ultrasound and its
rehydration properties, J. Food Eng., 81, 88–97, 2007.
Kadam, D.M., Samuel, D.V.K., and Parsad, R., Optimisation of pre-treatments of solar
dehydrated caulifl ower, J. Food Eng., 77, 659–664, 2006.
Karathanos, V.T., Anglea, S., and Karel, M., Collapse of structure during drying of celery,
Dry. Technol., 11, 1005–1023, 1993.
Karathanos, V.T., Kanellopoulos, N.K., and Belessiotis, V.G., Development of porous structure
during air drying of agricultural plant products, J. Food Eng., 29, 167–183, 1996.
Karathanos, V.T., Vagenas, G.K., and Saravacos, G.D., Water diffusivity in starches at high
temperatures and pressures, Biotechnol. Progr., 7, 178–184, 1991.
Kaymak-Ertekin, F., Drying and rehydrating kinetics of green and red peppers, J. Food Sci., 67, 168–175, 2002.
Krokida, M.K. and Marinos-Kouris, D., Rehydration kinetics of dehydrated products, J. Food Eng., 57, 1–7, 2003.
Krokida, M.K. and Maroulis, Z.B., Effect of drying method on shrinkage and porosity, Dry. Technol., 15, 2441–2458, 1997.
Krokida, M.K. and Maroulis, Z.B., Effect of microwave drying on some quality properties of
dehydrated products, Dry. Technol., 17, 449–466, 1999.
Krokida, M.K. and Maroulis, Z.B., Structural properties of dehydrated products during
rehydration, Int. J. Food Sci. Technol., 36, 529–538, 2001.
Krokida, M.K. and Philippopoulos, C., Rehydration of dehydrated foods, Dry. Technol., 23,
799–830, 2005.
Lee, K.T., Farid, M., and Nguang, S.K., The mathematical modelling of the rehydration
characteristics of fruits, J. Food Eng., 72, 16–23, 2005.
Levi, A., Ben Shalom, N., Plat, D., and Reid, D.S., Effect of blanching and drying on pectin
constitutents and related characteristics of dehydrated peaches, J. Food Sci., 53,
1187–1190, 1988.
Lewicki, P.P., Effect of pre-drying treatment, drying and rehydration on plant tissue properties:
A review, Int. J. Food Prop., 1, 1–22, 1998a.
52527_C009.indd 27952527_C009.indd 279 10/3/2008 3:58:57 PM10/3/2008 3:58:57 PM
© 2009 by Taylor & Francis Group, LLC

280 Advances in Food Dehydration
Lewicki, P.P., Some remarks on rehydration of dried foods, J. Food Eng., 36, 81–87, 1998b.
Lewicki, P.P., Design of hot air drying for better foods, Trends Food Sci. Technol., 17,
153–163, 2006.
Lewicki, P.P., Le, H.V., and Pomaranska-Lazuka, W., Effect of pre-treatment on convective
drying of tomatoes, J. Food Eng., 54, 141–146, 2002.
Lewicki, P.P. and Pawlak, G., Effect of mode of drying on microstructure of potato,
Dry. Technol., 23, 847–869, 2005.
Lewicki, P.P. and Wiczkowska, J., Rehydration of apple dried by different methods, Int. J. Food Prop., 9, 217–226, 2006.
Lewicki, P.P., Witrowa-Rajchert, D., Pomaranska-Lazuka, W., and Nowak, D., Rehydration
properties of dried onion, Int. J. Food Prop., 1, 275–290, 1998.
Lim, K.S. and Barigou, M., X-ray micro-computed tomography of cellular food products,
Food Res. Int., 37, 1001–1012, 2004.
Lin, T.M., Durance, T.D., and Scaman, C.H., Characterization of vacuum microwave, air and
freeze dried carrot slices, Food Res. Int., 31, 111–117, 1998.
Litvin, S., Mannheim, C.H., and Miltz, J., Dehydration of carrots by a combination of freeze
drying, microwave heating and air or vacuum drying, J. Food Eng., 36, 103–111, 1998.
Lu, R., Siebenmorgen, T.J., and Archer, T.R., Absorption of water in long-grain rough rice
during soaking, J. Food Process Eng., 17, 141–154, 1994.
Lucas, T., Le Ray, D., and Mariette, F., Kinetics of water absorption and solute leaching
during soaking of breakfast cereals, J. Food Eng., 80, 377–384, 2007.
Machado, M.F., Oliveira, F.A.R., and Cunha, L.M., Effect of milk fat and total solids concen-
tration on the kinetics of moisture uptake by ready-to-eat breakfast cereal, Int. J. Food Sci. Technol., 34, 47–57, 1999.
Machado, M.F., Oliveira, F.A.R., and Gekas, V., Modeling water uptake and soluble solids
losses by puffed breakfast cereal immersed in water or milk, in Proceedings of the Seventh International Congress on Engineering and Food—Part I, Jowitt, R., Ed.,
Sheffi eld Academic Press, Sheffi eld, U.K., 1997, pp. A65–A68.
Machado, M.F., Oliveira, F.A.R., Gekas, V., and Singh, R.P., Kinetics of moisture uptake and
soluble-solids loss by puffed breakfast cereals immersed in water, Int. J. Food Sci. Technol., 33, 225–237, 1998.
Marabi, A., Dilak, C., Shah, J., and Saguy, I.S., Kinetics of solids leaching during rehydration
of particulate dry vegetables, J. Food Sci., 69, FEP91–FEP96, 2004.
Marabi, A., Jacobson, M., Livings, S., and Saguy, I.S., Effect of mixing and viscosity on
rehydration of dry food particulates, Eur. Food Res. Technol., 218, 339–344, 2004.
Marabi, A., Livings, S., Jacobson, M., and Saguy, I.S., Normalized Weibull distribution for
modeling rehydration of food particulates, Eur. Food Res. Technol., 217, 311–318, 2003.
Marabi, A. and Saguy, I.S., Effect of porosity on rehydration of dry food particulates, J. Sci. Food Agric., 84, 1105–1110, 2004.
Marabi, A. and Saguy, I.S., Viscosity and starch particle size effects on rehydration of freeze-
dried carrots, J. Sci. Food Agric., 85, 700–706, 2005.
Marabi, A., Thieme, U., Jacobson, M., and Saguy, I.S., Infl uence of drying method and
rehydration time on sensory evaluation of rehydrated carrot particulates, J. Food Eng., 72, 211–217, 2006.
Marmur, A. and Cohen, R.D., Characterization of porous media by the kinetics of liquid
penetration: The vertical capillaries model, J. Colloid Interface Sci., 189, 299–304,
1997.
Maroulis, Z.B., Saravacos, G.D., Panagiotou, N.M., and Krokida, M.K., Moisture diffusivity
data compilation for foodstuffs: Effect of material moisture content and temperature,
Int. J. Food Prop., 4, 225–237, 2001.
Marousis, S.N., Karathanos, V.T., and Saravacos, G.D., Effect of physical structure of starch
materials on water diffusivity, J. Food Process. Preserv., 15, 183–195, 1991.
52527_C009.indd 28052527_C009.indd 280 10/3/2008 3:58:57 PM10/3/2008 3:58:57 PM
© 2009 by Taylor & Francis Group, LLC

Rehydration and Reconstitution of Foods 281
Martinez-Navarrete, N. and Chiralt, A., Water diffusivity and mechanical changes during
hazelnut hydration, Food Res. Int., 32, 447–452, 1999.
Maskan, M., Microwave/air and microwave fi nish drying of banana, J. Food Eng., 44, 71–78,
2000.
Maskan, M., Drying, shrinkage and rehydration characteristics of kiwifruits during hot air
and microwave drying, J. Food Eng., 48, 177–182, 2001.
Maskan, M., Effect of processing on hydration kinetics of three wheat products of the same
variety, J. Food Eng., 52, 337–341, 2002.
Mastrocola, D., Barbanti, D., Dalla Rosa, R.M., and Pittia, P., Physicochemical characteristics
of dehydrated apple cubes reconstituted in sugar solutions, J. Food Sci., 63, 495–498,
1998.
Mastrocola, D., Dalla Rosa, R.M., and Massini, R., Freeze-dried strawberries rehydrated in
sugar solutions: Mass transfers and characteristics of fi nal products, Food Res. Int., 30,
359–364, 1997.
Mate, J.I., Quartaert, C., Meerdink, G., and van’t Riet, K., Effect of blanching on structural
quality of dried potato slices, J. Agric. Food Chem., 46, 676–681, 1998.
Mayor, L. and Sereno, A.M., Modelling shrinkage during convective drying of food materials:
A review, J. Food Eng., 61, 373–386, 2004.
Meda, L. and Ratti, C., Rehydration of freeze-dried strawberries at varying temperatures,
J. Food Process Eng., 28, 233–246, 2005.
Misra, M.K. and Brooker, D.B., Thin-layer drying and rewetting equations for shelled yellow
corn, Trans. ASAE, 23, 1254–1260, 1980.
Moreira, R.G. and Barrufet, M.A., A new approach to describe oil absorption in fried foods:
A simulation study, J. Food Eng., 35, 1–22, 1998.
Mousavi, R., Miri, T., Cox, P.W., and Fryer, P.J., A novel technique for ice crystal visual-
ization in frozen solids using x-ray micro-computed tomography, Int. J. Food Sci. Technol., 42, 714–727, 2007.
Nayak, C.A., Suguna, K., and Rastogi, N.K., Combined effect of gamma-irradiation and
osmotic treatment on mass transfer during rehydration of carrots, J. Food Eng., 74,
134–142, 2006.
Neubert, A.M., Wilson III, C.W., and Miller, W.H., Studies on celery rehydration, Food Technol., 22, 1296–1301, 1968.
Nieto, A., Salvatori, D., Castro, M.A., and Alzamora, S.M., Air drying behaviour of apples as
affected by blanching and glucose impregnation, J. Food Eng., 36, 63–79, 1998.
Oliveira, F.A.R. and Ilincanu, L., Rehydration of dried plant tissues: Basic concepts and
mathematical modeling, in Processing Foods, Oliveira, F.A.R. and Oliveira, J.C., Eds.,
CRC Press, Boca Raton, FL, 1999, pp. 201–227.
Oliveira, F.A.R. and Silva, C.L.M., Freezing infl uences diffusion of reducing sugars in carrot
cortex, J. Food Sci., 57, 932–934, 1992.
Pappas, C., Tsami, E., and Marinos, K.D., The effect of process conditions on the drying
kinetics and rehydration characteristics of some MW–vacuum dehydrated fruits, Dry. Technol., 17, 157–174, 1999.
Paulus, K. and Saguy, I.S., Effect of heat-treatment on the quality of cooked carrots, J. Food Sci., 45, 239, 1980.
Peleg, M., An empirical-model for the description of moisture sorption curves, J. Food Sci., 53, 1216–1219, 1988.
Pinthus, E.J. and Saguy, I.S., Initial interfacial tension and oil uptake by deep-fat fried foods,
J. Food Sci., 59, 804–807, 1994.
Planinic, M., Velic, D., Tomas, S., Bilic, M., and Bucic, A., Modelling of drying and rehydration
of carrots using Peleg’s model, Eur. Food Res. Technol., 221, 446–451, 2005.
Prakash, S., Jha, S.K., and Datta, N., Performance evaluation of blanched carrots dried by
three different driers, J. Food Eng., 62, 305–313, 2004.
52527_C009.indd 28152527_C009.indd 281 10/3/2008 3:58:57 PM10/3/2008 3:58:57 PM
© 2009 by Taylor & Francis Group, LLC

282 Advances in Food Dehydration
Prothon, F., Ahrne, L.M., Funebo, T., Kidman, S., Langton, M., and Sjoholm, I., Effects of
combined osmotic and microwave dehydration of apple on texture, microstructure and
rehydration characteristics, Lebensm.-Wiss. Technol., 34, 95–101, 2001.
Quintero-Ramos, A., Bourne, M.C., and Anzaldua-Morales, A., Texture and rehydration of
dehydrated carrots as affected by low temperature blanching, J. Food Sci., 57,
1127–1128, 1992.
Rahman, M.S., Dried food properties: Challenges ahead, Dry. Technol., 23, 695–715, 2005.
Ramos, I.N., Silva, C.L.M., Sereno, A.M., and Aguilera, J.M., Quantifi cation of micro-
structural changes during fi rst stage air drying of grape tissue, J. Food Eng., 62,
159–164, 2004.
Rastogi, N.K., Angersbach, A., Niranjan, K., and Knorr, D., Rehydration kinetics of high-pressure
pretreated and osmotically dehydrated pineapple, J. Food Sci., 65, 838–841, 2000.
Ravindra, M.R. and Chattopadhyay, P.K., Optimisation of osmotic preconcentration and
fl uidised bed drying to produce dehydrated quick-cooking potato cubes, J. Food Eng., 44, 5–11, 2000.
Rodriguez, S., Villanueva-Suarez, M.J., and Redondo, C.A., Effects of processing conditions
on soluble sugars content of carrot, beetroot and turnip, Food Chem., 66, 81–85, 1999.
Rosin, P. and Rammler, E., The laws governing the fi neness of powdered coal, J. Inst. Fuel., 7, 27–36, 1933.
Ruiz-Cabrera, M.A., Salgado-Cervantes, M.A., Waliszewski-Kubiak, K.N., and Garcia-
Alvarado, M.A., The effect of path diffusion on the effective moisture diffusivity in
carrot slabs, Dry. Technol., 15, 169–181, 1997.
Ruiz-Diaz, G., Martinez-Monzo, J., and Chiralt, A., Modelling of dehydration–rehydration of
orange slices in combined microwave/air drying, Innov. Food Sci. Emerg. Technol., 4,
203–209, 2003.
Saca, S.A. and Lozano, J.E., Explosion puffi ng of bananas, Int. J. Food Sci. Technol., 27,
419–426, 1992.
Sacchetti, G., Pittia, P., Biserni, M., Pinnavaia, G.G., and Rosa, M.D., Kinetic modelling of
textural changes in ready-to-eat breakfast cereals during soaking in semi-skimmed
milk, Int. J. Food Sci. Technol., 38, 135–143, 2003.
Saguy, I.S. and Marabi, A., Rehydration of dried food particulates, in Encyclopedia of Agricultural, Food, and Biological Engineering, Heldman, D.R., Ed., Marcel Dekker,
New York, 2005.
Saguy, I.S., Marabi, A., and Wallach, R., Liquid imbibition during rehydration of dry porous
foods, Innov. Food Sci. Emerg. Technol., 6, 37–43, 2005a.
Saguy, I.S., Marabi, A., and Wallach, R., New approach to model rehydration of dry food
particulates utilizing principles of liquid transport in porous media, Trends Food Sci. Technol., 16, 495–506, 2005b.
Salvatori, D., Andres, A., Chiralt, A., and Fito, P., Osmotic dehydration progression in apple
tissue II: Generalized equations for concentration prediction, J. Food Eng., 42,
133–138, 1999.
Sanjuan, N., Carcel, J.A., Clemente, G., and Mulet, A., Modelling of the rehydration process
of broccoli fl orets, Eur. Food Res. Technol., 212, 449–453, 2001.
Sanjuan, N., Clemente, G., Bon, J., and Mulet, A., The effect of blanching on the quality of
dehydrated broccoli fl orets, Eur. Food Res. Technol., 213, 474–479, 2001.
Sanjuan, N., Simal, S., Bon, J., and Mulet, A., Modelling of broccoli stems rehydration
process, J. Food Eng., 42, 27–31, 1999.
Saravacos, G.D. and Maroulis, Z.B., Transport of water in food materials, in Transport Properties of Foods, Marcel Dekker, New York, 2001, pp. 105–162.
Schwartzberg, H.G., Mathematical analysis of solubilization kinetics and diffusion in foods,
J. Food Sci., 40, 211–213, 1975.
52527_C009.indd 28252527_C009.indd 282 10/3/2008 3:58:57 PM10/3/2008 3:58:57 PM
© 2009 by Taylor & Francis Group, LLC

Rehydration and Reconstitution of Foods 283
Schwartzberg, H.G. and Chao, R.Y., Solute diffusivities in leaching processes, Food Technol., 36, 73–86, 1982.
Shi, X.Q. and Fito-Maupoey, P., Mass transfer in vacuum osmotic dehydration of fruits:
A mathematical model approach, Lebensm.-Wiss. Technol., 27, 67–72, 1994.
Singh, B., Panesar, P.S., Gupta, A.K., and Kennedy, J.F., Optimisation of osmotic dehydration
of carrot cubes in sucrose–salt solutions using response surface methodology, Eur. Food Res. Technol., 225, 157–165, 2007.
Singh, B., Panesar, P.S., Nanda, V., Gupta, A.K., and Kennedy, J.F., 2006. Application of
response surface methodology for the osmotic dehydration of carrots, J. Food Process Eng., 29, 592–614.
Singh, P.P., Maier, D.E., Cushman, J.H., Haghighi, K., and Corvalan, C., Effect of visco-
elastic relaxation on moisture transport in foods. Part I: Solution of general transport
equation, J. Math. Biol., 49, 1–19, 2004.
Sopade, P.A., Ajisegiri, E.S., and Badau, M.H., The use of Peleg’s equation to model water-
absorption in some cereal-grains during soaking, J. Food Eng., 15, 269–283, 1992.
Sumnu, G., Turabi, E., and Oztop, M., Drying of carrots in microwave and halogen lamp-
microwave combination ovens, LWT Food Sci. Technol., 38, 549–553, 2005.
Taiwo, K.A., Angersbach, A., and Knorr, D., Infl uence of high intensity electric fi eld pulses
and osmotic dehydration on the rehydration characteristics of apple slices at different
temperatures, J. Food Eng., 52, 185–192, 2002a.
Taiwo, K.A., Angersbach, A., and Knorr, D., Rehydration studies on pretreated and osmotically
dehydrated apple slices, J. Food Sci., 67, 842–847, 2002b.
Tillotson, J.E., Convenience foods, in Encyclopedia of Food Sciences and Nutrition, Trugo,
L. and Finglas, P.M., Eds., Academic Press, Oxford, U.K., 2003, pp. 1616–1622.
Tomasula, P. and Kozempel, M.F., Diffusion coeffi cients of glucose, potassium, and magnesium
in Maine Russet Burbank and Maine Katahdin potatoes from 45 to 90 degrees, J. Food Sci., 54, 985–989, 1989.
Torringa, E., Esveld, E., Scheewe, I., van den Berg, R., and Bartels, P., Osmotic dehydration
as a pre-treatment before combined microwave–hot-air drying of mushrooms, J. Food Eng., 49, 185–191, 2001.
Trater, A.M., Alavi, S., and Rizvi, S.S.H., Use of non-invasive x-ray microtomography for
characterizing microstructure of extruded biopolymer foams, Food Res. Int., 38, 709–719,
2005.
Turhan, M., Sayar, S., and Gunasekaran, S., Application of Peleg model to study water
absorption in chickpea during soaking, J. Food Eng., 53, 153–159, 2002.
Vagenas, G.K. and Karathanos, V.T., Prediction of moisture diffusivity in granular materials,
with special applications to foods, Biotechnol. Prog., 7, 419–426, 1991.
van Genuchten, M.Th., A closed-form equation for predicting the hydraulic conductivity of
unsaturated soils, Soil Sci. Soc. Am. J., 44, 892–898, 1980.
Vidal, V.C., Frias, J., and Valverde, S., Effect of processing on the soluble carbohydrate
content of lentils, J. Food Protect., 55, 301–304, 1992.
Vidal, V.C., Frias, J., and Valverde, S., Changes in the carbohydrate composition of legumes
after soaking and cooking, J. Am. Diet. Assoc., 93, 547–550, 1993.
Waananen, K.M., Litchfi eld, J.B., and Okos, M.R., Classifi cation of drying models for porous
solids, Dry. Technol., 11, 1–40, 1993.
Waananen, K.M. and Okos, M.R., Effect of porosity on moisture diffusion during drying of
pasta, J. Food Eng., 28, 121–137, 1996.
Wang, J. and Chao, Y., Effect of gamma irradiation on quality of dried potato, Radiat. Phys. Chem., 66, 293–297, 2003.
Wang, J. and Du, Y.S., The effect of gamma-ray irradiation on the drying characteristics and
fi nal quality of dried potato slices, Int. J. Food Sci. Technol., 40, 75–82, 2005.
52527_C009.indd 28352527_C009.indd 283 10/3/2008 3:58:57 PM10/3/2008 3:58:57 PM
© 2009 by Taylor & Francis Group, LLC

284 Advances in Food Dehydration
Weerts, A.H., Lian, G., and Martin, D., Modeling rehydration of porous biomaterials:
Anisotropy effects, J. Food Sci., 68, 937–942, 2003a.
Weerts, A.H., Lian, G., and Martin, D., Modeling the hydration of foodstuffs: Temperature
effects, AIChE J., 49, 1334–1339, 2003b.
Weibull, W., A statistical theory of the strength of materials, R. Swed. Inst. Eng Res. Process., 151, 5–51, 1939.
Witrowa-Rajchert, D. and Lewicki, P.P., Rehydration properties of dried plant tissues, Int. J. Food Sci. Technol., 41, 1040–1046, 2006.
Xu, Y., Zhang, M., Tu, D., Sun, J., Zhou, L., and Mujumdar, A.S., A two-stage convective air
and vacuum freeze-drying technique for bamboo shoots, Int. J. Food Sci. Technol., 40,
589–595, 2005.
Zogzas, N.P., Maroulis, Z.B., and Marinos-Kouris, D., Densities, shrinkage and porosity of
some vegetables during air drying, Dry. Technol., 12, 1653–1666, 1994..
52527_C009.indd 28452527_C009.indd 284 10/3/2008 3:58:57 PM10/3/2008 3:58:57 PM
© 2009 by Taylor & Francis Group, LLC

285
10 Dehydration Processes for Nutraceuticals and Functional Foods
Susan D. St. George and Stefan Cenkowski
CONTENTS
10.1 Introduction ............................................................................................. 286
10.2 Nutraceuticals and Functional Foods ...................................................... 286
10.2.1 Nutraceuticals .......................................................................... 287
10.2.2 Functional Foods ...................................................................... 287
10.2.3 Phytochemicals ........................................................................ 287
10.2.4 Classifi cation and Activity of Major Bioactive Compounds .... 288
10.2.4.1 Isoprenoids ............................................................... 288
10.2.4.2 Phenolics .................................................................. 288
10.2.4.3 FAs and Structural Lipids ........................................ 288
10.2.4.4 Carbohydrates and Derivatives ................................ 289
10.2.4.5 Proteins and Amino Acids ...................................... 289
10.2.4.6 Minerals ................................................................... 289
10.2.4.7 Activity of Bioactive Compounds ........................... 289
10.2.5 Product Development ............................................................... 290
10.2.6 Bioactive Compound Stability during Drying ......................... 291
10.3 Applicable Drying Methods .................................................................... 292
10.3.1 Air, Sun, and Solar Drying ...................................................... 292
10.3.2 Osmotic Drying and Pretreatments ......................................... 293
10.3.3 Convective Air Dryers ............................................................. 293
10.3.4 Fixed Bed and Fluidized Systems ............................................ 294
10.3.4.1 Fluidized Bed Drying .............................................. 294
10.3.4.2 Spouted Bed Drying ................................................ 294
10.3.4.3 Rotary Drying .......................................................... 295
10.3.4.4 Encapsulation with Fluidized Bed Technology ....... 295
10.3.5 Drum and Refractance Window® Dryers ................................ 295
10.3.6 Spray Drying .............................................................................. 297
10.3.7 Freeze-Drying ............................................................................ 299
10.3.8 Vacuum Drying .......................................................................... 299
10.3.9 Microwave Drying ................................................................... 299
52527_C010.indd 28552527_C010.indd 285 10/3/2008 3:59:35 PM10/3/2008 3:59:35 PM
© 2009 by Taylor & Francis Group, LLC

286 Advances in Food Dehydration
10.3.10 Infrared Drying ........................................................................ 300
10.3.11 Combination Systems .............................................................. 300
10.4 Drying Methods and Quality Retention .................................................. 300
10.4.1 Berries ...................................................................................... 301
10.4.2 Tomatoes .................................................................................. 303
10.4.2 Carrots ..................................................................................... 304
10.4.4 Botanicals ................................................................................ 305
10.4.4.1 Ginseng .................................................................... 305
10.4.4.2 Echinacea ................................................................ 305
10.4.4.3 Herbs ........................................................................ 305
10.4.5 Oilseeds and Legumes ............................................................. 307
10.4.5.1 Oilseeds ..................................................................... 307
10.4.5.2 Legumes .................................................................... 307
10.5 Latest Advances ...................................................................................... 307
Nomenclature ..................................................................................................... 308
References .......................................................................................................... 309
10.1 INTRODUCTION
Awareness of the potential role of diet in the prevention and management of chronic
and degenerative disease has led to a demand for high quality, safe, and effective
healthy and benefi cial food and food-based products. This growing demand has
resulted in the formation and development of the nutraceutical and functional food
industries. As with the development of any new industry, this creates the need for a
greater knowledge base and associated methods and technology development.
Ongoing contributions to this knowledge and methods base include the identifi ca-
tion of structure, activity, and quantifi cation of major biologically active (bioactive)
compounds. Until recently, food product quality was based primarily on physical
and sensory characteristics; however, it can now extend to the preservation of key
bioactive compounds. This knowledge can facilitate the assessment of the effects
of processing on individual bioactive compounds in the fi nal product. A variety of
processing methods, including drying, are employed in the development of nutraceu-
ticals and functional foods.
Because of the continual growth of the nutraceutical and functional food indus-
tries, there is a constant stream of studies reporting new research developments. The
aim of this discussion is to provide a current overview of the use of drying in the
development of safe and effective plant-based nutraceuticals and functional foods.
This chapter is divided into four main sections: an overview of the nutraceutical and
functional food industries, applicable drying technologies, drying methods and quality
retention, and latest advances in the area.
10.2 NUTRACEUTICALS AND FUNCTIONAL FOODS
The traditional role of diet has been to provide energy and essential nutrients to
sustain life and growth. However, with aging populations, longer life expectancies,
52527_C010.indd 28652527_C010.indd 286 10/3/2008 3:59:35 PM10/3/2008 3:59:35 PM
© 2009 by Taylor & Francis Group, LLC

Dehydration Processes for Nutraceuticals and Functional Foods 287
and increasing health-care costs, the developed world is addressing the role of diet
and lifestyle in the prevention and management of chronic and degenerative diseases
(Oomah and Mazza, 2000). Preventable diseases such as certain cancers, heart
disease, stroke, diabetes, diseases of the arteries, and osteoporosis have important
dietary links (WHO, 2004). Part of a strategy to boost health and reduce the risk of
disease involves incorporating foods and food products rich in healthful bioactive
compounds into a healthy lifestyle, which includes exercise and a nutritious diet
(Oomah and Mazza, 2000).
Several terms are used to describe the many natural products currently being
developed for health benefi ts: functional foods, nutraceuticals, pharmafoods, designer
foods, vitafoods, phytochemicals, phytofoods, medical foods, and “foodaceuticals”
(foods combined with drugs to enhance body and mind; Oomah and Mazza, 2000;
Small and Catling, 1999). Although the terms nutraceutical and functional food are
the most commonly used worldwide, there is no defi nite consensus on their meaning.
The defi nitions recognized by Health Canada (1998) will be employed to maintain
consistency throughout the remainder of this discussion. The following sections will
provide a description of the most commonly used terms in the nutraceutical and
functional food industries, potential activity associated with certain bioactive com-
pounds, product development, and compound stability.
10.2.1 NUTRACEUTICALS
A plant-based nutraceutical is a product isolated or purifi ed from a food derived from
plant material, and it is generally sold in medicinal forms (capsules, tablets, powders,
and potions) that are not usually associated with foods (Health Canada, 1998). To be
considered a nutraceutical, a product must also offer a physiological benefi t or assist
in the management or prevention of chronic and/or degenerative disease. Within
Canada, nutraceuticals are included in the category of natural health products. Other
natural health products include traditional herbal medicines; Chinese, Ayurvedic,
and Native North American medicines; homeopathic preparations; and vitamin and
mineral supplements.
10.2.2 FUNCTIONAL FOODS
A functional food appears similar to or is a conventional food that is consumed as
part of a usual diet and has a physiological benefi t or assists in the management or
prevention of chronic and/or degenerative disease (Health Canada, 1998). A food
can be made functional through the elimination of a compound having a negative
physiological effect, increasing the concentration of benefi cial compounds, adding a
new compound observed to offer benefi ts, and partial replacement of a negative
compound by a benefi cial one without adversely affecting the nutritional value of the
food (Gibson and Fuller, 1998).
10.2.3 PHYTOCHEMICALS
Plant chemicals (phytochemicals) are the bioactive compounds that contribute to the
activity of plant-based nutraceuticals and functional foods (Oomah and Mazza, 2000).
52527_C010.indd 28752527_C010.indd 287 10/3/2008 3:59:35 PM10/3/2008 3:59:35 PM
© 2009 by Taylor & Francis Group, LLC

288 Advances in Food Dehydration
Plants synthesize both primary and secondary metabolites (Webb, 2006; Wildman,
2001a). Primary metabolites include proteins, amino acids, chlorophyll, membrane
lipids, nucleotides, and carbohydrates necessary for the existence of plants. Secondary
metabolites have not been linked to plant processes (photosynthesis, respiration,
etc.), and they were originally regarded as nonfunctional waste products. However,
researchers now recognize that secondary metabolites, which fulfi ll important functions,
may be associated only with certain plant species or taxonomically related groups.
Functions include protecting the plant from herbivores, insects, fungi, bacteria,
microbial infection, and ultraviolet light, as well as producing colorful pigments that
attract insects and birds for pollination and seed dispersal. Secondary metabolites
can be divided into three main groups: isoprenoid derivatives, phenolics, and sulfur
and nitrogen containing compounds.
10.2.4 CLASSIFICATION AND ACTIVITY OF MAJOR BIOACTIVE COMPOUNDS
Combining primary and secondary plant metabolites enables a simple classifi cation
of bioactive compounds based on their chemical nature: isoprenoid derivatives,
phenolic substances, fatty acids (FAs) and structural lipids, carbohydrates and deriv-
atives, amino acid based substances, and minerals (Wildman, 2001b).
10.2.4.1 Isoprenoids
The isoprenoid derivative class of 25,000 different substances, one of the largest of the
secondary metabolites, includes carotenoids, saponins, sterols, and simple terpenes
(Wildman, 2001b). The carotenoids, including carotenes and xanthophylls (pigments
that produce yellow, orange, and red colors), also play a signifi cant role in photosyn-
thesis and photoprotection. Saponins and sterols are gaining interest because of their
potential cholesterol reducing ability (Wasowicz, 2003). Essential oils, a mixture of
volatile monoterpenes and sesquiterpenes that impart the characteristic odor associ-
ated with specifi c plants, are often used in fl avorings and perfumes (Webb, 2006).
10.2.4.2 Phenolics
Phenolics, a class of more than 8000 secondary metabolites, includes cinnamic and
benzoic acid derivatives and simple phenols, coumarins, fl avonoids and stilbenes,
lignans and lignins, suberins and cutins, tannins, and tocopherols and tocotrienols
(Shahidi and Naczk, 2004). Among the fl avonoid groups are fl avonols (quercitin,
kaempferol, myricetin), fl avones (rutin), fl avanols (catechins, proanthrocyanidins),
anthocyanidins (cyanidin), fl avonones (hesperidin), and isofl avones (genistein, daidzein;
Shahidi and Naczk, 2004; Webb, 2006). Tocopherol (�-T, �-T, �-T, and �-T) and
tocotrienol (�-T3, �-T3, �-T3, and �-T3) isomers offer vitamin E activity (Shahidi
and Naczk, 2004).
10.2.4.3 FAs and Structural Lipids
Plants contain structural lipids, which build cell membranes, and triacylglycerols
(Kołakowska and Sikorski, 2003). Structural lipids consist of phospholipids (lecithin)
52527_C010.indd 28852527_C010.indd 288 10/3/2008 3:59:35 PM10/3/2008 3:59:35 PM
© 2009 by Taylor & Francis Group, LLC

Dehydration Processes for Nutraceuticals and Functional Foods 289
and glycolipids. Lipids offer important functions in nutrient and antioxidant delivery
(tocopherols, tocotrienols, and carotenoids). FA composition, which differs between
plant products, determines the physical properties, stability, and nutritive value of
lipids. Although many FAs contribute to health benefi ts, of particular interest are the
essential polyunsaturated FAs (PUFAs), linoleic and �-linolenic acids (ALA), which
cannot be synthesized by human or animals. These acids convert to eicosanoids that
affect physiological reactions ranging from blood clotting to immune response. Oleic
acid, a monounsaturated FA, is valued for its cholesterol lowering effect.
10.2.4.4 Carbohydrates and Derivatives
Among the carbohydrate and derivatives class, ascorbic acid (vitamin C) is one of
the most utilized functional ingredients. Certain oligosaccharides may function as
prebiotics that promote the growth of benefi cial bacteria in the gastrointestinal tract.
Another term for nonstarch plant polysaccharides is fi ber, which can be separated
into two groups: soluble and insoluble. Included within the insoluble fi ber group are
cellulose, hemicellulose, and the phenol lignan (Jalili et al., 2001).
10.2.4.5 Proteins and Amino Acids
The protein or amino acid based group includes intact protein (soy), polypeptides,
amino acids, and nitrogenous and sulfur amino acid derivatives (capsaicinoids,
isothiocyanates, allyl-s compounds; Wildman, 2001b). The amino acids arginine,
ornithine, taurine, and aspartic acid have been investigated for their functional
activity.
10.2.4.6 Minerals
Specifi c minerals (i.e., calcium, potassium, and trace minerals such as copper,
selenium, manganese, and zinc) are recognized for their functionality and are
being included as nutraceutical and functional food ingredients (Wildman, 2001b).
The activity of trace minerals is attributable to antioxidation. However, as with many
other natural compounds, toxicity may be an issue, depending on the dosage.
10.2.4.7 Activity of Bioactive Compounds
Organizing the compounds according to structure does not provide a clear indication
of their respective functionality or activity. Major bioactive compounds, potential
activity, and health benefi ts for selected foods are listed in Table 10.1. Much research
is still required in human clinical testing to ascertain whether claims made for
specifi c compounds or foods are valid. Comparing the bioactive compound classes
that are shared by cranberries and blueberries, we would expect the same activity and
health benefi ts. However, each of these fruits is composed of a unique set of com-
pounds. A common thread that the four foods shown in Table 10.1 share is that they all
possess antioxidant activity. Oxidative stress has been linked to many degenerative
diseases including cancer, atherosclerosis, cardiovascular disease, arthritis, and
diabetes. Antioxidants can restrict the effects of oxidation either directly (i.e., elimi-
nation of free radicals) or indirectly (i.e., prevention of radical formation; Shahidi and
52527_C010.indd 28952527_C010.indd 289 10/3/2008 3:59:36 PM10/3/2008 3:59:36 PM
© 2009 by Taylor & Francis Group, LLC

290 Advances in Food Dehydration
Naczk, 2004). There is some evidence, however, that in certain instances some com-
pounds such as �-carotene can possess prooxidant activity (Eskin and Tamir, 2006).
10.2.5 PRODUCT DEVELOPMENT
A separate discussion of the development of nutraceuticals and functional foods is
appropriate because they are available in very different forms. Nutraceuticals can be
developed from raw plant materials or a portion of the product as extracted com-
pounds or components. Processed raw materials can include or contain granules
or powders of solids (e.g., garlic, cranberry, and ginseng root) and powdered or
concentrated juice (e.g., cranberry and blueberry; Bruneton, 1999; Kim et al., 2002;
Li et al., 2007). Purifi ed and essential extracted compounds (e.g., peppermint oil and
ALA) can be provided in a liquid or powder form (Baranauskiené et al., 2007;
Sanguansri and Augustin, 2007). Products are generally standardized to contain a
specifi c quantity of the active ingredient, for example, tablets standardized at 25 to
36% anthocyanin content (Fleming, 2000).
Functional foods have a similar appearance to conventional foods, but they
contain bioactives inherent to the raw food or have added compounds or components
from other sources. Fruit powders (blueberry, cranberry, concord grape, and raspberry)
TABLE 10.1Major Bioactive Compounds, Activity, and Potential Health Benefi ts of Foods
PlantBioactive
Compound Class Activity
Condition Prevention or Management Ref.
Cranberries Phenolic acids,
anthocyanins,
fl avonols, fl avanols,
procyanidins,
proanthocyanidins
Antioxidant,
antibacterial,
antiinfl ammatory
Certain cancers,
urinary tract
infections
Vvedenskaya
et al. (2004),
Neto (2007)
Blueberries Phenolic acids,
anthocyanins,
fl avonols, fl avanols,
procyanidins,
proanthocyanidins,
tannins
Antioxidant,
antiinfl ammatory,
antiedemic,
astringent,
regeneration of
rhodopsin
Platelet aggregation,
vascular disorders,
ulcers, diabetic
retinopathy
Bruneton (1999),
Fleming (2000)
Tomatoes Carotenoids ascorbic
acid, folate,
polyphenols,
vitamins A and E
Antioxidant,
immuno -
stimulatory
Certain cancers,
artherosclerosis,
coronary heart
disease, boosting
of immune system
Shi et al. (2002),
Eskin and
Tamir (2006)
Carrots Carotenoids, insoluble
fi bers, vitamin A
Antioxidant,
prooxidant,
hypoglycemic
Cancers and
cardiovascular disease
(mixed results),
Alzheimer disease
Eskin and Tamir
(2006)
52527_C010.indd 29052527_C010.indd 290 10/3/2008 3:59:36 PM10/3/2008 3:59:36 PM
© 2009 by Taylor & Francis Group, LLC

Dehydration Processes for Nutraceuticals and Functional Foods 291
for use in extruded corn breakfast cereals were determined to be a potential source
of anthocyanins if added in adequate proportions (Camire et al., 2007). Other func-
tional foods include tea, fresh or dried fruits and vegetables, baked goods, bread,
beverages, jellies, and granola bars, as long as they contain valuable bioactive
compounds that provide health benefi ts beyond basic nutrition (Grabowski et al.,
2007; Kim et al., 2002; Nindo et al., 2007).
The original raw product or a component thereof (e.g., juice or seeds) can be
maintained intact by using it in the fresh or dried state. In some instances it is desirable
to isolate specifi c bioactive compounds from the original product. Several processes
have been investigated for the extraction and purifi cation of bioactive compounds
including supercritical fl uid technology (Shi et al., 2007), pressurized low polarity
water extraction (Cacace and Mazza, 2007), vacuum distillation (Bettini, 2007), and
membrane separation (Kumar, 2007). Drying can play an integral role as a pretreat-
ment and/or a fi nishing step for each of these extraction systems. Microencapsulation,
the coating of food ingredients, enzymes, cells, and extracts in small capsules, is
performed using various techniques including spray drying, fl uidized and spouted bed
coating, and freeze-drying (Desai and Park, 2005; Madene et al., 2006). It is being
employed in the nutraceutical and functional food industries for retention of aroma and
fl avor; protection of core material from evaporation, degradation, and reactivity with
surroundings; modifi cation of the original material for ease of handling; controlled
release; and fl avor masking; and to allow for uniform dispersion in the fi nal product.
10.2.6 BIOACTIVE COMPOUND STABILITY DURING DRYING
Drying is a complex process that may involve simultaneous heat and mass transfer
and the subsequent removal of moisture from the system (Cassini et al., 2006). The
potential for enzyme-catalyzed reactions, nonenzymatic and Maillard reactions,
protein denaturation, and nutrient loss (Roos, 2004) are associated with drying. Color
degradation of fruits and vegetables during drying may be due to pigment loss or
browning, which is caused by both enzymatic and nonenzymatic browning reactions
(Krokida et al., 2001). Enzymes are deactivated at temperatures ranging from 60
to �100°C and activity drops as water activity (aw) approaches 0.2 (Van Den Berg,
1986). Nonenzymatic browning is caused by caramelization of reducing sugars and
ascorbic acid and by Maillard browning, a reaction between amines (amino acids or
proteins) and carbonyls (sugars or fl avors; Bell, 2001; Pokorný and Schmidt, 2003).
The main factor that can affect stability during the process of air drying (natural
or forced) is oxidation, the rate of which can be infl uenced by oxygen, temperature,
light, aw, pH, and prooxidants (i.e., enzymes, minerals, and metals; DeMan, 1999).
Oxidation is reduced to a minimum at an aw value of 0.3, whereas at intermediate aw
values (0.5 to 0.8) the oxidation rate increases as a result of increased catalyst activity.
Some compounds that are sensitive to oxidation and therefore to one or more of the
oxidative catalysts include anthocyanins, carotenoids, vitamin C, PUFAs, and chlo-
rophyll (Cui et al., 2004; Litwinienko and Kasprzycka-Guttman, 2000; Shi et al.,
2002; Skrede and Wrolstad, 2002). The presence of antioxidants (vitamin C, tocols,
and carotenoids) added to or present in the product can reduce the rate of oxidation
(Cohen et al., 2000).
52527_C010.indd 29152527_C010.indd 291 10/3/2008 3:59:36 PM10/3/2008 3:59:36 PM
© 2009 by Taylor & Francis Group, LLC

292 Advances in Food Dehydration
Researchers have determined that these reactions are time and temperature
dependent and product degradation may be decreased with the combination of milder
temperatures and reduced residence time in hot air driers (Nindo et al., 2007).
Traditionally, culinary and medicinal herbs have been air dried because most products
are heat labile and require low temperature drying (Kabganian et al., 2002; Kim
et al., 2000; Rohloff et al., 2005). Many other technologies that reduce the potential
of oxidation because of the removal of heat and/or air are also available. The ability
to produce a uniform and effective product requires knowledge of its drying charac-
teristics and a high level of control within the drying process.
10.3 APPLICABLE DRYING METHODS
Drying may be used as a processing stage to improve shelf life; for quality preservation
(halt or reduce the growth of spoilage microorganisms and chemical reactions); for
product enhancement; to simplify handling, storage, and transport; and as a pretreat-
ment for subsequent processes (Cassini et al., 2006; Vega-Mercado et al., 2001). Many
drying systems and technologies are available for drying plant products. Selection
of the appropriate drying method depends on the original product and bioactive
compound characteristics, availability of equipment and technology, required quality
and characteristics of the fi nal product, and economics. Because of the lack of infor-
mation on drying characteristics and the complexity of many plant-based products
and their compounds, studies on drying kinetics and quality have been performed on
an individual basis. Drying methods that have been either used or investigated for the
processing of plant-based food products that are of potential use in the nutraceutical
and functional food industries are summarized in the following sections.
10.3.1 AIR, SUN, AND SOLAR DRYING
Air drying, a method by which the convective fl ow of ambient air removes moisture
from a product, has been used for many crops including herbs such as peppermint
(Rohloff et al., 2005), basil (Díaz-Maroto et al., 2004), and bay leaf (Díaz-Maroto
et al., 2002). This method can be employed directly in the fi eld (i.e., prewilting) and
in vented structures. Exposing the product to sunlight employs radiant energy in the
evaporation of water from products that are spread on a fl at surface (e.g., concrete;
Sokhansanj and Jayas, 2006). Sun drying is a traditional method in warm climates
that is utilized for seaweed (Chan et al., 1997), rooibos tea (Joubert and de Villiers,
1997), fi gs, plums, coffee beans, cocoa beans, sweet peppers, pepper, and rice (Ibarz
and Barbosa-Canovas, 2003).
Both of these natural methods offer a low cost alternative to mechanical systems,
especially in areas where such equipment is not easily accessible. The disadvantages,
however, include lack of control of the drying process; loss of product due to
germination and nutritional changes; lack of uniformity in drying; contamination
attributable to molds, bacteria, rodents, birds, and insects; potentially long drying
times; and dependence on climate. Drying time can also vary depending on the
product’s physical characteristics (i.e., color, shape, structure) and initial and fi nal
moisture contents (Sokhansanj and Jayas, 2006). These methods may not be suitable
52527_C010.indd 29252527_C010.indd 292 10/3/2008 3:59:36 PM10/3/2008 3:59:36 PM
© 2009 by Taylor & Francis Group, LLC

Dehydration Processes for Nutraceuticals and Functional Foods 293
for high value products that contain light- (sun drying) and oxygen-sensitive
bioactive compounds.
Solar drying employs the sun’s energy without direct exposure to UV light.
Collected energy can be used to increase the air temperature by ~10°C (Sokhansanj
and Jayas, 2006) or assist with air fl ow or drying systems such as a vacuum evaporator
or osmotic drying system (Grabowski and Mujumdar, 1992). Farkas (2004) provided a
comprehensive review of more than 20 solar drying confi gurations for products includ-
ing grains, fruits, vegetables, herbs, and botanicals. Systems range from the basic solar
heating of air upstream of the drying chamber to units with storage (water vessels,
rock bed, foil), heat recovery systems, and/or auxiliary heating. A project establishing
dryers in fi ve Association of Southern Asian Nations countries (i.e., Indonesia, Malasia,
Phillippines, Singapore, and Thailand) resulted in several economically viable solar
and solar or heat pump confi gurations for the drying of teas, fruit, and other crops
indigenous to the area (Halawa et al., 1997). Solar drying is the most applicable in hot
and dry countries especially if the crop is to be harvested just prior to the dry season
and where commercial drying is not available or feasible (Farkas, 2004).
10.3.2 OSMOTIC DRYING AND PRETREATMENTS
Some berries and fruits, such as blueberries, cranberries, grapes, and tomatoes, have
an external waxy layer that offers benefi ts such as protection of the fruit from envi-
ronmental and external factors (Sunjka and Raghavan, 2004; Wildman, 2001a). The
waxy layer also affects the fl ow of moisture from inside the fruit to its surface, slowing
the drying rate and thus increasing drying time. The following methods can be used
separately or in combination as an initial dewatering stage in combination with a
fi nish drying system (Sunjka and Raghavan, 2004).
Osmotic drying involves the removal of water with an osmotic agent (hypertonic
sugar or salt solution). This system consists of two countercurrent fl ows with water
diffusion from the product to the surrounding solution and migration of solutes from
the solution to the product (Sunjka and Raghavan, 2004). This is particularly useful
for products that require application of sugar (e.g., cranberries) or salt (e.g., tomatoes)
within the processing phase.
As shown in Chapter 1, three basic types of pretreatment methods have been
investigated: chemical, mechanical, and thermal. Chemical methods involve dipping
the product in alkaline or acidic solutions of oleate esters (Sunjka and Raghavan,
2004). Alkaline solutions develop fi ne cracks on product surfaces, whereas acidic
solutions cause the wax platelets on the skin to dissociate. Mechanical methods
include skin abrasion, puncturing, cutting, or peeling of the product (Sunjka and
Raghavan, 2004). Thermal treatments include the exposure of the product to hot or
cold fl uids to alter the skin permeability (Grabowski et al., 2007; Sablani, 2006).
10.3.3 CONVECTIVE AIR DRYERS
Cabinet and tunnel drying systems are based on convective heat and mass transfer
facilitated by warm air fl owing over the surface of a thin layer of product spread on
mesh or solid trays (Sokhansanj and Jayas, 2006). These systems are typically used
52527_C010.indd 29352527_C010.indd 293 10/3/2008 3:59:36 PM10/3/2008 3:59:36 PM
© 2009 by Taylor & Francis Group, LLC

294 Advances in Food Dehydration
for sliced, chunked, or whole fruits and vegetables or other plant material such as
seeds, fl owers, roots, and leaves (Orsat and Raghavan, 2007; Vega-Mercado et al.,
2001). The use of solid trays also allows the drying of fl uids and semisolid products
such as slurries, purees, and pomace. The main differences between cabinet and tunnel
drying systems are confi guration and capacity, with the latter being applicable to
high volume products.
Belt and conveyor band dryers also employ convective drying mechanisms.
However, the drying surface moves during the drying cycle and air fl ow is through rather
than over the thin product layer (Sokhansanj and Jayas, 2006). Conveyor band dryers
offer the fl exibility of having separate regions with different air characteristics to accom-
modate product requirements throughout the drying cycle as well as continuous drying
(Orsat and Raghavan, 2007). Product degradation is a major drawback associated with
the systems discussed in this section because of potentially high drying temperatures,
excessive air fl ow, and/or long drying times. Optimization of drying conditions accord-
ing to product characteristics and behavior can assist in dealing with these issues.
10.3.4 FIXED BED AND FLUIDIZED SYSTEMS
A fi xed deep bed system is one in which granular or solid products (i.e., grain, oilseeds,
and legumes) remain stationary as the air fl ows through the layer (Vega-Mercado
et al., 2001). Modifi cations, including fl uidization and movement of the particles
within the bed, has led to the development of fl uidized, pulsed fl uidized, vibrated
fl uidized, spouted bed, and rotary dryers. These methods offer an alternative for heat-
and oxygen-sensitive products because of faster drying rates and concomitant reduced
drying times and potential for lower drying temperatures (Kundu, 2004).
10.3.4.1 Fluidized Bed Drying
Fluidized bed dryers have a perforated fl oor through which air fl ows at a specifi c
velocity to fl uidize the product (Kundu, 2004). This dryer type is suitable for granular
and solid products such as oilseeds (e.g., mustard, sunfl ower, soybean, groundnut,
and rapeseeds). This method was also investigated for cranberries (Grabowski et al.,
2002). Systems such as the pulsed fl uidized bed and the vibrofl uidized bed dryer
produced better test results than the fl uidized bed dryer for products that are diffi cult
to fl uidize, which is due to stickiness or polydispersity (Benali, 2004). The aerodynamic
and mechanical functions of pulsed fl uidized bed and vibrofl uidized bed dryers,
respectively, can assist in preventing agglomeration. The pulsed fl uidized bed dryer,
a novel and modifi ed version of conventional fl uidized bed systems, employs gas
pulses to provide high-frequency retraction of the particle bed. These methods were
investigated for the drying of particulate solids such as diced carrots, cranberries,
blueberries, and onions (Benali, 2004; Grabowski et al., 2002, 2007). These systems
can be run either continuously or in batch mode.
10.3.4.2 Spouted Bed Drying
A spouted bed dryer uses a high velocity jet for material agitation. Two distinct zones
exist within a spouted bed dryer: a central jet with minimal product and high heat and
52527_C010.indd 29452527_C010.indd 294 10/3/2008 3:59:36 PM10/3/2008 3:59:36 PM
© 2009 by Taylor & Francis Group, LLC

Dehydration Processes for Nutraceuticals and Functional Foods 295
mass transfer rates and a moving annular bed with lower heat and mass transfer rates.
Originally developed for grain drying in the 1960s (Mathur and Epstein, 1974), the
application has been investigated for soybeans (Wiriyaumpaiwong et al., 2004),
medicinal plant extracts (Oliveira et al., 2006), and blueberries (Feng et al., 1999).
With the addition of uniformly sized inert particles, liquids, slurries, pulps, and pastes
that coat the inerts can also be dried (Orsat and Raghavan, 2007). As the product
becomes dry the adhered material is removed by chipping, which is caused by colli-
sions between inert particles. This system is currently used for small volumes in batch
mode, because of diffi culties involved with scale-up and continuous systems.
10.3.4.3 Rotary Drying
A rotary dryer consists of an angled cylindrical rotary drying chamber turning at
slow speed. Drying air and wet solids are fed continuously at one end of the chamber
and are discharged at the other end (Kundu, 2004). Allowing the air to fl ow in at the
material outlet, resulting in a countercurrent fl ow, improves drying performance.
The material is continuously churned, which is due to rotation, leading to uniform
mixing with drying air. The retention time is a function of the speed and angle of
inclination of the chamber. This system is traditionally used for drying chemicals.
However, it has been used for some agricultural products such as dry beans, rice,
nuts, seeds, cereal grains, and herbs (Benali, 2004). The rotational system leads to
an increase in capital investment (Kundu, 2004).
10.3.4.4 Encapsulation with Fluidized Bed Technology
Special confi gurations of fl uidized bed dryers, such as those shown in Figure 10.1,
which were originally established for the production of pharmaceuticals, have been
modifi ed for the encapsulation of food ingredients, additives, and nutraceutical
products (Desai and Park, 2005). The top spraying confi guration (Figure 10.1a) is
most widely used for the microencapsulation of droplets as small as 100 μm, because
of its versatility, capacity, and relative simplicity. Similar sized particles have also
been successfully coated using the bottom spray confi guration (Figure 10.1b), also
known as the Wûrster system. Figure 10.1c depicts another modifi cation using a
rotating drum that enhances gravitational forces and assists in fl uidizing smaller
particles. The fl uidized bed drying coating process (Figure 10.2) involves fl uidization
of core particles, spraying of a coating solution, contact spreading and coalescence
of the coating solution on the core, evaporation from the coating solution, and adher-
ence of the coating material to the core (Madene et al., 2006). Coating materials can
include carbohydrates (e.g., starch, maltodextrins, and corn syrup solids), cellulose
(hemicellulose), gums (e.g., gum acacia, agar, and carrageenan), lipids (e.g., wax,
paraffi n, and oils), and proteins (e.g., gluten, casein, and gelatin; Desai and Park,
2005; Madene et al., 2006).
10.3.5 DRUM AND REFRACTANCE WINDOW® DRYERS
Drum drying consists of indirect moisture removal from a thin fi lm of product on the
surface of internally heated twin (or single drum) hollow metal cylinders that rotate
52527_C010.indd 29552527_C010.indd 295 10/3/2008 3:59:36 PM10/3/2008 3:59:36 PM
© 2009 by Taylor & Francis Group, LLC

296 Advances in Food Dehydration
on a horizontal axis (Orsat and Raghavan, 2007; Vega-Mercado et al., 2001). Dried
product is fl aked off using a scraper. This system is applicable to viscous foods and
purees that can withstand high temperatures for a short period. Drum dried powdered
and fl aked products are used in bakery goods, beverages, cereal, granola, and dairy
foods (Vega-Mercado et al., 2001). This method was also investigated as a texturizing
method for wheat, rice, and fababean mixed breakfast cereals or puffed baked snacks
FIGURE 10.1 Fluidized bed coating systems with three confi gurations: (a) top spray,
(b) bottom spray, and (c) tangential spray. (Adapted from Desai, K.G.H. and Park, H.J., Dry. Technol., 23, 1361–1394, 2005. With permission.)
Perforatedroatating drum
Fluidized Nozzle
Coatingsolution
Air distributionplate
(c)
particles
Inlet air
Nozzle
Fluidized particles
Coating solution
Air distributionplate
Intet air
(a)
Fluidizedparticles Wûrster device
Coating solution
Air distribution plateNozzle
Inlet air
(b)
FIGURE 10.2 Schematic of fl uidized bed coating process. (Adapted from Madene, A. et al.,
Int. J. Food Sci. Technol., 41, 1–21, 2006. With permission.)
(a) Fluidizedcore particle
(e) Filmcoating
(c) Contact spreadingand coalescence
(b)Spraydroplets
(d) Evaporationof solvent
52527_C010.indd 29652527_C010.indd 296 10/3/2008 3:59:36 PM10/3/2008 3:59:36 PM
© 2009 by Taylor & Francis Group, LLC

Dehydration Processes for Nutraceuticals and Functional Foods 297
(Abdel-Aal et al., 1996) and for the processing of apple pomace (Constenla et al.,
2002). The effectiveness of the drying system relies on the uniform thickness of the
fi lm applied to the drum surface, the speed of rotation, and the heating temperature.
The main advantages of this system are the high drying rate and energy effi ciency.
Refractance Window drying is a relatively new indirect drying technology that
is used to evaporate moisture from foods (Nindo and Tang, 2007; Nindo et al., 2007;
Vega-Mercado et al., 2001). This approach uses a plastic fi lm to facilitate thermal
energy transfer between a heating medium (i.e., water below the fi lm) and a suspension
(on the surface of the fi lm). The thin plastic fi lm, fabricated from Mylar, allows
the transmission of infrared radiation in a wavelength that matches the absorption
spectrum of water in the product. Refractance Window was developed to provide an
alternative to long drying times and/or the use of high temperatures. Although the
water is maintained at temperatures just below boiling at 95 to 98°C, product tem-
peratures do not exceed 70°C. Shorter drying times are demonstrated by a reduction
from hours (tray and freeze-drying) to 5 min (Refractance Window) for strawberry
puree (Nindo and Tang, 2007). This system is applicable to the drying or precon-
centration of liquid foods. It is also being pursued for its potential to process fruits,
vegetables, and herbs into value-added powders, fl akes, and concentrates.
10.3.6 SPRAY DRYING
The spray drying process consists of the conversion of a spray of pumpable liquid
(i.e., juices, slurries, and purees) into a dry particulate (i.e., powder, granules, or
agglomerate) by exposure to a hot (150 to 200°C) medium (Orsat and Raghavan,
2007; Vega-Mercado et al., 2001). Operating and dryer components that infl uence
the fi nal product include the feed rate, temperature of the inlet drying air, pressure of
compressed air at the nozzle, air fl ow (i.e., cocurrent, countercurrent, or mixed fl ow),
atomizer design, and air heating method. Spray dryers are the most widely used drying
systems for the formation of powdered food additives and fl avors in the dairy,
beverage, and pharmaceutical industries (Benali, 2004; Desai and Park, 2005). This
drying method has been investigated for many products including tomato pulp
(Goula and Adamopoulos, 2005, 2006; Goula et al., 2004), fl axseed gum (Oomah
and Mazza, 2001), medicinal plant extracts (Oliveira et al., 2006), and fi eld pea protein
(Tian et al., 1999).
Another application for spray drying includes the encapsulation of nutraceutical
and functional foods and fl avors. A summary of recent research on the use of spray
drying for encapsulation is provided in Table 10.2. Spray drying microencapsulation
(Figure 10.3) includes the following steps: preparation and homogenization of
dispersion, atomization of the in-feed dispersion, and dehydration of the atomized
particles. Shell materials are limited to gum acacia, maltodextrin, hydrophobically
modifi ed starch, and their mixtures because of solubility in water (Desai and Park,
2005). With different material preparations and operating conditions, other less
water-soluble casings can be used: polysaccharides (alginate, carboxymethylcellu-
lose, and guar gum) and proteins (whey, soy, and sodium caseinate). According to
Madene et al. (2006), the advantages of spray drying encapsulation are low operating
cost; high quality, stability, and rapid solubility of the capsules; and small size.
52527_C010.indd 29752527_C010.indd 297 10/3/2008 3:59:36 PM10/3/2008 3:59:36 PM
© 2009 by Taylor & Francis Group, LLC

298 Advances in Food Dehydration
TABLE 10.2Summary of Studies on Encapsulation through Use of Spray Drying
Compound EncapsulantInlet/Outlet Temp. (°C) Ref.
2-Acetyl-1-pyrroline Gum acacia, maltodextrin 150/80 Apintanapong and
Noomhorn (2003)
Shiitake fl avors Cyclodextrin, maltodextrin 160/84–93 Yoshii et al. (2005)
�-Carotene Maltodextrin 170/95 Desobry et al. (1997)
Vitamin C Chitosan 175/— Desai and Park (2005)
Black carrot
anthocyanins
Maltodextrin 160–200/107–131 Ersus and Yurdagel (2007)
Cinnamon oleoresin Modifi ed starch 160/120 Vaidya et al. (2006)
Cumin oleoresin Gum arabic, maltodextrin,
modifi ed starch
160/120 Kanakdande et al. (2007)
Vitamin A Modifi ed starch 182/82 Xie et al. (2007)
Peppermint essential oil Modifi ed starch 200/120 Baranauskiené et al. (2007)
FIGURE 10.3 Schematic of the spray drying encapsulation process. (Adapted from
Bhandari, B., in Dehydration of Products of Biological Origin, Science Publishers, Enfi eld,
NH, 2004, pp. 513–533. With permission.)
(a) Preparation and homogenization of dispersion
Dispersiondroplet
(b) Atomization
Flavordroplets
Semipermeablemembrane (c) Drying
52527_C010.indd 29852527_C010.indd 298 10/3/2008 3:59:36 PM10/3/2008 3:59:36 PM
© 2009 by Taylor & Francis Group, LLC

Dehydration Processes for Nutraceuticals and Functional Foods 299
The disadvantages include lack of uniformity, production of a very fi ne powder that
requires further processing (i.e., fl uidized bed coating), and lack of suitability for
heat-sensitive material.
10.3.7 FREEZE-DRYING
Freeze-drying is a process by which a frozen product under vacuum conditions in an
airtight container releases moisture in the form of vapor when exposed to thermal
energy suitable for ice sublimation (Orsat and Raghavan, 2007). Originally devel-
oped in the 1940s for production of dry plasma and blood products, freeze-drying is
viewed as the method that in most cases retains the structure, texture, appearance,
and/or fl avor associated with fresh products (Ratti, 2001; Vega-Mercado et al., 2001).
This high level of quality preservation is due to minimum structural and chemical
reactions associated with the absence of air and a low processing temperature. The
major limitations of freeze-drying are capital and operating costs, long processing
times, and low volume capability (Ratti, 2001).
With quality retention similar to fresh products, freeze-dried products are often
used as a benchmark for other methods. Therefore, it is employed in many research
studies on valuable products: seaweed (Chan et al., 1997), bay leaf (Díaz-Maroto et al.,
2002), Echinacea purpurea (Kim et al., 2000), ginseng (Popovich et al., 2005), berries
(Feng et al., 1999; Grabowski et al., 2002; Nsonzi and Ramaswamy, 1998), and soy
products (Qing-guo et al., 2006; Tian et al., 1999). Freeze-drying has also been investi-
gated for the microencapsulation of food ingredients and fl avors (Desai and Park,
2005; Madene et al., 2006). The steps involved are mixing of core particles in a coating
solution and freeze-drying of the mixture (Desai and Park, 2005). This method offers
an alternative coating method for thermosensitive and water-unstable products. The
costs involved are considerably higher than spray drying (Desobry et al., 1997).
10.3.8 VACUUM DRYING
Vacuum drying employs the lowering of the boiling point of water through the
application of a vacuum, which allows evaporation of water at lower temperatures
(Sokhansanj and Jayas, 2006). The product can be heated by steam, conduction, or
radiation in the absence of oxygen (Orsat and Raghavan, 2007). Vacuum drying has
been investigated for carrot slices and chives (Cui et al., 2004) and berries (Grabowski
et al., 2002; Kongsoontornkijkul et al., 2006). Because of the costs involved, similar
to freeze-drying, this operation is commonly used as a fi nish drying operation in
conjunction with other drying technologies.
10.3.9 MICROWAVE DRYING
The mechanism involved with microwave drying consists of exposing a product to
microwaves that penetrate directly into the material, resulting in heating from the
inside out (Chua and Chou, 2005). The quick energy absorption by water molecules
causes rapid evaporation of water, creating an outward fl ux of vapor. In addition to
an increase in the drying rate, the outward fl ux helps to prevent the shrinkage of the
tissue structure (Schiffmann, 1995). Microwave technology is applicable to many
52527_C010.indd 29952527_C010.indd 299 10/3/2008 3:59:37 PM10/3/2008 3:59:37 PM
© 2009 by Taylor & Francis Group, LLC

300 Advances in Food Dehydration
industrial processes such as baking, concentrating, cooking, curing, enzyme inacti-
vation by blanching, pasteurizing, precooking, puffi ng, foaming, solvent removal,
moisture leveling, and thawing–tempering (Vega-Mercado et al., 2001). Passardi
et al. (2006) reported the advantages of one-step blanching and drying for Yerba maté.
Chua and Chou (2005) compared intermittent and constant microwave treatment
for carrots.
10.3.10 INFRARED DRYING
Far infrared radiation is a novel drying technology that employs radiation within a
specifi c spectral range in the selective heating of food ingredients (Jun and Irudayaraj,
2003). Application of far infrared radiation has increased during the past few years
because of the availability of commercial heaters with high emissivity; however, it is
still the most effi cient process for homogeneous products (i.e., soy protein and glucose).
Determination of the optical properties of food products is necessary to increase
energy effi ciency, although there are few studies on it. Jun and Irudayaraj (2003)
used fi lters to heat soy protein 6°C higher than glucose, whereas the opposite was
true without fi lters. Far infrared radiation was also investigated for carrots (Chua and
Chou, 2005) and ginseng (Kim et al., 2002).
10.3.11 COMBINATION SYSTEMS
Combination dryers and systems have been developed and investigated to capitalize
on the benefi ts (i.e., low temperature, reduced exposure to oxygen, and short drying
times) of certain systems while decreasing the impact of the disadvantages (i.e.,
oxidation, high costs, and long drying times) of other systems. Research performed
on self-contained combination dryers that eliminate the exposure of the product to
air included vacuum microwave drying of carrot slices and chives (Cui et al., 2004),
echinacea (Kim et al., 2000), ginseng (Popovich et al., 2005), and soybeans (Qing-
guo et al., 2006). Combining microwave energy with air-based drying systems, such
as spouted bed and convective dryers, increases the drying rate, resulting in a shorter
drying time as demonstrated for blueberries and cranberries (Beaudry et al., 2003;
Feng et al., 1999).
Multimode systems may include a series of stages employing different drying
technologies. Osmotic or pretreatments tend to be major components of multistage
systems, because water removal is usually possible only to 50 to 55% moisture
content. Therefore, a fi nal drying method is required (Beaudry et al., 2003; Feng
et al., 1999; Grabowski et al., 2007). Modifi cation of vacuum–microwave combina-
tion systems included adding a pre- or postdrying stage such as convective or vacuum
drying (Qing-guo et al., 2006; Cui et al., 2004). The addition of an extra drying
method is to enhance drying at a specifi c stage throughout the drying process or to
reduce costs associated with certain drying methods.
10.4 DRYING METHODS AND QUALITY RETENTION
The drying technologies in Section 10.3 are all at various stages of development with
respect to applicability to the nutraceutical and functional food industries. Aspects
52527_C010.indd 30052527_C010.indd 300 10/3/2008 3:59:37 PM10/3/2008 3:59:37 PM
© 2009 by Taylor & Francis Group, LLC

Dehydration Processes for Nutraceuticals and Functional Foods 301
such as the drying kinetics, dryer design and optimization, cost effectiveness, and
energy effi ciency are also being investigated in addition to product quality. Research
linking drying technology and operation to retention or loss of key bioactive
compounds or components is limited. The following sections focus on plant products
with specifi c bioactive ingredients and the various drying methods that have been
investigated. Because of the complexity of determining bioactive compound content,
some researchers have measured a single compound (i.e., vitamin C representative
of antioxidant activity) or other parameters such as color as a marker for anthocyanin
and carotenoid content (Feng et al., 1999; Goula and Adamopoulos, 2006; Nsonzi
and Ramaswamy, 1998).
10.4.1 BERRIES
We reviewed studies on the drying of cranberries and blueberries, which were based
assessments on various parameters: moisture content, water activity, and/or solids
gain (Grabowski et al., 2002, 2007; Sunjka and Raghavan, 2004); rehydration ratio
(Feng et al., 1999; Grabowski et al., 2002, 2007; Nsonzi and Ramaswamy, 1998);
texture (Beaudry et al., 2003; Nsonzi and Ramaswamy, 1998); bulk density (Feng et al.,
1999); sensory attributes (i.e., taste and appearance; Beaudry et al., 2003; Grabowski
et al., 2002, 2007); color (Feng et al., 1999; Nindo et al., 2007; Nsonzi and Ramaswamy,
1998); fl avor volatility analysis (Feng et al., 1999); anthocyanin content (Grabowski
et al., 2002, 2007); and ascorbic acid content (Nindo et al., 2007).
The most acceptable pretreatment among various chemical, thermal, and
mechanical methods for cranberries was halving (Beaudry et al., 2003; Grabowski
et al., 2002, 2007) or quartering (Sunjka and Raghavan, 2004) because it increased
the rate of osmotic drying due to increased surface area and provided the best taste
acceptability. Due to a wax layer that is 5 to 10 times thinner than cranberries, pre-
treatments were generally not required for blueberries (Grabowski et al., 2007).
However, Feng et al. (1999) employed a chemical dipping solution of 2.5% ethyl oleate
and 0.2% NaOH in conjunction with osmotic drying to prevent rupture of berries
dried in a microwave spouted bed dryer.
The parameters used in osmotic drying (osmotic solution, temperature, time, and
concentration) have a signifi cant effect on quality and drying characteristics
(Grabowski et al., 2007; Nsonzi and Ramaswamy, 1998; Sunjka and Raghavan,
2004). Optimal or applied osmotic treatments for the predrying of cranberries or
blueberries are provided in Table 10.3. Although osmotic treatment did result in a
shorter overall drying time, transfer of anthocyanins to the syrup was appreciable
(Grabowski et al., 2002, 2007). Because of the concentration equilibrium, the use of
a cranberry or blueberry processing syrup as the osmotic agent or recirculation of
the osmotic syrup reduces loss of anthocyanins in the original product (Grabowski
et al., 2002, 2007). In addition, the anthocyanin-rich osmotic syrup could be further
processed into a marketable product (Grabowski et al., 2007).
Applied fi nish drying methods include convective air (Feng et al., 1999;
Grabowski et al., 2002), freeze-drying (Feng et al., 1999; Grabowski et al., 2002),
microwave spouted bed (Feng et al., 1999), vacuum (Grabowski et al., 2002), fl uid-
ized bed (Grabowski et al., 2002, 2007), pulsed fl uidized bed (Grabowski et al.,
52527_C010.indd 30152527_C010.indd 301 10/3/2008 3:59:37 PM10/3/2008 3:59:37 PM
© 2009 by Taylor & Francis Group, LLC

302 Advances in Food Dehydration
2002, 2007), vibrofl uidized bed (Grabowski et al., 2002, 2007), spouted bed (Feng
et al., 1999), and microwave or convection drying (Beaudry et al., 2003). The antho-
cyanin content (70 to 90 mg/100 g) in blueberries was not signifi cantly affected by
the fi nal drying method or conditions; however, the taste and rehydration ratio was
superior for blueberries dried by a vibrofl uidized bed at 85 versus 90°C (Grabowski
et al., 2007). Temperature was not a factor for the quality of cranberries dried by a
vibrofl uidized bed, so 90°C was selected as the optimal temperature. The anthocy-
anin content in cranberries also did not differ signifi cantly for a variety of drying
methods including convective air, fl uidized systems, and freeze-drying (Grabowski
et al., 2002). Although freeze-drying offered superior color, rehydration coeffi cients,
and taste acceptability, the vibrofl uidized bed was determined as the most suitable
method based on the energy effi ciency and overall quality.
Based on sensory attributes, physical quality, and energy effi ciency, Feng et al.
(1999) selected microwave spouted bed technology at 70°C for chemically dipped or
osmotically dried blueberries. Beaudry et al. (2003) recommended microwave or con-
vection conditions of 0.75 W/g and a cycling period of 30 s on and 60 s off at an air
temperature of 62°C for osmotically dried cranberries. Feng et al. (1999) also reported
signifi cant changes in the quantity of volatile compounds (gains and losses) in blueber-
ries with microwave drying (13 and 2), convective air drying (10 and 5), and freeze-
drying (2 and 5). The gains and losses related to microwave and convective air drying
were attributed mainly to the chemical reactions associated with heat treatment, whereas
the losses in freeze-dried samples were attributed to long drying times. Instability of
volatiles was also reported by Nindo et al. (2007) in blueberry juice concentrated by
Refractance Window; however, the evaporated volatiles could be recovered.
Reductions of 32 and 48% in vitamin C concentration occurred with drying for
blueberry juice temperatures of 55.5 and 59.0°C, respectively (Nindo et al., 2007).
TABLE 10.3Optimal Osmotic Dehydration Parameters for Cranberries and Blueberries
Sugar Agent Concentration Temp. (°C) Time (h) Ref.
CranberriesHigh fructose corn syrup 2:1 23 24 Sunjka and Raghavan (2004)
High fructose corn syrup
with 76°Bx
1:1 23 24 Beaudry et al. (2003)
Standard osmotic syrup with
67.5°Brix
1:5 50 5 Grabowski et al. (2002)
Sucrose syrup with 70°Bx — 50 — Grabowski et al. (2007)
BlueberriesSucrose syrup — 50 24 Feng et al. (1999)
Sucrose syrup with 70°Bx — 50 6.8 Grabowski et al. (2007)
Sucrose syrup with 55°Bx — 50 4.5 Nsonzi and Ramaswamy
(1998)
52527_C010.indd 30252527_C010.indd 302 10/3/2008 3:59:37 PM10/3/2008 3:59:37 PM
© 2009 by Taylor & Francis Group, LLC

Dehydration Processes for Nutraceuticals and Functional Foods 303
However, this loss was much less than the 70.1% reported for an industrial falling
type evaporator providing a product temperature of 68°C. Low-pressure superheated
steam drying was also benefi cial in reducing vitamin C losses in the drying of Indian
gooseberries (Kongsoontornkijkul et al., 2006). This method resulted in a 14%
reduction in vitamin C compared to 20 and 23% associated with vacuum and convective
air drying, respectively, at 75°C. Although low-pressure superheated steam drying
resulted in greater losses during tea preparation because of a resulting higher porosity
of berry fl akes, a combined drying and tea preparation at a 70°C water temperature
resulted in the best overall retention of vitamin C.
10.4.2 TOMATOES
Studies on the drying of whole (Azoubel and Murr, 2003), sliced (Unadi et al., 2002),
halved or quartered (Goula and Adamopoulos, 2006; Lewicki et al., 2002), and pulped
tomatoes (Goula and Adamopoulos, 2005, 2006; Goula et al., 2004) were focused
on the fi nal product characteristics and/or retention of ascorbic acid under various
drying conditions. The focus of a majority of studies on lycopene stability in tomatoes
was on thermal treatment in liquids rather than moisture removal. However, Kaur
et al. (2006) did investigate the effects of the drying temperature on color and
lycopene degradation on tomato peel isolated from pomace.
A pretreatment of calcium chloride resulted in a 20% decrease in drying time
and a 20% increase in water removal during subsequent osmotic drying of skinned
quartered tomatoes (Lewicki et al., 2002). However, calcium bridges formed in the
tomato tissue restricted polymer hydration and swelling, resulting in poor rehydra-
tion properties. Although a rehydration rate was not reported, Azoubel and Murr
(2003) recommended a 10% sodium chloride osmotic solution for 2 h prior to drying
of perforated cherry tomatoes. Sliced tomatoes without any pretreatment were
dried within a tunnel dehydrator; higher throughput, lower energy consumption, and
acceptable color were achieved for a counterfl ow process at 60°C versus batch
two-step and parallel fl ow systems (Unadi et al., 2002).
Upon determination that standard spray drying of tomato pulp resulted in a 60 to
71% solid mass accumulation on the internal surfaces of the system (Goula et al.,
2004), a modifi cation employing a connection of the dryer inlet air intake to an air
dehumidifi er was added (Goula and Adamopoulis, 2005). This modifi cation assisted
with not only product recovery but also improved product properties such as mois-
ture content, bulk density, and solubility. In a pulp concentration process using an
evaporative rotary dryer, Goula and Adamopoulos (2006) reported a drying rate
increase with a temperature difference between 75 and 90°C in conjunction with
ascorbic acid losses of 45 and 60%, respectively. In the same study, spray drying of
pulp resulted in a higher rate of ascorbic acid loss attributable to high exposure of
individual droplets to oxidation. Pretreated tomato halves dried convectively at 80
and 110°C had the highest incidence of ascorbic acid loss at 90 and 95%, respec-
tively. Similarly, losses of 21 to 47% lycopene concentration were reported for drying
temperatures from 50 to 100°C, respectively, in tomato peel dried in a cabinet dryer
(Kaur et al., 2006). Changes in lycopene concentration were directly correlated with
color degradation, both a function of the drying temperature.
52527_C010.indd 30352527_C010.indd 303 10/3/2008 3:59:37 PM10/3/2008 3:59:37 PM
© 2009 by Taylor & Francis Group, LLC

304 Advances in Food Dehydration
10.4.2 CARROTS
Carrots represent one of many products that are rich in carotenoids. Pretreatment
and drying methods investigated for carrot pieces and slices include osmotic (Pan
et al., 2003), convective air (Cui et al., 2004; Pan et al., 2003; Regier et al., 2005),
oven (Pan et al., 2003), infrared radiation (Chua and Chou, 2005), microwave
combination (Chua and Chou, 2005; Cui et al., 2004; Regier et al., 2005), heat pump
(Chua and Chou, 2005), freeze-drying (Cui et al., 2004; Regier et al., 2005), and
vacuum drying (Cui et al., 2004).
The methods were assessed through evaluation of total carotenoid, �-carotene,
and/or lycopene concentrations (Cui et al., 2004; Pan et al., 2003; Regier et al., 2005)
and color (Chua and Chou, 2005). Because of the solid texture of raw carrots, osmotic
drying is viewed as an opportunity to decrease fi nal drying times (Pan et al., 2003).
The increase in water removal or solute gain, however, is proportional with carotene
loss. The carotene concentration as a function of osmotic drying time is described by
the following equation:
lnC � �Kt � ln C0 (10.1)
where C is the carotene content; K is the nutrition loss rate constant, which is linearly
related to the sucrose concentration with no presence of salt; t is the dehydration
time; and C0 is the initial carotene concentration. The solutions of 40% sucrose and
10% salts or 50% sucrose resulted in the highest carotene losses with K values of
0.0735 or 0.1777/h, respectively, compared to the 20% sucrose, 40% sucrose, and
15% salt solutions.
Regardless of degradation caused by osmotic drying, Pan et al. (2003) determined
that vibrofl uidized bed drying at 100°C with tempering for a minimum of 6h provided
the shortest drying time compared to oven and belt drying for 3-mm carrot slices.
Regier et al. (2005) reported complete retention of lycopene in blanched carrots dried
with three different methods: convective air or inert gas (50 to 90°C), vacuum or
microwave (400 W continuous at 5kPa), and freeze-drying (–60 or 30°C at 6 Pa).
However, �-carotene losses up to 20% were noted for temperatures above 70°C
for both convective air and inert gas drying, resulting in decreased total carotenoid
concentrations. Long drying times of 8 to10h are associated with drying temperatures
of �70°C, whereas vacuum–microwave samples dried within 2h. Major benefi ts of
convective and vacuum–microwave drying were 10 and 75% increases, respectively,
in lycopene concentration due to enhanced extractability.
Cui et al. (2004) determined that freeze-drying and microwave combination
systems (i.e., vacuum–microwave, vacuum–microwave � convective, and vacuum–
microwave � vacuum) resulted in 94.7 to 97.8% retention of total carotenoids
compared to 70.8 to 85.5% for convective air drying (60 to 65°C) of 5-mm
carrot slices. The 85.5% carotenoid retention is representative of blanched carrots,
implying that enzymes in the unblanched carrots may have been responsible for
further carotenoid degradation. Blanching was deemed unnecessary for the other
methods.
52527_C010.indd 30452527_C010.indd 304 10/3/2008 3:59:37 PM10/3/2008 3:59:37 PM
© 2009 by Taylor & Francis Group, LLC

Dehydration Processes for Nutraceuticals and Functional Foods 305
10.4.4 BOTANICALS
10.4.4.1 Ginseng
Although North American and Korean ginseng contain more than 200 different
compounds, the major bioactives are the ginsenosides (Kim et al., 2002; Martynenko
et al., 2006; Popovich et al., 2005). Retention of total and individual ginsenosides
was verifi ed for freeze-drying (Popovich et al., 2005), convective air (Davidson
et al., 2004; Kim et al., 2002; Popovich et al., 2005), vacuum–microwave (Popovich
et al., 2005), and infrared drying (Kim et al., 2002). Freeze-drying and vacuum–
microwave drying systems provided better retention and extraction effi ciency of total
ginsenosides than convective drying at 70°C (Popovich et al., 2005). The recom-
mended air drying temperature for ginseng is 38°C, because higher temperatures are
associated with degradation of ginsenosides and color and with higher energy costs
(British Columbia Ministry of Agriculture, Food, and Fisheries, 1998). Peeling prior
to drying (Martynenko et al., 2006) and use of a 38, 50, and 38°C staged drying system
(Davidson et al., 2004) reduced convective air drying times, which could offer bene-
fi ts in product quality. The addition of infrared technology did not provide greater
retention of ginsenosides than convective drying at 50 and 60°C (Kim et al., 2002).
10.4.4.2 Echinacea
The roots of echinacea are widely accepted for their potential role in boosting of the
immune system (Kabganian et al., 2002; Kim et al., 2000). Alkamides 1 and 2, echi-
nacosides, and cynarin, some of the many bioactives identifi ed in echinacea, are
used as marker compounds for the evaluation of postharvest processing effects
(Kabganian et al., 2002). The times achieved for moisture removal from 57 to 10%
moisture content for roots dried in a convective oven at 23, 30, 40, 50, 60, and 70°C
were 103.4, 55.7, 13.1, 11.2, 6.5, and 5.3 h, respectively. Echinacoside losses of 28 to
45% at temperatures of 30 to 65°C, respectively, were signifi cant, whereas the effect
on the other marker compounds was inconclusive. Kim et al. (2000) determined that
freeze-drying and vacuum–microwave drying provided better retention of total
alkamides (1, 2, 3/4, 5/6a/6, 7, and 8/9) than convective drying at 70°C. However,
replacing the full vacuum in the vacuum–microwave dryer with a partial vacuum
resulted in lower retention than convective drying. The decreased retention with
convective and partial pressure vacuum–microwave drying may have been attributable
to the high susceptibility of alkamides (1, 2, 3/4, 5/6a/6, and 7), to degradation at
higher temperatures and oxygen levels.
10.4.4.3 Herbs
The retention of essential oil volatiles was reviewed for basil (Díaz-Maroto et al.,
2004), bay leaf (Díaz-Maroto et al., 2002), and peppermint (Baranauskiené et al.,
2007; Rohloff et al., 2005). The highest retention of total volatiles in basil occurred
for air drying for 15 days compared to oven drying at 45°C for 15 h or freeze-drying for
24 h (Díaz-Maroto et al., 2004). The acceptability of air drying versus freeze-drying
52527_C010.indd 30552527_C010.indd 305 10/3/2008 3:59:37 PM10/3/2008 3:59:37 PM
© 2009 by Taylor & Francis Group, LLC

306 Advances in Food Dehydration
extended to bay leaf (Díaz-Maroto et al., 2002). Freeze-dried chopped leaves resulted
in substantial volatile losses compared to the equally effective methods of air drying
at 25°C for 3 weeks and convective drying at 45°C for 14 h. An air temperature of
30°C as opposed to 50 and 70°C was favored in the retention of peppermint volatiles
(Rohloff et al., 2005). Because convective air drying at 30°C had results similar to
5-day prewilting with fi nal drying at 30°C, the latter was preferred because of
additional energy savings.
Each plant is unique in its chemical and physical structure, which explains the
variety of parameters and drying methods discussed throughout this review. Table 10.4
provides a summary of the quality parameters and drying methods investigated for
seaweed and Brazilian medicinal plants or their extracts: passion fl ower (Passifl ora alata), pata de vaca (Bauhinia forfi cata), espinheira santa (Maytenus ilicifolia), and
echinacea. An inlet air temperature of 150°C was used for both spouted bed and
spray drying of the extracts of passion fl ower, pata de vaca, and espinheira santa;
however, spouted bed drying resulted in negligible losses compared to 3.2 to 13.6%
for spray drying (Oliveira et al., 2006).
As with herb volatiles, low temperature convective drying (50°C for 6.5 h) provided
better retention of total alkamides in echinacea leaves compared to freeze- drying and
vacuum–microwave drying (Kim et al., 2000). Seaweed showed different results
with freeze-drying providing the highest retention of total amino acids, PUFAs, and
vitamin C (Chan et al., 1997). However, based on the fi nal product use and economic
factors, sun drying, an alternative to freeze-drying, provided a similar nutritional
value with some losses in ash, minerals, and vitamin C (possibly due to leaching
effects and long exposure time to air). Seaweed samples oven dried at 60°C for 15 h
had the lowest overall quality. Cui et al. (2004) reported a 61.7% loss of chlorophyll
in chive leaves dried convectively at 60 to 65°C for 6 h, as opposed to systems that
TABLE 10.4Summary of Studies on Herb Drying
Plant Drying Method Quality Parameter Ref.
Seaweed Sun, oven, and freeze-drying Amino acids, FAs,
minerals, and
vitamin C
Chan et al. (1997)
Passion fl ower Spray and spouted bed Total fl avonoids Oliveira et al. (2006)
Pata de vaca Spray and spouted bed Total fl avonoids Oliveira et al. (2006)
Espinheira santa Spray and spouted bed Total tannins Oliveira et al. (2006)
Echinacea Freeze-drying, vaccum–microwave,
and convective drying
Alkamides Kim et al. (2000)
Chives Freeze-drying, vacuum–
microwave, vacuum–
microwave � convection,
vacuum–microwave � vacuum,
and convection drying
Chlorophyll Cui et al. (2004)
52527_C010.indd 30652527_C010.indd 306 10/3/2008 3:59:37 PM10/3/2008 3:59:37 PM
© 2009 by Taylor & Francis Group, LLC

Dehydration Processes for Nutraceuticals and Functional Foods 307
limit the potential of oxidation (i.e., freeze-drying, vacuum–microwave drying, vacuum–
microwave � convective, and vacuum–microwave � vacuum). The latter methods
offered more than 94% chlorophyll retention, allowing dryer selection to be based on
operating costs and equipment availability.
10.4.5 OILSEEDS AND LEGUMES
10.4.5.1 Oilseeds
Flaxseed is recognized for its role as a dietary source of soluble fi ber and ALA
(Manthey et al., 2002; Oomah and Mazza, 2001). The total extractable lipids and
stability were determined for spaghetti that contained ground fl axseed (Manthey et al.,
2002). Losses that occurred in lipid content during the extrusion process may be linked
to the binding of lipids to the gluten in wheat. Drying temperatures of 40 and 70°C had
no affect on the lipid content or FA distribution, resulting in retention of ALA.
10.4.5.2 Legumes
Edamame is a soybean harvested at 80% maturity, and it is dried and eaten as a
healthful snack (Qing-guo et al., 2006). The drying methods ranked from highest to
lowest vitamin C and chlorophyll retention were freeze-drying, vacuum–microwave
drying, convection plus vacuum–microwave drying, and convective air drying.
Freeze-drying provided levels of vitamin C and chlorophyll retention of 82.1 and
95.8%, respectively, whereas the same levels for convective drying at 70°C were 35.5
and 24.5%. The soft texture represented by a low hardness value of the freeze-dried
products, however, would not appeal to consumers who prefer a chewy texture.
Considering other important factors such as the drying rate, texture, rehydration
capacity, and costs, convection plus vacuum–microwave drying provided the best
overall quality. This treatment consisted of preliminary drying for 20 min at 70°C
followed by vacuum–microwave drying, resulting in retention of 66.2% of the vita-
min C and 49.7% of the chlorophyll. Chickpeas contain certain antinutritional factors
such as trypsin inhibitors, which lower their digestibility (Márquez et al., 1998). A heat
treatment of 140°C for 6 h facilitated destruction of the majority of trypsin inhibitors
in chickpea fl our without causing protein denaturation, which did occur at longer
durations of 12 and 24 h.
Field peas, a source of protein, contain high levels of the essential amino acid
lysine (Tian et al., 1999). The stages involved with pilot-scale preparation of fi eld pea
isolate with salt solution included preparing fl our from dehulled fi eld peas, develop-
ment of a slurry, decantation, clarifi cation, ultrafi ltration, diafi ltration, and drying
either by spray drying or freeze-drying. Freeze-dried and spray dried products did
not differ in their solubility, but freeze-drying caused nonuniform particle size and
an undesirable dark color.
10.5 LATEST ADVANCES
A variety of methods pertaining to the drying of plant products for use as
ingre dients in nutraceuticals and functional foods were discussed. The applicable
52527_C010.indd 30752527_C010.indd 307 10/3/2008 3:59:37 PM10/3/2008 3:59:37 PM
© 2009 by Taylor & Francis Group, LLC

308 Advances in Food Dehydration
novel technologies were Refractance Window (Nindo et al., 2007), far infrared (Chua
and Chou, 2005; Kim et al., 2002), heat pump (Chua and Chou, 2005), and low-pressure
superheated steam drying (Kongsoontornkijkul et al., 2006). These technologies
were investigated for their potential to reduce thermal and oxidative degradation
within products or for energy effi ciency (heat pump drying and low-pressure super-
heated steam). However, further research is required for each of these methods.
Although products such as carrots, squash, asparagus, berries, mangoes, avocadoes,
and blueberry and cranberry juice have been examined with Refractance Window
drying, more optimization testing is required (Nindo and Tang, 2007). Jun and
Irudayaraj (2003) determined with fi lters that individual compounds can be treated
with far infrared radiation according to their absorption ability, but more testing is
required for its applicability to complex food systems. Kongsoontornkijkul et al.
(2006) determined that, although low-pressure superheated steam allowed better
retention of ascorbic acid during drying, structural changes occurred that affected
the stability during tea preparation of Indian gooseberries. This effect needs to be
considered for application to other products. Chua and Chou (2005) ascertained that
heat pump drying can be used as part of a mixed mode drying system; however,
more investigation is required for optimization and applicability to other products.
In addition to the development and testing of novel drying systems, there is a
trend to optimize or modify conventional techniques. Several combination systems
that utilize convective drying in conjunction with vacuums and microwaves were
determined to be good alternatives to freeze-drying (Cui et al., 2004; Kim et al.,
2000; Qing-guo et al., 2006). Martynenko (2006) reported on a computer vision
system to assess the color quality of ginseng for the prediction of the drying process.
A correlation of image analysis with appearance and physical attributes (i.e., area,
color, texture, moisture, and quality) allowed the approximate prediction of moisture
content. Nanotechnology was considered for applications in the optimization of
encapsulation and delivery systems that carry, protect, and deliver functional food
ingredients (Weiss et al., 2006).
Optimization of drying system parameters can also be performed by determining
the drying kinetics, compound and product degradation, energy effi ciency, and product
stability during and after drying. Chua and Chou (2005) evaluated the drying rate and
energy effi ciency for various drying systems, in addition to determining color degrada-
tion with drying. Nindo and Tang (2007) determined the product temperature, color,
antioxidant activity, microbial destruction, and energy consumption in their evaluation
of Refractance Window drying in blueberry and cranberry juice concentrations.
NOMENCLATURE
ALA �-linolenic acid (ALA)
C carotene content (mg/100 g dry material)
C0 initial carotene concentration (mg/100 g dry material)
FA fatty acid
K nutrition loss content (/h)
PUFA polyunsaturated fatty acid
t dehydration time (h)
52527_C010.indd 30852527_C010.indd 308 10/3/2008 3:59:37 PM10/3/2008 3:59:37 PM
© 2009 by Taylor & Francis Group, LLC

Dehydration Processes for Nutraceuticals and Functional Foods 309
REFERENCES
Abdel-Aal, E.-S.M., Sosulski, F.W., Shehata, A.A.Y., and Youssef, M.M., Nutritional,
functional and sensory properties of wheat rice and fababean blends texturized by
drum drying, Int. J. Food Sci. Technol., 31, 257–266, 1996.
Apintanapong, M. and Noomhorm, A., The use of spray drying to microencapsulate 2-acetyl-
1-pyrroline, a major fl avour component of aromatic rice, Int. J. Food Sci. Technol., 38,
95–102, 2003.
Azoubel, P.M. and Murr, F.E.X., Effect of pretreatment on the drying kinetics of cherry
tomato (Lycopersicon esculentum var. cerasiforme), in Transport Phenomena in Food Processing, Welti-Chanes, J., Vélez-Ruiz, J.F., and Barbosa-Cánovas, G.V., Eds., CRC
Press, Boca Raton, FL, 2003, pp. 137–151.
Baranauskiené, R., Bylaité, E., Žukauskaité, J., and Venskutonis, R.P., Flavor retention of
peppermint (Mentha piperita L.) essential oil spray-dried in modifi ed starches during
encapsulation and storage, J. Agric. Food Chem., 55, 3027–3036, 2007.
Beaudry, C., Raghavan, G.S.V., and Rennie, T.J., Microwave fi nish drying of osmotically
dehydrated cranberries, Dry. Technol., 21, 1797–1810, 2003.
Bell, L.N., Stability testing of nutraceuticals and functional foods, in Handbook of Nutraceuticals and Functional Foods, Wildman, R.E.C., Ed., CRC Press, Boca Raton,
FL, 2001, pp. 501–516.
Benali, M., Thermal drying of foods: Loss of nutritive content and spoilage issues, in
Dehydration of Products of Biological Origin, Mujumdar, A.S., Ed., Science Publishers,
Enfi eld, NH, 2004, pp. 137–152.
Bettini, M.d-F.M., Purifi cation of orange peel oil and oil phase by vacuum distillation, in
Functional Food Ingredients and Nutraceuticals: Processing Technologies, Shi, J.,
Ed., CRC Press, Boca Raton, FL, 2007, pp. 157–172.
Bhandari, B., Spray-drying: An encapsulation technique for food fl avors, in Dehydration of Products of Biological Origin, Mujumdar, A.S., Ed., Science Publishers, Enfi eld, NH,
2004, pp. 513–533.
British Columbia Ministry of Agriculture, Food, and Fisheries, Farm mechanization factsheet
(No. 280.380-1), Resource Management Branch, Ministry of Agriculture, Abbotsford,
Canada, 1998, pp. 1–9.
Bruneton, J., Pharmacognosy: Phytochemistry Medicinal Plants, 2nd ed., Lavoisier
Publishing, Paris, 1999.
Cacace, J.E. and Mazza, G., Pressurized low polarity water extraction of biologically
active compounds from plant products, in Functional Food Ingredients and Nutraceuticals: Processing Technologies, Shi, J., Ed., CRC Press, Boca Raton, FL,
2007, pp. 135–155.
Camire, M.E., Dougherty, M.P., and Briggs, J.L., Functionality of fruit powders in extruded
corn breakfast cereals, Food Chem., 101, 765–770, 2007.
Cassini A.S., Marczak, L.D.F., and Noreña, C.P.Z., Drying characteristics of textured soy
protein, Int. J. Food Sci. Technol., 41, 1047–1053, 2006.
Chan, J.C.-C., Cheung, P.C.-K., and Ang, P.O., Jr., Comparative studies on the effect of three
drying methods on the nutritional composition of seaweed Sargassum hemiphyllum
(Turn.) C. Ag, J. Agric. Food Chem., 45, 3056–3059, 1997.
Chua K.J. and Chou, S.K., A comparative study between intermittent microwave and infrared
drying of bioproducts, Int. J. Food Sci. Technol., 40, 23–39, 2005.
Cohen, M., Robinson, R.S., and Bhagavan, H.N., Antioxidants in dietary lipids, in Fatty Acids in Foods and Their Health Implications, 2nd ed., Chow, C.K., Ed., Marcel
Dekker, New York, 2000, pp. 439–450.
Costenla, D., Ponce, A.G., and Lozano, J.E., Effect of pomace drying on apple pectin,
Lebensm.-Wiss. Technol., 35, 216–221, 2002.
52527_C010.indd 30952527_C010.indd 309 10/3/2008 3:59:37 PM10/3/2008 3:59:37 PM
© 2009 by Taylor & Francis Group, LLC

310 Advances in Food Dehydration
Cui, Z.-W., Xu, S.-Y., and Sun, D.-W., Effect of microwave–vacuum drying on the carotenoids
retention of carrot slices and chlorophyll retention of Chinese chive leaves, Dry. Technol., 22, 563–575, 2004.
Davidson, V.J., Li, X., and Brown, R.B., Forced-air drying of ginseng root: 1. Effects of air
temperature on quality, J. Food Eng., 63, 361–367, 2004.
DeMan, J., Principles of Food Chemistry, 3rd ed., Aspen Publishers, Gaithersburg, MD,
1999.
Desai, K.G.H. and Park, H.J., Recent developments in microencapsulation of food ingredients,
Dry. Technol., 23, 1361–1394, 2005.
Desobry, S.A., Netto, F.M., and Labuza, T.P., Comparison of spray drying, drum drying, and
freeze-drying for �-carotene encapsulation and preservation, J. Food Sci., 62, 1158–1162,
1997.
Díaz-Maroto, M.C., Palomo, E.S., Castro, I., Viñas, M.A.G., and Pérez-Coello, M.S., Changes
produced in the aroma compounds and structural integrity of basil (Ocimum basilicum L.)
during drying, J. Sci. Food Agric., 84, 2070–2076, 2004.
Díaz-Maroto, M.C., Pérez-Coello, M.S., and Cabezudo, M.D., Effect of drying method on the
volatiles in bay leaf (Laurus nobilis L.), J. Agric. Food Chem., 50, 4520–4524, 2002.
Ersus, S. and Yurdagel, U., Microencapsulation of anthocyanin pigments of black carrot
(Daucuscarota L.) by spray drier, J. Food Eng., 80, 805–812, 2007.
Eskin, M.N.A. and Tamir, S., Dictionary of Nutraceuticals and Functional Foods, CRC
Press, Boca Raton, FL, 2006.
Farkas, I., Solar-drying of materials of biological origin, in Dehydration of Products of Biological Prigin, Mujumdar, A.S., Ed., Science Publishers, Enfi eld, NH, 2004,
pp. 317–368.
Feng, H., Tang, J., Mattinson, D.S., and Fellman, J.K., Microwave and spouted bed drying of
frozen blueberries: The effect of drying and pretreatment methods on physical properties
and retention of fl avor volatiles, J. Food Process. Preserv., 23, 463–479, 1999.
Fleming, T., Ed., Physicians Desk Reference: PDR for Herbal Medicines, Medical Economics
Company, Montvale, NJ, 2000.
Gibson, G.R. and Fuller, R., The role of probiotics and prebiotics in the functional food
concept, in Functional Foods. The Consumer, the Products and the Evidence, Sadler,
M.J. and Saltmarsh, M., Eds., Cambridge University Press, Cambridge, U.K., 1998,
pp. 3–4.
Goula, A.M. and Adamopoulos, K.G., Spray drying of tomato pulp in dehumidifi ed air: II.
The effect on powder properties, J. Food Eng., 66, 35–42, 2005.
Goula, A.M. and Adamopoulos, K.G., Retention of ascorbic acid during drying of tomato
halves and tomato pulp, Dry. Technol., 24, 57–64, 2006.
Goula, A.M., Adamopoulos, K.G., and Kazakis, N.A., Infl uence of spray drying conditions
on tomato powder properties, Dry. Technol., 22, 1129–1151, 2004.
Grabowski, S., Marcotte, M., Poirier, M., and Kudra, T., Drying characteristics of osmotically
pretreated cranberries—Energy and quality aspects, Dry. Technol., 20, 1989–2004,
2002.
Grabowski, S., Marcotte, M., Quan, D., Taherian, A.R., Zareifard, M.R., Poirier, M., and
Kudra, T., Kinetics and quality aspects of Canadian blueberries and cranberries dried
by osmo-convective method, Dry. Technol., 25, 367–374, 2007.
Grabowski, S. and Mujumdar, A.S., Solar-assisted osmotic dehydration, in Drying ’92, Proceedings of the 8th International Drying Symposium (IDS ’92), Vol. B, Mujumdar,
A.S., Ed., Elsevier, Amsterdam, 1992, pp. 1689–1696.
Halawa, E.E.H., Brojonegoro, A., and Davies, R., An overview of the ASEAN–Canada
project on solar energy in drying processes [Technical note], Dry. Technol., 15, 1585–1592,
1997.
52527_C010.indd 31052527_C010.indd 310 10/3/2008 3:59:37 PM10/3/2008 3:59:37 PM
© 2009 by Taylor & Francis Group, LLC

Dehydration Processes for Nutraceuticals and Functional Foods 311
Health Canada, Nutraceuticals/functional foods and health claims on foods, policy paper,
Therapeutic Products Programme and the Food Directorate from the Health Protection
Branch, http://www.hc-sc.gc.ca/fn-an/alt_formats/hpfb-dgpsa/pdf/label-etiquet/nutra-funct_
foods-nutra-fonct_aliment_e.pdf (accessed March 4, 2007).
Ibarz, A. and Barbosa-Canovas, G.V., Unit Operations in Food Engineering, CRC Press,
Boca Raton, FL, 2003.
Jalili, T., Wildman, R.E.C., and Medeiros, D.M., Dietary fi ber and coronary heart disease, in
Handbook of Nutraceuticals and Functional Foods, Wildman, R.E.C., Ed., CRC Press,
Boca Raton, FL, 2001, pp. 281–293.
Joubert E. and de Villiers, O.T., Effect of fermentation and drying conditions on the quality
of rooibos tea, Int. J. Food Sci. Technol., 32, 127–134, 1997.
Jun, S. and Irudayaraj, J., Selective far infrared heating system—Design and evaluation I,
Drying Technol., 21, 51–67, 2003.
Kabganian, R., Carrier, D.J., and Sokhansanj, S., Physical characteristics and drying rate of
echinacea root, Drying Technol., 20, 637–649, 2002.
Kanakdande, D., Bhosale, R., and Singhal, R.S., Stability of cumin oleoresin microencapsu-
lated in different combination of gum arabic, maltodextrin and modifi ed starch,
Carbohydr. Polym., 67, 536–541, 2007.
Kaur, D., Sogi, D.S., and Wani, A.A., Degradation kinetics of lycopene and visual color in
tomato peel isolated from pomace, Int. J. Food Prop., 9, 781–789, 2006.
Kim, H.-O., Durance, T.D., Scaman, C.H., and Kitts, D.D., Retention of alkamides in dried
Echinacea purpurea, J. Agric. Food Chem., 48, 4187–4192, 2000.
Kim, M.H., Kim, S.M., Kim, C.S., Park, S.J., Lee, C.H., and Rhee, J.Y., Quality of Korean
ginseng dried by a prototype continuous fl ow dryer using far infrared radiation and hot
air, Can. Biosys. Eng., 44, 47–54, 2002.
Kołakowska, A. and Sikorski, Z.E., The role of lipids in food quality, in Chemical and Functional Properties of Food Lipids, Sikorski, Z.E. and Kołakowska, A., Eds., CRC
Press, Boca Raton, FL, 2003, pp. 1–8.
Kongsoontornkijkul, P., Ekwongsupasam, P., Chiewchan, N., and Devahastin, S., Effects of
drying methods and tea preparation temperature on the amount of vitamin C in Indian
gooseberry tea, Dry. Technol., 24, 1509–1513, 2006.
Krokida, M.K., Maroulis, Z.B., and Saravacos, G.D., The effects of the method of drying on
the colour of dehydrated products, Int. J. Food Sci. Technol., 36, 53–59, 2001.
Kumar, A., Membrane separation technology in processing bioactive components, in
Functional Food Ingredients and Nutraceuticals: Processing Technologies, Shi, J.,
Ed., CRC Press, Boca Raton, FL, 2007, pp. 193–208.
Kundu, K.M., Drying of oilseeds, in Dehydration of Products of Biological Origin, Mujumdar,
A.S., Ed., Science Publishers, Enfi eld, NH, 2004, pp. 275–295.
Lewicki, P.P., Le, H.V., and Pomaranska-Lazuka, W., Effect of pre-treatment on convective
drying of tomatoes, J. Food Eng., 54, 141–146, 2002.
Li, Y., Xu, S.-Y., and Sun, D.-W., Preparation of garlic powder with high allicin content by
using combined microwave–vacuum and vacuum drying as well as microencapsulation,
J. Food Eng., 83, 76–83, 2007.
Litwinienko, G. and Kasprzycka-Guttman, T., Study on the autoxidation kinetic of fat compo-
nents by differential scanning calorimetry. 2. Unsaturated fatty acids and their esters,
Ind. Eng. Chem. Res., 39, 13–17, 2000.
Madene, A., Jacquot, M., Scher, J., and Desobry, S., Flavour encapsulation and controlled
release—A review, Int. J. Food Sci. Technol., 41, 1–21, 2006.
Manthey, F.A., Lee, R.E., and Hall, C.A., III, Processing and cooking effects on lipid content
and stability of �-linolenic acid in spaghetti containing ground fl axseed, J. Agric. Food Chem., 50, 1668–1671, 2002.
52527_C010.indd 31152527_C010.indd 311 10/3/2008 3:59:37 PM10/3/2008 3:59:37 PM
© 2009 by Taylor & Francis Group, LLC

312 Advances in Food Dehydration
Márquez, M.C., Fernández, V., and Alonzo, R., Effect of dry heat on the in vitro digestibility and
trypsin inhibitor activity of chickpea fl our, Int. J. Food Sci. Technol., 33, 527–532, 1998.
Martynenko, A.I., Computer-vision system for control of drying processes, Dry. Technol., 24,
879–888, 2006.
Martynenko, A.I., Brown, R.B., and Davidson, V.J., Physical and physiological factors of
ginseng drying, Appl. Eng. Agric., 22, 571–576, 2006.
Mathur, K.B. and Epstein, N., Spouted Beds, Academic Press, New York, 1974.
Neto, C.C., Cranberry and its phytochemicals: A review of in vitro anticancer studies, Am. Soc. Nutr., 137, 186S–193S, 2007.
Nindo, C.I., Powers, J.R., and Tang, J., Infl uence of refractance window evaporation on
quality of juices from small fruits, LWT Food Sci. Technol., 40, 1000–1007, 2007.
Nindo, C.I. and Tang, J., Refractance window dehydration technology: A novel contact drying
method, Dry. Technol., 25, 37–48, 2007.
Nsonzi, F. and Ramaswamy, H.S., Quality evaluation of osmo-convective dried blueberries,
Dry. Technol., 16, 705–723, 1998.
Oliveira, W.P, Bott, R.F., and Souza, C.R.F., Manufacture of standardized dried extracts from
medicinal Brazilian plants, Dry. Technol., 24, 523–533, 2006.
Oomah, B.D. and Mazza, G., Functional foods, in The Wiley Encyclopedia of Food Science and Technology, Vol. 2, 2nd ed., Francis, F.J., Ed., John Wiley & Sons, New York,
2000, pp. 1176–1182.
Oomah, B.D. and Mazza, G., Optimization of a spray drying process for fl axseed gum, Int. J. Food Sci. Technol., 36, 135–143, 2001.
Orsat, V. and Raghavan, G.S.V., Dehydration technologies to retain bioactive components, in
Functional Food Ingredients and Nutraceuticals: Processing Technologies, Shi, J.,
Ed., CRC Press, Boca Raton, FL, 2007, pp. 173–191.
Pan, Y.K., Zhao, L.J., Zhang, Y., Chen, G., and Mujumdar, A.S., Osmotic dehydration
pretreatment in drying of fruits and vegetables, Dry. Technol., 21, 1101–1114, 2003.
Passardi, R.L., Schvezov, C.E., Schmalko, M.E., and González, A.D., Drying of Ilex paraguar-iensis Saint Hilaire by microwave radiation, Dry. Technol., 24, 1437–1442, 2006.
Pokorný, J. and Schmidt, Š., The impact of food processing in phytochemicals: The case of
antioxidants, in Phytochemical Functional Foods, Johnson, I. and Williamson, G.,
Eds., CRC Press, Boca Raton, FL, 2003, pp. 298–314.
Popovich, D.G., Hu, C., Durance, T.D., and Kitts, D.D., Retention of ginsenosides in dried
ginseng root: Comparison of drying methods, J. Food Sci., 70, 355–358, 2005.
Qing-guo, H., Min, Z., Mujumdar, A.S., Wei-hua, D., and Jin-cai, S., Effects of different
drying methods on the quality changes of granular edamame, Dry. Technol., 24, 1025–
1032, 2006.
Ratti, C., Hot air and freeze-drying of high-value foods: A review, J. Food Eng., 49, 311–319,
2001.
Regier, M., Mayer-Miebach, E., Behsnilian, D., Neff, E., and Schuchmann, H.P., Infl uences
of drying and storage of lycopene-rich carrots on the carotenoid content, Dry. Technol., 23, 989–998, 2005.
Rohloff, J., Draglund, S., Mordal, R., and Iversen, T.-H., Effect of harvest time and drying
method on biomass production, essential oil yield, and quality of peppermint (Mentha
x piperita L.), J. Agric. Food Chem., 53, 4143–4148, 2005.
Roos, Y.H., Phase and state transitions in dehydration of biomaterials and foods, in
Dehydration of Products of Biological Origin, Mujumdar, A.S., Ed., Science Publishers,
Enfi eld, NH, 2004, pp. 3–22.
Sablani, S.S., Drying of fruits and vegetables: Retention of nutritional/functional quality,
Dry. Technol., 24, 123–135, 2006.
Sanguansri L. and Augustin, M.A., Microencapsulation and delivery of omega-3 fatty acids,
in Functional Food Ingredients and Nutraceuticals: Processing Technologies, Shi, J.,
Ed., CRC Press, Boca Raton, FL, 2007, pp. 297–327.
52527_C010.indd 31252527_C010.indd 312 10/3/2008 3:59:37 PM10/3/2008 3:59:37 PM
© 2009 by Taylor & Francis Group, LLC

Dehydration Processes for Nutraceuticals and Functional Foods 313
Schiffmann, R.F., Microwave and dielectric drying, in Handbook of Industrial Drying,
Mujumdar, A.S., Ed., Marcel Dekker, New York, 1995, pp. 345–372.
Shahidi, F. and Naczk, M., Phenolics in Food and Nutraceuticals, CRC Press, Boca Raton,
FL, 2004.
Shi, J., Kassama, L.S., and Kakuda, Y., Supercritical fl uid technology for extraction of
bioactive components, in Functional Food Ingredients and Nutraceuticals: Processing Technologies, Shi, J., Ed., CRC Press, Boca Raton, FL, 2007, pp. 3–43.
Shi, J., LeMaguer, M., and Bryan, M., Lycopene from tomatoes, in Functional Foods: Biochemical and Processing Aspects, Vol. 2, Shi, J., Mazza, G., and Le Maguer, M.,
Eds., CRC Press, Boca Raton, FL, 2002, pp. 135–167.
Skrede, G. and Wrolstad, R.E., Flavonoids from berries and grapes, in Functional Foods: Biochemical and Processing Aspects, Vol. 2, Shi, J., Mazza, G., and Le Maguer, M.,
Eds., CRC Press, Boca Raton, FL, 2002, pp. 71–98.
Small, E. and Catling, P.M., Canadian Medicinal Crops, NRC Research Press, Ottawa, 1999.
Sokhansanj, S. and Jayas, D.S., Drying of foodstuffs, in Handbook of Industrial Drying,
3rd ed., Mujumdar, A.S., Ed., CRC Press, Boca Raton, FL, 2006, pp. 522–546.
Sunjka, P.S. and Raghavan, G.S.V., Assessment of pretreatment methods and osmotic
dehydration for cranberries, Can. Biosyst. Eng., 46, 35–40, 2004.
Tian, S., Kyle, W.S.A., and Small, D.M., Pilot scale isolation of proteins from fi eld peas
(Pisum sativum L.) for use as food ingredients, Int. J. Food Sci. Technol., 34, 33–39,
1999.
Unadi, A., Fuller, R.J., and Macmillan, R.H., Strategies for drying tomatoes in a tunnel
dehydrator, Dry. Technol., 20, 1407–1425, 2002.
Vaidya, S., Bhosale, R., and Singhal, R.S., Microencapsulation of cinnamon oleoresin by
spray drying using different wall materials, Dry. Technol., 24, 983–992, 2006.
Van Den Berg, C., Water activity, in Concentration and Drying of Foods, MacCarthy, D., Ed.,
Elsevier Applied Science, New York, 1986, pp. 11–51.
Vega-Mercado, H., Góngora-Nieto, M.M., and Barbosa-Cánovas, G.V., Advances in dehydration
of foods, J. Food Eng., 49, 271–289, 2001.
Vvedenskaya, I.O., Rosen, R.T., Guido, J.E., Russell, D.J., Mills, K.A., and Vorsa, N.,
Characterization of fl avonols in cranberry (Vaccinium macrocarpon) powder, J. Agric. Food Chem., 52, 188–195, 2004.
Wasowicz, E., Cholesterol and phytosterols, in Chemical and Functional Properties of Food Lipids, Sikorski, Z.E. and Kołakowska, A., Eds., CRC Press, Boca Raton, FL, 2003, pp.
93–107.
Webb, G.P., Dietary Supplements and Functional Foods, Blackwell Publishing, Oxford,
U.K., 2006.
Weiss, J., Takhistov, P., and McClements, D.J., Functional materials in food nanotechnology—
Scientifi c status summary, J. Food Sci., 71, R107–R115, 2006.
WHO, Global strategy on diet, physical activity and health, http://www.who.int/
dietphysicalactivity/strategy/eb11344/strategy_english_web.pdf, 2004.
Wildman, R.E.C., Nutraceuticals: A brief review of historical and teleological aspects, in
Handbook of Nutraceuticals and Functional Foods, Wildman, R.E.C., Ed., CRC Press,
Boca Raton, FL, 2001a, pp. 1–12.
Wildman, R.E.C., Classifying nutraceuticals, in Handbook of Nutraceuticals and Functional Foods, Wildman, R.E.C., Ed., CRC Press, Boca Raton, FL, 2001b, pp. 13–30.
Wiriyaumpaiwong, S., Soponronnarit, S., and Prachayawarakorn, S., Comparative study of
heating processes for full-fat soybeans, J. Food Eng., 65, 371–382, 2004.
Xie, Y.-L., Zhou, H.-M., and Zhang, Z.-R., Effect of relative humidity on retention and stability
of vitamin A microencapsulated by spray drying, J. Food Biochem., 31, 68–80, 2007.
Yoshii, H., Yasuda, M., Furuta, T., Kuwahara, H., Ohkawara, M., and Linko, P., Retention of
cyclodextrin complexed shiitake (Lentinus edodes) fl avors with spray drying, Dry. Technol., 23, 1205–1215, 2005.
52527_C010.indd 31352527_C010.indd 313 10/3/2008 3:59:37 PM10/3/2008 3:59:37 PM
© 2009 by Taylor & Francis Group, LLC

52527_C010.indd 31452527_C010.indd 314 10/3/2008 3:59:37 PM10/3/2008 3:59:37 PM
© 2009 by Taylor & Francis Group, LLC

315
11 Drying of Microorganisms for Food Applications
Janusz Adamiec
CONTENTS
11.1 Introduction ............................................................................................. 315
11.2 Background on Microorganisms ............................................................. 318
11.3 Microorganisms as Drying Objects ........................................................ 322
11.4 General Rules on Selection of Drying Method ....................................... 328
11.5 Drying of Starter Cultures ...................................................................... 331
11.6 Conventional and Advanced Methods in Drying
and Preservation of Microorganisms ...................................................... 336
11.7 Conclusions ............................................................................................. 348
Nomenclature ..................................................................................................... 348
References .......................................................................................................... 349
11.1 INTRODUCTION
Food and pharmaceutical industries have utilized drying technologies as the preferred
methods for preserving a multitude of microbiological and drug preparations in bulk
quantities. However, desiccation of microorganisms as culture collections of cells for
long-term storage and for future propagation has been the preferred preservation
method for decades. The term microorganisms encompasses a variety of living
organisms of microscopic size that are broadly classifi ed into bacteria, fungi, molds,
yeasts, algae, protozoa, and viruses. Microorganisms play key positive and negative
roles in food technology. The negative role denotes a risk of the uncontrolled devel-
opment of microorganisms that may change their positive functions and fi nally result
in deterioration of quality or even in complete degradation of a food product. There
is often a risk that poisonous and noxious substances may form.
However, under controlled conditions microorganisms most frequently play a
positive role in biotechnological processes, specifi cally in manufacturing, recombina-
tion, and conservation of foods. The spectrum of food products produced with the
assistance of microorganisms is very broad and extends from common-life products
52527_C011.indd 31552527_C011.indd 315 10/3/2008 4:09:37 PM10/3/2008 4:09:37 PM
© 2009 by Taylor & Francis Group, LLC

316 Advances in Food Dehydration
such as wine, beer, cheese, or bread, which have been produced historically by
fermentation, to newer products, such as fungal protein and the technology of a single
cell protein (SCP). This new and dynamically developing technology is based on a
fermentation process resulting in extraneous single cell microorganisms with high
protein content. After separation, and sometimes purifi cation and preservation, the
protein concentrate is used as a nutrient additive in many foodstuffs. One of the most
important biotechnologies is milk processing that not only produces cream, cheese,
yogurt, and so forth, but also includes biopreparations of lactic acid bacteria starters
and vitamins as well as the separation of milk components such as casein, lactose, and
lactic acid. The cutting edge application of microorganisms exploits their sensitivity
to environmental conditions. Thus, such “biosensors” could constitute cell-based
devices for environmental monitoring, if long-term preservation of both the viability
and activity of the yeast or bacteria are secured by drying, immobilizing, microencap-
sulation, and similar techniques (Abadias et al., 2001; Bjerketorp et al., 2006).
Note that biotechnological processes affect a broad spectrum of human activities,
including the chemical and pharmaceutical industry, agriculture, health, environ-
mental protection, and so forth. The remarkable differences in the defi nitions of
biotechnology used in the scientifi c and technical literature result from process
complexity and a growing number of applications. Thus, representatives of “pure
science” in this fi eld will include molecular biology, genetic engineering, and bio-
chemical processes on a microscale, such as those occurring within particular
elements constituting a cell. In contrast, a technologist will approach biotechnology
more practically as an interdisciplinary science that deals with the technical utiliza-
tion of biological materials and processes. This is supported by the achievements of
numerous, apparently detached areas of science that integrate molecular biology,
biochemistry, microbiology, engineering, mathematics, physics, mechanics, eco-
nomics, and so forth in industrial applications of microorganisms.
In both meanings of biotechnology, two different terms are utilized: “biomate-
rial” and “bioproduct.” It is generally assumed that a biomaterial is a substance that
is related in any way to a living organism and its vital functions and activities. Most
frequently it is a single cell or a system of cells that form a living organism. However,
this can be the structural part of a cell or an organism that constitutes a compact
entity, a component built into various structural parts of the organism, or a substance
that is formed or subject to transformations as a result of processes in which living
organisms are involved. Diversifi cation of biomaterials causes that the same sub-
stance to be termed differently and to perform more than one function. Bioproduct
is regarded as the equivalent to a biomaterial and denotes a substance that is a prod-
uct of biotechnological transformation with the use of microorganisms, their active
elements, or biochemically active substances. Our defi nition highlights the features
and vital functions of the biomaterial. However, not every bioproduct possesses such
properties. Thus, bioproducts do not always fall into the category of a biomaterial,
but every biomaterial is a bioproduct by defi nition. However, in many processes the
substance can be considered as both a biomaterial and bioproduct, for example,
baker’s yeast in the process of biosynthesis. Thus, yeast, vaccines, enzymes,
antibiotics, and hormones can be called bioproducts and biomaterials, whereas etha-
nol, acetone, citric acid, yogurt, and beer can be considered only as bioproducts.
52527_C011.indd 31652527_C011.indd 316 10/3/2008 4:09:37 PM10/3/2008 4:09:37 PM
© 2009 by Taylor & Francis Group, LLC

Drying of Microorganisms for Food Applications 317
Subsequent terms denoting substances that are within the group of biomaterials
include microorganisms, biopolymers, and biomass. The broadest meaning is
ascribed to biomass because it is used to cover the two other notions. Hence, biomass
is the mixture of reagents subjected to transformations and products formed during
the main bioprocess, together with by-products, remnants of substrates, stabilizing
agents, and others. It is also correct to call biomass a pure biomaterial separated
from the reaction mixture. Biomass essentially consists of microorganisms or their
structural components and/or of biopolymers. It can also constitute a mixture of
these elements. Microorganisms are biomaterials that usually appear as single cell
organisms or as specialized multicell systems that are similar to animal cells in
terms of their chemical structure (Figure 11.1). They are able to carry out the same
biochemical reactions; that is, a complete metabolic cycle can take place but they are
unable to control their own temperature.
Regarding the main profi le of this book, these biotechnology and process engi-
neering defi nitions and classifi cations appear to be too general, specifi cally from the
microbiology, biochemistry, or genetic engineering points of view. A systematic
classifi cation and description of microorganisms can be found in many monographs
on microbiology (Ainsworth et al., 1965–1973; Arora, 2004; Atlas, 1984; Barnett et
al., 2000; Gunsalus, 1986; Kirst et al., 2001; Rose and Harrison, 1987–1991; Salminen
et al., 2004; Schlegel, 1992).
Biomaterials are produced on an industrial scale with the application of fermen-
tation processes that are most often carried out in a liquid or, more exactly, water
phase. Taking into account the biomass growth stages, optimal activity, and aging, it
is necessary to stop fermentation at the most appropriate stage to separate biomass
from the reaction medium (i.e., water solution) and to fi x its required qualitative
properties. If biomass is left in a fermentation medium, the biochemical activity of
the microorganisms decreases dramatically and secondary reactions are triggered
that destroy the biomass (e.g., putrefaction). The removal of water from biomass
includes mechanical methods of water separation (fi ltration, centrifugation) and ther-
mal evaporation of water (concentration in evaporators, drying until solid biomass
with low moisture content is reached). The fermentation broth is subjected to solvent
FIGURE 11.1 Cross section through (a) bacterial and (b) yeast cells: (1) cell wall, (2) cyto-
plasmic membrane, (3) cytoplasm, (4) nucleid material (nucleus), (5) mesosomes, (6) fl agella,
(7) lipid droplets, and (8) vacuoles.
(a) (b)
1 2
4
3
65
42
1
8
73
52527_C011.indd 31752527_C011.indd 317 10/3/2008 4:09:37 PM10/3/2008 4:09:37 PM
© 2009 by Taylor & Francis Group, LLC

318 Advances in Food Dehydration
(water) removal. It usually contains from 0.1 to 5–7% mass of dry solids (rarely the
solids content exceeds 12 to 15% mass). Most microbiological products should have
moisture content from 5 to 12% mass after drying. Hence, in high capacity technolo-
gies it is necessary to quickly remove huge amounts of water from the fermentation
broth to prevent deterioration of the biomass. A dry microbiological product with
biochemical activity preserved for long-term storage is a valuable and often abso-
lutely necessary raw material for the production of various food products.
In addition to the preservation of products of large-scale biotechnological pro-
duction, in technologies involving microorganisms the preservation of fermentation
products on a much smaller scale is equally important, namely, production, preser-
vation, and storage of microorganism strains that are to be collected in the so-called
pure culture banks (culture collections of cells). These are collections of particular
species and strains of microorganisms that are produced in carefully selected and
controlled conditions and with a high degree of microbiological and genetic purity.
Such collections can be used either for the preservation and growth of originally
produced strains with valuable properties or for distribution as a starting material to
initiate fermentation processes on an industrial scale. There are detailed procedures
that determine the conditions for production and preservation, storage methods, and
time for every strain of bacteria, yeast, mold, and so forth. Although the majority of
these materials are produced and stored in a water environment (slurry), in many
cases it is advantageous to separate microorganisms from the fermentation broth and
to preserve them by drying. Some specifi c preservation procedures for pure cultures
will be presented here later.
Thus, there are many microbiologically different living microorganisms, related
substances, and products of their biotechnological transformations. The differentia-
tion of a microbiological material as a drying object (its origin, structure, suscepti-
bility to the environment, individual production conditions, dry product destination,
etc.) requires individual treatment and selection of the most appropriate method and
drying conditions. Some of the most important issues related to drying of microor-
ganisms (and bioproducts) will be discussed that are crucial to obtain a product with
the required stable qualitative properties and to preserve the active features of a
living organism in particular.
11.2 BACKGROUND ON MICROORGANISMS
Microorganisms are simple living organisms that are small in size (usually below the
limits of normal visibility; Table 11.1) and have a low level of morphological com-
plexity. The main forms of microorganisms and products of microbiological biosyn-
thesis with preserved viability include bacteria, fungi, yeast, molds, protozoa, algae,
viruses, vitamins, enzymes, proteins (amino acids), antibiotics, and so forth, the
activity of which is strongly related to living microorganisms.
Microorganisms can live in extreme conditions, and living cells can be found
almost anywhere where water is in the liquid state. The optimum temperature, pH,
and moisture levels vary from one organism to another. Some cells can grow at
–20°C, provided that water remains in the liquid state (psychrophiles), although
optimum is 15°C; others (mesophiles) can grow at temperature optima ranging from
52527_C011.indd 31852527_C011.indd 318 10/3/2008 4:09:38 PM10/3/2008 4:09:38 PM
© 2009 by Taylor & Francis Group, LLC

Drying of Microorganisms for Food Applications 319
20 to 50°C. Organisms that grow best at a temperature higher than 50°C (up to
110°C, where the water pressure is high enough to prevent boiling) are classifi ed as
thermophiles. For each species, and sometimes for each strain, there is either a point
or a narrow range of temperatures (2 to 4°C) at which the growth rate of microorgan-
isms is maximal. Many microorganisms have an optimum environmental pH that is
far from neutral; for example, some prefer pH 1 or 2 whereas others may grow well
at pH 9. Although most microorganisms can grow only when water activity is high
(Figure 11.2), others can grow on barely moist solid surfaces or in solutions with high
salt concentrations. Many papers and monographs are dedicated to the growth of
microorganisms in relation to the water activity of the medium in regard to the
preservation and storage of food (Rockland and Beuchat, 1987).
The technological processes of microorganism production (fermentation) can be
carried out in batch cultures (batch bioreactors) and in continuous cultures (continu-
ous bioreactors). In batch cultures the conditions of growth change with time: the
concentration of microorganisms (bacteria, yeast) increases, whereas the concentra-
tion of reaction substrates decreases. When microbial cells are inoculated into a batch
reactor containing a fresh culture medium and their increase in concentration is moni-
tored, several distinct phases of growth can be observed (Figure 11.3). There is an ini-
tial phase of stagnation called a lag phase, which is of variable duration and covers
the period of time from inoculation of the fermentation broth until the propagation
rate attains the maximum. This is followed by the exponential growth phase, where
the number of cells (and dry weight) increases exponentially. This phase is also called
the logarithmic phase, the name arising from the common method of plotting the
logarithm of the cell number against time. Thereafter, a short phase of declining growth exists followed by the stationary phase, where the cell numbers are the high-
est. Finally, the number of cells decline during the death phase. It is reasonable to
expect the fermentation process to be stopped in the stationary phase for maximum
TABLE 11.1Shape and Size of Representative Microorganisms Compared with Protein Molecules
Object Shape Size
Bacteria Spherical
Cylindrical
Filamentous
0.5–4 μm diameter
2–20 μm length
Fungi (molds, yeasts) Spherical
Ellipsoidal
Filamentous
10–40 to 200 μm diameter
9–15 × 5–10 μm
Algae Ovoid
Filamentous
28–30 × 8–12 μm
4–8 μm diameter
Protozoa Amorphous �600 μm diameter
Viruses �1 μm
Protein molecules �4–6 nm
52527_C011.indd 31952527_C011.indd 319 10/3/2008 4:09:38 PM10/3/2008 4:09:38 PM
© 2009 by Taylor & Francis Group, LLC
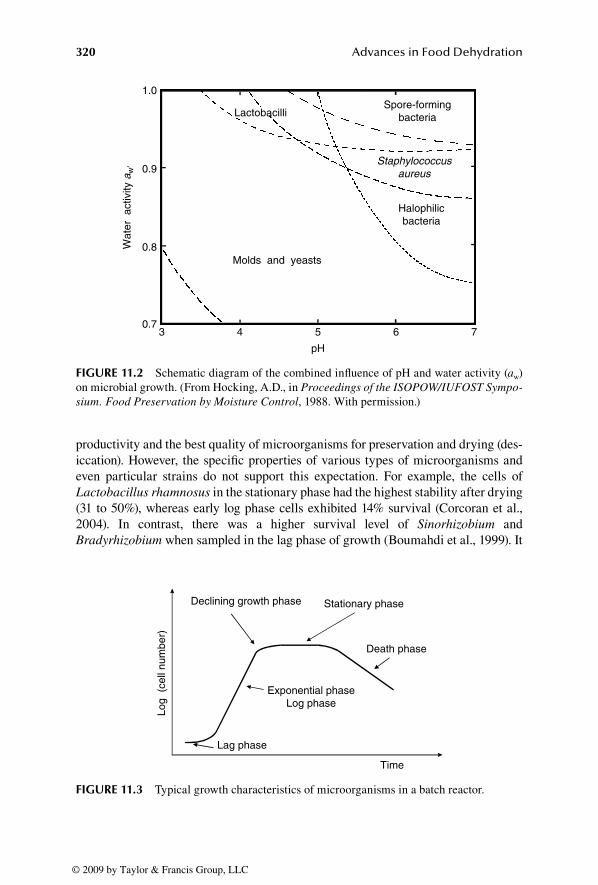
320 Advances in Food Dehydration
productivity and the best quality of microorganisms for preservation and drying (des-
iccation). However, the specifi c properties of various types of microorganisms and
even particular strains do not support this expectation. For example, the cells of
Lactobacillus rhamnosus in the stationary phase had the highest stability after drying
(31 to 50%), whereas early log phase cells exhibited 14% survival (Corcoran et al.,
2004). In contrast, there was a higher survival level of Sinorhizobium and
Bradyrhizobium when sampled in the lag phase of growth (Boumahdi et al., 1999). It
FIGURE 11.2 Schematic diagram of the combined infl uence of pH and water activity (aw)
on microbial growth. (From Hocking, A.D., in Proceedings of the ISOPOW/IUFOST Sympo-sium. Food Preservation by Moisture Control, 1988. With permission.)
1.0
0.9
0.8
0.73 4 5
pH
6 7
Wat
er a
ctiv
ity a
w′
Molds and yeasts
LactobacilliSpore-forming
bacteria
Staphylococcusaureus
Halophilicbacteria
Declining growth phase Stationary phase
Death phase
Exponential phaseLog phase
Lag phase
Time
Log
(ce
ll nu
mbe
r)
FIGURE 11.3 Typical growth characteristics of microorganisms in a batch reactor.
52527_C011.indd 32052527_C011.indd 320 10/3/2008 4:09:38 PM10/3/2008 4:09:38 PM
© 2009 by Taylor & Francis Group, LLC

Drying of Microorganisms for Food Applications 321
is generally known that a concentration higher than 1 × 10⁸ cells/mL is suffi cient to
start the process of preservation or drying, after which the preserved biomaterial will
have a suffi ciently high concentration of living microorganisms that have the proper-
ties of a well-preserved microbiological material.
Another numerical example of batch fermentation is provided in Figure 11.4
according to Hernández et al. (2007). They grew bacteria at subsequent stages (using
the pure culture collection in a preliminary inoculation in a 0.5-l bioreactor, fermen-
tation in a 15-l bioreactor, and fi nal fermentation in a 300-l bioreactor) to investigate
the stability of Tsukamurella paurometabola C-924 powder obtained via spray dry-
ing of biomass. The kinetics of the solid-phase (cells) concentration growth in the
fermentation broth and an increase of the biomass activity as cell viability were
determined (Figure 11.4) to fully estimate the stability of the test microorganisms.
The biomass of C-924 bacteria obtained after 20-h fermentation in the 300-l bio-
reactor was assumed to be an optimal microbiological material to investigate a spray
drying series and to study the stability and preservation of the viability of bacterial
cells in a dry powder stored under different conditions.
To complete the basic information concerning fermentation, note that in continu-
ous fermentation it is necessary to maintain a long period of stable bioreaction con-
ditions in which, at given culture parameters, a constant concentration of reaction
substrates is guaranteed (new substrate is added continuously), microbial cells are
constantly kept at the logarithmic biomass growth phase (log phase), and a controlled
volume of fermentation product is regularly received. This method of culture growth
is termed the equilibrium state.
FIGURE 11.4 Kinetic behavior of strain Tsukamurella paurometabola C-924 cultured in a
300-l effective volume bioreactor. Experimental conditions: pH 6, 30°C, 300 r/min agitation
speed, and 300 l/min air volumetric fl ow. Fermentation was stopped at 20 h. (From Hernández, A.
et al., Biotechnol. Lett., 29, 1723–1728, 2007. With permission.)
0 3 6 9 12 15 18 210
3
6
9
12
15
ConcentrationViability
Time (h)
Dry
cel
l wei
ght (
g/L)
109
1010
1011
1012
Via
bilit
y (U
FC
/mL)
52527_C011.indd 32152527_C011.indd 321 10/3/2008 4:09:38 PM10/3/2008 4:09:38 PM
© 2009 by Taylor & Francis Group, LLC

322 Advances in Food Dehydration
11.3 MICROORGANISMS AS DRYING OBJECTS
Living microorganisms and the products of their metabolism are the most complex
heterogeneous systems to be dried. In the microorganism structure (a typical bacterial
cell), there are numerous important components (cell membrane, nucleus, cytoplasm)
built of numerous inorganic and organic compounds with a broad range of molecular
weights. The specifi cs of heat and mass transfer in these systems are due not only to
their characteristic structure but also to their effect on the transfer processes of their
physicochemical and biological transformations, which follow the drying process.
Particular cultures of microorganisms and biosynthesis products are characterized
by different physical properties. They behave in different ways during moisture
removal, reacting differently to elevated temperature and loss of moisture; and they
conduct heat in different ways.
The nature and structure of a variety of microorganisms do not enable a precise
specifi cation of the form of material–moisture binding. In general, it is assumed that
microorganisms belong to a colloidal–capillary–porous group in which all forms of
material–moisture bonds are possible: water as a solvent, free water, and bound
water. A signifi cant part of water existing in the cells of microorganisms is free
water, whereas that in the macromolecules of biopolymers and products of biochem-
ical transformations is mostly bound water. Water present in the cell as free water is
a medium for various reactions and a solvent of many substances (nutritive, enzymes,
colloids). Fluctuations in the water level can cause disturbances in biochemical
processes that take place in the cell as a living organism (e.g., enzymatic reactions,
transformation of proteins). Interactions typical of drying that cause changes in the
moisture content and temperature of a product include many transformations
affecting its quality, which are related to four types of quality changes: biochemical
(or microbiological), enzymatic, chemical, and physical (Table 11.2). Changes in the
quality of microorganisms (biomaterials) are usually seen as changes in the viability
and death of cells or inactivation and denaturation of the structure. The most drastic
change in biomaterial quality is the death of cells, which is regarded as an irrevers-
ible change in the material structure that stops the life functions of the organisms
(viability), terminating the metabolic transformations that result in growth, repro-
duction, and active interrelations with the surrounding substances, conditions, and
so forth. Inactivation and denaturation or destruction of biomaterials are related to
TABLE 11.2Main Changes of Microorganism Properties during Drying
Biochemical (Microbiological) Enzymatic Chemical Physical
Atrophy of microorganism
cells (bacteria, molds,
yeast)
Loss of activity
of enzymes and
vitamins
Decrease of nutritive values
and activity of proteins,
carbohydrates, fats,
antibiotics, amino acids
Decrease of utility
properties (solubility,
rehydration, shrinkage,
loss of aroma)
52527_C011.indd 32252527_C011.indd 322 10/3/2008 4:09:38 PM10/3/2008 4:09:38 PM
© 2009 by Taylor & Francis Group, LLC

Drying of Microorganisms for Food Applications 323
various phenomena that fi nally lead to a decrease in biological and microbiological
activity. This concerns not only living microorganisms and cells or elements of their
structure but also biomaterials (biopolymers) such as enzymes, antibiotics, amino
acids, and vitamins, which do not possess the properties of living organisms. The
loss of activity or denaturation can be reversible (anabiosis) or irreversible and can be
caused by a number of factors.
Anabiosis is a temporary but reversible suspension of life functions induced by
external factors, a latency in which all processes take place at a minimum rate and
can be resumed when favorable conditions reappear. It is often encountered in nature,
for example, as a resting stage in plants and in protozoa, insects, bacteria sporulation,
and so forth. Anabiosis can also be regarded also as a factor of evolution that can lead
to biological structures capable of survival under extreme conditions. The main phys-
ical factors that control the intensity of life processes are temperature and moisture
content. Therefore, the following types of anabiosis are distinguished: anhydrobiosis
that is induced by water evaporation, cryobiosis caused by low temperature and
freezing of water, and osmobiosis when water is extracted from cells because of
osmotic pressure. During desiccation, microorganisms lose biologically active free
water and retain only bound water, which is biologically inactive. Depending on the
dryness, the balance between both forms of water can be disturbed in favor of bound
water and the formation of local structures in which moisture is isolated and cannot
take part in the transformations. Anabiosis is characterized by the presence of only
bound water in the form of hydrated envelopes of polar groups that constitute a
skeleton of the protoplasm gel. Microorganisms are subjected to anabiosis mainly to
preserve their microbiological features and to store them under safe conditions so
that, when necessary, their life functions can be restored after rehydration at an
appropriate temperature. However, anabiosis induces some processes related to
permanent changes such as a reduced number of cells capable of living and distinct
changes on the cell surfaces, nuclei, and membrane structures. Thus, when selecting
the methods for carrying out anabiosis and storage and activation of the biomaterial,
we should take into account not only what the anabiosis is but also predict and analyze
physical and chemical changes that occur during the latency of microorganisms.
Life functions and activity of microorganisms are closely related to two basic
forms of bacterial cells: vegetative and sporulating. A bacterial cell is in a vegetative
form during the cell’s normal (undisturbed) functioning with typical transformations
related to its growth, reproduction, and aging. The inhibition of life functions,
followed by the transition into anabiosis, is typical behavior of any vegetative cell
exposed to conditions unsuitable for its normal functioning. Further, when the exter-
nal conditions remain unfavorable, irreversible changes in the cell can take place,
leading to destruction and death. However, some types of microorganisms (e.g.,
species of Bacillus, Clostridium, or Sporosarcina) are able to produce a special
sporulating form (a spore) that can survive in extreme conditions such as drought,
elevated temperature, freezing, and radiation and in the presence of many toxic
chemical compounds or enzymes. Note that the bacterial cells’ ability to form spores
is valuable when it is necessary to preserve a biomaterial during long-term storage
under conditions that are different from those during the bioprocess. In contrast,
sporulation is undesirable and makes the process of sterilization very diffi cult
52527_C011.indd 32352527_C011.indd 323 10/3/2008 4:09:38 PM10/3/2008 4:09:38 PM
© 2009 by Taylor & Francis Group, LLC

324 Advances in Food Dehydration
because even the application of drastic conditions can appear insuffi cient to kill the
spores of bacteria. Hence, in view of the two processes of preservation and steriliza-
tion, studies on many aspects of spores have been carried out for a long time (Gould,
1999, 2006; Leuschner and Lillford, 2003).
The ability to form spores is a genetically encoded property, which is induced by
activation of the genes responsible for sporulation. This process is not reproductive
because one bacterial cell usually produces only one spore. Sporulation is a complex
process that encompasses morphological changes of cells, synthesis of new structures,
and specifi c biochemical transformations. There are seven stages of sporulation,
covering the formation of prespores, development of external spore envelopes, and
maturing of the spore (Figure 11.5).
The survival and stability of specifi c quality factors of dried microorganisms
depend strictly on two basic properties: resistance to temperature changes (both high
and low temperature) and sensitivity to changes of moisture content in the biomass or
single cells. Thus, biomaterials are classifi ed according to their thermolability or ther-
mostability and xerosensitivity or xeroresistivity. The intensity and time of thermal
processing (fermentation) as well as pH and water activity of the environment stimulate
the growth of microorganisms, affect their morphology and metabolism, and can
induce their thermal death or destruction and denaturation. Note that the thermal
stability of microorganisms is determined not only by their type, nature, and genetic
variety but also by a number of other factors such as the bioprocess run, type of raw
materials, nutrients and additives, stabilizers used in the fermentation process, and so
forth. For instance, solutions containing sucrose, glucose, proteins, and ions of some
metals (calcium, magnesium) increase the thermal stability of biomaterials.
To estimate the thermal resistance of a given microbiological material, the results
of relevant investigations are presented in the form of thermograms, which give the
effect of temperature and time of thermal impact on the survival or biochemical
activity of the biomaterial. An example of survival curves for Escherichia coli for
various external conditions (temperature and heating time) is illustrated in Figure
11.6. Another example is the water activity that affects the heat resistance of micro-
organisms in food powders (cf. Laroche et al., 2005). Two microorganisms, the yeast
Saccharomyces cerevisiae and the bacterium Lactobacillus plantarum (both remain
I II III IV
VVIVII
FIGURE 11.5 Schematic of morphological changes during sporulation: (I) vegetative cell,
(II–III) asymmetric division and spore enveloping, (IV–V) formation of envelopes and cortex
of spores, (VI) spore maturation, and (VII) mature spore.
52527_C011.indd 32452527_C011.indd 324 10/3/2008 4:09:38 PM10/3/2008 4:09:38 PM
© 2009 by Taylor & Francis Group, LLC

Drying of Microorganisms for Food Applications 325
(a)
L. plantarum
(b)
S. cerevisiae
0 0.2 0.4 0.6 0.80 0.2 0.4 0.6 0.8
8
7
6
5
4
3
2
1
0
Log
dest
ruct
ion
8
7
6
5
4
3
2
1
0
Log
dest
ruct
ion
Heatingtimes
5 s
10 s
20 s
30 s
Water activity aw′Water activity aw′
FIGURE 11.7 Destruction of (a) Lactobacillus plantarum and (b) Saccharomyces cerevi-siae dried on wheat fl our at 150°C for different heating times. (From Laroche, C. et al., Int. J. Food Microbiol., 97, 307–315, 2005. With permission.)
in a vegetative form), were mixed and then dried alive with milk or wheat fl our pow-
ders. After heat treatment for 5 to 30 s at 150 and 200°C, the viability of cells in
terms of the initial water activity was observed (Figure 11.7). Laroche et al. (2005),
among others, concluded that for each strain there was an initial water activity
range (0.3 to 0.4) over which the microorganisms were more resistant and that
L. plantarum was more sensitive to drying and heat treatment on wheat fl our than on
skim milk; a reverse phenomenon was noted for S. cerevisiae.
Unfortunately, the applicability of results from such studies is limited because of
specifi c individual features of microorganisms (cf. the growth curve during fermen-
tation), as well as the effect of the conditions, parameters, and method of given stud-
ies. These conditions are not always described precisely in the published studies, and
differences in the methodology applied by various researchers do not allow absolute
values to be used. However, they provide valuable information on trends and scale of
changes or on the behavior of microorganisms in relation to a given strain or type.
FIGURE 11.6 Survivor curves of Escherichia coli cells as a function of temperature and
heating time. (From Palaniappan, S. et al., Biotechnol. Bioeng., 39, 225–232, 1992. With
permission.)
20
60.0 °C
Time, s
Cel
l num
ber
(in 1
ml)
64.5 °C68.5 °C71.0 °C
40 60 80 10001
10102
103
104
105
106
107
108
109
52527_C011.indd 32552527_C011.indd 325 10/3/2008 4:09:38 PM10/3/2008 4:09:38 PM
© 2009 by Taylor & Francis Group, LLC

326 Advances in Food Dehydration
Zimmermann and Bauer (1986) estimated the biochemical activity of S. cerevisiae
subjected to heating and drying, based on the determination of the activity (enzyme
deactivation kinetics) of one of the yeast enzymes, which is alcohol dehydrogenase
(ADH). The effect of temperature was determined by heating whole yeast cells
(pellets) and pure isolated enzyme solved in a phosphate buffer for 20 min at 30 to
70°C. The enzymes in the microorganism cells have a higher thermal stability than
pure isolated enzymes.
Another method for estimation and numerical comparison of the thermostability
of different biomaterials uses the Arrhenius equation [Eq. (11.1)], which describes
the thermal death of microorganisms that typically follows a fi rst-order process:
dNv ____ dt
� �kNv (11.1)
where the reaction rate constant k is
k � �k0 exp ( � Ea _____
RT(t) ) (11.2)
or in logarithmic form,
ln k � � Ea __ R
( 1 ____ T(t)
) � ln k0 (11.3)
where Nv is the number of viable microorganisms per unit volume of medium, t is the
time, Ea is the activation energy for the death of the organism, R is the gas constant,
T(t) is the absolute temperature, and k0 is the frequency coeffi cient.
The activation energy and frequency coeffi cient are characteristic values for a
given substance and depend on process parameters like the biomass moisture content,
for example. Equation (11.3) is graphically illustrated in Figure 11.8.
The slope of this plot (calculation of Ea and k0) provides a measure of the suscep-
tibility of microorganisms to heat. Typical Ea values for bacterial spores range from
250 to 300 kJ/mol, so the spores are typically much more resistant to temperature
than heat-sensitive nutrients with medium 70 to 100 kJ/mol Ea values. Enzymes have
activation energies intermediate between microbial spores and vitamins (Table 11.3;
Blanch and Clark, 1997). Kuts and Tutova (1983–1984) distinguished and character-
ized the thermal resistance of particular groups of microbiological materials; however,
they found lower Ea values. Moreover, these researchers made the kinetic constants
dependent on the duration of a thermal impact. Luyben et al. (1982) and Kaminski et
al. (1992) used changes in the activity of enzymes during drying and the Arrhenius
equation to describe the reaction kinetics of enzyme deactivation by substituting both
the temperature and the moisture content of the tested material in the empirical
equations. They then used these formulae in a model description and optimization of
drying parameters for biomaterials. Note that the Ea, k0, and decimal reduction time
are important and fundamental factors in the determination of the temperature–time
profi le for sterilization processes.
Biomaterials and microorganisms are especially complex multicomponent objects
that require special treatment not only during drying but also after drying. The drying
kinetics of raw biomass, included in the group of colloidal–capillary–porous bodies
52527_C011.indd 32652527_C011.indd 326 10/3/2008 4:09:38 PM10/3/2008 4:09:38 PM
© 2009 by Taylor & Francis Group, LLC

Drying of Microorganisms for Food Applications 327
FIGURE 11.8 Dependency of destruction and microbial death on temperature: illustration
of Arrhenius correlation as Eq. (11.3).
180
2.2
–4
–3
–2
–1
0
1
2
3
2.3 2.4
Reciprocal absolute temperature1000/T (1/K)
Des
truc
tion
rate
con
stan
t In
k,(k
in 1
/min
)
2.5 2.6 2.7 2.8 2.9 3.0 3.1
160 140 120
Temperature (°C)
Vegetativecultures
Bacterialspores
Vitamins
Slope = Ea /R
100 80 60 50
TABLE 11.3Selected Values of the Activation Energy for Nutrients, Enzymes, and Cells
Compound or Reaction Ea (kJ/mol)
Spores Bacillus stearothermophilus 287.2
Bacillus subtilis 318.0
Clostridium botulinum 343.1
Nutrients Vitamin B12 96.6
Thiamine HCl (B6) 92.0
Ribofl avin (B2) 98.7
Folic acid 70.2
d-Pantothenyl alcohol 87.8
Enzymes Trypsin 170.5
Peroxidase 98.7
Pancreatic lipase 192.3
Source: Blanch, H.W. and Clark, D.S., Biochemical Engineering, Marcel Dekker, New
York, 1997. With permission.
52527_C011.indd 32752527_C011.indd 327 10/3/2008 4:09:38 PM10/3/2008 4:09:38 PM
© 2009 by Taylor & Francis Group, LLC

328 Advances in Food Dehydration
because of its structure, is characterized by intensive evaporation of free-solving water
in the fi rst drying period (process parameters can affect its run) and a prolonged drying
time in the second drying period with a particularly low drying rate in the fi nal stage of
the process. This is related to the shrinkage of biomass elements and their surface
structures that lead to entrapping the water molecules inside the body, which hampers
outward transport (diffusion). This characteristic phenomenon is magnifi ed because the
inner water is bound by relatively strong adsorption and osmotic forces.
After drying, the biomass is still a complex multicomponent system (proteins,
carbohydrates, lipids, biopolymers as enzymes, vitamins, residues from a fermenta-
tion broth, and water) with properties refl ected by the diversifi ed yet individual
character of the equilibrium curves during moisture sorption by a dry product. We
emphasize that such systems are most often characterized by a distinct hysteresis of
the isothermal equilibrium curves during moisture sorption–desorption (Kapsalis,
1987). These products are frequently characterized by moderate or low hygroscopicity
as a mild effect of temperature. In addition, the depth of hysteresis is different and
varies with temperature, so there is no regular relation that means that every material
requires separate studies. Determination of these characteristic equilibrium proper-
ties of a dry product is a precondition for specifying most proper and often very
demanding conditions for packing, storage, transportation, and distribution.
11.4 GENERAL RULES ON SELECTION OF DRYING METHOD
Considering only the positive impact, microorganisms play a crucial role in numerous
biotechnological processes of food production and preservation, health protection in
a broad sense, environmental protection, chemical industry, power engineering,
and many other branches of industry. The basic aim, scope, and development of
applications of modern biotechnologies in food production, agriculture, and health
protection are as follows:
1. Improvement of traditional fermentation processes: fermented dairy and veg-
etable products, bread baking, production of yeast, and alcoholic beverages
2. Development of new microbiological technologies for production of SCPs,
amino acids, vitamins, polysaccharides, and organic acids
3. More effi cient application of enzymes as biocatalysts in the production of
dairy products, fruit products, vegetable products, fermented beverages,
and starch products
4. Production of microbiological preparations (inhibitors, stabilizers) for food
preservation
5. Production of valuable fodder supplements (protein, vitamin and antibiotic
preparations, growth stimulators) and vegetable ensilage, plant protection
products (bioinsecticides, biopesticides, antibiotics), and animal protection
remedies (antibiotics, vaccines)
6. Development of modern methods for growing of tissues and cells in vitro 7. Development of techniques for microbiological biosynthesis of natural
microorganism metabolites (antibiotics, vitamins, enzymes, enzyme inhibi-
tors, organic acids, alkaloids, hormones, antigens) as well as microbiological
52527_C011.indd 32852527_C011.indd 328 10/3/2008 4:09:38 PM10/3/2008 4:09:38 PM
© 2009 by Taylor & Francis Group, LLC

Drying of Microorganisms for Food Applications 329
and enzymatic biotransformation in the production of a large group of drugs,
amino acids, and vitamins
8. Development and improvement of cultivation techniques for microorgan-
isms and animal cells to produce vaccines and antibodies
In these applications of microorganisms, there are different requirements related
to the form, physical and biochemical properties, and microbiological activity of
individual biomaterials. These requirements should be related to the specifi c proper-
ties of microorganisms such as sensitivity to temperature and dryness or fermenta-
tion conditions. As a result of these conditions, preservation or drying of
microbiological substances can be considered with respect to three types of actions
for three groups of preserved products:
1. Pure culture microorganisms that produce starters (bacteria, yeast) that have
to be preserved for long-term storage of a specifi c type and strain (stored
material) kept in the pure culture collections: The processes of fermentation
and preservation most often refer to small production on a laboratory scale.
2. Microorganisms and fermentation products that can be preserved to maintain
their microbiological activity and biological structure for future application
in a variety of biotechnological processes at industrial scale: Examples are
the active yeast that promotes fermentation in bread baking and beverage
production, active bacteria and enzymes needed in milk processing and pro-
duction of dairy products and processing of fruits and vegetables, and pro-
duction of pesticides for agriculture and biopreparations for environmental
protection such as those used in wastewater treatment plants.
3. Microorganisms and fermentation products that can be devoid of the
properties of a live microorganism but with their chemical and biochemical
composition intact: Examples are production of SCPs as a source of protein
with high nutritive value or inactive yeast with high protein content used as
fodder yeast.
Drying of biomaterials from the third group proceeds according to general rules
and parameters applied in the drying of typical food products (Mujumdar, 2004).
Thus, the process is carried out in such a way that the nutritive values of a dried
product are preserved and will not degrade during storage or rehydration. This means
that the most valuable nutrients, proteins, vitamins, fats, enzymes, and aromas will
be kept in an unchanged biochemical form and the product’s physical form after
rehydration will be maintained to be suitable for future applications (no structural
changes including excessive and irreversible shrinkage, caramelization or crystalli-
zation, and unintended change of color). These topics are discussed in detail
elsewhere in this book and hence are only mentioned in this chapter.
With advances in biotechnology, progressive growth of bioproduction, and esca-
lating use of microorganisms, the preservation of properties required for long-term
storage and transportation is a subject of both research and publications in which a
variety of the process and equipment issues are comprehensively discussed. Worth
mentioning are the monographs by Tutova and Kuts (1987) and Kudra and Strumillo
52527_C011.indd 32952527_C011.indd 329 10/3/2008 4:09:38 PM10/3/2008 4:09:38 PM
© 2009 by Taylor & Francis Group, LLC

330 Advances in Food Dehydration
(1998), some chapters in Mujumdar’s work (2007), and review articles by Morgan et
al. (2006) and Santivarangkna et al. (2007).
The broad spectrum of biotechnological products indicates that it is possible to
use various drying and dewatering methods. However, because of thermo- and xero-
lability and the risk of many qualitative changes in these products, some process
conditions should be strictly monitored. For example, the temperature and moisture
content of a product should be controlled, rapid changes of pressure should be
eliminated, and mechanical interactions should be avoided because they may damage
cells of microorganisms. In addition, many processes must be carried out under
sterile conditions using sterile drying agents. In general, the following solutions can
be recommended, which consider the properties of biotechnological products:
Processing at mild conditions•
Vacuum or freeze-drying•
Application of multistage systems•
Special techniques based on the decrease of the initial material moisture •
content
The phase diagram of thermodynamic water equilibrium in temperature–
pressure coordinates is very helpful in the initial selection of drying methods and
operating parameters (Figure 11.9). In particular, the equilibrium of the ice–water
Triple point(0.0099°C, 610.4 Pa)
107
106
105
104
103
102
101
100
10–1
Wat
er v
apor
pre
ssur
e (P
a)
0–50–100 100
Temperature (°C)
50 150 200 250
101.33 kPa
Solid(Ice)
Liquid(Water)
Gas(Vapor)
Freezing Melting
Sublimation
Condensation
Freeze drying
Condensation
Evaporation
Vacuum drying
Evaporation atatmospheric pressure
spray dryingfluidized bed
FIGURE 11.9 Phase diagram of water in relation to the important drying processes.
52527_C011.indd 33052527_C011.indd 330 10/3/2008 4:09:38 PM10/3/2008 4:09:38 PM
© 2009 by Taylor & Francis Group, LLC

Drying of Microorganisms for Food Applications 331
vapor system is one of the important elements in the proper selection of parameters
that are required in vacuum and freeze-drying processes.
11.5 DRYING OF STARTER CULTURES
Before the advent of concentrated starter cultures, commercial starter cultures were
initially supplied in a liquid form. For many reasons, such as the advancement and
development of biotechnological and engineering processes, better equipment and
control, and an increasing quantitative demand for starter cultures, the liquid form
has been replaced by a much better solid form. Hence, in a growing number of bio-
technological processes it is absolutely necessary to preserve high microbiological
quality microorganisms (their original physiological activity) in the fi rst group,
which is pure culture microorganisms (producing starters) during long-term storage.
However, it is diffi cult to select the optimum preservation method on the basis of
experimental data presented in numerous publications. Therefore, each problem
calls for individual consideration that may be guided by some general rules that
allow the technologies of preservation to be divided into two groups:
1. Dry preservation or storage methods, which are applied to products that are
freeze-dried, dried on solid substrates, dried in gel disks, and so forth
2. Wet conservation under slow transfer processes (in distilled water, under a
cover of mineral oil, in a protective medium at freezing temperature, etc.)
The fi rst group of dry preservation methods will be characterized in more detail,
in accordance with the profi le of this book.
In storage of freeze-dried cultures, microbial suspension in a protective medium
is placed in ampoules, frozen, and vacuum dried with a continuous supply of external
energy. After completing the process, the ampoules are sealed under vacuum and
stored. A proper protective medium and freeze-drying parameters are very important.
The advantages of the method are infections and wetting of the culture during storage
are eliminated, a high concentration of inoculant is produced, and small samples
reduce storage space. The disadvantages are costly and complex equipment, high
energy consumption, and a diffi cult choice of optimum dehydration conditions.
Freeze-drying is the preferred method for culture collections worldwide, including the
American Type Culture Collection and the National Collection of Type Cultures.
In storage on solid carriers, the culture is stored directly in a carrier–fi ller that
is also a sorbent, protective medium, and in some cases a substrate; organic and
inorganic substances (grain, sand, etc.) are used as carriers. Simple sample prepara-
tion, application of different (inexpensive) drying methods, and multiple controls are
the advantages of this method. The risk of sample infection during preservation and
storage and unrepeatable properties of the carriers–fi llers are its disadvantages.
Storage in liquid nitrogen is utilized in freeze-drying. During freezing at �196°C,
the microbial cultures are transferred to the cryobiosis state. This method is recom-
mended for storage of cultures that die during freeze-drying because it offers a high
degree of cell viability, no degeneration even during long-term storage, and the pro-
duction of homogeneous material for further investigations and applications.
52527_C011.indd 33152527_C011.indd 331 10/3/2008 4:09:38 PM10/3/2008 4:09:38 PM
© 2009 by Taylor & Francis Group, LLC

332 Advances in Food Dehydration
Miyamoto-Shinohara et al. (2006) analyzed the survival of various freeze-dried
species of microorganisms deposited in the International Patent Organism Depository
and stored for up to 20 years. The goals of these studies were (1) to determine the
variation of the survival rates for six groups of microbes by periodic testing for up to
20 years [(a) yeast, (b)–(d) Gram-negative bacteria, and (e)–(f) Gram-positive bacte-
ria, see Table 11.4] and the number of strains (from 5 to 144 strains, see Table 11.4),
(2) to plot the survival curves for microorganisms stored in ampoules, and (3) to
compare the survival patterns of the different species. Strains of the same species
were treated as one group, and the survival rates of the same group in the same year
were expressed as mean values with standard deviations. The log survival rates from
1 to 20 years (Y1–Y20) were satisfactorily fi tted to a linear function by the least squares
method:
log10 Y � A � BX (11.4)
where Y is the survival rate, X is the number of years of storage, A is the intercept on
the y axis, and B is the slope of the line relating the log survival to storage time.
The results of tests and calculated coeffi cients A and B for each species are listed
in Table 11.4, and the survival curves plotted against the storage time are provided in
Figure 11.10. Each species showed a slightly different survival curve, depending to
some extent on the kind of microorganisms. For example, S. cerevisiae showed only
YD of 8% survival just after the freeze-drying process. The B value of –0.01 indicates
that 97.7% of the living cells after freeze-drying will survive the fi rst year of storage
TABLE 11.4Coeffi cients of Fitted Survival Eq. (11.4) for Six Species after Freeze-Drying
Genus and Species Year YD Y1 A B n
(a) Saccharomyces cerevisiae
20 8.0 ± 10.2 (102) 6.7 ± 10.4 (87) 0.8 ± 0.0 �0.010 ± 0.004 9
(b) Escherichia coli 20 42.6 ± 23.9 (144) 29.1 ± 24.2 (130) 1.4 ± 0.0 �0.041 ± 0.005 9
(c) Pseudomonas putida
20 33.5 ± 26.5 (45) 17.4 ± 18.6 (40) 1.1 ± 0.1 �0.058 ± 0.011 8
(d) Enterobacter cloacae
15 50.8 ± 30.2 (11) 26.1 ± 26.0 (11) 1.4 ± 0.2 �0.073 ± 0.027 5
(e) Lactobacillus acidophilus
15 62.5 ± 24.5 (8) 36.5 ± 22.5 (8) 1.7 ± 0.1 �0.018 ± 0.009 5
(f) Enterococcus faecium
16 85.2 ± 4.8 (5) 86.8 ± 5.3 (4) 2.0 ± 0.1 �0.016 ± 0.007 6
Year indicates storage years; YD is the percentage survival rate several days after freeze-drying and Y1 is
the rate after 1 year with the number of strains examined in parentheses; A is the y intercept and B is the
slope of the survival equation log10Y � A � BX, where Y is the survival rate and X is the year; and n is the
number of data points.
Source: Miyamoto-Shinohara, Y. et al., Cryobiology, 52, 27�32, 2006. With permission.
52527_C011.indd 33252527_C011.indd 332 10/3/2008 4:09:38 PM10/3/2008 4:09:38 PM
© 2009 by Taylor & Francis Group, LLC

Drying of Microorganisms for Food Applications 333
(10�0.01X × 100% � 10�0.01 × 100% � 97.7%), and the same percentage of living cells
from the previous year will survive each consecutive year. In the case of L. acidophi-lus (the Gram-positive bacteria), the survival just after freeze-drying (YD) was at
62.5% and B at –0.018, which means that 96.0% of the cells that survived freeze-
drying will survive each year of storage (10�0.018X × 100% � 10�0.018 × 100% �
96.0%). The difference in survival curves should refl ect structural differences in the
cell wall and cell membrane of the microorganisms. The authors (after Antheunisse,
1973; Rudge, 1991) noticed that freeze-drying is not applicable to such microorgan-
isms as Clostridium species, Helicobacter pylori, and Microcyclus strains. Finally,
Miyamoto-Shinohara et al. (2006) compared their results with other published data
for different drying conditions and postulated that the survival during storage is
FIGURE 11.10 Survival curves of six species. (��) Mean values and (��) standard devia-
tions of the survival rate at each year. Open symbols show the survival rate before freeze-
drying (100%) and several days after freeze-drying (YD), and closed symbols show the survival
rate after more than 1 year. Only the upper bars of the standard deviations are shown. See
Table 11.4 for the equation log10 Y � A � BX. Each graph includes an enlarged graph for the
fi rst year after freeze-drying. (From Miyamoto-Shinohara, Y. et al., Cryobiology, 52, 27–32,
2006. With permission.)
(d)
Log10Y = 1.7 – 0.018X
(e) (f)
(c)
0 1 0 1
2
1
Log10Y = 1.4 – 0.041X
(b)
0 1
2
1
0
1
2
–1
–2
Log10Y = 0.8 – 0.010X
(a)
Saccharomyces cerevisiae Escherichia coli
2
1
0 1 0 1
2
1
0 1
2
1
2
1
Log10Y = 1.1 – 0.058X
Pseudomonas putida
0
1
2
–1
–20 5 1510 20 0 5 1510 20 0 5 1510 20
Log10Y = 1.4 – 0.073X
Enterobacter cloacae Lactobacillus acidophilus
Log10Y = 2.0 – 0.016X
Enterococcus faecium
Year
Log 1
0Y (
% s
urvi
val r
ate)
52527_C011.indd 33352527_C011.indd 333 10/3/2008 4:09:38 PM10/3/2008 4:09:38 PM
© 2009 by Taylor & Francis Group, LLC

334 Advances in Food Dehydration
strongly infl uenced by the degree of vacuum under which the ampoules were sealed.
Thus, the excellent survival after the freeze-drying process might be attributed to
perfect sealing under a vacuum.
Santivarangkna et al. (2007) presented a detailed survey of 115 publications on
industrial drying methods for preservation of lactic acid starter cultures. Among the
group of bacterial starter cultures, lactic acid starter culture is the most important,
and only a few non-lactic acid starter cultures are commercially available. For
instance, the dairy industry currently uses U.S. $250 million/year of commercial
starter cultures. Although freeze-drying is the best and frequently the only method
for preservation of starter cultures, the high costs (Table 11.5) drive fundamental and
applied research toward new, less expensive techniques. These methods are tested
and recommended as suitable even if they sometimes refer to a limited group of
microorganisms and biotechnological processes.
Santivarangkna and colleagues (2007) concentrated their survey on the publica-
tions that described drying methods other than freeze-drying. In a typical freeze-
drying process, cells are initially frozen at –196°C and then dried by sublimation
under high vacuum. The inactivation of the cells is mostly attendant on the freezing
step, and 60 to 70% of cells that survived the freezing step live through the dehydra-
tion step. In contrast to such a very low temperature, the alternative drying processes
are divided into two major groups related to the drying temperature: those carried
out at a high temperature such as spray drying and those at intermediate tempera-
tures such as fl uidized bed drying and vacuum drying. The well-known and histori-
cally used spray drying method, with its numerous advantages and disadvantages, is
also very useful for the drying of a large amount of starter cultures. The risk of
inactivation and dying of microbial cells appears at subsequent stages of the process.
This risk is more severe when the raw biomass of starter cells is more concentrated.
At the stage of spraying with an atomizer or rotating disk, the cells are already
affected by signifi cant, often destroying mechanical forces. In the next stage, the
microorganism cells are under the combined infl uence of two parameters: high air
temperature and exposure time to it. At the beginning of drying, the higher tempera-
ture is not directly correlated to the inactivation and has only a slight effect, because
TABLE 11.5Costs of Drying Processes Referenced to That of Freeze-Drying
Drying Process Fixed Costs (%) Manufac. Costs (%)
Freeze-drying 100.0 100.0
Vacuum drying 52.2 51.6
Spray drying 12.0 20.0
Drum drying 9.3 24.1
Fluidized bed drying 8.8 17.9
Air drying 5.3 17.9
Source: Santivarangkna, Ch. et al., Biotechnol. Prog., 23, 302–315, 2007. With permission.
52527_C011.indd 33452527_C011.indd 334 10/3/2008 4:09:38 PM10/3/2008 4:09:38 PM
© 2009 by Taylor & Francis Group, LLC

Drying of Microorganisms for Food Applications 335
the temperature of spray dried particles and thermal inactivation are limited to the
wet bulb temperature by the evaporative cooling effect. Finally, the optimum
residence time in the dryer is the time for completion of desired moisture removal
with a minimum increase in temperature of the dried products. The technological
system can be easily kept in aseptic conditions. After leaving the dryer the product
is packed and stored in conditions that meet all hygienic requirements.
Another analyzed method for drying of starter cultures (fl uidized bed) has a
drying time that is longer than that of spray drying (from 1 min to 2 h), but thermal
inactivation can be minimized and easily controlled by using relatively low air
temperatures. As reported by Santivarangkna et al. (2007), only a few studies have
been made on lactic acid starter cultures; more publications refer to studies and
applications of this method in the production of commercial dry yeast. A limitation
is that only big particles can form a fl uid bed, so the biomass can be dried in the
agglomerated and granulated forms only. Therefore, the cells must be granulated,
entrapped, or encapsulated in support materials such as skim milk, casein, and so
forth. Obviously, in this case not only pure culture starter cells but also the support
materials are components in the inoculum, together with the cells. Such materials
should fi t the foods to be fermented, for example, alginate or skim milk for fermented
milk, maltodextrin for fermented sausages, and starch or fl our for sourdough bread.
A disadvantage of this method is reduced viability of cells caused by osmotic shock
after mixing of the biomass with extremely desiccated support material characterized
by very low water activity. Moreover, the risk exists for easier contamination of the
biomass because of contact with the support materials or problems with the preserva-
tion of aseptic conditions during additional operations, such as mixing, granulation,
and transport of raw materials.
Vacuum drying is recognized as a process suitable for heat-sensitive materials,
despite much longer drying times (range � 20 to �100 h) compared to spray or
fl uidized bed drying. However, this disadvantage can be overcome by the use of a
continuous vacuum dryer, which is able to dehydrate the material to 1% moisture
(wet basis) at 40°C within 5 to 10 min (Hayashi et al., 1983). Because the dryer
operates under vacuum, moisture can be removed from materials at low temperature,
because the boiling point of water drops from 100°C at 0.1 MPa to 7°C at 1 kPa.
In addition, the oxidation reactions during drying can be minimized for oxygen-
sensitive lactic acid bacteria. King and Su (1993) studied freeze-, vacuum, and low-
temperature vacuum drying of lactic acid starter cultures (L. acidophilus) and found
comparable viability rates of 52.8 to 77.5% for freeze-drying and 50.0 to 74.6% for
low-temperature vacuum drying, in contrast to 15.4 to 30.4% for vacuum drying.
More details regarding King and Su’s (1993) studies are presented in the preserva-
tion of probiotic bacteria discussion later in the chapter.
Following technological progress and commercial requests, there is growing
interest in preserving the biomass of starter cultures using mixed drying systems to
combine spray and fl uidized bed drying, spray and vacuum drying, fl uidized bed
drying, and freeze-drying (“atmospheric pressure freeze-drying”). Using these two-
stage drying methods, it is possible to optimally control the parameters of each stage,
such as the temperature, moisture content, and residence time of a dried material. As
a result, a product of the best possible biochemical properties is obtained.
52527_C011.indd 33552527_C011.indd 335 10/3/2008 4:09:38 PM10/3/2008 4:09:38 PM
© 2009 by Taylor & Francis Group, LLC

336 Advances in Food Dehydration
11.6 CONVENTIONAL AND ADVANCED METHODS IN DRYING AND PRESERVATION OF MICROORGANISMS
Drying and preservation of microorganisms (biomass) from the second group of bio-
materials, which are aimed at preserving their microbiological activity and biologi-
cal structure, are successfully carried out using the described methods. These
methods are applied for starter cultures, although a higher process yield and bigger
scale are needed for the equipment, which often induces additional problems related
to process control. Despite the large dimensions of the spray dryers and ancillary
equipment, spray drying is a predominant method in many food technologies (milk
and whey in the dairy industry, bacteria, yeast, enzymes), particularly when high
process effi ciency is required at relatively low costs. In such a case, a liquid feed is
atomized at high velocity in the chamber where it contacts hot air (200 to 220°C), so
the droplets are dried into powder before they hit the side wall of the dryer chamber.
The outlet temperature is close to the temperature of a product leaving the dryer and
depends on the product dryness and material residence time. The inlet and outlet
temperatures should be lower than that permissible for a microbiological material
being dried. High survival rates can be obtained when the temperature is lower than
normal, which is ~150°C at the inlet and ~75°C at the outlet from the dryer. However,
the drying effi ciency is much lower (about 50%) than that specifi ed as a standard for
the drying equipment (Adamiec and Strumillo, 1998).
The interesting option of not utilizing the full capacity of a given drying technol-
ogy is now the acceptable practice, provided that several complementary drying
methods are exploited in an entire process. Chávez and Ledeboer (2007) proposed
low-temperature spray drying in the presence of protecting carrier materials in order
to enhance the survival of probiotics during drying and storage at 30°C. The Food
and Agriculture Organization of the United Nations and World Health Organisation
defi ne probiotic bacteria as “live microorganisms which, when administered in ade-
quate numbers, confer a health benefi t on the host.” For instance, some probiotic
bacteria are Lactobacillus and Bifi dobacterium species. For many reasons, mainly
referring to health issues, probiotics enhance the population of benefi cial bacteria in
the human gut, suppress pathogens, build up resistance against intestinal diseases,
and reduce intestinal side effects associated with antibiotics. In some cases these
bacteria lessen lactose intolerance and food allergies. There has been increasing
interest recently in food products containing probiotics (not only as fermented milk
drinks), which are dried foods with a long-term ambient shelf-live (Gardiner et al.,
2000). Probiotics are sensitive to heat, so freeze-drying is the best technology to pre-
serve viability, although spray drying is four- to sevenfold cheaper (Horaczek and
Viernstein, 2004). Thus, spray drying must be mild enough to avoid deterioration but
suffi ciently effi cient to yield a powder with moisture content below 4%, which is
required for storage stability (Ananta et al., 2004).
It is noteworthy that there is continuous interest in the use of both methods for
drying of probiotic bacteria. These studies focus on identifi cation of the best carriers
(protective environment) and on establishing a drying strategy (usually by applying
variable process conditions) that will offer the highest survival and the longest stor-
age time. A broader overview of these studies is out of the scope of this chapter, but
52527_C011.indd 33652527_C011.indd 336 10/3/2008 4:09:39 PM10/3/2008 4:09:39 PM
© 2009 by Taylor & Francis Group, LLC

Drying of Microorganisms for Food Applications 337
relevant information can be gotten from Bâadi et al. (2000), Fu et al. (1995), Johnson
and Etzel (1994), Lian et al. (2002), Rodriguez-Huezo et al. (2007), Teixeira et al.
(1995), Wang et al. (2004), and Zamora et al. (2006).
Chávez and Ledeboer (2007) analyzed publications from 2001 to 2005 and two
articles published in 1993 and 1995 that deal with spray drying of probiotic bacteria
(lactobacilli) in the presence of various carriers, such as proteins, polysaccharides,
sugars, gum arabic, maltodextrin, gelatin, starch, lactose, sucrose, trehalose, skim milk
powder, and soy milk. They concluded that industrial drying of probiotic foods is still
a challenging task to be overcome. The percentage of survival ranged from an accept-
able value of ~40% at 25°C after 4 months to the unsatisfactory values, when the mor-
tality was considerable, of 2 to 3 logs in only 5 days. Because one of the important
factors that affected the survival of these bacteria is the drying temperature (mortality
of bacteria starts to occur during drying and continues during storage), they tested a
two-stage drying process consisting of spray drying followed by vacuum drying. The
test probiotic was a culture of Bifi dobacterium lactis BB12 that, after appropriate
inoculation and separation, was added to a carrier solution immediately before spray
drying. The aqueous feed contained 20% (w/w) of various dissolved compounds in
addition to the skim milk powder or soy protein isolate to which carbohydrates (gum
arabic, maltodextrin or trehalose, lactose, sucrose) were added at a 1:1 ratio. A pilot-
scale spray dryer was operated at 80 and 48°C at the dryer inlet and outlet, respectively.
Then, the second drying step was performed in a vacuum oven at 45°C under a reduced
pressure of 10 mbar over 24h. The bacterial stability and survival in the powder were
determined under different conditions (but all at 30°C); the samples were sealed in alu-
minum bags under vacuum, as well as with no vacuum but under different, controlled
relative humidity or in an anaerobic jar (with wet oxygen scavenger). Figure 11.11
FIGURE 11.11 Survival of bifi dobacteria after drying and after 1 and 2 months storage at
30°C (soy protein isolate � maltodextrin DE 20). (From Chávez, B.E. and Ledeboer, A.M.,
Int. J. Dry. Technol., 25, 1193–1201, 2007. With permission.)
20
40
60
80 After drying
1 Month storage at 30°C2 Month storage at 30°C
79
29
4.9
44
23
0.005
105.1
% S
urvi
val
Spraydrying
(Low-temp.)
Freezedrying
Spray drying +vacuum drying
52527_C011.indd 33752527_C011.indd 337 10/3/2008 4:09:39 PM10/3/2008 4:09:39 PM
© 2009 by Taylor & Francis Group, LLC

338 Advances in Food Dehydration
FIGURE 11.12 Temperature variation in controlled low-temperature vacuum dehydration
operation of concentrated Lactobacillus acidophilus cell suspension. (From King, B.A.E.
and Su, J.T., Process Biochem., 28, 47–52, 1993. With permission.)
Tem
pera
ture
(°C
)
–5
5
15
25
35
0 40 80 120 160 200 240
Time (min)
compares the bacteria survival for various drying methods. Clearly, two-step drying
(spray drying � vacuum drying) under mild conditions is a realistic alternative to
freeze-drying when producing food powders containing viable probiotics. Vacuum dry-
ing as the second drying step is needed to bring the moisture content and water activity
below 5% and 0.25, respectively, which are safe for long-term storage. Furthermore,
such a two-step process is estimated to be threefold cheaper than freeze-drying.
King and Su (1993) studied dehydration of probiotic bacteria L. acidophilus in
aqueous suspension of the described carriers as well as CaCO3 (1 g/l) using freeze-
drying, vacuum drying, and controlled low-temperature vacuum drying. Aside from
the positive results described previously, we provide more details regarding vacuum
drying at controlled low temperature. The temperature passing the zone of maximum
ice crystal formation in tested suspensions was monitored at the beginning using an
automatic time–temperature recorder, and the results were between �2 and �3°C.
This was applied as the standard for temperature control in ongoing drying experi-
ments. During dehydration the temperature of concentrated cell suspensions was
controlled within �2 and �2°C by the combination of shelf heating and vacuum
adjustment. A typical run of the material temperature is shown in Figure 11.12.
Because of the diffi culty of water removal in the falling rate drying period that is due
to shrinkage and case hardening, the temperature of the sample rose rapidly to 30°C
before a fi nal moisture content of 5% was achieved. This temperature rise (thermal
shock) affected the survival of bacteria in the dry product. Note that the controlled
low-temperature vacuum drying took only 4 h compared to 24 h for freeze-drying.
Ahmad et al. (2007) studied microwave-assisted vacuum drying of probiotic
microorganisms (L. salivarius and L. brevis) and food yeasts (S. cerevisiae) as a
drying method competitive to freeze-drying. This hybrid technology, called “ traveling
radiant energy under vacuum” (t-REV), is a rapid and effi cient drying method that
52527_C011.indd 33852527_C011.indd 338 10/3/2008 4:09:39 PM10/3/2008 4:09:39 PM
© 2009 by Taylor & Francis Group, LLC

Drying of Microorganisms for Food Applications 339
yields products with unique characteristics while retaining biological functions
(Durance et al., 2007; Kudra and Mujumdar, 2001; Schiffmann, 2007). Although
microwaves provide volumetric heating, the vacuum not only reduces the boiling
point to maintain a low material temperature but also creates a water vapor pressure
gradient so the drying rate is increased. As a result, the microbiological material is
dried in a shorter time and at a lower temperature compared to other methods. For
instance, Ahmad et al. (2007) monitored the material temperature every minute
during t-REV drying of L. salivarius 417 using an infrared temperature sensor. They
found that down to the fi nal moisture content equivalent to 0.35 ± 0.05 water activity,
the maximum temperature was 37°C at an absolute pressure of 30 torr and 24°C at an
absolute pressure of 10 torr. Both temperatures were in the optimum range for bacte-
rial growth. Although the viability of microorganisms dehydrated by the t-REV
method was equal or superior to that by freeze-drying, the advantages of t-REV are a
much shorter drying time (20 to 25 min compared to 72 h) and lower energy
consumption. Similar results were reported by Kim et al. (1997), who studied the
preservation of bacterial cultures in vacuum–microwave (VM) dried yogurt and found
much higher values of survival than in spray drying or freeze-drying.
However, nonconventional energy sources such as infrared, radiofrequency, and
microwave irradiation can alter the physiology of the living cells in a different way
and to a different extent. Yaghmaee and Durance (2005) studied the effect of 2450-
MHz microwave irradiation under vacuum (at microwave power settings of 711 ± 20
and 510 ± 5 W) on the survival and injury of E. coli. The vacuum was used to control
the boiling point of water and to maintain the temperature in the bacterial suspension
at the specifi ed levels from 49 to 64°C. An analysis of the results showed that the
microwave power from 510 to 711 W did not affect the thermal sensitivity of E. coli in
this temperature range, but microbes were more sensitive to temperature changes
during VM treatment than in the control treatment under a vacuum without microwave
heating. For temperatures over 53°C in VM at 711 W and temperatures over 56°C in
VM at 510 W, microbial destruction was faster than in the control treatment.
Linders et al. (1996) investigated the infl uence of the drying rate at low and mild
temperatures on inactivation due to dehydration (with negligible thermal inactiva-
tion) of L. plantarum. Spray drying was used as a fast drying method because the
estimated residence time of spray droplets in the laboratory minispray dryer was
0.45 s. The inlet and outlet drying air temperatures varied from 60 to 80°C and 42 to
53°C, respectively. Such slow drying was performed in a glass vacuum desiccator at
4 and 30°C. Linders and colleagues sought to verify their hypothesis that during dry-
ing at low temperature, when thermal inactivation of the cells can be neglected, the
microorganisms adapt physiologically to ambient conditions (temperature and
humidity) and maintain high activity after dehydration. They concluded that the
residence time in this spray dryer was too short whereas the temperature of 4°C in a
vacuum desiccator was too low for such an adaptation. The hypothesis on the
preservation of the cell activity via such an adaptation was confi rmed by vacuum
dehydration at 30°C under high water activity.
An interesting option to alleviate the thermal effect on living microorganisms is
heat pump drying (Alves-Filho et al., 1998). Experiments were carried out in a fl uid-
ized bed of inert particles in the heat pump dryer. The bacterial suspension
52527_C011.indd 33952527_C011.indd 339 10/3/2008 4:09:39 PM10/3/2008 4:09:39 PM
© 2009 by Taylor & Francis Group, LLC

340 Advances in Food Dehydration
(Streptococcus thermophilus in a potassium phosphate buffer with and without
trehalose protectant) was dried by spraying it over the fl uid bed of 3.5-mm polypro-
pylene beads. The inlet air temperature was kept below 35°C by using a classical heat
pump circuit. The powdery product, which was dried with the addition of 100 mM of
trehalose, showed 86% viability at an inlet air temperature of 10°C. Thus, Alves-
Filho and coworkers concluded that this technique could be competitive to heat pump
assisted freeze-drying in a fl uidized bed that offers 100% viability but when drying
at �20°C for 15 h, �10°C for 2 h, �5°C for 0.5 h, and fi nally 10°C for 0.3 h.
Apart from bacteria, yeasts constitute the second important group of micro-
organisms because of a wide variety of applications to various food product technolo-
gies as well as a considerable yield (productivity) of such processes. The technology
of yeast preservation is one of the drying methods aimed at preservation of the
microbial activity of cells, that is, active dry yeasts (ADY; the second group of drying
technologies), in addition to preservation of high nutrient quality, that is, SCP (a third
group). Note that other microorganisms such as bacteria, algae, and molds also
constitute an important source of protein such as SCP. Nonetheless, yeasts (e.g.,
S. cerevisiae) possess the relatively highest concentration of intracellular proteins
located inside the yeast cell when compared to E. coli or bacillus species, for instance.
Furthermore, a genetically diversifi ed protein structure affects nutrient quality,
availability, and targeted activity. Moreover, proteins from microorganisms utilize
their structure–availability relationship the best. Thus, research seeks to identify
such a recombination of the protein structure that its suitability, both versatile and
oriented, can be exploited in the best way. At present, for instance, only one marketed
therapeutic protein (insulin) is produced from yeast. Detailed information on the
biochemical phenomena related to the structure and activity of fungi and yeast can
be found in the work of Arora (2004) and Ratledge and Kristensen (2006).
Another form of yeast used in the production of food is autolyzed yeast extract.
The substrate for producing yeast extracts is a biomass of brewer’s yeast and
molasses-grown baker’s yeast, S. cerevisiae and Kluyveromyces fragilis grown on
whey, and Candida utilis grown on carbohydrates wastes. Autolysis is an enzymatic
self-digestion of the yeast cell when the yeast cream is heated slowly to 55°C. The
process is slow and the yield depends on the temperature, pH, time, and type of
yeast. Finally, the slurry of biomass is pasteurized at 70°C, which deactivates the
enzymes and kills the vegetative cells of the bacteria. The cell wall residues are
removed by centrifugation and spray dried separately to be utilized as fodder.
The clear liquid is concentrated in a falling fi lm evaporator to approximately 50%
total solids and then spray dried. The obtained powder is hygroscopic, so the use of
dehumidifi ed air for cooling and pneumatic transport is recommended. Spray dried
autolyzed yeast extracts are rich in soluble nitrogen and vitamin B, and they are
used as nutritional supplements in feed and in industrial fermentations. They can
be used as additives in human food products for accentuation of fl avor and for
aroma in soups and meat products.
In practice, yeast in particular are dried in this way as ADY or SCP. That is why
the products dried using the methods suitable for the third group should be consid-
ered. As previously mentioned, the aim of biomaterials drying in the third group of
drying technologies is to obtain products of microbial origin and of high nutrient
52527_C011.indd 34052527_C011.indd 340 10/3/2008 4:09:39 PM10/3/2008 4:09:39 PM
© 2009 by Taylor & Francis Group, LLC

Drying of Microorganisms for Food Applications 341
quality. These are important substances extracted from microorganisms, both from
the widely available ones and those originating from other raw foods. Nevertheless,
other components that rarely occur or are not encountered in other raw materials are
reported as well. At this stage, proteins or, in general, amino acids, vitamins, lipids,
and organic dyestuffs may be considered along with enzymes and antibiotics, which
require the preservation of their biochemical activity. Through disruption (lysis) of
the cell walls (using mechanical or biochemical methods, e.g., enzymatic reactions),
certain components of cells are extracted and then separated, concentrated, and pre-
served using the appropriate methods of drying with the simultaneous preservation
of the parameters attributed to a given group of products such as amino acids, vita-
mins, and so forth. Nonetheless, the profi tability of the industrial production of SCP
is largely dependent on the costs of the raw materials. In addition, the commercially
profi table technologies are based on the use of semifi nished products and waste
materials. Examples are spent sulfi te liquor, methane, carbohydrates, or pentoses
and hexoses in waste liquor–cellulose hydrolysates. Here, the strains of Candida utilis and Candida tropicalis are used as protein (SCP) producers. The appropriate
biotechnological process of biomass SCP production after inoculation can be carried
out continuously for several months.
Yeast is harvested by subsequent centrifugation. The 1% growth suspension is
concentrated to 15 to 22% total solids, but sometimes the yeast cream is concen-
trated up to 27% in falling fi lm evaporators. As a standard, the spray drying method
is applied with inlet and outlet temperatures up to 350 and 100°C, respectively. The
temperature and time conditions during spray drying of yeast are such that the living
cells of yeast and some pathogenic bacteria such as Salmonella are practically killed
(up to 8 log), but the nutrition of the product is saved.
Production of an SCP for human consumption was regarded at the beginning as
a major method of food production, which eliminates seasonal and variable weather
constraints. Along with biotechnology development, because the choice of a micro-
organism can be based on nutritional value and protein content, large-scale produc-
tion could help to alleviate the worldwide nutritional defi ciency problem today. SCP
could be used to supplement natural foods to increase their nutritional value. If it is
to be used for human (and animal) consumption, the infl uence of production tech-
niques or quality factors such as fl avor, color, solubility, digestibility, and viable cell
count deserve attention.
In their pioneering research on the production of dry SCP using S. cerevisiae
baker’s yeasts, Labuza and Santos (1971) analyzed the soluble solids, soluble proteins,
and color score as the indicators of product quality, among others. The products
obtained in a double drum dryer equipped with steam heated rolls and in a laboratory
spray dryer with a centrifugal atomizer were compared. The results demonstrated
the high quality powder after spray drying (vivid color and high protein quality in
dough quality tests) and a high dependence of the powder properties on the operating
parameters after drum drying (considerable change into a brown color just after
75 s of drying, decreasing content of soluble protein with an increase in pressure of
the steam heating drums). Hedenskog and Morgen (1973) examined the production of
dry protein concentrates with a low content of nucleic acid (drum drying and mechan-
ical disintegration of the cell). They found that the nutritive value of the protein
52527_C011.indd 34152527_C011.indd 341 10/3/2008 4:09:39 PM10/3/2008 4:09:39 PM
© 2009 by Taylor & Francis Group, LLC

342 Advances in Food Dehydration
concentrate was higher than that of the starting yeast material. Ameri and Maa
(2006) presented an analysis of the possibilities and advantages of the spray drying
process for biopharmaceuticals, for example, the stability of protein- or peptide-
based drug formulations for different therapeutic applications.
ADYs constitute an indispensable basic microbial factor in a number of relevant
food technologies such as the production of baker’s yeasts (yeasts biomass) and beer,
wine, and alcohol beverages (ethanol production); in baking (CO2 production); and
the production of various ingredients altering the fl avor, smell, or preservation by
producing organic acids, unsaturated fatty acids, and so forth. The most frequently
used strains are S. cerevisiae, Pichia guillermondi, and Kluyveromyces lactis, as
well as yeasts with different morphology and shape (fi lamentous fungi), such as
Aspergillus niger, Agaricus bisporus, and Trichoderma viride. It is noteworthy that
the genetic modifi cations of the yeast cells are frequently applied to the technologies
of enzyme and antibiotics production. Not only do such diverse applications require
defi ned activity of the yeast cell in the inoculum, but they also need an appropriate
physical structure. Then the yeasts’ biomass is preserved using the proper methods
for a given application. Although compressed wet yeasts were widely applied in
many technologies (baking or beer production), the development of ADY has caused
them to be replaced by dry yeasts because dry yeasts are stable for a long time and
can be stored and used thereafter without restricted conditions (refrigeration).
Generally, compressed yeasts are dried from a moisture content of about 70% to
a moisture level of 3 to 8%. Any dry yeast must survive two drastic changes prior to
use by the baker: (1) when drying yeast cells, intracellular water must pass through
the cell membrane and cell wall, so the drying process must not damage the cell
membrane or decrease the intracellular enzymatic activity (Gervais et al., 1999); (2)
before use, water must again pass through the membrane into the cell to activate the
yeast. Poirier et al. (1999) demonstrated the importance of rehydration kinetics on
the viability of S. cerevisiae, specifi cally the importance of slow rehydration kinetics
in the water activity (aw) range from 0.117 to 0.455. Any substantial degree of dam-
age will dramatically reduce the gas (CO2) productivity of the dry yeast, and yeast’s
ability to survive these rigorous conditions will affect its viability as a suitable
replacement for compressed yeast. Since the development of ADY in the late 1930s,
yeast manufacturers have been unable to effectively dry compressed yeast with a
protein content higher than 44% (higher protein yeasts were unable to survive the
rigors of drying). Conventional drying is carried out in band, tray and tunnel, or
drum dryers, although the drying is relatively long at 4 to 12 h. Spray drying is much
faster, but it still exposes the yeast cell to high temperatures with little control (result-
ing in deterioration of the enzymatic activity).
Due to many reasons (e.g., the availability of a research material, wide application
of several different indices to determine the material quality), yeasts still constitute
a relevant research and test material to be used in the assessment of new methods and
drying parameters or in the experimental verifi cation of mathematical modeling and
computer simulation for the design of the preservation process.
There are numerous papers on this subject, but only the key studies will be pre-
sented here. Fluidized bed drying of baker’s yeast is the most frequently investigated
technology because it is easy to form fl uidizable granules from commercial compressed
52527_C011.indd 34252527_C011.indd 342 10/3/2008 4:09:39 PM10/3/2008 4:09:39 PM
© 2009 by Taylor & Francis Group, LLC

Drying of Microorganisms for Food Applications 343
yeast. Bayrock and Ingledew (1997a, 1997b) documented that the kinetics of drying
and cell death depend not only on the origin of the commercial compressed yeast but
also on the quality of the ADY product when dried at 35 to 80°C for up to 400 min.
Oszlanyi (1980) demonstrated the advantages of fl uidized bed drying of compressed
baker’s yeast when mixed before extrusion into 0.4-mm granules with �1% liquid
sorbitan monostearate as an emulsifi er. Because of the precise temperature control of
the yeast cells in the fl uidized bed at a maximum of 40.5°C, an “instant” product was
obtained after 20-min drying. The microbiological activity of the ADY product was
almost the same as compressed yeast (CO2 gasing activity of instant yeast was �87%
of the gas produced by compressed yeast). Taeymans and Thursfi eld (1987) dried
immobilized baker’s yeast (yeast entrapped in a gel matrix) in a fl uidized bed. Alginate
at 2% in the slurry with a 30% mass of yeast and a CaCl2 solution were used to solidify
the slurry drops pumped through the needles. Zimmermann and Bauer (1986, 1990)
studied fl uid bed drying of granulated baker’s yeast and evaluated its activity through
the activity of ADH and glucose-6-dehydrogenase enzymes. The results of these stud-
ies and those of Luyben et al. (1982) were used to formulate a mathematical model
allowing the material temperature, moisture content, and product activity to be deter-
mined as a function of the drying time. Using this model and multiobjective optimiza-
tion, a procedure was developed to design a fl uid bed dryer for granulated baker’s
yeast (Adamiec et al., 2007; Strumillo et al., 1989).
Luna-Solano et al. (2005) presented the optimal process calculations for spray
drying of brewer’s yeast (Saccharomyces sp.) cream with solids content of 14 to 18%
(w/w) in a pilot-scale dryer with a 1.2-m3 chamber at a maximum temperature of
145°C. They established empirical equations for the specifi c total cost, cell viability,
production rate, and product moisture content. Their results were $26.7/kg cost,
10 kg/h productivity, 0.013 kg/kg dry matter product moisture content, and 1 × 10⁶
cfu/g cell viability at an outlet air temperature of 59°C.
Alsina and colleagues (2005) utilized pressed yeast (by-product in the produc-
tion of ethyl alcohol) to study the possibility of obtaining a powdery S. cerevisiae
that could be used as a source of protein (raw protein content of 50%), vitamins, and
fl avoring in animal feed formulas. A relatively novel drying method was employed,
namely, drying on a fl uid bed of inert particles that is similar to the jet spouted bed
(Markowski, 1993). Batches of the wet material (compressed yeast) and some volume
of polyethylene particles (3.26-mm mean volume diameter) in different mass ratios
were fl uidized together and dried in a laboratory fl uid bed dryer. The research was
aimed at determination of the bed hydrodynamics as a function of the wet material/
inert particles ratio, and a mathematical model was developed to determine the dryer
throughput for different operating conditions. Characteristically, stable fl uidization
was obtained for pressed yeast with the same average moisture content as for
commercial pressed yeast, which is on the order of 70% wet basis.
Grabowski et al. (1997) performed an experimental study to obtain high quality
ADY in fl uidized bed and spouted bed dryers. Wet commercial pressed yeast was
extruded through a steel screen with 0.8-, 0.9-, and 1-mm perforations, giving cylin-
drical particle lengths of around 1.5, 2.5, and 3 mm, respectively. Experiments were
carried out in batch laboratory scale dryers. The results from the bed hydrodynamics
and drying kinetics for the same batches of material indicated the need for higher
52527_C011.indd 34352527_C011.indd 343 10/3/2008 4:09:39 PM10/3/2008 4:09:39 PM
© 2009 by Taylor & Francis Group, LLC

344 Advances in Food Dehydration
(by almost 25%) air velocity in a spouted bed during the initial drying phase down to
a yeast moisture content of about 30 to 35% wet basis. However, the drying time to
attain the fi nal moisture content of 6 to 8% wet basis was shorter for the spouted bed,
and this difference was dependent on the temperature. Based on these results, a two-
stage process was arranged in which the spouted bed was turned into a fl uidized bed
when the moisture content of the yeast was reduced to 35% wet basis. This two-stage
drying reduced the energy consumption because of the lower air-fl ow rate and the
viability of the yeast cells was higher (Figure 11.13). With better technology and
development of controlling equipment, old methods such as tunnel, band, and drum
drying can be successfully replaced by spray drying, fl uidized bed, spouted bed, and
vibrofl uidized bed drying.
Enzymes are simple or complex proteins possessing catalytic activity that allows
chemical reactions in a living cell to occur at ambient temperature at a high rate.
Every biotechnological process is based on enzymatic reactions. Enzymes are pro-
duced by plants, animals, and microorganisms as a result of the fermentation pro-
cesses. Single enzymes or systems of enzymes are formed in a cell. The structure of
enzymes is similar to the structure of amino acids and proteins, with the so-called
active center as the central region of the long biopolymer chain that is directly
engaged in a biochemical reaction. Based on the biochemical reaction mechanism, a
large variety of enzymes are commonly categorized into six basic groups: oxyreduc-
tases, transferases, hydrolases, lyases, isomerases, and ligases. The rate of the enzy-
matic reaction is affected by many factors including the duration of the reaction,
temperature, pH, enzyme stability, substrate concentration, and presence of activa-
tors. In addition, enzymes are biological catalysts and their action can be targeted
and controlled, or it can be self-induced in a biomaterial. Drapron (1985) provided
FIGURE 11.13 Viability of ADY at standard moisture content (6 to 8% wet basis). (From
Grabowski, S. et al., Int. J. Dry. Technol., 15, 625–634, 1997. With permission.)
100
90
80
70
60
50
40
Via
bilit
y of
yea
st c
ells
(%
)
30
20
10
040 50
Drying air temperature (°C)
Fluidized bed Spouted bed Spouted and fluidized bed
60
52527_C011.indd 34452527_C011.indd 344 10/3/2008 4:09:39 PM10/3/2008 4:09:39 PM
© 2009 by Taylor & Francis Group, LLC

Drying of Microorganisms for Food Applications 345
numerous examples of enzyme activity as a function of the water activity of a food
material. During storage and transformations of foodstuffs, enzymes continuously
play a leading role, which is positive or negative (e.g., Maillard reactions).
Because enzymes are proteins, their structures change easily under the action of
the mentioned factors, which may reduce even their catalytic ability completely.
Because of enzymatic treatment, the source materials are used economically, the
processes are more effi cient, the product’s quality and durability are improved, and
the reaction rates can easily be controlled. The specifi c advantages of enzymes or
enzymatic preparations have been utilized in many areas of human activity, causing
revolutionary changes in numerous technological processes. Examples of industrial
uses of enzymes are provided in Table 11.6.
Because most enzymes are not stable in solution, drying is often used to improve
the stability during storage. Depending on the enzyme’s characteristics and indus-
trial designation, the dry product should possess certain quality indices, such as high
and stable activity and purity, and other physical features such as solubility and dis-
persability, homogeneity (particle size distribution), bulk density, color, and odor.
Enzymes are thermolabile substances, so they are deactivated because of heat-
induced structural changes. The methods used for heat-sensitive microorganisms are
useful for enzymes as well. Although freeze-drying is usually favored for drying of
TABLE 11.6Major Food Industry Applications of Microbiologically Produced Enzymes
Application Enzyme Microbial Origin
Dairy Protease
Lipase
Lactase
RhizomucorAspergillusKlyveromyces, Aspergillus
Bakery Amylase
Protease
Glucose oxidase
BacillusAspergillus, BacillusAspergillus
Starch industry Amylase
Glucoamylase
Glucose isomerase
BacillusAspergillusBacillus, Streptomyces
Wine and juice Pectinase
Cellulase
Cellobiase
Calf stomach
AspergillusAspergillus, Trichoderma
Brewery �-Clucanase
Acetoacetate decarboxylase
AspergillusAspergillus, Bacillus
Distilling industry Amylase
Glucoamylase
TrametesAspergillus
Animal feed Phytase
Cellulase
AspergillusAspergillus
Source: Adapted from Pilosof, A.M.R. and Sánches, V.E., in Handbook of Industrial Drying, Taylor &
Francis, Boca Raton, FL, 2007, pp. 881–992. With permission.
52527_C011.indd 34552527_C011.indd 345 10/3/2008 4:09:39 PM10/3/2008 4:09:39 PM
© 2009 by Taylor & Francis Group, LLC

346 Advances in Food Dehydration
high-valued and thermally labile enzymes in small quantities (used as analytical
enzymes), spray drying is largely applied in large-scale production of enzymes.
Pilosof and Terebiznik (2000) compared both drying methods based on numer-
ous publications (�100). Some of them are worth mentioning.
1. Yamamoto et al. (1984) studied the kinetics of enzyme inactivation (glu-
cose oxidase, alkaline phosphatase, and alkohol dehydrogenase) during
water evaporation from a single droplet of the solution.
2. Etzel et al. (1996) investigated enzyme inactivation (alkaline phosphatase)
in a spray-dried condensed skim milk.
3. Samborska et al. (2005) looked at the effect of spray-drying conditions on
the activity of a fungal enzyme (a-amylase) dissolved in a maltodextrin.
4. Luyben et al. (1982) used the experimental results on enzyme inactivation
kinetics (alkaline phosphatase, lipase, and catalase) to develop a mathemat-
ical model and to simulate the kinetics of quality changes, including inacti-
vation of enzymes during drying.
When the high throughput of dry enzymes is needed (in food technology, pro-
duction of detergents, and the pulp and paper industry), the enzyme powder is pro-
duced in a two-stage drying process, which comprises a conventional spray dryer as
the fi rst stage and a fl uidized bed dryer as the second stage (Masters, 2002). An
example is when the isolated and concentrated enzymes solution is mixed with heat-
protecting and carrier substances, and the slurry with up to 40% total solids is spray
dried in a conical spray dryer at air inlet temperatures from 170 to 200°C. The
exhaust temperature is kept as low as possible to permit powder to leave the cone at
low temperature and a high moisture content of 10 to 20% wet basis. The still wet
enzyme powder is then dried to about 2% wet basis in an external, continuous, plug-
fl ow fl uid bed with a fl uidizing gas temperature of �90°C. In the last section of the
fl uid bed, the powder can be cooled with dehumidifi ed air.
Enzymes, which are active polymers with no attributes of living microorganisms
but acting as reusable catalysts of biochemical reactions, are frequently preserved by
immobilizing (entrapping, encapsulating) them in carrier materials, which preserve
and stabilize the enzyme’s activity. Note that in living cells most enzymes are bound
to the cell membranes or structural elements of the cells, so they are protected in a
natural way. Immobilized enzymes are much less sensitive to external factors than
free enzymes. For example, immobilization of b-glucosidase on a silty material
increases its thermal resistance by about 100 times. Eduardo et al. (1986) studied the
effect of dehydration on the thermostability of alcohol oxidase (Pichia pastoris) immobilized on diaminoethyl cellulose. The results indicated that dehydration, in
contrast to immobilization by wet adsorption, dramatically improved the thermore-
sistance of the enzyme. For instance, the half-life was increased from �2 min to ~3 h
at 60°C, and 25% of the initial enzymatic activity was still present even after 20 h of
heating at 80°C. Because of immobilization, the enzyme catalytic properties are
often improved, which makes it possible to carry out a wide range of biotechnologi-
cal operations under restricted conditions. For instance, glucose isomerase can be
used continuously for over 1000 h at temperatures from 60 to 65°C. Regarding the
52527_C011.indd 34652527_C011.indd 346 10/3/2008 4:09:39 PM10/3/2008 4:09:39 PM
© 2009 by Taylor & Francis Group, LLC

Drying of Microorganisms for Food Applications 347
mechanisms of immobilization, the typical methods are depicted in Figure 11.14.
These are (a) trapping by semipermeable membranes (encapsulation and microen-
capsulation); (b) and (c) embedding a gel carrier inside the matrix (in natural or
synthetic gels such as agar, alginate, or collagen); and (d) adsorption and adhesion in
the carrier or on its surface because of the ionic strength, hydrogen bonds, and other
weak physical–chemical interactions.
Champagne et al. (1994) conducted an extensive review of immobilized cell
technologies in the dairy industry, where lactic acid bacteria play an essential role in
the processing of milk into fermented products. For instance, when discussing the
process of cheese production, results were quoted on the application of three strains
of mesophilic lactic acid bacteria (Lactococcus lactis ssp. lactis, Lactococcus lactis
ssp. cremoris, and Lactococcus lactis ssp. lactis var. diacetylactis) entrapped sepa-
rately in calcium alginate beads during continuous prefermentation of milk. Very
high productivity was shown for a continuous stirred tank reactor operated at 34°C,
a pH of 6.2 that was controlled by the incoming pasteurized milk, and a population
of 1.5 to 2.0 × 10⁸ cfu/mL in the prefermented milk. Using immobilized cell
technologies, the incubation time required to reach a pH of approximately 4.6 was
reduced by 50% compared with milk inoculated with a freeze-dried starter used in
industrial production. In this application, immobilized cell technology demonstrated
attractive features, including high productivity, better control of the mixed culture
with impact on the quality of the product (i.e., fi nal acidity, texture, and sensory
attributes), and process economics.
There is continuous and growing interest in immobilized enzymes and cells and
a large number of practical applications in various branches of the chemical, pharma-
ceutical, and food industries as well as in medicine, health care, environmental
protection, and the treatment of industrial and municipal wastes. In particular, the
encapsulation technology has recently received a great deal of interest mainly because
of its suitability in the production of drugs and foods with enhanced nutritive proper-
ties. In the food industry this method is most frequently used to protect the active
component from the negative infl uence of the environment (oxygen, light, humidity);
to entrap the fragrance components; to change the physical state from liquid to
powder because the latter is easier to store and handle; and to preserve the activity of
microorganisms, enzymes, vitamins, and other components of interest. The key
(c)(a) (d)(b)
FIGURE 11.14 Examples of methods of production and forms of immobilized biocata-
lysts: (a) encapsulation, (b,c) closing in membrane and gel structures, and (d) physicochemical
bonds of adsorption and adhesion.
52527_C011.indd 34752527_C011.indd 347 10/3/2008 4:09:39 PM10/3/2008 4:09:39 PM
© 2009 by Taylor & Francis Group, LLC

348 Advances in Food Dehydration
publications, in the order of their importance, are those by Adamiec and Kalemba
(2006), Anal and Singh (2007), Bhandari (2004), Han et al. (2007), Patil et al. (2006),
Re (1998), Shahidi and Han (1993), Yoshii et al. (2001), and Yoshii et al. (2006). The
procedure leading to microcapsules (most frequently spherical particles having a
diameter in the range of microns, typically from 30 to 50 μm, with a maximum of 500
to 700 μm) obtained from a multicomponent system starts with the formation of a
suitable emulsion followed by spray drying. The selection of the proper encapsulating
medium along with the method and conditions for optimal drying and process control
allow the production of powdery microcapsules that offer a high-value substrate that
can preserve its properties over long-term storage prior to use or when already
incorporated in the food product. A number of preservation methods via dehydration
that are described in this chapter can be successfully used to preserve the complex
structures of immobilized and microencapsulated products.
11.7 CONCLUSIONS
In summary, a variety of microorganisms can be applied to process raw materials,
intermediate foods, and fi nal foods. These microorganisms differ not only in their
inherent properties but also in the destination of the fi nal product. Thus, the proper
dehydration technique greatly depends on the production rate, the end use of the
product, and its market value (cost of the raw material and price of the product). It is
reasonable to assume that with the progress in drying and dewatering as well as
advanced process control, two-stage or multistage technologies will be favored,
especially for large-scale production. It is quite likely that mild and variable operat-
ing conditions will be used in addition to additives, which will preserve the vital
functions of the product and stabilize it for a long time. Of special interest here is the
rapidly growing technique of microencapsulation, which is one of the immobiliza-
tion methods.
NOMENCLATURE
ADH alcohol dehydrogenase
A intercept on the y axis
ADY active dry yeast
aw water activity
B slope of the line relating log survival to storage time
Ea activation energy for the death of the organism
k reaction rate constant
k0 frequency coeffi cient
Nv number of viable microorganisms per unit volume of medium
R gas constant
SCP single cell protein
t time
t-REV traveling radiant energy under vacuum
T(t) absolute temperature
VM vacuum–microwave
52527_C011.indd 34852527_C011.indd 348 10/3/2008 4:09:39 PM10/3/2008 4:09:39 PM
© 2009 by Taylor & Francis Group, LLC

Drying of Microorganisms for Food Applications 349
X number of years of storage,
Y survival rate
Y1–Y20 log survival rates from 1 to 20 years
REFERENCES
Abadias, M., Benabarre, A., Teixidó, N., Usall, J., and Viñas, I., Effect of freeze drying and
protectants on viability of the biocontrol yeast Candida sake, Int. J. Food Microbiol., 65, 173–182, 2001.
Adamiec, J. and Kalemba, D., Analysis of microencapsulation ability of essential oils during
spray drying, Dry. Technol., 24, 1127–1132, 2006.
Adamiec, J., Kaminski, W., Markowski, A.S., and Strumillo, C., Drying of biotechnological
products, in Handbook of Industrial Drying, 3rd ed., Mujumdar, A.S., Ed., Taylor &
Francis, Boca Raton, FL, 2007, pp. 905–929.
Adamiec, J. and Strumillo, C., Attempts of low-temperature spray drying of mixed population
of lactic acid bacteria and yeast, in Drying ’98, Proceedings of the 11th International Drying Symposium, Vol. C, Akritidis, C.B., Marinos-Kouris, D., and Saravakos, G.D.,
Eds., Ziti Editions, Thessaloniki, Greece, 1998, pp. 1669–1674.
Ahmad, S., Yaghmaee, P., and Durance, T., Survival of probiotic bacteria and food yeast
dehydrated with microwave energy under vacuum, in 41st Annual Microwave Symposium Proceedings, International Microwave Power Institute, Mechanicsville,
VA, 2007, pp. 30–34.
Ainsworth, G.C., Sparrow, F.K., and Sussman, A.S., The Fungi, Vols. 1–4, Academic Press,
New York, 1965–1973.
Alsina, O.L.S., Silva, V.S., Silva, F.L.H., and Rocha, A.P.T., Drying of yeasts in fl uidized
beds: Powder producing kinetics, in Proceedings of the 3rd Inter-American Drying Conference, Orsat, V., Raghavan, G.S.V., and Kudra, T., Eds., Montreal, Canada, 2005,
paper XIV-3.
Alves-Filho, O., Strømmen, I., Aasprong, A., Torsveit, A.K., Boman, H.C., and Hovin, W.,
Heat pump fl uidized bed drying for lactic acid suspensions using inert particles and
freeze drying, in Drying ’98, Proceedings of the 11th International Drying Symposium,
Vol. C, Akritidis, C.B., Marinos-Kouris, D., and Saravakos, G.D., Eds., Ziti Editions,
Thessaloniki, Greece, 1998, pp. 1833–1840.
Ameri, M. and Maa, Y.-F., Spray drying of biopharmaceuticals: Stability and process consid-
erations, Dry. Technol., 24, 763–768, 2006.
Anal, A.K. and Singh, H., Recent advances in microencapsulation of probiotics for industrial
applications and targeted delivery, Trends Food Sci. Technol., 18, 240–251, 2007.
Ananta, E., Birkeland, S.E., Corcoran, B.M., Fitzgerald, G.F., Hinz, S., Klijn, A., Mättö, J.,
Mercernier, A., Nilsson, U., Nyman, M., O’Sullivan, E., Parche, S., Rautonen, N., Ross,
R.P., Saarela, M., Stanton, C., Stahl, U., Suomalainen, T., Vincken, J.-P., Virkajärvi, I.,
Voragen, F., Wesenfeld, J., Wouters, R., and Knorr, D., Processing effects on the nutri-
tional advancement of probiotics and prebiotics, Microb. Ecol. Health Dis., 16, 113–124,
2004.
Antheunisse, J., Viability of lyophilized microorganisms after storage, Anton. Leeuwen., 39,
243–248, 1973.
Arora, D.K., Ed., Handbook of Fungal Biotechnology, 2nd ed., Marcel Dekker, New York,
2004.
Atlas, R.M., Microbiology, Fundamentals and Applications, Macmillan, New York, 1984.
Bâati, L., Fabre-Gea, C., Auriol, D., and Blanc, P.J., Study of the cryotolerance of Lactobacillus acidophilus: effect of culture and freezing conditions on the viability and cellular
protein levels. Int. J. Food Microbiol., 59, 241–247, 2000.
52527_C011.indd 34952527_C011.indd 349 10/3/2008 4:09:39 PM10/3/2008 4:09:39 PM
© 2009 by Taylor & Francis Group, LLC

350 Advances in Food Dehydration
Barnett, J.A., Payne, R.W., and Yarrow, D., Yeasts, Characteristics and Identifi cation, 3rd ed.,
Cambridge University Press, New York, 2000.
Bayrock, D. and Ingledew, W.M., Fluidized bed drying of bakers’s yeast: Moisture levels,
drying rates, and viability changes during drying, Food Res. Int., 30, 407–415,
1997a.
Bayrock, D. and Ingledew, W.M., Mechanism of viability loss during fl uidized bed drying of
baker’s yeast, Food Res. Int., 30, 417–425, 1997b.
Bhandari, B., Spray-drying: An encapsulation technique for food fl avors, in Dehydration of Products of Biological Origin, Mujumdar, A.S., Ed., Science Publishers, Enfi eld, NH,
2004, pp. 513–533.
Bjerketorp, J., Håkansson, S., Belkin, S., and Jansson, J.K., Advances in preservation
methods: Keeping biosensor microorganisms alive and active, Curr. Opin. Biotechnol., 17, 43–49, 2006.
Blanch, H.W. and Clark, D.S., Biochemical Engineering, Marcel Dekker, New York, 1997.
Boumahdi, M., Mary, P., and Hornez, J.-P., Infl uence of growth phases and desiccation on the
degrees of unsaturation of fatty acids and the survival rates of rhizobia, J. Appl. Microbiol., 87, 611–619, 1999.
Champagne, C.P., Lacroix, Ch., and Sodini-Gallot, I., Immobilized cell technologies for the
dairy industry, Crit. Rev. Biotechnol., 14, 109–134, 1994.
Chávez, B.E. and Ledeboer, A.M., Drying of probiotics: Optimization of formulation and
process to enhance storage survival, Dry. Technol., 25, 1193–1201, 2007.
Corcoran, B.M., Ross, R.P., Fitzgerald, G.F., and Stanton, C., Comparative survival of
probiotic lactobacilli spray-dried in the presence of prebiotic substances, J. Appl. Microbiol., 96, 1024–1039, 2004.
Drapron, R., Enzyme activity as a function of water activity, in Properties of Water in Foods,
Simatos, D. and Multon, J.L., Eds., Martinus Nijhoff Publishers, Dordrecht, 1985,
pp. 171–190.
Durance, T., Yaghmaee, P., Ahmad, S., and Zhang, G., Method for dehydrating microor-
ganisms and vaccines, PCT, European Patent Application 05772090.6, 2007.
Eduardo, B.-G., Klibanow, A.M., and Karel, M., Enhanced thermoresistance of enzymes by
drying, in Drying ’86, Proceedings of the 5th International Drying Symposium,
Mujumdar, A.S., Ed., Hemisphere Publishing, Washington, DC, 1986, pp. 428–431.
Etzel, M.R., Suen, S.-Y., Halverson, S.L., and Budijono, S., Enzyme inactivation in a droplet
forming a bubble during drying, J. Food Eng., 27, 17–34, 1996.
Fu, W.-Y., Suen, S.-Y., and Etzel, M.R., Inactivation of Lactococcus lactis ssp. lactis C2
and alkaline phosphatase during spray drying. Int. J. Drying Technol., 13, 1463–1476,
1995.
Gardiner, G.E., O’Sullivan, E., Kelly, J., Auty, M.A., Fitzgerald, G.F., Collins, J.K., Ross,
R.P., and Stanton, C., Comparative survival rates of human-derived probiotics
Lactobacillus paracasei and Lactobacillus salivarius strains during heat treatment and
spray drying, Appl. Environ. Microbiol., 66, 2605–2612, 2000.
Gervais, P., Beney, L., Martinez de Maranon, I., and Marechal, P.A., Could high water fl ow
rate damage the membrane of Saccharomyces cerevisiae? in Water Management in the Design and Distribution of Quality Foods, Roos, Y.H., Leslie, R.B., and Lillford, P.J.,
Eds., Technomic Publishing, Lancaster, PA, 1999, pp. 353–374.
Gould, G.W., Water and the bacterial spore: Resistance, dormancy and germination, in Water Management in the Design and Distribution of Quality Foods, Roos, Y.H., Leslie, R.B.,
and Lillford, P.J., Eds., Technomic Publishing, Lancaster, PA, 1999, pp. 301–323.
Gould, G.W., History of science—Spores, J. Appl. Microbiol., 101, 507–513, 2006.
Grabowski, S., Mujumdar, A.S., Ramaswamy, H.S., and Strumillo, C., Evaluation of fl uidized
versus spouted bed drying of baker’s yeast, Dry. Technol., 15, 625–634, 1997.
Gunsalus, I.C., The Bacteria, Academic Press, Orlando, FL, 1986.
52527_C011.indd 35052527_C011.indd 350 10/3/2008 4:09:39 PM10/3/2008 4:09:39 PM
© 2009 by Taylor & Francis Group, LLC

Drying of Microorganisms for Food Applications 351
Han, D., Yu, C., and Zhou, Y., Microencapsulation of Gram-negative bacteria by spray-
drying, in Proceedings of the 5th Asia–Pacifi c Drying Conference, Chen, G., Ed., The
Hong Kong University of Science and Technology, Hong Kong, 2007, pp. 249–254.
Hayashi, H., Kumuzawa, E., Saeki, Y., and Ishioka, Y., Continuous vacuum dryer for energy
saving, Dry. Technol., 1, 275–284, 1983.
Hedenskog, G. and Morgen, H., Some methods for processing of single cell protein,
Biotechnol. Bioeng., 15, 129–142, 1973.
Hernández, A., Weekers, F., Mena, J., Pimentel, E., Zamora, J., Borroto, C., and Thonart, Ph.,
Culture and spray-drying of Tsukamurella paurometabola C-924: Stability of formu-
lated powders, Biotechnol. Lett., 29, 1723–1728, 2007.
Hocking, A.D., Moulds and yeasts associated with foods of reduced water activity: Ecological
interactions, in Proceedings of the ISOPOW/IUFOST Symposium. Food Preservation by Moisture Control, Seow, C.C., Teng, T.T., and Quah, C.H., Eds., Malaysian Institute
of Food Technology, and Universiti Sains Malaysia, 1988, pp. 57–72.
Horaczek, A. and Viernstein, H., Comparision of three commonly used drying technologies
with respect to activity and longevity of aerial conidia of Beauveria brongniartii and
Metarhizium anisopliae, Biol. Control, 31, 65–71, 2004.
Johnson, J.A.C. and Etzel, M.R., Inactivation of lactic acid bacteria during spray drying.
AICHE Symposium Series, 89, No. 297, 98–106, 1994.
Kaminski, W., Adamiec, J., Grabowski, S., Zbicinski, I., Strumillo, C., and Mujumdar, A.S.,
Application of degradation kinetics to optimization of drying process for yeasts, in
Drying of Solids, Mujumdar, A.S., Ed., International Science Publishers, New York,
1992, pp. 250–266.
Kapsalis, J.G., Infl uences of hysteresis and temperature on moisture sorption isotherms, in
Water Activity: Theory and Applications to Food, Rockland, L.B. and Beuchat, L.R.,
Eds., Marcel Dekker, New York, 1987, pp. 173–213.
Kim, S.S., Shin, S.S., Chang, S.Y., Kim, S.Y., Noh, B.S., and Bhomik, S.R., Survival of lactic
acid bacteria during microwave vacuum drying of plain yoghurt, Lebensm.-Wiss. Technol., 30, 573–577, 1997.
King, V.A.E. and Su, J.T., Dehydration of Lactobacillus acidophilus, Process. Biochem., 28,
47–52, 1993.
Kirst, H.A., Yeh, W.K., and Zmijewski, M.J., Jr., Eds., Enzyme Technologies for Pharmaceutical and Biotechnological Applications, Marcel Dekker, New York, 2001.
Kudra, T. and Mujumdar, A.S., Advanced Drying Technologies, Marcel Dekker, New York,
2001.
Kudra, T. and Strumillo, C., Eds., Thermal Processing of Bio-Materials, Gordon and Breach
Science Publishers, Amsterdam, 1998.
Kuts, P.S. and Tutova, E.G., Fundamentals of drying of microbiological materials, Dry. Technol., 2, 171–201, 1983–1984.
Labuza, T.P. and Santos, D.B., Concentration and drying of yeast for human food: Effect of
evaporation and drying on cell viability and SCP quality, Trans. ASAE, 701–705, 1971.
Laroche, C., Fine, F., and Gervais, P., Water activity affects heat resistance of microorganisms
in food powders, Int. J. Food Microbiol., 97, 307–315, 2005.
Leuschner, R.G.K. and Lillford, P.J., Thermal properties of bacterial spores and biopolymers,
Int. J. Food Microbiol., 80, 131–143, 2003.
Lian, W.-C., Hsiao, H.-C., and Chou, C.-C., Survival of bifi dobacteria after spray drying.
Int. J. Food Microbiol., 74, 79–86, 2002 .
Linders, L.J.M., Meerdink, G., and van’t Riet, K., Infl uence of temperature and drying rate on
the dehydration inactivation of Lactobacillus plantarum, Trans. Inst. Chem. Eng., 74C,
110–114, 1996.
Luna-Solano, G., Salgado-Cervantes, M.A., Rodrigues-Jimenes, G.C., and Garcia-Alvarado,
M.A., Optimization of brewer’s yeast spray drying process, J. Food Eng., 68, 9–18, 2005.
52527_C011.indd 35152527_C011.indd 351 10/3/2008 4:09:39 PM10/3/2008 4:09:39 PM
© 2009 by Taylor & Francis Group, LLC

352 Advances in Food Dehydration
Luyben, K.C.A.M., Liou, J.K., and Bruin, S., Enzyme degradation during drying, Biotechnol. Bioeng., 24, 533–552, 1982.
Markowski, A.S., Quality interaction in a jet spouted bed dryer for bio-products, Dry. Technol., 11, 369–387, 1993.
Masters, K., Spray Drying in Practice, SprayDryConsult International ApS, Charottenlund,
Denmark, 2002.
Miyamoto-Shinohara, Y., Sukenobe, J., Imaizumi, T., and Nakahara, T., Survival curves for
microbial species stored by freeze-drying, Cryobiology, 52, 27–32, 2006.
Morgan, C.A., Herman, N., White, P.A., and Vesey, G., Preservation of microorganisms by
drying: A review, J. Microbiol. Methods, 66, 183–193, 2006.
Mujumdar, A.S., Ed., Dehydration of Products of Biological Origin, Science Publishers,
Enfi eld, NH, 2004.
Mujumdar, A.S., Ed., Handbook of Industrial Drying, 3th ed., Taylor & Francis, Boca Raton,
FL, 2007.
Oszlanyi, A.G., Instant yeast, Bakers Dig., August, 16–19, 1980.
Palaniappan, S., Sastry, S.K., and Richter, E.R., Effect of electroconductive heat treatment
and electrical pretreatment on thermal death kinetics of selected microorganisms,
Biotechnol. Bioeng., 39, 225–232, 1992.
Patil, V.V., Joshi, V.S., and Thorat, B.N., Effect of various drying techniques on survival of
baker’s yeast immobilized in Ca-alginate beads and its applications, in Proceedings of the 15th International Drying Symposium, Farkas, I., Ed., Szent Istvan University
Publisher, Gödöllo� , Hungary, 2006, pp. 1209–1215.
Pilosof, A.M.R. and Sánches, V.E., Drying of enzymes, in Handbook of Industrial Drying,
3rd ed., Mujumdar, A.S., Ed., Taylor & Francis, Boca Raton, FL, 2007, pp. 981– 992.
Pilosof, A.M.R. and Terebiznik, M.R., Spray and freeze drying of enzymes, in Developments in Dring, Drying of Foods and Agro-Products, Vol. I, Mujumdar, A.S. and
Suvachittanont, S., Eds., Kasetsart University Press, Bangkok, Thailand, 2000,
pp. 71–94.
Poirier, I., Maréchal, P.-A., Richard, S., and Gervais, P., Saccharomyces cerevisiae viability
is strongly dependant on rehydration kinetics and the temperature of dried cells,
J. Appl. Microbiol., 86, 87–92, 1999.
Ratledge, C. and Kristiansen, B., Eds., Basic Biotechnology, 3th ed., Cambridge University
Press, Cambridge, U.K., 2006.
Re, M.I., Microencapsulation by spray drying, Dry. Technol., 16, 1195–1236, 1998.
Rockland, L.B. and Beuchat, L.R., Eds., Water Activity: Theory and Applications to Food,
Marcel Dekker, New York, 1987.
Rodriguez-Huezo, M.E., Durán-Lugo, R., Prado-Barragán, L.A., Cruz-Sosa, F., Lobato-
Calleros, C., Alvarez-Ramírez, J., and Vernon-Carter, E.J., Pre-selection of protective
colloids for enhanced viability of Bifi dobacterium bifi dum following spray-drying and
storage, and evaluation of aguamiel as thermoprotective prebiotic. Food Res. Int., 40,
1299–1306, 2007.
Rose, A.H. and Harrison, J.S., Eds., The Yeasts, Vols. 1–4, Academic Press Limited, London,
1987–1991.
Rudge, R.H., Maintenance of bacteria by freeze-drying, in Maintenance of Microorganisms,
2nd ed., Kirsop, B.E. and Doyle, A., Eds., Academic Press, London, 1991, pp. 31–43.
Salminen, S., von Wright, A., and Ouwehand, A., Eds., Lactic Acid Bacteria Microbiological and Functional Aspects, Marcel Dekker, New York, 2004.
Samborska, K., Witrowa-Rajchert, D., and Goncalves, A., Spray-drying of �-amylase—The
effect of process variables on the enzyme inactivation, Dry. Technol., 23, 941–953,
2005.
Santivarangkna, Ch., Kulozik, U., and Foerst, P., Alternative drying processes for the industrial
preservation of lactic acid starter cultures, Biotechnol. Prog., 23, 302–315, 2007.
52527_C011.indd 35252527_C011.indd 352 10/3/2008 4:09:39 PM10/3/2008 4:09:39 PM
© 2009 by Taylor & Francis Group, LLC

Drying of Microorganisms for Food Applications 353
Schiffmann, R.F., Microwave and dielectric drying, in Handbook of Industrial Drying, 3th ed.,
Mujumdar, A.S., Ed., Taylor & Francis, Boca Raton, FL, 2007, pp. 285–305.
Schlegel, H.G., Allgemeine Mikrobiologie, Georg Thieme Verlag, Stuttgart, Germany, 1992.
Shahidi, F. and Han, X., Encapsulation of food ingredients, Crit. Rev. Food Sci. Nutr., 33,
501–547, 1993.
Strumillo, C., Grabowski, S., Kaminski, W., and Zbicinski, I., Simulation of fl uidized bed
drying of biosynthesis products, Chem. Eng. Process., 26, 139–145, 1989.
Taeymans, D. and Thursfi eld, J., Fluidbed-drying of immobilized yeasts, in Drying ’87,
Proceedings of the 5th International Drying Symposium, Mujumdar, A.S., Ed.,
Hemisphere Publishing, Washington, DC, 1987, pp. 160–165.
Teixeira, P.C., Castro, M.H., and Kirby, R.M., Death kinetics of Lactobacillus bulgaricus in
a spray drying process. J. Food Prot., 57, 934–936, 1995.
Tutova, E.G. and Kuts, P.S., Drying of Microbiological Products (in Russian), Agropromizdat,
Moscow, 1987.
Wang, Y.-C., Yu, R.-C., and Chou, C.-C., Viability of lactic acid bacteria and bifi dobacteria
in fermented soymilk after drying, subsequent rehydration and storage. Int. J. Food Microbiol., 93, 209–217, 2004.
Yaghmaee, P. and Durance, T.D., Destruction and injury of Escherichia coli during
microwave heating under vacuum. J. Applied Microbiol., 98, 498–506, 2005.
Yamamoto, S., Agawa, M., Nakano, H., and Sano, Y., Enzyme inactivation during drying of
a single droplet, in Proceedings of the 4th International Drying Symposium, Toei, R.
and Mujumdar, A.S., Eds., Hemisphere Publishing, Washington, DC, 1984,
pp. 328–335.
Yoshii, H., Buche, F., Takeuchi, N., Ohgawara, M., and Furuta, T., Encapsulation of ADH
enzyme in trehalose/protein matrices by spray drying, in Proceedings of the 15th International Drying Symposium, Farkas, I., Ed., Szent Istvan University Publisher,
Gödöllo� , Hungary, 2006, pp. 1139–1142.
Yoshii, H., Shiga, H., Ishikawa, M., Furuta, T., Forssell, P., Poutanen, K., and Linko, P.,
Enzyme encapsulation with crystal transformation of anhydrous trehalose, in
Proceedings of the 1st Nordic Drying Conference, Alves-Filho, O., Eikevik, T.M., and
Strømmen, I., Eds., Trondheim, Norway, 2001, paper 22.
Zamora, L.M., Carretero, C., and Parés, D., Comparative survival rates of lactic acid bacteria
isolated from blood, following spray-drying and freeze-drying. Food Sci. Technol. Int., 12, 77–84, 2006.
Zimmermann, K. and Bauer, W., The infl uence of drying conditions upon reactivation of
baker’s yeast, in Food Engineering and Process Applications. Proceedings of the 4th International Congress on Engineering and Food, Vol. 1, Le Maguer, M. and Jelen, P.,
Eds., Elsevier Applied Science, London, 1986, pp. 425–437.
Zimmermann, K. and Bauer, W., Fluidized bed drying of microorganisms on carrier material,
in Engineering and Food. Preservation Processes and Related Techniques. Proceedings of the 5th International Congress on Engineering and Food, Vol. 2, Spiess, W.E.L. and
Schubert, H., Eds., Elsevier Applied Science, London, 1990, pp. 666–678.
52527_C011.indd 35352527_C011.indd 353 10/3/2008 4:09:39 PM10/3/2008 4:09:39 PM
© 2009 by Taylor & Francis Group, LLC

355
12 Dryer Modeling
Catherine Bonazzi, Bertrand Broyart, and Francis Courtois
CONTENTS
12.1 Introduction ............................................................................................. 356
12.2 Modeling Internal and Interfacial Transfers during Drying ................... 359
12.2.1 Phenomenological and Empirical Drying Models ................... 361
12.2.1.1 Empirical Models .................................................... 362
12.2.1.2 Characteristic Drying Curves (CDC) ...................... 364
12.2.1.3 Neural Networks (NNs) ........................................... 366
12.2.1.4 Compartmental Models ........................................... 367
12.2.2 Drying Models Based on First Principle Equations ................ 367
12.2.2.1 Importance of Description of Product
Internal Physical Structure ...................................... 368
12.2.2.2 Internal Heat and Mass Transfer Mechanisms
in Drying of Food Products ..................................... 368
12.2.2.3 External Heat and Mass Transfer Mechanisms
in Drying of Food Products ..................................... 369
12.2.2.4 Models Neglecting Resistance to
Internal Heat and Mass Transfers ............................ 370
12.2.2.5 Models Using an Apparent
Diffusivity Approach ............................................... 371
12.2.2.6 Fully Mechanistic Models ....................................... 372
12.2.2.7 Modeling of Product Volume Change ..................... 373
12.3 Space and Time Integration of Elementary Drying Models ................... 374
12.3.1 From Thin Layer to Deep Bed ................................................. 375
12.3.2 From Deep Bed to Full Dryer .................................................. 379
12.3.3 Other Approaches .................................................................... 383
12.3.3.1 Use of Computational Fluid Dynamics
(CFD) in Drying Simulation ........................................ 383
12.3.3.2 Simulation of Drum Dryers ..................................... 384
12.4 Important Issues ...................................................................................... 386
12.4.1 Dynamic versus Steady State ................................................... 386
12.4.2 Identifi cation and Validation .................................................... 387
12.5 Applications of Drying Models ............................................................... 389
12.5.1 Coupling with a Quality Model ............................................... 389
12.5.2 On-Line Uses of Dryer Models ................................................ 391
52527_C012.indd 35552527_C012.indd 355 10/3/2008 4:11:15 PM10/3/2008 4:11:15 PM
© 2009 by Taylor & Francis Group, LLC

356 Advances in Food Dehydration
12.6 Conclusion ............................................................................................... 393
Nomenclature ..................................................................................................... 393
Variables ................................................................................................. 393
Greek Letters ........................................................................................... 394
Abbreviations .......................................................................................... 394
References .......................................................................................................... 394
Appendix ............................................................................................................ 398
Web Links to Software Related to Food Dryers ..................................... 398
Web Links to Software Related to the Chemical Industry ..................... 399
12.1 INTRODUCTION
There are many dryer types and subtypes in the food industry around the world.
There is even more diversity in the products to be dried: solids, liquid, gels, and so
forth. The objectives and constraints that apply to drying processes are evolving
more and more toward high expectations. If the main objective 30 years ago was to
achieve a certain degree of dehydration with minimal energy cost, engineers now
design, build, and set the performance of industrial dryers with respect to energy,
product quality, controllability, and much more. Designing, building, tuning, and
controlling industrial dryers clearly becomes more and more complex, requiring
highly skilled engineers with effi cient simulation tools whenever possible.
Chemical engineers can use commercial software such as ASPEN or PROSIM
to help design, set, and optimize their processes. A good question is why food
engineers cannot buy similar software.
Dryers are also used for nonfood products (e.g., chemical, wood, or paper
industries), but the innovations cannot be simply transferred to food specifi cities for
several reasons:
Food product properties and moisture contents are generally highly •
variable, as opposed to manufactured products such as paper or chemical
compounds. For example, when looking at the distribution of the grain
moisture content of a sample of rice grains from the same harvested fi eld it
is common to observe a moisture content distribution from 5% wet basis
(w.b.) up to 35% w.b. with a mean value of 20% w.b. Similarly, the geomet-
ric characteristics can vary over a wide range, even for homogeneous
samples. Currently, there is an active research theme concerning the predic-
tion of food properties based on their composition and the construction
of databases.
Food products are not usually made of homogeneous materials. They partly •
share this characteristic with wood. Food is often an assembly of different
cellular tissues with specifi c resistance to water transport. Moreover, foods
usually shrink considerably during drying and have important visible
changes in aspect, texture, color, and so forth. As an illustration, think of
the high shrinkage of carrot or apple slices or the change in surface texture
of maize kernels (from elastic to rigid).
52527_C012.indd 35652527_C012.indd 356 10/3/2008 4:11:15 PM10/3/2008 4:11:15 PM
© 2009 by Taylor & Francis Group, LLC

Dryer Modeling 357
The design of food dryers cannot be reduced to a pure energy optimization •
problem. Apart from the main moisture content target, dried food has to
comply with many other “qualities” (e.g., color, fi rmness, odor, taste, etc.).
Although those qualities can be quantifi ed in a laboratory, they are seldom
available as models or simple equations.
For these reasons, dryer models and dryer simulators are required. Different
situations may arise such as the following:
1. A new dryer must be designed and built. Industrial dryers typically have
volumes greater than hundreds of cubic meters or more, so it is necessary to
consider laboratory-scale experimental dryers and/or model-based simula-
tion tools. Note that the scaling of results obtained at the laboratory level up
to the industrial level is never trivial.
2. There is an existing dryer with a given technology, but a new product or at
least new objectives are set. In that case, the engineering work will focus on
the setting (design is already done) and possibly the control of the drying
system. Because it is practically impossible to test different drying strate-
gies, a model-based simulator is required.
3. There is an existing dryer and the settings are satisfactory, but on-line record-
ings of dried product moisture content and quality do not match the objec-
tives nor the constraints. This is a classical control problem for a nonclassical
(e.g., nonlinear, multiple input–multiple output) system. As shown in several
publications, successful controllers for drying systems are model based.
As explained later in this chapter, there are other cases where available dryer
models may be helpful.
As stated, no polyvalent dryer simulator is available for the food industry. On the
one hand, one can fi nd several calculators relative to moist air or steam properties
(e.g., LINRIC or PSYCHRO), sometimes including useful tools for dryer design or
tuning, but no true versatile software dedicated to all types of food dryers. On the
other hand, there are several big commercial packages (e.g., PROSIM or ASPEN)
dedicated to the design, setting, and optimization of chemical processes that may be
adapted to fi t some food drying problems, possibly with a lot of work. However, no
“ready to use” tool is available for food dryer design, setting, control, and optimiza-
tion. Fortunately, numerous drying models exist for several dryer types (e.g., grain
dryers, spray dryers, freeze-dryers, drum dryers, etc.) validated on several products.
However, there is a chance that we can fi nd a drying model for the right dryer type
but not the right product. In that general case, the model does not have to be invented,
just extended (or adapted) to the new product.
It is regrettable that when major industrial simulators (e.g., PROSIM) comply
with CAPE-OPEN interoperability requirements, there are no available food dryer
models that are compatible. This means that no one did the extra work needed to make
the model accessible through a standard interface. Most (if not all) dryer simulators
are dryer type specifi c and product specifi c, and their graphical user interface is
generally hard coded in the model. This may not last indefi nitely when current trends
52527_C012.indd 35752527_C012.indd 357 10/3/2008 4:11:15 PM10/3/2008 4:11:15 PM
© 2009 by Taylor & Francis Group, LLC

358 Advances in Food Dehydration
in research are seeking more generic approaches and results (e.g., SAFES methodo-
logy or molecular modeling approach). If there is no “standard” simulation software
for food dryers, some drying models exist and are commonly used (with variants),
each of them with a certain level of complexity (i.e., physical realism) and an attached
domain of validity. For instance, the Brooker and Bakker Arkema model (1974) can
probably be considered to be at the root of the development of several close models
such as the Nellist–Bruce model (Bruce, 1983) or the Courtois–Abud model (Courtois
et al., 1991, 2001). Alternatively, there are several situations where few bibliographies
can be found. When considering a very specifi c product with specifi c quality criteria
in an unusual (i.e., barely found in industry) kind of dryer, the engineer is left almost
helpless. For instance, designing a steam dryer for alfalfa may be diffi cult for several
reasons: the product dimensions and texture change considerably during drying
(e.g., due to shrinkage of the product and collapse of the stack), and drying occurs
above the boiling point and requires a specifi c drying model.
The specifi city of food dryer models can be analyzed at two levels from the
particle to the full dryer scale:
1. The fi rst level is the single particle (e.g., a wheat kernel), the droplet (in
spray drying), or an elementary element of volume (e.g., for drum drying).
This is the place to describe all of the internal transfers: heat, mass, and
possibly quality related transformations. At this level there are many well-
known equations to describe the phenomena, but there is little knowledge
for predicting heat and mass transfer coeffi cients or even less for quality
transformations. This means that internal heat and mass balances rely heav-
ily on unknown coeffi cients. These heat and mass transfer equations within
the product (classic differential equations) require boundary equations to
describe what happens at the interface with the surrounding environment
(drying air or steam, contact or radiative fl uxes, etc.). This level is classi-
cally referred to as a thin layer of product (see later).
2. The second level is the integration of the fi rst level model in the three
dimensions of the dryer. We should say four dimensions because time is an
important variable: even if a dryer can be globally considered in the steady
state (time independence of state variables), all of the product particles or
parts are in an unsteady state (time dependence). Considering a multipart
conveyor belt dryer for pet food as an example, the product is spread over
the belt with a certain thickness. This is described as a deep bed. Depending
on the drying conditions, this dryer can be considered as a combination (in
series and/or in parallel) of deep beds. The numerical integration of thin
layers into a deep bed is usually complex. Typically, the simulation of a
dryer implies the numerical resolution of several coupled deep bed models,
involving the simulation of many elementary thin layers. Note that there are
many cases in which this logic is not applied exactly (e.g., freeze-dryers,
drum dryers, etc.).
Even if there are many categories of dryers that cannot fi t exactly with this
dichotomy, they are often less different than they seem to be. For instance, a solar
52527_C012.indd 35852527_C012.indd 358 10/3/2008 4:11:15 PM10/3/2008 4:11:15 PM
© 2009 by Taylor & Francis Group, LLC

Dryer Modeling 359
dryer with indirect solar heating can be considered as the combination of a solar
heater and a classical hot air dryer. In addition, a drum dryer can be approximated as
a thin layer drying above the boiling point and so forth.
There are two main steps to model an industrial dryer. First, consider the main
phenomena responsible for heat and mass transfer within the product and in interac-
tion with the drying media. At this stage, elementary equations describing the drying
of a single particle or elementary volume must be written. Second, integrate elemen-
tary systems with respect to space and time. At this stage, a large part of the work
is related to computer programming, depending on the graphical user interface that
is expected.
The next section discusses different approaches used to describe the internal
transfers within the product and the external transfers with the drying media
(i.e., boundary conditions). Then, the classical method to integrate thin layer models
into a deep bed and then at the full dryer scale is described. In the last section, some
important issues are discussed and some applications are presented.
12.2 MODELING INTERNAL AND INTERFACIAL TRANSFERS DURING DRYING
The available approaches for modeling heat and mass transfers within the product
and at the interfaces with drying media will be discussed in this section. White box
models are considered to comply with strong theoretical foundations. They are
supposed to be a combination of physically valid equations and laboratory measur-
able properties. Conversely, black box models are considered to be totally meaningless
and unable to extrapolate any results. Usually, situations are not black or white and
many models are grey boxes, for instance, meaningful equations with coeffi cients
and properties obtained via model identifi cation procedures. Neural networks (NNs),
when intelligently structured, may also include some knowledge.
It is well known that the whiter the model, the more robust it is. In other words,
a fi rst principle model can be considered suffi ciently robust for interpolation and
perhaps extrapolation.
The general drying curve (also known as drying kinetic) is composed of three
successive parts (Figure 12.1), which is a common assumption. The initial step is
either warming up or cooling down to reach the wet bulb temperature (if convective
drying) at which the product is maintained during drying at a constant rate; during
this second step it follows an isenthalpic direction and heat brought to the product is
entirely used to evaporate water. The curve is then followed by a slowing down part
where the product temperature increases as its surface becomes dry.
This classical theory is not directly transferable to food products. A simple
example can illustrate this assertion. Considering the thin layer drying kinetics of
maize and carrots, whose moisture content is X and its drying rate –dX/dt, Figure 12.2
shows how different the actual curves are compared to Figure 12.1.
Drying models can be written on the scale of a single particle (a grain in a bed,
a droplet during spray drying, or an entire solid) in order to predict moisture loss and
temperature rise kinetics during processing. There can be multiple objectives because
they can be used to obtain optimal settings for the drying operation, to set a design
52527_C012.indd 35952527_C012.indd 359 10/3/2008 4:11:15 PM10/3/2008 4:11:15 PM
© 2009 by Taylor & Francis Group, LLC

360 Advances in Food Dehydration
Drying rate
Product moisture content
Step 0Warming up
Step 1Constant ratedrying
Step 2Decreasing ratedrying
FIGURE 12.1 Generic air drying kinetic with three different steps: warming up, constant
rate drying, and decreasing rate drying.
FIGURE 12.2 Drying kinetics of (left) maize and (right) carrots: drying rate versus mois-
ture content (dry basis).
0
0.0001
0.0002
0.0003
0.0004
0.0005
0.0006
0.0007
0.0008
0.0009
0.1 0.2 0.3 0.4 0.5 0.6 0.7
–dX
/dt (
kg w
ater
/kg
dry
mat
ter/
s)
X (d.b.)
Maize 90°C
0
0.001
0.002
0.003
0.004
0.005
0.006
0.007
0.008
0.009
0.01
0 1 2 3 4 5 6 7 8 9 10 11
–dX
/dt (
kg w
ater
/kg
dry
mat
ter/
s)
X (d.b.)
Carrot slices 67°C
52527_C012.indd 36052527_C012.indd 360 10/3/2008 4:11:15 PM10/3/2008 4:11:15 PM
© 2009 by Taylor & Francis Group, LLC

Dryer Modeling 361
factor for a given dryer, or to understand and quantify interactions between elemen-
tary mass transfer modes inside the product during drying. The drying models
written on the scale of a single particle can be classifi ed as follows according to the
level of empiricism used when formulating the equations:
The drying models not based on fi rst principle equations where kinetics of •
moisture loss are described using empirical laws.
The drying models based on a fi rst principle where an attempt is made to •
describe internal (inside the product) and external (between the product and
its environment) heat and mass transfers: in such models, a variable number
of assumptions can be made to simplify the physical (and mathematical)
formulation of the transfer phenomena. This gives rise to a large number of
model types from oversimplifi ed models, in which internal resistances
attibutable to heat and mass transfer are neglected, to a complete mechanis-
tic approach, in which all individual modes of transfer are taken into account
when formulating the model’s equations.
12.2.1 PHENOMENOLOGICAL AND EMPIRICAL DRYING MODELS
Foods dry mostly in the falling rate period. Experimentally obtained Krischer’s
curves (drying vs. product water content) as well as the evolution of product tempera-
tures show no constant rate period in most cases. Some products exhibit a very
marked initial warming-up period, associated with an increasing drying rate. The
falling rate period can sometimes be divided in two or more distinct parts, depend-
ing on the product, its dimensions, and the applied temperatures.
The air temperature always has a strong infl uence on the drying rate constants,
which are sometimes “formalized” by an Arrhenius law, without any theoretical
ground, but giving an easy basis for comparison. In fact, the drying rate should be
more physically correlated to the product temperature, because in the falling rate
period the main resistance is due to internal moisture transfer that is strongly depen-
dent on the product temperature. However, this correlation with the air temperature
is much more convenient for practical purposes.
Published drying curves for different foods processed under the same condi-
tions show an extreme discrepancy in the magnitude of drying rates. One explana-
tion is certainly that the drying rates are expressed as functions of the decreasing
moisture content expressed on a dry matter basis, when surfaces of exchange or
specifi c surfaces (m2/kg dry matter) would certainly be a better basis of compari-
son. However, the structures and compositions of food products, especially the
sugar and fat concentrations, may also explain variations in the drying rates. For
those reasons, the theory is so far unable to predict the drying curves for such
products. Moreover, the experimental evaluation of the physical constants
(i.e., moisture diffusivity, thermal conductivity, density, specifi c heat, external heat,
and mass transfer coeffi cients) needed for solving the equations of simultaneous
heat and mass transport in a shrinking material (see Section 12.2.2) is a diffi cult
problem, and their dependence on the moisture content and temperature is not well
known for biological products.
52527_C012.indd 36152527_C012.indd 361 10/3/2008 4:11:15 PM10/3/2008 4:11:15 PM
© 2009 by Taylor & Francis Group, LLC

362 Advances in Food Dehydration
Although a description of the drying kinetics is important information for
dryer design, quite simple models to simulate the drying curves of foods have
been frequently proposed. These empirical or semi-empirical models can provide
adequate representation of experimental results, although their parameters lack a
physical sense.
12.2.1.1 Empirical Models
Different types of empirical models, which are more or less applicable to food mate-
rials, have been proposed for fi tting the thin layer drying curves. The main similarity
between them is the exponential term included in the equations, which gives a
decreasing exponential curve that provides a reasonable fi t to the continuous decrease
of the average moisture content during continuous drying.
The simplest one is based on the description of drying as a fi rst-order kinetics in
terms of the moisture ratio:
� d __
X ___ dt
� kd( __
X � Xe) (12.1)
where __
X is the average moisture content in the product (dry basis), Xe is the equilib-
rium moisture content (dry basis), and kd is the drying constant (/s), which is a lumped
parameter used to fi t experimental data.
This description was fi rst suggested by Lewis (1921) for drying of thin layers of
porous hygroscopic materials in the falling rate period and for constant conditions in
the drying air. This equation is analogous to Newton’s law for cooling when internal
resistance to heat transfer can be neglected.
The main problem is the evaluation of the exact value of the equilibrium mois-
ture content to utilize in this equation. It is sometimes treated as zero to simplify the
mathematical solution or extrapolated from the experimental curves representing
�(d __
X /dt) as a function of __
X ; Xe is then considered to be the value of __
X corresponding
to –(d __
X /dt) � 0 (Jannot et al., 2004). In reality, Xe depends on the temperature and
relative humidity of the air and on the material being dried. It should be obtained
from the sorption isotherm measured at the temperature of the drying experiment for
water activity values corresponding to the relative humidity (RH) of the drying air
(Figure 12.3).
In that case, the moisture ratio (MR) is expressed by integrating Eq. (12.1):
MR � __
X � Xe _______ X0 � Xe
� exp(�kdt) (12.2)
where X0 is the initial product moisture content. It shows that the average moisture
content of the product decreases exponentially with time (t):
__
X � (X0 � Xe) exp(�kdt) � Xe (12.3)
As previously discussed, the drying operating conditions have a signifi cant
infl uence on the drying curves. Therefore, kd can be correlated with the drying
52527_C012.indd 36252527_C012.indd 362 10/3/2008 4:11:15 PM10/3/2008 4:11:15 PM
© 2009 by Taylor & Francis Group, LLC

Dryer Modeling 363
conditions and material dimensions. Henderson and Pabis (1961) proposed the
following equation for expressing the dependence on the air temperature (Ta):
kd � k0 exp ( � k1 __ T
) (12.4)
However, more complex expressions can be found. For example, Kiranoudis et al.
(1997) proposed the following:
kd � k0 d p k1 Tk2 v a
k3 RHk4 (12.5)
where dp is the diameter of the dried material, T the drying temperature, and va is the
air velocity.
Another similar type of equation is known as Page’s equation:
MR � exp(�ktn) (12.6)
This equation has been used extensively for characterizing thin layer drying of
cereals, oilseeds, and ear corn (Jayas et al., 1991). It has been utilized to better
describe the drying kinetics mainly of starch-based materials when Eq. (12.2) failed
to fi t the drying data properly.
Sometimes the experimental data show that a single fi rst-order reaction kinetic
may not be fi tted to the whole drying curve. In such cases, equations expressed as a
sum of two or three exponentials have been proposed. Nellist and O’Callaghan
(1971) fi tted the data for ryegrass seeds using a two-term exponential equation.
Karathanos (1999) proposed a three exponential equation [Eq. (12.7)] for drying of
fruits rich in sugars, suggesting that each term may correspond to one of the main
Sorption isotherms
T1 < T2
Xe1
Xe2
0 Aw = RH/100 1AW
t
T2
T1
X
Drying curves
Xe1
T1
T2
Xe2
XFIGURE 12.3 Equilibrium moisture content measurement from sorption isotherms.
52527_C012.indd 36352527_C012.indd 363 10/3/2008 4:11:16 PM10/3/2008 4:11:16 PM
© 2009 by Taylor & Francis Group, LLC

364 Advances in Food Dehydration
mechanisms of weight loss, that is, water evaporation and two different reactions of
sugar decomposition.
MR � c1 exp(�k1t) � c2 exp(�k2t) � c3 exp(�k3t) (12.7)
More than 12 equations of this type are more or less applicable to biological
products. A huge number of publications deal with the application of such models to
various vegetables, fruits, or agroproducts. Jayas et al. (1991) reviewed and discussed
many different equations. Among many others, Akpinar (2006), Celma et al. (2007),
and Togrul and Pehlivan (2002) provided descriptions of the most widely used
empirical models to describe drying kinetics.
Such empirical models are generally fi tted to experimental data by regression
analysis using statistical tools. Karathanos (1999) preferred a method of successive
residuals described by Mohsenin (1980) for fi tting coeffi cients in Eq. (12.7). The fi rst
residual was calculated by the difference between the experimental moisture ratios
and those calculated by a fi rst linear regression using only the fi rst exponential term.
This residual was then refi tted to a second linear regression equation and the same
for the third. In this way, Mohsenin proposed to discriminate the weight loss due to
the decomposition of sugars from water evaporation.
Empirical models mathematically relate the average moisture content and drying
time with a variable level of physical realism. They neglect the fundamentals of the
drying process and the controlling transfer mechanisms, and their parameters have
no physical meaning.
12.2.1.2 Characteristic Drying Curves (CDC)
The concept of CDC, fi rst proposed by van Meel in 1958, states that there is a unique
shape for the falling rate drying curve for a particular material, independent of
the external conditions. For certain assumptions, a series of drying curves of the
same material that are experimentally obtained under different drying conditions
are supposed to be geometrically similar and can be brought down to a unique
dimensionless curve called the CDC.
A CDC of a moist material can therefore be drawn from a single or a reduced
number of pilot-scale experiments by plotting the relative drying rate as a function
of the characteristic moisture content.The relative drying rate ( f ) can be defi ned as f � (N/Nc), where N is the drying
rate and Nc is the drying rate in the constant rate drying period. Function f is supposed
to be specifi c to the product being dried and independent of external conditions.
The dimensionless characteristic moisture content (f) is the ratio of the free mois-
ture content to the difference in moisture content between the critical point (Xcr, the end
point of the constant drying rate period) and the equilibrium moisture content.
f � __
X � Xe _______ Xcr � Xe
(12.8)
If there is no clear constant drying period, Nc can be taken as the maximal rate
and Xcr is equal to X0 (Baini and Langrish, 2007; Jannot et al., 2004).
52527_C012.indd 36452527_C012.indd 364 10/3/2008 4:11:16 PM10/3/2008 4:11:16 PM
© 2009 by Taylor & Francis Group, LLC

Dryer Modeling 365
The CDC is normalized to pass through the points (1, 1) at the critical point and
(0, 0) at equilibrium, and an empirical function for simulating f can be fi tted on this
curve (Figure 12.4).
This is an attractive representation because it can lead to a simple lumped-
parameter expression for the drying rate:
N � f (Nc) � f (Sb (pvs � pvg)) (12.9)
where b is the external mass transfer coeffi cient (kg/m2 Pa s), pvs is the saturated
vapor pressure, and pvg is the vapor pressure in the bulk gas. Such a representation
allows the separation of the parameters that infl uence the drying process because f depends on the material itself, b depends on the design of the dryer (value of the air
velocity around the product), and pvs and pvg depend on the processing conditions
(Langrish and Kockel, 2001).
Fornell (1979) proposed a similar but simplifi ed transformation for food and
agricultural products with no constant drying rate period, where f � N/(Ta – Twb) √ __
va
and f � __
X . This transformation was successfully applied to products with an isotropic
and homogeneous physical structure and seemed justifi ed in the usual domain of
drying air conditions.
CDCs can be effi cient for small (�20 mm), microporous, and nonshrinking
materials (Keey and Suzuki, 1974; Langrish and Kockel, 2001). On such products,
Fyhr and Kemp (1998) calculated that, in most cases, the CDC predictions were as
good as or even sometimes better than those from a diffusion model.
For bioproducts showing a falling rate period with two different decreasing
drying rates, it is possible to establish a CDC by segments with two different forms
(Jannot et al., 2004; Ng et al., 2006). A transition point has to be identifi ed for
calculating two characteristic moisture contents f1 and f2, one for each period, and
for fi tting two expressions for f1 and f2.
–dX
/dt f
X
1
φ0
1
CD
C
FIGURE 12.4 Achieving a CDC from drying curves measured in different process
conditions.
52527_C012.indd 36552527_C012.indd 365 10/3/2008 4:11:16 PM10/3/2008 4:11:16 PM
© 2009 by Taylor & Francis Group, LLC

366 Advances in Food Dehydration
It is important to outline that empirical models and the CDC method can be
useful for describing the drying kinetics of products dried continuously, but they
cannot be used to describe intermittent drying and relaxation processes (Baini and
Langrish, 2007).
12.2.1.3 Neural Networks (NNs)
Calculating the moisture content using a black box model is quite easy but its appli-
cation is limited, especially for variable drying conditions that are necessary, for
example, for process control purposes. In such cases, the artifi cial NN is an inter-
esting tool because it allows fast and easy simulation that can be used in predictive
control algorithms, when the process model has to be simulated many times in a
sampling period.
NNs have the ability to “learn” the process behavior from a set of experimental
data and to provide a smooth and reasonable interpolation of new data. When com-
pared to traditional function approximators like polynomials or Fourier series, NNs
require generally less adjustable coeffi cients, especially if the number of variables is
high. In order to obtain a dynamic model, the time can be incorporated as an explicit
variable. However, it is important to note that NNs usually require more experimental
data than physical models because all relevant combinations of inputs have to be
present in the training set. The “generalization” concerns only interpolation, and
results for combinations of inputs not previously seen are unpredictable.
The inputs of the structure can be variables such as air-fl ow rates, inlet and outlet
temperatures, and relative humidities, which are easily measured. One of the fi rst
applications to drying was proposed by Huang and Mujumdar (1993) to predict the
temperature and moisture content of tissues during industrial drying. Trelea et al.
(1997a) used explicit time and recurrent NNs with three hidden neurons for simulat-
ing the moisture content of thin layer corn during drying (Figure 12.5). The inputs of
the model were the initial moisture content, the temperature of the drying air, and
the drying time. Explicit time NNs allowed the prediction of the fi nal moisture
content and recurrent NNs the whole drying kinetics.
These researchers showed that such models can be used for simulations in
variable temperature conditions, if the number of temperature levels is not too high.
Bala et al. (2005) used a multilayered NN approach to predict the performance of a
solar tunnel drier. Martynenko and Yang (2006) compared the accuracy of an NN
Explicitneural
networkt
Ta Xf
D
Xi
Recurrentneural
networkTa(k – 1) X(k)
X(k – 1)
FIGURE 12.5 Explicit and recurrent NNs as used by Trelea et al. (1997a); k, increment in
sampling time; �, one sampling period delay.
52527_C012.indd 36652527_C012.indd 366 10/3/2008 4:11:16 PM10/3/2008 4:11:16 PM
© 2009 by Taylor & Francis Group, LLC

Dryer Modeling 367
with exponential and Page models for simulating the drying rate of ginseng. The NN
gave the best fi t to the experimental data, especially for small roots, because it can
predict the nonlinear effects of different parameters on the mass transfer.
NNs are a possible methodology for building fast nonlinear dynamic models
of drying. No assumptions on the underlying physical mechanisms are made; the
models are based on experimental data and can be reliable in interpolation only.
12.2.1.4 Compartmental Models
Physical dynamic models of drying, which are based on the description of under-
lying diffusion mechanisms (see Section 12.2.2), usually result in coupled partial
differential equations. Such models can be simplifi ed using a semi-empirical
compartmental approach (Courtois et al., 1991; Toyoda, 1988) that describes the
macroscopic behavior of the product. They allow the prediction of the steady-state
and dynamic behaviors of any dryer.
In most cases, the product is described as being composed of a certain number of
concentric compartments for mass transfer and a uniform one for heat transfer, that is,
as a multiple compartment water system and as a single one for heat (Figure 12.6).
Mass transfer inside the product is based on diffusion, and vaporization takes place
only at the surface. Such a compartmental approach is mainly used to effi ciently
account for the internal resistance to mass transfer for computing.
The external heat transfer coeffi cient (h) and the external (b1) and internal (b2)
mass transfer coeffi cients must be adjusted with the help of constant condition drying
kinetics. Basically, this modeling approach is preferred for its ability to represent
many phenomena well (even if containing lumped parameters), its fast speed of
computing, its physical backgrounds, and its optimal parameterization.
12.2.2 DRYING MODELS BASED ON FIRST PRINCIPLE EQUATIONS
Before listing the different types of models written on the scale of a single particle,
the individual modes of heat and mass transfer are described, making the distinction
between internal transfers (inside the drying product) and external transfers (between
the product and its environment).
Mass transfer
Compartment 2
Compartment 1
Heat transfer
Air : Tair, pva
X1
Tp
X2
Tp
h
2
1
FIGURE 12.6 Principle of the compartmental approach in modeling. The product is seen
here as two tanks in series.
52527_C012.indd 36752527_C012.indd 367 10/3/2008 4:11:16 PM10/3/2008 4:11:16 PM
© 2009 by Taylor & Francis Group, LLC

368 Advances in Food Dehydration
12.2.2.1 Importance of Description of Product Internal Physical Structure
It is important to note at this level that the description of the internal mass transfer
phenomena is always related to a description of the internal structure of the product
that is as precise as possible. Important factors are the presence or absence of pores,
the size of pores, and the level of interactions between water and dry matter.
Most food products can be viewed as hygroscopic porous or capillary–porous
media or as colloidal (nonporous) media such as gels or liquid solutions. The distinc-
tion between porous and capillary–porous is made by considering the size of the
pores as discussed by Datta (2007a): porous products have pore diameters ≥10�7 m
and capillary–porous products have pore diameters of <10�7 m. Analyzing the level
of physicochemical interactions between water and dry matter allows us to make the
distinction between nonhygroscopic media (negligible amount of bound water in the
pores) and hygroscopic media (mixture of bound and unbound water in the pores in
a variable ratio as drying proceeds).
Note that many dried food products have an initial porosity that is signifi cantly
developed during drying. This is the case for apples whose porosity increases from
0.220 initially (mainly open porosity) to 0.609 when completely dried at 80°C.
However, this product ends up with a very low level of open porosity (0.130) because
of the collapse of surface pores (Rahman et al., 2005). If this experimental informa-
tion about the internal structure is available, it must be taken into account when dis-
cussing the correct simplifying assumptions used to describe internal mass transfers
during drying.
12.2.2.2 Internal Heat and Mass Transfer Mechanisms in Drying of Food Products
According to the discussion in the previous paragraph, drying of food products can
be now considered as a combination of heat and mass transport mechanisms occur-
ring in hygroscopic porous media with changing (size and nature) internal porosity.
We now list and physically describe all elementary heat and mass transport mecha-
nisms occurring during a food product undergoing drying.
12.2.2.2.1 Internal Mass Transport MechanismThe main elementary mass transport mechanisms occurring during heat processing
of porous media are ordinary diffusion, convection of liquid or gas driven by pres-
sure gradients, capillary diffusion, and the evaporation–condensation phenomenon.
All of these modes of heat and mass transfer are precisely described and quantifi ed
by Datta (2007a) and Peczalski and Laurent (2000). We give a physical description
of each of these elementary modes of transfer.
Ordinary diffusion is the movement of particles from zones of high concentra-
tion to zones of lower concentration. It is the statistical result of a random process
occurring on a microscopic scale. Ordinary diffusion occurs in the liquid phase for
drying of nonporous media and in the gas phase for porous materials if the open
porosity of the product is high enough. The ordinary diffusion fl ux is proportional to
the gradient of the mass or molar fraction.
52527_C012.indd 36852527_C012.indd 368 10/3/2008 4:11:16 PM10/3/2008 4:11:16 PM
© 2009 by Taylor & Francis Group, LLC

Dryer Modeling 369
The convection phenomenon (or hydrodynamic fl ow) is driven by total pressure
gradients and is also noted in porous products. This mode of mass transfer is of
prime importance during drying at high temperature where internal pressure gradi-
ents are expected to occur.
Capillary diffusion (or capillary fl ow) occurs in a porous medium. It is attribut-
able to the intermolecular forces between the liquid and the solid phase, which are
stronger than intermolecular forces inside the liquid phase, and it explains why the
liquid phase is migrating in the porous structure. This fl ux of liquid is proportional
to the gradients of capillary pressure. Because the capillary pressure is a function of
both the moisture content and temperature, the capillary fl ow of liquid can be decom-
posed in the sum of a mass fl ux proportional to the temperature gradient and a mass
fl ux proportional to the moisture concentration gradient.
Finally, there is a migration of moisture in a porous medium that is initiated by
a temperature gradient inside the product. This mechanism is known as evaporation–
condensation because liquid water evaporates in the hot zone and condenses in colder
zones after diffusion in the gas phase. This mechanism can happen between two
menisci in an open pore or between different zones of the cell walls surrounding
a gas cell subjected to a temperature gradient. By modifying the liquid moisture
concentration when condensing, this mechanism can be amplifi ed by capillary
diffusion operating in the return from zones of high moisture concentration to zones
of lower moisture concentration.
12.2.2.2.2 Internal Heat Transport MechanismIn continuous media, heat is driven by thermal conduction from zones of high tem-
perature to zones of lower temperature. The proportionality factor between the heat
fl ux and temperature gradient is by defi nition the product thermal conductivity. In
porous media during drying, this elementary mechanism is completed by energy
infl ow and outfl ow due to different mass transfers. In the evaporation–condensation
phenomenon, a signifi cant transfer of latent heat of vaporization accompanies
the mass transport from hot zones (where evaporation occurs) to cold zones (where
condensation occurs). This effect can appear explicitly in the heat balance or be
taken into account in a modifi ed thermal conductivity term, the so-called apparent thermal conductivity. This apparent coeffi cient globalizes the different mechanisms
contributing to the overall heat transport due to temperature gradients.
12.2.2.3 External Heat and Mass Transfer Mechanisms in Drying of Food Products
The mechanisms of heat and mass transfer occurring between the product and its
environment during drying (external transfers) are those classically encountered in
all unit operations involving heat transfer (heating, drying, baking, frying, etc.).
External heat transfer mechanisms are convection, thermal radiation, and heat trans-
fer occurring at the interface between two solids (heat transfer by contact).
Thermal convection is a mode of heat transfer resulting of the bulk motion of a
fl uid relative to the surface of a solid when the two phases have different temperatures.
Thermal and hydrodynamic boundary layers develop at the immediate vicinity of the
solid surface. The patterns of variation of the temperature and velocity distributions in
52527_C012.indd 36952527_C012.indd 369 10/3/2008 4:11:16 PM10/3/2008 4:11:16 PM
© 2009 by Taylor & Francis Group, LLC

370 Advances in Food Dehydration
these boundary layers determine the effi ciency of energy exchange between the fl uid
and the solid. This effi ciency is quantifi ed by a convective heat transfer coeffi cient.
The same phenomenon explains the convective drying of the product. In this
case, the vapor fl ux emitted by the surface of the product is proportional to the dif-
ference of the vapor concentration (or partial pressure) between the immediate vicin-
ity of the product surface and the drying air. The proportionality factor is physically
related to the convective heat transfer coeffi cient. The more effi cient the thermal
convection is, the more important the vapor fl ux emitted by the surface of the prod-
uct. At the product surface, the composition of humid air in the immediate vicinity
of the product surface is estimated by assuming an instantaneous thermodynamic
equilibrium between liquid moisture at the surface of the product and vapor just
above the product. It is thus calculated using moisture equilibrium isotherms, as
discussed in Section 12.2.2.1.
Thermal radiation is the result of energy exchanges between solid surfaces at
different temperatures, and this energy is transported by electromagnetic waves
(alternatively, photons). The net energy emitted by the environment and absorbed by
the surface of a solid during drying is infl uenced by the emissivity of each of the
emitting surfaces (which is a measure of the ability of a surface to emit thermal
energy relative to an ideal solid called a black body), by the relative position between
the emitting surfaces (quantifi ed by a geometric factor called view factor), and by the
temperature difference (�T 4) between the different emitting surfaces.
Finally, external heat transfer occurs at the interface between two solids put into
contact. As a result of the surface roughness effects, air fi lled gaps always appear at
mesoscopic levels when two solids are put into contact. Heat transfer across these
gaps occurs by conduction, which is known to be a noneffi cient phenomenon in a gas
phase. Macroscopically, thermal contact resistance appears at the interface between
the two solids and assuming the equality of temperature for the two solids at the
interface can be an incorrect hypothesis. The heat fl ux between the two solids is
hence proportional to the temperature difference between the two solids at the inter-
face, and the inverse of the proportionality factor is called thermal contact resis-
tance. This thermal contact resistance is always diffi cult to evaluate because surface
temperatures and contact fl ux are diffi cult to measure experimentally without affect-
ing this mechanism of transfer.
12.2.2.4 Models Neglecting Resistance to Internal Heat and Mass Transfers
The infl uence of the product internal structure on the nature of internal heat and
mass transfers was discussed and the different mechanisms of internal and external
heat and mass transfers were listed and briefl y described. Thus, the fi rst category of
drying models to be presented concerns the fi rst principle based models in which
resistance to internal heat and mass transfer is neglected.
According to this simplifying hypothesis, the temperature and moisture content
are assumed to be uniform (in the space volume occupied by the product) at any
drying time. In this case, the product drying rate is controlled by the nature and
intensity of the external modes of heat transfer (thermal convection, radiation, heat
transfer by contact, convective drying) that thus must be measured or estimated as
52527_C012.indd 37052527_C012.indd 370 10/3/2008 4:11:16 PM10/3/2008 4:11:16 PM
© 2009 by Taylor & Francis Group, LLC

Dryer Modeling 371
precisely as possible. This assumption can be satisfactory for small products (milli-
metric size or lower such as in a liquid droplet during spray drying) and for drying
in the constant drying rate period or at low levels of external heat fl ux.
Using this hypothesis, the model for drying takes the mathematical form of sim-
ple ordinary differential equations expressing the overall heat and mass conservation
equations for the product. The major drawback of this type of approach is that an
eventual (always present, even if weak) internal resistance to heat and mass transfer
is likely to rely numerically on the value of a parameter related to external transfer
(e.g., the convective heat transfer coeffi cient). In this case, this parameter, which is
initially of clear physical signifi cance, becomes a pseudo-empirical parameter with
an initial order of magnitude that can be assessed experimentally but the precise
fi nal value will be fi xed by a comparison between predicted and experimental drying
curves. Moreover, this type of model is diffi cult to extrapolate to other sizes of prod-
ucts (when increasing the size of the product, the internal resistance to heat and mass
transfer increases) and to other dryer types (levels of external heat and mass fl ux can
change when using another type of dryer).
12.2.2.5 Models Using an Apparent Diffusivity Approach
In this category of models, we make the assumption that, whatever the migrating
phase (liquid or gas), all of the elementary internal mass transport mechanisms can
be mathematically described by Fick’s law of diffusion that was initially developed
for ordinary binary diffusion. In this case, the resulting moisture fl ux (indifferently
in the liquid and gas phases) is assumed to be proportional to the moisture concentra-
tion or moisture content gradient, and the proportionality factor is defi ned as the
apparent diffusivity.
The apparent diffusivity can be assumed constant in a range of moisture con-
tents. Nevertheless, because the apparent diffusivity is a property used to mathemat-
ically describe a wide range of mass transport mechanisms, it is more generally
expressed as an empirical function of product composition factors (moisture, fat and
salt contents, etc.), physical structure factors (level and type of porosity, etc.), or
environmental conditions (mainly temperature). From its defi nition, the apparent
diffusivity is a pseudo-empirical parameter and its experimental determination
becomes very diffi cult. When trying to experimentally measure the apparent diffu-
sivity, we must ensure that the mass transfer conditions (nature and intensity of heat
and mass fl ux, level of deformation of the product, etc.) are of the same order of
magnitude on the apparatus used for measurement as the ones experienced by the
product during the drying process. A large catalogue of values for the apparent mois-
ture diffusivity and a clear discussion on the methodology and precautions needed to
measure this transport property can be found in Saravacos and Maroulis (2001).
The same methodology can be used to describe all internal heat transfer mecha-
nisms by defi ning an apparent thermal conductivity and using the classical Fourier’s
law. The experimental determination of this apparent heat transport property global-
izing a wide range of elementary mechanisms poses the same problem as the one
encountered when measuring the apparent diffusivity. Fortunately, the internal heat
resistance (in products up to centimeter size) is often neglected for reasonable levels
of external heat fl ux.
52527_C012.indd 37152527_C012.indd 371 10/3/2008 4:11:16 PM10/3/2008 4:11:16 PM
© 2009 by Taylor & Francis Group, LLC

372 Advances in Food Dehydration
The benefi t of this type of approach is that it has been widely used for numerous
products and dryers. Hence, there is profuse literature about this subject and the
validity of all of the simplifying assumptions made when formulating the model has
been already discussed for a lot of cases. Moreover, if the internal heat and mass
transfer phenomena can be assumed as unidirectional and if the product can be
assumed as a typical shape (slab, cylinder, or sphere), the obtained equations are in
the form of coupled partial differential equations (assuming internal resistance to
heat and mass transfer), which can still be numerically solved using classical soft-
ware for technical computing such as Matlab®.
The major drawback of this approach is the pseudo-empirical nature of the
apparent heat and mass transport properties and the diffi culty of measure it on a
laboratory scale. When comparing the drying model to experimental results, we
must simultaneously assume the validity of the hypothesis made when formulating
the model and identify the optimal values for parameters appearing in expressions of
the apparent diffusivity and conductivity by minimizing the sum square of errors
between the measured and predicted values. This strategy is always dangerous when
dealing with uncertain model principles and uncertain parameter values. Particular
care must also be taken when characterizing external heat and mass transfer (often
by experimental measurement) in order to not report uncertainties in the values of
the internal transport properties and hence lowering their level of physical realism.
12.2.2.6 Fully Mechanistic Models
In this approach each individual mode of internal heat and mass transfer is clearly
made explicit and formulated mathematically. Note that these individual modes of
transfer are highly coupled, which gives rise to serious complications when solving
the obtained equations. The most complete works on modeling coupled heat and
mass transfer during heating and drying of porous media are certainly those of
Berger and Pei (1973), Perré and Degiovanni (1990), Philip and De Vries (1957), and
Whitaker (1977).
In this category of models, food or nonfood products are always considered as
polyphasic materials in which the internal porosity is partially fi lled with a mixture
of bound water, unbound water, and a gas phase that is assumed to be a mixture of
dry air and vapor. We must be particularly careful to describe the internal structure
of the product as precisely as possible. The proportion and nature of the porosity
between completely closed porosity (gas cells entrapped in a continuous solid of the
liquid phase) and open or fl ow-through pores allowing hydrodynamic fl ow of liquid
or gas is sometimes taken into account. The link between internal structure parame-
ters and the signifi cant elementary mass transfer mechanisms is always made. The
respective infl uence between the mechanical properties of the product and mass
transfer mechanisms is sometimes discussed when considering product deformation
during drying. The levels of local deformation are described in one or more direc-
tions in space in this case.
Conservation equations are written on the microscopic scale at the level of a
representative elementary volume including water, vapor, air, and solid matrix phases
and are then volume averaged to obtain fi nal equations expressing continuity and
52527_C012.indd 37252527_C012.indd 372 10/3/2008 4:11:16 PM10/3/2008 4:11:16 PM
© 2009 by Taylor & Francis Group, LLC

Dryer Modeling 373
fl ux equations in a fi ctitious equivalent continuous medium (Datta, 2007a). As
discussed in detail by Datta (2007a), two complementary approaches are distin-
guished at this level: a fi rst approach considering a uniformly distributed evaporation
in liquid, vapor, and heat conservation equations (the evaporation term in mass
balance equations corresponds to a heat sink term in heat conservation equations)
and a second approach in which evaporation is supposed to occur at a moving inter-
face between a dry phase and a phase still containing liquid water.
The obvious benefi t of this type of model is its ability to be extrapolated to other
product geometries and other types of dryers. This is possible because the physical
basis used to develop the model is well established and very clear. Moreover, this
type of approach allows evaluating and then organizing into a hierarchy all of the
individual modes of internal heat and mass transfer. Limiting phenomena to overall
mass transport can also be identifi ed.
By contrast, the major drawbacks of these approaches lie in the complexity of
the mathematical formulation of internal heat and mass transfer and the complexity
of solving the resulting coupled equations. Moreover, the hypotheses made when
developing the drying model are critical and their validity is sometimes diffi cult to
judge because no experimental technique is available on-line to separately evaluate
the infl uence of each of the individual transfer modes on the overall product moisture
loss. Finally, this type of model needs the knowledge of an important number of
properties related to the product structure (nature and level of porosity and its
evolution as drying proceeds) and their impact on transport properties such as
capillarity or molecular diffusivity, vapor, and liquid permeability. Because these
values are sometimes diffi cult to assess on the laboratory scale and are not available
in the literature, this gives rise to another complication when comparing the
predictions of the drying model to experimentally measured values. Datta (2007b)
recently discussed the problem of the availability of precise property data needed
when developing a drying model for a porous product.
12.2.2.7 Modeling of Product Volume Change
The volume change of food products submitted to drying occurs for a large family of
products such as fruits or vegetables. Generally, overall shrinkage of the product
occurs as drying progresses. Some cases of swelling can also be noted when rewet-
ting dried products or when internal vaporization of water occurs inside individual
gas cells separated by a still deformable liquid phase. This deformation has a great
infl uence on the overall product moisture loss kinetics because of the following:
The product surface area can signifi cantly decrease in a product submitted •
to shrinkage. This phenomenon can lead to confl icting results about the
presence or absence of a fi rst drying stage. May and Perré (2002) investi-
gated this in the drying of various fruits and vegetables, where the external
mass fl ux per surface area was precisely measured by an original experi-
mental setup.
The internal structure of the product is signifi cantly modifi ed when shrink-•
age or swelling occurs during drying. In mechanistic models, the nature
52527_C012.indd 37352527_C012.indd 373 10/3/2008 4:11:16 PM10/3/2008 4:11:16 PM
© 2009 by Taylor & Francis Group, LLC

374 Advances in Food Dehydration
and proportion of individual transfer modes can be drastically affected by
this change of the internal structure.
Faced with this supplementary complexity, some models do not take this volume
change into account or simply consider a dimension change that is directly propor-
tional to the moisture loss or gain in each zone of the product. The model is hence
written in a referential attached to the dry matter of the product (Lagrangian coordi-
nates) and the Eulerian coordinates are then recalculated at the end of the simulation
by considering that, whatever the drying time, the volume of the product is always
equal to the sum of the partial volumes of the liquid and dry matter phases. At this
level of description of deformation phenomena, the shrinkage is often considered as
unidirectional and seldom bi- or tridirectional. Another alternative consists of impos-
ing on the material a deformation law measured experimentally or simply predicted
from the evolution of the apparent density of the product (making the assumption
that the volume of the product is equal to the sum of the partial volumes of water, dry
matter, and gas phases). The latter point is discussed by Mayor and Sereno (2004).
Some recent studies presented drying models that were completely coupled to small
or large deformation models, taking into account the mechanical properties of the
product and their change during drying. One example of this type of approach can
be found in Zhang et al. (2005).
12.3 SPACE AND TIME INTEGRATION OF ELEMENTARY DRYING MODELS
The previous section listed the phenomena describing heat and mass transfers within
the product and at the interface with the drying medium. This level of analysis is
usually called a “thin layer” of product. This terminology refers to the fact that air
(or steam) is considered as constant and uniform around the product particle.
A more practical defi nition is given for the air drying of a static bed: the output
temperature and moisture content of used air are not signifi cantly different from the
input values.
In fact, the modeling approaches provided in Section 12.2 may be suffi cient to
describe some industrial dryers. For instance, when considering a fl uidized bed
dryer, the air fl ow is “strong” enough to maintain product particles in suspension
with perfect agitation. In other words, all particles are submitted to the same average
drying air and dry the same way. In that case, the model is a mathematical equivalent
to an average particle and there is no need for a time-consuming numerical integra-
tion over the bed volume.
In a more generic approach, every time the particles are well agitated and/or
their drying medium (air most likely) is not dependent upon the drying of other par-
ticles (with whom air would already have some transfers), the dryer can be modeled
as average particle drying. To be precise, one may calculate the following index of
saturation (IoS) empirical ratio:
IoS � 100 jw ___ ja
1 ______ �Ymax
(%) (12.10)
52527_C012.indd 37452527_C012.indd 374 10/3/2008 4:11:17 PM10/3/2008 4:11:17 PM
© 2009 by Taylor & Francis Group, LLC

Dryer Modeling 375
where ja and jw are the air-fl ow and evaporation rates, respectively; �Ymax is the
maximum saturation capacity. Then, the maximum evaporation rate (max jw) is
max jw � max ( � dX ___ dt
) S H rdm
and
ja � rda S va
where S is the section area; H is the bed height; and rda and rdm are the dry air and
dry matter densities, respectively.
The previous equation can be simplifi ed to
IoS ª 100 max ( � dX ___
dt ) H rdm
____________________ va 1 _____
�Ymax
by neglecting variations of the air density with the temperature.
The �Ymax of drying air is usually taken as the (positive) difference between its
actual absolute humidity ratio (kg water/kg dry air) and the same variable at satura-
tion assuming isenthalpic saturation. For instance, 90°C drying air and 0.010 kg
water/kg dry air will saturate in an isenthalpic manner at 33.6°C (wet bulb tempera-
ture) for an absolute humidity ratio of 0.034 kg water/kg dry air. In that case, the
�Ymax of this drying air is 0.024 kg water/kg dry air.
When the index of saturation is low (e.g., �20%), it is probable that the
deep bed can be considered as an elementary particle of the product of the same
weight. In that case, there is no need to model and integrate the air moisture and
temperature gradients within the bed because it behaves mostly like a thin layer
of product.
In any other case, the progressive saturation of the drying air throughout the
product deep bed, with respect to both time and space, can no longer be neglected.
Furthermore, the air gradients within the bed must be computed to correctly simulate
successive product layers. Taking into consideration the energy costs, it is generally a
good idea to design a dryer in such a way that the drying air fi nally outputs close to
(but below) saturation in order to use its maximum drying capacity and minimize the
energy spent at the burners.
Note that the index of saturation can reach values of over 100% in local conden-
sations at the air outlet ducts that are quite common in industrial dryers.
12.3.1 FROM THIN LAYER TO DEEP BED
As previously stated, most deep bed models for dryers assume a deep bed of product
to be equivalent to a group of thin layers in series (Figure 12.7). Many industrial
dryers are simulated that way, such as conveyor belt dryers, mixed-fl ow dryers, and
52527_C012.indd 37552527_C012.indd 375 10/3/2008 4:11:17 PM10/3/2008 4:11:17 PM
© 2009 by Taylor & Francis Group, LLC

376 Advances in Food Dehydration
so forth. For that purpose, in such an approach, there are several assumptions (on air
drying) to make:
The air fl ow is plug type and unidirectional [one-dimensional (1-D) models, •
see discussion in Section 12.3.2].
Direct heat and mass transfers between product particles are negligible. •
All transfers are assumed to take place either within the particles or at the
interface with the surrounding air.
There is no signifi cant change in air properties within a thin layer of product, •
only between two successive layers.
The air pressure drop within the bed is usually neglected.•
The overall shrinkage of the bed is usually neglected. The same is true for •
the changes in bed porosity.
The heat losses throughout the walls are usually considered to be negligible.•
In this approach the air moisture content and temperatures are no longer consid-
ered to be constant and uniform: they are truly new variables to include specifi cally
in the equation set. Therefore, it is necessary to extend the heat and mass balances
from the product to the drying air. The direction axis over which the air fl ows is
usually noted oz, with z being the position in the bed (0 at the input and H at the
output of the bed).
The mass balances for the air at level z are the result of the difference between
the water taken from the product at the same level z and the renewing of the air
moisture attributable to its gradient over the bed height:
∂(ra Y)
_________ ∂t �
∂(va ra Y) _____________ ∂z
� Fw a 1�e ____ e (12.11)
where va is the actual air velocity within the bed, depending mainly on the bed poros-
ity (e), and �w is the water fl ow density between the air and the product.
In a similar way, the heat balance for this air is defi ned as
∂(ra cpa T)
_____________ ∂t �
∂(va ra cpa T) _________________ ∂z
� (Fw Lv � Fh) a 1�e ____ e (12.12)
Air
0
z
FIGURE 12.7 Virtual decomposition of a deep bed of product into a series of successive
thin layers.
52527_C012.indd 37652527_C012.indd 376 10/3/2008 4:11:17 PM10/3/2008 4:11:17 PM
© 2009 by Taylor & Francis Group, LLC

Dryer Modeling 377
Note that the ra cpa (volumetric heat capacity of the air) term is not constant
because it highly depends on Y. One common way of dealing with this term is to
consider that it is the sum of two terms: one corresponding to the dry air fraction,
and the other to the vapor fraction. Here, �w is the water exchanged between the air
and product at level z and �h is the heat exchanged between the air and product at
level z. They are both calculated using the equations described in Section 12.2
(i.e., thin layer equations). They constitute the hard link between air related balances
and product related balances.
Solving the resulting system results in the ability to predict both air and product
temperatures and moisture contents at any location within the bed. Unfortunately,
there have been few research attempts to fi nd analytical solutions of such systems.
There is an interesting application of Adomian’s method (1996) for coupled heat
and mass transfers that is far less complex than what is found in food dryers: no
complicated food properties or phase changes. There is also a nice work from
Sebastian (Aregba et al., 2006; Nadeau et Puiggali, 1995) to analytically integrate
some simple thin layer models over a deep bed with strong assumptions concerning
the product temperature behavior. It is therefore common to fi nd numerical
solutions of this type of models. For that purpose, continuous equations are usually
discretized over space (�z) and time (�t) using either an explicit or implicit fi nite
difference scheme.
There are basically two methods to solve the discrete version of this model
type, depending on the fi nite difference scheme (for further explanations, see
Press et al., 2007):
1. If the scheme is time explicit, Runge–Kutta methods or similar ones
can be used to calculate, time step after time step, the space evolution
of all air and product temperatures and moisture contents. Because of
the stiffness of the equation set, the integration procedure can diverge
very easily.
2. If the scheme is time implicit, the resolution implies, at each time step, the
inversion of a (variable) matrix. The extra cost of computation required by
this inversion is usually fully compensated by the gain in stability and thus
the gain in integration speed (at least a factor 100).
In any case, the choice of the space increment �z and the time increment �t constitutes a major issue. Many methods are available to adjust �t in order to ensure
stability, convergence, and precision of the numerical integration as performed by
Matlab®, Scilab®, Octave®, or any other platform for numerical computation imple-
menting ordinary differential equation solvers. In contrast, �z is usually a constant
fi xed at the beginning of the algorithm. However, �z should be reduced as the
integration progresses in order to take the bed shrinkage into account.
In actuality, it is possible to extend this method to two-dimensional (2-D), even
three-dimensional (3-D), models with a considerable amount of complexity added
into the numerical integration procedure. It is barely used in works found in the
literature, probably because the resulting complexity is not always justifi ed to attain
a precise simulator for industrial dryers.
52527_C012.indd 37752527_C012.indd 377 10/3/2008 4:11:17 PM10/3/2008 4:11:17 PM
© 2009 by Taylor & Francis Group, LLC

378 Advances in Food Dehydration
After having written the equations and solved them with an appropriate numerical
method on a computer, the user can obtain a lot of valuable information concerning
the process: moisture contents and temperatures for air and product at each zi � i�z.
Therefore, it is possible to compare some of the simulated variables with correspond-
ing measured values from air temperature or relative humidity sensors located at the
outlet or within the deep bed (e.g., see Techasena et al., 1992). Some problems usually
arise at this point. On the one hand, thin layer models are usually strongly validated
but only with regard to the overall grain moisture content, which is usually the only
reliable on-line measurement available. On the other hand, more reliable information
is available at the deep bed level (on the air, possibly at different locations within the
deep bed). Air temperature measurements within the bed are arguable because they
may correspond to the temperature of the mixture of air and solid. Similarly, on-line
measurements of the relative humidity of the air are often biased by the probe system
inertia. At least the outlet (used) air temperature just outside of the deep bed may be
considered as a reliable on-line measurement that can be used for comparison, and
thus validation, purposes. Techasena et al. (1992) and many other authors (e.g.,
Courtois, 1991) state that it is common to have good agreement between simulation
and experimental measurements only for the product moisture content but not for the
air temperature. As shown in Figure 12.8, even if the simulation correctly renders
20
30
40
50
60
70
80
90
100
0 1000 2000 3000 4000 5000 6000 7000 8000
Ta2 = f(t )
0.005
0.01
0.015
0.02
0.025
0.03
0.035
0 1000 2000 3000 4000 5000 6000 7000 8000
Y2 = f(t )
0
10
20
30
40
50
60
70
80
0 1000 2000 3000 4000 5000 6000 7000 8000
t (s) t (s)
t (s) t (s)
RH2 = f(t )
0.05
0.1
0.15
0.2
0.25
0.3
0 1000 2000 3000 4000 5000 6000 7000 8000
Xm = f(t )
FIGURE 12.8 Comparison of simulation and experiment for parboiled rice dried at 95°C,
ambient moisture content, and 2 m/s. For a small error in the simulation of the mean grain
moisture content (Xm), there are signifi cant differences in the outlet air temperature (Ta2) and
moisture content (Y2), and even more in the relative humidity (RH2) predicted trajectories.
52527_C012.indd 37852527_C012.indd 378 10/3/2008 4:11:17 PM10/3/2008 4:11:17 PM
© 2009 by Taylor & Francis Group, LLC

Dryer Modeling 379
the overall shape of the registered data curves, the fast dynamics of the air tempera-
ture change is not accounted correctly. There may be several reasons for that:
The heat and mass transfer coeffi cients obtained for the thin layer may •
no longer be valid when the particles are stacked with very different
aerodynamics.
The heat exchanges directly between particles or with the walls may not be •
as negligible as expected.
The ratio of air to solid densities shows that a very small error in the predic-•
tion of the heat and mass transfers leads to large errors in the change of air
temperature and moisture content.
12.3.2 FROM DEEP BED TO FULL DRYER
There are many dryers worldwide that can be considered to be a static deep bed.
In developing countries, for instance, many dryers are simply composed of a fi xed
bed of grains and a fan, sometimes coupled with a burner. Every time the weather
conditions allow it, the drying air can be solar heated.
Large-scale industrial dryers, especially grain dryers, are usually composed
of several stages, each of them an assembly of elementary sections. Each of these
elements is generally assumed to be composed of several deep beds. It is therefore
common to consider an industrial dryer as a network of deep bed dryers in which the
connections depend on the air trajectory, especially if there is some air-recycling
scheme.
For example, a multiple conveyor belt dryer (i.e., a succession of several single
conveyor belts with air recycling from one to another) can be considered as a collec-
tion of several deep beds with drying conditions depending on each other. Similarly,
grain dryers are huge vertical towers combining several deep beds with a complex
air trajectory designed to minimize energy loss.
There are basically fi ve types of elementary deep beds:
1. Cross-current deep beds where air and product trajectories have perpendi-
cular axes
2. Cocurrent deep beds where air and product trajectories have the same axes
and directions
3. Countercurrent deep beds where air and product trajectories have the same
axes but reverse directions
4. Tempering deep beds where there is no air fl ow and the product is main-
tained at the same temperature without drying
5. Mixing deep beds where all product particles are mixed to improve the bed
homogeneity
Three other types of beds corresponding to cooling should be added: cocurrent,
countercurrent, and cross-fl ow cooling beds. This distinction between cooling and
drying beds depends on the domain of validity of the thin layer drying model that is
used. In fact, many thin layer models are validated only for some particular drying
52527_C012.indd 37952527_C012.indd 379 10/3/2008 4:11:17 PM10/3/2008 4:11:17 PM
© 2009 by Taylor & Francis Group, LLC

380 Advances in Food Dehydration
conditions, for example, when the air temperature is higher than the product temper-
ature. Using such a model for simulating the behavior in the cooling sections is gen-
erally not a good idea because the complementary drying happening in these stages
will be signifi cantly underestimated.
Tempering sections are common in mixed-fl ow dryers for cereal grains. They
are supposed to allow, at no energy loss, a decrease in the internal moisture gradient
within the grain, leading to a subsequent higher drying rate in the next drying stage
(see Figure 12.9). There are several publications about the intermittent drying of rice.
From the product quality viewpoint, if considering the breakage of rice grains after
drying, tempering periods are of interest for reducing the strengths caused by mois-
ture gradients and involved in cracking and breakage. Conversely, when considering
the biochemical properties of a dried product, maintaining a product at high temper-
ature without drying is generally a bad idea (e.g., wet milling quality of corn in
Courtois, 1991). Furthermore, because a resting period has to be long enough to sig-
nifi cantly decrease moisture gradients, the building of an extra tempering zone is
synonymous with extra investment costs and loss in compactness.
Countercurrent sections are more diffi cult to simulate because calculating the
drying kinetics of a top-fi rst thin layer relies on the calculation of the air used for
drying the bottom-last thin layers. The usual method is to simulate such a deep bed
as if it was a cocurrent one and then to reinject simulated air temperatures and mois-
ture gradients within the bed to reiterate until reaching a steady state.
0.00000
0.00005
0.00010
0.00015
0.00020
0.00025
0.00030
0.00035
0 5000 10000 15000 20000 25000
–dX
/dt (
kg w
ater
/kg
dry
mat
ter/
s)
time (s)
4 h resting period at 62°C
FIGURE 12.9 Increase of drying rate after a 4-h resting period for corn at 62°C. (Data from
Courtois, F., Ph.D. thesis, AgroParisTech, Massy, France, 1991. With permission.)
52527_C012.indd 38052527_C012.indd 380 10/3/2008 4:11:17 PM10/3/2008 4:11:17 PM
© 2009 by Taylor & Francis Group, LLC

Dryer Modeling 381
There are mainly two types of grain dryers in the industry: cross-fl ow and mixed
fl ow. The former is comparable to a big cross-current deep bed. The latter is usually
considered as a vertical succession of alternative cocurrent and countercurrent deep
beds. Olesen (1987) studied the air fl ow between the air ducts in a mixed-fl ow grain
dryer and evaluated the air and grains exchanges as 32% cocurrents, 32% counter-
currents, and 36% cross-currents (in volumes of grains). These proportions may vary
according to the geometry of these air ducts and their distribution in the dryer vol-
ume. In practice, a vast majority of researchers consider that each physical deep bed
is of only one type. Giner et al. (1998) and Giner and Bruce (1998) considered that
the classical 1-D decomposition of the drier in cocurrent and countercurrent deep
beds underestimates the grain temperature near the air ducts and hence overesti-
mates the fi nal grain quality (here seed viability). They proposed a 2-D model where
co-, counter-, and cross-currents are coexisting. This conclusion is in contradiction
with results from Courtois et al. (1991) on corn wet milling quality and Courtois
et al. (2001) on the rice breakage ratio. This may mean that, depending on the quality
criterion used, the dynamics of the quality decrease may require a more precise
prediction of local grain temperature.
In some cases the volumes of the air ducts are subtracted from the total volume of
the bed, as demonstrated in Figure 12.10. The full-scale dryer can then be considered as
a pile of blocks of elementary deep beds linked by the specifi c air circulation (and
recycling) between each stage. Behind this scheme there are strong assumptions
concerning the evenness of air fl ows in each duct. Furthermore, the aerodynamics within
the dryer is supposed to distribute the air fl ows equally within each section, which is
almost never true in practice. The positive point is that, even if it is not true for local air-
fl ow rates, the global air-fl ow rate is generally known with good precision so that we can
expect automatic compensations between overestimates and underestimates. Actually,
Courtois et al. (2001) and others observed less than 10% error between simulated (1-D
model) and measured grain moisture content and quality in industrial dryers.
Continuing further with grain dryers, the decomposition into deep beds should
be completed by the right air trajectories connecting all beds. Actually, air recycling
patterns are common in mixed-fl ow dryers for obvious energy saving considerations.
The most common scheme is presented in Figure 12.11. Ambient air is used at the
GrainsGrains
Air inlet
Counter-currents
Concurrents
Grain flow Virtual air ducts
Air outletAir trajectory
Air inlet ducts
Air outlet ducts
FIGURE 12.10 Side view of an elementary drying section in a mixed-fl ow dryer. Virtual-
ization (from left to right) of air ducts within the grain bed. Here, the section is assumed to be
composed of either cocurrent or countercurrent deep beds.
52527_C012.indd 38152527_C012.indd 381 10/3/2008 4:11:17 PM10/3/2008 4:11:17 PM
© 2009 by Taylor & Francis Group, LLC

382 Advances in Food Dehydration
very bottom of the tower to cool the grain for safe storage. The removed sensible heat
is then used to reduce the energy needed for heating the air to the temperature set
point of the second drying stage (numbering starts from the top, i.e., the grain
entrance). Because the grain has already been partially dried in stage 1, the exhaust
air from stage 2 is not saturated and is still warm enough to be reheated to the
temperature set point of stage 1. At the end, exhaust air from stage 1, which is close
to saturation, is rejected outside. From a very superfi cial point of view, the global
exchange is of countercurrents. As explained for countercurrent deep beds, the
calculation is more complex because the drying kinetics at the top-fi rst beds depend
on the air outlet from bottom-last (at the bottom of the dryer) beds. An iterative
procedure is usually the best option to avoid an excessively long calculation.
There is an additional diffi culty in simulating the full-scale dryer: if burners are
used for air heating, we must pay attention to the additional water vapor coming
from the combustion of gas or fuel. However, in practice burners do not work contin-
uously. They are connected to temperature controllers so that the additional air
moisture content created varies with time.
Although there is no steady state at the product level in such a dryer, simulators
are usually restricted to the simulation of the global steady state of the operation.
The unsteady-state simulation will be discussed later in this chapter. Mixed-fl ow
dryers usually have a discontinuous extraction of grains at the bottom to ensure no
static dead volume in order to avoid fi re risks. This is due to the presence of the
FIGURE 12.11 Typical schematic of a three-stage mixed-fl ow dryer used for grain drying.
Air is recycled from bottom to top, and grain fl ows from top to bottom. Two burners are used
to control temperature set points at stages 1 and 2.
Stage #1Drying
Stage #2Drying
Stage #3Cooling
Grain
Burner #1
Burner #2
Dried grain
52527_C012.indd 38252527_C012.indd 382 10/3/2008 4:11:17 PM10/3/2008 4:11:17 PM
© 2009 by Taylor & Francis Group, LLC

Dryer Modeling 383
numerous air ducts that break the natural easy fl ow of grains by gravity. Each grain
discharge and extraction forces a nearly plug-type grain fl ow. A typical setting is
1-s extractions every 3 min. For some other types of grain dryers (e.g., cross-fl ow
dryers), where no air ducts are on the way of the grain fl ow, the discharge rate is a
continuous function. For the former case, at each extraction, the whole dryer content
(i.e., numerous thin layers) is shifted downward and the upper part is fi lled with thin
layers of grain at the initial state. In the latter case, this must be done at a higher
frequency calculated from the time needed to extract one full elementary thin layer.
Therefore, for the same equations (thin layer and deep bed), there are many options
when computing the algorithm for linking them with respect to the discharge rate.
Commercial software for simulating such dryers is available (e.g., DRYER3000,
http://www.drying.org). A (specifi c) dryer simulator can be very helpful to calculate
some interesting ratios:
Final product temperature (should be compatible with safe storage)•
Final grain moisture gradients within each discharged quantity (the less the •
better for safe storage)
Final grain quality (see discussion later in this chapter)•
Total heat power used for temperature control (e.g., necessary for the dimen-•
sioning of the burners)
Energy cost of each kilogram of water evaporated from the product (to be •
compared to the thermodynamic constant Lv)
Volume effi ciency of the dryer in kilograms of evaporated water per second •
and per cubic meter of dryer (the higher the better for a more compact dryer)
Percentage of unused dryer volume due to air having reached saturation •
(the higher the better)
Average level of saturation of exhaust air rejected by the dryer (the higher •
the better for more effi cient energy savings)
12.3.3 OTHER APPROACHES
12.3.3.1 Use of Computational Fluid Dynamics (CFD) in Drying Simulation
The CFD approach has enabled progress in understanding the circulation of gazes
around products, in predicting changes in the product, and therefore in improving
the design of dryers.
Modeling of drying can also be used for analyzing fl ows at the dryer level. Thanks
to the rapid increase in the calculation power of computers and to the development of
commercial codes, CFD techniques are increasingly used in the fi eld of food drying.
Such codes can solve problems of the fl ow of uncompressible and compressible fl uids
via heat and mass transfer and turbulence phenomena. Many research groups used
CFD techniques for spray dryers (Ducept et al., 2001; Straatsma et al., 1999a). They
allow the simulations of 2-D or 3-D gas fl ows, calculating the particle trajectories
throughout the dryer and calculating the drying kinetics of the atomized droplets,
which are infl uenced by both internal and external transport phenomena. The direct
results of a CFD calculation are particle size distributions (from interparticle collision
52527_C012.indd 38352527_C012.indd 383 10/3/2008 4:11:17 PM10/3/2008 4:11:17 PM
© 2009 by Taylor & Francis Group, LLC

384 Advances in Food Dehydration
and agglomeration calculations), drying states, and related material properties.
Blei and Sommerfeld (2007) provide the results of a good study on the use of CFD
for simulating spray dryers. They are effective tools in giving indications on how to
adapt industrial dryers to attain better product quality or reduce fouling problems
(change in process conditions, change in shape of the drying chamber, choice of
another atomization position or nozzle). However, the degree of physical detail
that has to be described and incorporated in such a model is rather high, as is the
computational effort.
CFD techniques can also be used for calculating the fi elds of air velocities
and controlling the homogeneity of drying. Many applications can be found in the
literature. Anglerot et al. (2001) used them for calculating air fl ows in a convective
rack dryer and for eliminating air recirculation. Marchal (2001) employed CFD for
piloting an industrial dryer combining convective and radiative heat transfers and for
adapting radiative fl ux in order to consider the constraints from the nature of the
product. Mirade (2001) utilized this technique for piloting air fl ows in sausage
cabinet dryers and for obtaining good surface drying of the product, which is known
for piloting the internal process of fermentation. Pajonk (2001) used CFD for
calculating air fl ows in a refrigerated cheese maturing cabinet.
12.3.3.2 Simulation of Drum Dryers
Drum dryers have high drying rates and high energy effi ciencies, and they are suit-
able for slurries in which the particles are too large for spray drying. Hence, drum
drying is used to produce potato fl akes, precooked cereals, molasses, some dried
soups and fruit purees, and so forth. Actually, it is the only process to produce fl akes
in the industry. However, the high investment cost of the machined drums and threat
for heat damage to sensitive foods caused by high drum temperatures have caused a
move to spray drying for many bulk dried foods.
Slowly rotating hollow steel drums are heated internally by pressurized steam
at 120 to 170°C. A thin layer of food is spread uniformly over the outer surface by
dipping, spraying, or spreading or by auxiliary feed rollers. Before the drum has
completed one revolution (usually within 20 s to 3 min, sometimes �20 s), the dried
food is scraped off by a cutting blade contacting the drum surface uniformly along its
length (Figure 12.12).
To simulate such a drying process, most groups (Abchir, 1988; Kozempel et al.,
1986, 1995; Trystram, 1985; Vasseur, 1983) use some common simplifying
assumptions:
A drum rotation cycle is composed of two elementary phases (Figure 12.13): •
deposit, drying, and removal of product, and then heat accumulation.
The product behaves as an infi nite slab, receiving heat by conduction from •
internal condensation of vapor.
Convection and radiation exchanges between the product or drum wall and •
air are neglected compared to conduction with the drum wall.
The product is thin enough to neglect any moisture and temperature gradi-•
ents along the axis perpendicular to the product layer.
52527_C012.indd 38452527_C012.indd 384 10/3/2008 4:11:17 PM10/3/2008 4:11:17 PM
© 2009 by Taylor & Francis Group, LLC

Dryer Modeling 385
The product temperature is equal to the drum surface temperature.•
No border effects along the cylinder axis are taken into consideration.•
The product is placed on the drum surface at approximately 100°C (con-•
fi rmed by measurements) and warming of the product can be neglected.
The product is supposed to dry at the pure water boiling temperature (this •
can be relaxed) and hence evaporative fl ow is proportional to the heat fl ow
between the drum wall and product.
Finally, the heat fl ow from the drum wall to the product is modeled with
an empirical equation related to its temperature, water load (kg water/m2 drum
wall), and dry matter load. The equation contains three to six unknown para-
meters to identify from experimental runs. As a recent example, Karapantsios
(2006) used such equations derived from the work of Trystram and Vasseur
FIGURE 12.12 A detailed view of the “bourbier” between the drum and its feed roller (pilot
plant, AgroParisTech, Massy).
Supply
Sup
ply
Sup
ply
2
2
1
1 21
Blade
Bla
de
Bla
de
FIGURE 12.13 The two main phases in the drum rotation cycle.
52527_C012.indd 38552527_C012.indd 385 10/3/2008 4:11:17 PM10/3/2008 4:11:17 PM
© 2009 by Taylor & Francis Group, LLC

386 Advances in Food Dehydration
(1992) to describe the amount of heat (kW/m2) used for drum drying of thin fi lms
of pregelatinized starch:
Fh(t) � b1 (Ts(t) � 100)b2 ( 1 __ C
) b3
(1 � eX(t)/b4)b5 (12.13)
where Ts is the temperature at the outer surface of the drum wall (i.e., it is also the
product temperature); C is the so-called “specifi c load” (kg dry matter/m2, a quantity
remaining constant during drying); X(t) is the instantaneous moisture content of
the fi lm (kg water/kg dry matter); and b1, b2, . . . , b5 are parameters that must be
identifi ed in order to best-fi t the experimental data. Such an equation can be under-
stood as the heat fl ow formulation of the classical thin layer equations described in
Section 12.1.1.
Most simulators described in the literature solve this model numerically with
fi nite difference schemes as described in Figure 12.14. There are basically two axes:
the x axis along the path followed by the product fi lm during its rotation (steps i in
Figure 12.14) and the y axis perpendicular to the x axis (steps j in Figure 12.14) where
the temperature gradient within the steel wall is discretized.
To our knowledge, there is no commercial simulator available for food drum
dryers. The available software remains confi ned to very few research laboratories.
12.4 IMPORTANT ISSUES
12.4.1 DYNAMIC VERSUS STEADY STATE
Most process simulators (including dryer simulators) use steady-state assumptions.
As far as we know, they do no dynamic simulations. There are few articles available
on the process control of dryers, even less for food dryers.
At a higher scale, dryer simulators, probably like most process simulators,
predict only the steady states of dryers. This means that they are unusable for process
control, for instance (see later in this chapter). However, when getting into detail,
down to the elementary particle level, the core of the simulator model may not be
Removal (blade)i = blpos
Application of the producti = 0 and i = i_end – 1
Productj = j_end – 1
i = i_
end
– 2
i i + 1
i = 0
, i =
i –en
d –
1
j + 1
j – 1
j = 0
jSteel
Steam
FIGURE 12.14 Discretization scheme of the drum.
52527_C012.indd 38652527_C012.indd 386 10/3/2008 4:11:18 PM10/3/2008 4:11:18 PM
© 2009 by Taylor & Francis Group, LLC

Dryer Modeling 387
compatible with any transient period of drying. For example, the moisture ratio as
defi ned in Eq. (12.2) is incompatible with dynamic modeling because it includes
references to both the initial moisture content and an equilibrium value. Fohr et al.
(1988) demonstrated that a drying model relying on the moisture ratio, although
validated for drying kinetics under constant drying conditions, will not work on
kinetics with sharp changes in the drying conditions (e.g., see Figure 12.9). As stated
earlier, most industrial dryers cannot be considered as drying under constant condi-
tions. Hence, most empirical drying models (at least those relying on the moisture
ratio) are incompatible with a valid simulation of a full-scale dryer.
12.4.2 IDENTIFICATION AND VALIDATION
There are insuffi cient available data on food properties to allow direct simulation of
the drying kinetics. In the process of modeling, apart from the equations and some
specifi c properties of the material, some unknown parameters always remain that
have to be fi tted to the experimental data.
In the common sense, “modeling” is understood as writing the equations describ-
ing all of the thermodynamics of the system undergoing drying. In practice, it is only
half of the job. The subsequent “identifi cation” of all necessary parameters consti-
tutes the other half.
Concerning the interfacial transfer coeffi cients, note that they always appear in
balance equations coupled with the product external surface area (in contact with the
drying medium). If the latter is not constant during drying, there is a chance that it is
not known with enough precision to enable a precise simulation. Every time the
product shrinks, its surface geometry may change in a complex way. For instance,
macroscopic estimations of the product surface are not reliable enough to describe
complex roughness changes. In such cases, it is useful to group the more or less
known transfer coeffi cient with the unknown surface area to build an apparent
coeffi cient to fi t the experimental data.
Carrying this reasoning to its limits, we would transfer the heavy task of the
laboratory measurement of product properties to a higher level of numerical identifi -
cation of too many unknown coeffi cients. However, we highly recommend limiting
the identifi cation only to those parameters that really cannot be determined with
laboratory instruments with a satisfactory level of confi dence. For example, product
heat capacity, density, volume, water activity, and so forth should be measured
whereas internal diffusion coeffi cients should be identifi ed throughout some curve-
fi tting algorithm.
Numerical identifi cation of unknown parameters is a well-known, yet diffi cult,
problem. There are numerous articles and books concerning the identifi cation of
linear parameter models, especially in control sciences. Much less information is
available concerning dynamic models that have nonlinear parameters. Prior to any
identifi cation, we should check the theoretical feasibility of such a computation. For
instance, it is impossible to distinctly identify the heat transfer coeffi cient and the
product surface area because they are always coupled in the model equations. Precise
checking of the structural identifi ability of nonlinear models requires fastidious
manipulations of the symbolic expressions in the model. Symbolic mathematical
52527_C012.indd 38752527_C012.indd 387 10/3/2008 4:11:18 PM10/3/2008 4:11:18 PM
© 2009 by Taylor & Francis Group, LLC

388 Advances in Food Dehydration
packages (e.g., Maple®, Mathematica®, Maxima®, etc.) may be of some help, although
they do not guarantee convergence in all cases. Under some simplifying assump-
tions, it is possible to fi nd approximate answers using linearization techniques or a
Taylor series expansion (Rodriguez-Fernandez et al., 2007). Because of the high
level of complexity of the exact structural identifi ability test and the limited validity
of the approximate approaches, most published works skip this step and go directly
to the identifi cation itself.
Because of nonlinearities in the parameters, the identifi cation procedure implies
the use of a nonlinear optimization algorithm. Common choices are simplex (also
known as Nelder and Mead), Levenberg–Marquardt, Broyden–Fletcher–Goldfarb–
Shanno, and so forth. Using software like Matlab, Scilab, and Octave can simplify
the extra programming needed. As opposed to linear curve fi tting, obtaining confi -
dence intervals for the parameters is not straightforward. This can explain why so
many articles do not give this information. This is somehow unfortunate because
large confi dence intervals will inform of potential identifi ability (structural or
practical) problems. Moreover, the identifi cation procedure is less limited by mathe-
matical or software diffi culties than by poor experimental data.
In a classical approach, unknown transfer coeffi cients are fi tted using thin layer
drying kinetics in constant conditions over an expected domain of validity. Depending
on the industry needs, drying conditions (temperature mostly, plus eventually rela-
tive humidity and velocity) are varied between each experiment. The resulting
experimental data obtained are then split in two subsets: one for the identifi cation
itself, and the rest for the validation. Fohr et al. (1988) discussed that it is generally a
good idea to add kinetics obtained with varying drying conditions in the second
subset to improve the validation. In the fi eld of food drying, there is no practical
explanation of how the drying experiments could be designed to minimize both the
confi dence intervals and the total experimental time.
We emphasize that an interesting consequence of avoiding black box models
and limiting the number of parameters to be identifi ed is the ability to keep the
same model for several product varieties. For instance, Courtois et al. (2004)
demonstrated that the same model could be used for two totally different kinds of
rice grains just by updating the product properties; there was no need for a second
identifi cation.
Model validation is the fi nal step of modeling. Depending on the choice of model
equations and experimental data in the training and validation subsets, the model
may or may not be robust in a wide range of conditions. In fact, it is very common to
see models validated over a narrow range of temperatures (e.g., from 20 to 50°C).
In a similar manner, most models cannot correctly simulate the drying rate during
cooling. It is also quite uncommon to discuss the residuals (i.e., the part of the data
that remains unexplained by the simulation), although they contain some informa-
tion about the model validity. If the model is perfect, the residuals should be distrib-
uted as a normal law (white noise). In practice, only visual agreement between the
simulated and experimental kinetics are used, in conjunction with some accounting
of mean errors between simulations and experimental data. As an illustration,
DRYER3000 claims to simulate the fi nal grain moisture content in an industrial
mixed-fl ow dryer with an error of �5%.
52527_C012.indd 38852527_C012.indd 388 10/3/2008 4:11:18 PM10/3/2008 4:11:18 PM
© 2009 by Taylor & Francis Group, LLC

Dryer Modeling 389
Thus, the question is, what would be a good criterion to measure the goodness of
fi t of the model over the data? The common answer is the absolute or relative error
observed in the prediction of the product moisture content. It is the only criterion that
is used in practice. The error concerning the product temperature is not used because
of the numerous biases and problems concerning the measurement. Reverse engineer-
ing might be of interest to try to identify the transfer coeffi cients directly from deep
bed experiments using, in addition to the classical moisture content, the errors between
simulations and experiments for the output air temperature and relative humidity.
12.5 APPLICATIONS OF DRYING MODELS
12.5.1 COUPLING WITH A QUALITY MODEL
The quality of dried products is of prime importance for consumers and food manu-
facturers. This notion of quality covers various concepts for food products: appear-
ance (color, gloss, shape, and natural aspect), taste (aroma, texture), convenience
of use (rapidity of rehydration or dissolution, consistency of apparent density for
constant delivery quantities, no stickiness), composition and nutritional characteristics
(vitamin content in fruits, furosine content in pasta, protein degradation, etc.),
microbial innocuousness, and so forth. Quality is also very important for many
agroproducts like grains or seeds, for which the mechanical resistance (e.g., head
grain yield), biochemical composition (wheat gluten content for breadmaking, ability
of starch or protein separation in corn), or germination potential have to be preserved
by drying for further use.
The physicochemical phenomena responsible for the quality changes depend
mainly on the dryer design and on control of the drying operating conditions
(process parameters and product residence time distribution). In fact, reactions rates
are time–temperature dependent and very sensitive to water activity. Depending on
the nature, structure, and size of the product (solid, paste, liquid), different drying
processes are used with various drying times (seconds to hours) and consequences
in the evolution of the product during drying. The environmental drying conditions
(temperature, relative humidity of the air) also result in creating more or less intense
moisture and temperature gradients during drying. The gradients of water concen-
tration provoke differential shrinkage and induce mechanical stresses that can lead
to cracks or breakage, and therefore often a loss of quality and economic value.
Case hardening is also a common problem in dried bioproducts that is attributable
to rapid drying, and phenomena like the glass transition or crystallization can
be observed.
It is therefore important to develop combined modeling approaches of drying
that integrate a simulation of the chemical and biochemical reactions and/or the
stress-induced cracks to assess the quality parameters. Such simulation tools are
necessary to obtain acceptable, even improved, quality and a high production capac-
ity. However, the diffi culty is that the defi nition of the desired fi nal quality is often a
multidimensional problem, involving complicated reactions and transformations, for
which a target function must be defi ned. Most of the time the initial state of the
product is variable, and this variability must also be taken into account.
52527_C012.indd 38952527_C012.indd 389 10/3/2008 4:11:18 PM10/3/2008 4:11:18 PM
© 2009 by Taylor & Francis Group, LLC

390 Advances in Food Dehydration
The optimization of processing conditions can be helped by such mathematical
modeling and lead to a dynamic prediction of the quality of the product being dried.
Different kinds of models have been developed:
n• th-Order reaction equations (Abud-Archila et al., 2000; Beke et al., 1993;
Bruce, 1992; Courtois et al., 1991; Migliori et al., 2005; Nellist, 1981;
Straatsma et al., 1999b)
NNs (Rocha Mier, 1993; Trelea et al., 1997a)•
Fuzzy logic (Perrot et al., 1998; Zhang and Lichtfi eld, 1990)•
Mechanical description of tensile stress profi les using fi nite elements •
(Lichtfi eld and Okos, 1998; Peczalski et al., 1996; Ponsart, 2002)
For the three fi rst types of models, the purpose is to express the time derivative
of a quality index as a function of the moisture content (average moisture content or
gradient of moisture content for mechanical properties) and temperature in order
to calculate it during drying by integrating through the changing product moisture
contents and temperatures. The quality model is used as a module of the drying
simulation model.
Reaction equations of the nth order have been widely used to give the variations
of the concentration of a sensitive component or the variations of a quality index (Q)
with time:
dQ
___ dt
� �kQ Qn (12.14)
with a constant of reaction kQ usually depending on X and n generally equal to
0, 1, or 2. An Arrhenius law is frequently used to describe the temperature (T)
dependence:
kQ � k0 [X, . . . ,] exp ( � Ea ___ RT
) (12.15)
where Ea is the pseudoactivation energy and R is the perfect gas constant.
In most cases, the rate of variation of the quality index can be assessed in experi-
mental tests under constant conditions at different temperatures and for different
water activities (sealed heating experiments) and then used for calculating the cumu-
lative damage in a drying model. It has been used for very different types of quality
indexes. Courtois et al. (1991), Migliori et al. (2005), Nellist (1981), and Straatsma
et al. (1999b) applied this procedure for predicting the loss of wheat seed viability,
loss of corn wet milling quality, and the insolubility index of milk powder or furosine
production in pasta, respectively.
When quality is not dependent on the temperature and moisture content only,
such tests cannot be applied. Bruce (1992) and Abud-Archila et al. (2000) measured
the variations of a quality index directly by sampling and analyzing products during
thin layer drying experiments. In the fi rst study, the relative loaf volumes were
measured for loaves baked from wheat samples dried in thin layers for various times
and they were described using a fi rst-order process and a constant of the reaction
52527_C012.indd 39052527_C012.indd 390 10/3/2008 4:11:18 PM10/3/2008 4:11:18 PM
© 2009 by Taylor & Francis Group, LLC

Dryer Modeling 391
function of the moisture content of the kernels. In the second study, the head rice
yield after milling was modeled by an analogy with a second-order chemical reac-
tion. Qualitative analysis of the experimental results as a function of the drying con-
ditions suggested that there was a very close relationship between the moisture
content gradient and the processing quality. An Arrhenius-type expression was used
to describe the effect of the kernel temperature (Tk):
dQ
___ dt
� �kQ2 with k � 5.71 1026�X5 exp ( �1.657 105
____________ R(Tk � 273.1)
) (12.16)
There are numerous studies on the impact of drying parameters on quality
attributes, but few published articles deal with the validation of such models on the
industrial scale, imposing variable conditions in separated zones during the treat-
ment (Courtois, 1995; Courtois et al., 2001; Migliori et al., 2005). However, such
models can be used in dryer design for optimization of process parameters or for
control. For example, Courtois (1991) designed a control algorithm taking the milling
quality of dried corn into account according to the potentialities of the dynamic
model used to simulate the unsteady-state behavior of the dryer. This control
algorithm was validated on the industrial scale.
The prediction of the mechanical behavior of a solid during drying is more
complex. Heat and moisture gradients induce differential shrinkage, so strain and
stress in the product and stress cracking can appear. However, the rheological
behavior of the solid in turn impacts the mass transport inside the product. To predict
this it is necessary to simultaneously model the evolution of the local variables inside
the product during the drying process, such as the water content, temperature, defor-
mation, and drying-induced stress. For elastic products, the infl uence of the rheology
on heat and mass transport can be taken into account (Jomaa and Puiggali, 1991;
Mrani et al., 1995). For viscoelastic products, solving the coupling is very complex
and the infl uence of strains and stresses on internal transport must generally be
neglected in order to describe the interactions between the process conditions and
crack formation in the product.
In all cases, the stress must be calculated by using an experimental behavior law
linking stress to strain, depending on both the moisture and temperature. However,
at the temperatures reached by the products during drying, very few data on the
Young’s modulus and tensile and compressive strengths as a function of the strain
rate and moisture content are available in the literature for food materials.
12.5.2 ON-LINE USES OF DRYER MODELS
As mentioned previously, there are very few articles describing drying models,
including a quality equation and validated on the industrial scale. In fact, there are
even fewer articles describing (a) how to set up a real-time automatic control of an
industrial dryer or (b) how to get an estimate of the product moisture content at the
outlet from indirect measurements such as exhaust air temperatures. Dufour (2006)
provided some statistics about publications concerning the control of dryers. He
reported that recently there were about 4 to 10 new articles/year in that area with
52527_C012.indd 39152527_C012.indd 391 10/3/2008 4:11:19 PM10/3/2008 4:11:19 PM
© 2009 by Taylor & Francis Group, LLC

392 Advances in Food Dehydration
approximately 66% of them concerning food, but there were only 0 to 2 new
articles 20 years ago. Obviously, this is not an active research topic. Most of
these works made limited use of the dryer model to help design and test the control
strategy (Eltigani and Bakker-Arkema, 1987; McFarlane and Bruce, 1991). In
many cases, the control law was a variant of a classical proportional–integral–
derivative controller. Among the improvements over the generic control law, we
emphasize the simple linearization technique detailed in Whitfi eld (1988a, b),
which was used in several works: using the logarithm of the product moisture
content and a sampling time proportional to the residence time is practically a
necessity for linear control.
Trelea et al. (1997b) developed optimization techniques combined with a predic-
tion model to attain nonlinear model based predictive control. Two models, one for
the prediction of the product moisture content and the other for the product wet
milling quality, are used in an optimization scheme to compute the best air tempera-
ture profi le satisfying one objective and three constraints (Figure 12.15):
Minimal energy or drying time or any combination•
Air temperature within specifi ed boundaries•
Final product moisture content below the related set point•
Final product quality above the related set point•
The interesting point in this work is in the generic approach. The authors suc-
cessfully applied a similar method to a batch refrigeration process.
Olmos et al. (2002) performed a similar study on the batch drying of rice and its
breakage ratio as the quality index.
Air temperature
Quality index
Moisture content
XwQTa
Time
Minimal value for Q
Constraint on Xw
End of drying
FIGURE 12.15 Optimization of maize drying with respect to a minimal value for the quality
index and a maximal value for the moisture content. (From Trelea, I.C. et al., J. Food Eng., 31,
403–421, 1997b. With permission.)
52527_C012.indd 39252527_C012.indd 392 10/3/2008 4:11:19 PM10/3/2008 4:11:19 PM
© 2009 by Taylor & Francis Group, LLC

Dryer Modeling 393
Concerning how to get an estimate of the product moisture content at the outlet
from indirect measurements such as exhaust air temperatures, a well-known problem
in automatic control is building up a state observer for a highly nonlinear system.
Unfortunately, generic solutions are not available and it remains an open fi eld for
research. Some authors have tried, sometimes with success, to control the product
moisture content indirectly by measuring the fi nal exhaust air temperature (at the
very end of the dryer). In most cases, depending on the drying scheme, the relation
between the product moisture content and exhaust air temperature is not monoto-
nous. Hence, there is no guarantee that good control of the temperature implies good
control of the product moisture content.
12.6 CONCLUSION
There are many models available to simulate and hence predict the performance of
food dryers. Unfortunately, each model is available only for a limited number of
products and a limited domain of validity in the best case. Furthermore, a model is
not exactly a simulator. There are only a few simulators available for very specifi c
problems. None of them can be compared to what is found in the chemical engineer-
ing area. There are a few works in progress that are trying to make the modeling of
the drying methodology more generic. In contrast, with the increasing price of
energy, the optimization of dryers again becomes an important issue. Hence, we can
probably expect numerous studies to come from the research laboratories, which
will soon be transferred into useful tools for food engineers.
NOMENCLATURE
VARIABLES
a surface to volume ratio (/m)
b1, b2, . . . , b5 drum drier equation parameters
C specifi c load on the drum (kg dry matter/m2)
cpa heat capacity of product (J/kg/K)
dp diameter of the dried material (m)
Ea pseudoactivation energy in Arrhenius law (J/mol)
f relative drying rate
H bed total height (m)
IoS index of saturation (empirical ratio)
kd drying constant (/s)
Lv latent heat of water evaporation (J/kg)
MR reduced moisture content
n, k, kQ, k0, k1, k2, k3, c1, c2, c3 empirical coeffi cients
N drying rate (kg water/kg dry matter/s)
Nc drying rate in constant rate period
pvs saturated vapor pressure (Pa)
pvg vapor pressure in bulk gas (Pa)
Q product quality
52527_C012.indd 39352527_C012.indd 393 10/3/2008 4:11:19 PM10/3/2008 4:11:19 PM
© 2009 by Taylor & Francis Group, LLC

394 Advances in Food Dehydration
R perfect gas constant (J/mol/K)
RH air relative humidity (%)
S section surface (m2)
t time (s)
T temperature (°C)
Ta air temperature (°C)
Tk kernel temperature (°C)
Ts temperature at the outer surface of the drum wall (°C)
Twb wet bulb temperature (°C)
va air velocity (m/s)
X product moisture content (kg water/kg dry matter)
X0 initial product moisture content (kg water/kg dry matter)
Xcr critical moisture content (kg water/kg dry matter)
__
X , Xm product average moisture content (kg water/kg dry matter)
Xe product equilibrium moisture content (kg water/kg dry matter)
Y air moisture content (kg vapor/kg dry air)
z bed height (m)
GREEK LETTERS
b external mass transfer coeffi cient (kg/m2/Pa/s)
e deep bed porosity
f dimensionless characteristic moisture content
�h thermal fl ow density between air and product (W/m2)
�w water fl ow density between air and product (kg water/s/m2)
j air-fl ow rate (kg dry air/s)
jw evaporation rate (kg water/s)
ra air density (kg/m3)
rda dry air density (kg/m3)
rdm dry matter density (kg/m3)
ABBREVIATIONS
CDC characteristic drying curve
CFD computational fl uid dynamics
NN neural network
w.b. wet basis
d.b. dry basis
REFERENCES
Abchir, F., Modélisation du séchage sur cylindre, Ph.D. thesis, AgroParisTech, Massy, France,
1988.
Abud-Archila, M., Courtois, F., Bonazzi, C., and Bimbenet, J.J., Processing quality of rough
rice during drying—Modeling of head rice yield versus moisture gradients and kernel
temperature, J. Food Technol., 45, 161–169, 2000.
Adomian, G., Fundamental Theories of Physics. Solving Frontier Problems of Physics: The Decomposition Method, Vol. 60, Kluwer Academic, Dordrecht, 1996.
52527_C012.indd 39452527_C012.indd 394 10/3/2008 4:11:19 PM10/3/2008 4:11:19 PM
© 2009 by Taylor & Francis Group, LLC

Dryer Modeling 395
Akpinar, E.K., Mathematical modeling of thin layer drying process under open sun of some
aromatic plants, J. Food Eng., 77, 864–870, 2006.
Anglerot, D., Couture, F., and Roques, M., Optimisation des écoulements dans un séchoir à
claies à l’aide de FLUENT, in Cahiers de l’AFSIA 19—Compte Rendu des 19èmes Journées de l’AFSIA, 22–23 mars, Poitiers, France, AFSIA-EFCPE, Villeurbanne,
2001, pp. 69–79.
Aregba, A.W., Sebastian, P., and Nadeau, J.-P., Stationary deep-bed drying: A comparative
study between a logarithmic model and a non-equilibrium model, J. Food Eng., 77,
27–40, 2006.
Baini, R. and Langrish, T.A.G., Choosing an appropriate drying model for intermittent and
continuous drying of bananas, J. Food Eng., 79, 330–343, 2007.
Bala, B.K., Ashraf, M.A., Uddin, M.A., and Janjai, S., Experimental and neural network
prediction of the performance of a solar tunnel drier for drying jackfruit bulbs and
leather, J. Food Proc. Eng., 28, 552–566, 2005.
Beke, J., Vas, A., and Mujumdar, A., Impact of process parameters on the nutritional value of
convectively dried grains, Dry. Technol., 11, 1415–1428, 1993.
Berger, D. and Pei, D.C.T., Drying of hygroscopic capillary porous solids, a theoretical
approach, Int. J. Heat Mass Transfer, 16, 293–302, 1973.
Blei, S. and Sommerfeld, M., CFD in drying technology—Spray-dryer simulation, in Modern Drying Technology. Computational Tools at Different Scales, Tsotsas, E. and Mujumdar,
A.S., Eds., Wiley–VCH Verlag GmbH & Co. KGaA, Weinheim, 2007, pp. 155–208.
Brooker, D.B., Bakker-Arkema, F.W., and Hall, C.W., Drying Cereal Grains, AVI Publishing
Company, Westport, CT, 1974.
Bruce, D.M., A simulation of multi-bed, concurrent-fl ow and counter-fl ow grain driers. Part
1: The model, National Institute of Agricultural Engineering, Silsoe, U.K., 1983, paper
DN.1171.
Bruce, D.M., A model of the effect of heated-air drying on the bread baking quality of wheat,
J. Agric. Eng. Res., 52, 53–76, 1992.
Celma, A.R., Rojas, S., Lopez, F., Montero, I., and Miranda, T., Thin-layer drying behaviour
of sludge of olive oil extraction, J. Food Eng., 80, 1261–1271, 2007.
Courtois, F., Dynamic modeling of drying to improve processing quality of grain, Ph.D.
thesis, AgroParisTech, Massy, France, http://francis.courtois.free.fr, 1991.
Courtois, F., Computer-aided design of corn dryers with quality prediction, Dry. Technol., 13,
147–164, 1995.
Courtois, F., Abud Archila, M., Bonazzi, C., Meot, J.M., and Trystram, G., Modeling and
control of a mixed-fl ow rice dryer with emphasis on breakage quality, J. Food Eng., 49, 303–309, 2001.
Courtois, F., Khoshhal, M., Matthieu, O., and Lalanne, V., Simulation of deep bed dryers:
Application to the drying of rice in Iran, in ICEF9, International Congress on Engineering and Food, Montpellier, France, March 7–11, 2004 (CD).
Courtois, F., Lebert, A., Duquenoy, A., Lasseran, J.C., and Bimbenet, J.J., Modeling of drying
in order to improve processing quality of maize, Dry. Technol., 9, 927–945, 1991.
Datta, A.K., Porous media approaches to studying simultaneous heat and mass transfer in
food processes. I: Process formulations, J. Food Eng., 80, 80–95, 2007a.
Datta, A.K., Porous media approaches to studying simultaneous heat and mass transfer in food
processes. II: Property data and representative results, J. Food Eng., 80, 96–110, 2007b.
Ducept, F., Sionneau, M., and Vasseur, J., Séchage par pulvérisation en vapeur d’eau
surchauffée: Modélisation CFD et validation expérimentale, in Cahiers de l’AFSIA 19—Compte Rendu des 19èmes Journées de l’AFSIA, 22–23 mars, Poitiers, France,
AFSIA-EFCPE, Villeurbanne, 2001, pp. 81–90.
Dufour, P., Control engineering in drying technology: Review and trends, Dry. Technol., 24,
889–904, 2006.
52527_C012.indd 39552527_C012.indd 395 10/3/2008 4:11:19 PM10/3/2008 4:11:19 PM
© 2009 by Taylor & Francis Group, LLC

396 Advances in Food Dehydration
Eltigani, A.Y. and Bakker-Arkema, F.W., Automatic control of commercial crossfl ow grain
dryers, Dry. Technol., 5, 561–575, 1987.
Fohr, J.P., Arnaud, G., Ali Mohamed, A., and Ben Moussa, H., Validity of drying kinetics, in
Proceedings of the Sixth International Drying Symposium (IDS’88), Vol. 1, Versailles,
France, September 5–8, 1988, OP151–OP157.
Fornell, A., Le séchage de produits biologiques par l’air chaud—Calcul de séchoirs, Ph.D.
thesis, AgroParisTech, Massy, France, 1979.
Fyhr, C. and Kemp, I.C., Comparison of different drying kinetics models for single particles,
Dry. Technol., 16, 1339–1369, 1998.
Giner, S.A. and Bruce, D.M., Two-dimensional simulation model of steady-state mixed-fl ow
grain drying. Part 2: Experimental validation, J. Agric. Eng. Res., 71, 55–66, 1998.
Giner, S.A., Bruce, D.M., and Mortimore, S., Two-dimensional simulation model of steady-
state mixed-fl ow grain drying. Part 1: The model, J. Agric. Eng. Res., 71, 37–50, 1998.
Henderson, S.M. and Pabis, S., Grain drying theory. I: Temperature effect on drying coeffi -
cient, J. Agric. Eng. Res., 6, 169–174, 1961.
Huang, B. and Mujumdar, A.S., Use of neural network to predict industrial dryer perfor-
mance, Dry. Technol., 11, 525–541, 1993.
Jannot, Y., Talla, A., Nganhou, J., and Puiggali, J.R., Modeling of banana convective drying by
the drying characteristic curve (DCC) method, Dry. Technol., 22, 1949–1956, 2004.
Jayas, D.S., Cenkowski, S., Pabis, S., and Muir, W.E., Review of thin-layer drying and wetting
equations, Dry. Technol., 9, 551–588, 1991.
Jomaa, W. and Puiggali, J.R., Drying of shrinking materials: Modelling with shrinkage
velocity, Dry. Technol., 9, 1271–1293, 1991.
Karapantsios, T.D., Conductive drying kinetics of pregelatinized starch thin fi lms, J. Food Eng., 76, 477–489, 2006.
Karathanos, V.T., Determination of water content of dried fruits by drying kinetics, J. Food Eng., 39, 337–344, 1999.
Keey, R.B. and Suzuki, M., On the characteristic drying curve, Int. J. Heat Mass Transfer, 17,
1455–1464, 1974.
Kiranoudis, C.T., Tsami, E., Maroulis, Z.B., and Marinos-Kouris, D., Drying kinetics of
some fruits, Dry. Technol., 15, 1399–1418, 1997.
Kozempel, M.F., Sullivan, J.F., Craig, J.C., Heiland, W.K., Jr., and Heiland, W.K., Drum drying
potato fl akes—A predictive model, Lebensm.-Wiss. Technol., 19, 193–197, 1986.
Kozempel, M.F., Tomasula, P., and Craig, J.C., Jr., The development of the ERRC food process
simulator, Simul. Practice Theory, 2, 221–236, 1995.
Langrish, T.A.G. and Kockel, T.K., The assessment of a characteristic drying curve for
milk powder for use in computational fl uid dynamics modeling, Chem. Eng. J., 84,
69–74, 2001.
Lewis, W.K., The rate of drying of solid materials, J. Ind. Eng. Chem., 13, 427–432, 1921.
Lichtfi eld, J.B. and Okos, M.R., Prediction of corn kernel stress and breakage induced by
drying, tempering and cooling, Trans. ASAE, 31, 585–594, 1998.
Marchal, D., Simulation du rayonnement dans les fours infrarouge au moyen de codes CFD,
in Cahiers de l’AFSIA 19—Compte Rendu des 19èmes Journées de l’AFSIA, 22–23
mars, Poitiers, France, AFSIA-EFCPE, Villeurbanne, 2001, pp. 107–116.
Martynenko, A.I. and Yang, S.X., Biologically inspired neural computation for ginseng
drying rate, Biosyst. Eng., 95, 385–396, 2006.
May, B.K. and Perré, P., The importance of considering exchange surface area reduction to
exhibit a constant drying fl ux period in foodstuffs, J. Food Eng., 54, 271–282, 2002.
Mayor, L. and Sereno, A.M., Modeling shrinkage during convective drying of food materials:
A review, J. Food Eng., 16, 373–386, 2004.
McFarlane, N.J.B. and Bruce, D.M., Control of mixed-fl ow grain-drier: Development of a
feedback-plus-feedforward algorithm, J. Agric Eng. Res., 49, 243–258, 1991.
52527_C012.indd 39652527_C012.indd 396 10/3/2008 4:11:19 PM10/3/2008 4:11:19 PM
© 2009 by Taylor & Francis Group, LLC

Dryer Modeling 397
Migliori, M., Gabriele, D., de Cindio, B., and Pollini, C.M., Modeling of high quality pasta
drying: Quality indices and industrial application, J. Food Eng., 71, 242–251, 2005.
Mirade, P.S., Simulation du fonctionnement aéraulique instationnaire d’un séchoir à charcuterie
au moyen d’un outil de CFD, in Cahiers de l’AFSIA 19—Compte Rendu des 19èmes Journées de l’AFSIA, 22–23 mars, Poitiers, France, AFSIA-EFCPE, Villeurbanne, 2001,
pp. 125–133.
Mohsenin, N.N., Physical Properties of Plant and Animal Materials, 3rd ed., Gordon and
Breach Science Publishers, New York, 1980.
Mrani, I., Benet, J.C., and Fras, G., Transport of water in a biconstituent elastic medium,
Appl. Mech. Rev., 48, 717–721, 1995.
Nadeau, J.-P. and Puiggali, J.-R., Séchage: Des Processus Physiques aux Procédés Industriels,
Lavoisier, Techniques et Documentation, Paris, 1995.
Nellist, M.E., Predicting the viability of seeds dried with heated air, Seed Sci. Technol., 9,
438–455, 1981.
Nellist, M.E. and O’Callaghan, J.R., The measurement of drying rates in thin layers of
ryegrass seed, J. Agric. Eng. Res., 16, 192–212, 1971.
Ng, P.P., Tasirin, S.M., and Law, C.L., Thin layer method analysis of spouted bed dried Malaysian
paddy—Characteristic drying curves, J. Food Proc. Eng., 29, 414–428, 2006.
Olesen, H.T., Grain Drying, Innovation Development Engineering, Thisted, Denmark, 1987.
Olmos, A., Trelea, I.C., Courtois, F., Bonazzi, C., and Trystram, G., Dynamic optimal control
of batch rice drying process, Dry. Technol., 20, 1319–1345, 2002.
Pajonk, A., Simulation numérique et étude expérimentale de la circulation de l’air et des
échanges de matière dans les enceinte d’affi nage de l’emmental, in Cahiers de l’AFSIA 19—Compte Rendu des 19èmes Journées de l’AFSIA, 22–23 mars, Poitiers, France,
AFSIA-EFCPE, Villeurbanne, 2001, pp. 117–124.
Peczalski, R. and Laurent, M., Transferts dans les aliments solides. Modèles physiques et
mathématiques, in Techniques de l’Ingénieur, Génie des Procédés—Agroalimentaire,
ETI Sciences & Techniques, Paris, vol. F-2000, 2000, pp. 1–18.
Peczalski, R., Laurent, P., Andrieu, J., Boyer, J.C., and Boivin, M., Drying-induced stress
build-up within spaghetti, in Drying ‘96, Proceedings of the 10th International Drying Symposium, Vol. B, Strumillo, C. and Pakowski, Z., Eds., Lodz Technical University,
Lodz, Poland, 1996, pp. 805–816.
Perré, P. and Degiovanni, A., Simulation par volumes fi nis des transferts couples en milieux
poreux anisotropes: Séchage du bois à basse et haute température, Int. J. Heat Mass Transfer, 33, 2463–2478, 1990.
Perrot, N., Bonazzi, C., and Trystram, G., Application of fuzzy rules-based models to
prediction of quality degradation of rice and maize during hot air drying, Dry. Technol., 16, 1533–1565, 1998.
Philip, J.R. and De Vries, D.A., Moisture movement in porous materials under temperature
gradients, Trans. Am. Geophys. Union, 38, 222–232, 1957.
Ponsart, G., Caractérisation expérimentale d’un matériau alimentaire et modélisation des
contraintes au cours du séchage. Application aux pâtes spaghetti, Ph.D. thesis,
AgroParisTech, Massy, France, 2002.
Press, W.H., Teukolski, S.A., Vetterling, W.T., and Flannery, B.P., Numerical Recipes: The Art of Scientifi c Computing, 3rd ed., Cambridge University Press, Cambridge,
U.K., 2007.
Rahman, M.S., Al-Zakwani, I., and Guizani, N., Pore formation in apple during air-drying
as a function of temperature: Porosity and pore-distribution size distribution, J. Sci. Food Agric., 85, 979–985, 2005.
Rocha Mier, T., Infl uence des prétraitements et des conditions de séchage sur la couleur et
l’arôme de la menthe (Mentha spicata Huds.) et du basilic (Ocimum basilicum), Ph.D.
thesis, AgroParisTech, Massy, France, 1993.
52527_C012.indd 39752527_C012.indd 397 10/3/2008 4:11:19 PM10/3/2008 4:11:19 PM
© 2009 by Taylor & Francis Group, LLC

398 Advances in Food Dehydration
Rodriguez-Fernandez, M., Balsa-Canto, E., Egea, J.A., and Banga, J.R., Identifi ability and
robust parameter estimation in food process modeling: Application to a drying model,
J. Food Eng., 83, 374–383, 2007.
Saravacos, G.D. and Maroulis, Z.B., Transport Properties of Foods, New York, Marcel
Dekker, 2001.
Straatsma, J., Van Houwelingen, G., Steenberg, A.E., and De Jong, P., Spray drying of food
products. 1. Simulation model, J. Food Eng., 42, 67–72, 1999a.
Straatsma, J., Van Houwelingen, G., Steenberg, A.E., and De Jong, P., Spray drying of food
products. 2. Prediction of insolubility index, J. Food Eng., 42, 73–77, 1999b.
Techasena, O., Lebert, A., and Bimbenet, J.-J., Simulation of deep bed drying of carrots,
J. Food Eng., 16, 267–281, 1992.
Togrul, I.T. and Pehlivan, D., Mathematical modeling of solar drying of apricots in thin
layers, J. Food Eng., 55, 209–216, 2002.
Toyoda, H., Study on intermittent drying of rough rice in a recirculation dryer, in Sixth International Drying Symposium (IDS’88), Vol. 2, Versailles, France, September 5–8,
1988, OP171–OP178.
Trelea, I.C., Courtois, F., and Trystram, G., Dynamic models for drying and wet-milling
quality degradation of corn using neural networks, Dry. Technol., 15, 1095–1102,
1997a.
Trelea, I.C., Courtois, F., and Trystram, G., Optimal constrained non linear control of batch
processes: Application to corn drying, J. Food Eng., 31, 403–421, 1997b.
Trystram, G., Contribution à l’automatisation des procédés en industrie alimentaire; Cas du
séchage sur cylindre, Ph.D. thesis, Institut National Polytechnique de Lorraine, Nancy,
France, 1985.
Trystram, G. and Vasseur, J., The modeling and simulation of a drum drying process, Int. Chem. Eng., 32, 689–705, 1992.
van Meel, D.A., Adiabatic convection batch drying with recirculation of air, Chem. Eng. Sci., 9, 36–44, 1958.
Vasseur, J., Etude du séchage d’un produit visqueux, en couche mince sur une paroi chaude,
permettant de défi nir un modèle de séchoir cylindre, Ph.D. thesis, AgroParisTech,
Massy, France, 1983.
Whitaker, S., Simultaneous heat, mass and momentum transfer in porous media: A theory
of drying, in Advances in Heat Transfer, Vol. 13, Academic Press, New York, 1977,
pp. 119–203.
Whitfi eld, R.D., Control of a mixed-fl ow drier, Part 1: Design of the control algorithm,
J. Agric. Eng. Res., 41, 275–287, 1988a.
Whitfi eld, R.D., Control of a mixed-fl ow drier, Part 2: Test of the control algorithm, J. Agric. Eng. Res., 41, 289–299, 1988b.
Zhang, J., Datta, A.K., and Mukherjee, S., Transport processes and large deformation during
baking of bread, AIChE J., 51, 2569–2580, 2005.
Zhang, Q. and Lichtfi eld, J.B., Fuzzy expert systems: A prototype for control of corn breakage
during drying, J. Food Proc. Eng., 12, 259–273, 1990.
APPENDIX
WEB LINKS TO SOFTWARE RELATED TO FOOD DRYERS
Psychrometric calculations software: http://www.linric.com
Psychrometric calculator: http://www.psychro.com
Commercial mixed-fl ow grain dryer simulator: http://www.drying.org
52527_C012.indd 39852527_C012.indd 398 10/3/2008 4:11:19 PM10/3/2008 4:11:19 PM
© 2009 by Taylor & Francis Group, LLC

Dryer Modeling 399
WEB LINKS TO SOFTWARE RELATED TO THE CHEMICAL INDUSTRY
Commercial software for design, tuning, and optimization of chemical
processes (no food, no drying): http://www.prosim.net
Commercial software for design, tuning, and optimization of chemical
processes (some tools for drying): http://www.aspentech.com
Network promoting the CAPE-OPEN initiative for software interoperability
standards: http://www.colan.org
52527_C012.indd 39952527_C012.indd 399 10/3/2008 4:11:19 PM10/3/2008 4:11:19 PM
© 2009 by Taylor & Francis Group, LLC

401
13 Nonconventional Heating Sources during Drying
Valérie Orsat and G.S. Vijaya Raghavan
CONTENTS
13.1 Introduction ............................................................................................. 401
13.2 MW Drying ............................................................................................. 404
13.2.1 Material Properties .................................................................. 405
13.2.2 MW–Convective Drying .......................................................... 406
13.2.3 MW–Vacuum Drying ............................................................... 409
13.2.4 MW–Osmotic Dehydration ...................................................... 410
13.3 RF Drying ............................................................................................... 412
13.4 IR Drying ................................................................................................ 413
13.5 Heat Pump Drying .................................................................................. 415
13.6 Conclusion ............................................................................................... 417
Nomenclature ..................................................................................................... 418
References .......................................................................................................... 418
13.1 INTRODUCTION
This chapter focuses on drying processes that have been developed using noncon-
ventional sources of energy for drying agricultural and food products. Nonconventional
heating sources such as microwaves (MWs), radiofrequency (RF), infrared (IR), and
heat pumps have been increasingly utilized in drying in recent years because of the
improved drying kinetics, energy savings, and quality dried products that they can
provide. The benefi t of using these heating sources lies in the short processing time
that is the most advantageous for product quality when compared to other drying
techniques, especially when dealing with fruits and vegetables that contain high
moisture and are sensitive to heat. To ensure good physical appearance and maintain
the nutrient value of dried products, combination techniques with new sources of
energy need to be considered for the successful drying of biological materials.
Population growth, the world economy, and climate change are placing severe
pressures on natural resources and food production systems. Appropriate management
52527_C013.indd 40152527_C013.indd 401 10/17/2008 12:26:02 PM10/17/2008 12:26:02 PM
© 2009 by Taylor & Francis Group, LLC

402 Advances in Food Dehydration
of resources will require innovative measures and practices that are researched and
developed by interdisciplinary teams of engineers and scientists. Innovation
contributes to the development of more value-added chains in the agrifood economy
while providing the foundation to ensure food security and safety and maintain the
health of our environment.
Greenhouse gas emissions and global warming are motivating the development
of technologies using electrical energy to replace fossil fuels in a wide spectrum of
activities, with one obvious restriction: the electrical energy must come from
renewable sources. These include hydro, solar, tidal, and wind energies and exclude
combustion of coal, oil, and natural gas. To a great extent, electricity produced from
renewable sources is considered clean and relatively friendly to the environment.
Electricity can also be transformed into radiant energy over practically the entire
useful electromagnetic spectrum (Figure 13.1), thus providing processing options
that are not available through combustion-based technologies, other than through the
electrical intermediate.
Evolution and competition in the market place drive processors to continuously
look for new processing methods to differentiate their products through improved
quality, lower costs, or value-added features. Dielectric heating (MW and RF) has a
number of advantages over other drying processes such as the volumetric dissipation
of energy throughout a product and the ability to automatically level any moisture
variation within it (Decareau, 1985). However, it also has some limitations, which
are occasionally technical, but principally economic. MW technology in industrial
processes is no doubt expensive, but it is rapid and effi cient. In general, dielectric
heating can be justifi ed in processes involving material of high value that is being
processed in modest quantities or in combination with other technologies. The
benefi ts of the development of combination processes with nonconventional heating
sources are the decrease in energy consumption for the production of high-quality
dried products, a reduction in chemicals used for pretreatment of the products prior
to drying, and a better understanding of the kinetics involved in drying heat-sensitive
materials. Reductions in processing time and substantially more effi cient energy
utilization should make nonconventional hybrid processes very cost effective and
attractive to all levels of the agrifood processing chain.
FIGURE 13.1 Electromagnetic spectrum wavelengths for gamma rays, x-rays, ultraviolet,
visible, IR, MW, radio waves, and long waves. Are all electromagnetic energy, and the differ-
ences among them are their wavelengths. (From Langley Science Center, NASA, http://www.
nasa.gov/centers/langley/science/FIRST.html. With permission.)
52527_C013.indd 40252527_C013.indd 402 10/17/2008 12:26:02 PM10/17/2008 12:26:02 PM
© 2009 by Taylor & Francis Group, LLC

Nonconventional Heating Sources during Drying 403
The benefi t of drying is not only to preserve crops as food but also to reduce
package and transport cost in terms of weight and volume while offering the possi-
bility to add value to harvested commodities. The challenge in food drying, espe-
cially for high moisture fruits and vegetables, is to reduce the moisture content to a
certain level where microbiological growth will not occur while maintaining the
high nutrient value, especially the functional micronutrients. For the majority of
existing drying processes, excluding freeze-drying, applying heat during drying
through conduction, convection, and radiation is the basic technique to force water
to vaporize, whereas forced air or a vacuum is applied to encourage the removal of
the moisture vapor away from the drying material.
The operating conditions in drying and thermal processing have a considerable
infl uence on the quality of processed biological materials. Browning reactions occur
in the presence of high heat with lower moisture, causing a decrease in nutritional
value and overall quality. Color loss, shrinkage, denaturation, loss of aroma and
fl avor, vitamin loss, and textural changes are also important quality changes affected
by thermal processing. In order to optimize practices for thermal processing and
drying of biological materials, extensive research has been carried out worldwide on
various drying methods such as fl uidized bed drying, spouted bed drying, particulate
medium conduction drying, fl ash drying, freeze-drying, spray drying, drum drying,
tunnel convective drying, tray drying, MW drying, RF drying, IR drying, electric
fi eld drying, superheated steam, osmotic dehydration, conveyor dryers, impingement
drying, solar drying, rotary drying, and so forth (Mujumdar, 2007). All of the drying
methods have been developed to optimize the drying of target materials, because not
all drying processes are suitable for all types of biological materials.
High frequency electromagnetic energy transfer in the MW and RF ranges can
be considered as heat arising from the oscillation of molecular dipoles and the move-
ment of ionic constituents in response to an alternating electric fi eld. Unlike conven-
tional energy, this energy is absorbed throughout the volume of the wet material. The
evaporation of moisture within the material results in an increase in the internal
pressure that can rapidly drive the moisture from the interior to the exterior of the
solid. Care must be taken to limit this pressure build-up because it can cause the
material to burst (Venkatachalapathy and Raghavan, 1999).
Resistive or ohmic heating is the term used to describe the release of heat in food
products by direct electrical resistance. The process allows rapid, uniform heating
for high-quality processing of liquid food products through the direct dissipation of
electrical energy. Metallic materials, insulators, and foodstuffs are highly conduc-
tive at main frequencies, so that the source energy is dissipated ohmically in direct
resistive heating. In such applications, the material comes in direct contact with the
electrodes. Ohmic heating has great application for thermal treatments, potentially
for enhancing water evaporation, rather than in direct drying applications (Goullieux
and Pain, 2005).
In contrast, induction heating has had few applications in biological materials
but has been used in the metal industry. The majority of applicators for induction
are based on coils wrapped around the material. The electric current fl owing in
the coil establishes an axial magnetic fl ux that in turn sets up a circumferential
current in the material, the depth of which depends on the frequency of operation.
52527_C013.indd 40352527_C013.indd 403 10/17/2008 12:26:02 PM10/17/2008 12:26:02 PM
© 2009 by Taylor & Francis Group, LLC

404 Advances in Food Dehydration
The fl owing current is responsible for imparting electrical energy to the material
(Metaxas, 1996).
IR radiation falls in the short wavelength electromagnetic spectrum and offers
great potential for surface heat treatments in thin layer drying applications (Ratti and
Mujumdar, 2007).
Heat pumps are used to reduce the energy consumption of existing dryers. Their
usefulness lies in their dehumidifi cation process for the recovery of the latent heat of
evaporation of water being lost in the exhaust air from the dryer (Chou and Chua,
2007; Sosle, 2006).
This chapter concentrates on drying applications with MW and RF drying, IR
heating, and heat pump dehumidifi cation.
13.2 MW DRYING
The electromagnetic spectrum covers a large span of wavelengths from low frequency
telecommunications, MWs, and IR radiation, up to gamma rays. Dielectric and MW
heating lie in the electromagnetic spectrum in the range of frequencies from 300 kHz
to 300 GHz. RFs range from 300 kHz to 300 MHz, and MWs range from 300 MHz to
300 GHz.
The difference between RF and MW is in the means of transferring the energy
to the processed material. In RF, an electric fi eld is developed between electrodes; in
MW, a wave is propagated and refl ected under the laws of optics. RF works well with
bulky materials having high ionic conductivity. At 27.12 MHz the wavelength is on
the order of 10 m. MW works well with smaller quantities of a dipolar nature. At
2450 MHz the wavelength is on the order of 10 cm.
Research on mutual interactions between food products and dielectric process-
ing equipment is still needed to provide a practical basis for process control and
minimization of process energy costs and to ensure microbial safety and product
quality. Processes for high moisture solid foods have been less successful in exten-
sive research conducted at 2450 MHz, unless combined with convection heating
methods. This results to some extent from low penetration depths that could be
increased at frequencies below 2450 MHz, such as 915 and 27.12 MHz.
The degree to which a given material responds to an electromagnetic fi eld
depends on the frequency and intensity of the fi eld and on the characteristics of the
material itself. The electrical basis of interaction is described in terms of the dielec-
tric properties: the dielectric constant (e¢) and dielectric loss factor (e≤). These
represent the proportion of energy that can penetrate the material and the amount of
energy that can be absorbed by the material, respectively. The loss tangent (tan �) is
the ratio of e¢/e≤, which is a combination of the material’s ability to be penetrated by
an electric fi eld and to dissipate that energy as heat (Mudgett, 1986). The dielectric
properties of materials are of great importance in the consideration of high frequency
or MW applications with biological materials.
Fundamental studies aimed at characterizing the dielectric responses of complex
biological materials over a wide range of frequencies, temperatures, and moisture
contents still need to be undertaken. Although a great deal of progress has been
achieved in the development of instrumentation and in the understanding of the
52527_C013.indd 40452527_C013.indd 404 10/17/2008 12:26:02 PM10/17/2008 12:26:02 PM
© 2009 by Taylor & Francis Group, LLC
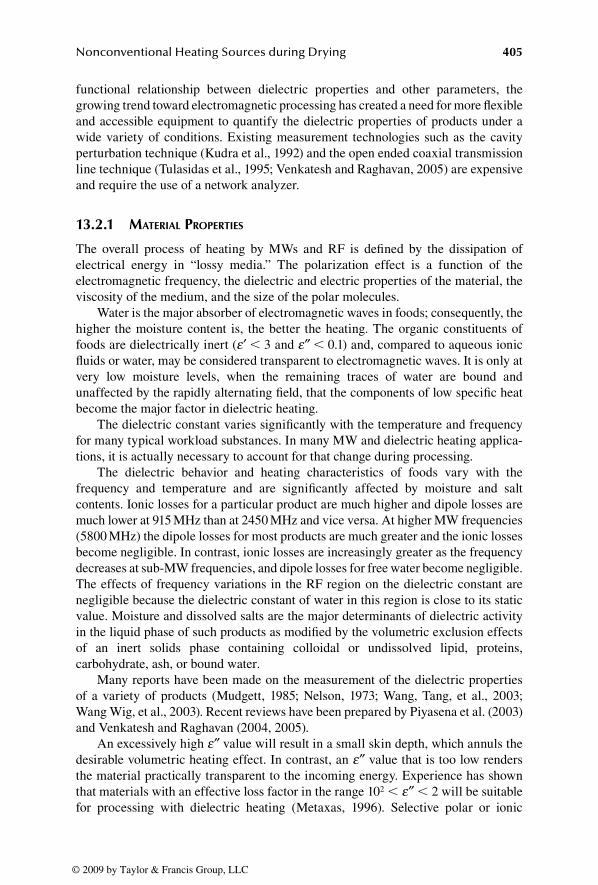
Nonconventional Heating Sources during Drying 405
functional relationship between dielectric properties and other parameters, the
growing trend toward electromagnetic processing has created a need for more fl exible
and accessible equipment to quantify the dielectric properties of products under a
wide variety of conditions. Existing measurement technologies such as the cavity
perturbation technique (Kudra et al., 1992) and the open ended coaxial transmission
line technique (Tulasidas et al., 1995; Venkatesh and Raghavan, 2005) are expensive
and require the use of a network analyzer.
13.2.1 MATERIAL PROPERTIES
The overall process of heating by MWs and RF is defi ned by the dissipation of
electrical energy in “lossy media.” The polarization effect is a function of the
electromagnetic frequency, the dielectric and electric properties of the material, the
viscosity of the medium, and the size of the polar molecules.
Water is the major absorber of electromagnetic waves in foods; consequently, the
higher the moisture content is, the better the heating. The organic constituents of
foods are dielectrically inert (e¢ � 3 and e≤ � 0.1) and, compared to aqueous ionic
fl uids or water, may be considered transparent to electromagnetic waves. It is only at
very low moisture levels, when the remaining traces of water are bound and
unaffected by the rapidly alternating fi eld, that the components of low specifi c heat
become the major factor in dielectric heating.
The dielectric constant varies signifi cantly with the temperature and frequency
for many typical workload substances. In many MW and dielectric heating applica-
tions, it is actually necessary to account for that change during processing.
The dielectric behavior and heating characteristics of foods vary with the
frequency and temperature and are signifi cantly affected by moisture and salt
contents. Ionic losses for a particular product are much higher and dipole losses are
much lower at 915 MHz than at 2450 MHz and vice versa. At higher MW frequencies
(5800 MHz) the dipole losses for most products are much greater and the ionic losses
become negligible. In contrast, ionic losses are increasingly greater as the frequency
decreases at sub-MW frequencies, and dipole losses for free water become negligible.
The effects of frequency variations in the RF region on the dielectric constant are
negligible because the dielectric constant of water in this region is close to its static
value. Moisture and dissolved salts are the major determinants of dielectric activity
in the liquid phase of such products as modifi ed by the volumetric exclusion effects
of an inert solids phase containing colloidal or undissolved lipid, proteins,
carbohydrate, ash, or bound water.
Many reports have been made on the measurement of the dielectric properties
of a variety of products (Mudgett, 1985; Nelson, 1973; Wang, Tang, et al., 2003;
Wang Wig, et al., 2003). Recent reviews have been prepared by Piyasena et al. (2003)
and Venkatesh and Raghavan (2004, 2005).
An excessively high e≤ value will result in a small skin depth, which annuls the
desirable volumetric heating effect. In contrast, an e≤ value that is too low renders
the material practically transparent to the incoming energy. Experience has shown
that materials with an effective loss factor in the range 102 � e≤ � 2 will be suitable
for processing with dielectric heating (Metaxas, 1996). Selective polar or ionic
52527_C013.indd 40552527_C013.indd 405 10/17/2008 12:26:02 PM10/17/2008 12:26:02 PM
© 2009 by Taylor & Francis Group, LLC

406 Advances in Food Dehydration
additions to a low loss host material can enhance its effective loss and render it
suitable for dielectric processing. It is sometimes possible to modify a low loss factor
material without signifi cantly altering its other properties via a small amount of high
loss factor additive, such as carbon added to natural rubber or sodium chloride added
to urea formaldehyde glues (Ikediala et al., 2002; Orsat and Raghavan, 2005).
Two major mechanisms are involved in the MW–matter heating interaction:
dipolar rotation and ionic conduction. In ionic conduction, ions are accelerated by
electric fi elds causing them to move toward the direction opposite to their own
polarity. The movement of the ions provokes collisions with the molecules of the
material. A disordered kinetic energy is created and as a consequence heat is
generated. For example, polar molecules subjected to MW radiation at 2450 MHz
will rotate 2.45 × 10⁹ times/s. The friction between the fast rotating molecules
generates heat throughout the material instead of being transferred from the surface
to the inner part as is the case in conventional hot air drying.
Equation (13.1) is used to calculate the energy absorption by products during
dielectric heating:
P � 2pfe0 e ≤ |E |2 (13.1)
where P is the energy developed per unit volume (W/m3), f is the frequency (Hz), e0
is the absolute permittivity of a vacuum (8.854188 × 10⁻¹² F/m), and |E| is the electric
fi eld strength (V/m). Uniformity of drying is made possible with the control of the
MW power density and duty cycle.
13.2.2 MW–CONVECTIVE DRYING
The heat and mass transfer through conduction, convection, and electroheating each
have their own advantages and disadvantages. Process equipment can benefi t from
the combination of multiple processes (Orsat et al., 2007). Utilizing MW energy in
drying offers reduced drying times and complements conventional drying in later
stages by specifi cally targeting the internal residual moisture (Osepchuk, 2002).
Because the dielectric properties of the material being processed vary as a function
of the frequency along with temperature and moisture content as variables, they
should point to a specifi c frequency range for a target application.
The ability of MWs to selectively heat areas with higher dielectric loss factors is
very important in this application. Unlike other conventional systems, dielectric
drying has an inherent ability to “moisture level” a given product, with more power
being applied to regions with higher moisture content than to regions with lower
moisture content. If the drying process is considered as a whole, it becomes apparent
that, as long as the physical surface of a material can be maintained wet, conven-
tional drying can still be economical. The argument for combining volumetric
(dielectric) heating and surface (conventional) heating is based on suffi cient heat
being provided by the dielectric heating within the body of the material to cause
water to move to the surface. This minimizes the retreating wet front, maintains the
evaporating surface, and perhaps permits entrainment–evaporation. If MW energy
52527_C013.indd 40652527_C013.indd 406 10/17/2008 12:26:02 PM10/17/2008 12:26:02 PM
© 2009 by Taylor & Francis Group, LLC

Nonconventional Heating Sources during Drying 407
can be used to bring moisture continually to the surface, then only a portion of the
total drying heat needs to be provided by the dielectric heating system; the bulk of
the heat is required for evaporation, and it can be provided at the surface with
convective air drying.
MW drying uses electrical energy in the frequency range from 300 MHz to
300 GHz with 2450 MHz being the most commonly used frequency, especially for
heating applications with the popular domestic MW oven. MWs are generated inside
a cavity by stepping up the 60-Hz frequency of alternating current from domestic
power lines to 2450 MHz. A magnetron device accomplishes this (Orsat et al., 2005).
The step-up transformer that powers the magnetron accounts for more than half of
the weight of the domestic MW ovens. A waveguide channels the MWs into the
cavity that holds samples for heating. Domestic ovens have refl ecting cavity walls
that produce several modes of MWs, maximizing the effi ciency of heating with a
variety of materials. In industrial applications, however, it may be desirable to use
single mode ovens that homogenously distribute the MWs into the cavity.
The basic requirements in MW power applications are effi ciency of power
transfer, low cost, and reliability of system operation. The most successful device for
power application is the magnetron (Osepchuk, 2002). Magnetrons in MW ovens
operate from 300 to 3000 W and in high power applications operate from 5 to
100 kW. The supplied power is fed into a cavity known as the applicator. The most
common applicators include the multimode cavity, the single mode cavity, and the
traveling wave device.
Because the heat is generated within the material, mass transfer occurs from the
pressure gradient created by vapor generation inside the material, rapidly forcing water
vapor to the product’s surface creating a pumping action. This mechanism pushes water
out of the product with great effi ciency as the moisture content of the product decreases.
The rapidity of the process can thus yield energy savings (Schiffmann, 2007).
For large-scale heating applications, RF’s longer wavelength makes it less prone
to standing waves and the resulting nonuniform heating. Moisture leveling is more
effective at RF for wet planar materials in drying applications. In contrast, if drying
needs to be conducted under a vacuum to reduce the boiling point, MW energy is
better suited in drying cases with temperature-sensitive materials because the likeli-
hood of arcing and corona discharge is much smaller.
From an environmentally friendly perspective, more effi cient utilization of
energy is required in the food drying and processing sector. In this respect, dielectric
techniques may play an important role in the future. Selection of dielectric energy
and its combination with conventional technologies will lead to products that meet,
and often improve, the quality requirements of existing products and open the fi eld
for new product development (Demeczky, 1985; Jones, 1987).
The use of MW energy for drying requires moderately low energy consump-
tion (Tulasidas et al., 1995). The volumetric heating and reduced processing time
make MWs an attractive source of thermal energy. Because MWs alone cannot
complete a drying process, combining techniques, such as forced air or vacuum, is
recommended in order to further improve the MW process effi ciency (Chou and
Chua, 2001).
52527_C013.indd 40752527_C013.indd 407 10/17/2008 12:26:02 PM10/17/2008 12:26:02 PM
© 2009 by Taylor & Francis Group, LLC

408 Advances in Food Dehydration
In MW drying, when the material couples with the MW energy, heat is generated
within the product through molecular excitation. The critical next step is to
immediately remove the water vapor. The simplest method to remove the released
water is to pass air over the surface of the material, hence combining processes to
create “MW–convective drying.” In many cases when MW drying is mentioned,
MW–convective drying is implied. The air temperature passing through the product
can be varied to speed up the drying process by increasing its moisture carrying
capacity (Chua et al., 2000). The selected air temperature is dependent on the
products’ characteristics and their sensitivity to heat. In order to control the overall
drying process temperature, it is necessary to control the MW power density (watts/
grams of material) or the duty cycle (time of power on or off; Changrue et al., 2004).
Drying banana slices with MW–convective drying demonstrated that good quality
dried products can be achieved by optimizing the power density and duty cycle time
(Nemes et al., 2005). Similar results were reported in dried carrots, in which there
was excellent quality in terms of color, shrinkage, and rehydration properties (Orsat
et al., 2007; Wang and Xi 2005). Tulasidas et al. (1995) conducted a comparison of
the specifi c energy consumption and drying time and showed the advantage of MW
over convective drying for grapes (Table 13.1). The quality of raisins dried by MW
drying was superior to hot air dried samples in terms of color, damage, darkness,
crystallized sugar, stickiness, and uniformity (Tulasidas et al., 1995a; Tulasidas
et al., 1995).
In studying MW drying kinetics, it is clearly during the falling rate period of the
drying process that the use of MWs can prove most benefi cial. As the material
absorbs the MW energy, a temperature gradient occurs where the center temperature
is greater, effectively forcing the residual moisture out (Erle, 2005; Soysal et al.,
2006). Combination drying with an initial conventional drying process followed by
a fi nish MW or MW–vacuum process reduces the drying time while improving
product quality and minimizing the overall energy requirements (Erle, 2005;
Raghavan et al., 2005; Soysal et al., 2006; Yanyang et al., 2004).
A signifi cant industrial application is in MW–air tunnel drying that is used
principally as a fi nish drying process to level-off moisture content in pasta, cracker,
or chip drying (Osepchuk, 2002). However, when the heat generation within the
product is too rapid, it can cause the generation of great internal steam pressure,
TABLE 13.1Comparison of Convective and MW Drying of Grapes
Drying MethodAir Temp.
(∞C)Air-Flow Rate
(kg/s)Drying Time
(h)Specifi c Energy Consumption
(MJ/kg Water)
Convective 50
60
0.0210
0.0204
23.66
16.75
90.35
81.15
MW 50
60
0.0210
0.0204
5.58
3.86
21.86
19.08
Source: From Tulasidas, T.N. et al., Dry. Technol., 13, 1973–1992, 1995a. With permission.
52527_C013.indd 40852527_C013.indd 408 10/17/2008 12:26:02 PM10/17/2008 12:26:02 PM
© 2009 by Taylor & Francis Group, LLC

Nonconventional Heating Sources during Drying 409
resulting in expansion that can lead to product collapse or material explosion as
experienced by Venkatachalapathy and Raghavan (2000) during the MW drying of
whole strawberries.
MW–hot air tunnel dryers are commercially available from various sources
(Microdry Incorporated, 2007; Sairem Microwave & Radio Frequency, 2007), and the
industrial equipment manufacturers have to work with their customer to adjust the
equipment design to meet target product requirements and their specifi c limitations.
13.2.3 MW–VACUUM DRYING
Further drying improvements can be obtained by using subatmospheric pressures.
Water evaporation takes place at lower temperatures under a vacuum; hence, the
product processing temperature can be signifi cantly lower, offering higher product
quality. Many comparisons have been made between MW–vacuum drying and other
systems, mainly hot air and freeze-drying.
MW–vacuum dehydration was fi rst used for concentration of citrus juice. In the
food industry, MW–vacuum drying is used for drying of pastas, powders, and many
porous solids. The main purpose of vacuum drying is to enable the removal of
moisture at a much lower temperature than the boiling point under ambient conditions.
For example, the boiling point of water is reduced to 29°C at 40 mbar. A low
temperature is important for many products that are heat sensitive. Furthermore, the
absence of air, especially oxygen, helps preserve many of the components that are
sensitive to oxidation (Regier et al. 2005).
Drouzas and Schubert (1996) investigated vacuum–MW drying of banana slices.
They found the product quality was excellent in terms of taste, aroma, and rehydra-
tion. Yongsawatddigul and Gunasekaran (1996) used MW–vacuum drying to dry
cranberries. Their experiment was done in pulsed and continuous mode duty cycles.
The dried products were redder and had a softer texture than those dried by the
conventional hot air method.
Lin et al. (1998) compared dried carrot slices using vacuum–MW drying with
air and freeze-drying on the basis of rehydration potential, color, density, nutritional
value, and textural properties. MW–vacuum dried carrot slices had higher rehydra-
tion potential, higher �-carotene and vitamin C content, lower density, and softer
texture than those prepared by air drying. Although freeze-drying of carrot slices
yielded a product with improved rehydration potential, appearance, and nutrient
retention, MW–vacuum drying was rated as equal to freeze-dried. Similar results
were reported by Regier et al. (2005); MW–vacuum dried carrots had the highest
carotenoid retention compared to freeze-drying and convection drying. Giri and
Prasad (2007) studied the drying kinetics of MW–vacuum and convective dried
mushrooms. MW–vacuum was much faster than hot air drying. The drying rate was
controlled by the level of applied MW power.
Adjusting the MW power or selecting an intermittent mode of application is
recommended to control the product temperature during the MW–vacuum drying
process. Orsat et al. (2007) found that at the vacuum level of 5.1-kPa absolute pressure,
1.5 W/g power density provides more suitable drying conditions in continuous mode
for MW drying of carrots. An intermittent MW mode, operating at 90 s on and
52527_C013.indd 40952527_C013.indd 409 10/17/2008 12:26:03 PM10/17/2008 12:26:03 PM
© 2009 by Taylor & Francis Group, LLC

410 Advances in Food Dehydration
30 s off with 2.0 W/g MW at an absolute pressure of 5.1 kPa, provided the best drying
conditions. These results also showed that the combination of continuous and inter-
mittent modes is an alternate MW operating sequence that improves energy utilization
and accelerates the drying rate (Orsat et al., 2007).
Böhm et al. (2006) studied the MW–vacuum drying of strawberries with the
objective of maximizing their nutritional quality. Control of the process temperature
at low levels (�60°C) was critical to maintain the stability of ascorbic acid and the
total content of phenolic compounds.
Cui et al. (2003) conducted a comparative study for garlic drying. Freeze-drying,
MW–vacuum drying, and hot air drying effects on loss of pyruvate were compared.
The best dried garlic quality was obtained with freeze-drying and MW–vacuum
drying as a close second. In contrast, there was a great loss in garlic pungency with
the hot air dried samples. Sharma and Prasad (2006) came to a similar conclusion
when comparing hot air drying with MW–convective drying of garlic. They obtained
a drying time reduction of 80% with superior quality dried garlic when combining
MWs at 0.4 W/g with hot air at 60 to 70°C.
In a comparative study conducted by Sunjka et al. (2004), MW–vacuum drying
of cranberries produced enhanced quality characteristics when compared to MW–
convective drying. The drying performance results (defi ned as the mass of evapo-
rated water per unit of supplied energy) showed that MW–vacuum drying is more
energy effi cient than MW–convective drying.
Vacuum–MW drying was compared with freeze-drying, air drying, and a
combination drying method of air drying and MW–vacuum drying for preserving
the antioxidant functional properties of Saskatoon berries (Kwok et al., 2004). Air
drying yielded a considerable loss of anthocyanin. The best retention was obtained
with freeze-drying followed by vacuum–MW drying, combination drying, and air
drying (75°C).
Commercially available MW–vacuum dryers are custom made to specifi c
product requirements (Enwave Corporation, 2007). GEA Niro Inc. (2007) and
Püschner Microwave Power Systems (2007) offer various industrial models of
vacuum–MW dryers (Figures 13.2 and 13.3). Their use is predominant when oxida-
tion of the product requires the drying to be carried out under an inert atmosphere
or if the volatiles that are produced need to be recovered for economic and environ-
mental reasons. When considering vacuum drying alone, there is a signifi cant
disadvantage in the long drying periods that require adding thermal energy, where
MW is selected to push the moisture out with increased drying rates. The demands
for producing higher product quality with shorter drying times for temperature-
sensitive products can be addressed using MW heat treatment in combination with
vacuum driers.
13.2.4 MW–OSMOTIC DEHYDRATION
Osmosis is known as a partial dehydration process. Although it does not remove
enough moisture from the product to be considered as a dried product, the process has
the advantage of requiring little energy because the driving force pulling water out
resides in the osmotic gradient created between the product and the osmotic agent.
52527_C013.indd 41052527_C013.indd 410 10/17/2008 12:26:03 PM10/17/2008 12:26:03 PM
© 2009 by Taylor & Francis Group, LLC

Nonconventional Heating Sources during Drying 411
FIGURE 13.2 UltimaPro™ one-pot stirring–MW–vacuum dryer. (From GEA Niro Pharma
Systems, http://www.niropharma.com. With permission.)
FIGURE 13.3 Batch MW–vacuum dryer. (From Püschner Microwave Power Systems,
http://www.pueschner.com, 2007. With permission.)
52527_C013.indd 41152527_C013.indd 411 10/17/2008 12:26:03 PM10/17/2008 12:26:03 PM
© 2009 by Taylor & Francis Group, LLC

412 Advances in Food Dehydration
It works well as a pretreatment prior to other drying processes (Barbosa-Canovas and
Vega-Mercado, 1996). The application of osmotic dehydration to fruits and to a lesser
extent to vegetables has received attention in recent years to reduce energy consump-
tion and heat damage, thus allowing greater retention of nutrients (Beaudry et al.,
2004; Jayaraman and Gupta, 1992; Shi et al., 1997). The protective skin of some food
products impedes water transport through the surface. In these cases, pretreating the
skin to increase its permeability is required before osmosis, which Sunjka and
Raghavan (2004) described for the pretreatment of cranberries. Nsonzi and
Ramaswamy (1998) modeled the mass transfer process with respect to moisture loss
and solids gain for the osmotic concentration of blueberries. They stated that, even
though the moisture loss and solids gain occurred at the same time, the rate of mois-
ture loss was much higher than the rate of solids gain. Lenart (1996) described the
main advantages of using osmotic dehydration as the reduction of the process temper-
ature, sweeter taste of the dehydrated product, a 20 to 30% reduction in energy con-
sumption when carbohydrates were used as the osmotic agent, and a shorter drying
time following osmotic dehydration.
Beaudry et al. (2004) studied the effect of MW–convective (0.7 W/g and 62°C),
hot air (62°C), freeze-drying, and vacuum drying (94.6 kPa) methods on the quality
of osmotically dehydrated cranberries. With all of the drying methods, they reported
that the constant drying rate period is no longer present following osmotic dehydra-
tion. Piotrowski et al. (2004) also reported this effect for strawberries. The fastest
drying method was MW–convective, and the longest was hot air drying at 62°C. All
dried samples were judged acceptable by sensory evaluation, and the texture of the
MW dried ones scored the closest to commercially available dried cranberries
(Beaudry et al., 2004). Venkatachalapathy and Raghavan (1999) reported that com-
bined osmotic–MW dried strawberries were close to the freeze-dried product in
terms of rehydration characteristics and overall sensory evaluation.
13.3 RF DRYING
In an RF heating system, the RF generator creates an alternating electric fi eld
between two electrodes. The electrode confi guration is designed according to the
characteristics of the product being processed (Orsat and Raghavan, 2004). The
material is placed between the electrodes where the alternating energy causes polar-
ization, and the molecules in the material continuously reorient themselves to face
opposite poles. When the electric fi eld is alternating at RFs, for example, 27.12 MHz,
the electric fi eld alternates 27,120,000 cycles/s. The friction resulting from the rota-
tional movement of the molecules and the space charge displacement causes the
material to be rapidly heated throughout its mass. The amount of heat generated in
the product is determined by the frequency, the square of the applied voltage, the
dimensions of the product, and the dielectric loss factor of the material [Eq. (13.1)].
Industrial development that has been undertaken thus far in RF drying appli-
cations is limited because of the small size of the corresponding equipment manu-
facturing industry and the limited market demand, causing the investment costs to
remain high. Nonetheless, there are some well-known applications of RF energy in
drying, especially in wood (Avramidis and Zwick, 1996), textiles (Pai et al., 1989),
52527_C013.indd 41252527_C013.indd 412 10/17/2008 12:26:03 PM10/17/2008 12:26:03 PM
© 2009 by Taylor & Francis Group, LLC

Nonconventional Heating Sources during Drying 413
and postbaking drying (Mermelstein, 1998). The most successful applications often
combine two or more drying techniques (RF–heat pump, forced air with RF, etc.).
Murphy et al. (1992) conducted experiments on RF drying (27 MHz) of alfalfa.
To dry alfalfa from 80 to 12% moisture content requires the removal of 3.5 kg water/
1.0 kg dried alfalfa. Assuming that the water removed is free water, the alfalfa is
initially at 20°C, and the water is vaporized at 100°C, the energy required is 8.8 MJ or
2.4 kW h. Typically, the effi ciency of RF ovens is about 50 to 60%, so 4.8 kW h of
input energy would be required to produce 1kg of dried alfalfa. At a rate of $0.04/kW h,
the energy costs alone would amount to $200/t dried alfalfa, which is more than the
current market value. Hence, the only economically feasible application of RF power
to dry alfalfa is as a supplementary source rather than a major power source, perhaps
in the fi nal stages of drying for moisture leveling.
RF drying has mainly been used for postbake drying of cookies, crackers, and
pasta (Mermelstein, 1998; Union Internationale d’Électrothermie, 1992). Cookies
and crackers, fresh out of the oven, have a nonuniform moisture distribution that may
yield to cracking during handling. RF heating can help even out the moisture
distribution after baking by targeting the remaining moisture pockets. Recent
development trends are in investigating hybrid drying systems involving RF to cater
to the special needs of heat-sensitive foodstuffs (Chou and Chua, 2001; Vega-Mercado
et al., 2001; Zhao et al., 2000).
The Radio Frequency Macrowave Company produces a line of RF dryers
operating at 40 MHz (Figure 13.4). Their dryers are designed with programmable
logic controllers to provide complete diagnostics and centralized control of all dryer
functions. The macrowave heat reclamation system uses waste heat from the RF
power generator to scavenge moisture and increase drying effi ciency.
13.4 IR DRYING
IR radiation falls in the wavelength range of 0.75 to 100 μm; hence, solid bodies will
generally absorb the radiation in a narrow layer at the surface. Therefore, for a suc-
cessful IR drying application, the radiation properties of both the radiator and the
material must be matched (Ratti and Mujumdar, 2007). The emissivity, absorptivity,
refl ectivity, and transmissivity are the properties of interest. IR heating is used in
industry principally for surface drying or thin layer drying. IR drying offers high
effi ciency of conversion of the electrical energy into heat (average 80% effi ciency)
in addition to being a simple, inexpensive and easy to control technology. The limita-
tion is that applications are more or less limited to thin layers of material. IR dryers
are commonly designed to be integrated with conventional dryers (conveyor hot air
dryers), where standard IR radiators are used in order to ensure that the IR radiation
is directed on the product being dried. The design must take into account the prod-
uct’s radiation properties and the effi ciency of conversion from electric to IR energy
for the emitters and radiators to optimize the process. The cavity must be equipped
with refl ectors and adequate air movement and exhaust to remove moisture, gases,
and so forth. The heating and drying chambers require some particular design com-
ponents. The inner surface of the cavity should have a mirrored polished fi nish to
ensure maximum refl ection of the radiation onto the bed of material. The IR emitters
52527_C013.indd 41352527_C013.indd 413 10/17/2008 12:26:03 PM10/17/2008 12:26:03 PM
© 2009 by Taylor & Francis Group, LLC

414 Advances in Food Dehydration
can either be electrical or gas fi red. The effi ciency of the IR heating system depends
on the coupling of the heat source with the material because the heat conversion only
occurs if the material absorbs the radiation. The absorption range for food materials
is generally between 2.5 and 3.0 μm.
The combination of IR and hot air provides a synergistic effect, resulting in
greater effi ciency with a higher rate of mass transfer. When a material is exposed to
IR radiation, there is increased molecular vibration in the material at the inner
surface layers. The rate of moisture movement in the material toward the surface is
increased and the convective air removes this moisture from the surface, reducing
the product’s temperature for improved product quality (Hebbar et al., 2004).
Combination IR and hot air drying performed better than either IR (17 kW/m2, 2.4 to
3 μm) or hot air alone (80°C, 1 m/s) for drying carrots and potatoes (Hebbar et al.,
2004). Table 13.2 presents the specifi c energy consumption for these types of drying
as reported by Hebbar et al. (2004).
TABLE 13.2Specifi c Energy Consumption during Hot Air, IR, and Combined IR and Hot Air Drying of Potatoes and Carrots
Drying Mode
Specifi c Energy (MJ/kg) of Evaporated Water
Potato Drying Carrot Drying
Hot air 17.17 16.15
IR 7.60 7.15
IR and hot air 6.43 6.04
Source: From Hebbar, H.U. et al., J. Food Eng., 65, 557–563, 2004. With permission.
FIGURE 13.4 The 7000 Series Macrowave dryers. (From Radio Frequency Macrowave
Company, http://www.radiofrequency.com/products/mac7000f.html, 2007. With permission.)
52527_C013.indd 41452527_C013.indd 414 10/17/2008 12:26:03 PM10/17/2008 12:26:03 PM
© 2009 by Taylor & Francis Group, LLC

Nonconventional Heating Sources during Drying 415
Pathare and Sharma (2006) conducted an experiment on IR–convective drying of
onion slices. The operating parameters were IR intensities of 26 to 44 kW/m2, air
temperatures ranging between 30 and 60°C, and air velocities from 0 to 1.5 m/s. The
drying occurred entirely in the falling rate period, and the drying rate increased with an
increase in process intensity with a dominant effect from an increase in IR intensity.
Tireki et al. (2006) studied the combined near-IR–MW drying of breadcrumbs.
MW inputs of 210, 350, and 490 W/20 g samples and near-IR heating in the 0.7 to
1.1 μm wavelength were tested. Halogen lamps (1350, 2250, and 3150 W) were used.
Combining the processes shortened the drying time while ensuring product quality.
Wang and Sheng (2006) investigated sequential far-IR (�25 μm) and MW drying
of peaches. For MW drying, power intensities of 0.5, 0.7, and 1 kW/kg were studied
with a 1 m/s fl ow of air. The far-IR heating operated at 0.5, 0.7, and 1 kW/kg with a
1 m/s fl ow of air. The drying rate increased with increasing intensity, but MW drying
achieved greater drying rates at lower energy consumption than IR drying (Wang
and Sheng, 2006).
The Kreyenborg GmbH (2007) offers a line of IR dryers. The drying chamber
consists of a screw coil that conveys the drying material lengthwise through the
system (Figure 13.5). The residence time is determined by the speed of the screw
conveyor. The product temperature is permanently controlled, and the radiators’
capacity is readjusted if necessary. The material is stirred by the rotation of the drum
and at the same time permanently irradiated by the IR radiation, ensuring uniformity
of the process. The wavelength of the IR rays is adjusted according to the process
parameters. The radiation is directly absorbed by the bulk material and vaporizes the
water to the surface of the material.
13.5 HEAT PUMP DRYING
Heat pumps have been studied for use on farms since the early 1950s and have found
some applications in various sectors like dairy, grain drying, timber drying, and so
FIGURE 13.5 Kreyenborg Infrared Rapid Dryer. (From Kreyenborg GmbH, http://www.
kreyenborg.com/en/kreyenborg/index.php, 2007. With permission.)
52527_C013.indd 41552527_C013.indd 415 10/17/2008 12:26:03 PM10/17/2008 12:26:03 PM
© 2009 by Taylor & Francis Group, LLC

416 Advances in Food Dehydration
forth. Heat pump dryers have many advantages compared to conventional systems
such as improved product quality due to mild drying conditions, reduced energy
consumption, and reduced environmental incidence. An electrically driven heat
pump shares the advantage of low temperature drying and manifests the same desir-
able characteristics of resistance heat, yet is considerably more energy effi cient
(Strommen and Jonassen, 1996).
In drying, there are two distinctly different types of moisture removal: one in
which the problem is to eliminate airborne water vapor and another in which liquid
water is to be extracted from some material. In the fi rst, the heat has already been
supplied from somewhere to evaporate the water and increase the air humidity; in
the second, the water is still present as liquid, and part of the drying process is to
supply the heat to vaporize it (Strommen and Kramer, 1994). The simplest drying
method is to blow heated air over the moist material and vent the moist air to the
atmosphere. All of the latent heat carried in the water vapor is lost to the atmosphere.
In a heat pump, the moisture in the exhaust is condensed at the evaporator and the
latent heat is recovered to the circulating air stream via the condenser (Heap, 1979).
The heat pump, in a closed cycle, reclaims heat and uses it at a cost equal to that of
operating the compressor motor.
A heat pump dehumidifi er works on the principle of refrigeration to cool an air
stream and condense the water contained in it. This not only renders the air dry but
also recovers the latent heat of evaporation represented by the water vapor removed,
which can be routed back to the air, thus increasing its capacity to pick up more
moisture. This technology is ideal for application in the drying sector where the pur-
pose is removal of water at a minimal energy cost. The introduction of the dehumidi-
fi er into the process enhances the energy effi ciency by recovering the latent heat that
is exhausted to air in a conventional process. The use of MW heating provides an
effi cient supply of energy required to speed up the process of moisture rejection from
the material undergoing drying. This component overcomes some of the heat and
mass transfer drawbacks of convective air drying.
The schematic presented in Figure 13.6 shows the arrangement of a typical heat
pump system as described by Sosle et al. (2003). The drying material is placed on
perforated trays stacked on a platform in the drying chamber. The platform rests on
load cells that monitor the mass of the load. There is an electrical heater that is used
to control the temperature of the drying air. The heat pump itself has a centrifugal
fan that can be run independently of the compressor, and this fan drives the air in the
loop. The heat pump unit is equipped with a secondary water-cooled condenser.
There is a butterfl y valve in the circuit and two dampers to switch between closed
and semiclosed modes of air circulation.
The air circuit can be operated in a completely closed, partially closed, or completely
open mode. In the closed mode, an initial quantity of air is introduced into the system
and recirculated throughout the process. In the other two modes, there is partial or
complete discharge–intake of the air that acts as the working fl uid for the drying
system. The primary condenser is located in the path of the air stream, which implies
that any heat rejection over this retains the energy within the system, whereas the
secondary water-cooled coil channels the energy out of the system to the environment.
52527_C013.indd 41652527_C013.indd 416 10/17/2008 12:26:03 PM10/17/2008 12:26:03 PM
© 2009 by Taylor & Francis Group, LLC

Nonconventional Heating Sources during Drying 417
Various agriproducts such as apple, banana, onion, and potato rings were heat
pump dried by Sosle et al. (2003). In most cases, the products were dried from an
initial moisture content of 85 to 90% wet basis to a fi nal 10 to 12% wet basis. The
products obtained by the process were of exceptionally high quality. The color
degradation was negligible and the fl avor was free from any process-induced aber-
rations (Sosle et al., 2003). Their observations showed a distinct advantage of the
novel drying process over conventional methods in preserving the integrity of the
cellular structure of the plant material. The low temperature drying that was
achieved was less destructive toward the cell walls and led to a gradual, gentle
collapse of the cells, which recovered their turgor remarkably upon rehydration
(Sosle et al., 2003).
Cardona et al. (2002) studied heat pump drying of lactic acid bacteria. They
obtained high-quality dried products with the use of dehydroprotectants and nitrogen
purging.
Hawlader et al. (2006) compared the loss of gingerol when ginger was dried by air
drying, modifi ed atmosphere heat pump drying, freeze-drying, and vacuum drying.
Using inert gases such as N2 and CO2, the modifi ed atmosphere heat pump drying
process improved the quality and gingerol retention of dried ginger better than
freeze-drying.
13.6 CONCLUSION
The trend in recent years has been concentrated on the incorporation of multiple
transfer mechanisms and energy sources. Developments are reported for heat pump,
IR, RF, and MW dryers.
FIGURE 13.6 Schematic of a heat pump dryer. (From Sosle, V. et al., Dry. Technol., 21,
539–554, 2003. With permission.)
52527_C013.indd 41752527_C013.indd 417 10/17/2008 12:26:04 PM10/17/2008 12:26:04 PM
© 2009 by Taylor & Francis Group, LLC

418 Advances in Food Dehydration
Because of their selective and volumetric heating effects, MWs bring new
characteristics to various bioprocessing techniques such as an increased rate of
drying, enhanced fi nal product quality, and improved energy consumption.
The quality of MW dried commodities is often between air dried and freeze-
dried products. The rapidity of the process yields better color and retention of aroma.
Quality is further improved when a vacuum is used because the thermal and oxida-
tive stresses are reduced.
The operating conditions of a MW drying process are dependent on the com-
modity. In some cases, an osmotic pretreatment is recommended (as with cranber-
ries) or the process should be combined with either hot air (for moisture removal) or
a vacuum (to keep the temperature to a minimum).
Because electrotechnologies are based on electric power sources, which are free
of chemicals, they provide a more ecological and stable environment cost than a fuel-
based conventional processing method. Past research successfully demonstrated that
electromagnetic energy can be used effi ciently at a fraction of the energy consump-
tion of conventional equipment presently found in the agrifood sector.
The development of new applications for MW, RF, IR, and electroheating of
materials has been steadily increasing over the years. This is a high tech growth
industry with much untapped potential, and it has recently been adapted to biomedi-
cal needs. We can expect this area to become more important in parallel with the
increased development of sources of electrical energy, whether they are hydro, solar,
wind, or nuclear driven. Furthermore, the increased pressure to reduce combustion of
fossil fuels is forcing the private sector to investigate alternate sources of heating for
a wide variety of processes that require thermal input.
NOMENCLATURE
P energy per unit volume (W/m3)
E electric fi eld strength (V/m)
e0 absolute permittivity of vacuum (8.854188 × 10⁻¹² F/m)
e¢ dielectric constant (relative real permittivity, F/m)
e≤ dielectric loss factor (relative dielectric loss factor, F/m)
f frequency (Hz)
tan � � e≤/e¢ dielectric loss tangent
REFERENCES
Avramidis, S. and Zwick, R.L., Commercial-scale RF/V drying of softwood lumber. 2:
Drying characteristics and lumber quality, Forest Prod. J., 46, 27–36, 1996.
Barbosa-Canovas, S.G. and Vega-Mercado, H., Dehydration of Foods, Chapman & Hall,
New York, 1996.
Beaudry, C., Raghavan, G.S.V., Ratti, C., and Rennie, T.J., Effect of four drying methods
on the quality of osmotically dehydrated cranberries, Dry. Technol., 22, 521–539,
2004.
Böhm V., Kühnert, S., Rohm, H., and Scholze, G., Improving the nutritional quality of
microwave–vacuum dried strawberries: A preliminary study, Food Sci. Technol. Int., 12, 67–75, 2006.
52527_C013.indd 41852527_C013.indd 418 10/17/2008 12:26:04 PM10/17/2008 12:26:04 PM
© 2009 by Taylor & Francis Group, LLC

Nonconventional Heating Sources during Drying 419
Cardona, T.D., Driscoll, R.H., Paterson, J.L., Srzednicki, G.S., and Kim, W.S., Optimizing
conditions for heat pump dehydration of lactic acid bacteria, Dry. Technol., 20,
1611–1632, 2002.
Changrue, V., Sunjka, P.S., Gariepy, Y., Raghavan, G.S.V., and Wang, N., Real-time control
of microwave drying process, in Drying 2004, Proceedings of the 14th International Drying Symposium, Silv, M.A. and Rocha, S.C.S., Eds., State University of Campinas,
Campinas, Brazil, 2004, pp. 941–948.
Chou, S.K. and Chua, K.J., New hybrid drying technologies for heat sensitive foodstuffs,
Trends Food Sci. Technol., 12, 359–369, 2001.
Chou, S.K. and Chua, K.J., Heat pump drying systems, in Handbook of Industrial Drying,
3rd ed., Mujumdar, A.S., Ed., CRC Press, Boca Raton, FL, 2007, pp. 1103–1131.
Chua, K.J., Mujumdar, A.S., Chou, S.K., Hawlader, M.N.A., and Ho, J.C., Convective drying
of banana, guava and potato pieces: Effect of cyclical variations of air temperature on
drying kinetics and color change, Dry. Technol., 18, 907–936, 2000.
Cui, Z.-W., Xu, S.-Y., and Sun, D.-W., Dehydration of garlic slices by combined microwave
vacuum and air drying, Dry. Technol., 21, 1173–1184, 2003.
Decareau, R.V., Microwaves in the Food Processing Industry, Academic Press, Orlando, FL,
1985.
Demeczky, M., Application of dielectric techniques in food production and preservation,
in Developments in Food Preservation, Thorne, S., Ed., Elsevier, London, 1985,
pp. 127–181.
Drouzas, A.E. and Schubert, H., Microwave application in vacuum drying of fruit, J. Food Eng., 28, 203–209, 1996.
EnWave Corporation, http://www.enwave.net, 2007.
Erle, U., Drying using microwave processing, in The Microwave Processing of Foods,
Schubert, H. and Regier, M., Eds., Woodhead Publishing, Cambridge, U.K., 2005,
pp. 142–152.
GEA Niro Pharma Systems, http://www.niropharma.com, 2007.
Giri, S.K. and Prasad, S., Drying kinetics and rehydration characteristics of microwave–
vacuum and convective hot air dried mushrooms, J. Food Eng., 78, 512–521, 2007.
Goullieux, A. and Pain, J.-P., Ohmic heating, in Emerging Technologies for Food Processing,
Sun, D.W., Ed., Elsevier Ltd., London, 2005, pp. 469–505.
Hawlader, M.N.A., Perera, C.O., and Tian, M., Comparison of the retention of 6-gingerol in
drying of ginger under modifi ed atmosphere heat pump drying and other drying
methods, Dry. Technol., 24, 51–56, 2006.
Heap, R.D., Heat Pumps, E. & F.N. Spon, London, 1979.
Hebbar, H.U., Vishwanathan, K.H., and Ramesh, M.N., Development of combined infrared
and hot air dryer for vegetables, J. Food Eng., 65, 557–563, 2004.
Ikediala, J.N., Hansen, J.D., Tang, J., Drake, S.R., and Wang, S., Development of a saline
water immersion technique with RF energy as a postharvest treatment against codling
moth in cherries, Postharv. Biol. Technol., 24, 25–37, 2002.
Jayaraman, K.S. and Gupta, D.K., Dehydration of fruit and vegetable—Recent developments
in principles and techniques, Dry. Technol., 10, 1–50, 1992.
Jones, P.L., Radio-frequency processing in Europe, J. Microwave Power Electromagn. Energy, 22, 143–153, 1987.
Kreyenborg GmbH, http://www.kreyenborg.com/en/kreyenborg/index.php, 2007.
Kudra, T., Raghavan, G.S.V., Akyel, C., Bosisio, R., and van de Voort, F., Electromagnetic
properties of milk and its constituents at 2.45 GHz, J. Microwave Power Electromagn. Energy, 27, 199–203, 1992.
Kwok, B.H.L., Hu, C., Durance, T., and Kitts, D.D., Dehydration techniques affect phyto-
chemical contents and free radical scavenging activities of Saskatoon berries
(Amelanchier alnifolia Nutt.), J. Food Sci., 69, S122–S126, 2004.
52527_C013.indd 41952527_C013.indd 419 10/17/2008 12:26:04 PM10/17/2008 12:26:04 PM
© 2009 by Taylor & Francis Group, LLC

420 Advances in Food Dehydration
Lenart, A., Osmo-convective drying of fruits and vegetables: Technology and application,
Dry. Technol., 14, 391–413, 1996.
Lin, T.M., Durance, T.D., and Scaman, C.H., Characterization of vacuum microwave, air and
freeze dried carrot slices, Food Res. Int., 31, 111–117, 1998.
Mermelstein, N.H., Microwave and radio frequency drying, Food Technol., 52, 84–85,
1998.
Metaxas, A.C., Foundations of Electroheat: A Unifi ed Approach, John Wiley & Sons Ltd.,
Chichester, U.K., 1996.
Microdry Incorporated, http://www.microdry.com, 2007.
Mudgett, R.E., Electrical properties of foods, in Microwave in the Food Processing Industry,
Decareau, R., Ed., Academic Press, London, 1985.
Mudgett, R.E., Microwave properties and heating characteristics of foods, Food Technol., 40,
84–93, 1986.
Mujumdar, A.S., Ed., Handbook of Industrial Drying, 3d ed., CRC Press, Boca Raton, FL,
2007, p. 1280.
Murphy, A., Morrow, R., and Besley, L., Combined radio-frequency and forced-air drying of
alfalfa, J. Microwave Power Electromagn. Energy, 27, 223–232, 1992.
Nelson, S.O., Electrical properties of agricultural products—A critical review, Trans. ASAE,
16, 384–400, 1973.
Nemes, S.M., Sivakumar, S.S., Gariepy, Y., and Raghavan, G.S.V., Microwave vacuum drying
of banana slices under different power levels, in Proceedings of the 3rd Inter-American Drying Conference (IADC 2005), Orsat, V., Raghavan, G.S.V., and Kudra, T., Eds.,
McGill University, Montreal, 2005.
Nsonzi, F. and Ramaswamy, H.S., Osmotic dehydration kinetics of blueberries, Dry. Technol., 16, 725–741, 1998.
Orsat, V. and Raghavan, G.S.V., Review of the design aspects of radio-frequency heating for
development of agri-food applications, in Dehydration of Products of Biological Origin, Mujumdar, A.S., Ed., Science Publishers, Enfi eld, NH, 2004, pp. 467–492.
Orsat, V. and Raghavan, G.S.V., Radio frequency processing, in Emerging Technologies for Food Processing, Sun, D.W., Ed., Elsevier Ltd., London, 2005, pp. 445–468.
Orsat, V., Raghavan, G.S.V., and Meda, V., Microwave technology for food processing: An
overview, in The Microwave Processing of Foods, Schubert, H. and Regier, M.M., Eds.,
Woodhead Publishing, Cambridge, U.K., 2005, pp. 105–118.
Orsat, V., Yang, W., Changrue, V., and Raghavan, G.S.V., Microwave-assisted drying of
biomaterials, Food Bioprod. Process., 85, 1–9, 2007.
Osepchuk, J.M., Microwave power applications, IEEE Trans. Microwave Theory Tech., 50,
975–985, 2002.
Pai, G.A., Mock, G.N., Grady, P.L., Graham, R.W., Crabtree, K.K., and Moore, E.J., Radio
frequency drying in the textile industry, paper presented at the IEEE 1989 Annual
Textile Industry Technical Conference, paper 89CH2697-1 P9/1-9/3, 1989.
Pathare, P.B. and Sharma, G.P., Effective moisture diffusivity of onion slices undergoing
infrared convective drying, Biosyst. Eng., 93, 285–291, 2006.
Piotrowski, D., Lenart, A., and Wardzynski, A., Infl uence of osmotic dehydration on micro-
wave–convective drying of frozen strawberries, J. Food Eng., 65, 519–525, 2004.
Piyasena, P., Dussault, C., Koutchma, T., Ramaswamy, H.S., and Awuah, G.B., Radio-
frequency heating of foods: Principles, applications and related properties—A review,
Crit. Rev. Food Sci. Nutr., 43, 587–606, 2003.
Püschner Microwave Power Systems, http://www.pueschner.com, 2007.
Raghavan, G.S.V., Rennie, T.J., Sunjka, P.S., Orsat, V., Phaphuangwittayakul, W., and
Terdtoon, P., Overview of new techniques for drying biological materials with emphasis
on energy aspects, Brazil. J. Chem. Eng., 22, 195–201, 2005.
52527_C013.indd 42052527_C013.indd 420 10/17/2008 12:26:04 PM10/17/2008 12:26:04 PM
© 2009 by Taylor & Francis Group, LLC

Nonconventional Heating Sources during Drying 421
Ratti, C. and Mujumdar, A.S., Infrared drying, in Handbook of Industrial Drying, 3rd ed.,
Mujumdar, A.S., Ed., CRC Press, Boca Raton, FL, 2007, pp. 423–438.
Regier, M., Mayer-Miebach, E., Behsnilian, D., Neff, E., and Schuchmann, H.P., Infl uences
of drying and storage of lycopene-rich carrots on the carotenoid content, Dry. Technol., 23, 989–998, 2005.
Sairem Microwave & Radio Frequency, http://www.sairem.com, 2007.
Schiffmann, R.F., Microwave and dielectric drying, in Handbook of Industrial Drying,
3rd ed., Mujumdar, A.S., Ed., CRC Press, Boca Raton, FL, 2007, pp. 285–305.
Sharma, G.P. and Prasad, S., Optimization of process parameters for microwave drying of
garlic cloves, J. Food Eng., 75, 441–446, 2006.
Shi, J.X., Le Maguer, M., Wang, S.L., and Liptay, A., Application of osmotic treatment in
tomato processing—Effect of skin treatments on mass transfer in osmotic dehydration
of tomatoes, Food Res. Int., 30, 669–674, 1997.
Sosle, V., Heat pump drying, Stewart Postharv. Rev., 2, 3, 2006.
Sosle, V., Raghavan, G.S.V., and Kittler, R., Low-temperature drying using a versatile heat
pump dehumidifi er, Dry. Technol., 21, 539–554, 2003.
Soysal, Y., Oztekin, S., and Eren, O., Microwave drying of parsley modeling, kinetics and
energy aspects, Biosyst. Eng., 93, 403–413, 2006.
Strommen, I. and Jonassen, O., Performance tests of a new 2-stage counter-current heat pump
fl uidized bed dryer, in Drying ‘96, Proceedings of IDS 96, Vol. A, Strumillo, C. and
Pakowski, Z., Eds., Lodz Technical University Publisher, Lodz, Poland, 1996,
pp. 563–568.
Strommen, I. and Kramer, K., New applications of heat pumps in drying processes, Dry. Technol., 12, 889–901, 1994.
Sunjka, P.S. and Raghavan, G.S.V., Assessment of pretreatment methods and osmotic
dehydration of cranberries, Can. Biosyst. Eng., 4, 3.35–3.40, 2004.
Sunjka, P.S., Rennie, T.J., Beaudry, C., and Raghavan, G.S.V., Microwave/convective and
microwave/vacuum drying of cranberries: A comparative study, Dry. Technol., 22,
1217–1231, 2004.
Tireki, S., Sumnu, G., and Esin, A., Production of breadcrumb by infrared-assisted microwave
drying, Eur. Food Res. Technol., 222, 8–14, 2006.
Tulasidas, T.N., Raghavan, G.S.V., and Mujumdar, A.S., Microwave drying of grapes in a
single mode cavity at 2450 MHz—II: Quality and energy aspects, Dry. Technol., 13,
1973–1992, 1995a.
Tulasidas, T.N., Raghavan, G.S.V., and Mujumdar, A.S., Microwave drying of grapes in a single
mode cavity at 2450MHz. I. Drying kinetics, Dry. Technol., 13, 1949–1971, 1995b.
Tulasidas, T.N., Raghavan, G.S.V., van de Voort, F., and Girard, R., Dielectric properties of
grapes and sugar solutions at 2.45 GHz, J. Microwave Power Electromagn. Energy, 30,
117–123, 1995.
Union Internationale d’Électrothermie (International Union of Electroheat), Dielectric
heating for industrial processes, UIE Working Group paper, La Defense, Paris, 1992.
Vega-Mercado, H., Gongora-Nieto, M.M., and Barbosa-Canovas, G.V., Advances in
dehydration of foods, J. Food Eng., 49, 271–289, 2001.
Venkatachalapathy, K. and Raghavan, G.S.V., Combined osmotic and microwave drying of
strawberry, Dry. Technol., 17, 837–853, 1999.
Venkatachalapathy, K. and Raghavan, G.S.V., Microwave drying of whole, sliced and pureed
strawberries, Agric. Eng. J., 9, 29–39, 2000.
Venkatesh M.S. and Raghavan, G.S.V., An overview of microwave processing and dielectric
properties of agri food materials, Biosyst. Eng., 88, 1–18, 2004.
Venkatesh, M.S. and Raghavan, G.S.V., An overview of dielectric properties measuring
techniques, Can. Biosyst. Eng., 47, 15–30, 2005.
52527_C013.indd 42152527_C013.indd 421 10/17/2008 12:26:05 PM10/17/2008 12:26:05 PM
© 2009 by Taylor & Francis Group, LLC

422 Advances in Food Dehydration
Wang, J. and Sheng, K., Far-infrared and microwave drying of peach, Lebensm.-Wiss. Technol., 39, 247–255, 2006.
Wang, J. and Xi, Y.S., Drying characteristics and drying quality of carrot using a two-stage
microwave process, J. Food Eng., 68, 505–511, 2005.
Wang, S., Tang, J., Johnson, J.A., Mitcham, E., Hansen, J.D., Hallman, G., Drake, S.R., and
Wang, Y., Dielectric properties of fruits and insect pests as related to radio-frequency
and microwave treatments, Biosyst. Eng., 85, 201–212, 2003.
Wang, Y., Wig, T.D., Tang, J., and Hallberg, L.M., Dielectric properties of foods relevant to
RF and microwave pasteurization and sterilization, J. Food Eng., 57, 257–268, 2003.
Yanyang, X., Min, Z., Mujumdar, A.S., Le-qun, Z., and Jian-cai, S., Studies on hot air and
microwave vacuum drying of wild cabbage, Dry. Technol., 22, 2201–2209, 2004.
Yongsawatddigul, J. and Gunasekaran, S., Microwave–vacuum-drying of cranberries: Part I:
Energy use and effi ciency. Part II: Quality evaluation, J. Food Process. Preserv., 20,
121–156, 1996.
Zhao, Y., Flugstad, B., Kolbe, E., Park, J.W., and Wells, J.H., Using capacitive (radio frequency)
dielectric heating in food processing and preservation—A review, J. Food Process Eng., 23, 25–55, 2000.
52527_C013.indd 42252527_C013.indd 422 10/17/2008 12:26:05 PM10/17/2008 12:26:05 PM
© 2009 by Taylor & Francis Group, LLC

423
14 Energy Aspects in Food Dehydration
Tadeusz Kudra
CONTENTS
14.1 Introduction ............................................................................................. 423
14.2 Energy Measures ..................................................................................... 425
14.2.1 Energy and Thermal Effi ciency ............................................... 425
14.2.2 Specifi c Energy Consumption ................................................. 430
14.2.3 Energy Indices for Particular Technologies ............................. 432
14.2.4 Instantaneous Energy Indices .................................................. 432
14.3 Selected Energy-Saving Technologies .................................................... 435
14.3.1 Foam-Mat Drying .................................................................... 436
14.3.2 Intermittent Drying .................................................................. 437
14.3.3 Combined Osmotic Dehydration and Thermal Drying ........... 440
14.4 Summary ................................................................................................. 441
Nomenclature ..................................................................................................... 441
Abbreviations and Variables ................................................................... 441
Greek Symbols ........................................................................................ 442
Subscripts ................................................................................................ 442
Superscripts ............................................................................................. 443
References .......................................................................................................... 443
14.1 INTRODUCTION
Thermal drying has long been recognized as one of the most energy-intensive
operations in solids–liquid separation. The share of drying energy in industrial
energy use ranges from 10 to 25%, although in some industrial sectors it is much
higher, reaching 35% in paper production and even 50% in fi nishing of textile fabrics
(Kudra, 2004; Mujumdar, 2007). It is diffi cult to estimate drying energy use in the
agrifood sector because of the diversity of food products, multiplicity of food pro-
ducers, and frequent use of process coproducts as supplementary fuel. Nevertheless,
12% was quoted for England and 27% for France over two decades ago (Strumillo
et al., 2007). At present, higher numbers can be anticipated because the percentage
of drying energy is progressively increasing (Baker, 2005). For example, Kemp
52527_C014.indd 42352527_C014.indd 423 10/1/2008 12:15:01 PM10/1/2008 12:15:01 PM
© 2009 by Taylor & Francis Group, LLC

424 Advances in Food Dehydration
(1998) indicates that the drying proportion of the U.K. industrial energy consumption
has risen by 4% over 12 years. Because almost 99% of applications involve removal
of water (Mujumdar, 2007), such high energy consumption is primarily due to the
latent heat of water vaporization, which is 2500 kJ/kg at 0°C. The fraction of thermal
energy can be favorably reduced by upstream mechanical separation or nonthermal
dewatering such as membrane processing and osmotic dehydration. An interesting
option for drying certain fruits such as cranberries is osmotic dehydration prior to
thermal drying because such a hybrid technology not only reduces energy consump-
tion but also offers a product of enhanced quality (Grabowski et al., 2002). Basically,
ineffi cient convective dryers, which account for about 85% of all industrial dryers
(Mujumdar, 2007), are the second contributor to the high energy demands for drying.
Thus, concentrating the liquid feed by evaporation prior to spray drying can notably
reduce the heat load to the dryer because the energy demand for evaporation ranges
from 360 to 3600 kJ/kg versus 2900 to 5400 kJ/kg for a single spray dryer, even
though higher values were also reported, such as 9040 kJ/kg for spray drying of
sweet whey (Trägårdh, 1986).
Except for certain technologies such as contact drying, dielectric drying, sorp-
tion drying, freeze-drying, or drying on inert particles (Kudra and Mujumdar, 2002),
the majority of foodstuffs are convection dried either by dispersing liquid materials
into a hot air stream as in spray drying or by blowing hot air through a wet granular
material as in rotary, fl uidized bed, or belt dryers. Hot air drying requires high
energy input because of ineffi cient air–material heat transfer and the signifi cant
amount of energy lost with the exhaust air, even if its temperature approaches the wet
bulb temperature. Various measures, such as partial recycling of exhaust gas or heat
recovery, can increase the overall energy effi ciency of the dryer. However, the energy
cost in terms of heat represents a signifi cant percentage of the total drying costs of
food and agriproducts, especially when using ineffi cient methods such as indirect
heating of the drying air.
Energy consumption can vary considerably, depending on the physical and
thermal characteristics of the material, product quality requirements, and drying
technology. An example of a fairly energy effi cient process is spray drying of milk,
in which raw milk concentrated by evaporation to approximately 50% solids is then
dried to a fi nal moisture content of 3 to 4% wet basis (w.b.). The specifi c energy
consumption amounts to 5300 kJ/kg water evaporated in a single-stage concurrent
spray dryer (Tang et al., 1999). This yields an energy effi ciency (defi ned as the ratio
of energy needed for moisture evaporation to the energy supplied to the dryer) of
about 47%. The use of two-stage and three-stage drying systems reduces specifi c
energy consumption to 4500 and 4000 kJ/kg H2O, respectively. Thus, replacing the
most frequently used two-stage dryers with three-stage ones could reduce the energy
demand by 465 kJ/kg milk powder. In Canada, which produced 72,420 tonnes of
skim milk powder in 2006 (Canadian Dairy Information Centre, 2007), such
technology upgrades would result in appreciable energy savings.
An example of a highly energy intensive process is the drying of ginseng root.
The initial moisture content of ~70% w.b. should be reduced to �10% w.b. for safe
storage. Typically, the whole roots are placed on perforated trays stacked in a heated
chamber and dried by hot air fl owing through the trays. At 38°C, which is the
52527_C014.indd 42452527_C014.indd 424 10/1/2008 12:15:01 PM10/1/2008 12:15:01 PM
© 2009 by Taylor & Francis Group, LLC

Energy Aspects in Food Dehydration 425
optimum temperature for quality product, the drying time is on the order of 240 to
280 h. Under such conditions the specifi c energy consumption is close to 40,000 kJ/kg
evaporated water (Reynolds, 1998), although twofold higher values were calculated
based on the energy use by ginseng farmers. Accepting an activation energy of
3650 kJ/kg water at 38°C (Martynenko, 2007), the energy effi ciency ranges from
5 to 9%. The annual ginseng production in Canada amounts to 2510 tonnes, so the
energy spent for drying is on the order of 2 × 10¹¹ kJ/year.
These two extreme examples clearly indicate that energy consumption is an
important issue in the drying of constantly increasing food production, even for
materials that contain signifi cant amounts of easily removed water and that are dried
in relatively effi cient dryers. The attempts to improve energy effi ciency start with an
energy audit for a dryer in use followed by a thorough analysis of the existing litera-
ture and technical information to identify options to reduce energy consumption.
However, the reported data should be considered with caution: inconsistent terminol-
ogy and calculation methods are found that, although starting with apparently identi-
cal indices, can lead to drastically different results (Kudra, 2004). For example, if a
given index is not explicitly defi ned, care should be taken to not confuse drying
effi ciency with energy effi ciency, because the latter generally yields lower values.
This chapter provides a concise overview of the most frequently used energy
indices in order to establish a common platform for various measures of energy use,
permitting the objective comparison of various dryers and a credible assessment of
options for reducing energy consumption.
14.2 ENERGY MEASURES
14.2.1 ENERGY AND THERMAL EFFICIENCY
The performance of a drying system is characterized by various indices, including
energy effi ciency, thermal effi ciency, volumetric evaporation rate, specifi c heat
consumption, surface heat losses, unit steam consumption, and so forth, that are
defi ned to refl ect the particularities of various drying processes such as intermittent
drying, microwave-assisted drying, or heat pump drying. Of these indices, energy
effi ciency and specifi c heat consumption are most frequently used to assess dryer
performance from the energy viewpoint.
The energy effi ciency (h) relates the energy used for moisture evaporation at the
feed temperature (Eev) to the total energy supplied to the dryer (Et):
h � Eev ___ Et
(14.1)
The energy needed for moistutre evaporation is commonly calculated from the
mass of evaporated water and the latent heat of vaporization (�H). The calculation of
the mass of the evaporated water can be based on either the initial and fi nal material
moisture content or the inlet and outlet air (drying agent) humidity. Because the mate-
rial temperature is rarely known, the latent heat of vaporization is taken as the feed
temperature, although some calculations of energy effi ciency are based on the latent
heat of vaporization at 100°C. However, utilizing the feed temperature is more
52527_C014.indd 42552527_C014.indd 425 10/1/2008 12:15:01 PM10/1/2008 12:15:01 PM
© 2009 by Taylor & Francis Group, LLC

426 Advances in Food Dehydration
accurate because during convective drying the material temperature is frequently
equal or close to the wet bulb temperature. Thus, the difference between both
temperatures is much smaller than between 100°C and the wet bulb temperature, even
at higher drying temperatures.
The assumption on evaporation from a free water surface penalizes a majority of
foods because they dry mostly in the falling drying rate period. Therefore, it is
worthwhile to consider another measure of energy in the numerator of Eq. (14.1) such
as the sorption energy.
Thermal energy supplied to the external or internal heater or combustion heat
released in the burner is a major part of the total energy supplied to the dryer. For
some dryers, however, additional energy inputs cannot be neglected. This is the case
in the electrical energy needed to run a microwave generator in microwave-assisted
drying; additional energy is necessary to vibrate or rotate the dryer, disperse the feed,
and stir the product. A notable fraction of energy can be needed to run the blowers
that force an air stream through the drying system not only to remove the evaporated
moisture but also to provide the required hydrodynamic conditions, especially in
dryers with active hydrodynamics (progressive dryers) such as fl uidized bed dryers,
spouted bed dryers, pneumatic dryers, or dryers with impinging streams.
Regarding only the energy used to heat drying air that enters a single pass,
theoretical convective dryer, Eq. (14.1) can be rewritten as
ht � DH __________
W*(I1 � Ia) �
DH (Y2 � Ya) ___________ I1 � Ia
� DH(Y2 � Ya) ___________
I2 � Ia
(14.2)
where Y2 and Ya are the outlet and ambient air humidities, respectively; I1 and Ia are the
inlet and ambient enthalpies, respectively; and W* is the specifi c air consumption given
as the mass of air required to evaporate 1 kg of water (Strumillo and Kudra, 1986):
W* � Wg
___ Wev
� 1 _______ Y2 � Ya
(14.3)
where Wg and Wev are the gas and evaporation fl ow rates, respectively.
A theoretical dryer is defi ned as a dryer with no heat spent for heating the
material and transportation equipment, heat is not supplied to the internal heater,
heat is not lost to the ambient atmosphere, and the inlet material temperature is 0°C.
This means that energy supplied to the external heater is used solely to increase
the enthalpy of the exit air (Strumillo and Kudra, 1986). A difference in the heat
consumption in the external heater for the real and theoretical dryers quantifi es the
heat losses (�Ql) per kilogram of evaporated water. Thus, the energy effi ciency of a
real dryer can be determined from the following relation:
h � �H ________________ W*(I2 � Ia) � �Ql
(14.4)
or expressed in terms of the theoretical dryer (Nevenkin, 1985):
h � 1 ________________ (1/ht ) � (�Ql/DH)
(14.5)
52527_C014.indd 42652527_C014.indd 426 10/1/2008 12:15:01 PM10/1/2008 12:15:01 PM
© 2009 by Taylor & Francis Group, LLC

Energy Aspects in Food Dehydration 427
For low humidity and low temperature convective drying, the energy effi ciency
can be approximated by the thermal effi ciency (hT) that is based on the inlet air
temperature (T1), the outlet air temperature (T2) and the ambient temperature
(Ta) (Strumillo et al., 2007):
hT � T1 � T2 _______ T1 � Ta
(14.6)
Equation (14.6) shows that hT can vary from 0 (for T2 � T1) to 1 (for T2 � Ta) if
T1 � Ta.
Because of water evaporation the outlet air temperature is lower than the inlet
temperature. Theoretically, its minimum value will attain either the adiabatic satura-
tion temperature (TAS) or the wet bulb temperature (TWB), depending on the air–water
ratio. Thus, the maximum thermal effi ciency (hT,max) can be determined from the
following relations:
hT,max � T1 � TWB ________ T1 � Ta
(14.7)
or
hT,max � T1 � TAS ________ T1 � Ta
(14.8)
Similar to Eq. (14.6), both equations for maximum thermal effi ciency do not
hold true when T1 approaches Ta.
At the low temperatures and humidities of air–water systems, the wet bulb
temperature is negligibly higher than the adiabatic saturation temperature (Bond,
2002; Pakowski, 2001). Thus, either equation can be used to determine by how much
a given thermal effi ciency departs from the maximum one:
c � hT ______ hT, max
� T1 � T2 ________
T1 � TWB
� T1 � T2 ________
T1 � TAS
(14.9)
Parameter c is an equivalent of the evaporative effi ciency frequently used in
spray drying (Masters, 2002) because it refl ects the ratio of the actual evaporative
capacity of the dryer to the capacity obtained in the ideal case of exhausting air at
saturation.
As shown in Eqs. (14.7) and (14.8), the maximum thermal effi ciency is based on
the wet bulb temperature or the adiabatic saturation temperature. This implies that
unbound water in a drying material is either in adiabatic contact with a limited
amount of air to attain equilibrium or in contact with a large amount of unsaturated
air. Further, the material is either nonhygroscopic or contains large amounts of sur-
face water to exhibit a constant rate drying period under constant drying conditions.
However, most materials, especially foods, dry in the constant and falling rate peri-
ods or only in the falling rate period, so the material temperature rises progressively
from the wet bulb temperature once unbound water is removed. For such materials,
it is more realistic to determine the maximum energy effi ciency based on a relation-
ship between the material moisture content and air humidity.
52527_C014.indd 42752527_C014.indd 427 10/1/2008 12:15:02 PM10/1/2008 12:15:02 PM
© 2009 by Taylor & Francis Group, LLC

428 Advances in Food Dehydration
From Eq. (14.2) it follows that maximum energy effi ciency exists when the
exhaust air is saturated with water vapor, although this never occurs in practice
because of operational constraints such as condensation problems. For a given evap-
oration rate, saturation of the exhaust air ( Y 2 sat ) can be attained when the air fl ow is
minimal yet securing both heat and hydrodynamic requirements. Thus,
hmax � DH( Y
2 sat � Ya)
____________ I2 � Ia
(14.10)
Equation (14.10) can be easily transformed into Eqs. (14.7) and (14.8) based on
fundamental relationships for humid air. However, all of these equations are valid for
convective drying during the constant rate period when unbound water is evaporated.
When hygroscopic materials are being processed, the relative humidity of the air stream
at any point in the dryer should be less than the equilibrium relative humidity at this
point. Thus, for such materials the maximum energy effi ciency is restricted not by satu-
ration but by the equilibrium air humidity ( Y 2 eq ) determined from sorption isotherms:
hmax � DH( Y
2 eq � Ya)
___________ I2 � Ia
(14.11)
Figure 14.1 presents the maximum energy effi ciency plotted against the inlet air
temperature for a nonhygroscopic material [Eq. (14.10)] and a hygroscopic material
1.0
0.9
0.8
0.7
0.6
0.5
0.4
Max
imum
ene
rgy
effic
ienc
y (h
max
)
0.3
0.2
0.1
070 90 110
Temperature (T1, °C)
Xeq = 0.000735 exp[1750/(273 + T )] [RH/(1 – RH)]0.401
Ya = 0.005 kg/kg
Ya = 0.01 kg/kg
Ta = 20°C
Carrot
Nonhygroscopic material
130 150
FIGURE 14.1 Maximum energy effi ciency for hygroscopic and nonhygroscopic materials. The
equation for the equilibrium moisture content was taken from Maroulis and Saravacos (2003).
52527_C014.indd 42852527_C014.indd 428 10/1/2008 12:15:02 PM10/1/2008 12:15:02 PM
© 2009 by Taylor & Francis Group, LLC

Energy Aspects in Food Dehydration 429
[Eq. (14.11)] represented by carrots, the sorption isotherm Xeq � f (RH, T ) for which
was taken from Maroulis and Saravacos (2003), where Xeq is the equilibrium material
moisture content, T is the temperature, and RH is the relative humidity. To determine
the Y 2 eq , the typical moisture content of dry carrots of 0.1kg/kg dry basis (d.b.) was
assumed to be the same as the Xeq. Then, the air relative humidity was calculated from
the equilibrium equation for several temperatures ranging from 25 to 75°C, which
covers the foreseen range of outlet air temperatures during adiabatic drying at inlet air
temperatures varying from 70 to 150°C. The line drawn on the Mollier chart across the
points (RH, T ) depicts the variation of the Y 2 eq with temperature for a carrot moisture
content of 0.1kg/kg d.b. The particular value of Y 2 eq for a given inlet air temperature is
determined by the intersection of the isenthalpic and equilibrium lines. Similarly, the
intersection of the isenthalpic and saturation lines specifi es the value of Y 2 sat .
The relatively high and almost constant energy effi ciency for nonhygroscopic
materials can be anticipated in view of unbound water evaporation. Although a
particular variation of the maximum energy effi ciency for hygroscopic materials is
dictated by the sorption isotherms, the curves are located well below their counter-
parts for nonhygroscopic materials. Thus, evaluation of the energy performance of
a given dryer may result in overestimated values if the sorption isotherms are not
taken into account.
According to Eqs. (14.2) to (14.11), the thermal effi ciency (and indirectly the energy
effi ciency) depends on the inlet and outlet temperatures of a drying agent, the
ambient temperature, and the air humidity. Because the energy performance of the dryer
is affected by ambient conditions, it will vary from day to day, depending on climatic
conditions. For given ambient parameters, high energy effi ciencies are attained by
using high inlet temperatures and by arranging for outlet air conditions that are close
to saturation. However, certain constraints should be considered when playing with
operating parameters to maximize energy effi ciency. For instance, high humidity
implies reduced driving force that could result in slower drying. Condensation may
occur on the dryer wall and downstream equipment, so the already dry product will
stick to the walls and eventually clog the system. Although higher effi ciencies can be
obtained at higher inlet air temperatures, the maximum temperature is limited by
quality loss that is attributable to thermal degradation of the product. In heat- sensitive
materials, the temperature at any point in the dryer should be lower than the permis-
sible material temperature. In general, the inlet air temperature in drying of foods
does not exceed 200°C, and 300°C is the upper limit in spray drying of some materials
such as coffee extract and fodder yeast (Masters, 2002). An excessive temperature
may change the temperature profi les across the dryers and bring about an increase in
the outlet air temperature. This can lead to overdrying and provoke adverse effects
such as deactivation of enzymes, deterioration of proteins, and generation of
poisonous (carcinogenic) substances. Moreover, the particle size and bulk density
can be greatly reduced because of the expansion of the vapor and air bubbles occluded
in the droplets, which may also lead to increased volatile retention. Furthermore, if
the outlet air temperature is higher than the glass-transition temperature, it may cause
stickiness of certain products, which leads to lower product yields and operation
problems such as clogging of the dryer. In addition to amorphous products, the
materials prone to stickiness are those containing low molecular weight carbohydrates,
52527_C014.indd 42952527_C014.indd 429 10/1/2008 12:15:02 PM10/1/2008 12:15:02 PM
© 2009 by Taylor & Francis Group, LLC

430 Advances in Food Dehydration
fat, and proteins. Typical examples are tomato paste, milk, and orange juice (Brennan
et al., 1971; Goula et al., 2004; Kota and Langrish, 2006). The temperature level can
also be constrained by economic reasons such as the additional costs of air heating
and more expensive materials of construction that can withstand higher temperatures
in the heater and the dryer.
The effect of the air-fl ow rate on the thermal effi ciency is not explicit because
this parameter is not incorporated into Eqs. (14.6) through (14.9). However, if the
air-fl ow rate is not limited by the heat demand, then at lower fl ow rates and the same
evaporative capacity the exhaust air stream will be more humid and give higher
energy effi ciency, as can be concluded from Eq. (14.2). Note that a signifi cant amount
of energy is lost with exhaust air even if its temperature approaches the wet bulb
temperature. Moreover, heat dissipated with the exhaust air increases with the wet
bulb temperature because of higher water content. According to Cook and DuMont
(1991), the reject heat ranges typically from 20 to 40% of the drying energy but
extreme values up to 60% are also possible. Thus, aside from higher energy effi -
ciency, the air-fl ow rate should be kept minimal to reduce the absolute values of heat
carried away with the exhaust air.
In addition to these factors, the energy effi ciency also depends on the heat fl uxes
supplied and exhausted, number of internal heating zones, material preheating, air
recycle ratio, fractional air saturation, and so on. Ashworth (1982) presents an exten-
sive review of various expressions for energy effi ciency along with a parametric
analysis of various drying conditions.
14.2.2 SPECIFIC ENERGY CONSUMPTION
An alternative measure of dryer effi ciency is the specifi c energy consumption (Es),
which is defi ned as the heat input to the dryer (Qh) per unit mass of water evapo-
rated. For convective dryers the heat input is given as the power supplied to the
heater, so
Es � Qh ____ Wev
� Qh __________
F(X1 � X2) (14.12)
where F is the dry basis material feed rate and X1 and X2 are the moisture contents at
the inlet (feed) and the outlet (product), respectively. (To facilitate future analysis of
source publications by interested readers, the original nomenclature used by Baker
and coworkers has been retained here.)
Baker and McKenzie (2005) derived the following expression for the specifi c
energy consumption of a theoretical dryer that indicates that the specifi c energy
consumption of an unspecifi ed indirectly heated convective dryer depends on the
temperature and humidity of the outlet air and the heat loss:
Es � cg ( T2/(1 � h1) � Ta ______________ Y2 � Ya
) � DHref ( Y2/(1 � h1) � Ya ______________ Y2 � Ya
) (14.13)
where cg is the heat capacity of air (gas), �Href is the latent heat of evaporation
at 0°C taken as the reference temperature, and hl is the thermal loss factor of
the dryer.
52527_C014.indd 43052527_C014.indd 430 10/1/2008 12:15:02 PM10/1/2008 12:15:02 PM
© 2009 by Taylor & Francis Group, LLC

Energy Aspects in Food Dehydration 431
Parameter hl in Eq. (14.13) is defi ned as
hl � Q1 ____
WgI1
(14.14)
where Ql represents the heat loss and Wg is the dry basis air-fl ow rate. If the dryer is
adiabatic, then hl � 0 and Eq. (14.13) reduces to
Es,a � cg ( T2 � Ta _______ Y2 � Ya
) � �Href (14.15)
where Es,a is the specifi c energy consumption of the adiabatic dryer.
From Eq. (14.15) it follows that a plot of Es,a against (T2 � Ta)/(Y2 � Ya) is linear
with a slope of cg and an intercept of �Href. Thus, this plot can be used as a bench-
mark against which the performance of the real dryer can be assessed.
Figure 14.2 demonstrates the performance of several industrial spray dryers with
different capacities plotted as the specifi c energy consumption against (T2 � Ta)/
(Y2 � Ya), where Ta was taken as 25°C and Ya as 0.005 kg/kg (Baker and McKenzie,
2005). As expected, most of the points are located above the straight line that depicts
the performance of a theoretical dryer. Clearly, more effi cient dryers are character-
ized by lower specifi c energy consumption values.
The difference between the specifi c energy consumption of the real and theoreti-
cal dryers operated at the same exhaust air temperature and humidity gives the excess
specifi c energy consumption (Es,x), which is a measure of the wasted energy due to
heat losses and other ineffi ciencies (Baker and McKenzie, 2005):
Es,x � Es � Es,a (14.16)
FIGURE 14.2 Specifi c energy consumption for several industrial spray dryers. (From
Baker, C.G.J. and McKenzie, K.A., Dry. Technol., 23, 365–386, 2005. With permission.)
25000
20000
Multistage dryers
Single-stage dryers
Eq. (14.15) (Adiabatic dryer)
15000
Spe
cific
ene
rgy
cons
umpt
ion
(ES, K
J/kg
)
10000
5000
00 1000 2000
(T2 – Ta)/(Y2 – Ya) (°C)
3000 4000 5000
52527_C014.indd 43152527_C014.indd 431 10/1/2008 12:15:02 PM10/1/2008 12:15:02 PM
© 2009 by Taylor & Francis Group, LLC

432 Advances in Food Dehydration
The concept of using specifi c energy consumption to evaluate the performance
of indirect heated spray dryers (Baker and McKenzie, 2005) and extended to fl uid-
ized bed dryers (Baker, 2005; Baker and Al-Adwani, 2007; Baker et al., 2006) was
successfully validated here for other single-stage convective dryers such as pneu-
matic and rotary dryers and various combined dryers including a fi ltermat dryer and
a spray dryer with an integrated fl uidized bed. This concept is also valid for gas-fi red
dryers, if combustion air is accounted for.
14.2.3 ENERGY INDICES FOR PARTICULAR TECHNOLOGIES
An example of a particular energy index that is often used for heat pump dryers is
the specifi c moisture extraction rate (SMER), which indicates how much water can
be removed from the system by a unit of input energy:
SMER � mass of water evaporated
_____________________ energy input
(kg/kW h) (14.17)
For conventional drying, the theoretical maximum value for SMER is 1.55 kg/
kW h, which equals the latent heat of water evaporation at 100°C (Strumillo et al.,
2007). The SMER value ranges from 1 to 4 kg/kW h for heat pump drying (typically
from 2 to 3 kg/kW h), which is much higher than 0.12 to 1.28 kg/kW h for hot air
drying (Chou and Chua, 2007).
Another example of an energy index developed for specifi c applications is the
one used to calculate the energy consumption rate (DE) per unit mass of water during
microwave-assisted drying with an intermittent power supply (Beaudry et al., 2003;
Yongsawatdigul and Gunasekaran, 1996):
DE � ton P(1 � Xf
�) 10�3
_________________ mi (Xi
� � Xf
�) (kJ/kg) (14.18)
where ton is the total time that the microwave power is on (s); P is the input micro-
wave power (W); mi is the initial mass of the material (kg); and Xi� and Xf
� are the ini-
tial and fi nal material moisture contents, respectively (fraction, wet basis). Note that
Eq. (14.18) refl ects the energy demand attributable to intermittent microwave irradia-
tion, but it does not account for the energy demand from the vacuum (Yongsawatdigul
and Gunasekaran, 1996) or energy supplied by hot air (Beaudry et al., 2003).
14.2.4 INSTANTANEOUS ENERGY INDICES
The energy indices determined from these specifi ed equations hold true if all of the
operating parameters remain constant. With a few exceptions such as spray drying
of liquids, where the constant rate period dominates the drying kinetics, most of the
materials, including the majority of food products, dry in the falling rate period
where energy is used for capillary-bound water removal, heating of the wet material
as its temperature changes in the course of drying, local superheating of the vapor,
and overheating of the already dry layers of the material otherwise necessary to
maintain the required temperature gradient. Thus, even at a constant inlet air
temperature, the outlet air temperature and humidity vary as drying progresses.
Clearly, the energy indices calculated from the initial-fi nal or inlet-outlet data are
52527_C014.indd 43252527_C014.indd 432 10/1/2008 12:15:02 PM10/1/2008 12:15:02 PM
© 2009 by Taylor & Francis Group, LLC
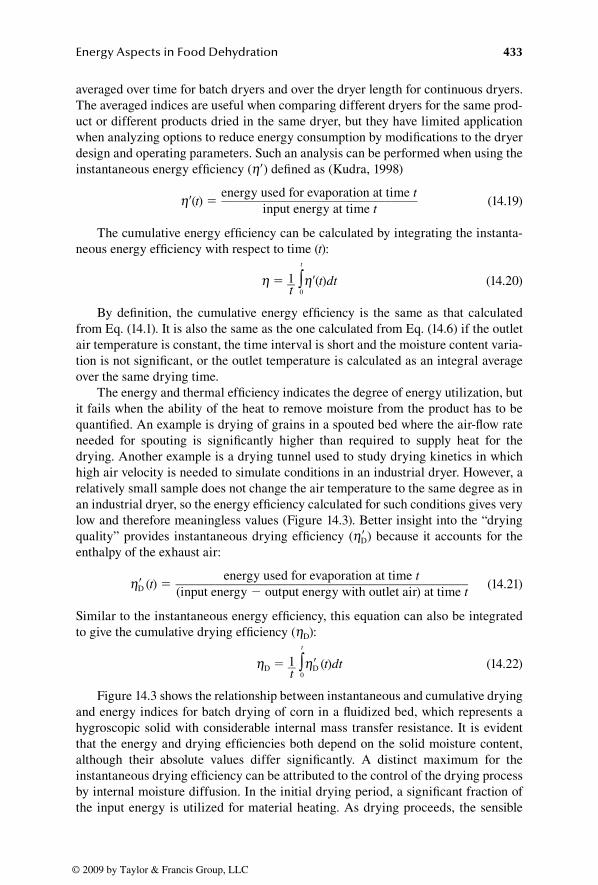
Energy Aspects in Food Dehydration 433
averaged over time for batch dryers and over the dryer length for continuous dryers.
The averaged indices are useful when comparing different dryers for the same prod-
uct or different products dried in the same dryer, but they have limited application
when analyzing options to reduce energy consumption by modifi cations to the dryer
design and operating parameters. Such an analysis can be performed when using the
instantaneous energy effi ciency (h�) defi ned as (Kudra, 1998)
h�(t) � energy used for evaporation at time t
______________________________ input energy at time t
(14.19)
The cumulative energy effi ciency can be calculated by integrating the instanta-
neous energy effi ciency with respect to time (t):
h � 1 __ t ∫
0
t
h�(t)dt (14.20)
By defi nition, the cumulative energy effi ciency is the same as that calculated
from Eq. (14.1). It is also the same as the one calculated from Eq. (14.6) if the outlet
air temperature is constant, the time interval is short and the moisture content varia-
tion is not signifi cant, or the outlet temperature is calculated as an integral average
over the same drying time.
The energy and thermal effi ciency indicates the degree of energy utilization, but
it fails when the ability of the heat to remove moisture from the product has to be
quantifi ed. An example is drying of grains in a spouted bed where the air-fl ow rate
needed for spouting is signifi cantly higher than required to supply heat for the
drying. Another example is a drying tunnel used to study drying kinetics in which
high air velocity is needed to simulate conditions in an industrial dryer. However, a
relatively small sample does not change the air temperature to the same degree as in
an industrial dryer, so the energy effi ciency calculated for such conditions gives very
low and therefore meaningless values (Figure 14.3). Better insight into the “drying
quality” provides instantaneous drying effi ciency (hD� ) because it accounts for the
enthalpy of the exhaust air:
hD� (t) � energy used for evaporation at time t
____________________________________________ (input energy � output energy with outlet air) at time t
(14.21)
Similar to the instantaneous energy effi ciency, this equation can also be integrated
to give the cumulative drying effi ciency (hD):
hD � 1 __ t ∫
0
t
hD� (t)dt (14.22)
Figure 14.3 shows the relationship between instantaneous and cumulative drying
and energy indices for batch drying of corn in a fl uidized bed, which represents a
hygroscopic solid with considerable internal mass transfer resistance. It is evident
that the energy and drying effi ciencies both depend on the solid moisture content,
although their absolute values differ signifi cantly. A distinct maximum for the
instantaneous drying effi ciency can be attributed to the control of the drying process
by internal moisture diffusion. In the initial drying period, a signifi cant fraction of
the input energy is utilized for material heating. As drying proceeds, the sensible
52527_C014.indd 43352527_C014.indd 433 10/1/2008 12:15:02 PM10/1/2008 12:15:02 PM
© 2009 by Taylor & Francis Group, LLC

434 Advances in Food Dehydration
heat in a drying agent is used for evaporation of nonhygroscopic water near the mate-
rial surface. When this water is evaporated, the instantaneous drying effi ciency falls
rapidly because most of the heat is now utilized for overheating of the already dry
surface layers and removal of the microcapillary water (the bound water moisture
content for grains � ~22% w.b., but the hygroscopic moisture content � ~36.5%
w.b.). Another example of the variation of drying indices with moisture content is
shown later.
Considering the sensitivity of instantaneous and cumulative indices to moisture
content variation, which also holds for alumina beads and potato cubes (Kudra,
1998), the drying effi ciency index appears to be more suitable for energy perfor-
mance analysis than the energy effi ciency index, and the instantaneous indices are
more useful than the cumulative ones. An example of energy performance analysis
for a cross-fl ow pilot-scale vibrated fl uid bed dryer is given below based on experi-
mental data by Nilsson and Wimmerstedt (1987). Details of this analysis as well as
performance analysis for a concurrent rotary dryer and batch fl ow-through dryer can
be found elsewhere (Kudra, 1998).
Figure 14.4 demonstrates that instantaneous drying and energy effi ciencies attain
maximum values near the dryer inlet, which results from high drying rates due to
the evaporation of surface moisture. In this section of a dryer the outlet air leaving the
bed is saturated, which practically limits the drying rate. Further along the dryer,
the energy and drying effi ciencies diminish dramatically as a result of the decreasing
drying rate. Although the temperature of the outlet air remains nearly constant along
1.0
Instantaneous value
Cumulative value
T1 = 80°C
V = 52 m3/h
0.9
0.8
0.7
0.6
0.5
Dry
ing
effic
ienc
y (h
¢ D, h
D)
Ene
rgy
effic
ienc
y (h
¢, h)
0.4
Moisture content (X, kg/kg)
0.3
0.2
0.2
0.1
00
1.0
0.9
0.8
0.7
0.6
0.6
0.5
0.40.4
0.3
0.2
0.1
0
FIGURE 14.3 Instantaneous and cumulative drying and energy indices for fl uid bed drying
of corn. (From Kudra, T., Chem. Process. Eng., 19, 163–172, 1998. With permission.)
52527_C014.indd 43452527_C014.indd 434 10/1/2008 12:15:02 PM10/1/2008 12:15:02 PM
© 2009 by Taylor & Francis Group, LLC

Energy Aspects in Food Dehydration 435
the dryer length from about 0.4 to 1.0 m, the relative humidity falls sharply because
of the reduced evaporation rate. At the dryer outlet, where the material is practically
dry, the air temperature starts to increase so the relative humidity drops to 5%.
Considering the pattern of energy and drying effi ciencies in the dryer, we can con-
clude that better energy performance can be achieved by reducing the air-fl ow rate at
the dryer end. In practice, starting at 0.4 m from the dryer inlet, the internal mass
transfer controls the drying rate, so reducing the gas velocity may lower the energy
consumption without signifi cantly decreasing the drying rate. Because at the dryer
inlet the outlet air is saturated, higher air-fl ow rates are recommended to supply addi-
tional heat for water evaporation and to increase the mass transfer driving force. The
higher inlet air temperature in this part of the dryer can also be taken into account.
Thus, the improved performance of this particular dryer in regard to the drying rate
and energy consumption can be achieved by varying the air-fl ow rate and air temper-
ature along the dryer. This can be done by dividing the gas plenum into separate
compartments that are fed with individual air streams. The temperatures and superfi -
cial air velocities of each air stream can be set to maximize the instantaneous drying
effi ciency throughout the dryer.
Note that the concept of instantaneous energy and drying effi ciency, which is an
explicit function of the material moisture content, applies to other energy indices.
For example, specifi c energy consumption in a plug fl ow fl uidized bed dryer increased
with the distance from the feed point as the evaporation rate declined over the length
of the dryer (Baker et al., 2006).
14.3 SELECTED ENERGY-SAVING TECHNOLOGIES
Various options to reduce energy consumption including methods of heat recovery,
heat pump drying, mechanical vapor recompression, hybrid technologies, process
control, and so forth are well described in easily accessible studies (Baker, 2005;
FIGURE 14.4 Performance characteristics of a vibrated fl uid bed dryer. (From Kudra, T.,
Chem. Process. Eng., 19, 163–172, 1998. With permission.).
0.10
0.08
0.06
0.04
0.02
00 0.5 1.0
Dryer length (L, m)
X
T2
RH2
h′D
h′
100
80
60
40
Out
let a
ir te
mpe
ratu
re (
T2,
°C
)
Moi
stur
e co
nten
t (X
, kg/
kg)
Ene
rgy
and
dryi
ng e
ffici
ency
(h′
, h′ D)
Out
let r
elat
ive
hum
idity
(R
H2)
20
0
1.0
0.8
0.6
0.4
0.2
0
100
80
60
40
20
0
52527_C014.indd 43552527_C014.indd 435 10/1/2008 12:15:03 PM10/1/2008 12:15:03 PM
© 2009 by Taylor & Francis Group, LLC

436 Advances in Food Dehydration
Cook and DuMont, 1991; Kemp, 2005; Marcotte and Grabowski, 2008; Masters,
2002; Raghavan et al., 2005; Strumillo et al., 2007). Therefore, we provide only a
concise overview of three selected technologies that are particularly suited for drying
of food products.
14.3.1 FOAM-MAT DRYING
Foaming of liquid and semiliquid materials is recognized as one of the methods to
shorten the drying time. Recently, this relatively old technology, known as foam-mat
drying, received renewed attention because of its added ability to process hard to dry
materials, obtain products of desired properties (e.g., favorable rehydration, con-
trolled density), and retain volatiles that otherwise would be lost during the drying of
nonfoamed materials. Thus, current research is directed not only toward convective
drying of purposely foamed materials in spray dryers, plate dryers, and band dryers
but also toward conventional freeze-drying, as well as microwave drying of frozen
foams with and without dielectric inserts as complementary heat sources (Ratti and
Kudra, 2006).
Foam-mat drying is a process by which a liquid is whipped by various means to
form a stable foam and then dehydrated by evaporation of water. Wet foams are usu-
ally dried by convection, via hot air fl owing over or through a relatively thin (3 to
10 mm) layer of the foamed material. Craters can be made in the foam layer by
impinging the air jets to accelerate the drying rate. Foams can also be extruded into
“spaghetti” up to several millimeters in diameter.
The main advantages of foam-mat drying are lower temperatures and shorter
drying times, compared to the nonfoamed material dried in the same type of dryer,
which should lead to energy savings when drying foamed materials. Figure 14.5
FIGURE 14.5 Drying rate and drying effi ciency versus moisture content for foamed and
nonfoamed apple juice air dried as a 19-mm layer at 55°C. Data are compiled from Kudra
and Ratti (2006).
1.0instantaneous
cumulative
Foamed apple juice
Nonfoamed apple juice
(r = 210 kg/m3)
0.8
0.6
0.4
0.2
0
10
8
6
4
2
08 9753 64
Moisture content (X, kg/kg)
Dry
ing
rate
× 1
06 (u
D, k
g/s)
Dry
ing
effic
ienc
y (h
′ D, h
D)
210
52527_C014.indd 43652527_C014.indd 436 10/1/2008 12:15:03 PM10/1/2008 12:15:03 PM
© 2009 by Taylor & Francis Group, LLC

Energy Aspects in Food Dehydration 437
displays the variation of the drying rate and energy indices as defi ned by Eqs. (14.21)
and (14.22) with the moisture content during drying of nonfoamed and foamed apple
juice dried in a drying tunnel at a superfi cial air velocity of 0.7 m/s (Kudra and Ratti,
2006). Characteristically, both indices for foamed and nonfoamed juice exhibit very
similar runs. Namely, after reaching a weak maximum at the beginning of drying the
instantaneous drying effi ciency gradually decreases as water evaporates. An abrupt
drop occurs at the end of drying, and such a run conforms to the drying rate curve.
The run of cumulative indices is more tempered than the respective run of instanta-
neous indices because the cumulative effi ciency represents an integral average value
from the beginning of drying to a given instant.
As expected, drying of foamed juice is more energy effi cient, so the curves for
the instantaneous and cumulative drying indices for foamed juice are both located
above the ones for nonfoamed juice. Higher energy effi ciency can be ascribed to (1)
the foam particularities facilitating the removal of moisture at the beginning of
drying, such as extended interfacial area and enhanced transport of liquid to the
evaporation front; and (2) the porous structure of the foamed material developed at a
certain instant and retained throughout drying. Thus, the foamed materials dry
similarly to the capillary–porous solid, which opens several possibilities for energy
savings. For example, once the rate of drying starts to be controlled by internal heat
and mass transfer conditions, there is no reason to maintain the same level of heat
input because a greater fraction of it is used to raise the sensible heat of the solid
rather than that needed for evaporation. It is thus logical to reduce the intensity of
the heat input once the surface moisture is removed, especially for heat-sensitive
materials. This will not only improve product quality but also increase the overall
energy performance of the dryer.
The energy consumption for drying of foamed apple juice was 20% of the one
for drying of nonfoamed juice, which results from a shorter drying time (220 vs.
600 min) and higher drying effi ciency, as shown in Figure 14.5.
14.3.2 INTERMITTENT DRYING
Drying of most solid foods occurs in the falling drying rate period because the resis-
tance to mass transfer inside the product dominates the process. Depending on the
operating conditions and characteristics of the drying material, a temporal moisture
gradient is established inside the dried solid. When the evaporation front recedes and
leaves behind a dry near-surface region, only a fraction of the thermal energy from
the drying air is utilized for evaporation, leading to lower energy effi ciency and
higher specifi c energy consumption as pointed out earlier. Thus, from the energy
standpoint, optimal drying takes place when the energy supplied to the dryer matches
the energy for water evaporation at any instant. One of the technical solutions to
optimized drying is “intermittent drying,” which is based on a controlled supply of
thermal energy that varies periodically with time according to the dryer design or its
operation (Chua et al., 2003; Mujumdar, 2004). Intermittent drying offers better
energy effi ciency because of reduced heat input, a shorter effective drying time, and
lower air consumption, in addition to improved product quality as a result of the
lower material temperature.
52527_C014.indd 43752527_C014.indd 437 10/1/2008 12:15:03 PM10/1/2008 12:15:03 PM
© 2009 by Taylor & Francis Group, LLC

438 Advances in Food Dehydration
An example of intermittent drying is the rotating jet spouted bed (Figure 14.6).
In this bed the granular material is periodically exposed to hot air over the period
resulting from the rotational speed of one or several air jets that move circumferen-
tially in the annular region between the dryer wall and the central spout (Kudra and
Mujumdar, 2002). Such a confi guration reduces air consumption by up to 10% with-
out any signifi cant increase in drying time, which translates into proportional energy
savings due to lower heat input (Devahastin et al., 1998).
Another mode of intermittent drying consists of a continuous heat supply over a
predetermined period (usually to the critical moisture content), a tempering period
over which redistribution of temperature and moisture content takes place with
essentially no heat supply, and continuous drying to the fi nal moisture content (Pan
et al., 1999).
The reason for intermittent drying, in addition to a straightforward reduction of
energy consumption, is the so-called tempering effect. Here, during the “rest” period
(no heat supply), the moisture diffuses from the wet core of the dried material toward
its surface, so the already dry near-surface region becomes wet. During subsequent
Exhaust air
Central spout
Central nozzle
Peripheral spout
Peripheral nozzle
CirculatingspoutFixed
spout
A-A
A A
Spoutingair
Supporting grid
Air distributor
FIGURE 14.6 Rotating jet spouted bed with central and peripheral spouts.
52527_C014.indd 43852527_C014.indd 438 10/1/2008 12:15:03 PM10/1/2008 12:15:03 PM
© 2009 by Taylor & Francis Group, LLC

Energy Aspects in Food Dehydration 439
heat supply, water evaporates from the material surface, which accelerates the drying
rate. It is apparent that the intermittency (heating–drying time ratio) has to be
adjusted to the material properties and drying characteristics; that is, the subsequent
heating period should start when the moisture reaches the material surface. However,
the start of the heating period can be delayed to accumulate more water in the near-
surface layers. Clearly, the process needs optimization to take full advantage of
intermittent operation. The results for the simulation of intermittent drying to
minimize energy consumption reveal the following advantages of intermittent drying
over continuous drying (Bon and Kudra, 2007):
Reduced energy consumption attributable to shorter total heating time •
(from 2.3 to 6.3%) at constant air temperature in all heating periods or
lower average temperature of the drying air when the total heating time is
constrained
Lower average enthalpy of the product by up to 23%, which results in quality •
advantages
Another mode of intermittent drying is based on a pulsed supply of microwave
energy by alternating between microwave power-on and power-off. This cycling
schedule is usually preset according to the power density given as the microwave
power per unit mass of the wet material and according to the properties of a dried
material (Beaudry et al., 2003; Sunjka et al., 2004; Yongsawatdigul and Gunasekaran,
1996). Overall, pulsed application of microwave energy is more effi cient than con-
tinuous application, even though the total drying time is longer. Beaudry et al. (2003)
demonstrated that the specifi c energy consumption for pulsed microwave drying of
osmotically dehydrated cranberries depends on the microwave power density and
cycling period; the minimum value was 8700 kJ/kg for a power density of 1.00 W/g
and a cycling period of 30 s on and 30 s off whereas the maximum specifi c energy
consumption was 9900 kJ/kg for a power density of 1.25 W/g and a cycling period of
30 s on and 30 s off.
Further improvement of the energy performance in pulsed microwave drying
can be achieved by drying under a vacuum. Yongsawatdigul and Gunasekaran
(1996) found the best energy performance for microwave–vacuum drying of osmot-
ically dehydrated cranberries when a 100-g sample was exposed intermittently to
250-W microwave power that was on for 30 s and off for 150 s. Under such condi-
tions, the minimum specifi c energy consumption was 2470 kJ/kg water at 10.67 kPa
and an initial moisture content of 76% w.b., which represents a 47% improvement
over continuous microwave–vacuum drying. The maximum specifi c energy
consumption of 4490 kJ/kg was attained at a power level of 250 W, a cycling sched-
ule of 60 s on and 60 s off, a vacuum level of 10.67 kPa, and an initial moisture
content of 62% w.b. These values match the results of Sunjka et al. (2004) who
found the specifi c energy consumption confi ned to 2850 to 7690 kJ/kg for
microwave–vacuum drying of osmotically dehydrated cranberries at 3.4-kPa
absolute pressure, 1.00 to 1.25 W/g power density, and two cycling schedules of
30 s on and 30 s off and 30 s on and 45 s off.
52527_C014.indd 43952527_C014.indd 439 10/1/2008 12:15:03 PM10/1/2008 12:15:03 PM
© 2009 by Taylor & Francis Group, LLC

440 Advances in Food Dehydration
14.3.3 COMBINED OSMOTIC DEHYDRATION AND THERMAL DRYING
Osmotic dehydration is regarded as the partial removal of water by immersing wet
materials such as fruits and vegetables in a hypertonic solution. The mass transfer
driving force originates from the water and the solute activity gradient across the
material–solution interface. Although various solutes can be used such as glucose,
high fructose corn syrup, common salt, sorbitol, and starch, the most popular is
sucrose syrup because the sugar-infused material may form a new market product
for intermediate moisture foods with enhanced nutritional, sensory, and functional
properties (Grabowski et al., 2002, 2007). Osmotic dehydration is frequently followed
by complementary processing such as thermal drying to attain a product with reduced
moisture content and thus a long shelf life. Because osmotic dehydration is carried
out at moderate temperatures, usually from 30 to 40°C, it is regarded as an energy-
saving technology when used prior to thermal drying.
In osmotic dehydration the energy is needed for (1) heating of the material and
hypertonic solution to the required temperature and compensating for heat losses and
(2) reconstitution of the diluted hypertonic solution by evaporation of excess water
that is equal to the mass of water removed from the material during dehydration. The
input energy for solution pumping and circulation (~10 kJ/kg evaporated water) and
for dissolution of a hypertonic substance in a diluted solution (~1 kJ/kg water removed)
can be neglected as being much smaller than for heating and evaporation. As pointed
out by Lewicki and Lenart (1992), energy for water evaporation constitutes a basic
component of energy consumption. For example, in osmotic dehydration of apples
from 7.6 to 4.0 kg/kg d.b. carried out at 20 to 40°C, dehydration consumes 100 to
500 kJ/kg water removed whereas concentration of the diluted solution by evaporation
increases energy consumption up to 2500 kJ/kg unless multiple effect evaporators are
used. Therefore, an interesting option is to design osmotic dehydration in such a way
that the spent syrup from the osmotic dehydration can be sold as a market product. An
example is sucrose syrup from osmotic dehydration of cranberries and blueberries,
which is sold as a table syrup that contains anthocyanins and other valuable compounds
that were partially leached from the berries (Grabowski et al., 2007).
Regarding osmoconvective drying as a hybrid technology, osmotic dehydration
prior to thermal drying results in reduced energy consumption, although to different
degrees, depending on the drying kinetics. For example, during convective drying of
apples nearly 40% of the water is evaporated during the constant rate period.
Convective drying of osmotically dehydrated apples shows no constant rate period
because the water content is below its critical value. Even though the drying rate of
osmotically dehydrated apples is slightly lower because of the surface layer made up
of a concentrated syrup, the initial osmotic dehydration shortens the drying time by
10 to 15% compared with the drying time of raw apples. Washing out the surface
sugar reduces the resistance to mass transfer to such an extent that the drying time is
shortened by ~20%, even though extra water is added to the material during washing
(Lewicki and Lenart, 1992). Convective drying of apples consumes ~5000 kJ/kg
evaporated water. Application of osmotic dehydration preceding convective drying
reduces the total energy consumption by 24 to 75%, depending on the process
conditions and the method to reconstitute the hypertonic solution. As anticipated,
52527_C014.indd 44052527_C014.indd 440 10/1/2008 12:15:03 PM10/1/2008 12:15:03 PM
© 2009 by Taylor & Francis Group, LLC

Energy Aspects in Food Dehydration 441
reduction of the water content in apples by 76% instead of 49% decreases the specifi c
energy consumption by 46 to 51%, depending on the temperature of the osmotic
dehydration (Lewicki and Lenart, 1992).
The same slow-down effect of the infused sugar on the air drying rate for
cranberries was noted by Grabowski et al. (2002). However, this negative effect was
completely offset by lower energy consumption due to a shorter drying time and
nonthermal water removal. With respect to the total processing time, the osmotic
dehydration of cranberries adds 5 h to about 50 to 60 min of the convective drying
whereas the drying time of raw berries is about 3 h. However, drying of raw cranber-
ries starts at relatively high moisture content (e.g., 87.4% w.b.) but fi nish drying of
osmotically dehydrated cranberries begins at a moisture content of about 50% w.b.
This means that osmotic dehydration allows nearly 75% of the water to be removed
nonthermally, which translates into energy savings of about 2150 kJ/kg fresh berries
when convective drying in the vibrated fl uid bed or pulsed fl uid bed follows osmotic
dehydration.
14.4 SUMMARY
An evaluation of the actual energy performance of a given dryer for an objective
comparison with alternative dryers and a credible assessment of the options for
reducing energy consumption require a common platform to be established for vari-
ous measures of energy performance. Of a variety of indices, the energy effi ciency
and specifi c energy consumption are most frequently used to assess the dryer perfor-
mance from the energy viewpoint. Because the energy performance for a given dryer
depends on the drying material and operating parameters, the absolute value of the
energy effi ciency is not informative because it does not indicate whether the dryer
operates at or close to its maximum effi ciency.
A departure from such a maximum can be quantifi ed when calculating the maxi-
mum energy effi ciency in hygroscopic materials such as foods that should be based
on thermodynamic equilibrium (sorption isotherms). Similarly, the departure from
the maximum performance of convective dryers can be quantifi ed when using the
specifi c energy consumption.
Instantaneous and cumulative energy and drying indices allow the analysis of
the dryer performance that varies in the course of drying because of decreasing
moisture content. Therefore, optional modifi cations are highlighted to improve tem-
poral or spatial ineffi ciencies by altering the operating parameters through imple-
menting temperature regimes or varying the air-fl ow rate, for example, or modifying
the dryer design to a multistage dryer or turning to hybrid technologies.
NOMENCLATURE
ABBREVIATIONS AND VARIABLES
c heat capacity [kJ/(kg K)]
d.b. dry basis
DE energy consumption rate [Eq. (14.18), kJ/kg H2O]
52527_C014.indd 44152527_C014.indd 441 10/1/2008 12:15:03 PM10/1/2008 12:15:03 PM
© 2009 by Taylor & Francis Group, LLC

442 Advances in Food Dehydration
E energy (J)
Es specifi c energy consumption (kJ/kg H2O)
Es,a specifi c energy consumption of adiabatic dryer (kJ/kg H2O)
Es,x excess specifi c energy consumption (kJ/kg H2O)
F feed rate (dry basis, kg/s)
�H latent heat of vaporization (kJ/kg)
I enthalpy (kJ/kg)
L length (m)
m mass (kg)
P microwave power (W)
�Ql heat losses (kJ/kg H2O)
Q heat rate (kJ/s)
RH relative air humidity
SMER specifi c moisture extraction rate (kg/kW h)
t time (s)
ton time of microwave power on (s)
T temperature (K, °C)
uD drying rate (kg H2O/s)
V volumetric air-fl ow rate (m3/h)
W fl ow rate (kg/s)
W* specifi c air consumption (kg air/kg H2O)
w.b. wet basis
X material moisture content (dry basis, kg H2O/kg dry material)
X� material moisture content (wet basis, kg H2O/kg wet material)
Y air humidity (kg H2O/kg dry air)
GREEK SYMBOLS
h effi ciency
h cumulative energy effi ciency
hD cumulative drying effi ciency
hl thermal loss factor
h� instantaneous energy effi ciency
hD� instantaneous drying effi ciency
r density (kg/m3)
c effi ciency ratio or evaporative effi ciency
SUBSCRIPTS
a ambient
AS adiabatic saturation
ev evaporation
f fi nal
g gas (air)
h heater
i initial
l losses
52527_C014.indd 44252527_C014.indd 442 10/1/2008 12:15:03 PM10/1/2008 12:15:03 PM
© 2009 by Taylor & Francis Group, LLC

Energy Aspects in Food Dehydration 443
max maximum
ref reference
t total
T thermal
WB wet bulb
1 inlet
2 outlet
SUPERSCRIPTS
eq equilibrium
t theoretical
sat saturation
REFERENCES
Ashworth, J.C., Energy performance of drying and application of heat recovery devices, in
The Scientifi c Approach to Solids Drying Problems, Ashworth, J.C., Ed., Drying
Research Ltd., Wolverhampton, U.K., 1982.
Baker, C.G.J., Energy effi cient dryer operation—An update on developments, Dry. Technol., 23, 2071–2087, 2005.
Baker, C.G.J. and Al-Adwani, H.H., An evaluation of factors infl uencing the energy-effi cient
operation of well-mixed fl uidized bed dryers, Dry. Technol., 25, 311–318, 2007.
Baker, C.G.J., Khan, A.R., Ali, Y.I., and Damyar, K., Simulation of plug fl ow fl uidized bed
dryers, Chem. Eng. Process., 45, 641–651, 2006.
Baker, C.G.J. and McKenzie, K.A., Energy consumption of industrial spray dryers, Dry. Technol., 23, 365–386, 2005.
Beaudry, C., Raghavan, G.S.V., and Rennie, T.J., Microwave fi nish drying of osmotically
dehydrated cranberries, Dry. Technol., 21, 1797–1810, 2003.
Bon, J. and Kudra, T., Enthalpy-driven optimization of intermittent drying, Dry. Technol., 25,
523–532, 2007.
Bond, J.-F., Visual Metrix, Drying Doctor, Inc., Verdun, QC, Canada, 2002.
Brennan, J.G., Herrera, J., and Jowitt, R., A study of some of the factors affecting the spray
drying of concentrated orange juice on a laboratory scale, J. Food Technol., 6, 295–307,
1971.
Canadian Dairy Information Centre, Milk powders production, http://www.dairyinfo.gc.ca,
2007.
Chou, S.K. and Chua, K.J., Heat pump drying systems, in Handbook of Industrial Drying,
3rd ed., Mujumdar, A.S., Ed., Taylor & Francis, Boca Raton, FL, 2007, pp. 1103–1131.
Chua, K.J., Mujumdar, A.S., and Chou, S.K., Intermittent drying of bioproducts: An overview,
Biores. Technol., 90, 285–295, 2003.
Cook, E.M. and DuMont, H.D., Process Drying Practice, McGraw-Hill, New York, 1991.
Devahastin, S., Mujumdar, A.S., and Raghavan, G.S.V., Diffusion-controlled batch drying of
particles in a novel rotating jet annular spouted bed, Dry. Technol., 16, 525–543,
1998.
Goula, A.M., Adamopoulos, K.G., and Kazakis, N.A., Infl uence of spray drying conditions
on tomato powder properties, Dry. Technol., 22, 1129–1151, 2004.
Grabowski, S., Marcotte, M., Poirier, M., and Kudra, T., Drying characteristics of osmoti-
cally pretreated cranberries—Energy and quality aspects, Dry. Technol., 20,
1989–2004, 2002.
52527_C014.indd 44352527_C014.indd 443 10/1/2008 12:15:04 PM10/1/2008 12:15:04 PM
© 2009 by Taylor & Francis Group, LLC

444 Advances in Food Dehydration
Grabowski, S., Marcotte, M., Quan, D., Taherian, A.R., Zareifard, M.R., Poirier, M., and
Kudra, T., Kinetics and quality aspects of Canadian blueberries and cranberries dried
by osmo-convective method, Dry. Technol., 25, 367–374, 2007.
Kemp, I.C., Reducing dryer energy use by process integration and pinch analysis, Dry. Technol., 23, 2089–2104, 2005.
Kemp, J.C., Thermal drying: Dryer models, energy statistics and conclusions, paper presented
at the Expert Workshop on Energy Effi ciency in Separation Technologies, Meeting of
the International Energy Agency, Mainz, Germany, May 18–19, 1998.
Kota, K. and Langrish, T.G.A., Fluxes and patterns of wall deposits from skim milk in a pilot-
scale spray dryer, Dry. Technol., 24, 993–1001, 2006.
Kudra, T., Instantaneous dryer indices for energy performance analysis, Chem. Process. Eng., 19, 163–172, 1998.
Kudra, T., Energy aspects in drying, Dry. Technol., 22, 917–932, 2004.
Kudra, T. and Mujumdar, A.S., Advanced Drying Technologies, Marcel Dekker, New York,
2002.
Kudra, T. and Ratti, C., Foam-mat drying: Energy and cost analyses, Can. Biosyst., Eng., 48,
3.27–3.32, 2006.
Lewicki, P. and Lenart, A., Energy consumption during osmo-convection drying of fruits and
vegetables, in Drying of Solids, Mujumdar, A.S., Ed., International Science Publishers,
New York, 1992, pp. 354–366.
Marcotte, M. and Grabowski, S., Minimising energy consumption associated with drying,
baking and evaporation, in Improving Water and Energy Management in Food Processing, Smith, R., Klemes, J., and Kim, J.-K., Eds., Woodhead Publishers Ltd.,
Cambridge, U.K., 2008, pp. 481–522.
Maroulis, Z.B. and Saravacos, G.D., Food Process Design, Marcel Dekker, New York,
2003.
Martynenko, A., Nova Scotia Agricultural College, Truro, NS, Canada, unpublished data,
2007.
Masters, K., Spray Drying in Practice, SprayDryConsult International ApS, Charlottenlund,
Denmark, 2002.
Mujumdar, A.S., Research and developments in drying: Recent trends and future prospects,
Dry. Technol., 22, 1–26, 2004.
Mujumdar, A.S., Principles, classifi cation and selection of dryers, in Handbook of Industrial Drying, 3rd ed., Mujumdar, A.S., Ed., Taylor & Francis, Boca Raton, FL, 2007,
pp. 3–32.
Nevenkin, S., Drying and Drying Technique, Tekhnika, Sofi a, Bulgaria, 1985 (in
Bulgarian).
Nilsson, L. and Wimmerstedt, R., Drying in longitudinal-fl ow vibrating fl uid beds—Pilot
plant experiments and model simulations, Dry. Technol., 5, 337–362, 1987.
Pakowski, Z., DryPak 2000LE: Psychrometric and Drying Computations, OMNIKON Ltd.,
Lodz, Poland, 2001.
Pan, Y.K., Zhao, L.J., Dong, Z.X., Mujumdar, A.S., and Kudra, T., Intermittent drying of
carrot in a vibrated fl uid bed: Effect on product quality, Dry. Technol., 17, 2323–2340,
1999.
Raghavan, G.S.V., Rennie, T.J., Sunjka, P.S., Orsat, V., Phaphuangwittayakul, W., and
Terdtoon, P., Overview of new techniques for drying biological materials with emphasis
on energy aspects, Brazil. J. Chem. Eng., 22, 195–201, 2005.
Ratti, C. and Kudra, T., Drying of foamed biological materials: Opportunities and challenges,
Dry. Technol., 24, 1101–1108, 2006.
Reynolds, L.B., Effects of drying on chemical and physical characteristics of American
ginseng (Panax quinquefolius L.), J. Herbs Spices Med. Plants, 6(2), 9–21, 1998.
52527_C014.indd 44452527_C014.indd 444 10/1/2008 12:15:04 PM10/1/2008 12:15:04 PM
© 2009 by Taylor & Francis Group, LLC

Energy Aspects in Food Dehydration 445
Strumillo, C., Jones, P.L., and Zylla, R., Energy aspects in drying, in Handbook of Industrial Drying, 3rd ed., Mujumdar, A.S., Ed., Taylor & Francis, Boca Raton, FL, 2007,
pp. 1075–1101.
Strumillo, C. and Kudra, T., Drying: Principles, Applications and Design, Gordon and
Breach Science Publishers, New York, 1986.
Sunjka, P.S., Rennie, T.J., Beaudry, C., and Raghavan, G.S.V., Microwave–convective and
microwave–vacuum drying of cranberries: A comparative study, Dry. Technol., 22,
1217–1231, 2004.
Tang, J.X., Wang, Z.G., and Huang, L.X., Recent progress of spray drying in China, Dry. Technol., 17, 1747–1759, 1999.
Trägårdh, C., Energy analysis for energy conservation in the food processing industry, in
Energy in Food Processing, Singh, R.P., Ed., Elsevier, Amsterdam, 1986, pp. 89–100.
Yongsawatdigul, J. and Gunasekaran, S., Microwave–vacuum drying of cranberries: Part 1.
Energy use and effi ciency, J. Food Process. Preserv., 20, 121–143, 1996.
52527_C014.indd 44552527_C014.indd 445 10/1/2008 12:15:04 PM10/1/2008 12:15:04 PM
© 2009 by Taylor & Francis Group, LLC

447
15 Novel Food Dryers and Future Perspectives
Cristina Ratti
CONTENTS
15.1 Introduction ............................................................................................. 447
15.2 Novel Pretreatments ................................................................................ 448
15.2.1 Poultice Up Process (PUP) ...................................................... 448
15.2.2 Controlled Pressure Drop ........................................................ 448
15.2.3 Foaming ................................................................................... 449
15.3 Novel Dryers ........................................................................................... 451
15.3.1 Superheated Steam Drying ...................................................... 451
15.3.2 Refractance Window® (RW) .................................................... 452
15.3.3 Low Temperature with Adsorbent Materials ........................... 454
15.3.4 Atmospheric Freeze-Drying .................................................... 455
15.3.5 Acoustic Drying ....................................................................... 456
15.3.6 Corona Wind ............................................................................ 457
15.4 Future Perspectives ................................................................................. 457
References .......................................................................................................... 458
15.1 INTRODUCTION
The drying process has been known for centuries. However, there is still a clear
desire in the scientifi c community to improve and perfect this unit operation. As
times changes, the need for dry foodstuffs is based not only on the extension of their
shelf life and better microbiological preservation but also on the development of dry
foods and ingredients with added value in terms of nutritional and physicochemical
quality. In addition, energy and the environment are important issues that presently
worry researchers and the general public worldwide. Cleaner and more energy effi -
cient technologies are thus the focal point of current scientifi c challenges. Thus, the
most recent research tendencies in dryer developments are for the enhancement of
the nutritional quality of dry products, to improve dryer energy effi ciency, and to
integrate “greener” technologies into the process.
The heating utilized in drying has been historically provided by thermal means,
commonly by convection. However, nonconventional heat sources are new areas of
52527_C015.indd 44752527_C015.indd 447 10/3/2008 4:14:39 PM10/3/2008 4:14:39 PM
© 2009 by Taylor & Francis Group, LLC

448 Advances in Food Dehydration
increased interest these days. The use of microwaves, infrared, or radiofrequency in
drying was discussed in Chapter 13 and will not be repeated here.
This last chapter presents new pretreatments and drying technologies that have
been developed or substantially improved in the last 10 years. Note that, unfortu-
nately, some of the new technologies have not been thoroughly studied “indepen-
dently” from commercially oriented tests, and thus some of the information found in
the literature regarding these technologies does not completely refl ect their real
potential. More independent scientifi c evaluation is therefore needed in some cases.
Among the new technologies that will be demonstrated, superheated steam and
ultrasound drying technologies have the highest potential for success in industry.
15.2 NOVEL PRETREATMENTS
15.2.1 POULTICE UP PROCESS (PUP)
Case hardening, a problem sometimes encountered during drying, occurs when the
surface of the product dehydrates too rapidly and forms a dry layer that is “hard.”
Because of the presence of this layer, mass transfer and shrinkage are reduced (Ratti,
1994) and the process duration increases. This phenomenon causes an undesirable
decrease in quality in the fi nal product, because moisture and the porous structure
are not distributed uniformly. Konishi and colleagues propose a PUP to reduce case
hardening (Konishi et al., 2001a, 2001b; Konishi and Kobayashi, 2003). In this pro-
cess, the product is subjected to the fi rst stage of drying, followed by storage (several
hours) in a low temperature controlled environment. After this “relaxation time” the
moisture profi les are again uniform, and then the product is subjected to the second
stage of drying. Figure 15.1a contains a schematic of this process. After this treat-
ment, the fi nal product has a uniform distribution of moisture that contributes to
reductions in the drying time and total cost of the drying process (Konishi and
Kobayashi, 2003). The treatment has been successfully applied to fi sh paste and
sausages (Konishi et al., 2001a, 2001b).
15.2.2 CONTROLLED PRESSURE DROP
A controlled instantaneous pressure drop or DIC, from the French designation
Décompression Instantanée Controllée, is a hydrothermomechanical treatment that
is mainly used with biomaterials (Louka and Allaf, 2004). High pressure followed
by an instantaneous release to vacuum conditions is applied to the product. Thus, the
texture of the product changes to a less compact porous structure that facilitates
mass transfer during many processes (extraction, drying, etc.).
During drying, the DIC treatment is applied only after the fi rst stage of drying
followed by an equilibration of moisture profi les. A second drying stage takes place
after the DIC treatment to reduce the product moisture content to low values (see
Figure 15.1b). Volume expansion accelerates drying, which has been known for a
long time; it has already been used in a process called “explosion puffi ng,” in which
the product is also pressurized by heating the air to high temperatures in a hermetic
container followed by a sudden decompression to atmospheric conditions (Saca and
Lozano, 1992). In the DIC method, however, steam is used to increase the pressure
52527_C015.indd 44852527_C015.indd 448 10/3/2008 4:14:39 PM10/3/2008 4:14:39 PM
© 2009 by Taylor & Francis Group, LLC

Novel Food Dryers and Future Perspectives 449
in the chamber, and the release of pressure is performed up to vacuum conditions.
These two differences (steam and vacuum) make the DIC method a better and gentler
texturization process that can be safely used for heat-sensitive foodstuffs.
Figure 15.2 provides a comparison of the pressure profi les that can be encoun-
tered during DIC and explosion puffi ng processes. There are many variables that
should be controlled to optimize the increase in the expansion ratio of the product:
the steam pressure in the vessel (PDIC), the duration of the pressurization (t) and
decompression, and the vacuum level (Pvacuum). A good discussion on the effect of
these variables in the process of vegetable dehydration can be found in the work of
Louka et al. (2004). Adding an equilibration step to the process increases the drying
rate of the second dehydration stage through increased porosity in the sample (Louka
and Allaf, 2002).
15.2.3 FOAMING
Some researchers successfully used foaming prior to processing to decrease operating
times during conventional hot-air drying of liquids, semi-liquids, and pastes (Kudra
and Ratti, 2006). In this technique called “foam-mat drying,” a liquid is whipped
into a stable foam, and then dehydrated by thermal means. Many studies concerning
physical and organoleptic characteristics have been done on foam-mat dried foods
Drying
(a) (b)
Drying
Equilibration(PUP)
Drying
Drying
Equilibration
Texturization(DIC)
FIGURE 15.1 Schematic representation of two pretreatment processes: (a) PUP and (b) DIC.
52527_C015.indd 44952527_C015.indd 449 10/3/2008 4:14:39 PM10/3/2008 4:14:39 PM
© 2009 by Taylor & Francis Group, LLC

450 Advances in Food Dehydration
such as mango, tamarind juice, starfruit puree, whole egg, or ripe bananas. These
studies showed better fi nal quality characteristics after foam-mat drying than using
simply the air drying process. Current research is directed toward convective drying
of foamed materials in spray dryers, plate dryers, and band dryers but also toward
conventional freeze-drying, as well as microwave drying of frozen foams (Ratti and
Kudra, 2006).
Air drying of foamed materials is generally faster than air drying of nonfoamed
ones, although certain foams such soymilk (Akintoye and Oguntunde, 1991) or star-
fruit (Karim and Wai, 1999) exhibit higher drying rates in the beginning of foam-mat
drying. For other materials such as tomato paste (Lewicki, 1975), bananas (Sankat
and Castaigne, 2004), and mango (Cooke et al., 1976) the drying rates are greatly
accelerated only at the end of drying.
Freeze-drying of foamed and nonfoamed apple juice was studied to assess
whether there is a reduction in process time attributable to foaming (Raharitsifa and
Ratti, 2008). Foams were prepared by whipping apple juice with methylcellulose or
egg albumin at different concentrations. Foaming reduced the process time when the
comparison was done at equal sample thickness. However, a lower density of foamed
materials decreased the weight load in the dryer. The optimization of the process did
not provide a minimal sample thickness necessary to increase both the drying rate
and dryer throughput for egg albumin or methylcellulose foams (Raharitsifa and
Ratti, 2008).
In addition to accelerated transport of liquid water to the evaporation front,
drying experts have repeatedly isolated the increased interfacial area of foamed
FIGURE 15.2 Pressure scheme (—) during DIC texturization treatment and (- - -) in
explosion puffi ng; PDIC, steam pressure in the vessel; Patm, atmospheric pressure; Pvacuum,
vacuum level. (Adapted from Haddad, J. and Allaf, K., J. Food Eng., 79, 353–357, 2007. With
permission.)
Pressure
Time
Patm
Pvacuum
τPDIC
52527_C015.indd 45052527_C015.indd 450 10/3/2008 4:14:39 PM10/3/2008 4:14:39 PM
© 2009 by Taylor & Francis Group, LLC

Novel Food Dryers and Future Perspectives 451
materials as the factor responsible for reduced drying time. Because the density of
foamed materials (300 to 600kg/m3) is lower than that of nonfoamed ones, the
mass load of the foam-mat dryer is also lower. In some cases, a shorter drying
time not only offsets the reduced dryer load but also increases the dryer through-
put. For example, the dryer throughput can be 32% higher when air drying foamed
apple juice with pulp (unpublished data) and 22% higher when drying foamed
mango pulp, which was calculated in this study from the experimental data gener-
ated by Rajkumar et al. (2007). In foam-mat freeze-drying, the possibility of
increasing the drying kinetics and dryer throughput is dependent on the composi-
tion of the foam as well as on the sample thickness (Raharitsifa and Ratti, 2008).
Furthermore, shorter drying times per unit mass of foamed materials may not
always bring about lower energy consumption and better process economics
(Kudra and Ratti, 2006).
Food foams can be considered as biphasic systems in which a gas bubble phase
is dispersed in a continuous liquid phase (Herzhaft, 1999; Pernell et al., 2000;
Thakur et al., 2003; Vernon-Carter et al., 2001). Foams are inherently unstable
(Dickinson and Stainsby 1987; Karim and Wai 1999), resulting in the drainage of
the continuous phase through the thin fi lms between the bubbles. As a result, the
foam lamellae are thinned, favoring the mass transfer of gas across it, which leads
to the growth of large bubbles at the expense of smaller ones (disproportionation or
Ostwald ripening). This process continues with bubble coalescence (the thin fi lm
between the two bubbles collapses, and the two bubbles merge to form one larger
bubble) and ends in phase separation. Foam stability is infl uenced by the physical
and rheological properties of the interface and the continuous phase. Foaming
agents contribute to the improvement of the structure and to the control of the tex-
ture and stability of food foams by modifying the rheological properties of the
continuous phase and the interfacial regions where they are adsorbed. A thorough
study of the stability should be performed before applying this pretreatment to
accelerate drying in order to determine the optimal foaming agent and its concen-
tration (Raharitsifa et al., 2006).
15.3 NOVEL DRYERS
15.3.1 SUPERHEATED STEAM DRYING
Superheated steam vacuum drying is a technique that has recently received increased
attention (Defost et al., 2004; Ratti, 2008). This technique uses superheated steam as
a heating medium for water evaporation from a solid that is at a temperature above
its boiling point. The evaporated moisture becomes part of the drying medium and
does not need to be exhausted (Cenkowski et al., 2005) and, because the steam is
superheated and unsaturated, a drop in its temperature because of heat transfer to the
solid will not cause condensation. In addition, no oxygen is present in the super-
heated steam medium, which can make it a choice heating method for oxygen-
sensitive materials. Superheated steam vacuum drying has been successfully applied
to foods (Devahastin and Suvarnakuta, 2004; Elustondo et al., 2001; Methakhup
et al., 2005; Nathakaranakule et al., 2007; Suvarnakuta et al., 2005).
52527_C015.indd 45152527_C015.indd 451 10/3/2008 4:14:39 PM10/3/2008 4:14:39 PM
© 2009 by Taylor & Francis Group, LLC

452 Advances in Food Dehydration
Studies comparing the product quality and drying kinetics of hot air or vacuum
drying versus superheated steam drying are inconclusive. Some works report that the
fi nal product quality is superior with superheated steam dehydration, but the drying
time is longer than that for air or vacuum drying at the same temperatures
(Jamradloedluk et al., 2007; Methakhup et al., 2005; Suvarnakuta et al., 2005). Table
15.1 lists the diffusion coeffi cients for hot air and superheated steam drying of durian
chips (Jamradloedluk et al., 2007). The diffusion coeffi cients for superheated steam
are 35% lower than air drying. The steam temperature, however, has a strong effect
on the diffusion coeffi cients of some foodstuffs, as can be seen in Table 15.1 for
chicken meat (Nathakaranakule et al., 2007). Thus, above a specifi c temperature,
superheated steam could provide a higher drying rate than hot air (Jamradloedluk et
al., 2007). However, the quality of the product processed at an excessive temperature
would deteriorate. This approach is therefore not recommended to dry highly sensi-
tive foods.
Models for mass transfer during superheated steam drying have been based
mainly on Fick’s law (Jamradloedluk et al., 2007; Nathakaranakule et al., 2007).
More original semiempirical kinetics models have been also tested against actual
foods and gave excellent results (Elustondo et al., 2001).
15.3.2 REFRACTANCE WINDOW® (RW)
RW is a relatively new fi lm drying method from which fl akes and powders can be
obtained. As explained by Nindo and Tang (2007) in an extensive comparative review,
the energy in this method is supplied from a hot water bath (95 to 97ºC) to the product
deposited as a thin fi lm (1 to 2 mm) over a plastic transparent conveyor under atmo-
spheric pressure. Figure 15.3 is a schematic representation of the RW dryer (adapted
from Nindo et al., 2007). There are three heat transfer modes in this dehydration method
TABLE 15.1Diffusion Coeffi cients during Drying of Foods with Hot Air or Superheated Steam at Various Temperatures
Food Drying Medium Drying Temp. (°C)
Deff 108 (m2/s)
Ref.
Durian chips Hot air 130 1.49 Jamradloedluk et al.
(2007)140 1.69
150 2.15
Superheated steam 130 0.97
140 1.10
150 1.44
Chicken meat Superheated steam 120 2.71 Nathakaranakule et al.
(2007)140 4.64
160 7.74
52527_C015.indd 45252527_C015.indd 452 10/3/2008 4:14:39 PM10/3/2008 4:14:39 PM
© 2009 by Taylor & Francis Group, LLC

Novel Food Dryers and Future Perspectives 453
(Nindo and Tang, 2007): conduction (from the water bath to the product through the
plastic fi lm), radiation (from the water bath to the product through the transparent
plastic fi lm that is selected to maximize the heat absorption), and convection (from the
product to the atmospheric air conditions). Nindo and Tang (2007) claimed that the use
of process water at temperatures just below boiling and the thin plastic conveyor with
infrared transmission in the wavelength range that matches the absorption spectrum for
water all work together to facilitate rapid drying in �5min.
Some of the advantages of this type of drying technology are (Nindo and Tang,
2007) the following:
Indirect method that has no chance of cross-contamination•
Rapid heating•
Demands less energy than freeze-drying (equipment costs estimated as one •
third to one half that of a freeze-dryer and operation costs approximately
one half that of freeze-drying, which is not negligible)
By contrast, this dehydration method is only applicable for liquids or pastes.
(It is not applicable for solids because of the low penetration depth of infrared radiation
in solids and because of the slow down in heat conduction transfer.) In addition, the
product should have the right consistency so that it can be spread in very thin fi lms
on the conveyor, which implicates some kind of pretreatment and optimization of the
product properties prior to the drying process.
Wetproduct
Water95°c
Dryproduct
Water
Plastic film
Product
Evaporation
Watertank
FIGURE 15.3 Refractance Window dryer. (Adapted from Nindo, C.I. et al., Lebensm.-Wiss. Technol., 40, 1000–1007, 2007. With permission.)
52527_C015.indd 45352527_C015.indd 453 10/3/2008 4:14:39 PM10/3/2008 4:14:39 PM
© 2009 by Taylor & Francis Group, LLC

454 Advances in Food Dehydration
The drying kinetics and fi nal physical and bioactive product quality with RW
has been compared to other drying methods such as freeze-drying, spray drying,
and drum drying for several food pastes and purees (asparagus, carrots, strawber-
ries, etc.). The quality and drying kinetics obtained with RW is clearly superior to
spray and drum drying, as shown in various studies (Abonyi et al., 2002; Nindo et
al., 2003; Nindo and Tang, 2007). RW provided products with similar or higher
quality than freeze-drying in very short times (Abonyi et al., 2002; Nindo et al.,
2003). However, these comparisons were made on different bases. Thickness is an
extremely important parameter in freeze-drying, which directly determines the
dehydration time. If the product is left inside the freeze-drier too long after the
completion of dehydration, the product will be overheated and quality losses may
increase. Food pastes or purees (i.e., strawberry, carrot or asparagus) with a thick-
ness of 1 to 2mm certainly need �2h to complete freeze-drying at a heating plate
temperature of 20ºC. Nevertheless, in the comparison between freeze-drying and
RW in the work of Abonyi et al. (2002) and Nindo et al. (2003) the freeze-drying
was carried out for 24h, although the thickness of the product being freeze-dried
was not provided (products dehydrated by RW had a thickness of 1 to 2mm).
15.3.3 LOW TEMPERATURE WITH ADSORBENT MATERIALS
Adsorption freeze-drying uses a desiccant (e.g., silica gel) to create a high vapor
drive at low temperatures (Bell and Mellor, 1990a). Figure 15.4a provides a sche-
matic representation of this type of freeze-dryer. The adsorbent material replaces
the condenser, and it reduces the total costs by 50% compared to traditional freeze-
drying. Despite its many advantages compared to regular freeze-drying (Bell and
Mellor, 1990b), the quality of adsorption freeze-dried foods is slightly reduced and
sometimes poor compared to that obtained by traditional freeze-drying. Another
problem is related to the enormous amounts of desiccant needed for the operation,
which has to be regenerated when saturation occurs.
Condensing the water vapor on adsorbent materials has also been applied in the
“zeodration” technique, in which drying takes place at low temperatures in a vacuum
cabinet and the water vapor is adsorbed in a zeolite reactor (Figure 15.4a). The dif-
ference between the adsorption freeze-dryer and the zeodrator is the temperatures of
the product: in the former process the product is frozen and in the latter the tempera-
ture is above freezing. Table 15.2 provides a comparison of the three types of vacuum
dryers. Zeolites have a higher water adsorption capacity than other materials during
wheat dehydration (Revilla et al., 2006). Because the adsorption reaction is exother-
mic, the heat generated during water adsorption can increase the air temperature in
the zeodrator to reduce the energy required for dehydration (Djaeni et al., 2007a).
However, zeolite regeneration needs signifi cant energy input, which decreases the
energy saved for drying (Djaeni et al., 2007a). Very few articles can be found on a
dehydration technique aided by an adsorbent reactor (Djaeni et al., 2007a, 2007b;
Rane et al., 2005), and scientifi c studies on the effect of the method on quality
attributes are practically nonexistent. However, drying with adsorbents has been
advertized (Bucher Zeodration, 2007) as a gentle and “green” dehydration technique,
which is appropriate to maintain a high standard of quality in food products.
52527_C015.indd 45452527_C015.indd 454 10/3/2008 4:14:40 PM10/3/2008 4:14:40 PM
© 2009 by Taylor & Francis Group, LLC

Novel Food Dryers and Future Perspectives 455
(a)
(b)
Humid air Dry air
Adsorbentmaterial
Drying chamber
Vacuumpump
Drying chamber
Heater
FIGURE 15.4 (a) Freeze-dryer with adsorbents or zeodrator and (b) atmospheric fl uidized
freeze-dryer.
TABLE 15.2Comparison of Vacuum Drying Techniques
Dryer Type Vacuum Level
Temp. Range (°C) Condenser Type
Characteristics
Vacuum
drying
Medium 30–100 Water trap Ineffi cient heat
transfer
Freeze-
drying
Very high –40 to –15
(product)
–20 to 50
(heating plate)
Low
temperature
Frozen samples
Zeodrator High 15–65 Adsorbent
material
No use of
refrigerants
52527_C015.indd 45552527_C015.indd 455 10/3/2008 4:14:40 PM10/3/2008 4:14:40 PM
© 2009 by Taylor & Francis Group, LLC

456 Advances in Food Dehydration
15.3.4 ATMOSPHERIC FREEZE-DRYING
Atmospheric freeze-drying was developed in the beginning of the 1990s because of
the numerous diffi culties that a vacuum causes during freeze-drying: the expensive
energy cost to maintain a vacuum during long drying times; the poor heat transfer
under a vacuum; and the problem of converting a process from a batch type to
continuous when a vacuum is applied, which limits its application to the industrial
scale. The most common type of atmospheric freeze-drying process can be defi ned
with three words: adsorption, fl uidization, and atmospheric pressure (Wolff and
Gibert, 1987). Figure 15.4b is a schematic representation of this type of process. The
product particles are mixed with an adsorbent medium in order to replace the con-
denser. Fluidization increases the heat transfer coeffi cients by more than 1 order of
magnitude compared to fi xed bed operations (Donsì et al., 1998; Donsì and Ferrari,
1995). The bed temperature and size of the product are key parameters affecting the
process dehydration rates (Di Matteo et al., 2003). An excellent discussion on heat
and mass transfer phenomena during atmospheric fl uidized freeze-drying can be
found in the work by Di Matteo et al. (2003).
The energy savings offered by atmospheric freeze-drying are approximately 34%
compared to vacuum freeze-drying (Wolff and Gibert, 1990). However, drying times are
increased 1 to 3 times because the use of atmospheric pressure turns the control of the
process from heat to mass transfer, which makes the kinetics extremely slow. In a recent
review on the subject, Claussen et al. (2007) stated that atmospheric freeze-dried foods
had higher quality than vacuum freeze-dried foods. However, Lombraña and Villarán
Air
Ultrasonic powergenerator
Impedancematching unit
Digital powermeter
Ultrasonictransducer
Vibrating drying chamber
FIGURE 15.5 Schematic of an ultrasound dryer. (Adapted from Cárcel, J.A. et al., Dry. Technol., 25, 185–193, 2007. With permission.)
52527_C015.indd 45652527_C015.indd 456 10/3/2008 4:14:40 PM10/3/2008 4:14:40 PM
© 2009 by Taylor & Francis Group, LLC

Novel Food Dryers and Future Perspectives 457
(1997) showed that the quality of the products is not excellent when atmospheric pressure
is used instead of a vacuum, because of the increased risk of product collapse.
15.3.5 ACOUSTIC DRYING
Among the novel dehydration methods, acoustic drying together with superheated
steam drying has the highest potential for commercial application. Ultrasound can be
applied to the fl uid itself (airborne ultrasound drying) or to the solid directly by
vibrating the solid surface. Figure 15.5 shows a schematic of an ultrasonic assisted
air dryer in which ultrasound is applied directly to food samples. As explained by
Cárcel et al. (2007), high-intensity ultrasonic waves during air drying produce a rapid
series of alternative contractions and expansions of the solid material that makes the
moisture transport within the solid easier. In addition, bound water can be unattached
effortlessly in the presence of cavitation produced by ultrasound. Cavitation could
also be the cause for enhanced heat and mass transfer at the solid–air interface. Heat
transfer in the presence of ultrasonic waves can be increased by approximately 30 to
60% (Mason et al., 1996). However, high-intensity airborne ultrasound is more
effi cient in the drying constant rate period when the surface of the material is com-
pletely covered with moisture, as well as when external transfer is predominant, such
as during drying with low air velocities (Gallego-Juárez et al., 1999). Under all other
conditions, ultrasonic waves applied directly to the solid material are recommended
for enhancing the drying rates. Ultrasound was recently tested during fl uidized bed
drying of foodstuffs (Garcia-Perez et al., 2006).
Because ultrasound is not an invasive technique, drying can be achieved in reduced
times under lower air temperatures but without dramatic changes in the sample
structure. This may have an important application in dehydration of high-value foods,
such as those that are heat sensitive or contain fragile bioactive compounds.
Acoustic drying has been successfully applied to air drying of carrots (de la
Fuente-Blanco et al., 2006), persimmons (Cárcel et al., 2007), and so forth. In addi-
tion, it has been utilized as a pretreatment before air drying of mushrooms, Brussels
sprouts, and caulifl ower (Jambrak et al., 2007). Ultrasound has also been useful in
enhancing osmotic dehydration of blueberries (Stojanovic and Silva, 2006), bananas
(Fernandes and Rodrigues, 2007), and papaya (Fernandes et al., 2007).
15.3.6 CORONA WIND
Corona wind drying (“electrohydrodynamic drying”) is one of the latest nonthermal
dehydration technologies applied to foodstuffs. In this method, the food is placed
between two electrodes where high-intensity electric fi elds at 50- to 60-Hz frequen-
cies are applied. As a result, the electric wind created by the ionic injection enhances
the heat and mass transfers to and from the particle (Goodenough et al., 2007).
Evaporation rates are increased signifi cantly, but energy consumption is equivalent to
conventional drying (Goodenough et al., 2007). The greater the voltage that is applied
in this type of dehydration method, the greater the drying rate (Bajgai et al., 2006).
This drying method was successfully applied to potato slabs (Chen et al., 1994), apple
slices (Hashinaga et al., 1999), Japanese radishes (Bajgai and Hashinaga, 2001a),
spinach (Bajgai and Hashinaga, 2001b), and biscuits (Goodenough et al., 2007).
52527_C015.indd 45752527_C015.indd 457 10/3/2008 4:14:40 PM10/3/2008 4:14:40 PM
© 2009 by Taylor & Francis Group, LLC

458 Advances in Food Dehydration
15.4 FUTURE PERSPECTIVES
Although progress has been made recently in developing new dehydration tech-
nologies and pretreatments to reduce the energy and costs associated with the
process and to enhance quality aspects of dried foods, there is no single dehydration
method that is suitable for any type of product and application while operating at
reduced energy consumption. The available dehydration processes are specifi c to
a particular situation requiring pilot-scale optimization in order to attain the best
results. Hybrid dehydration technologies have good potential to cope with present
trends, but they still require numerous research tests to generalize their results.
In this sense, modeling and simulation should be regarded with increased atten-
tion because they allow extrapolation to different drying situations in terms of han-
dled products, energy requirements, and optimal dried food quality, thus minimizing
the experiments done on lab or pilot scales. In addition, realistic models are certainly
required in order to control the main variables during dehydration. Dryer control is
one of the main areas, if not THE main area, of food engineering research that
should be targeted for development in the next decade.
REFERENCES
Abonyi, B.I., Feng, H., Tang, J., Edwards, C.G., Mattinson, D.S., and Fellman, J.K., Quality
retention in strawberry and carrot purees dried with Refractance Window system,
J. Food Sci., 67, 1051–1056, 2002.
Akintoye, O.A. and Oguntunde, A.O., Preliminary investigation on the effect of foam stabi-
lizers on the physical characteristics and reconstitution properties of foam-mat dried
soymilk, Dry. Technol., 9, 245–262, 1991.
Bajgai, T.R. and Hashinaga, F., High electric fi eld drying of Japanese radish, Dry. Technol., 19, 2291–2301, 2001a.
Bajgai, T.R. and Hashinaga, F., Drying of spinach with a high electric fi eld, Dry. Technol., 19,
2331–2341, 2001b.
Bajgai, T.R., Raghavan, G.S.V., Hashinaga, F., and Ngadi, M.O., Electro-hydrodynamic
drying—A concise review, Dry. Technol., 24, 905–910, 2006.
Bell, G.A. and Mellor, J.D., Adsorption freeze-drying, Food Austral., 42, 226–227, 1990a.
Bell, G.A. and Mellor, J.D., Further developments in adsorption freeze-drying, Food Res. Quart., 50, 48–53, 1990b.
Bucher Zeodration, http://www.bucherdrytech.com/html/en/5233.html (accessed December
6, 2007).
Cárcel, J.A., García-Pérez, J.V., Riera, E., and Mulet, A., Infl uence of high-intensity ultra-
sound on drying kinetics of persimmon, Dry. Technol., 25, 185–193, 2007.
Cenkowski, S., Pronyk, C., and Muir, W.E., Current advances in superheated-steam drying
and processing, Stewart Postharv. Rev., 4, 4, 2005.
Chen, Y., Barthakur, N.N., and Arnold, N.P., Electrohydrodynamic (EHD) drying of potato
slabs, J. Food Eng., 23, 107–119, 1994.
Claussen, I.C., Ustad, T.S., Strømmen, I., and Walde, P.M., Atmospheric freeze drying—A
review, Dry. Technol., 25, 957–967, 2007.
Cooke, R.D., Breag, G.R., Ferber, C.E.M., Best, P.R., and Jones, J., Studies of mango
processing. 1. The foam-mat drying of mango (Alphonso cultivar) puree, J. Food Technol., 11, 463–473, 1976.
Defost, M., Fortin, Y., and Cloutier, A., Modeling superheated steam vacuum drying of wood,
Dry. Technol., 22, 2231–2253, 2004.
52527_C015.indd 45852527_C015.indd 458 10/3/2008 4:14:40 PM10/3/2008 4:14:40 PM
© 2009 by Taylor & Francis Group, LLC

Novel Food Dryers and Future Perspectives 459
de la Fuente-Blanco, S., Riera-Franco de Saravia, E., Acosta-Aparicio, V.M., Blanco-Blanco,
A., and Gallego-Juárez, J.A., Food drying process by power ultrasound, Ultrasonics,
44, e523–e527, 2006.
Devahastin, S. and Suvarnakuta, P., Superheated steam drying of food products, in
Dehydration of Products of Biological Origin, Mujumdar, A.S., Ed., Science Publishers,
Enfi eld, NH, 2004.
Dickinson, E. and Stainsby, G., Progress in the formulation of food emulsions and foams,
Food Technol., 41, 74–81, 116, 1987.
Di Matteo, P., Donsì, G., and Ferrari, G., The role of heat and mass transfer phenomena in
atmospheric freeze-drying of foods in a fl uidised bed, J. Food Eng., 59, 267–275, 2003.
Djaeni, M., Bartels, P., Sanders, J., van Straten, G., and van Boxtel, A.J.B., Process integration
for food drying with air dehumidifi ed by zeolites, Dry. Technol., 25, 225–239, 2007a.
Djaeni, M., Bartels, P., Sanders, J., van Straten, G., and van Boxtel, A.J.B., Multistage zeolite
drying for energy-effi cient drying, Dry. Technol., 25, 1063–1077, 2007b.
Donsì, G. and Ferrari, G., Heat transfer coeffi cients between gas fl uidised beds and immersed
spheres: Dependence on the sphere size, Powder Technol., 82, 293–299, 1995.
Donsì, G., Ferrari, G., Nigro, R., and Di Matteo, P., Combination of mild dehydration and
freeze-drying processes to obtain high quality dried vegetables and fruits, Trans. IChemE., 76, 181–187, 1998.
Elustondo, D., Elustondo, M.P., and Urbicain, M.J., Mathematical modeling of moisture
evaporation from foodstuffs exposed to subatmospheric pressure superheated steam,
J. Food Eng., 49, 15–24, 2001.
Fernandes, F.A.N., Oliveira, F.I.P., and Rodrigues, S., Use of ultrasound for dehydration of
papayas, Food Bioprocess. Technol., DOI: 10.1007/s11947-007-0019-9, 2007.
Fernandes, F.A.N. and Rodrigues, S., Ultrasound as pre-treatment for drying of fruits:
Dehydration of banana, J. Food Eng., 82, 261–267, 2007.
Gallego-Juárez, J.A., Rodríguez-Corral, G., Galvez Moraleda, J.C., and Yang, T.S., A new
high-intensity ultrasonic technology for food dehydration, Dry. Technol., 17, 597–608,
1999.
Garcia-Perez, J.V., Cárcel, J.A., de la Fuente-Blanco, S., and Riera-Franco de Sarabia, E.,
Ultrasonic drying of foodstuff in a fl uidized bed: Parametric study, Ultrasonics, 44,
e539–e543, 2006.
Goodenough, T.I.J., Goodenough, P.W., and Goodenough, S.M., The effi ciency of corona wind
drying and its application to the food industry, J. Food Eng., 80, 1233–1238, 2007.
Haddad, J. and Allaf, K., A study of the impact of instantaneous controlled pressure drop on
the trypsin inhibitors of soybean, J. Food Eng., 79, 353–357, 2007.
Hashinaga, F., Bajgai, T.R., Isobe, S., and Barthakur, N.N., Electrohydrodynamic (EHD)
drying of apple slices, Dry. Technol., 17, 479–495, 1999.
Herzhaft, B., Rheology of aqueous foams: A literature review of some experimental works,
Oil Gas Sci. Technol., 54, 587–596, 1999.
Jambrak, A.R., Mason, T.J., Paniwnyk, L., and Vesna, L., Accelerated drying of button
mushrooms, Brussels sprouts and caulifl ower by applying power ultrasound and its
rehydration properties, J. Food Eng., 81, 88–97, 2007.
Jamradloedluk, J., Nathakaranakule, A., Soponronnarit, S., and Prachayawarakorn, S.,
Infl uences of drying medium and temperature on drying kinetics and quality attributes
of durian chip, J. Food Eng., 78, 198–205, 2007.
Karim, A.A. and Wai, C.C., Characteristics of foam prepared from starfruit (Averrhoa carambola
L.) puree by using methylcellulose, Food Hydrocolloids, 13, 203–210, 1999.
Konishi, Y., Horiuchi, Y., and Kobayashi, M., Dynamic evaluation of the dehydration response
curves of foods characterized by a poultice-up process using a fi sh-paste sausage. I.
Determination of the mechanism for moisture transfer, Dry. Technol., 19, 1253–1270,
2001a.
52527_C015.indd 45952527_C015.indd 459 10/3/2008 4:14:40 PM10/3/2008 4:14:40 PM
© 2009 by Taylor & Francis Group, LLC

460 Advances in Food Dehydration
Konishi, Y., Horiuchi, Y., and Kobayashi, M., Dynamic evaluation of the dehydration response
curves of foods characterized by a poultice-up process using a fi sh-paste sausage. II.
A new tank model for a computer simulation, Dry. Technol., 19, 1271–1285, 2001b.
Konishi Y. and Kobayashi, M., Characteristic innovation of a food drying process revealed by the
physicochemical analysis of dehydration dynamics, J. Food Eng., 59, 277–283, 2003.
Kudra, T. and Ratti, C., Foam-mat drying: Energy and cost analyses, Can. Biosyst. Eng., 48,
3.27–3.32, 2006.
Lewicki, P.P., Mechanisms concerned in foam-mat drying of tomato paste, Trans. Agric. Acad. Warsaw, 55, 1–67, 1975 (in Polish).
Lombraña, J.I. and Villarán, M., The infl uence of pressure and temperature on freeze-drying
in an adsorbent medium and establishment of drying strategies, Food Res. Int., 30,
213–222, 1997.
Louka, N. and Allaf, K., New process for texturizing partially dehydrated biological products
using controlled sudden decompression to the vacuum: Application on potatoes,
J. Food Sci., 67, 3033–3038, 2002.
Louka, N. and Allaf, K., Expansion ratio and color improvement of dried vegetables texturized
by a new process “controlled sudden decompression to the vacuum”. Application to
potatoes, carrots and onions, J. Food Eng., 65, 233–243, 2004.
Louka, N., Juhel, F., and Allaf, K., Quality studies on various types of partially dried
vegetables texturized by controlled sudden decompression. General patterns for the
variation of the expansion ratio, J. Food Eng., 65, 245–253, 2004.
Mason, T.J., Paniwnyk, L., and Lorimer, J.P., The uses of ultrasound in food technology,
Ultrason. Sonochem., 3, s253–s260, 1996.
Methakhup, S., Chiewchan, N., and Devahastin, S., Effects of drying methods and conditions
on drying kinetics and quality of Indian gooseberry fl ake, Lebensm.-Wiss. Technol., 38, 579–587, 2005.
Nathakaranakule, A., Kraiwanichkul, W., and Soponronnarit, S., Comparative study of
different combined superheated-steam drying techniques for chicken meat, J. Food Eng., 80, 1023–1030, 2007.
Nindo, C.I., Powers, J.R., and Tang, J., Infl uence of Refractance Window evaporation on
quality of juices from small fruits, Lebensm.-Wiss. Technol., 40, 1000–1007, 2007.
Nindo, C.I., Sun, T., Wang, S.W., Tang, J., and Powers, J.R., Evaluation of drying technologies
for retention of physical quality and atioxidants in asparagus (Asparagus offi cinalis L.),
Lebensm.-Wiss. Technol., 36, 507–516, 2003.
Nindo, C.I. and Tang, J., Refractance Window dehydration technology: A novel contact
drying method, Dry. Technol., 25, 37–48, 2007.
Pernell, C.W., Foegeding, E.A., and Daubert, C.R., Measurement of the yield stress of protein
foams by vane rheometry, J. Food Sci., 65, 110–114, 2000.
Raharitsifa, N., Genovese, D.B., and Ratti, C., Characterization of apple juice foams for
foam-mat drying prepared with egg white protein and methylcellulose, J. Food Sci., 71,
E142–E151, 2006.
Raharitsifa, N. and Ratti, C., Foam-mat freeze-drying of apple juice: Experimental data and
ANN simulations, J. Food Process Eng., submitted.
Rajkumar, P., Kailappan, R., Viswanathan, R., Raghavan, G.S.V., and Ratti, C., Studies on
foam mat drying of Alphonso mango pulp, Dry. Technol., 25, 357–366, 2007.
Rane, M.V., Kota Reddy, S.V., and Easow, R.R., Energy effi cient liquid desiccant-based dryer,
Appl. Therm. Eng., 25, 769–781, 2005.
Ratti, C., Shrinkage during drying of foodstuffs, J. Food Eng., 23, 91–105, 1994.
Ratti, C., Freeze and vacuum drying of foods, in Drying Technologies for Food Processing,
Mujumdar, A.S., Ed., Blackwell Publishing, New York, 2008.
Ratti, C. and Kudra, T., Drying of foamed materials: Opportunities and challenges, Dry. Technol., 24, 1101–1108, 2006.
52527_C015.indd 46052527_C015.indd 460 10/3/2008 4:14:40 PM10/3/2008 4:14:40 PM
© 2009 by Taylor & Francis Group, LLC

Novel Food Dryers and Future Perspectives 461
Revilla, G.O., Velázquez, T.G., Cortéz, S.L., and Cárdenas, S.A., Immersion drying of wheat
using Al-PILC, zeolite, clay and sand as particulate media, Dry. Technol., 24, 1033–1038,
2006.
Saca, S.A. and Lozano, J.E., Explosion puffi ng of bananas, Int. J. Food Sci. Technol., 27,
419–426, 1992.
Sankat, C.K. and Castaigne, F., Foaming and drying behaviour of ripe bananas, Lebensm.-Wiss. Technol., 37, 517–525, 2004.
Stojanovic, J. and Silva, J.L., Infl uence of osmoconcentration, continuous high-frequency
ultrasound and dehydration on properties and microstructure of rabbiteye blueberries,
Dry. Technol., 24, 165–171, 2006.
Suvarnakuta, P., Devahastin, S., and Mujumdar, A.S., Drying kinetics and b-carotene degra-
dation in carrot undergoing different drying processes, J. Food Sci., 70, S520–S526,
2005.
Thakur, R.K., Vial, C., and Djelveh, G., Infl uence of operating conditions and impeller design
on the continuous manufacturing of food foams, J. Food Eng., 60, 9–20, 2003.
Vernon-Carter, E.J., Espinosa-Paredes, G., Beristain, C.I., and Romero-Tehuitzil, H., Effect
of foaming agents on the stability, rheological properties, drying kinetics and fl avour
retention of tamarind foam-mats, Food Res. Int., 34, 587–598, 2001.
Wolff, E. and Gibert, H., Atmospheric freeze-drying part 2: Modelling drying kinetics using
adsorption isotherms, Dry. Technol., 8, 405–428, 1990.
Wolff, E. and Gibert, H., Lyophilisation sous pression atmosphérique, in Collection Récents Progrès en Génie des Procédés, Lavoisier, Paris, 1987.
52527_C015.indd 46152527_C015.indd 461 10/3/2008 4:14:40 PM10/3/2008 4:14:40 PM
© 2009 by Taylor & Francis Group, LLC

52527_C015.indd 46252527_C015.indd 462 10/3/2008 4:14:40 PM10/3/2008 4:14:40 PM
© 2009 by Taylor & Francis Group, LLC