advanced visualization and interactive ...the advanced visualization and interactive displays (avid)...
TRANSCRIPT

AFRL-RI-RS-TR-2009-115 In-House Final Technical Report April 2009 ADVANCED VISUALIZATION AND INTERACTIVE DISPLAYS (AVID)
APPROVED FOR PUBLIC RELEASE; DISTRIBUTION UNLIMITED.
STINFO COPY
AIR FORCE RESEARCH LABORATORY INFORMATION DIRECTORATE
ROME RESEARCH SITE ROME, NEW YORK

NOTICE AND SIGNATURE PAGE
Using Government drawings, specifications, or other data included in this document for any purpose other than Government procurement does not in any way obligate the U.S. Government. The fact that the Government formulated or supplied the drawings, specifications, or other data does not license the holder or any other person or corporation; or convey any rights or permission to manufacture, use, or sell any patented invention that may relate to them. This report was cleared for public release by the 88th ABW, Wright-Patterson AFB Public Affairs Office and is available to the general public, including foreign nationals. Copies may be obtained from the Defense Technical Information Center (DTIC) (http://www.dtic.mil). AFRL-RI-RS-TR-2009-115 HAS BEEN REVIEWED AND IS APPROVED FOR PUBLICATION IN ACCORDANCE WITH ASSIGNED DISTRIBUTION STATEMENT. FOR THE DIRECTOR: /s/ /s/ JULIE BRICHACEK JAMES W. CUSACK Branch Chief, Cyber Command and Chief, Information Systems Division Control Systems Branch Information Directorate This report is published in the interest of scientific and technical information exchange, and its publication does not constitute the Government’s approval or disapproval of its ideas or findings.

REPORT DOCUMENTATION PAGE Form Approved OMB No. 0704-0188
Public reporting burden for this collection of information is estimated to average 1 hour per response, including the time for reviewing instructions, searching data sources, gathering and maintaining the data needed, and completing and reviewing the collection of information. Send comments regarding this burden estimate or any other aspect of this collection of information, including suggestions for reducing this burden to Washington Headquarters Service, Directorate for Information Operations and Reports, 1215 Jefferson Davis Highway, Suite 1204, Arlington, VA 22202-4302, and to the Office of Management and Budget, Paperwork Reduction Project (0704-0188) Washington, DC 20503. PLEASE DO NOT RETURN YOUR FORM TO THE ABOVE ADDRESS.1. REPORT DATE (DD-MM-YYYY) APR 09
2. REPORT TYPEFinal
3. DATES COVERED (From - To)May 06 – Oct 08
4. TITLE AND SUBTITLE ADVANCED VISUALIZATION AND INTERACTIVE DISPLAYS (AVID)
5a. CONTRACT NUMBER In-House
5b. GRANT NUMBER
5c. PROGRAM ELEMENT NUMBER62702F
6. AUTHOR(S) Peter A. Jedrysik Jason A. Moore Chad F. Salisbury Brian Holmes
5d. PROJECT NUMBER 558S
5e. TASK NUMBER AV
5f. WORK UNIT NUMBER IH
7. PERFORMING ORGANIZATION NAME(S) AND ADDRESS(ES) AFRL/RISF 525 Brooks Rd. Rome NY 13441-4505
8. PERFORMING ORGANIZATION REPORT NUMBER N/A
9. SPONSORING/MONITORING AGENCY NAME(S) AND ADDRESS(ES) AFRL/RISF 525 Brooks Rd. Rome NY 13441-4505
10. SPONSOR/MONITOR'S ACRONYM(S) N/A
11. SPONSORING/MONITORING AGENCY REPORT NUMBER AFRL-RI-RS-TR-2009-115
12. DISTRIBUTION AVAILABILITY STATEMENT APPROVED FOR PUBLIC RELEASE; DISTRIBUTION UNLIMITED. PA# 88ABW-2009-1628
13. SUPPLEMENTARY NOTES
14. ABSTRACT This Final Technical Report discusses the Advanced Visualization and Interactive Displays (AVID) program objectives and accomplishments to evaluate, exploit, and develop new concepts in information visualization, display technology, and human-computer interaction (HCI) that provide airmen with a tailored information environment. Building on past in-house programs that researched the technology areas of advanced visualization and interactive displays independently, this program sought to develop integrated technology that would leverage each other’s capabilities. The advances made in visualization techniques were developed cognizant of the types of high-resolution interactive display capabilities that were available as well as emerging display technology to be developed under this program. Likewise, the display research benefited significantly from the types of visualizations being developed and steered design decision in the process. Although visualization and display technology can be thought of independently, this program developed them as complementary technologies each having an impact on the other’s research and development. 15. SUBJECT TERMS Real time 3D graphics, information visualization, terrain visualization, cross-platform graphics engine, java, high-resolution display, tiled display, datawall, interactive display
16. SECURITY CLASSIFICATION OF: 17. LIMITATION OF ABSTRACT
UU
18. NUMBER OF PAGES
60
19a. NAME OF RESPONSIBLE PERSON Peter A. Jedrysik
a. REPORT U
b. ABSTRACT U
c. THIS PAGE U
19b. TELEPHONE NUMBER (Include area code) N/A
Standard Form 298 (Rev. 8-98) Prescribed by ANSI Std. Z39.18

i
Table of Contents Executive Summary .......................................................................................................... 1
1 Introduction ................................................................................................................ 3
2 Visualization ............................................................................................................... 4
2.1. Background ......................................................................................................... 4
2.2. JView 1.5 ............................................................................................................ 4
2.2.1. Introduction .................................................................................................. 4
2.2.2. JView World ................................................................................................. 7
2.2.3. JView 1 Applications .................................................................................... 9
2.3. JView 2 ............................................................................................................. 14
2.3.1. JView 2 Design Motivation ........................................................................ 14
2.3.2. JView 2 Design/Requirements .................................................................. 15
2.3.3. Examples and Proofs of Concept .............................................................. 18
3 Interactive Displays .................................................................................................. 27
3.1. Reconfigurable Display Modules (RDMs) ......................................................... 27
3.1.1. Introduction ................................................................................................ 27
3.1.2. Enhancements ........................................................................................... 32
3.2. Dual Use 2D/3D Display System ...................................................................... 39
3.2.1. Introduction ................................................................................................ 39
3.2.2. Projectors .................................................................................................. 39
3.2.3. Screen ....................................................................................................... 40
3.2.4. Projector Alignment System ...................................................................... 42
3.2.5. Touch Screen DataWall ............................................................................. 46
4 AVID Research Facility Development ...................................................................... 48
5 Future Research ...................................................................................................... 50
5.1. Visualization ...................................................................................................... 50
5.2. Electromechanical Projector Mount .................................................................. 51
5.3. AVID Display Connectivity ................................................................................ 51
5.4. Autonomous Leveling RDM .............................................................................. 51
5.5. Touch Screen ................................................................................................... 52
6 Conclusions ............................................................................................................. 52
References: ..................................................................................................................... 54

ii
List of Figures
Figure 1 Test range photograph ........................................................................................ 9 Figure 2 APATS ................................................................................................................ 9 Figure 3 CUNEViewer ..................................................................................................... 10 Figure 4 The Audit Trail Viewer layout ............................................................................ 11 Figure 5 The Audit Trail Viewer with JView World .......................................................... 12 Figure 6 ACESViewer: Aircraft, sectors, and the world ................................................... 13 Figure 7 One Node .......................................................................................................... 19 Figure 8 One million nodes ............................................................................................. 21 Figure 9 125k nodes with fully connected tree ................................................................ 21 Figure 10 Standard additive blending ............................................................................. 22 Figure 11 Compositing then blending ............................................................................. 22 Figure 12 Non-additive blending ..................................................................................... 23 Figure 13 Additive with color blending ............................................................................ 23 Figure 14 Re-sampling for lines over terrain ................................................................... 24 Figure 15 Failed use of OpenGL lines ............................................................................ 25 Figure 16 Diminishing lines using textures ...................................................................... 25 Figure 17 Preserving line width over the surface ............................................................ 26 Figure 18 Reconfigurable Display Module (RDM)s – 3 Module Configuration ................ 28 Figure 19 RDM ¾ View – Extended and Collapsed ........................................................ 29 Figure 20 RDM Side View – Extended and Collapsed .................................................... 29 Figure 21 RDM Front and Top Views .............................................................................. 30 Figure 22 Isolated Views of RDM Projector Mount ......................................................... 31 Figure 23 Exploded View of RDM Projector Mount ......................................................... 31 Figure 24 RDM Leveling Caster Prototype ..................................................................... 32 Figure 25 RDM Ratcheting Leveling Caster .................................................................... 33 Figure 26 RDM Electromechanical Leveler ..................................................................... 35 Figure 27 Fine-Tune Mirror Adjusters ............................................................................. 36 Figure 28 Overhead View of a 3 RDM Configuration ...................................................... 37 Figure 29 RDM Linkage Prototype .................................................................................. 38 Figure 30 DataWall Brightness Uniformity ...................................................................... 41 Figure 31 Increasing Throw Distance Impact on Brightness Uniformity ......................... 41 Figure 32 DataWall Off-Axis Brightness Non-Uniformity ................................................. 42 Figure 33 Worm Gear ..................................................................................................... 43 Figure 34 Projector Mount ............................................................................................... 44 Figure 35 Projector Mount with Base .............................................................................. 44 Figure 36 Dual Projectors Mounted ................................................................................ 45 Figure 37 16M Pixel DataWall ......................................................................................... 45 Figure 38 Sony HoloWall Touch Screen ......................................................................... 46

iii
Figure 39 IR Illuminator Position Testing ........................................................................ 47 Figure 40 Reconfigurable Conference Table .................................................................. 49 Figure 41 AVID Research Facility Floor Plan .................................................................. 49

1
Executive Summary The Advanced Visualization and Interactive Displays (AVID) program objectives include the evaluation, exploitation, and development of new concepts in information visualization, display technology, and human-computer interaction (HCI) that provide airmen with a tailored information environment. Building on past in-house programs that researched the technology areas of advanced visualization and interactive displays independently, this program sought to develop integrated technology that would leverage each other’s capabilities. The advances made in visualization techniques were developed cognizant of the types of high-resolution interactive display capabilities that were available as well as emerging display technology to be developed under this program. Likewise, the display research benefited significantly from the types of visualizations being developed and steered design decisions in the process. Although visualization and display technology can be thought of independently, this program developed them as complementary technologies each having an impact on the other’s research and development.
A state-of-the-art facility has been developed to support advancements in visualization and interactive display technologies. It was designed to serve as a resource for the Air Force Research Laboratory’s Information Directorate (AFRL/RI) research that could benefit from the capabilities it provides, allowing other programs to leverage technologies not found in typical research facilities. In so doing also helped guide our research to address the needs of technology users. The work space was thoughtfully designed to serve as a demonstration space for moderately large audiences and as a research space that would foster collaboration amongst scientists. Some of the displays and furniture developed are reconfigurable to accommodate various modes of operation.
The majority of the visualization work focused on enhancement of the JView API and developing JView based applications. These applications not only understood the implications of large screen and high resolution displays but were designed with their existence in mind. This meant that visualization components needed to be efficient on memory, but also become more aggressive when resources became available. Applications ranged from visualizing measured antenna data for the Joint Strike Fighter and F-22 to volumetric visualization of the National Airspace System (NAS). The researchers explored concepts ranging from how to display complex airspaces, preserving line attributes over arbitrarily tessellated surfaces, and massive node visualization.
Unique high-resolution display systems have been developed that leverage commercial-off-the-shelf (COTS) technology whenever possible, augmented by exclusive hardware designed to precisely align multiple projector display configurations. In addition systems have been developed that are extremely portable yet large-scale, and can be set-up in any venue with ease in a timely manner.

2
Future research and development in visualization and interactive displays includes heavy use of non-geographic representations. While the location of an item is important for a subset of decisions, how those items are related will often yield more insight. JView 2 will be developed in order to support graph visualization constructs while also realizing improvements to performance and quality due to the changes to the underlying OpenGL graphics library. While massive geospatial data offers a convenient method for level of detail through its inherent spatialization, non-geographic data does not. This is forcing the JView 2 engine to support graph sizes and constructs that greatly exceed that of standard graphing and display packages. In addition to new content types that are of interest, the world of computation has radically changed. Multi-core processing is not relegated to a small subset and is now the norm. The JView 2 engine and its components will take advantage of multiple threads in order to utilize the resources as efficiently and effectively as possible. Also planned are extended capabilities for the display alignment systems that were developed under this program, intuitive computer system connectivity to the AVID displays, and integration of touch as an additional mode of input.

3
1 Introduction Solving the challenges facing today’s commander who wants to dominate the information domain correlates closely with the assimilation, analysis and interaction of an extensive amount of data and information that is detailed, dynamic, and variable in format. The immense amount of information includes terrain and geographic area representations, database information, intelligence and surveillance collections, graph analysis, target modeling and simulation results. In addition, increased tempo, higher precision, and more complex data have increased the demand for tailored information and have increased emphasis on revolutionary information technologies. Critical to the aggregation of information is portraying it accurately and in a meaningful format. Equally important is the system’s accessibility and real time performance while running highly intensive graphic 2D and 3D renditions with multiple instances often running simultaneously. The AVID team recognizes the requirements and the importance of addressing the interdependent and intense issues challenging today’s decision makers. The development of visualization technology was out of necessity instead of initial desire. Commercial and freely available graphics systems did not afford the team the ability to explore the visualization needs of the Air Force. JView, a visualization toolset, was created by the AVID team in order for synergy to exist between the display device, the visualization, the developer, and the end-user. A high resolution tiled display has the ability to augment situational awareness for an entire C2 audience. The uniqueness of the AVID display technology is the push to actively foster collaboration and participation among a collection of decision makers. Displays have been developed as active workspaces rather than simply presentation devices. Many of the displays are also portable and scalable, and can be used outside the AVID facility very effectively. In this report Section 2 will discuss the visualization research and development of this program. Section 3 covers our interactive display research. Section 4 describes our state-of-the-art facility that was designed and implemented under this program to support our advancements in visualization and interactive display technologies. Section 5 discusses some future research endeavors. And finally our results conclude the report in Section 6.

4
2 Visualization The visualization research performed under this effort spanned the following areas: development of the JView 1.x Application Programmer’s Interface (API), design and minimal prototype of the new JView 2.x engine, prototype demo visualizations, and application development. While this chapter will cover each of those areas described, it concentrates heavily on the prototype demonstrations and the JView 2.x engine design.
2.1. Background
Visualization research spans the gamut from computer graphics to raw data visualization to scientific visualization to information visualization. Each domain uses varied amounts of data, varied display metaphors, and varied purposes. While there are many differences, there are many commonalities and links between the domains. One goal of information visualization is to help users make sense out of the disparate data, using different visual metaphors, to answer varied questions. This clearly connects all the types of visualizations together and relies on extensive computer graphics research.
Numerous APIs are being used and developed to help users develop applications in individual domains. JView however has components that support operations through that process. The application section of this chapter will discuss a range of visualizations developed from a scientific visualization in the Antenna Pattern Analysis ToolSet (APATS) to the information visualization in the Airspace Concepts Evaluation System Viewer (ACESViewer).
2.2. JView 1.5
2.2.1. Introduction
JView is an application programmer’s interface (API) developed to reduce the time, cost, and effort associated with the creation of computer visualization applications or the visualization component of an application. JView provides the ability to quickly develop 2-dimensional and 3-dimensional visualization applications that are tailored to address your specific problem. JView is written entirely in Java and utilizes the Java bindings for OpenGL (JOGL) API to gain hardware graphics acceleration. It is government-owned and available free of charge to government agencies and their contractors.
An API provides a rigidly defined method for developing software applications. Industry-standard APIs greatly simplify the software development process, reducing development cost and time. Some very common APIs include OpenGL for the creation of 2D and 3D graphics applications and the Windows API which allows for the management of windows and message

5
passing for Windows-based applications. Platform-independent APIs, like JView, enable PC, workstation, and supercomputing hardware vendors to provide high-performance 2D and 3D graphics solutions and enable application programmers to write an application once and deploy it across many platforms.
Prior to OpenGL, many hardware vendors had different graphics libraries. This situation made it expensive for software developers to support versions of their applications on multiple hardware platforms, and it made porting applications from one hardware platform to another very time-consuming and difficult. JView is built upon the OpenGL API and enables a higher level of functionality by providing a visualization engine which, among other things, manages the manipulation of the objects in a scene and allows for movement in and through the scene.
One of the more difficult points to convey to those who have a need for a visualization application is that JView, in itself, is not an application. Rather, JView allows one to develop tailored visualization applications to suit a specific need. As such, JView is a standard visualization solution that does not concentrate solely on a space, air, ground, or maritime genre nor is it constrained by scale; allowing for the display of entities from the molecular level to macro-scale phenomena.
The need for visualization tools is pervasive and as such, is, ironically, often left as an afterthought. And understandably so, when one has been tasked to develop, for example, a simulation, it’s prudent to enlist the efforts of a company, individual or organization that has the domain expertise in the area that you wish to simulate. The visualization component of the program is often assumed to be ‘available’ in the form of a commercial or government off-the-shelf package. Quite often it is thought to be a good idea to use an existing visualization tool developed for another purpose to meet one’s visualization requirements. The rational for taking this approach spans from time reduction to cost savings, but almost always at the expense of desired functionality. “Hey, it’s not exactly what we want, but we can probably force fit it to meet our needs” is the far too often used mantra of the program manager. JView eliminates the need to make this compromise by demystifying the world of 3D graphics programming and allows the user to concentrate on the difficult task of visualizing the right information instead of concentrating their effort on the art of complicated 3D graphics. Enable your programming staff to answer the question of “What to visualize” rather than “How to visualize.”
JView can be used to replace or complement existing visualization functions regardless of how tightly coupled the existing visualization capability is to the core application. JView allows the programmer to quickly implement additions when the visualization needs change. It also allows the end user to operate in an environment in which they are familiar, instead of having to learn a new interface. JView functionality can be married to an existing Graphical User Interface (GUI), thereby providing improved visualization capability without having to change the methodology the end user employs to interact with their application.

6
Assimilating your data into one scene can help solve problems faster and better than viewing isolated data. JView is completely data source independent. One of its most useful capabilities is the simultaneous access of multiple input sources, which enables information residing in various modes of storage and persistence to be displayed in a common scene or space. Stated another way, the user can display live, simulated, and recorded information in the same geographically resolved space at the same time. This capability not only allows the programmer to quickly implement the addition of new data types as they become available, but also allows the end user to visually fuse information from previously disparate sources.
JView relies on concrete object oriented design and programming techniques to provide a robust and venue agnostic visualization environment. By creating various types of code modules, one can quickly conquer the often arduous task of developing a tailored visualization system. JView nomenclature categorizes modules into two types: facilitators and oddments.
Facilitators conquer the specific task of placing objects in the scene and manipulating their behavior. By definition, facilitators are specific to the application domain. Facilitators have been written to visualize data from simulation audit trails, live simulations, and hardware in-the-loop feeds. Facilitators can be added and removed dynamically from an application, causing certain visual controls to appear and disappear based on the components that were being utilized. Application developers are very uncomfortable with the thought that a user could perform an action that can alter the interface. So while facilitators were designed to provide the user with runtime configurability, a more traditional programming model is used by all the current JView users, making facilitators a mostly unused feature.
Oddments are JView specific general code fragments. Examples include 3D model renderers, 3D simple shape factories, world visualization, and others. One of the development principles behind JView is to provide a visualization solution to rapidly changing environments. The task of visualization and the subsequent analysis of that visualization extend over a diverse heterogeneous environment varying in computing platform, operating system, and capabilities. There are numerous oddments, providing the JView application developer with capabilities as their application matures.
The power of JView can be utilized on many different levels. It allows the programming savvy researcher to exploit the lowest level graphics hardware capabilities. It allows a novice programmer to connect the provided code modules to create an application. It also gives programmers the ability to change the functionality of the system at runtime.

7
2.2.2. JView World
JView World is an oddment that provides JView developers with a full-featured globe visualization capability. It is similar to Google Earth™ (GEarth), and NASA WorldWind for Java (WW) in terms of desired capabilities, but with vastly different design requirements. As the users of JView changed over time, so did the scale and scope of their visualization needs. Once global visualization became important to our customers, development of this oddment began. Initial development occurred at least a year before the Java version of WorldWind was developed.
A comparison of these globe visualization capabilities can be found in Table 1. Google Earth™ and NASA WorldWind both use shelving algorithms to stitch together changes in the geometric complexity of the terrain. JView World contains a patent pending algorithm1 that stitches the geometry seamlessly for two reasons. The primary reason is accuracy, as drawing shelves means that there are multiple pixel locations that return the same latitude, longitude, and elevation. Essentially this is no longer a function. Secondarily, it is done for aesthetics. If the user was using JView to visualize a simulation and a tank was traversing the terrain, for the tank to be clamped to the ground, it would have to point straight up in the air.
A design requirement for JView World is that it does not force the user to alter the data. This is done to preserve the original pedigree and provenance of the data. For instance, a Google Earth™ server ingests the original data, potentially changing its statistical accuracy. This also means there are multiple copies of the files around, one in its source form and another in the form for the other applications. This occurs for many DoD users and is prevalent with users of the Portable Flight Planning System (PFPS). This also means that as NGA distributes changes for the data, there are extra steps before it can be used. GEarth and WW while they work well in rich connected clients, JView World still thrives with disconnected and disadvantaged clients. JView World does not require the user to alter a single file that is provided from the NGA CD distributions.
The largest difference with Google Earth™ is that it is an application, not a component that can be embedded into your own application. NASA WorldWind, while also an API, is just a globe visualization tool and lacks all the other capabilities that the JView developer has available.
1 Patent title: Method for loading and displaying gridded data by determining the usefulness of a particular vertex. # 60/879,211

8
Capability JView World NASA WorldWind Java
Google Earth™
Supports native NGA image product formats
Yes (GNC, JNC, CIB, ONC, TPC, JOG, TLM, JOG-A, JOG-R, CC1, CC6, CCA, CCG, CCJ, CCQ, CCS, LFC, TFC)
No, community interest exists but no complete solution available.
No, with the server, data can be imported, but the client cannot use it natively.
Supports arbitrarily large GeoTiffs.
Yes, uncompressed only. Tested up to 14336x14336 pixels (588MB).
No. Free version does not support retrieving the geotag information. Purchased Pro version does, but is limited by texture card limit, usually 4kx4k pixels.
Supports WMS Servers
Yes Yes Yes
API Yes Yes No
Programmatically generated imagery
Yes Yes Yes after saving the image, building a KML, and loading KML.
Programmatically get cursor location
Yes Yes No
Supports DTED Yes No No, with the server, data can be imported, but the client cannot use it natively.
Embed into your own application
Yes Yes No
Table 1 JView World Comparison

9
2.2.3. JView 1 Applications
Numerous applications were developed with JView during this program, both internally by the AVID team and externally. This section introduces four of these applications, all developed by the in-house team. They were chosen based on their varied scale and scope of visualizations. The Antenna Pattern Analysis Tool Set (APATS) provides single entity scientific analysis for antenna pattern measurements. The Characterizing UAV Network Environment Viewer (CUNEViewer) allows analysts the ability compare the same antenna measurements in a real-time live fly environment of one UAV and few receivers. The Audit Trail Viewer (ATV) provides analysts with the ability to view few-on-few engagements. The Airspace Concepts Evaluation System (ACES) Viewer provides researchers with insight, at a national level, of the air transportation system.
2.2.3.1. APATS
The Antenna Pattern Analysis Tool Set (APATS) represents a significant change from how the AFRL disseminates the high quality antenna data that it is charged with collecting. Traditionally a CD with the raw values collected from the antenna test range was provided, containing decibel loss/gain at a particular azimuth or elevation. These measurements are captured by rotating and tilting the asset of interest in a controlled manner, Figure 1 shows the test range in a typical configuration. Traditional visualization approaches show a single slice of the data, making it nearly impossible for experts to even understand the impact of airframe effects on antenna performance. APATS renders the airframe in conjunction with the measured data in 3D, providing the users with the ability to understand the measured data and explain it to others (Figure 2). Providing an application with the data significantly improves the AFRL analysis capability within the Department of Defense (DoD) and for DoD contractors.
Figure 1 Test range photograph Figure 2 APATS
10
2.2.3.2. CUNEViewer
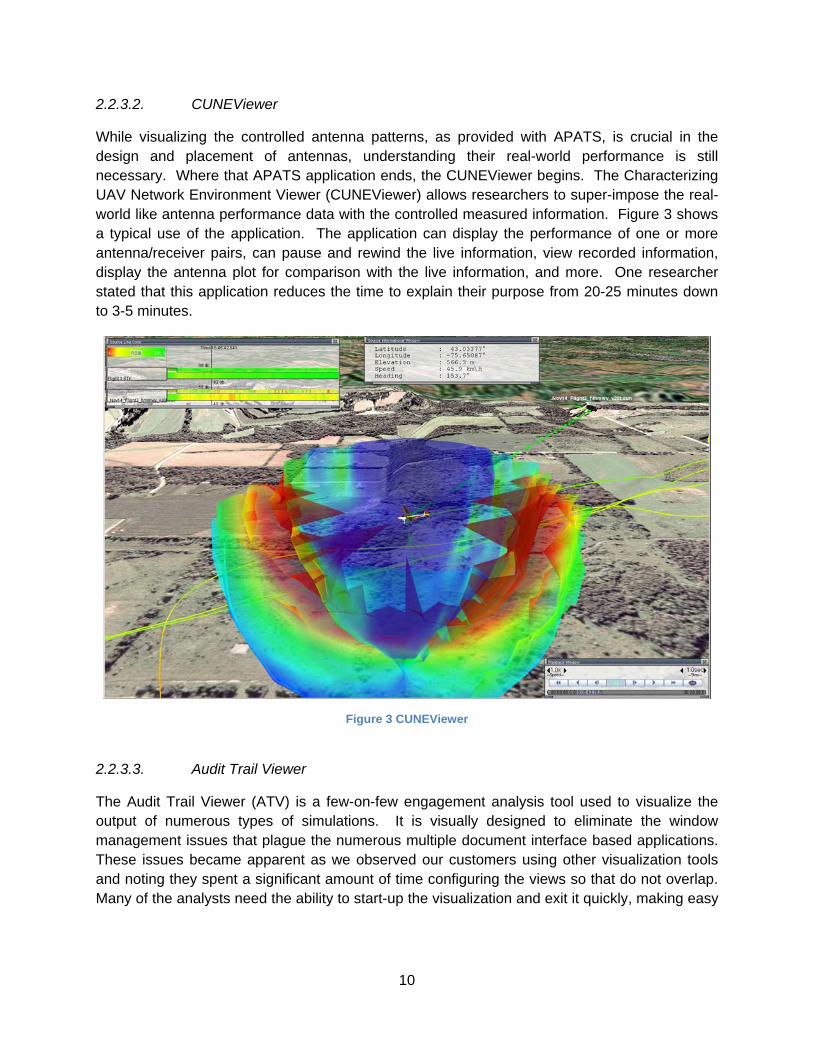
While visualizing the controlled antenna patterns, as provided with APATS, is crucial in the design and placement of antennas, understanding their real-world performance is still necessary. Where that APATS application ends, the CUNEViewer begins. The Characterizing UAV Network Environment Viewer (CUNEViewer) allows researchers to super-impose the real-world like antenna performance data with the controlled measured information. Figure 3 shows a typical use of the application. The application can display the performance of one or more antenna/receiver pairs, can pause and rewind the live information, view recorded information, display the antenna plot for comparison with the live information, and more. One researcher stated that this application reduces the time to explain their purpose from 20-25 minutes down to 3-5 minutes.
2.2.3.3. Audit Trail Viewer
The Audit Trail Viewer (ATV) is a few-on-few engagement analysis tool used to visualize the output of numerous types of simulations. It is visually designed to eliminate the window management issues that plague the numerous multiple document interface based applications. These issues became apparent as we observed our customers using other visualization tools and noting they spent a significant amount of time configuring the views so that do not overlap. Many of the analysts need the ability to start-up the visualization and exit it quickly, making easy
Figure 3 CUNEViewer

11
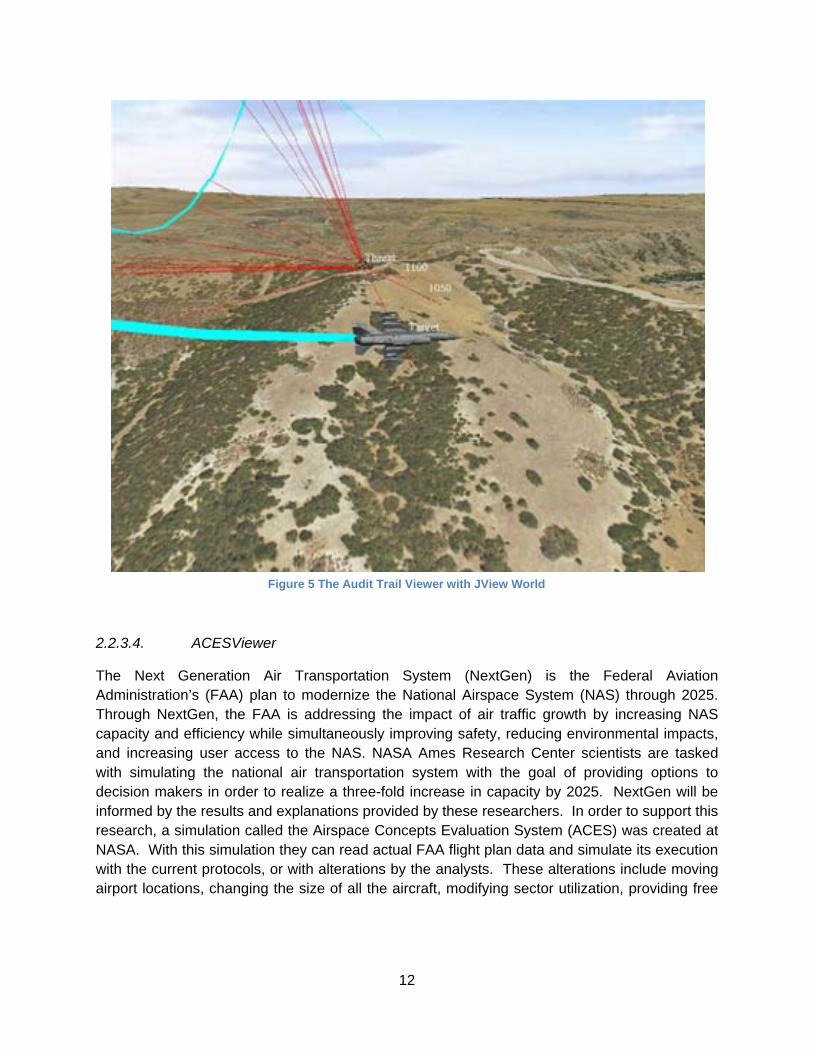
setup critical to their work process. The ATV therefore adopts a more computer-aided design (CAD) approach for user interaction (Figure 4). While the Audit Trail Viewer has been in development since JView’s inception, many JView improvements from other applications helped its development. Figure 5 shows the increased visual realism capability with the development and integration of JView World. Initial users of the ATV did not visualize simulations that occurred over any real place on the planet; therefore a geospatially accurate globe wasn’t necessary. As the requirement for visualizing simulations that do occur at particular world locations (e.g. GATER II), the ATV had a large collection of capabilities to draw from the JView engine. The result is the ability to support a wider range of simulations that utilize geospatial coordinate systems.
Figure 4 The Audit Trail Viewer layout
12
2.2.3.4. ACESViewer
The Next Generation Air Transportation System (NextGen) is the Federal Aviation Administration’s (FAA) plan to modernize the National Airspace System (NAS) through 2025. Through NextGen, the FAA is addressing the impact of air traffic growth by increasing NAS capacity and efficiency while simultaneously improving safety, reducing environmental impacts, and increasing user access to the NAS. NASA Ames Research Center scientists are tasked with simulating the national air transportation system with the goal of providing options to decision makers in order to realize a three-fold increase in capacity by 2025. NextGen will be informed by the results and explanations provided by these researchers. In order to support this research, a simulation called the Airspace Concepts Evaluation System (ACES) was created at NASA. With this simulation they can read actual FAA flight plan data and simulate its execution with the current protocols, or with alterations by the analysts. These alterations include moving airport locations, changing the size of all the aircraft, modifying sector utilization, providing free
Figure 5 The Audit Trail Viewer with JView World

13
flight routes, inserting weather, et al. It is critical that a wide spectrum of users, from Congress to the analyst, can use the information available from this application, which is the overall intent of the ACESViewer.
The ACESViewer, developed at the Information Directorate, is an exploratory visualization system that allows analysts to create visualizations that are appropriate for themselves, other analysts, NAS knowledgeable managers, and Congress. Traditional visualization approaches typically depicted only a small subset of the information available using a top-down 2D approach. The ACESViewer allows the researcher, as in Figure 6, the ability to visualize the individual aircraft, sector zones colored with their utilization, and a geospatially accurate globe. There are nearly an infinite number of visual combinations that can be assembled dynamically to answer the questions at hand for the researcher, analyst, and decision maker. The ACESViewer architecture allows the users to pull data from databases, flat files, or user generated via scripting. The ACESViewer application is not venue specific and could be used to visualize information from other sources.
2.2.3.5. Summary
While the range of applications using the JView 1 engine is vast, they all use capabilities that were born out of other communities’ interests and needs. The power of a useful visualization, even one as specifically tuned as the CUNEViewer, cannot be underscored. Visualization is still the primary method used to convey information within and between communities of interest. The JView 1 API has, and is still, successfully bridging the gap between the needs of end-users, the expertise of individual developers, and the AFRL visualization researchers.
Figure 6 ACESViewer: Aircraft, sectors, and the world

14
2.3. JView 2
While we and others have been successfully developing JView 1 based applications, the underlying graphics engine, OpenGL, has made some dramatic changes that required a fresh look at how JView 1 is implemented. For many years the underlying assumptions in JView 1 have been very stable and provided the best speeds possible on modern and older generation hardware. However, with the advent of the OpenGL 3 specification, many of the calls for which JView 1 relies will be removed from the core portion of the library. While OpenGL has always remained backwards compatible, in order to fully realize the opportunities of OpenGL 3.0, the old ways of JView 1 need to be abandoned.
JView 1 allows non-graphics experts the ability to create graphics intensive applications and provide a smooth means to introduce graphics concepts. With the introduction of OpenGL 3.0, this need is even greater. While OpenGL 3 will allow graphics experts to create even faster and more elaborate visualizations, access to that power requires an extensive knowledge of computer graphics, linear algebra, and lighting calculations. These changes forced a new encapsulation scheme for JView 2.
While changes in the underlying libraries will change how the JView 2 engine is implemented, there are additional changes to the engine that are dictated by new domains of use and from lessons learned. 2D and Non-geospatial representations of content are driving many of the design decisions. JView 2 will be a unified 2D/3D engine that provides both geospatial and non-geospatial rich content which takes advantage of high-resolution screens, multi-modal interaction, and multi-core systems.
2.3.1. JView 2 Design Motivation
To drive development and focus the effort, an executive summary for JView 2 has been written, as if a version is ready for shipping. The following provides motivation and a litmus test for development of the engine.
JView 2 is a hardware accelerated Java based application programmer’s interface (API) developed to reduce the time, cost, and effort associated with the creation of computer visualization applications or the visualization component of an application. JView 2 provides the ability to quickly develop 2-dimensional and 3-dimensional visualization applications that are tailored to address your specific problem.
The JView 2 API is government-owned and will be available free of charge to government agencies and their contractors.
JView 2 will expose a unified 2D/3D engine cutting the development time significantly to develop applications that change their desired output during design or during execution. By combining the two different engines, the same 3D model can be used to render a traditional top down view,

15
or a 3D representation. For the first time, the 2D viewer could actually see the pitch and roll of an aircraft, not just its yaw, while still maintaining the traditional map layering and scale invariance common to 2D representations.
JView 2 considers the non-geospatial representations with the same completeness as the traditional geospatial support that JView users have come to depend. The multi-core aware node-link graph subsystems allows developers to produce visualizations of computer networks, social networks, hierarchies, and more with the same ease and flexibility as other JView components. The JView 2 user community is made up of software programmers; remember our initial definition of JView 2 as an application programmer’s interface. However, the end user of a JView 2-based application is anyone who has the need to have information portrayed.
Users of the original JView 1 API will recognize some of the terms, but now have access to the latest speed and flexibility in the underlying OpenGL library, and a graphics system that scales with the number of available computational cores. While the JView 2 engine is not backwards compatible, transitioning products to the new engine is straightforward.
2.3.2. JView 2 Design/Requirements
The goal of JView 2 is to create a visualization system that allows seamlessly blending 2D and 3D concepts including advanced image operations. An application developer can have layers of 2D and layers of 3D content intermixed with custom control over how and when blending will occur based on depth within the scene and when it should occur based on draw order preference. The engine has facilities that perform or assist in clipping plane management, frustum culling, occlusion culling, and level-of-detail. All these concepts are inter-related and supported through the multi-pass traversal of the scene. There are interfaces used for end-user implementations for extending the core system, but JView 2 also includes concrete, i.e. instantiable, versions for many of those interfaces. As of writing this document, only limited portions of the JView 2 engine have been implemented.
2.3.2.1. Performance Requirements
As displays grow in resolution, computers increase the number of available cores, and users’ thirst for more content being displayed, the performance of the underlying engine will bound its future utility. For the next set of values the term unit refers to 1/60 of a second. A SceneElement is a JView 1 term and while there is no such object for JView 2, it represents an application’s set of atomic visual objects. For example, a SceneElement is an entire aircraft, not just the wing or an articulated aileron. Initial performance requirements are as follows:
• Create 1,000 SceneElements/unit • Update 5,000 SceneElement positions/unit • Display 25,000 SceneElements/unit • Interactive at 7680x2160 pixel resolutions

16
These requirements were derived from the ACESViewer development where in one time step of the simulation, hundreds of new aircraft are created, thousands need to change location, and the aircraft, labels, and boundaries need to be displayed. While the amount of data and number of aircraft dictate half of the requirements, these involve mostly vertex operations. The display represents the other half of the equation and is of critical concern as it scales the needs of the polygon fill operations. Numerous users are now using two 30” cinema displays at a combined resolution of 5120x1600 with single panels also available now at a whopping 3840x2160.
In order to meet the performance requirements of our users, multi-threaded implementations of core components is critical.
2.3.2.2. Rendering Pipeline
The JView 1 rendering pipeline had five distinct draw passes in order to support background, foreground, and blending of shapes, the JView 2 engine has no such restriction. The user can create any number of draw passes that are necessary to achieve the desired effect(s). A large source of confusion in JView 1 was what geometry gets rendered in which pass and how that affects the resulting image. This was partially due to the fact that assigning the geometry to particular draw passes was hidden from the user and only evaluated by hints. Limiting the number of passes also makes it significantly harder to create layers that operate as they do in traditional 2D applications.
There are a handful of concepts that are necessary to understand, harness, and extend the JView 2 rendering pipeline. The concepts are the Scene, SceneDrawPassInterface, SceneDrawPass, SceneDrawableInterface, SceneElementRoot, SceneElement, SEGeometry, TransformNode, and GeometryNode components.
2.3.2.3. Scene
A Scene maintains what to draw and where to draw it from. It has a reference to one of the JView provided drawables that are added to the Java Widget Hierarchy. This separation allows the Scene to operate on different types of hardware supported visuals: heavyweight, lightweight, and off-screen.
Scenes respond to repaint requests that originate from both the widget component hierarchy and the SceneDrawPass lists. Scenes also contain the lights and camera positions.
Each Scene is responsible for storing an ordered list of objects that implement the SceneDrawPassInterface. An example set is a SceneDrawPass that clears the background to a solid color; another may display a skybox. Another SceneDrawPass might contain a list of 3D

17
primitives to display; another may just clear the depth buffer, followed by another pass that displays 2D heads-up-display like content.
These SceneDrawPass objects are guaranteed to be processed in order, or in parallel followed by a compositing stage that would have yielded the same result as if they were in order.
Example construction is as follows:
Scene scene = Scene.newInstance(new HeavyWeightCanvas());
Calling the newInstance method creates a new Scene and “binds” it with the drawable that it uses as its canvas. While it would be nice to be able to create it with, "new Scene(drawable)", it is not thread safe since there are internal listeners that need to be registered on other Threads for its proper implementation.
A Scene also contains state that is common among all of the components. For example, a fast implementation for GLUProject that performs intermediate calculations once each frame, calculates the frustum for the view, and any other CPU expensive shared state.
Every Scene that has SceneDrawPasses that are common with another scene must share the same lock to create the necessary blocking behavior for movie creation and other atomic operations.
2.3.2.4. SceneDrawPassInterface
Scenes can only display instances of objects that implement the SceneDrawPassInterface. There are two extended implementations provided by the core JView 2 engine; SimpleSceneDrawPassInterface and SortableSceneDrawPassInterface.
The SimpleSceneDrawPassInterface implements the traditional 2D layering concept, meaning that display ordering is dictated solely by its position in the list. The SortableSceneDrawPassInterface provides a mechanism for depth sorting individual “SceneElements” to support rendering of translucent objects.
Example concrete implementations of the SimpleSceneDrawPassInterface include the ClearSceneDrawPass and the ScreenshotDrawPass. The ClearSceneDrawPass clears the depth and color buffers, it does not really draw any objects to the scene and is typically added as the first DrawPass for a Scene. In JView 1 this happened by default, but there are instances where it is a waste of effort; for instance, when the entire background will be filled by an image, or sky. While clearing the screen may seem trivial, it is one of the most costly operations since it must alter every pixel. The ScreenshotDrawPass captures an image and provides it to the programmer. It could be used to generate a movie, a thumbnail for some camera operation, or saved to the disk for instance.

18
The ElementDrawPass is a concrete implementation of the SortableSceneDrawPassInterface. During draw operations, the JView 2 engine grabs view dependent depth values from all the contiguous SortableSceneDrawPassInterfaces and displays them in depth order based on a runtime configurable policy. While sorting is usually done on translucent geometry to create a more believable final product, it can be useful to sort opaque objects as well. On modern graphics cards there is a process called early Z-kill. This extra stage essentially does not allow a triangle to pass through the entire pipeline if all pixels that it would fill would fail a depth check later in the pipeline. This optimization alters the logical representation of the graphics pipeline and can significantly change the performance of an application. By providing this option to JView based developers, they can tune for performance based on the use of their application.
2.3.2.5. JViewDrawables
JView 1 was limited to on-screen hardware accelerated drawables due to the GL4Java binding that was being used for most of its development. There are instances where rendering to an off-screen visual not only makes development of an application easier, but makes some applications possible. For instance, remote rendering on the server and sending an image back to a client, rendering frames of a movie at a different resolution than the application window, or rendering an image larger than the current screen can support for printing.
JView 2 exposes an on-screen hardware accelerated surface, called HeavyWeightCanvas, a lightweight hardware accelerated on-screen version for correct integration into Swing based applications called LightWeightCanvas, and an offscreen version called OffscreenCanvas
2.3.2.6. Outstanding Issues
One of the nicest JView 1 features is that it allows non-graphics experts to slowly learn the concepts of computer graphics and develop custom components without having to understand all of OpenGL and the JView engine. With the advent of shaders and the removal of what was once core OpenGL functionality, this may no longer be the case in JView 2. While shaders provide experts with the power necessary to realize new visual metaphors, they make learning much more difficult. JView 2 needs some method of encapsulating this complexity so that users are not constrained by the engine’s use of shaders.
2.3.3. Examples and Proofs of Concept
2.3.3.1. Million Node Demo
In order to experiment with non-geospatial visualization needs, the AVID team wanted to explore the capability of Java based graphing packages. Graphs in this case are the

19
generalized construct of a set of nodes and edges. These representations are used for social network analysis, computer network visualization, command chain representation and many other applications.
There exist numerous Java based graph libraries, both free and commercially available. We started our exploration with a free library called Prefuse2. It is consistently used by the research community and is even used by the ACESViewer application to display the visualization graph.
While Prefuse offers the researcher a wealth of visual representations, it quickly becomes unusable with large datasets, or at resolutions of 2560x1600, even with modest datasets of tens of nodes and links. Defining what constitutes large quickly became difficult, fortunately one of our customers was interested in visualizing networks consisting of 100,000 nodes. Based on historical data growth explosion, the team decided to experiment with an order of magnitude larger.
The team implemented two different demonstrations, one of 1,100,101 nodes (see Figure 8) with no edges, and one of 100,101 nodes (see Figure 9) in fully connected tree emulating computer network subnets of 255 computers. Each node being displayed (see Figure 7) is a view aligned pixel accurate rounded rectangle. In order to support such a massive number of nodes, it was quickly determined that the use of OpenGL shaders would yield the best performance and the best visual quality. This demonstration uses Vertex Buffer Objects (VBOs) and vertex and fragment shaders to convert a simple set of four points into individually located, view aligned, and pixel accurate nodes. This graphical representation was chosen due to the fact that numerous graph packages use this as their basis.
The setup for the algorithm works as follows:
1) Create a large memory mapped buffer that stores four vertices per node. 2) Store in each of the four vertices for that node the center point of the node. 3) Assign attributes for each vertex with the node width, node height, individual corner
id, and aspect ratio of the node.
Each node needs to store the width, height, and aspect ratio of the entire node since while processing vertices on the graphics card, neighbor information is not available. The corner id is either upper left, upper right, lower left, or lower right. This is used so that the vertex is transformed to the appropriate screen location based on the node width and height. Through
2 Prefuse is a set of software tools for creating rich interactive data visualizations and is available from http://prefuse.org/
Figure 7 One Node

20
the use of the VBO, all the data for the graph to display is resident in graphics memory on the card, resulting in very little communication at display time.
There are two shaders that were needed to recreate the desired image from the encoded data, a vertex shader and a fragment shader. These shaders are defined in a high level language and converted into graphics card dependent code during compilation. OpenGL 2 has two programmable stages that allow per vertex or per fragment (pixel) operations. When a piece of geometry is to be rendered its vertices are passed to the vertex shader where the location, color, texture coordinates and other properties can be accessed and modified. The topology is not available, only a single vertex. After vertex processing, it is sent to the rasterizer that converts the mathematical location of a piece of geometry into a set of filled pixels on the screen. At this point each fragment, which in this case is a pixel, is passed to the fragment shader where the color to be rendered can be modified or the fragment can be discarded. Its destination pixel on the screen cannot be altered.
The vertex shader uses the eye space information to transform the four vertices into their new world space coordinates, creating a simple view aligned quad. The fragment shader then evaluates first if the fragment is within the mathematical bounds of the rounded rectangle. If it fails it is discarded. If it succeeds, the color is assigned as a smooth interpolation of yellow in the upper left, green in the upper right, cyan in the lower left and blue in the lower right.
Through the use of OpenGL shaders and VBOs, this demonstration exceeds 60 frames per second (fps) on a modern desktop system and scales just as effectively on the 16 million pixel screen. While this demonstration shows just a small portion of what is necessary to display graphs, this test does prove that with judicious use of modern technology, some of the assumed limitations can be surpassed. The elimination of some of these performance barriers informed and drove many of the JView 2 requirements.

21
Figure 8 One million nodes
Figure 9 125k nodes with fully connected tree
2.3.3.2. Blending Operations
In 3D applications, translucency is simulated with blending operations. This simulates what exists in the real world. However, 2D applications address blending in a myriad of different ways. In order for JView 2 to support the needs of 2D drawing, identifying and listing the methods is important to understand their own unique design implications.

22
For example, if you want to see the area covered by a number of surface-to-air missile (SAM) sites, you could draw each one translucent as shown in Figure 10. The areas of overlap generate a more opaque representation. However, the user may want to show the entire area as a threat and the overlapped region isn’t any more lethal, then Figure11 would be better. Now consider overlapping colored regions. If blending is done per zone, the overlapping region would have the wrong color and would be excessively darkened (Figure 13).
Figure 10 Standard additive blending
Figure 11 Compositing then blending

23
Illustrating the blending operations worked to identify and refine the need for compositing draw passes and user defined sorting of any number of draw passes.
Figure 13 Additive with color blending
Figure 12 Non-additive blending

24
2.3.3.3. Preserving Line Attributes over Arbitrarily Tessellated Surfaces
Drawing in 2D affords certain visual representations that are difficult or computationally infeasible in interactive 3D applications. One such visual structure is a line that traverses over terrain. The color, shape, connectivity, and proximity are used to convey information. Drawing lines in a 2D application degenerates to the simple case of drawing the line after drawing the map. As you zoom in and out of the map, the line maintains the thickness and stipple (dashed, dotted, et. al) pattern assigned. This works since all the points in a 2D projection are orthogonal to the view and occlusion cannot occur with the terrain. For 3D this is not the case. The naïve assumption is adding 3D provides an enhanced understanding due to the addition of another dimension. The problem is that rendering lines in 3D cannot be accomplished in the same fashion.
There are essentially two different ways to display lines on the terrain using OpenGL. The first method involves drawing the terrain, then drawing the rest using OpenGL line primitives. This requires the programmer to re-sample all of their lines so that there exists a vertex at every point where the line crosses a terrain boundary, see Figure 14.
This is computationally restrictive based on the refinement of the terrain and the amount of terrain that each line crosses. There are also differences in how OpenGL renders lines and triangles causing the programmer to artificially move the line closer to the viewer. While polygon offset seems like a godsend at first, it quickly creates errors in the output. Lines that are supposed to be hidden behind terrain will often poke through and create disturbingly difficult depictions to understand. Figure 15 is an example of how these lines will often float above the ground or interact with the terrain in undesirable ways.
Figure 14 Re-sampling for lines over terrain

25
Alternatively, programmers use textures to display lines on the terrain. This method has the beneficial property of being drawn in the same way as the terrain and operates much like any other texture of the terrain would act. The programmer does not need to resample the lines and treats it much like they would in 2D. This has a huge disadvantage, however since if the user looks obliquely upon the terrain the width of the line will vary over the surface (Figure 16). This means that the user cannot encode meaning to the thickness, or the stipple pattern of any of these lines since they will vary during normal interaction.
Figure 16 Diminishing lines using textures
Figure 15 Failed use of OpenGL lines

26
Our implementation has all the advantages of texture mapping without the negatives. Figure 17 is a screenshot from our implementation. Any perceived changes to the width of the line are caused by the fact that the terrain actually tilts away from the user. This gives the viewer a much better understanding of the terrain surface.
This implementation uses each pixel in a texture map to store the positions of the line segments. When each fragment is being rendered, our shader evaluates whether the fragment being processed intersects the line segments stored in the texture. If it fails, the fragment underlying texture is used; otherwise, display (in this case) a red line.
2.3.3.4. Summary
While JView was the centerpiece for the majority of concept demonstrations, some concepts were more easily created without JView. These often gave rise to the requirements that formulated many JView 2 concepts and design. While the new capabilities of OpenGL will allow the team and users of JView to display data in new and informative ways, the learning curve for extending JView 2 will be much steeper due to those same changes.
Figure 17 Preserving line width over the surface

27
3 Interactive Displays A tiled display or DataWall is a matrix of multiple display devices such as Liquid Crystal Displays (LCDs), plasma screens, or video projectors positioned next to each other, to create a single continuous image. The approach of using a large tiled display has advantages in enabling mission planning in today’s battlefield. Primarily, a large tiled display offers more available workspace for viewing data and information. In critical C2 situations, enabling comparisons and relationships across different applications is crucial to decision-making. Moreover, a larger tiled display is accompanied by an increase in image resolution, which leads to better image scalability. Higher levels of detail are available to the commander, improving the viewing clarity and ability to manage applications. This is especially true for those situations requiring high performance such as graphical maps and high resolution satellite imagery. A large tiled display comprising of high-resolution devices provide the avenue for exposing deeper levels of imagery pertinent in analyzing and assessing essential details in visualized data. Furthermore, larger displays enable more effective collaboration within a localized working environment. Tasks where missions are planned and discussed necessitate information that is effortlessly shared with an entire audience.
Most large high-resolution displays available in the present market are manufactured as passive systems. These systems typically only allow the user to view data, and provide little means for engagement and interaction. Collaborators face the challenge of effectively managing massive amounts of data displayed on a large screen. The use of input devices such as conventional mice and keyboards is a cumbersome and limiting approach, which tethers user operations to a single location. Displays should function as active and interactive work spaces and not merely as a summary device for information presentation.
As a follow on to our previous research in large screen interactive displays [1, 2] our goals for this in-house project included an implementation of a high-resolution large screen display that would enable touch interaction. This was based on repeated requests by our previous DataWall users. The resolution requirement for the display was driven primarily by the state-of-the-art in commercial projector technology, and the types of high-resolution visualizations that would be developed. We also planned to implement a number of enhancements to our previously developed portable displays to improve their usability.
3.1. Reconfigurable Display Modules (RDMs)
3.1.1. Introduction
The RDMs were originally developed by Information Directorate researchers under a Memorandum of Agreement (MOA) with NASA Ames Research Center to develop interactive display technology. The RDMs provide a modular and reconfigurable large screen display

28
system that is suitable for a variety of applications. It was in keeping with the philosophy to build unique display capabilities that would not be isolated to a specialized laboratory environment, but that could be moved and set-up in any venue. They consist of a frameless screen, folded optics, and video projector housed in a frame on casters that collapses to a size that will fit through any standard 3' doorway.
Each RDM screen is acrylic, 72"W x 54"H, and mounted in a unique screen frame assembly that provides a near frameless viewing surface. When multiple RDMs are aligned with each other the frameless screens provide a near seamless tiled display (Figure 18). The folded optic is a trapezoidal first surface mirror mounted at three points at 45° relative to the screen. It provides the required projection throw distance while minimizing the functional depth of the RDM. The outside edges of the mirror can be distorted with adjustment knobs to bend the mirror in either direction to correct for optical distortions in the image caused by the projector optics. Short-throw projector lenses have a tendency to cause barrel distortion which makes the edges of the image curved, so the adjustable mirror can compensate for this. The video projector has a resolution of 1400x1050 pixels with a short-throw lens to further minimize the operational footprint of the RDM. The screen, mirror, and projectors are all commercially available and were purchased off the shelf.
The innovation is the design of the extruded aluminum frame that supports these components that incorporates rail bearings and hydraulic pistons to expand the system for operation and collapse the system for transport without disassembly. Collapsed dimensions of 78.5"H x 32.5"D x 72"W allow it to fit through a standard 3' doorway. The screen assembly slides on rail bearings to collapse the depth to 32.5". The display system height collapses from 92" to 78.5" via hydraulic pistons (Figures 19-21). The unit is on casters for portability and also allows multiple modules to be linked together in a variety of configurations to create larger modular displays.
Figure 18 Reconfigurable Display Modules (RDMs) – 3 Module Configuration

29
Hydraulic Piston
Rail Bearing
Slides in
Lowers
Figure 20 RDM Side View – Extended and Collapsed
Figure 19 RDM ¾ View – Extended and Collapsed
Rail Bearing (On each side)
Hydraulic Piston
Commercially available display screen
Commercially available video projector

30
The screen, mirror and projector assemblies are linked together to ensure the optical path from the projector to the mirror, to the screen is constant regardless of the display height. This ensures the image size is constant, and allows the display to operate at any height within the hydraulically actuated range of 92"-78.5". The operating height range also aids in vertical alignment of multiple modules on unlevel flooring.
The prototype RDM used a COTS 6-DOF (degrees of freedom) projector mount to secure the projector vertically and to adjust its position for image alignment. However, it was not suitable for the desired mobility of the RDMs. Pivot points on the mount provided easy movement but lacked the tight precision that was necessary. Adjustments could not be adequately locked into place which required readjustment if the RDMs were moved to another location. So, included in the current RDM version is a custom-built projector mount providing the necessary 6 degrees of precise adjustment, with mechanisms to lock it in place and ensure the projector position remains constant (Figure 22-23). We currently have 6 RDM units in the AVID Research Facility.
Figure 21 RDM Front and Top Views
Commercially available display system mirror

31
Figure 23 Exploded View of RDM Projector Mount
Figure 22 Isolated Views of RDM Projector Mount

32
3.1.2. Enhancements
During the course of this in-house program a number of enhancements to the RDMs were designed and implemented to improve their usability; all of which focused on making set-up easier inside and outside the AVID Facility.
3.1.2.1. Manual Leveling Casters
It was clear very early in development that there needed to be a method for leveling each individual RDM if they were to be set-up in multi-module configurations in order to minimize the gap between screens. Without it, even the slightest irregularities in the floor will make multi-module alignment impossible. The first RDM prototype used an integrated caster/leveler (Figure 24). Once the RDM was positioned, the levelers could be lowered to lift any of the four corners. The mechanical ring to lower the leveler was very difficult to turn however, primarily due to the weight of the RDM, and they had a limited range. It was also difficult to make slight position adjustments of the RDMs once the levelers were lowered. This is necessary once it has been leveled to correct any screen offset at the seams
The next implementation used conventional casters with the levelers separate and mounted to the front and rear sections of the base near the corners. These required a wrench to raise and lower each leveler. They worked very well, but required a separate tool to operate and minor repositioning of the RDMs was still difficult once they were lowered.
The current systems share some of the original design concepts by integrating the caster and leveler into a single mechanism. Unable to find a COTS solution, a custom leveling caster was designed and fabricated. The design addresses the previous implementation issues by keeping the wheel on the ground regardless of the height adjustment to allow the RDM to be repositioned after it has been leveled. It also no longer requires a separate tool to adjust them. The mechanism uses a COTS triple rod pneumatic cylinder assembly that was modified by integrating a threaded rod. It is turned by an integrated ratchet to raise and lower the piston and subsequently the caster. The triple rod bearing system was particularly appealing because it would adequately support the moment load on the casters without flexing. There were some minor issues with respect to the rigidity of the mounting brackets with the first prototype, but
Figure 24 RDM Leveling Caster Prototype

33
were addressed using thicker gauge steel and the addition of a gusset. They have been successfully installed on the 6 RDMs in the AVID research facility (Figure 25).
3.1.2.2. Automated Leveling Casters
The manually actuated leveling casters proved to be very effective when aligning multiple RDMs. However, if the RDMs could level themselves automatically, this would further simplify multi-module configuration set-up. The approach was to leverage COTS sensors to determine the pitch and roll of an RDM dynamically and to adjust each of the four caster heights independently with electromechanical actuators until it is level. The ultimate goal is to have a completely autonomous leveling system, but the first implementation described here still
Figure 25 RDM Ratcheting Leveling Caster

34
requires a human to operate the switches based on the information displayed by the sensor system.
There were several issues that had to be addressed in designing the automated leveling device. One of these issues was a space constraint. There exists a limited amount of space in and around each caster to be utilized by some type of device. This is particularly true when the RDM is collapsed for transport. Given the complex nature of the existing RDM frame, the final design of the device had to be small enough as to not interfere with any pre-existing components. It was also desirable to avoid or at least minimize the amount of disassembly to the existing frame in order to integrate the new parts.
The device needs to be able to detect the pitch and roll of the RDM and then convey this information to the user to aid in the leveling process. Currently, a traditional carpenter’s level is placed on the front, rear, left and right sections of an RDM and adjustments are made based upon these measurements. This current method is crude, inaccurate, and can be very tedious.
The leveling device also had to be as cost effective as possible for obvious reasons. There was a delicate balance between cost and both the precision and usability of the device. The device consists of four major components including a control unit, an inclinometer, two LED displays, and one AC motor per caster.
The control unit is the user interface to level each RDM display. It contains the LED displays that show the pitch and roll information, and eight push button switches to adjust the casters. The switches are connected to four relays each of which is connected to one of the caster motors. The push button switches are responsible for activating one or a combination of the relays which in turn activate one or more motors. The eight switches allow any combination of the four casters to be adjusted individually or simultaneously. The control unit also has two master switches. The first is to activate the DC components of the device such as the switches, relays, and the inclinometer. The other switch is to activate the AC components of the device including the LED displays and the AC motors. There is also a toggle switch to reverse the polarity of the motors so that they can operate clock-wise and counter-clockwise. The polarity of the motors determines if the casters are being raised or lowered.
The gravity referenced inclinometer is an inertial device that can detect changes in the incline of an object on a geometric plane. In our implementation this component can dynamically and simultaneously determine the current roll and pitch angles of the RDM very precisely. The power for the inclinometer is generated by one of the control unit LED displays to which it is connected. The inclinometer is highly accurate to within a thousandth of a degree. It has a full input range of -1 to 1 degree, comes equipped with an internal temperature sensor to prevent overheating, and is a low power consumption device of less than 50 mA. The inclinometer works by outputting a specific voltage for a specific incline and is then sent to the LED displays for processing.

35
The pair of LED displays show the inclinometer angle readouts. One displays the pitch angle while the other displays the roll angle. The components are microprocessor based panel meters designed to take the output from the inclinometer and display it as an angle in degrees. As stated previously, the unit also provides the excitation voltage needed to drive the inclinometer, and comes equipped with RS-232 outputs for interfacing with a computer, programmable logic controller (PLC), or printer. The actual display consists of a 4½ digit, seven segment red LED with each digit .58” in height.
The set of AC motors are single phase induction motors that are reversible and operate with considerably less amperage at full load then DC motors. The motors operate at 115 volts AC, have a 18:1 gear ratio, output power of 90 watts, round shaft type, and built-in thermal protectors. They operate at 100 rpm and have a torque rating of 80 in-lbs as required for this application. It was determined the casters would extend/retract about an inch for every 12 seconds at 100 rpm. This was considered to be a reasonable speed for accurately leveling the RDMs. Raising or lowering the load will depend on which direction the motors are operating. A simple sprocket and timing belt assembly is used to transfer the rotational torque of the motors to the caster piston shaft (Figure 26).
Final integration of this system is still being accomplished and will require some testing once installed. After successful completion of the leveling prototype, most of the circuitry associated with the control unit can be implemented on a microprocessor. This will greatly reduce the size of the current control unit and allow for easier manipulation of the device. There also exists the potential in the future to modify the device to make it completely autonomous with no human intervention needed. This device will greatly simplify the process of leveling the RDM displays thus increasing their portability and functionality.
Figure 26 RDM Electromechanical Leveler

36
3.1.2.3. Mirror Mounts
Early in the development of the RDMs it was realized that the mirrors that are mounted at a 45° angle would also need some adjustment to aid in image alignment. Slight variations in the projector and mirror optics, even ones of the same make and model means the position of the mirror will not be consistent for each RDM in order to get the image rectilinear. Initially, the brackets that mount the mirror at three points to the RDM frame were slotted to allow some adjustment, the horizontal extrusions could be positioned higher or lower to adjust the pitch, and the entire mirror frame assembly could be repositioned forward or backward. This however did not give the mirror sufficient adjustment, and lacked a precise fine-tune adjustability. Correct mirror position greatly reduces projector adjustment time. Precision is critical because a very slight adjustment has significant impact on the image. And again since the modules would be moved periodically to other locations, the ability to lock the mirror in position after it had been adjusted was important to reduce set-up time in its new location.
A new fine tune adjustable mirror mount was designed and fabricated by our in-house fabrication shop (Figure 27). Each of the three mirror mounting points can be adjusted independently. Adjusting the lower mount changes the pitch of the mirror to correct vertical keystone in the image, i.e. wider on the top than the bottom or vice versa. Adjusting the upper mounts changes the pitch of the upper corners of the mirror independently to correct both horizontal and vertical keystone. Adjusting a combination of the three to get the image as rectilinear as possible on the screen is the first step to achieving image alignment. Once adjusted, a locking mechanism maintains its position even if the RDM is moved. The final correction is then accomplished by adjusting the projector mount. Once a prototype mirror mount was fabricated, integrated and tested, all of the RDM mirror mounts were upgraded with the new design.
Figure 27 Fine-Tune Mirror Adjusters

37
3.1.2.4. Linkage
Since the RDMs were designed to be used in a variety of multi-module configurations, it is critical that the screens be positioned tightly together to ensure a near seamless aggregate screen. It is also important to be able to position the modules at fixed, consistent angles to create a faceted, curved screen if desired (Figure 28).
In collaboration with our fabrication shop, a multi-RDM linkage system was designed and prototyped to allow multiple RDMs to be linked together at various angles. The mechanism is mounted in between the two modules to be linked. A screw drive is turned to either increase or decrease the angle between the modules. Since the screens need to remain together at any angle, the mechanism’s pivot point is just below the corner of screen (Figure 29).
While evaluating the prototype, it was determined that the moving parts would need to be fabricated to much tighter tolerances to ensure the screens do not separate at the seam during adjustment. The slightest amount of play in the mechanism causes the modules to separate if they are pushed with any amount of force. Therefore it doesn’t keep it in a locked position effectively. A more significant problem with the linkage, however, is a result of the characteristics of the casters. They are swiveling casters that are offset from their central pivot point to allow them to change direction. This allows the modules to be rolled in any direction to make multi-module set-up easier. The problem with these casters with respect to the linkage is whenever you reverse the angle adjustment, i.e. go from increasing the angle to decreases it, or vice versa, the casters need to rotate 180 degrees to change direction. In so doing, pivots the entire frame about the casters’ contact points with the floor. This causes the modules to separate at the screen seam. Some modifications to the linkage were considered along with alternative solutions for the casters, but nothing completely solved the issues without introducing a new set of problems. Based on the analysis, it was decided to cease any further development at this time.
Figure 28 Overhead View of a 3 RDM Configuration

38
Figure 29 RDM Linkage Prototype

39
3.2. Dual Use 2D/3D Display System
3.2.1. Introduction
A new large screen display was designed to support both high-resolution 2D and stereoscopic 3D imagery, each using a different set of projectors. The intent of designing a dual use display system was to efficiently use premium lab space that could serve multiple purposes. The projection room space needed to accommodate the quantity of projectors that would be used for both applications.
The display size and resolution were determined by a number of interdependent factors, including projection room space, audience size, ease of interaction, and projector technology. Although there was no specific resolution requirement, we wanted it to be as high-resolution as technology would allow since it was intended to be interactive at a close distance. The visualizations being developed by the team discussed previously in Section 2 would also benefit from a display that could accommodate massive and multiple dataset representations. However, since the display would also be viewed by groups of users we had to be careful in selecting a pixel density that would also be usable at a distance for collaboration. Conventional applications are not cognizant of display resolutions and sizes of this magnitude and can become unusable and unreadable if taken to the extreme.
Tiling multiple projectors is a common technique to accomplish both higher resolution and brightness that has been used extensively at the Information Directorate for previously designed displays [1, 2]. It was a technique we intended to use in this instance, but at minimum if possible to simplify alignment and minimize the number of seams.
The screen material for this dual purpose display also needed to support both types of imagery. White field uniformity was important for the multi-projector installation to minimize hot-spots, but equally important was the need to maintain polarization for 3D imagery. It also needed to be rigid enough to support touch screen integration research.
3.2.2. Projectors
The first design decision for this display was the selection of the projectors for the 2D imagery. Our requirements were a commercial-off-the-shelf model that would provide the highest resolution possible with a minimum throw distance to keep our projection space as small as possible. The highest resolution projector on the market is the Sony 4K SXRD series at 4096 x 2160 pixels. It is also available with an extremely short-throw lens having a 0.8:1 throw distance to image width ratio that would accomplish the image size desired within the projection room space available. We decided to tile two of these projectors and drive them each at 3840 x 2160 for a combined resolution of 7680 x 2160 or roughly 16M pixels. We opted to drive them at a

40
slightly reduced resolution than what they were capable of natively, since it is a multiple of the standard HDTV format of 1920 x 1080 pixels. This would be more compatible with potential content to be displayed and would also be compatible with the aspect ratio planned for the 3D imagery.
One common technique for creating stereoscopic 3D imagery is to use a set of dual projectors each displaying either the left or right eye images overlaid across the same screen area. In rendering a 3D scene on a computer, the location of the “eye” is defined as one of the parameters that determine the viewing volume and subsequently which objects will be visible. To mimic the way the eyes view 3D objects in the real world, the left and right eye scene renderings have eye positions with a lateral disparity equal to an average interpupillary distance (distance between the pupils) for the viewer. The images are kept separate by passing each projected image through a filter such as a polarizer (one polarized orthogonal to the other). A viewer observes the images through glasses similarly filtered. Left and right eye information is only seen by each appropriate eye to create the illusion of depth.
To accomplish the 3D imagery, several candidate projectors were identified. With the recent surge in products supporting the HDTV standard resolution it was decided to be the best option in terms of cost and format compatibility. Although the 3D capability has not been integrated into the display system to date, it was a key component to the decision making process involving the screen type and aspect ratio. There are plans to implement a 3D capability in the near future.
3.2.3. Screen
Once the projectors were selected, the final details could be completed regarding the projection room and screen size that had previously been rough estimates based on desired viewing room size. In the end we were able to minimize the projection room in order to maximize the viewing room size while still providing adequate space to service the equipment.
The screen size was very carefully decided based on the average viewing distance, the aspect ratio of the projector configuration for both 2D and 3D applications, and intent to integrate a close screen interaction capability. AFRL/RI has been developing novel modes of large screen interaction for the past several years [1, 2]. We intended to use this screen to continue that research which would include interaction by touch. Based on an average body size of a user, it was determined a screen height of about 4¼' would allow access to both the top and bottom of the screen without strain. It was also an acceptable height for audience viewing that translated the total screen aspect ratio of 32:9 to a screen size of approximately 15' x 4¼'. At this size the 2D image would be the resolution of the human eye at about 6'. That is, a viewer could not discern a pixel from > 6' away.
The screen selected is made of shatterproof glass that is very rigid to enable touch interaction without flexing. It also has adequate brightness uniformity and will maintain polarization for the

41
3D imagery configuration. The extremely short throw of the projectors does however result in a difference in observed brightness when viewing off axis due to the sharp angle in which the projected light hits the screen that is most noticeable at the projection seam. This cannot be avoided completely with any type of screen. Hot spots are a characteristic of all projection screens that are a result of the high intensity light source emanating from a projector lens much smaller than the screen. The diffusion layer in the screen scatters the light to distribute it as evenly as possible. The more diffusion, the greater the brightness uniformity, but the less screen gain and image brightness. In the Figure 30, from the position of the eyes depicted, the left projector image is brightest at the center and darkest at the corners. Since the light rays from the right projector’s left edge are aimed directly at the viewer, while the light rays from the left projector’s right edge light rays are aimed away from the viewer, the right edge of the left projector image will appear considerably darker than the left edge of the right projector image. The brightness shifts in the opposite direction as the eyes move to the right with the best vantage point for brightness uniformity across the tiled display directly in the center of the screen and as far back as possible. The photo in Figure 32 shows the non-uniform brightness issue. Brightness uniformity can be improved to a certain degree by increasing the throw distance for more consistent angles at which the light rays reach the viewer (Figure 31). The additional projection space was not an option, however and would also decrease the overall brightness. We have considered some edge blending to lessen the effect in the future.
Figure 30 DataWall Brightness Uniformity Figure 31 Increasing Throw Distance
Impact on Brightness Uniformity

42
3.2.4. Projector Alignment System
A critical component for a tiled projection system is an adjustable projector mount system that provides 6 degrees-of-freedom (x, y, z, roll, pitch, and yaw) for image alignment. There are approaches for both manual and automatic alignment of projection-based display systems to greatly reduce the visibility of seams and gaps between image tiles, but each with its own limitations and trade-offs. What has to be considered in implementing solutions to these problems is what is acceptable in terms of image distortion and ease of adjustments. Ideally the projected tiles should be the same size, rectilinear, and with no separation.
Although manual alignment of projectors can be a time-consuming process, there is no loss of resolution which is a major advantage; especially with certain applications. Therefore, a conscious decision was made to implement a completely mechanical alignment procedure that physically repositions the projectors rather than distorting the image through software. Many projectors provide a lens shift capability to electronically shift the image on the lens, vertically and often times horizontally. It aids in the alignment procedure significantly, but only provides adjustment for the y and x positions. Based on some of our previous in-house research in designing adjustable projector mounts, a new 6-DOF projector mount was developed for the
Figure 32 DataWall Off-Axis Brightness Non-Uniformity

43
Sony projectors that would be used for the 2D application. Most challenging was the substantial weight of approximately 200 lbs per projector.
The projector mount needed to safely secure the large projector with freedom of movement that was precise and smooth for accurate alignment. At the heart of the design is an airbag that is pressurized to support a majority of the projector’s weight. This makes yaw (rotation about the vertical axis), pitch (raising/lowering the front or back) and roll (raising/lowering the left or right side) adjustments significantly easier, considering the massive weight involved. For the pitch and roll adjustment, threaded rods can be turned independently via adjustment knobs at each of the four corners. The four rods can be also be adjusted together for the y (height) adjustment, but using the projectors’ electronic vertical lens shift capability is a more efficient method. For the x (left/right) adjustment a rail bearing system allows the projector to slide left to right very precisely via another threaded rod and knob. In many instances the size of a projected image can be controlled using a zoom lens. However, in our application we needed a short throw lens that was only available in a fixed focal length. Therefore, the image size needed to be adjusted by physically moving the projector closer or further away from the screen. So, for the z (forward/backward) adjustment another rail bearing system with threaded rod and knob is used. Finally, the yaw adjustment is accomplished through a center shaft on which the entire assembly can pivot, and worm gear (Figure 33) that allows the projector to be rotated in either direction very smoothly by turning an adjustment knob. Each of the six degrees of freedom can all be adjusted independently.
The initial implementation of the projector mount had some issues with the yaw adjustment. A roll pin was used initially to pin the gear assembly to the shaft. The pin would flex and the entire assembly could pivot about the center shaft even though the worm gear was not being turned. It made the yaw adjustment very sloppy and far from precise. It was also impossible to lock it into place after adjustment. Rather than having the entire gear and shaft machined out of a single piece of material, which would have been very expensive, we replaced the roll pin with a solid pin. The improvement was dramatic, and is now operating effectively (Figures 35-37).
Figure 33 Worm Gear

44
Figure 34 Projector Mount
Figure 35 Projector Mount with Base

45
Figure 37 16M Pixel DataWall
Figure 36 Dual Projectors Mounted

46
3.2.5. Touch Screen DataWall
As displays become larger and offer higher resolution, interaction with these screens becomes increasingly difficult using conventional input devices. Technologies such as the iPhone and Microsoft Surface™ are capitalizing on touch to make interaction both easy to use and understand. Some standard touch screens work on a principal of sensing pressure on the screen to detect the touch. While this is effective on small applications, as screen size increases this type of method becomes both more costly and less accurate. Other techniques developed use video camera sensors in either the visible light or infrared (IR) light spectrums. Initial investigation into existing research that was successful led us to an approach that used the reflection of IR light.
The HoloWall was developed by Sony and uses reflection of IR light to detect and track screen touch and enable interaction [4]. The HoloWall is a rear projection system that uses IR LEDs and cameras equipped with IR filters to track the reflection of IR light (Figure 38). The camera and IR illuminator are positioned behind the screen. Since IR light is not in the visible spectrum the IR LEDs cause no distortion or interference to the image from the projector. The IR light passes through the screen and is not visible to the camera until an object comes in contact with the front of the screen. This contact causes the IR light to be reflected and can be seen by the camera. These reflections can be tracked to their screen location using image capture and provide a method for touch interaction.
Although the AVID DataWall screen is conventional it was unknown if any of its properties would have an undesirable effect on the reflection of IR light. To test the viability of touch interaction using IR light, several small scale tests were conducted using COTS products. Several pieces of hardware where procured to test multiple configurations. IR illuminators with LEDs at a specific wavelength to generate IR light were used. To block the visible light, IR filters where used with the cameras. The filters would only transmit light at and above the specified wavelength. Hardware included: two IR cameras, one with built in 940nm IR LEDS, 2 IR illuminators (850nm flood illuminator and a 940nm bar illuminator), and three IR filters (720nm, 830nm and 900nm).
The first test used only the IR cameras and filters with no illuminators to determine if the DataWall projectors generated adequate ambient IR light for touch interaction. IR reflections where not detected therefore the projectors did not generate adequate IR light. The next phase
Figure 38 Sony HoloWall Touch Screen

47
of testing introduced IR illuminators. The HoloWall placed its illuminators near the camera and directly at the back of the screen. Using this placement it was possible to track IR reflections. However, it was not optimal since it also caused the camera to detect bright areas of reflection off the DataWall screen. The reflections where localized to an area directly in front of the illuminator. These areas of reflection would interfere with the image capture and make it difficult to accurately track screen touches.
It was decided that the best way to mitigate the screen reflections was to reposition illuminators such that the reflections were out of the camera’s field of view. Instead of pointing the illuminators directly at the screen they would be tested at various off axis angles to the screen (Figure 39). While this allowed for IR illumination of the screen and eliminated the screen reflections, it created new problems. Touch reflections were not as prominent, due to a reduced intensity and area of IR light that illuminated the back of the screen. Unfortunately an area of illumination was not provided in the technical specifications of the illuminators. This made it difficult to find the proper placement to eliminate the reflections and maintain adequate illumination.
These small scale results showed it is likely that touch interaction via IR reflection tracking will be possible with the DataWall screen with suitable illuminators. The future phases of testing will focus on providing adequate illumination and cameras to provide full screen touch tracking. Once touch can be detected on the full screen, the cameras will be interfaced with image capture hardware and software. Image capture software will translate the touch detection and tracking to provide mouse like interaction.
Figure 39 IR Illuminator Position Testing

48
4 AVID Research Facility Development Starting from a blank slate of 3500 square feet of lab space, our team had the rare opportunity to design our AVID Facility from the ground up to best accommodate our research objectives as well as serve as a demonstration space for our visualization and interactive displays research. There was also a goal that it would become a resource for the entire Information Directorate for presentations, demonstrations, training sessions, etc.
It was important to design the space as efficiently as possible to provide capabilities for a variety of large screen display systems either being reinstalled from our previous lab space or new systems that were to be developed. Also important was to design the space to encourage its use for day to day group collaboration activities rather than just demonstrations.
The first consideration was an appropriate amount of workspace for our in-house staff to conduct their daily research and development. We needed to accommodate a minimum of 15 people with some room for growth. In addition, since there were to be different research groups residing in the facility, separation of work spaces was also important.
The next consideration was an appropriate location for the six Reconfigurable Display Modules (RDMs) discussed in Section 3.1 of this report. The units are 6'W x 4½'D and require significant floor space when set up in a 6 module configuration. Based on the architecture of the lab there was only one location that would be suitable without any viewing obstructions caused by existing support structures. And so this served as the anchor point for the rest of the lab space.
Next was the design of the space for a dual use DataWall discussed in Section 3.2 of this report that would be permanently mounted inside a wall, yet to be constructed. The intent here was to design a space with a sufficiently sized projection room to provide enough throw distance for the projectors and screen size we desired. Plus, the viewing area needed to accommodate teaming sessions of small groups, demonstrations for 30+ people, and if at all possible, be positioned within the space that would not necessitate repositioning existing air handlers that would impact construction costs and duration.
The new DataWall was also to be designed to support both high-resolution 2D and stereoscopic 3D imagery, each using a different set of projectors. The intent of designing a dual use display system was to efficiently use premium lab space that could serve multiple purposes. The projection room design, including the position of the screen, needed to take into consideration the layout of the projectors in order to support both types of imagery.
Lastly, to facilitate collaboration and continuing the theme of efficient use of space and reconfigurability, we designed a modular conference table that could be used in a variety of ways (Figure 41). In its primary V-configuration it would allow meeting participants to face each other for discussion, but also provide the large high-resolution DataWall as a display resource. The angle and size of the table was deliberate and based on the size of the room, the size of

49
the display, and the desired viewing distance to ensure everyone seated at the table had a clear view of the entire screen. To accommodate presentations for larger groups of people the table can be repositioned in a straight line to make room for additional rows of chairs for audience members. The result is the layout depicted below (Figure 41). The design has proven to be a tremendous success and has been used by groups both inside and outside our branch on a number of occasions for demonstrations, presentations, and training sessions.
Figure 41 Reconfigurable Conference Table
Reconfigurable Display Modules (RDMs)
Dual-Use DataWallProjection Room
Work Areas
Teaming & DemoSpace
Figure 40 AVID Research Facility Floor Plan

50
5 Future Research There is still a significant amount of research that should be done in the technology areas of visualization and displays that can leverage the work accomplished under this program. The following are some ideas for the future, including extension of capabilities that were under development.
5.1. Visualization
Future work in visualization needs to address not just the geospatial domain, but place the same amount of emphasis on network display and analysis. In this case networks are not just computer networks, but can include social networks, command and control networks, neural networks, et al. This will drive numerous new requirements about how to address massive data sources. While geospatial simplification is relatively easy, since location derives importance, simplification algorithms for the non-geospatial domain are much harder to define. Furthermore, the simplification dimensions seem to be very context sensitive. It is critical than any new visualization technology also allow the 2D and 3D visualizations to interact smoothly together and rely on the same source representation. Traditional engines are developed completely separately, meaning that the degrees of freedom in 2D are not available in 3D and vice versa. This means that operators have to choose one representation where a blend of the two may be most effective. Moving between the two seamlessly could be used for greater enhanced awareness. Another aspect of visualization is scalability. It is often the case that visualization tools are not scalable in terms of display size, display resolution, or content. As displays grow in resolution, the responsiveness of many tools is dramatically reduced. This essentially makes the added real display resolution ineffective. Data is also growing at an unprecedented rate and visualization often offers users with the first insights. If the applications being developed have to store all the data in memory at once, they are already limiting their use, and ultimately their importance. There are numerous summary devices, large screen displays, and “Data Walls”, where the content being displayed is relatively small with respect to the viewing distance, making the content displayed unreadable and unusable. In these terms, scalability boils down to cost. The Air Force is investing large sums of money into displays that are ineffective, not because the hardware cannot actually offer some improved performance, but rather the software makes incorrect assumptions of actual use. Visualization was important in the past, and will be even more important in the future as everyone from commanders to analysts need to sort through, index, share, collaborate, and make decisions with an ever increasing amount of disparate data that operates in varied modes

51
of time scales and persistence. All this, compounded by high quality decisions that need to be made with less time than afforded our warfighting forces in the past.
5.2. Electromechanical Projector Mount
The projector mounts that have been developed by the AVID team have been tremendously effective in aligning the various tiled displays we use inside and outside the AVID facility. However, the process is still quite labor intensive. Particularly because our implementations are rear projected and adjustment occurs behind the screen. The optical characteristics of the display screens result in the images looking quite different on the rear surface than the front viewing surface, which makes it very difficult to assess the result of making an adjustment until viewing it from the front. Therefore there is a considerable amount of time walking back and forth from the projection side to the viewing side of the screens.
Integrating an electromechanical system that could adjust the 6 DOF projector mounts via a remote control unit used from the viewing side of the screen, would be a significant time saver for alignment procedures. We plan to investigate the feasibility of integrating a system similar to what was used for the RDM leveling system in order to turn the projector mount manual adjustments electronically.
5.3. AVID Display Connectivity
The vision for the AVID Research Facility is to allow any computer system in the facility to be displayed on any of the large screen displays. Although some of the visualization software is developed and tested while using one of the large screens, most development occurs at a desktop computer with conventional monitors in the work area sections of the AVID facility. Currently, software needs to be installed on the computer dedicated to the DataWall screen or the work area computer needs to be moved and plugged into one or more RDMs to test and demonstrate on the large screens. In addition, visitors to the facility often have laptop computers that they would like to display on a big screen.
To provide the type of connectivity desired will require some effort to design an effective infrastructure to accomplish this. Things to be considered regarding the remote systems include display latency, interaction techniques, and wide range of computer resolutions to be displayed.
5.4. Autonomous Leveling RDM
Although not a high priority, we would like to investigate the feasibility of fully automating the RDM leveling system. This would entail replacing the control unit switch interface with a control unit that could process the inclinometer data and automatically adjust the casters until it is level.

52
This would include developing the software that accurately distributes commands to the correct caster motor and in the correct sequence.
5.5. Touch Screen
It is likely that touch interaction via IR reflection tracking would be possible with the DataWall screen. An adequate amount of illumination and camera coverage to provide full screen touch tracking still needs to be determined through testing; and the tracking software developed. Additional things we have considered developing are touch gestures that could be used to augment other near screen input devices. For example, using our laser pointer input device [1] to annotate a document digitally would be very natural if you could use your hand as an eraser to change annotations. Much the same way a conventional white board is used. The new focus for our research team has been on visualization development, so it is unlikely this capability will be completed. We are however, always looking for COTS products that may be integrated to provide a touch screen capability, and are still funding some research in this area.
6 Conclusions AFRL/RI has vast experience in developing innovative visualization and display system technologies. Developing visualization technology that is informed by the display capabilities for which it will be used has allowed an unprecedented set of capabilities supporting internal and customer based research objectives.
The JView 1 API development represents a continued program supporting the visualization needs of the Air Force, the Department of Defense and numerous other agencies. It is distributed to more than 100 people at over 80 organizations and is saving application developers time and money. The JView 2 API design and development will ensure future success at providing striking visualizations, answering some of the hardest problems the Air Force has. It will do this while harnessing the newly found computing power of multi-core systems and the dramatic changes of the OpenGL graphics subsystem.
The display system development has been evolutionary rather than revolutionary, leveraging COTS products and past in-house research. This should not be construed as insignificant because the level of sophistication in the design and implementation is unprecedented. With a small team of researchers and a limited budget we successfully created a state-of-the-art visualization and display facility with unique capabilities not found anywhere. Where commercial technology fell short we developed displays with exceptional functionality with the average user in mind. We sought to provide instances of both permanently installed and portable large screen display systems that users with limited training could set-up and use effectively. We also wanted to ensure that their use was not constrained to our facility exclusively but in any venue. Although

53
not completely successful we have made great progress in accomplishing this objective, and believe the display technology we have developed will serve as an effective resource for future research in visualization.

54
References: 1. P. Jedrysik and R. Alvarez, “Advanced Displays and Intelligent Interfaces”, AFRL-IF-RS-TR-
2006-230, Jul 2006.
2. R. Alvarez, P. Jedrysik, and J Zhang, “Enhanced Interactive DataWall: Display Architecture for Data Fusion and Collaboration in C2 environments”, Proceedings of the SPIE International Symposium on Defense and Security, Apr 2006.
3. J. Moore and A. McVay, “Out-of-Core Digital Terrain Elevation Data (DTED) Visualization”,
AFRL-RI-RS-TR-2008-206, Jul 2008. 4. N. Matsushita and J. Rekimoto, "HoloWall: Designing a Finger, Hand, Body, and Object
Sensitive Wall", Proceedings of the ACM Symposium on User Interface Software and Technology (UIST'97), 1997.
5. T. Ni, G. Schmidt , O. Staadt, M. Livingston, R. Ball, and R. May, “A Survey of Large High-
Resolution Display Technologies, Techniques, and Applications”, Proceedings of the 2006 IEEE Conference on Virtual Reality, 2006.
6. T. Ni, D. Bowman, and J. Chen, “Increased Display Size and Resolution Improve Task
Performance in Information-Rich Virtual Environments”, ACM International Conference Proceedings of Graphics Interface 2006.