advanced optical coherence tomography techniques: novel
TRANSCRIPT

17th World Conference on Nondestructive Testing, 25-28 Oct 2008, Shanghai, China
Advanced Optical Coherence Tomography techniques: novel and fast imaging tools for non-destructive testing
David STIFTER 1, Karin WIESAUER 1, Martin WURM 1, Elisabeth LEISS 1,
Michael PIRCHER 2, Erich GÖTZINGER 2, Bernhard BAUMANN 2, Christoph K. HITZENBERGER 2
1 Upper Austrian Research GmbH; Linz, Austria; Phone: +43 732 9015 5606, Fax: +43 732 9015 5618; e-mail: [email protected], [email protected],
[email protected], [email protected] 2 Center for Biomedical Engineering and Physics, Medical University of Vienna; Vienna, Austria; e-mail: [email protected], [email protected],
[email protected], [email protected]
Abstract
We demonstrate that Optical Coherence Tomography (OCT), a method which was originally developed for depth-resolved imaging of biological tissue, is suited to adequately respond to different problems posed in the field of contactless material characterisation and non-destructive testing and evaluation. In detail, the potential of advanced OCT techniques like ultrahigh-resolution OCT, polarisation-sensitive OCT or spectral-domain OCT is evaluated and exemplified for the imaging and characterisation of different polymer and ceramic materials, as well as of whole components, like polymer coated medical metal stents.
Keywords: optical coherence tomography, contactless material characterization, depth-resolved imaging 1. Introduction
Optical Coherence Tomography (OCT), originally introduced for the contactless depth-resolved imaging of biological tissue [1], underwent rapid developmental progress in the recent years: extensive research activities are dedicated worldwide to improve imaging quality with ultrahigh-resolution OCT (UHR-OCT), to increase acquisition speed and sensitivity with frequency-domain OCT (FD-OCT) and to take advantage of alternative contrasting techniques with polarisation-sensitive OCT (PS-OCT), as detailed in recent reviews [2-4]. Although these developments are nearly exclusively driven by applications related to biomedical diagnostics, experts outside the biomedical field start to increasingly recognize the potential of OCT for contact-free and non-destructive material evaluation on the micron-scale. A summary of the to date reported applications of OCT outside the biomedical field can be found in [5]: it has been shown, that structures within materials like glass, polymers, ceramics or paper can efficiently be evaluated by OCT, a pre-requisite for future applications of OCT in the field of non-destructive testing (NDT). However, mostly standard OCT setups with rather low resolution and long acquisition times have been used up to now.
Consequently, we will present a variety of possible non-biological applications in the field of NDT and material characterization. For this purpose, we modified and extended existing OCT techniques, also beyond the state-of-the-art, and evaluated their potential for diverse problems posed in material research and NDT.

2. Experimental setup
A standard OCT setup is depicted in Figure 1 (left). A Michelson interferometer is illuminated with low-coherence light from a broadband light source. A movable mirror is placed in the reference arm. By shifting this mirror a depth profile from the sample can be recorded, since interference will only be observed, if the optical path of a backscattering structure in the sample arm coincides with the optical path length in the reference arm. Normally, the envelope of the interference signal is taken to form a depth profile (so-called A scan) at one position on the sample surface. By joining several A-scans taken at adjacent locations on the sample (e.g. by scanning the measurement spot with a Galvano-mirror scanner or simply by shifting the sample) cross-sectional images or whole 3D volumes can be acquired. It is worth noting that the lateral resolution, determined by the spot size of the light, is decoupled from the axial (depth) resolution, which is related to the width of the spectrum of the light source: the broader the spectrum, the higher the axial resolution, down or below one micron for UHR-OCT setups [6]. By acquiring the state of polarization of light back reflected from the sample, PS-OCT images are obtained [7]. The determined spatially resolved birefringence contains information on the anisotropy within the sample, e.g. caused by internal stress.
Figure 1. Schema of a standard time-domain OCT setup (left) and of a spectral-domain OCT setup (right). Abbreviations: optical path lengths (A, B), refractive index of the sample
layer (n), beamsplitter (BS), reference mirror (RM), galvano-scanner mirror (GM), diffraction grating (DG), charge coupled device camera (CCD)
The setup depicted in Figure 1 (left) belongs to the time-domain OCT (TD-OCT) systems: the position of the reference mirror determines the axial measurement location. It is evident that all photons, which are backscattered from other depths than the current axial measurement position, do not contribute to the interference and are lost. In contrast, FD-OCT uses a fixed reference mirror and the spectral distribution of the light exiting the interferometer is analysed. One possibility is depicted in Figure 1 (right), representing a FD-OCT variant called spectral-domain OCT (SD-OCT). The spectrum is taken with a grating spectrometer (with a CCD line camera) and a depth profile is obtained by calculating the Fourier-transform of the spectrum in the k-space. The acquisition speed of such systems is only limited by the read-out rate of the line sensor, which is routinely in the 10-30 kHz range, a scan rate which cannot be achieved with TD-OCT with movable reference mirror. Furthermore, it has been shown that the gain in sensitivity is more than 20 dB for FD-OCT systems when compared to their TD-OCT counterparts [8].

For our current study, we have used a UHR-PS-OCT in the TD configuration with a depth resolution of less than 2 µm in typical materials (refractive index n~1.5). This system is described in detail in ref. [9] and is also capable of delivering images parallel to the sample surface at a certain depth (so called en-face scan). The central imaging wavelength for this system is 800 nm. Another TD-PS-OCT operating at 1500 nm exhibiting a depth resolution around 14 µm and described in ref. [10] has been used for comparative measurements. Furthermore, two different SD-OCT systems, one operating at a centre wavelength around 840 nm and one at 1550 nm have been applied for this study. The 840 nm system is equipped with a custom-made spectrometer with a fast silicon line-CCD (charge coupled device) camera (2k Pixel, 12 bit), provides a sensitivity of ~106 dB with a light power of 1 mW on the sample at an A-scan rate of 28 kHz. As a light source a single superluminescence diode (SLD) operating at 840 nm, providing a depth resolution of 4 µm in typical materials is used. The SD-OCT system for 1550 nm operates with an InGaAs line camera (1k Pixel, 14 bit) as line sensor in the spectrometer and a SLD as light source. This SD-OCT system exhibits a sensitivity of more than 102 dB at an A-scan rate of 4 kHz and a depth resolution of 13 µm. 3. Results and discussion
As a first example a filled polypropylene (PP) polymer sample is presented, with magnesium oxide particles as filler material. The lateral and depth distribution of the particles within the PP matrix is of primary concern. Cross-sections taken with our UHR-PS-OCT clearly show that the magnesium oxide is concentrated in a thin region extending approximately 30 microns from the sample surface into the bulk material (Figure 2, top left). An en-face image taken 10 µm below the sample surface, immediately gives the lateral distribution (Figure 2, bottom left). The corresponding PS-images contain information on the optical retardation characteristics of the sample (Figure 2, right column).
Figure 2. Cross-sectional intensity (top left) and retardation (top right) images of a PP polymer sample with magnesium oxide filler particles. Bottom row: corresponding en-face
images taken at a depth of 10 µm parallel to the surface. The retardation images are grey-scale coded: optical retardation from black (0°, 180°, 360°,… and multiples of 180°) to white (90°,
270°,…) The images are grey-scale coded: a transition from a black to a white region corresponds
to an increase of the optical retardation by 90° for one polarisation direction (with respect to the other orthogonal one) of the light travelling the corresponding distance in the sample.
Consequently, a steep gradient (or high periodicity of fringes as in the retardation images of Figure 5) is correlated to a high degree of optical anisotropy introduced by the sample, caused by e.g. strain or orientation of supermolecular polymer structures, as we have shown in ref. [5]. From the retardation images of Figure 2, it can be concluded that the magnesium oxide filler particles locally decrease the degree of anisotropic orientation of the condensed PP matrix. UHR-Intensity images as well as PS information thus provide valuable information for process development and optimisation of heterogeneous polymer materials in a fast and convenient way. An alternative technique for the imaging of such particles embedded in a polymer matrix is represented by x-ray computed tomography (CT). However, in order to achieve a high spatial resolution, the overall size of the sample has to be sufficiently small for CT, since CT works in transmission and the sample has to fit into the x-ray measurement cone. If the density difference between embedded particles and matrix is small, as it is the case for e.g. polymer blends, even synchrotron phase-contrast CT has to be used to deliver sufficient contrast for a reliable discrimination between particles and surrounding matrix. We have recently shown, that for the imaging of polymer blends UHR-OCT can even outperform synchrotron phase-contrast CT [11].
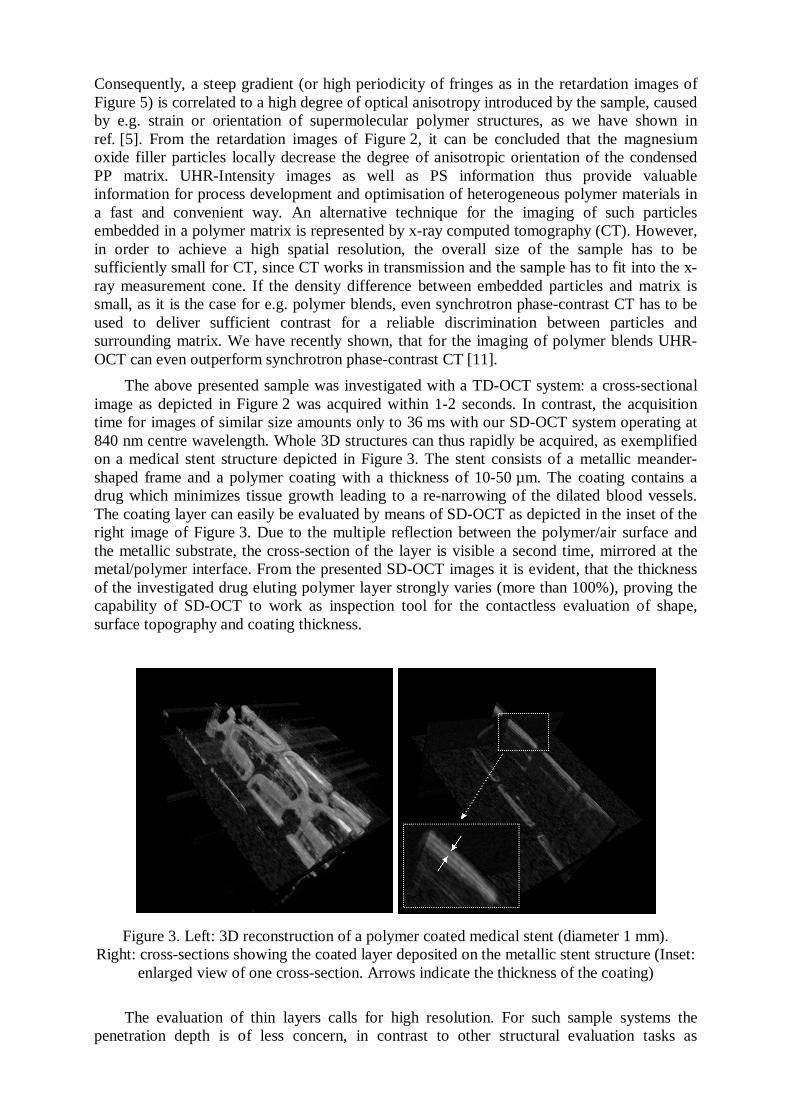
The above presented sample was investigated with a TD-OCT system: a cross-sectional image as depicted in Figure 2 was acquired within 1-2 seconds. In contrast, the acquisition time for images of similar size amounts only to 36 ms with our SD-OCT system operating at 840 nm centre wavelength. Whole 3D structures can thus rapidly be acquired, as exemplified on a medical stent structure depicted in Figure 3. The stent consists of a metallic meander-shaped frame and a polymer coating with a thickness of 10-50 µm. The coating contains a drug which minimizes tissue growth leading to a re-narrowing of the dilated blood vessels. The coating layer can easily be evaluated by means of SD-OCT as depicted in the inset of the right image of Figure 3. Due to the multiple reflection between the polymer/air surface and the metallic substrate, the cross-section of the layer is visible a second time, mirrored at the metal/polymer interface. From the presented SD-OCT images it is evident, that the thickness of the investigated drug eluting polymer layer strongly varies (more than 100%), proving the capability of SD-OCT to work as inspection tool for the contactless evaluation of shape, surface topography and coating thickness.
Figure 3. Left: 3D reconstruction of a polymer coated medical stent (diameter 1 mm). Right: cross-sections showing the coated layer deposited on the metallic stent structure (Inset:
enlarged view of one cross-section. Arrows indicate the thickness of the coating)
The evaluation of thin layers calls for high resolution. For such sample systems the
penetration depth is of less concern, in contrast to other structural evaluation tasks as
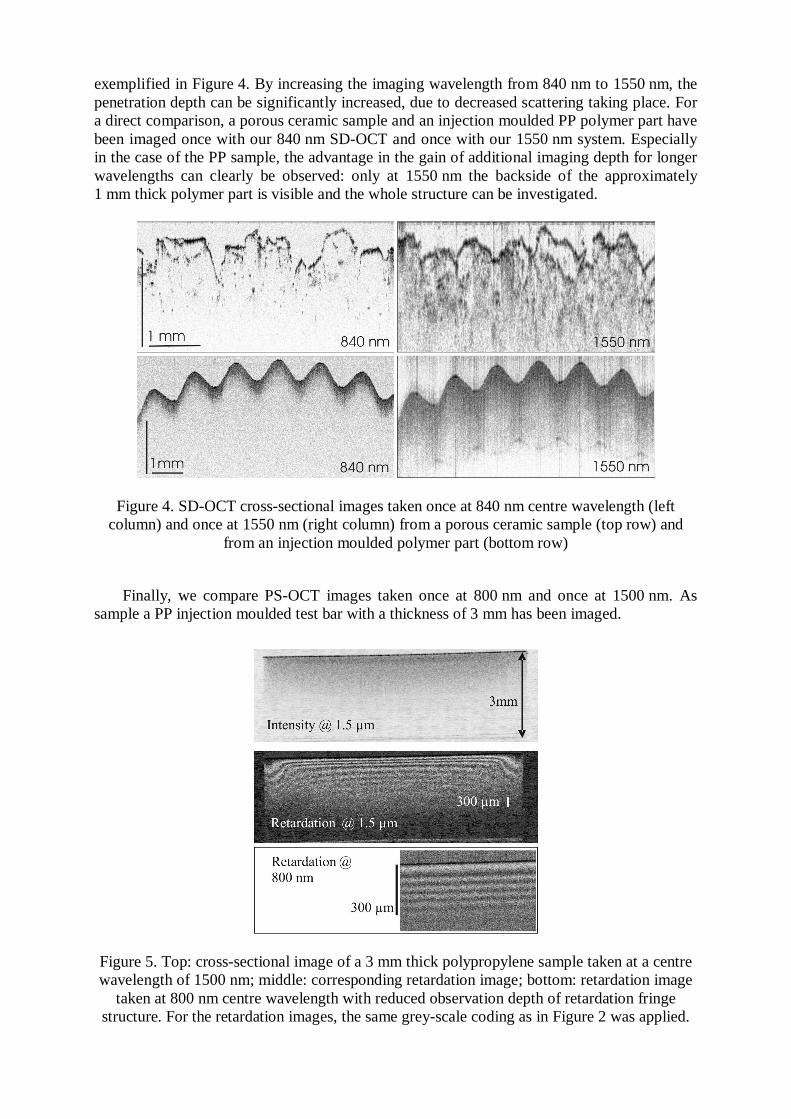
exemplified in Figure 4. By increasing the imaging wavelength from 840 nm to 1550 nm, the penetration depth can be significantly increased, due to decreased scattering taking place. For a direct comparison, a porous ceramic sample and an injection moulded PP polymer part have been imaged once with our 840 nm SD-OCT and once with our 1550 nm system. Especially in the case of the PP sample, the advantage in the gain of additional imaging depth for longer wavelengths can clearly be observed: only at 1550 nm the backside of the approximately 1 mm thick polymer part is visible and the whole structure can be investigated.
Figure 4. SD-OCT cross-sectional images taken once at 840 nm centre wavelength (left column) and once at 1550 nm (right column) from a porous ceramic sample (top row) and
from an injection moulded polymer part (bottom row)
Finally, we compare PS-OCT images taken once at 800 nm and once at 1500 nm. As sample a PP injection moulded test bar with a thickness of 3 mm has been imaged.
Figure 5. Top: cross-sectional image of a 3 mm thick polypropylene sample taken at a centre wavelength of 1500 nm; middle: corresponding retardation image; bottom: retardation image
taken at 800 nm centre wavelength with reduced observation depth of retardation fringe structure. For the retardation images, the same grey-scale coding as in Figure 2 was applied.

Again, only the 1500 nm system is capable to penetrate the whole structure (3 mm). The PS signal is observable in the entire upper half of the sample. In contrast, the image of the 800 nm UHR-PS-OCT system exhibits a finer speckle structure due to the higher resolution. This and the fact that the periodicity of the fringe structure at 800 nm is higher than for the 1500 nm allow determining the retardation with higher precision. However, the PS signal already fades at a depth of 300 µm, strongly limiting the sample regions which can be accessed. 4. Conclusions and outlook
Advanced modifications of OCT, like UHR-PS-OCT and SD-OCT, originally introduced for depth-resolved imaging of biological tissue, show promising potential to play a dominant role for the contactless evaluation of the interior of transparent and scattering samples on the micron-scale up to a depth of 1-3 mm. Depending on the measurement task, on the material to be investigated and the features to be detected, a system with appropriate imaging speed, wavelength, contrast generating mechanism and depth resolution has to be chosen. Future work is dedicated to combine the strengths of the different set-ups in a single OCT system for versatile investigation tasks in the field of NDT. Acknowledgements
Financial support from the Austrian Science Funds FWF is acknowledged (Projects: L126-N08 and P19751-N20). References
[1] D. Huang et al., Optical coherence tomography, Science 254, 1991, pp1178–81. [2] B.E. Bouma, G.J. Tearney, Handbook of Optical Coherence Tomography, Dekker,
New York, 2002. [3] A.F. Fercher, C.K. Hitzenberger, Optical coherence tomography, Prog. Opt. 44, 2002,
pp215–301. [4] M.E. Brezinski, Optical Coherence Tomography: Principles and Applications,
Academic, San Diego, 2006. [5] D. Stifter, Beyond biomedicine: a review of alternative applications and developments
for optical coherence tomography, Appl. Phys B 88, 2007, pp337-357. [6] W. Drexler et al., In vivo ultrahigh-resolution optical coherence tomography, Opt.
Lett. 24, 1999, pp1221-1223. [7] J.F. de Boer et al., Two-dimensional birefringence imaging in biological tissue by
polarization-sensitive optical coherence tomography, Opt. Lett. 22, 1997, pp934-936. [8] R.A. Leitgeb et al., Performance of Fourier domain vs. time domain optical coherence
tomography, Opt. Express 11, 2003, pp889-894. [9] K. Wiesauer et al., Transversal ultrahigh-resolution polarization-sensitive optical
coherence tomography for strain mapping in materials, Opt. Express 14, 2006, pp5945-5953.
[10] D. Stifter et al., Polarisation-sensitive optical coherence tomography for material characterisation and strain-field mapping, Appl. Phys A 76, 2003, pp1-5.
[11] D. Stifter et al., Investigation of polymer and polymer/fibre composite materials with optical coherence tomography, Meas. Sci. Technol, 2008, in print.