advanced math 7: midterm exam reviewmacomb.k12.mi.us/utica/eppler/media/12-13 mid-term review...
TRANSCRIPT

Advanced Math 7: Midterm Exam Review
Course 3 Book
pg 49 #1-6 and #16-27
pg 71 #13-15 and #22
pg 76-77 #17-28, #36, #38, #43
pg 104 #1-15
pg 125 #12-20
pg 131 #1-3
Read pg 134-135
pg 139-140 #1-12 and #28-29
pg 153 #1-9
pg 166 #10-15
pg 193 #27-36
pg 223-224 #9-16 and #21-30
pg 228 #1-4
pg 229 #15-17
pg 262 #30-31
pg 268 #5-8
pg 270 #24
pg 274 #9-14
pg 284 #9 and #11
pg 294 #12-17
pg 379 #15-22
Algebra I Book
pg 307 #31-35
pg 343 #19-22
pg 365 #1-2
pg 373 #7-10
pg 587 #1-6
pg 594 #1-6
Adv. Math 7 Midterm Review p1
ADVANCED MATH 7 MIDTERM EXAM REVIEW
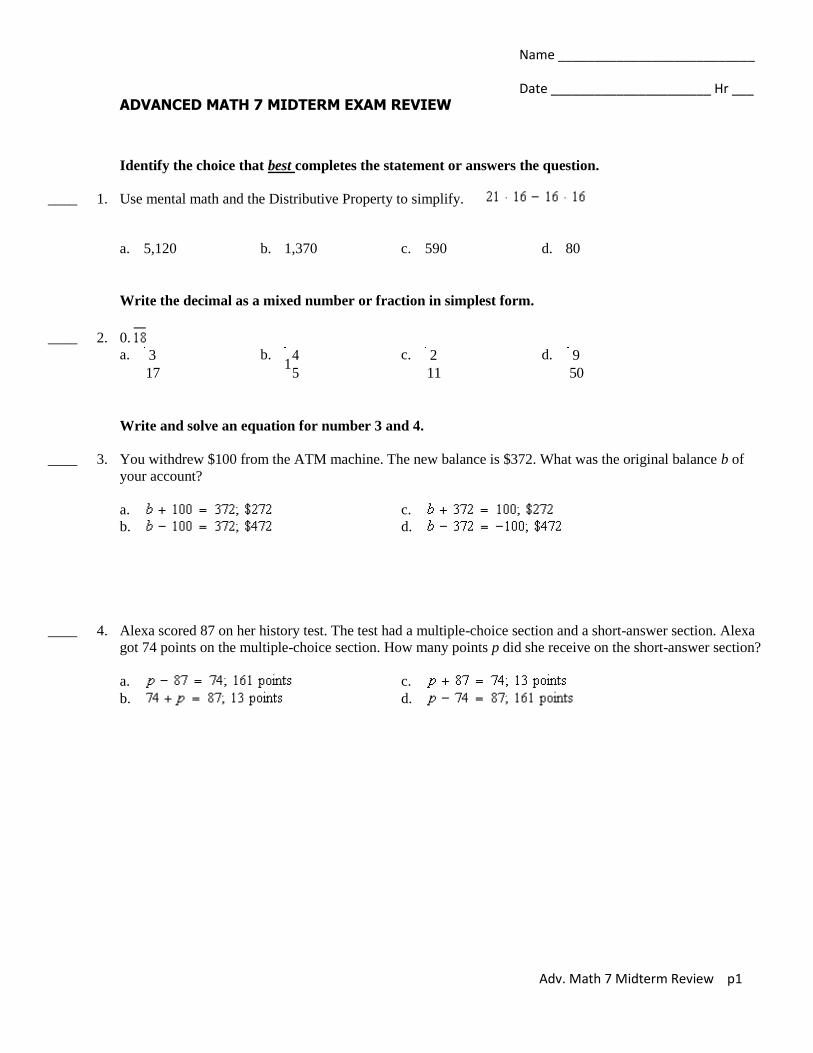
Identify the choice that best completes the statement or answers the question.
____ 1. Use mental math and the Distributive Property to simplify.
a. 5,120 b. 1,370 c. 590 d. 80
Write the decimal as a mixed number or fraction in simplest form.
____ 2. 0.
a.
b.
c.
d.
Write and solve an equation for number 3 and 4.
____ 3. You withdrew $100 from the ATM machine. The new balance is $372. What was the original balance b of
your account?
a. c.
b. d.
____ 4. Alexa scored 87 on her history test. The test had a multiple-choice section and a short-answer section. Alexa
got 74 points on the multiple-choice section. How many points p did she receive on the short-answer section?
a. c.
b. d.
3
171
4
5
2
11
9
50
Name ___________________________
Date ______________________ Hr ___
Adv. Math 7 Midterm Review p2
O 2 4–2–4 x
2
4
–2
–4
y
O 2 4–2–4 x
2
4
–2
–4
y
O 2 4–2–4 x
2
4
–2
–4
y
O 2 4–2–4 x
2
4
–2
–4
y
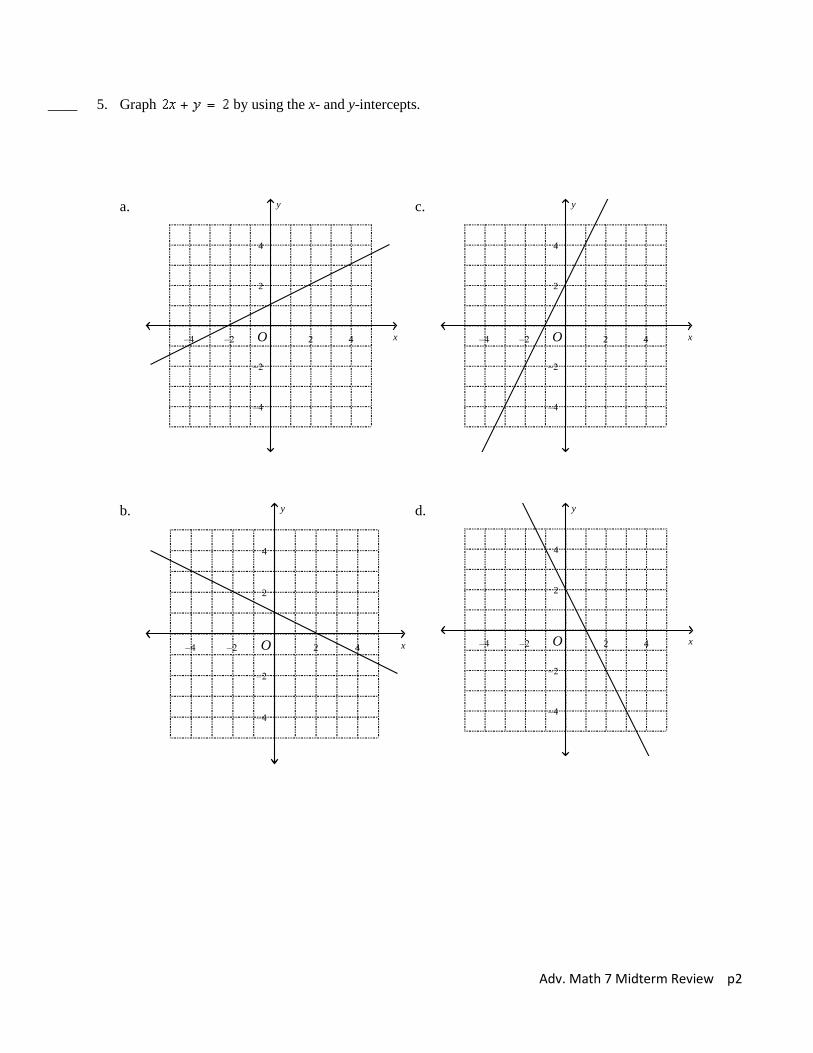
____ 5. Graph by using the x- and y-intercepts.
a. c.
b. d.

Adv. Math 7 Midterm Review p3
____ 6. The data in the table are linear. Use the table to find the slope. Then graph the data and the line.
x 0 2 4 6
y –5 –2 1 4
a. ;
c. ;
b. ;
d. ;
2
3
O 4 8–4–8 x
4
8
–4
–8
y
2
3
O 4 8–4–8 x
4
8
–4
–8
y
3
2
O 4 8–4–8 x
4
8
–4
–8
y
3
2
O 4 8–4–8 x
4
8
–4
–8
y

Adv. Math 7 Midterm Review p4
Is the relationship shown by the data linear? If so, model the data with an equation.
____ 7.
x y
–9 –2
–5 –7
–1 –12
3 –17
____ 8.
x y
3 1
7 2
11 3
18 5
____ 9.Does the figure have reflectional symmetry? Draw the lines of symmetry.
Write no reflectional symmetry where applicable.
a. The relationship is linear; y + 2 = (x + 9).
b. The relationship is linear; y + 9 = (x + 2).
c. The relationship is not linear.
d. The relationship is linear; y + 2 = (x + 9).
a. The relationship is not linear.
b. The relationship is linear; .
c. The relationship is linear; .
d. The relationship is linear; .
4
5
4
5
5
4

Adv. Math 7 Midterm Review p5
____ 10. Which of the following is an example of the Distributive Property?
a. c.
b. d.
11. Simplify the expression.
12. Identify the number as rational or irrational and explain why. 1.875
13. Solve the inequality and graph.
14. The table below shows some values of x and y, where x is directly proportional to y.
What are the values of C and T?
x y
5 10
8 C
13 26
T 34
15.

Adv. Math 7 Midterm Review p6
16. The Nelson Widget Company’s revenue has decreased over several months, and this is
shown in the graph below.
About how much money has been lost in revenue for each month during the
7-month period shown?
A $25,000 B $50,000 C $100,000 D $350,000
17. Which of these equations is directly proportional? Explain your answer.
y = 6x y = 12x + 9
y
x 0 1 2 3 4 5 6 7
$100
$200
$300
$400
$500
$600
$700
Number of Months
Pro
fit
(in
th
ou
san
ds)
Business Revenue

Adv. Math 7 Midterm Review p7
18. Bob and Susie went to pick the cheapest cell phone plan. One plan costs $40 per month plus 10
cents per minute. The other plan costs $60 per month, calls only cost 5 cents per minute.
Part 1. Decide what variables you will use to figure out how much each plan will cost for different
numbers of minutes. Then write equations to represent both phone plans, using the variables you
chose.
Part 2. Use the equations to calculate how much each plan will cost for 200 minutes and 500
minutes.
Part 3. Then graph the equations to determine the number of minutes you can talk where each plan
costs the same amount.
Adv. Math 7 Midterm Review p8
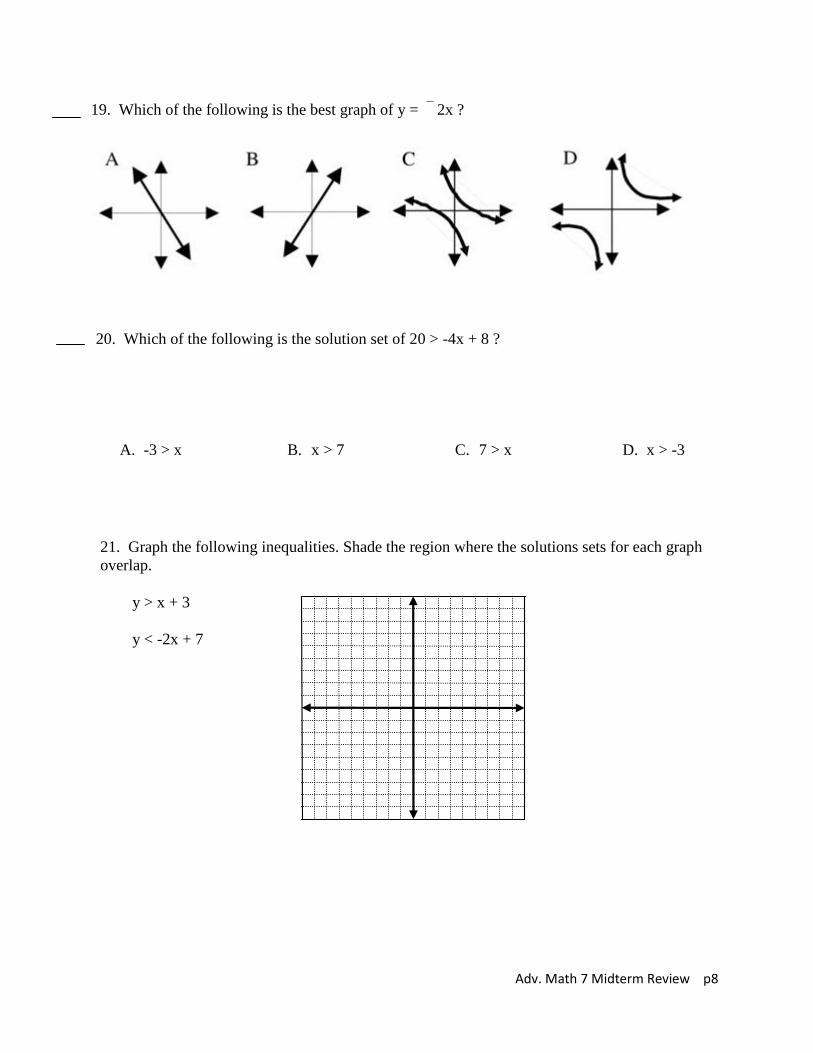
20. Which of the following is the solution set of 20 > -4x + 8 ?
A. -3 > x B. x > 7 C. 7 > x D. x > -3
19. Which of the following is the best graph of y = –
2x ?
21. Graph the following inequalities. Shade the region where the solutions sets for each graph
overlap.
y > x + 3
y < -2x + 7

Adv. Math 7 Midterm Review p9
22. You can sell rabbits for $5 and ducks for $4 at the local farmers market. You need to make
$40 to cover your overhead. What possible combinations of each could you bring to the market
to cover your overhead? Explain your reasoning using graphs and equations in your explanation.
23. Your school sold 456 tickets for a school play. An adult ticket cost $3.50 and a student
ticket cost $1. Total ticket sales were $1131. How many adult tickets and how many student
tickets were sold?
Let x = ________________________ Let y=___________________________
24. Which type of number is the square root of 5
A. integer
B. rational Number
C. irrational Number
D. whole Number
Adv. Math 7 Midterm Review p10
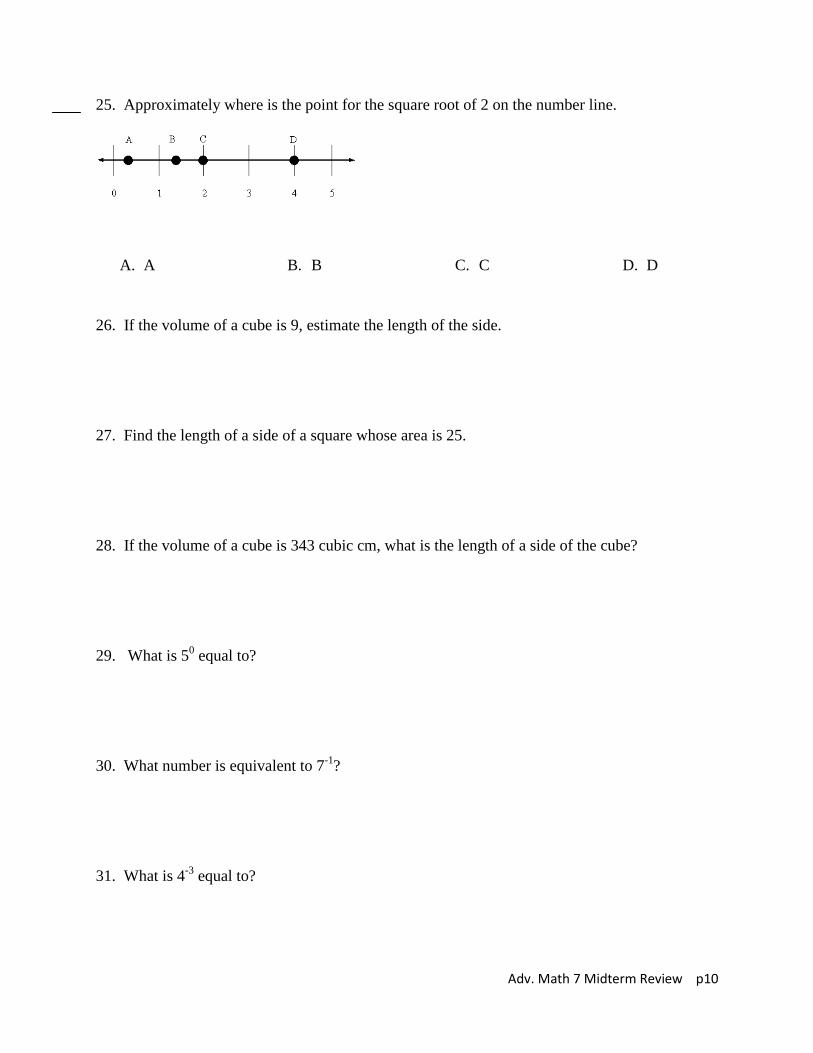
25. Approximately where is the point for the square root of 2 on the number line.
A. A B. B C. C D. D
26. If the volume of a cube is 9, estimate the length of the side.
27. Find the length of a side of a square whose area is 25.
28. If the volume of a cube is 343 cubic cm, what is the length of a side of the cube?
29. What is 50 equal to?
30. What number is equivalent to 7-1
?
31. What is 4-3
equal to?

Adv. Math 7 Midterm Review p11
32. If triangle DEF is similar to triangle ABC, what is the measure of A?
33. Based on what is shown, which statement best explains why the two triangles are similar?
A The ratios of all pairs of corresponding sides are equal.
B Corresponding angles of the triangles are congruent.
C The ratios of two pairs of corresponding sides are equal and included angles are congruent.
D Three sides of one triangle have the same lengths as the three sides of the other triangle.
75
45 60
A
C B
D
E F
46 cm
13 cm 24 cm
23 cm
26 cm 48 cm
Adv. Math 7 Midterm Review p12
14
5c
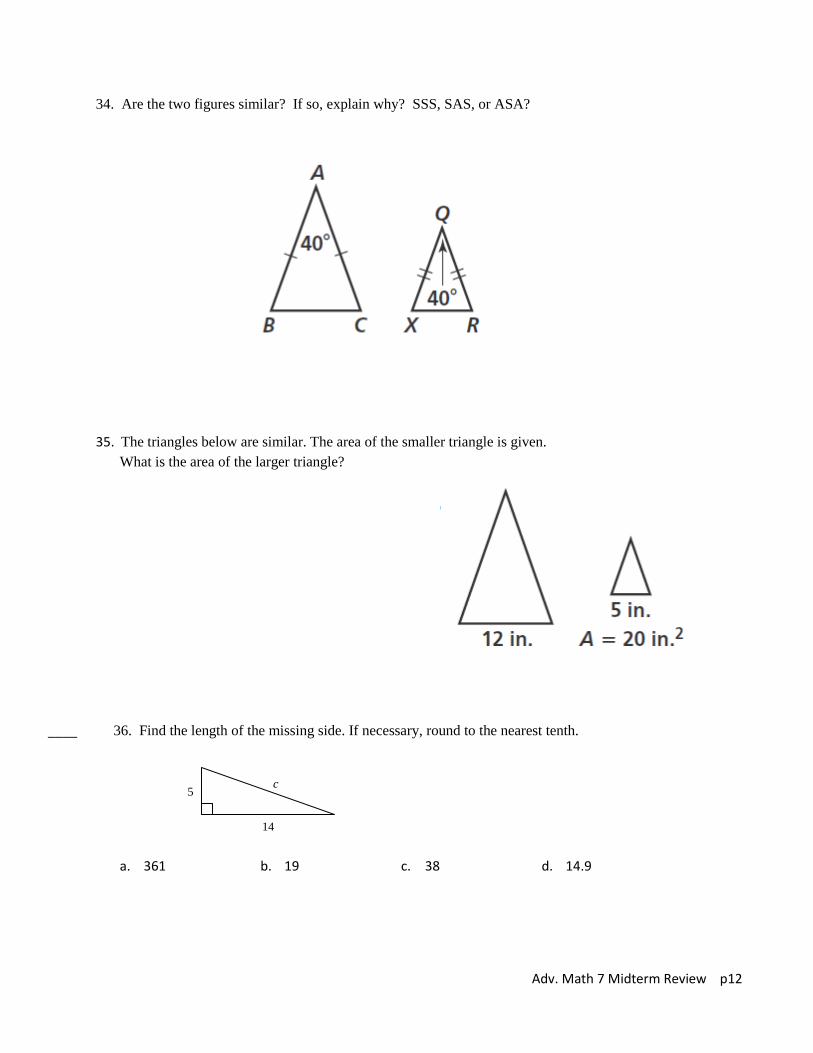
34. Are the two figures similar? If so, explain why? SSS, SAS, or ASA?
35. The triangles below are similar. The area of the smaller triangle is given.
What is the area of the larger triangle?
____ 36. Find the length of the missing side. If necessary, round to the nearest tenth.
a. 361 b. 19 c. 38 d. 14.9
Adv. Math 7 Midterm Review p13
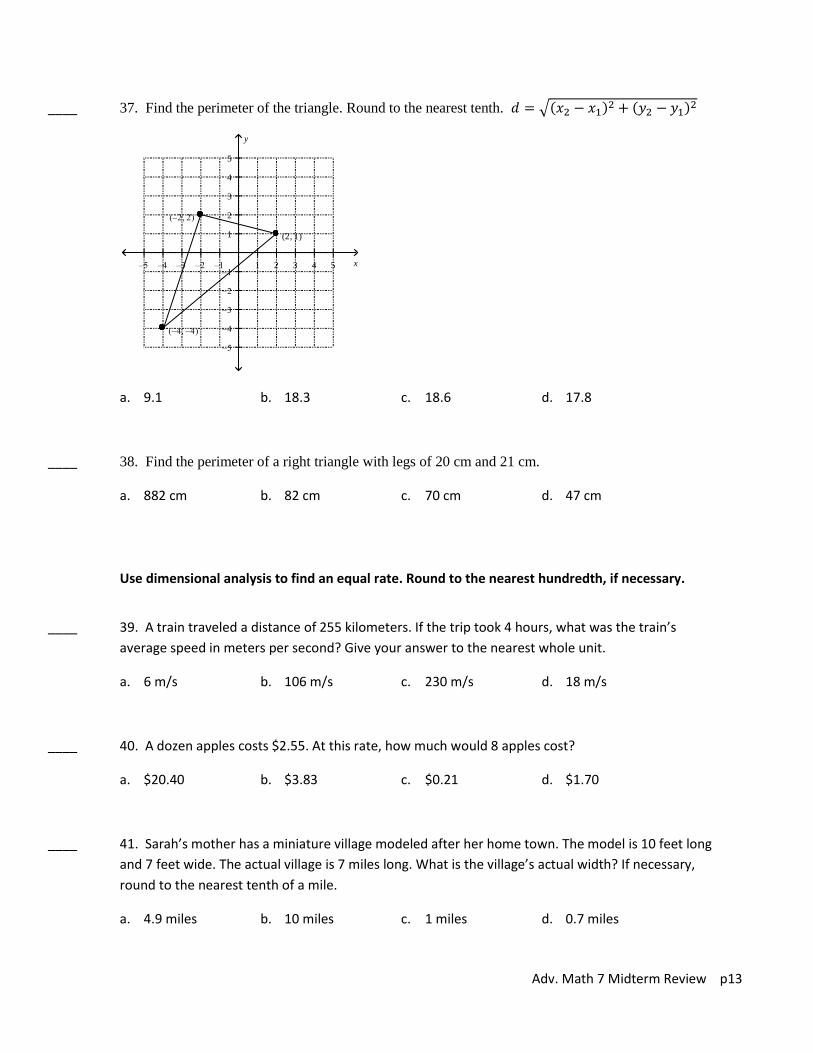
____ 37. Find the perimeter of the triangle. Round to the nearest tenth. √( ) ( )
a. 9.1 b. 18.3 c. 18.6 d. 17.8
____ 38. Find the perimeter of a right triangle with legs of 20 cm and 21 cm.
a. 882 cm b. 82 cm c. 70 cm d. 47 cm
Use dimensional analysis to find an equal rate. Round to the nearest hundredth, if necessary.
____ 39. A train traveled a distance of 255 kilometers. If the trip took 4 hours, what was the train’s
average speed in meters per second? Give your answer to the nearest whole unit.
a. 6 m/s b. 106 m/s c. 230 m/s d. 18 m/s
____ 40. A dozen apples costs $2.55. At this rate, how much would 8 apples cost?
a. $20.40 b. $3.83 c. $0.21 d. $1.70
____ 41. Sarah’s mother has a miniature village modeled after her home town. The model is 10 feet long
and 7 feet wide. The actual village is 7 miles long. What is the village’s actual width? If necessary,
round to the nearest tenth of a mile.
a. 4.9 miles b. 10 miles c. 1 miles d. 0.7 miles
(–2, 2)
(2, 1)
(–4, –4)
1 2 3 4 5–1–2–3–4–5 x
1
2
3
4
5
–1
–2
–3
–4
–5
y
Adv. Math 7 Midterm Review p14
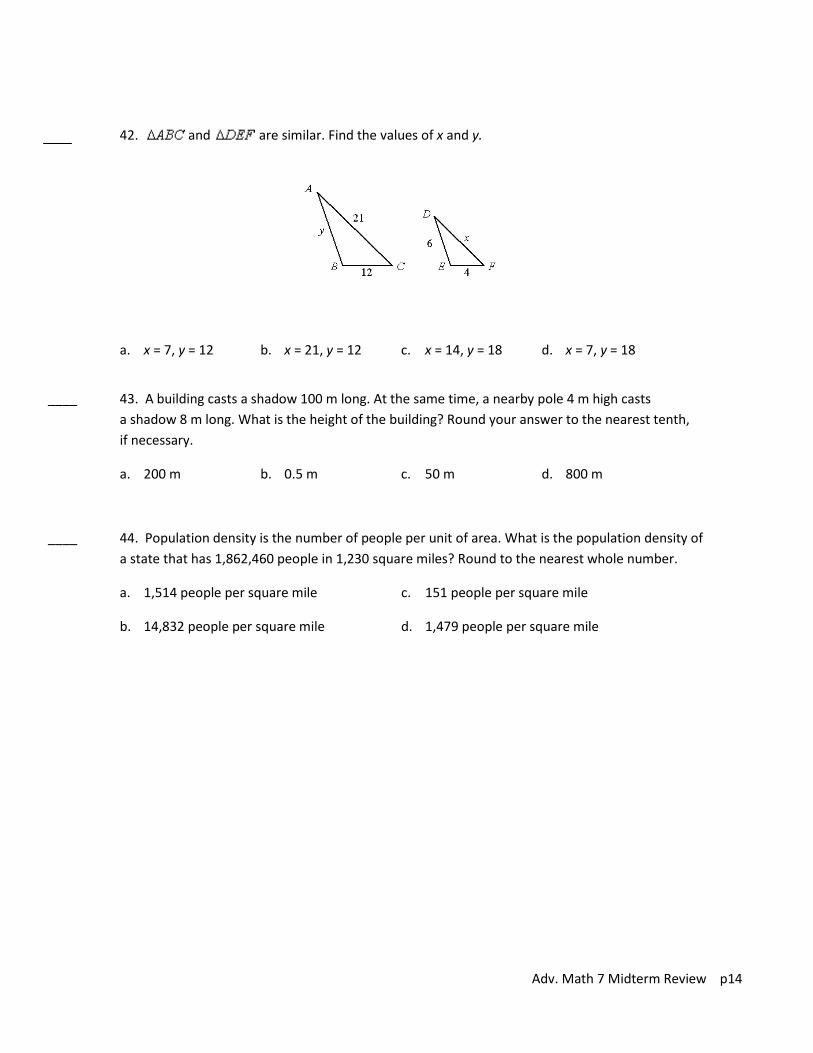
42. and are similar. Find the values of x and y.
a. x = 7, y = 12 b. x = 21, y = 12 c. x = 14, y = 18 d. x = 7, y = 18
____ 43. A building casts a shadow 100 m long. At the same time, a nearby pole 4 m high casts
a shadow 8 m long. What is the height of the building? Round your answer to the nearest tenth,
if necessary.
a. 200 m b. 0.5 m c. 50 m d. 800 m
____ 44. Population density is the number of people per unit of area. What is the population density of
a state that has 1,862,460 people in 1,230 square miles? Round to the nearest whole number.
a. 1,514 people per square mile c. 151 people per square mile
b. 14,832 people per square mile d. 1,479 people per square mile
Adv. Math 7 Midterm Review p15
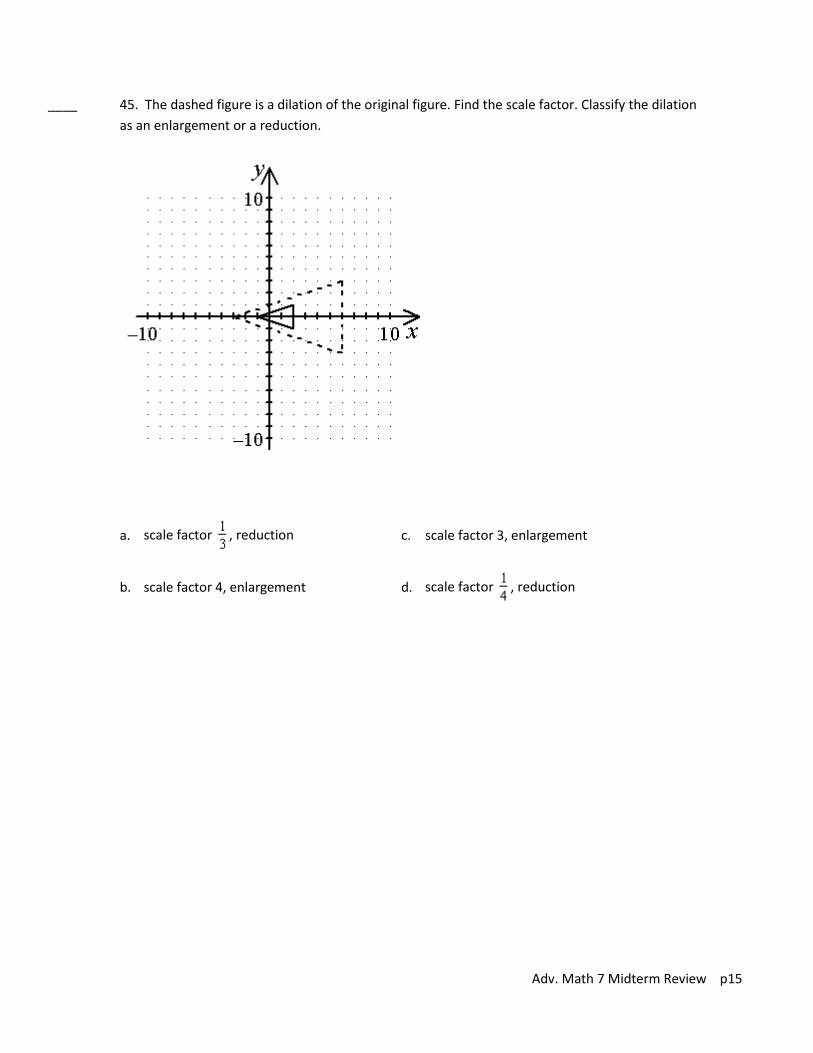
____ 45. The dashed figure is a dilation of the original figure. Find the scale factor. Classify the dilation
as an enlargement or a reduction.
a. scale factor , reduction c. scale factor 3, enlargement
b. scale factor 4, enlargement d. scale factor , reduction