advanced inverter technology for high penetration levels ... · pdf filesystems colin schauder...
TRANSCRIPT

NREL is a national laboratory of the U.S. Department of Energy Office of Energy Efficiency & Renewable Energy Operated by the Alliance for Sustainable Energy, LLC
This report is available at no cost from the National Renewable Energy Laboratory (NREL) at www.nrel.gov/publications.
Contract No. DE-AC36-08GO28308
Advanced Inverter Technology for High Penetration Levels of PV Generation in Distribution Systems Colin Schauder Satcon Technology Corporation Boston, Massachusetts
NREL Technical Monitor: Barry Mather
Subcontract Report NREL/SR-5D00-60737 March 2014

NREL is a national laboratory of the U.S. Department of Energy Office of Energy Efficiency & Renewable Energy Operated by the Alliance for Sustainable Energy, LLC
This report is available at no cost from the National Renewable Energy Laboratory (NREL) at www.nrel.gov/publications.
Contract No. DE-AC36-08GO28308
National Renewable Energy Laboratory 15013 Denver West Parkway Golden, CO 80401 303-275-3000 • www.nrel.gov
Advanced Inverter Technology for High Penetration Levels of PV Generation in Distribution Systems Colin Schauder Satcon Technology Corporation Boston, Massachusetts
NREL Technical Monitor: Barry Mather Prepared under Subcontract No. LAT-2-11815-01
Subcontract Report NREL/SR-5D00-60737 March 2014
This publication received minimal editorial review at NREL.
NOTICE
This report was prepared as an account of work sponsored by an agency of the United States government. Neither the United States government nor any agency thereof, nor any of their employees, makes any warranty, express or implied, or assumes any legal liability or responsibility for the accuracy, completeness, or usefulness of any information, apparatus, product, or process disclosed, or represents that its use would not infringe privately owned rights. Reference herein to any specific commercial product, process, or service by trade name, trademark, manufacturer, or otherwise does not necessarily constitute or imply its endorsement, recommendation, or favoring by the United States government or any agency thereof. The views and opinions of authors expressed herein do not necessarily state or reflect those of the United States government or any agency thereof.
This report is available at no cost from the National Renewable Energy Laboratory (NREL) at www.nrel.gov/publications.
Available electronically at http://www.osti.gov/scitech
Available for a processing fee to U.S. Department of Energy and its contractors, in paper, from:
U.S. Department of Energy Office of Scientific and Technical Information P.O. Box 62 Oak Ridge, TN 37831-0062 phone: 865.576.8401 fax: 865.576.5728 email: mailto:[email protected]
Available for sale to the public, in paper, from:
U.S. Department of Commerce National Technical Information Service 5285 Port Royal Road Springfield, VA 22161 phone: 800.553.6847 fax: 703.605.6900 email: [email protected] online ordering: http://www.ntis.gov/help/ordermethods.aspx
Cover Photos: (left to right) photo by Pat Corkery, NREL 16416, photo from SunEdison, NREL 17423, photo by Pat Corkery, NREL 16560, photo by Dennis Schroeder, NREL 17613, photo by Dean Armstrong, NREL 17436, photo by Pat Corkery, NREL 17721.
Printed on paper containing at least 50% wastepaper, including 10% post consumer waste.

All figures in this report are property of Satcon.
iv
Table of Contents Abstract ........................................................................................................................................................ 1 1 Introduction ........................................................................................................................................... 2 2 Utility Concerns about the Impact of High-Penetration PV on Medium-Voltage Feeders ............ 3 3 Capabilities of Inverters ....................................................................................................................... 5
3.1 Controlled Output Current ............................................................................................................... 5 3.2 Grid-Smart Control Features ............................................................................................................ 8 3.3 Reactive Power Generation ............................................................................................................ 10
3.3.1 Inverter Reactive Power Generation Capability ............................................................. 11 3.3.2 Inverter Output Power Control ....................................................................................... 13
3.4 Effect of Inverter Output Power on Distribution Feeder Voltage .................................................. 15 3.5 Simplified Distribution Feeder with Large PV System Connected ............................................... 19
3.5.1 Steady-State Analysis with Voltage Control at the PV System ...................................... 20 3.5.2 Demonstration of Fast Automatic Voltage Control ........................................................ 22 3.5.3 Fast Voltage Control for Flicker Reduction .................................................................... 27
4 Main Issues Delaying or Blocking the Connection of Large PV Projects .................................... 29 5 Conclusions ........................................................................................................................................ 31
This report is available at no cost from the National Renewable Energy Laboratory (NREL) at www.nrel.gov/publications.

1
Abstract This subcontract report was completed under the auspices of the NREL/SCE High-Penetration Photovoltaic (PV) Integration Project, which is co-funded by the U.S. Department of Energy (DOE) Office of Energy Efficiency and Renewable Energy (EERE) and the California Solar Initiative (CSI) Research, Development, Demonstration, and Deployment (RD&D) program funded by the California Public Utility Commission (CPUC) and managed by Itron. This project is focused on modeling, quantifying, and mitigating the impacts of large utility-scale PV systems (generally 1–5 MW in size) that are interconnected to the distribution system. This report discusses the concerns utilities have when interconnecting large PV systems that interconnect using PV inverters (a specific application of frequency converters). Additionally, a number of capabilities of PV inverters are described that could be implemented to mitigate the distribution system-level impacts of high-penetration PV integration. Finally, the main issues that need to be addressed to ease the interconnection of large PV systems to the distribution system are presented.
This report is available at no cost from the National Renewable Energy Laboratory (NREL) at www.nrel.gov/publications.
2
1 Introduction Utilities around the world are trying to determine how best to accommodate the increasing percentage of solar photovoltaic (PV) power generation on their electric grids. Utilities are uncertain about the effects of high levels of variable renewable power generation on system reliability, power quality, and the safety of workers and equipment, but recent advances in inverter technology have made them valuable tools for managing these aspects of grid operation.
Practically all renewable energy sources, and most forms of energy storage, produce either direct current (DC) or variable-frequency output power. All power from these sources must pass through a frequency converter (DC to AC or AC to AC) in order to feed the constant-frequency alternating current (AC) power grid.
This extra stage of power conversion introduces additional equipment cost and power losses. On the plus side, however, this need for frequency conversion has resulted in a rapidly growing class of electronically coupled generators (ECGs) connected to the grid, with control capabilities that are more flexible compared to those of conventional rotating synchronous machine generators.
Understandably, electric utilities have viewed the advent of these ECGs with a certain amount of reluctance, both because of their unfamiliar operating characteristics and because of their location in distribution systems where traditionally there has been minimal power generation. The level of concern has increased with the rapidly increasing size of proposed projects relative to the feeder rating and/or the minimum load levels. It is of course perfectly feasible to generate power in new or existing distribution circuits, and even to export power back into the transmission system, but in doing so we challenge some of the traditional assumptions that have been made in the design of protection and voltage regulation schemes for these distribution circuits. This is especially true in the case of higher penetration levels for PV power generation.
The remainder of this paper explores potential impacts of high-penetration PV on medium-voltage (MV) feeders, and discusses capabilities of modern inverters that can correct for the effects of their associated PV systems, as well as for other events occurring on the grid.
This report is available at no cost from the National Renewable Energy Laboratory (NREL) at www.nrel.gov/publications.
3
2 Utility Concerns about the Impact of High-Penetration PV on Medium-Voltage Feeders
As a leading supplier of inverters for large PV generating projects, Satcon has participated in industry forums and IEEE working groups for standards development, where electric utilities are also strongly represented. Satcon also provides support for project developers in the United States and abroad, as they negotiate with utilities over interconnection impact assessments, connection rules, and similar issues that arise in regard to their requested grid connections. Because Satcon must comply with interconnection rules in the many countries where its inverters are installed, it also follows emerging regulations very closely and is aware of worldwide trends in this area. Finally, Satcon is called in to help solve real problems that occur in the field. As a result, Satcon has a good understanding of the main concerns of electric utilities in relation to the installation of large PV generating projects in distribution systems. These concerns can be roughly grouped into three categories as follows:
• The effects of fluctuating real power output from renewable sources on the normal operation and power quality of the distribution system, which could include the following:
o Increased switching operations for line regulators, tap changers, and switched capacitors
o Steady-state voltage regulation over the range of real power generation, especially on long feeders1
o Flicker due to rapidly fluctuating voltage caused by sudden changes in real power generation
o Transient voltage changes on sudden trip of the PV generation system, especially if the system is actively participating in voltage regulation
o Harmonics generated by PV inverters, and possible resonant interactions of inverters with the distribution system
o Conductor and equipment loading due to new power flows resulting from the introduction of local power generation in the distribution system.
• The design of protection relay schemes for existing and new distribution feeders when large new generators are connected; areas of concern can include:
o The possibility of bi-directional real and reactive power flows
o Protective relay settings and operation
o Contribution of new generators to short-circuit levels
o Islanding of generators with residual load connected
o Auto-reclosing of a feeder breaker onto energized generator(s)
1 This brings up questions such as: Should PV generators be allowed or required to participate in voltage regulation automatically, or on the basis of reactive power dispatch or scheduling? If autonomous local automatic voltage control is allowed, can stable operation be expected when multiple PV generators are involved on the same feeder? Will fast automatic voltage controllers "fight" with slower line regulators?
This report is available at no cost from the National Renewable Energy Laboratory (NREL) at www.nrel.gov/publications.

4
o Appropriate grounding schemes for new generators to allow ground fault detection and prevent transient over-voltages.
• The management of real power for frequency regulation in smaller grids (e.g., islands) with limited aggregate generator rotational inertia, which can lead to:
o Rapid curtailment of real power sources on over-frequency
o Rapid load-shedding and/or "spinning reserve" deployment on under-frequency
o Impact of real power fluctuations from variable sources on grid frequency
o Transient frequency excursion on sudden trip of the generating system.
Many of these concerns can be addressed through a proper understanding of the capabilities and operating characteristics of modern inverters that are used to couple PV systems to the grid. There is little doubt that the introduction of large-scale ECGs into distribution systems will eventually force utilities to depart from some of the traditional practices that have been established over a century. This is bound to be a difficult process, and is possibly risky at the outset, but it should ultimately result in a more reliable power system with better power quality. Most of the issues listed as concerns do not in fact present fundamental obstacles to the implementation of high penetration levels of PV generation, and in many cases the presence of inverter-based PV generation can facilitate solutions rather than complicate the problems. This is especially true with respect to system protection, because inverters are inherently fast acting and current limited.
In the next section, we first describe the basic output characteristics of PV inverters and the control capabilities that are relevant to their grid interconnection in a high-penetration scenario. This should serve to provide a basis for further consideration of system protection and circuit requirements from the utility perspective. Next, we provide details on how the PV inverters can actively participate in the regulation of voltage in the distribution system. Because inverters bring to the table their unique ability to generate or absorb controlled reactive power, and there is little consensus on how this capability should be used in a distribution system, this is by far the most important topic that needs to be addressed.
This report is available at no cost from the National Renewable Energy Laboratory (NREL) at www.nrel.gov/publications.
5
3 Capabilities of Inverters Inverters are electronic power converters that can be used to couple DC or variable-frequency power sources to the grid. Practically all renewable power generation systems depend on inverters for their grid connection. In these applications, the primary function of the inverter is simply to deliver the maximum possible generated real power as efficiently as possible to the grid. First-generation PV inverters were typically designed with only the basic controls necessary to perform this primary function, while complying with UL 1741 and IEEE 1547 requirements. For low power levels (less than 500 kW) and low levels of PV power penetration, certification of the equipment to these standards was sufficient for utilities to allow interconnection to the grid without much concern.
In addition to frequency conversion and basic real power delivery, inverters also have a number of other inherent control capabilities that are widely used elsewhere in power systems for power management and power quality improvement. As the penetration level increases for PV generation, and as more sophisticated rules for interconnection emerge, it has become clear that harnessing these inverter control capabilities will be key to the successful implementation of large-scale PV generation in distribution systems. Consequently, a wide range of control functions have already been incorporated into newer PV inverter designs that will allow them to play an important role in the operation of the distribution system. In this section we will briefly describe the most relevant inverter capabilities and the ways in which they can facilitate the successful implementation of high penetration levels of PV generation.
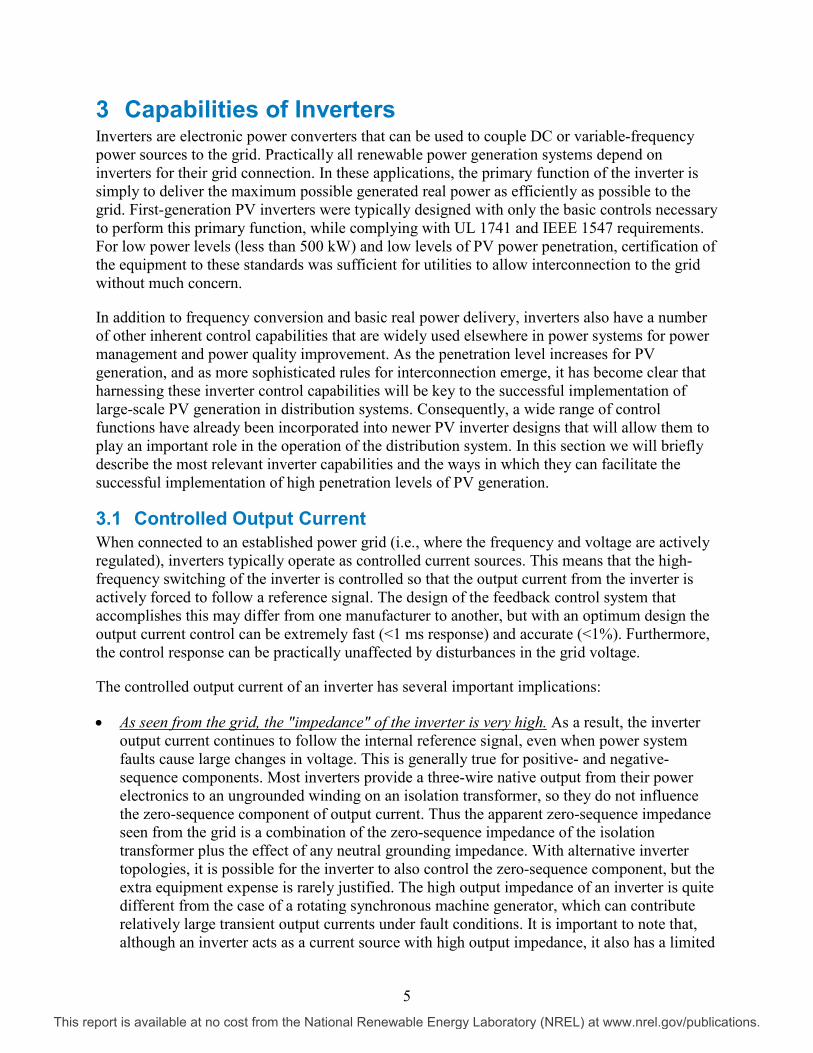
3.1 Controlled Output Current When connected to an established power grid (i.e., where the frequency and voltage are actively regulated), inverters typically operate as controlled current sources. This means that the high-frequency switching of the inverter is controlled so that the output current from the inverter is actively forced to follow a reference signal. The design of the feedback control system that accomplishes this may differ from one manufacturer to another, but with an optimum design the output current control can be extremely fast (<1 ms response) and accurate (<1%). Furthermore, the control response can be practically unaffected by disturbances in the grid voltage.
The controlled output current of an inverter has several important implications:
• As seen from the grid, the "impedance" of the inverter is very high. As a result, the inverter output current continues to follow the internal reference signal, even when power system faults cause large changes in voltage. This is generally true for positive- and negative-sequence components. Most inverters provide a three-wire native output from their power electronics to an ungrounded winding on an isolation transformer, so they do not influence the zero-sequence component of output current. Thus the apparent zero-sequence impedance seen from the grid is a combination of the zero-sequence impedance of the isolation transformer plus the effect of any neutral grounding impedance. With alternative inverter topologies, it is possible for the inverter to also control the zero-sequence component, but the extra equipment expense is rarely justified. The high output impedance of an inverter is quite different from the case of a rotating synchronous machine generator, which can contribute relatively large transient output currents under fault conditions. It is important to note that, although an inverter acts as a current source with high output impedance, it also has a limited
This report is available at no cost from the National Renewable Energy Laboratory (NREL) at www.nrel.gov/publications.
6
maximum output voltage available. In other words, it will not present "infinite" voltage at its terminals if an upstream feeder breaker is suddenly opened while the inverter is running. The maximum output voltage is in fact determined by a combination of the inverter DC terminal voltage and the action of the control system.
• The output current is limited. The internally generated current reference signal takes account of prevailing voltage variations to maintain a required power output, but it is always subject to an over-riding current limit that corresponds to the level of current needed to output rated kVA at the minimum specified working voltage, usually 0.9 per-unit (pu). This means that with a properly designed control system, the output current from an inverter during a grid fault should not exceed approximately 1.1 pu. In most cases, a 1.1 pu fault contribution from distributed generators should be negligible in relation to the conventional fault contribution fed from the transmission system. Add to this the consideration that the inverter output currents are largely in phase with the system voltage, whereas the conventional fault currents are largely in quadrature, and it is safe to say that inverters contribute a negligible amount to the total fault level on a distribution feeder.
• The output current can be reduced to zero in an extremely short time. If necessary, the native output current from the inverter bridge can be stopped in a few microseconds (followed by some short-lived [<1 cycle] decaying transients between the output filter and the grid). This can be very important for the protection and management of the distribution system. If the utility is concerned about circuit breaker capacity, provisions can be made for the output current from an inverter-based generator to be stopped well before any mechanical switchgear starts to operate. In this situation, the inverter controls can autonomously initiate rapid shutdown when abnormal grid conditions are sensed, or the controls can respond to a signal from the utility (e.g., a transfer trip).
• The complex (apparent) output power (S = P + jQ) can be controlled in any of the four power quadrants. Because the magnitude and the phase angle of the fundamental output current relative to the grid voltage can be arbitrarily selected, the real power (P) and reactive power (Q) components of the complex output power (S) can be directly and independently controlled. The real power output is typically controlled so as to regulate another internal quantity such as the DC voltage or power at the PV array. The active control of real power also allows important over-riding real-power-limiting functions, such as power curtailment and power ramping, to be implemented in response to inputs received from a remotely located system operator (e.g., via supervisory control and data acquisition or SCADA). These real power management functions are expected to become essential tools for utilities under a high-penetration scenario, especially in smaller grids (e.g., islands) where the power system may not always be able to accept additional real power and where frequency regulation is a concern. Apart from the management of real power output, the inverter has unique capabilities to generate and strategically deploy reactive power output. This topic is especially important and warrants a separate in-depth discussion in the following sections. The reactive power output that can be generated by inverters at a PV system is a valuable resource for utilities and is expected to be crucial for regulating the voltage in a distribution system with a high penetration of PV.
• The complex output power can be controlled with very high bandwidth. In most cases it is not desirable to change real power output very rapidly because of the impact on system voltage
This report is available at no cost from the National Renewable Energy Laboratory (NREL) at www.nrel.gov/publications.
7
(and frequency in weaker systems). Consequently, real power changes are usually made to follow slow time ramps whenever possible. The same consideration may often be true for reactive power. However, by means of the high bandwidth control of reactive power, the inverter can also act as a fast autonomous local voltage control system. Fast automatic response is essential for correction of the voltage deviations associated with voltage flicker, for example. This will be discussed in more detail in the following sections.
• The inverter can absorb real power from the grid and deliver it to charge an energy storage device connected to the DC-side collector bus (also fed by a PV array). This can facilitate the implementation of an energy management system in which the inverter supplies real power to the grid from storage at times when PV power is not available. To achieve different objectives, the energy storage device might be relatively small (to facilitate power ramping) or very large (e.g., for frequency regulation or power output leveling).
• The inverter output current can be controlled to correct pre-existing low-order voltage (or current) harmonics on the grid. In order to do this, the inverter must deliberately produce corresponding harmonics in the output current. This rather specialized "active filter" function is sometimes performed by dedicated inverters installed specifically for this purpose. To facilitate the production of controlled harmonic output currents, an inverter would ideally switch at the highest practical frequency, and it would be designed with a small output filter inductor in order to minimize the inverter voltage needed to drive the harmonic currents. In addition, because the oscillating harmonic power produced at the AC terminals must be matched by an approximately equal harmonic power at the DC terminals, it is desirable to provide a larger-than-normal DC bus capacitance in order to minimize the corresponding harmonic voltage that develops on the DC bus. It would be relatively costly to produce a PV inverter designed to simultaneously deliver real power while also serving as an active filter. However, active-filter capability might be useful when normal PV power production is very low or zero, such as during the night.
• The inverter can help to correct for unbalanced fundamental voltage at the point of connection to the grid by controlling output current to include a negative sequence fundamental component. In this mode the inverter essentially acts as an active filter for the minus-one (-1) order harmonic. The negative sequence fundamental output current produces a second harmonic power pulsation at the AC terminals, matched by a similar power pulsation at the DC terminals. As in the case of the active filter, a large DC capacitance is needed to absorb this pulsating power with acceptably small DC voltage deviation. As mentioned previously, most inverters can only correct for the negative-sequence fundamental. However, using a more costly alternative inverter topology (e.g., a four-leg inverter bridge), a similar correction could be provided for the zero-sequence components in an unbalanced system.
This report is available at no cost from the National Renewable Energy Laboratory (NREL) at www.nrel.gov/publications.
8
3.2 Grid-Smart Control Features Under the U.S. Department of Energy’s (DOE) Solar Energy Grid Integration Systems (SEGIS) program, Satcon set out to develop an inverter design for the future grid that would have all the capabilities needed to facilitate the integration of large-scale PV generation into distribution systems. To do this, it was necessary to define a new set of "Smart Grid" control features for the inverter, which would make full use of the inherent capabilities listed in the previous section. The main inverter features that were selected are as follows:
• Ability for local communication with site-level controller,2 providing utility-level supervisory control and data acquisition (SCADA) based communications and multi-unit control through:
o Control of real power limit (curtailment)
o Controlled ramp rate for real power limit o Control of reactive power output OR power factor.
• Ability to issue commands to the inverters, providing: o Aggregate power factor control (accounting for site transformers)
o Automatic voltage control, if required
o Long-duration real power ramping by means of curtailment commands to inverters.
• Ride-through3 capability for specified grid disturbances. This would require:
o Adjustable tolerance for voltage and frequency deviation
o Enhanced dynamic control to continue operating successfully with unbalanced or distorted grid voltages during faults
o An un-interruptible power source for control and communications.
• Bi-directional power flow capability to support charging of a DC energy store using grid power
2 The site-level controller is a shared local computer that complements the features of each inverter in a multi-inverter installation by providing aggregate output power management at the point of interconnection (POI) with the utility. The site controller is a communications hub that communicates with all inverters and the utility control center, and receives and processes real-time current and voltage measurements from the POI. 3 "Ride-through" means that the generator must stay online and operate as specified during voltage disturbances caused by faults on the transmission system or an adjacent feeder. The ride-through requirement originated from experience in wind power generation, mainly at transmission-level voltages, and has now become the most common new requirement for interconnection with MV distribution systems. It is a contradiction of IEEE 1547, which requires generators to cease operating within specified maximum time periods when the grid voltage deviates from normal. New ride-through requirements differ considerably in regard to voltage levels and duration. In general, they are intended to ensure that generators will be online and ready to carry their share of system load after the disturbance. In some cases the generator is required to generate reactive power according to a special schedule when voltage deviates beyond set limits. It is assumed that generators will use anti-islanding and other fault-sensing methods to distinguish between a voltage disturbance that requires ride-through and the occurrence of a fault within the feeder or the opening of the feeder breaker that requires operation to cease.
This report is available at no cost from the National Renewable Energy Laboratory (NREL) at www.nrel.gov/publications.

9
• Permissive signal4 response, based on power line carrier communication (PLCC)—an alternative to conventional transfer trip schemes.
The SEGIS program work led to the development of Satcon's Solstice Inverter products, which incorporate Grid-Smart control features. These features provide a flexible basic control interface for the inverters, allowing higher-level power-management strategies to be implemented either from a remote control center or on site by means of a site-level control system.
Some of the Grid-Smart control features are illustrated in Figure 1 using waveforms generated from a transient simulation model. In this case, the output currents to the grid are displayed together with the calculated associated instantaneous real and reactive power output. Real power curtailment, sudden change of irradiance at the PV array, and leading and lagging reactive power generation are all shown. For this illustration, fast internal ramp rates were set to speed up the transition between each operating state of interest. Note that there is no downward ramp of output power when the solar irradiance is suddenly dropped. The fall of power cannot be controlled in this situation without the addition of a suitable energy storage device.
Figure 1. Illustration of some advanced grid support control features using a transient simulation
model of a Grid-Smart inverter.
4 While it is generally understood that transfer trip schemes are needed for synchronous machine generators that cannot easily detect an island condition, there is considerable dispute over the need for these expensive schemes in the case of PV inverters that are usually certified to be compliant with the anti-islanding requirements of IEEE 1547. Often a utility will question the effectiveness of anti-islanding when there are multiple PV units connected on one feeder. Because there is, as of yet, no definitive way to prove this point one way or another, the utility will usually choose to err on the safe side and insist on the provision of a transfer trip scheme. The PLCC permissive signal provides an alternative approach, whereby all generators on a grid segment can rapidly and reliably detect when islanding has occurred and cease operating.
This report is available at no cost from the National Renewable Energy Laboratory (NREL) at www.nrel.gov/publications.

10
3.3 Reactive Power Generation The name "reactive power" is really a misnomer, because the quantity it describes is actually the redundant current that flows at a given point in a power circuit in relation to the electrical power (watts) measured at that point. The notion of reactive power often causes confusion because it is an artifice created for circuit analysis, with no basis in physics. The concept of reactive power is also not uniformly applicable to three-phase and single-phase circuits.
In a three-phase circuit carrying positive and negative sequence currents only (i.e., where the sum of the three currents is zero), the instantaneous reactive current is defined at any given point in the circuit. It describes the part of the instantaneous three-phase current set that is redundant at that point (i.e., the part that could be discarded without changing the instantaneous electrical power calculated at that point). This redundant set of currents is uniquely defined using space vector theory. Specifically, it is the component of the current vector that is in space quadrature with the voltage vector. For convenience in circuit analysis, the instantaneous reactive current is multiplied by the voltage in order to define a quantity (var) with the same dimensions as power. In addition, a polarity is assigned to the product, depending on whether the current vector leads or lags the voltage vector spatially. This quantity is treated as the imaginary part of an instantaneous complex power quantity for computation purposes. There is no universal rule for the polarity of reactive power, but if current is defined as positive in a certain direction, and the associated current vector lags the voltage vector, then reactive power is usually said to be flowing in that direction (i.e., positive). Because the reactive power in three-phase circuits is defined on an instantaneous basis, irrespective of the voltage and current waveforms, it can also be controlled on an instantaneous basis (i.e., in a timeframe that can be much shorter than one fundamental cycle). This means that instantaneous reactive power in three-phase circuits can be used to influence voltages in the circuit very rapidly, which can provide an important means for improving power quality.
Instantaneous reactive power is not defined for single-phase circuits. Instead, for single-phase circuits, the concept of reactive power is applied to steady-state behavior with purely sinusoidal voltage and current, represented by sine-wave phasors. The reactive current phasor at a point in the circuit is defined as the component of the current phasor that is in quadrature with the voltage phasor at that point. This redundant component of current could be discarded without changing the average electrical power calculated at that point. Reactive current is once again multiplied by voltage to obtain reactive power. Of course, this steady-state phasor interpretation of reactive power can also be applied to three-phase circuits in the steady state, where it is entirely consistent with the instantaneous reactive power concept under steady-state sinusoidal conditions. Phasor analysis also provides the only way of applying the reactive power concept to zero-sequence currents flowing in three-phase circuits.
Reactive current occurs naturally in power circuits due to the presence of reactive circuit elements (inductance and capacitance) and various electrical loads (motors, etc.) that draw current at non-unity power factor. The reactive current passes through the circuit, causing voltage drops and power losses and without contributing directly to the useful transfer of electrical energy. Reactive power is conserved (like electrical power) as it passes through an ideal transformer, but in a non-ideal transformer substantial reactive power may be absorbed by the leakage inductance. Passive reactive components (capacitors and reactors) are often
This report is available at no cost from the National Renewable Energy Laboratory (NREL) at www.nrel.gov/publications.
11
strategically switched into or out of a power circuit to compensate for the natural reactive current flow. In the case of so-called "static var generators," electronic switches are used to regulate the reactive current drawn by these components.
Like electrical power, reactive power can be injected into a power circuit from a suitable generator. An ideal reactive power generator requires no electrical or mechanical power input, and no bulk reactive circuit elements, but instead uses a controlled source of voltage to drive the required reactive current output. The rotating synchronous machine is the traditional reactive power generator. The reactive power output from a synchronous generator is controlled by changing the field excitation, allowing reactive power generation up to rated kVA, as well as a more limited range of reactive power absorption. The ability to inject controlled reactive power into a power circuit is important because it provides a very effective means of regulating the voltage.
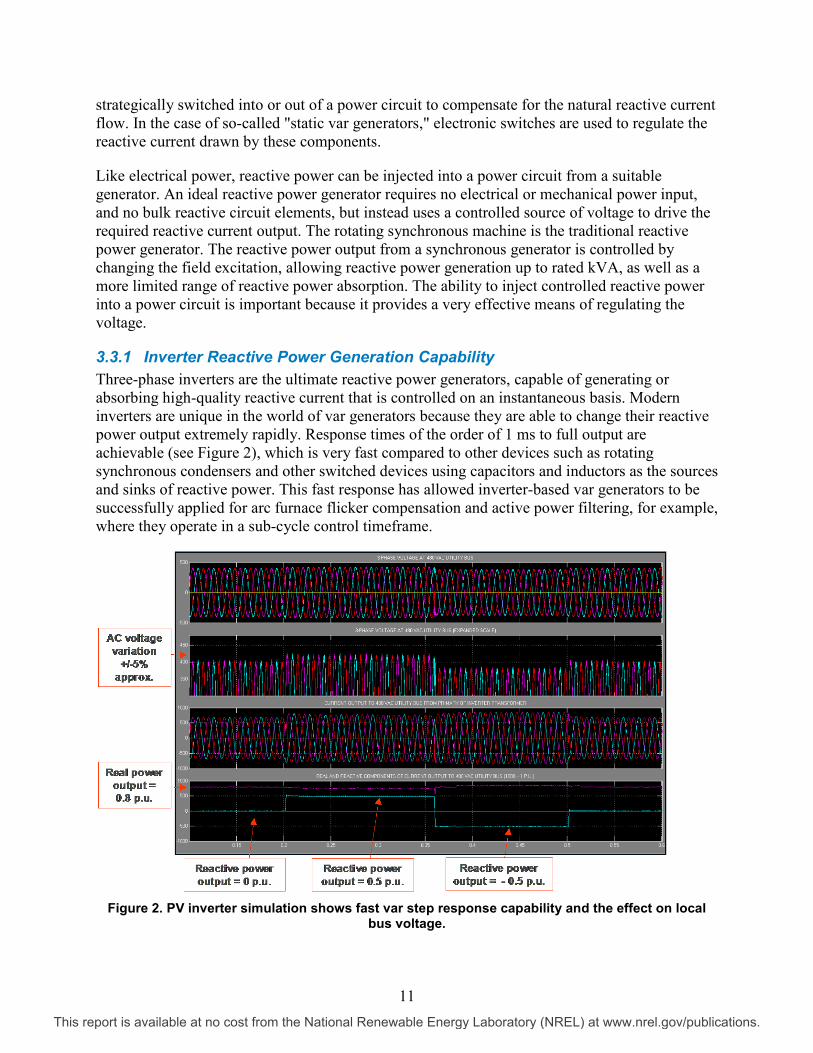
3.3.1 Inverter Reactive Power Generation Capability Three-phase inverters are the ultimate reactive power generators, capable of generating or absorbing high-quality reactive current that is controlled on an instantaneous basis. Modern inverters are unique in the world of var generators because they are able to change their reactive power output extremely rapidly. Response times of the order of 1 ms to full output are achievable (see Figure 2), which is very fast compared to other devices such as rotating synchronous condensers and other switched devices using capacitors and inductors as the sources and sinks of reactive power. This fast response has allowed inverter-based var generators to be successfully applied for arc furnace flicker compensation and active power filtering, for example, where they operate in a sub-cycle control timeframe.
Figure 2. PV inverter simulation shows fast var step response capability and the effect on local
bus voltage.
This report is available at no cost from the National Renewable Energy Laboratory (NREL) at www.nrel.gov/publications.

12
As previously stated in Section 3.1, inverters can provide real (P) and reactive (Q) output power simultaneously, with a corresponding complex power output, S = P + jQ. For safe operation of the solid-state switches in the inverter, there are strict limits on the maximum working current. Therefore inverters are typically designed for a specific maximum kVA output (Smax) that cannot be exceeded. Thus at any operating point, the real power and reactive power output must be constrained so that Smax > (P2 + Q2)1/2. Note that the reactive power output does not add linearly to the total prevailing kVA output. So, for example, with Smax = 1 pu, and a reactive power output of Q = 0.2 pu, an inverter can still pass real power up to P = 0.98 pu without exceeding Smax. This represents a very small impact on maximum real power production while generating a significant level of reactive power output. Some inverters are designed solely for the purpose of generating reactive power (i.e., P = 0). These devices are often called static var compensators, or statcoms for short. In that case the generated reactive power must account for the entire cost of the inverter. But if the cost of the inverter is already covered by its primary function (real power delivery), then the incremental cost for simultaneous reactive power generation may be low. This is particularly true at times when the maximum real power capability of the inverter is not being used. This may occur, for example, in the case of PV power sources due to the daily cycle of solar irradiance.
While it is broadly accepted that the ability of inverters to generate controlled reactive power is a useful feature, there has been little consensus on how this capability should be deployed in a power distribution system. There are many ways in which the reactive power output of PV inverters might be managed for the benefit of the distribution system. Some of these schemes have been arbitrarily defined and included in published interconnection rules and private power producer agreements, but there is not yet any uniformity apparent in these requirements. One trend is to provide a predetermined schedule of reactive power output versus voltage at the POI. The typical schedule would not require any reactive power output from the inverter until the voltage deviates outside of normal working limits. Supposedly, this approach circumvents the thorny issue of allowing a generator to perform automatic voltage control and avoids the anticipated problem of fast voltage controllers fighting with each other and with slower mechanically switched line regulators. It is worth noting that automatic local voltage control is routine in transmission systems, where reactive power generators are always required to autonomously regulate the voltage at the bus where they are connected. Furthermore, there are many instances where fast-acting var generators are either connected to the same bus, or within a short distance of each other, and work together in a stable way thanks to the appropriate control system designs. There is no fundamental reason why PV inverters should not be used to continuously and autonomously regulate voltage in a similar way in distribution systems. This topic will be discussed in greater detail in Section 3.5.
This report is available at no cost from the National Renewable Energy Laboratory (NREL) at www.nrel.gov/publications.

13
3.3.2 Inverter Output Power Control Regarding the PV inverter control system, the first consideration is how to ensure that the maximum inverter kVA is not exceeded while simultaneously supplying real and reactive power to the grid. Other manufacturers may use different design approaches, but Satcon provides a choice of two basic control modes, which make it possible to implement a variety of reactive power strategies.
The first control mode provides independent reactive power control. In this very flexible control mode, the maximum available reactive power at any time is calculated as a function of the prevailing real power curtailment level. Reactive power output follows a command (local or remote) up to the maximum available level. In a large utility-scale application, for example, the real power curtailment level is allowed to slowly track the prevailing real power output up to a pre-determined maximum, while the reactive power command is generated by a site-level controller following a specified algorithm in response to MV measurements at the POI. Figure 3 shows the available reactive power from the inverter versus the real power curtailment level. Note that available reactive power has been limited to 0.87 pu so that at least 0.50 pu real power is always achievable. This constraint is by design and does not represent an absolute limit.
Figure 3. Independent reactive power control mode.
This report is available at no cost from the National Renewable Energy Laboratory (NREL) at www.nrel.gov/publications.

14
The second control mode provided for the inverter is a power factor mode. In this mode, the reactive power output automatically tracks the real power output, maintaining the Q:P ratio that is consistent with the prevailing power factor command but always staying within the kVA rating, and observing the prevailing curtailment level for real power output. Figure 4 shows the maximum available real power as a function of power factor (assuming 1.0 pu real power curtailment) and the associated reactive power levels. This control mode can be used to set a constant power factor prescribed by the utility, or it can be used to follow a variable power factor command generated by the site controller or received from a remote operator at the utility control center.
Figure 4. Power factor control mode.
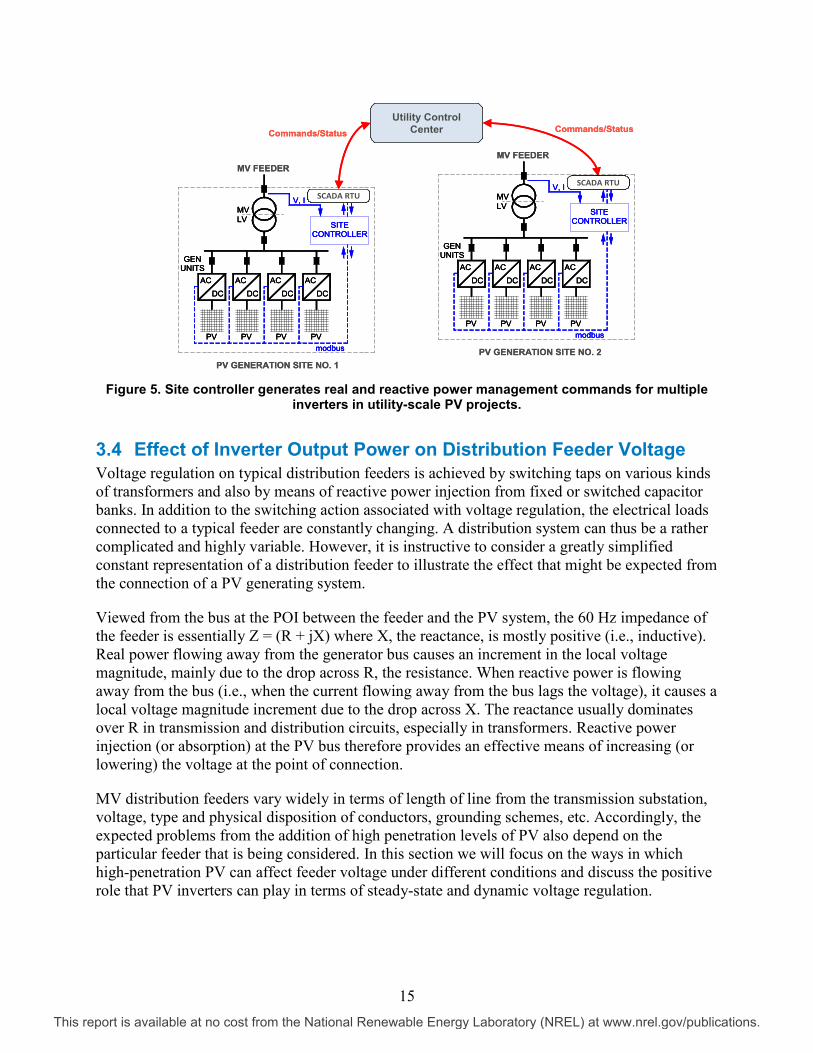
The need for the site-level controller has emerged with the advent of larger PV projects that use multiple inverters to achieve the aggregate output power from the site. Multiple inverters are preferable to a single large inverter because of the physical layout of these projects over a large area and the logistics associated with providing the site-wide power collection circuits. The grid interconnection rules for these sites usually specify the required behavior at the POI with the utility MV feeder. Measurements at the POI are not usually available (or needed) in the individual inverter control systems, so the site controller provides a common local center of intelligence where higher-level power management algorithms can be executed. The site controller also serves as a communications hub for the site, exchanging commands and status information with the utility via SCADA and with the individual inverters via local serial communications. Figure 5 illustrates the role of the site controller.
This report is available at no cost from the National Renewable Energy Laboratory (NREL) at www.nrel.gov/publications.
15
Figure 5. Site controller generates real and reactive power management commands for multiple
inverters in utility-scale PV projects.
3.4 Effect of Inverter Output Power on Distribution Feeder Voltage Voltage regulation on typical distribution feeders is achieved by switching taps on various kinds of transformers and also by means of reactive power injection from fixed or switched capacitor banks. In addition to the switching action associated with voltage regulation, the electrical loads connected to a typical feeder are constantly changing. A distribution system can thus be a rather complicated and highly variable. However, it is instructive to consider a greatly simplified constant representation of a distribution feeder to illustrate the effect that might be expected from the connection of a PV generating system.
Viewed from the bus at the POI between the feeder and the PV system, the 60 Hz impedance of the feeder is essentially Z = (R + jX) where X, the reactance, is mostly positive (i.e., inductive). Real power flowing away from the generator bus causes an increment in the local voltage magnitude, mainly due to the drop across R, the resistance. When reactive power is flowing away from the bus (i.e., when the current flowing away from the bus lags the voltage), it causes a local voltage magnitude increment due to the drop across X. The reactance usually dominates over R in transmission and distribution circuits, especially in transformers. Reactive power injection (or absorption) at the PV bus therefore provides an effective means of increasing (or lowering) the voltage at the point of connection.
MV distribution feeders vary widely in terms of length of line from the transmission substation, voltage, type and physical disposition of conductors, grounding schemes, etc. Accordingly, the expected problems from the addition of high penetration levels of PV also depend on the particular feeder that is being considered. In this section we will focus on the ways in which high-penetration PV can affect feeder voltage under different conditions and discuss the positive role that PV inverters can play in terms of steady-state and dynamic voltage regulation.
Utility Control Center
DC
AC
PV
DC
AC
DC
AC
DC
AC
PV PV PV
MVLV
GENUNITS
SITECONTROLLER
modbus
SCADA RTUV, I SCADA RTU
DC
AC
PV
DC
AC
DC
AC
DC
AC
PV PV PV
MVLV
GENUNITS
SITECONTROLLER
modbus
SCADA RTUV, I SCADA RTU
MV FEEDERMV FEEDER
PV GENERATION SITE NO. 1PV GENERATION SITE NO. 2
Commands/StatusCommands/Status
Utility Control Center
DC
AC
PV
DC
AC
DC
AC
DC
AC
PV PV PV
MVLV
GENUNITS
SITECONTROLLER
modbus
SCADA RTUV, I SCADA RTU
DC
AC
PV
DC
AC
DC
AC
DC
AC
PV PV PV
MVLV
GENUNITS
SITECONTROLLER
modbus
SCADA RTUV, I SCADA RTU
DC
AC
PV
DC
AC
DC
AC
DC
AC
PV PV PV
MVLV
GENUNITS
SITECONTROLLER
modbus
SCADA RTUV, I SCADA RTU
DC
AC
PV
DC
AC
DC
AC
DC
AC
PV PV PV
MVLV
GENUNITS
SITECONTROLLER
modbus
SCADA RTUV, I SCADA RTU
MV FEEDERMV FEEDER
PV GENERATION SITE NO. 1PV GENERATION SITE NO. 2
Commands/StatusCommands/Status
This report is available at no cost from the National Renewable Energy Laboratory (NREL) at www.nrel.gov/publications.

16
Figure 6 shows a simplified representation of a PV system connected to a distribution feeder with 60 Hz impedance Z = (R + jX) pu. Obviously this model is highly simplistic, but it does capture the essence of the system at one point in time. The voltage at the utility substation is assumed to be constant with amplitude 1 pu, and the PV system output is S = (P + jQ) pu. All pu values are based on the PV system rating. Using this model, and assuming the PV system to be operating at unity power factor (Q = 0), the bus voltage at the system was calculated for the full range of real power output. The calculation was repeated for four different values of R, in each case assuming an X/R ratio of 4. The results, plotted in Figure 7, provide a quick overview of the different ways in which the bus voltage can be affected, depending on the feeder impedance. In each case, all of the reactive power absorbed by the feeder inductance is supplied from the substation. For the shorter line, with lower impedance, the resistance dominates and the voltage rises approximately linearly with respect to output power. As the line length is increased (or the impedance is otherwise increased), the feeder inductance begins to dominate, causing the bus voltage to fall for generated power above a certain level. For a very long line, the voltage at the PV bus can fall below the substation voltage, rapidly collapsing to the point where the inverter reaches its current limit. For a given X/R ratio in this scenario, the maximum bus voltage is the same regardless of the total feeder impedance, but it occurs at different output power levels. The maximum bus voltage is higher for lower values of X/R, and it occurs at higher output power levels.
Figure 6. Simplified representation of a distribution feeder with PV generator connected.
R + j.X
V1 0 os
=
DISTRIBUTION FEEDER
SUBSTATIONPV GENERATINGUTILITY
STATION
VV αop
=
S= P + j.Q
This report is available at no cost from the National Renewable Energy Laboratory (NREL) at www.nrel.gov/publications.

17
Figure 7. PV bus voltage versus real power generated. Inverter operates at power factor = 1.
A further set of calculations was performed for the same feeder impedances and the same range of real power output from the PV system, but now assuming that the PV bus is automatically regulated at 1 pu by means of reactive power output generated by the system. The results are plotted in Figure 8a. The output power factors corresponding to the operating points shown in Figure 8a are plotted in Figure 8b. Figure 8a shows that in every case considered, a relatively small amount of reactive power generated or absorbed at the PV system (~ 0.2 pu or less) can completely compensate for any voltage variation at the PV bus that would otherwise be caused by the generated real power output. The required level of reactive power will be different for different feeder impedances and X/R ratios and will also depend on the reactive loads connected, but the same basic principle is valid in most practical cases. In this example, it was necessary for the PV system to absorb Q at most operating points in order to regulate the voltage to 1 pu. A further observation from Figure 8b is that a wide range of power factors would be needed to hold the voltage constant over the range of real power output. A constant power factor, selected for one operating point (e.g., full output), would result in voltage deviations at other output power levels.
This report is available at no cost from the National Renewable Energy Laboratory (NREL) at www.nrel.gov/publications.

18
Figure 8a. PV reactive power output versus real power generated. PV inverter holds the bus
voltage at 1 pu.
Figure 8b. PV inverter output power factors corresponding to Figure 8a.
These results illustrate the general effect that an inverter-based PV system may be expected to have on different types of distribution feeders. The necessary reactive power output from the PV system can be determined in a variety of different ways, requiring a variety of different response times ranging from very slow to very fast. As mentioned before, there is still no consensus as to the proper way to use reactive power generation. However, what is certain is that local injection of reactive power on a distribution feeder can be used for voltage regulation and can correct voltage deviations caused by generated real power, as well as correct for "pre-existing" conditions on the feeder. One of the main benefits of regulating feeder voltage by local reactive power generation is that the local var source can supply the reactive power requirements of nearby loads, thus reducing the overall current loading at the substation and reducing the power losses on the feeder.
This report is available at no cost from the National Renewable Energy Laboratory (NREL) at www.nrel.gov/publications.

19
3.5 Simplified Distribution Feeder with Large PV System Connected To illustrate some of the capabilities and potential benefits of an inverter-based PV system for voltage control, a simplified benchmark distribution feeder is defined in the one-line diagram in Figure 9. The layout of the feeder and the total loading is loosely based on a proposed project in Massachusetts that was recently submitted to National Grid for approval. The simplified representation of the system does not include any conventional voltage-regulating equipment, and the 69 kV sub-transmission bus has been assumed to be infinite. The bus designations and the load distribution are hypothetical, but the line impedances are consistent with typical distribution practice. Essentially, Figure 9 is a long 13.8 kV feeder with a 5 MVA PV system at the end. Load flow and detailed transient simulation studies have been used to illustrate the capability of the PV inverters to actively regulate the voltage at the point of connection.
Figure 9. Simplified benchmark system with a 5 MVA PV system connected to a 13.8 kV feeder.
This report is available at no cost from the National Renewable Energy Laboratory (NREL) at www.nrel.gov/publications.
20
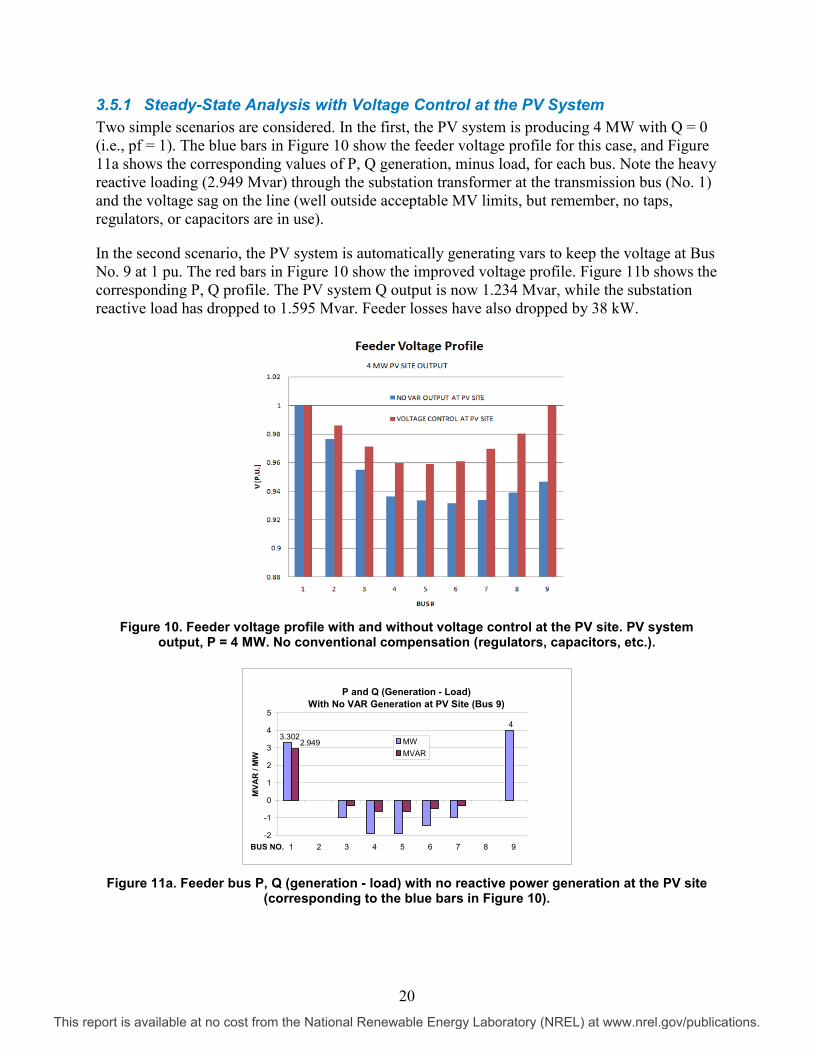
3.5.1 Steady-State Analysis with Voltage Control at the PV System Two simple scenarios are considered. In the first, the PV system is producing 4 MW with Q = 0 (i.e., pf = 1). The blue bars in Figure 10 show the feeder voltage profile for this case, and Figure 11a shows the corresponding values of P, Q generation, minus load, for each bus. Note the heavy reactive loading (2.949 Mvar) through the substation transformer at the transmission bus (No. 1) and the voltage sag on the line (well outside acceptable MV limits, but remember, no taps, regulators, or capacitors are in use).
In the second scenario, the PV system is automatically generating vars to keep the voltage at Bus No. 9 at 1 pu. The red bars in Figure 10 show the improved voltage profile. Figure 11b shows the corresponding P, Q profile. The PV system Q output is now 1.234 Mvar, while the substation reactive load has dropped to 1.595 Mvar. Feeder losses have also dropped by 38 kW.
Figure 10. Feeder voltage profile with and without voltage control at the PV site. PV system
output, P = 4 MW. No conventional compensation (regulators, capacitors, etc.).
Figure 11a. Feeder bus P, Q (generation - load) with no reactive power generation at the PV site
(corresponding to the blue bars in Figure 10).
P and Q (Generation - Load)With No VAR Generation at PV Site (Bus 9)
3.3024
2.949
-2
-1
0
1
2
3
4
5
1 2 3 4 5 6 7 8 9BUS NO.
MVA
R /
MW
MWMVAR
This report is available at no cost from the National Renewable Energy Laboratory (NREL) at www.nrel.gov/publications.

21
Figure 11b. Feeder bus P, Q (generation - load) with reactive power generation at the PV site used
to maintain Bus No. 9 voltage at 1 pu (corresponding to the red bars in Figure 10).
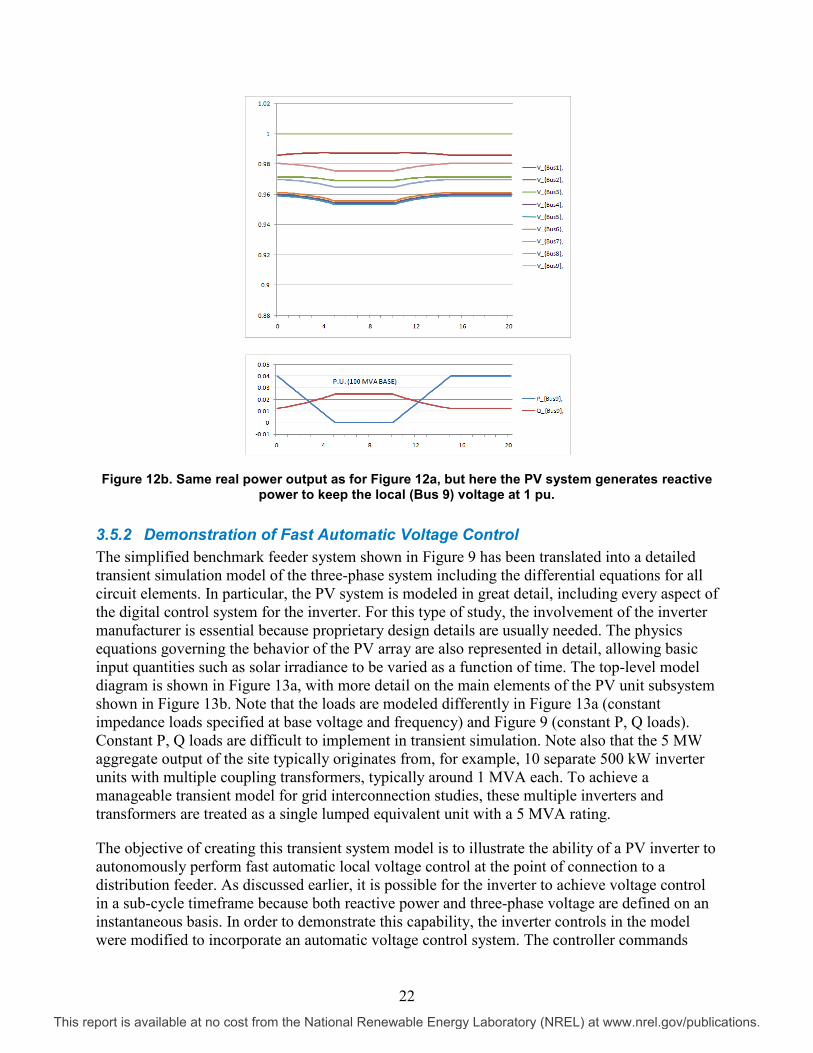
The load flow analysis has also been used to produce a quasi-dynamic illustration of the effect on the feeder voltage profile as the real power production from the PV site changes. The same two scenarios are considered for the PV system: 1) Q = 0, and 2) automatic voltage control at the PV site. Figure 12a plots the bus voltages as the P output from the PV system is dropped from 4 MW to 0 MW and back again, while Q = 0. Figure 12b shows the second case, which is similar but now with Q output generated by the PV system to keep the Bus No. 9 voltage at 1 pu. Note that these illustrations are simply a succession of load flow solutions showing the steady-state locus for different P, Q output from the PV system, and not a true time-domain transient simulation.
Figure 12a. Feeder voltage profile plotted as PV system real power drops from 4 MW to 0 MW and back. Q output = 0. In this case, the voltage at the PV system is not controlled.
P and Q (Generation - Load)With Voltage Control at PV Site (Bus 9)
3.2644
1.2341.595
-2
-1
0
1
2
3
4
5
1 2 3 4 5 6 7 8 9BUS NO.
MVA
R /
MW
MWMVAR
This report is available at no cost from the National Renewable Energy Laboratory (NREL) at www.nrel.gov/publications.
22
Figure 12b. Same real power output as for Figure 12a, but here the PV system generates reactive power to keep the local (Bus 9) voltage at 1 pu.
3.5.2 Demonstration of Fast Automatic Voltage Control The simplified benchmark feeder system shown in Figure 9 has been translated into a detailed transient simulation model of the three-phase system including the differential equations for all circuit elements. In particular, the PV system is modeled in great detail, including every aspect of the digital control system for the inverter. For this type of study, the involvement of the inverter manufacturer is essential because proprietary design details are usually needed. The physics equations governing the behavior of the PV array are also represented in detail, allowing basic input quantities such as solar irradiance to be varied as a function of time. The top-level model diagram is shown in Figure 13a, with more detail on the main elements of the PV unit subsystem shown in Figure 13b. Note that the loads are modeled differently in Figure 13a (constant impedance loads specified at base voltage and frequency) and Figure 9 (constant P, Q loads). Constant P, Q loads are difficult to implement in transient simulation. Note also that the 5 MW aggregate output of the site typically originates from, for example, 10 separate 500 kW inverter units with multiple coupling transformers, typically around 1 MVA each. To achieve a manageable transient model for grid interconnection studies, these multiple inverters and transformers are treated as a single lumped equivalent unit with a 5 MVA rating.
The objective of creating this transient system model is to illustrate the ability of a PV inverter to autonomously perform fast automatic local voltage control at the point of connection to a distribution feeder. As discussed earlier, it is possible for the inverter to achieve voltage control in a sub-cycle timeframe because both reactive power and three-phase voltage are defined on an instantaneous basis. In order to demonstrate this capability, the inverter controls in the model were modified to incorporate an automatic voltage control system. The controller commands
This report is available at no cost from the National Renewable Energy Laboratory (NREL) at www.nrel.gov/publications.
23
rapid changes in reactive power in order to correct errors in the measured voltage feedback. Two cases were studied, one with the voltage controller disabled (and no reactive power generation) and one with the automatic voltage control enabled. In each case, the PV system is initially running under real power curtailment at 4 MW output (although the available solar power from the array is higher). At t = 0.2 the irradiance starts to drop from 1,000 W/m2 at a rate of 104
W/m2/s. At t ≈ 0.225 it crosses the threshold for supporting the curtailed power output, and site output power starts to fall. After 80 ms the irradiance reaches 200 W/m2, where it holds until t = 0.4, then rises again to 1,000 W/m2 at the same rate at which it dropped initially. This is a rather extreme interpretation of a passing cloud, although these fall and rise rates for irradiance might possibly occur.
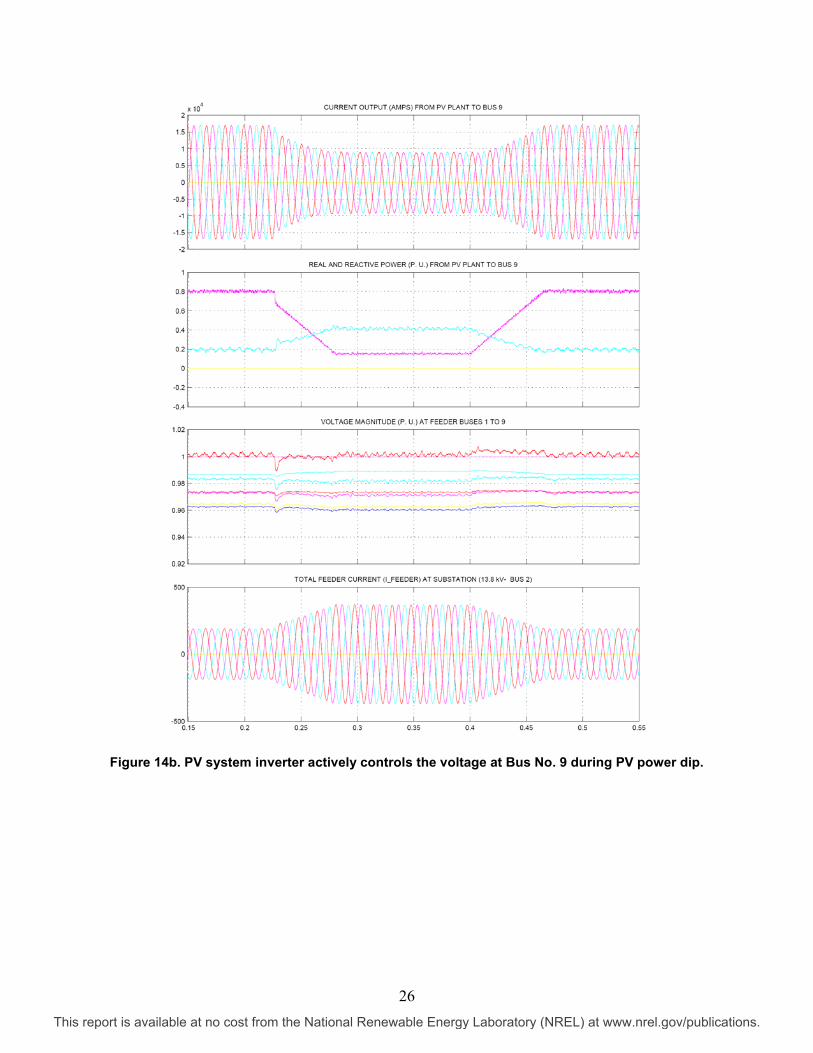
Figure 14a shows the waveforms obtained for the case with voltage control disabled. As expected from the earlier steady-state analysis, in this case we see a large voltage variation at each of the feeder buses due to the rapid transition of output power from the PV system. Figure 14b shows the case with fast automatic voltage control enabled. In this case the voltage control greatly reduces the voltage variations that occur over the length of the feeder.
In the earlier steady-state load flow analysis, we assumed that the PV inverter would generate precisely the reactive power needed to maintain the voltage at 1 pu at Bus No. 9. What the transient case in Figure 14b serves to show is that a fast automatic voltage controller using a relatively small amount of locally generated reactive power can, in fact, hold the local bus voltage practically constant during short-lived transient disturbances. Note that the initial current output from the PV system in Figure 14b is roughly the same as in Figure 14a despite the higher reactive power output. This is due to the higher bus voltage in the Figure 14b case. It is reasonable to assume that this voltage control capability could also be used to reduce the voltage flicker that might otherwise be caused by such events. In the following section we further investigate this hypothesis, using the transient simulation model to show the improvement that could be achieved.
This report is available at no cost from the National Renewable Energy Laboratory (NREL) at www.nrel.gov/publications.

24
Figure 13a. Simulink transient model of the system in Figure 9.
Figure 13b. PV unit subsystem in Figure 13a.
This report is available at no cost from the National Renewable Energy Laboratory (NREL) at www.nrel.gov/publications.

25
Figure 14a. No var output (pf = 1) at PV site during PV power dip. Bus No. 9 voltage is not
controlled.
This report is available at no cost from the National Renewable Energy Laboratory (NREL) at www.nrel.gov/publications.
26
Figure 14b. PV system inverter actively controls the voltage at Bus No. 9 during PV power dip.
This report is available at no cost from the National Renewable Energy Laboratory (NREL) at www.nrel.gov/publications.
27
3.5.3 Fast Voltage Control for Flicker Reduction The term "flicker" originates from the troublesome variation in light intensity, from incandescent lights in particular, as a result of even very small variations in voltage. Eye sensitivity, perception, and human tolerance play a large part in the assessment of flicker, which has made it difficult to define quantitatively in absolute engineering terms. Flicker sensitivity has been found to peak for voltage variations around 9 Hz, so flicker problems have traditionally been associated with industrial processes such as large electric arc furnaces and welding systems that draw fluctuating power at or around these frequencies. However, the concept of flicker has now been extended to cover all kinds of voltage fluctuations through the use of short-term (10 minutes) flicker assessment (Pst) and long-term (a few hours) flicker assessment (Plt). The International Electrotechnical Commission (IEC) has developed standards for measuring voltage flicker. The IEC method for flicker measurement is defined in the IEC Standard 61000-4-15 (formerly the IEC 868). IEC Standard 61000-3-7 also provides target limits for Pst (0.9) and Plt (0.7) as measured according to the standard. These standards have enabled consistent measurements to be made at existing locations, but it remains difficult to assess the possibility of excessive flicker at the planning stage because the result is critically dependent on the time-varying nature of the expected voltage variations. The issue is further complicated by the random nature of power fluctuations from a PV system subject to passing cloud cover.
We have postulated that the fast automatic voltage control demonstrated by the results of Figure 14b can have a beneficial effect in reducing the flicker caused in a distribution system due to rapid fluctuation of output power from a PV generator. We would like to test this hypothesis, using the detailed transient model of Figure 13 to generate the voltage waveform at one of the feeder buses in the benchmark system, and from this data calculate the level of flicker according to the IEC standard. By repeating the experiment with and without the fast voltage control enabled, we would obtain an absolute assessment of the improvement in the flicker level due to the voltage control. Unfortunately the transient model runs with a 1 µs time-step, and it would be impractical (though not impossible) to simulate the 10 minutes of real-time voltage data required for Pst assessment. In order to facilitate the proposed experiment, a slightly simplified process was developed. The approach that was used is to simulate one "cloud-cover cycle" such as that simulated in Figure 14a and Figure 14b and then to assume that the event is repeated continuously for 10 minutes. In this way, 10 minutes of voltage waveform data can rapidly be generated. This approach introduces an unrealistic periodicity for the cloud cycle into the experiment, but the response to each event is accurately simulated, thus allowing us to capture the changes in the voltage transitions due to the voltage control system. These voltage transitions are thought to account in large part for the flicker produced. If the same periodicity for the cloud cycle is consistently used, this method at least allows a comparative assessment to be obtained for the two different operating conditions.
This report is available at no cost from the National Renewable Energy Laboratory (NREL) at www.nrel.gov/publications.
28
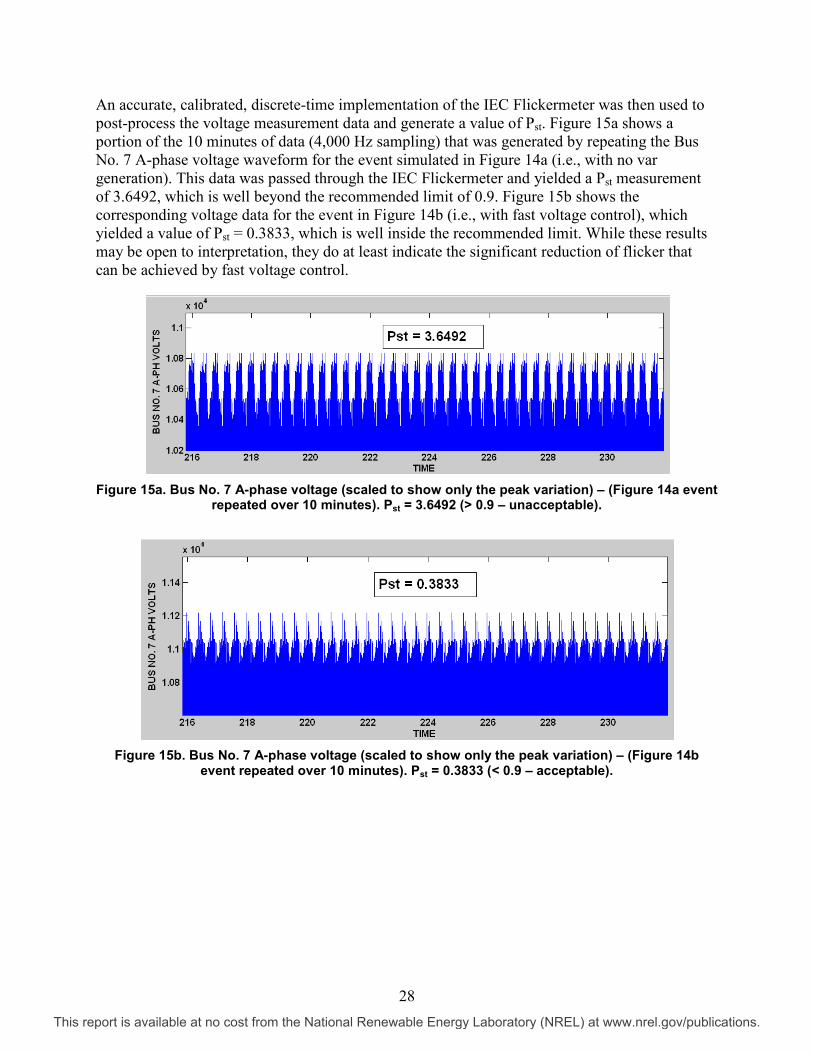
An accurate, calibrated, discrete-time implementation of the IEC Flickermeter was then used to post-process the voltage measurement data and generate a value of Pst. Figure 15a shows a portion of the 10 minutes of data (4,000 Hz sampling) that was generated by repeating the Bus No. 7 A-phase voltage waveform for the event simulated in Figure 14a (i.e., with no var generation). This data was passed through the IEC Flickermeter and yielded a Pst measurement of 3.6492, which is well beyond the recommended limit of 0.9. Figure 15b shows the corresponding voltage data for the event in Figure 14b (i.e., with fast voltage control), which yielded a value of Pst = 0.3833, which is well inside the recommended limit. While these results may be open to interpretation, they do at least indicate the significant reduction of flicker that can be achieved by fast voltage control.
Figure 15a. Bus No. 7 A-phase voltage (scaled to show only the peak variation) – (Figure 14a event
repeated over 10 minutes). Pst = 3.6492 (> 0.9 – unacceptable).
Figure 15b. Bus No. 7 A-phase voltage (scaled to show only the peak variation) – (Figure 14b
event repeated over 10 minutes). Pst = 0.3833 (< 0.9 – acceptable).
This report is available at no cost from the National Renewable Energy Laboratory (NREL) at www.nrel.gov/publications.

29
4 Main Issues Delaying or Blocking the Connection of Large PV Projects
With the introduction of favorable feed-in tariff (FIT) rates and tax credits for renewable power, and the rapid decline in the cost of PV modules, there has been an unprecedented rush to install large PV projects in many parts of the world. Consequently, utilities have been inundated with requests for interconnection to the grid. In many cases the utilities have been unprepared to deal with this, especially in the case of large-scale projects (5 MW to 10 MW and even greater) requesting interconnection at distribution-system voltage levels. In the United States, the prevailing IEEE 1547 standard does not provide the answers needed to reassure utilities because these high-penetration scenarios were simply not anticipated when the standard was drawn up. So in some cases project approvals are on hold simply because the utility is waiting for clear guidelines to emerge that will allow them to determine what additional measures (if any) are needed for the project to proceed safely. In other cases, especially in other countries and in Hawaii, utilities and various regulatory bodies have been hastily drawing up their own rules and regulations for interconnection of distributed resources. In many cases, these new rules have had the effect of slowing the progress of PV projects as developers scramble to understand the requirements and their financial impacts. Examination of these rules is instructive because it highlights some of the utility concerns and shows some of the ways in which the advanced capabilities of inverters can be utilized to address them.
The issues and requirements currently affecting the interconnection of new PV systems include:
• Short-circuit capacity limitation. This applies in cases where the short-circuit level has been assessed to be so close to the maximum capacity of existing circuit breakers that it would be unsafe to connect any additional local generation that would contribute in any way to increase the fault level. Surprisingly, this unlikely scenario apparently exists at many transformer stations in Ontario, Canada, where attractive FITs have been announced. As developers rush to take advantage of the FIT, interconnection of any new distributed generators through these transformer stations has been refused.
• Power/distance limitation. This applies especially in the case of the very long feeders encountered in Canada. These may be 44 kV feeders, but they are still classed as distribution level. The concern in this case is the regulation of voltage over a range of real power output from a PV system located far from the transformer station. Typically the utility allows connection of distributed resources that fall within its acceptable power/distance rules and specifies remedies for those that are not acceptable. Such remedies are often expensive and include re-conductoring the feeder line, re-locating the system, or providing a separate reactive power generator to regulate voltage at the system location. The goal of many developers whose projects are threatened by this rule is to convince the utility to allow the PV inverters to participate in reactive power generation instead of using a separate var generator.
• Transfer trip for the PV system. While it is generally understood that transfer trip schemes are needed for synchronous machine generators, there is considerable disagreement over the need for these expensive schemes in the case of PV inverters that are usually certified to be compliant with the anti-islanding requirements of IEEE 1547. Often the utility will require a
This report is available at no cost from the National Renewable Energy Laboratory (NREL) at www.nrel.gov/publications.

30
transfer trip because it questions the effectiveness of anti-islanding when there are multiple PV units connected on one feeder. The cost of providing a transfer trip scheme can sink the budget for a PV project.
• Special custom requirements for reactive power deployment. As the capability of inverters to generate reactive power becomes more widely understood, utilities are beginning to specify reactive power generation as a condition for interconnection. In some cases this calls for a fixed or adjustable power factor. In other cases a schedule is prescribed for reactive power output versus voltage or for reactive power output versus real power output. In general, rules for distribution feeders have stopped short of allowing generators to perform continuous autonomous local voltage control (as is commonly done in transmission systems).
• Customized ride-through requirements. Ride-through requirements differ considerably in regard to voltage levels and duration. In some cases the generator is required to generate reactive power according to a special schedule when voltage deviates beyond set limits.
• Voltage quality requirements at the PV station. This is an area where there is often disagreement about who is responsible for the grid voltage quality. It is impractical for a PV project developer to guarantee voltage quality at the point where the system is connected to the grid. Apart from other second-order effects, the voltage quality depends on the impedance of the grid and the presence of other harmonic sources throughout the system. It could be possible to fail to meet a voltage quality criterion without ever turning on the PV system. Undeterred by these facts, utilities still often try to insert voltage quality requirements into power producer agreements and regulations.
• PV system (AC output) grounding method. In some cases utilities are insisting on the provision of a solidly grounded primary neutral at the PV inverter isolation transformer. It is easy to demonstrate that this is bad practice, especially when the upstream transformer in the distribution system is also solidly grounded with low zero-sequence impedance. However, it is difficult to persuade utilities to change their standard practices.
• Transient over-voltage on islanding. When impact studies show an unacceptable rise in inverter terminal voltage following sudden interruption of the grid connection, the utility will sometimes insist on the provision of special surge arrestors. This is a problem that is easily addressed through inverter control capabilities and need not be the cause for large additional equipment expense.
• General uncertainty about impact of a high-penetration PV project on an existing feeder. In these cases the utility may commission impact studies that will result in a number of special requirements being stipulated as the condition for approval. Sometimes the impact studies still leave room for doubts, and the approval may be further delayed. Main issues are usually the following:
o Increased switching operations at line regulators, load tap changers, and capacitor banks
o Conductor and other equipment loading
o Flicker
o Protection relay settings with reverse power flow possible.
This report is available at no cost from the National Renewable Energy Laboratory (NREL) at www.nrel.gov/publications.

31
5 Conclusions The advanced inverter capabilities discussed in this report could clearly facilitate high penetration levels of PV generation and also lead to potential savings for utilities by reducing line losses and drastically reducing regulator switching operations, thereby extending the life of equipment, reducing maintenance costs, and possibly deferring the cost of new capacitor banks and other equipment. In addition, a new PV system on a feeder could improve the pre-existing power quality.
On the other hand, owner/operators who install inverters to interface their power plant to the grid would prefer that the inverters only be used to deliver revenue-producing real power. Providing ancillary services to the utility incurs a cost, either in terms of lost power production, increased power losses at the generation site, or other operating costs. The preferred business model for this relationship is not yet clear. It raises issues about who pays for what, as well as some more basic questions such as liability (who is responsible for maintaining system voltage) and how to measure lost production from variable sources for accounting purposes. These thorny issues must be resolved before the benefits discussed here can be fully realized.
This report has shown that advanced inverters in renewable power plants on distribution feeders can use their fast var generating capability to automatically regulate the voltage at the point of connection, thereby correcting for voltage swings due to their own real power fluctuations, reducing flicker that would otherwise occur, and improving power quality compared to pre-existing conditions. Changes to existing regulations are needed if these potential benefits are to be fully realized.
The inverters that are used to connect PV power sources to the grid should be viewed as valuable resources for the management of the distribution system. Most of their unique control capabilities stem from the fact that inverters provide fast and flexible control of their output current (unparalleled by other power generators) and hence the real and reactive power injected into the grid.
The most important remaining questions for the integration of inverters into distribution systems lie in the area of voltage control. As we have seen, there are no fundamental technical barriers that would prevent PV inverters from actively and automatically controlling the voltage at their point of connection. Instead, the barriers lie in the unwillingness of distribution system operators to adapt the existing infrastructure of the distribution system where necessary and to modify traditional practices to allow this to happen. This change will not come about quickly, but, as with all innovation in the electric utility industry, can start to happen after successful demonstration projects in the field have shown that the proposed new practices are safe, reliable, and beneficial.
This report is available at no cost from the National Renewable Energy Laboratory (NREL) at www.nrel.gov/publications.