advanced data analysis (ada) improved analysis guiding
TRANSCRIPT

Advanced Data Analysis (ADA)
Guiding Mississippi Sites to More Effective Cleanups
Improved Analysis through Modeling, LLC
William Benni

Slide 2 Improved Analysis
through Modeling, LLC
Duration Distribution of Dual-Phase Systems Operations at 282 MS Sites
69% Cleanup in Under 4 Years 31% Cleanup in Over 4 Years (Problem Sites)

Slide 3 Improved Analysis
through Modeling, LLC
Estimated Distribution of Operational Costs at 282 MS Sites
39% Costs in Under 4 Years 61% Costs in Over 4 Years (Problem Sites)
Improved Analysis through Modeling, LLC
Slide 4
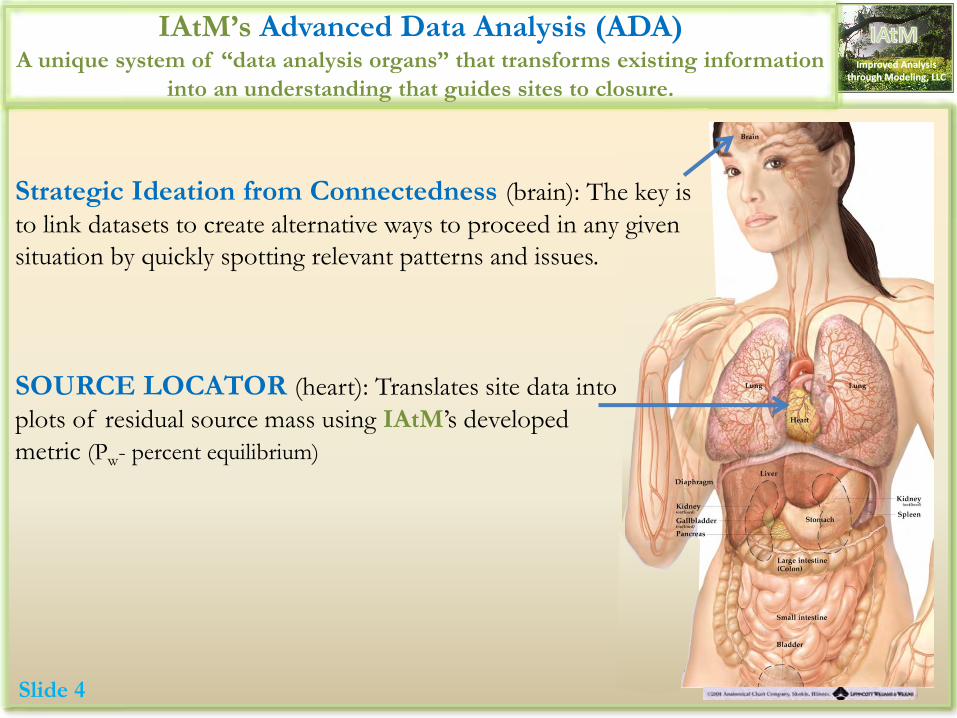
IAtM’s Advanced Data Analysis (ADA) A unique system of “data analysis organs” that transforms existing information
into an understanding that guides sites to closure.
Strategic Ideation from Connectedness (brain): The key is
to link datasets to create alternative ways to proceed in any given
situation by quickly spotting relevant patterns and issues.
SOURCE LOCATOR (heart): Translates site data into
plots of residual source mass using IAtM’s developed
metric (Pw- percent equilibrium)


Improved Analysis through Modeling, LLC
Slide 6
IAtM’s Advanced Data Analysis (ADA) A unique system of “data analysis organs” that transforms existing information
into an understanding that guides sites to closure.
Strategic Ideation from Connectedness (brain): The key is
to link datasets to create alternative ways to proceed in any given
situation by quickly spotting relevant patterns and issues.
SOURCE LOCATOR (heart): Translates site data into plots
of residual source mass using IAtM’s developed metric (Pw-
percent equilibrium)
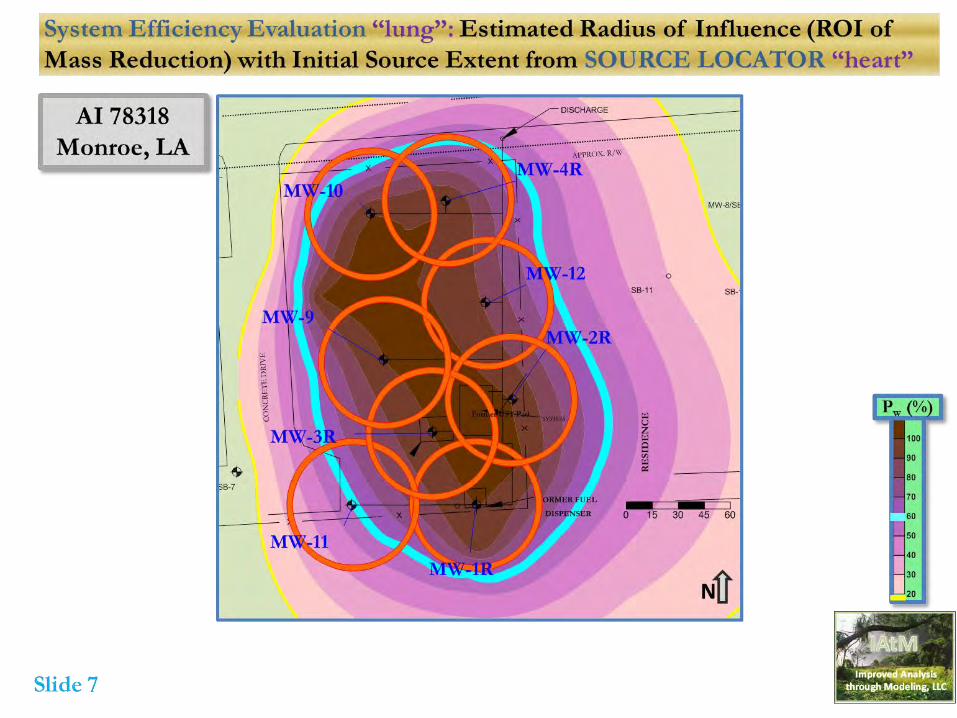
System Efficiency Evaluation (SEE) (lungs):
IAtM estimates radius of effective mass reduction to
identify areas of missed source mass and site-specific
factors affecting mass removal

Improved Analysis through Modeling, LLC
Slide 9
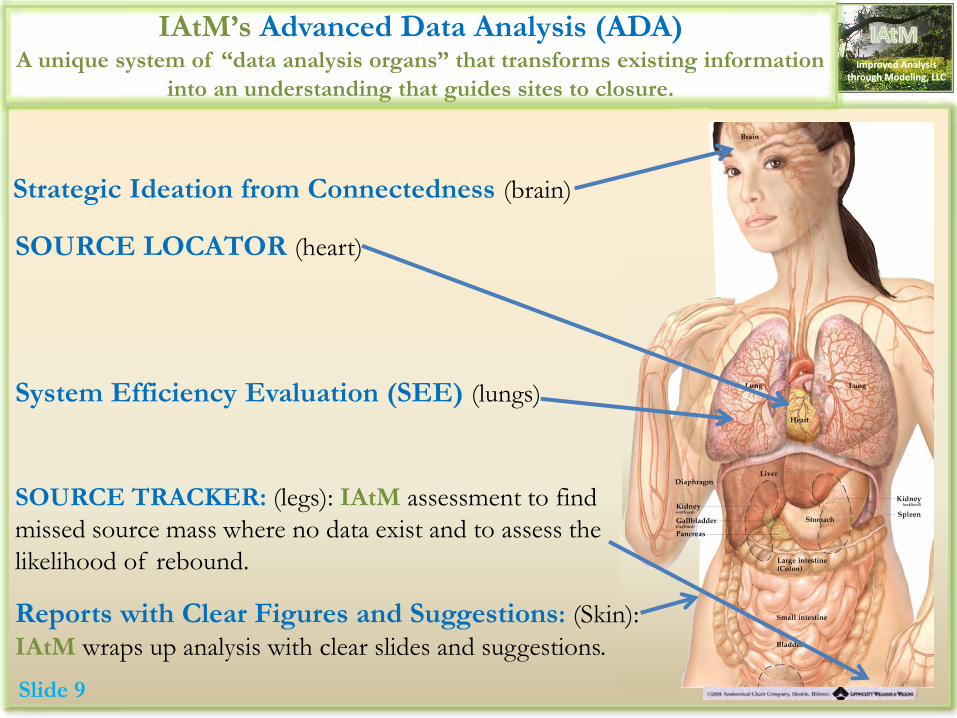
IAtM’s Advanced Data Analysis (ADA) A unique system of “data analysis organs” that transforms existing information
into an understanding that guides sites to closure.
Strategic Ideation from Connectedness (brain)
SOURCE LOCATOR (heart)
System Efficiency Evaluation (SEE) (lungs)
SOURCE TRACKER: (legs): IAtM assessment to find
missed source mass where no data exist and to assess the
likelihood of rebound.
Reports with Clear Figures and Suggestions: (Skin):
IAtM wraps up analysis with clear slides and suggestions.


Slide 12 Improved Analysis
through Modeling, LLC
Consistent Causes for Failure to Cleanup in 4 Years Identified by ADA
In Between recovery/
injection wells
OutSIDE treatment
area
Deep (below
remedy's
reach)
Shallow (above
remedy's
reach)
Remedy
Inefficieny
Multiple
Releases
Dual-Phase (32
Evaluations)74% 68% 65% 13% 45% 52% 71%
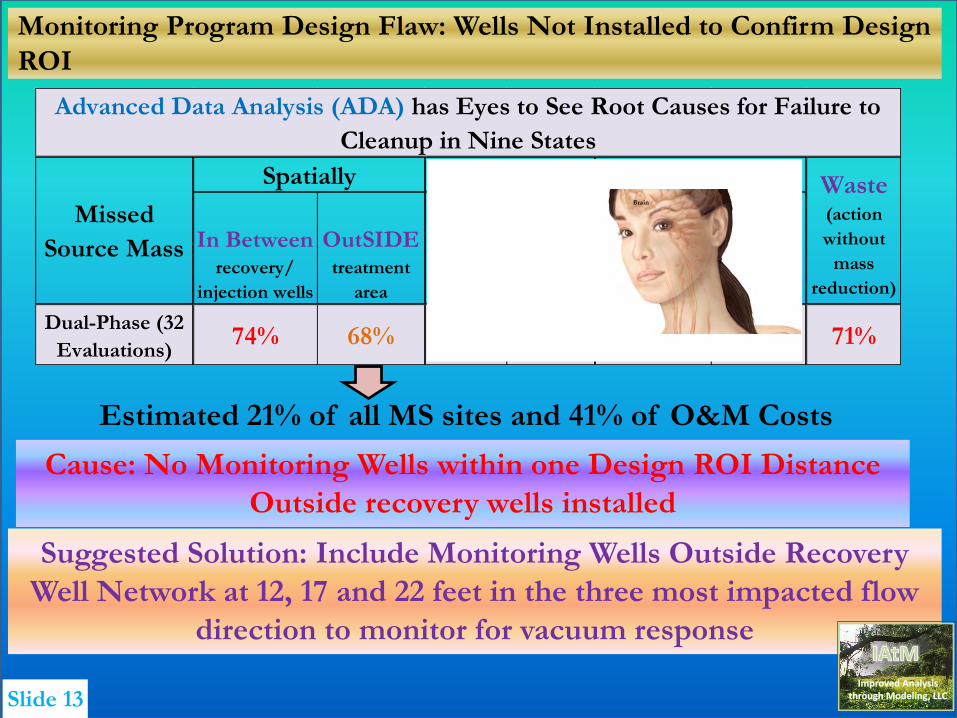
Advanced Data Analysis (ADA) has Eyes to See Root Causes for Failure to
Cleanup in Nine States
Missed
Source Mass
Spatially Vertically Complications Waste (action
without
mass
reduction)
Cause: ROI Overestimated or Possibility of Gaps not Checked
Suggested Solution: Begin with following Design ROI Maximums:
20 to 25 feet in asphalt covered areas with typical DTWs
Estimated 23% of all MS sites and 45% of O&M Costs
12 to 15 feet in grass areas, or shallow DTWs relative to soil type
(critical shallow depth greater for sands) [short-circuiting]
10 to 15 feet in very tight materials
Slide 13
Monitoring Program Design Flaw: Wells Not Installed to Confirm Design
ROI
In Between recovery/
injection wells
OutSIDE treatment
area
Deep (below
remedy's
reach)
Shallow (above
remedy's
reach)
Remedy
Inefficieny
Multiple
Releases
Dual-Phase (32
Evaluations)74% 68% 65% 13% 45% 52% 71%
Advanced Data Analysis (ADA) has Eyes to See Root Causes for Failure to
Cleanup in Nine States
Missed
Source Mass
Spatially Vertically Complications Waste (action
without
mass
reduction)
Cause: No Monitoring Wells within one Design ROI Distance
Outside recovery wells installed
Suggested Solution: Include Monitoring Wells Outside Recovery
Well Network at 12, 17 and 22 feet in the three most impacted flow
direction to monitor for vacuum response
Estimated 21% of all MS sites and 41% of O&M Costs
Improved Analysis through Modeling, LLC
Slide 14
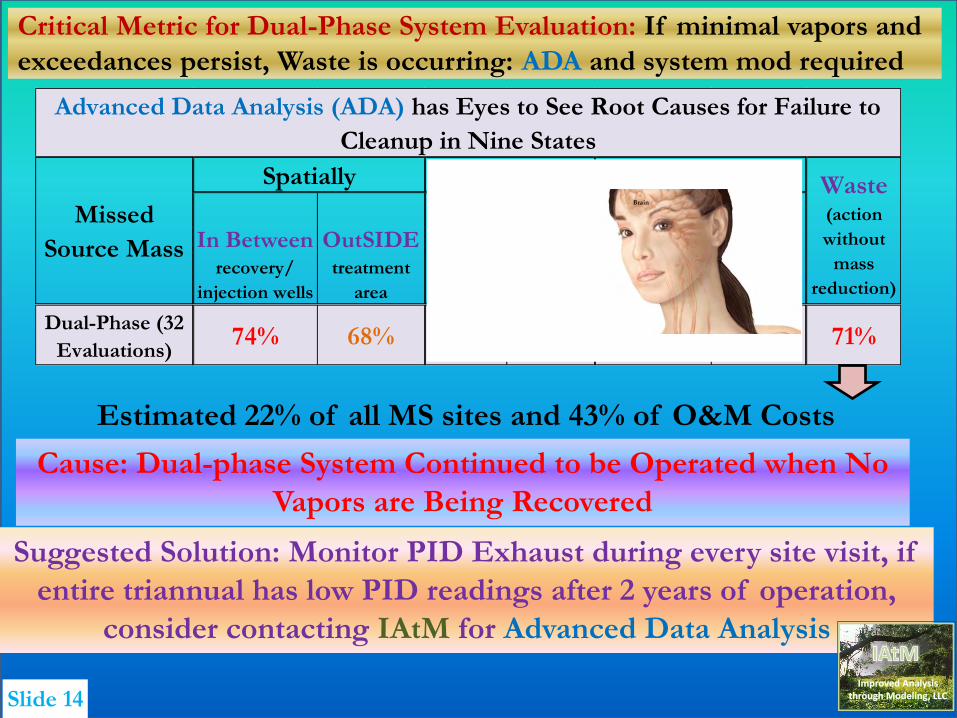
Critical Metric for Dual-Phase System Evaluation: If minimal vapors and
exceedances persist, Waste is occurring: ADA and system mod required
In Between recovery/
injection wells
OutSIDE treatment
area
Deep (below
remedy's
reach)
Shallow (above
remedy's
reach)
Remedy
Inefficieny
Multiple
Releases
Dual-Phase (32
Evaluations)74% 68% 65% 13% 45% 52% 71%
Advanced Data Analysis (ADA) has Eyes to See Root Causes for Failure to
Cleanup in Nine States
Missed
Source Mass
Spatially Vertically Complications Waste (action
without
mass
reduction)
Estimated 22% of all MS sites and 43% of O&M Costs
Cause: Dual-phase System Continued to be Operated when No
Vapors are Being Recovered
Suggested Solution: Monitor PID Exhaust during every site visit, if
entire triannual has low PID readings after 2 years of operation,
consider contacting IAtM for Advanced Data Analysis
Improved Analysis through Modeling, LLC

72.7 73.072.0 71.7 73.2 73.0
64.8
67.568.2
66.365.1 64.6
RW-9 ScreenRW-14 Screen
RW-2 ScreenRW-1 Screen
RW-13 Screen
RW-6 Screen
60
65
70
75
80
85
90
95
Ele
vati
on
(ft)
Min Obs GW Elev. (ft)
Top Source
Bottom Source
RW-9 Screen
RW-14 Screen
RW-2 Screen
RW-1 Screen
RW-13 Screen
RW-6 Screen
Slide 15 Improved Analysis
through Modeling, LLC
Missed Mass
Deep
Dual-Phase
65% of Dual-Phase
problem sites
Deep Residual Source
MS Site
Critical Dual-Phase Remedy Vulnerability: Deep Mass Below Remedy’s
Reach C
riti
cal
Vu
lnera
bil
ity
Improved Analysis through Modeling, LLC
Slide 16
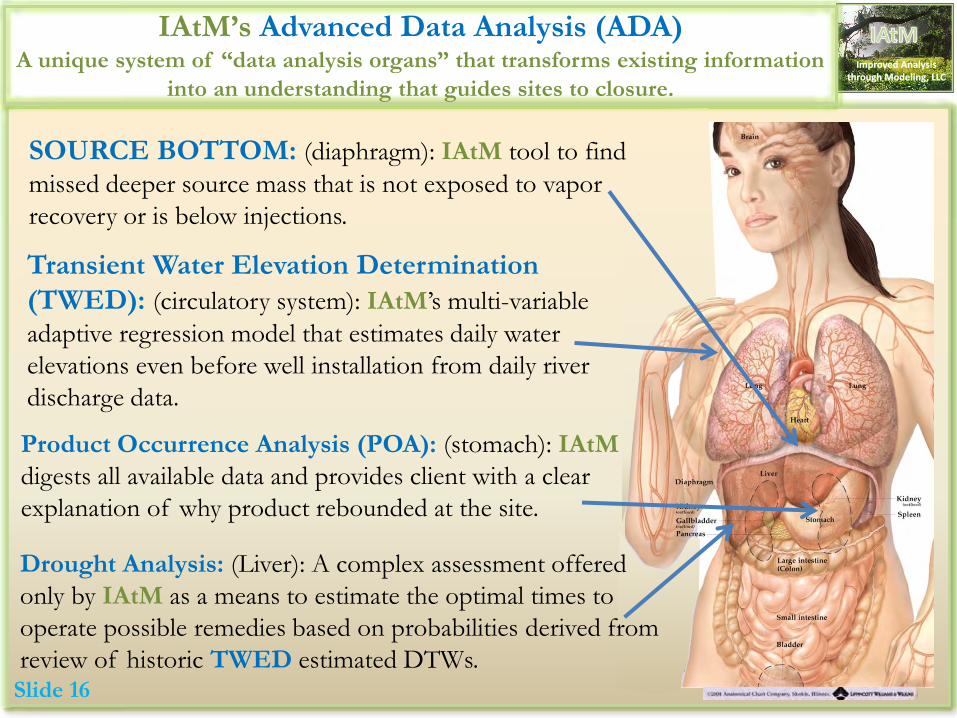
IAtM’s Advanced Data Analysis (ADA) A unique system of “data analysis organs” that transforms existing information
into an understanding that guides sites to closure.
SOURCE BOTTOM: (diaphragm): IAtM tool to find
missed deeper source mass that is not exposed to vapor
recovery or is below injections.
Transient Water Elevation Determination
(TWED): (circulatory system): IAtM’s multi-variable
adaptive regression model that estimates daily water
elevations even before well installation from daily river
discharge data.
Product Occurrence Analysis (POA): (stomach): IAtM
digests all available data and provides client with a clear
explanation of why product rebounded at the site.
Drought Analysis: (Liver): A complex assessment offered
only by IAtM as a means to estimate the optimal times to
operate possible remedies based on probabilities derived from
review of historic TWED estimated DTWs.

Slide 17 Improved Analysis
through Modeling, LLC
SOURCE BOTTOM: Observed and TWED Water Elevations from Missouri River
and Wakenda Creek at MW-6: Maximum Depth of -16 ft During Observed Period
Carrollton, MO
Source mass
indicated 14 feet
below minimum
observed water
levels

Slide 18 Improved Analysis
through Modeling, LLC
SOURCE BOTTOM: 87 Years of River Data Yields Greater Maximum Depth of
-27.1 ft Based on TWED Correlation: High PIDs at this Depth Confirm TWED
Carrollton, MO
Maximum observed product thickness at Site
would depress water levels another 2.1 feet
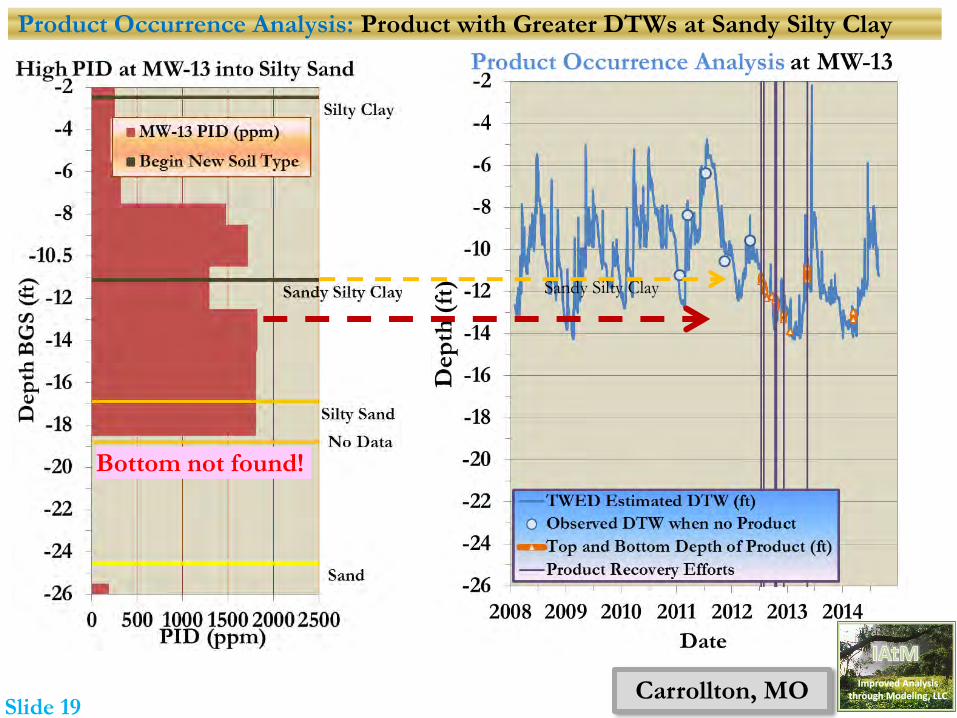
Slide 19 Carrollton, MO Improved Analysis
through Modeling, LLC
Product Occurrence Analysis: Product with Greater DTWs at Sandy Silty Clay
Sandy Silty Clay
Bottom not found!

Slide 20 Improved Analysis
through Modeling, LLC
Critical Dual-Phase Remedy Vulnerability: Deep Mass Below Remedy’s
Reach
In Between recovery/
injection wells
OutSIDE treatment
area
Deep (below
remedy's
reach)
Shallow (above
remedy's
reach)
Remedy
Inefficieny
Multiple
Releases
Dual-Phase (32
Evaluations)74% 68% 65% 13% 45% 52% 71%
Advanced Data Analysis (ADA) has Eyes to See Root Causes for Failure to
Cleanup in Nine States
Missed
Source Mass
Spatially Vertically Complications Waste (action
without
mass
reduction)
Estimated 20% of all MS sites and 40% of O&M Costs
Multiple Causes: Source Bottom Not Found During Initial
Investigation
Suggested Solution: Continue Drilling Soil Boring Until Confirmed
Significant Decline in Measured PIDs

Slide 21 Improved Analysis
through Modeling, LLC
Critical Dual-Phase Remedy Vulnerability: Deep Mass Below Remedy’s
Reach
In Between recovery/
injection wells
OutSIDE treatment
area
Deep (below
remedy's
reach)
Shallow (above
remedy's
reach)
Remedy
Inefficieny
Multiple
Releases
Dual-Phase (32
Evaluations)74% 68% 65% 13% 45% 52% 71%
Advanced Data Analysis (ADA) has Eyes to See Root Causes for Failure to
Cleanup in Nine States
Missed
Source Mass
Spatially Vertically Complications Waste (action
without
mass
reduction)
Estimated 20% of all MS sites and 40% of O&M Costs
Multiple Causes: Dual-phase unable to lower water table without
aid of pumps
Suggested Solution: If large initial product thicknesses or PIDs
below water levels, install deeper wells with pumps from start

Slide 22 Improved Analysis
through Modeling, LLC
Dual-Phase Review: Significantly More Vapor Mass Recovery Achieved After
Pumps were Added at a Bulk Plant Remediation with Submerged Product
MS Site

Slide 23 Improved Analysis
through Modeling, LLC
Critical Dual-Phase Remedy Vulnerability: Deep Mass Below Remedy’s
Reach
In Between recovery/
injection wells
OutSIDE treatment
area
Deep (below
remedy's
reach)
Shallow (above
remedy's
reach)
Remedy
Inefficieny
Multiple
Releases
Dual-Phase (32
Evaluations)74% 68% 65% 13% 45% 52% 71%
Advanced Data Analysis (ADA) has Eyes to See Root Causes for Failure to
Cleanup in Nine States
Missed
Source Mass
Spatially Vertically Complications Waste (action
without
mass
reduction)
Estimated 20% of all MS sites and 40% of O&M Costs
Multiple Causes: Natural water levels only seasonally low limits
duration of deeper mass remediation even with pumps
Suggested Solution: Perform ADA drought analysis to determine
optimal operation periods

Improved Analysis through Modeling, LLC
Drought Analysis: Based on 13 Years Most Similar to 2015 in February
through April Water Levels are Projected to be Slightly Lower this Fall
Slide 24
AI
70617
Win
nsb
oro
, L
A

Slide 25
Improved Analysis through Modeling, LLC
Drought Analysis: Activate System with New Wells by September 2015
and Operate through December then Shut Off
AI
70617
Win
nsb
oro
, L
A

Slide 26
Monitoring Program Design Flaw: Dedicated Deeper Screened Wells
Below Typical Water Level Not Installed to Monitor Deep Mass
Cause: Monitoring Wells only installed across the water table
and not with screen only below typical water levels
Suggested Solution: Include two Monitoring Wells screened below
water table in between recovery wells with deepest PID readings
Improved Analysis through Modeling, LLC
In Between recovery/
injection wells
OutSIDE treatment
area
Deep (below
remedy's
reach)
Shallow (above
remedy's
reach)
Remedy
Inefficieny
Multiple
Releases
Dual-Phase (32
Evaluations)74% 68% 65% 13% 45% 52% 71%
Advanced Data Analysis (ADA) has Eyes to See Root Causes for Failure to
Cleanup in Nine States
Missed
Source Mass
Spatially Vertically Complications Waste (action
without
mass
reduction)
Estimated 20% of all MS sites and 40% of O&M Costs

Advanced Data Analysis Evaluates an Ozone Remedy
Slide 27 Improved Analysis
through Modeling, LLC
February 2011, a PulseOx® In-situ Chemical Oxidation Ozone
Sparging Technology (Ozone system) began operating
Six months to a one year later, product was observed at MW-2
After four years of operations, benzene was monitored at 3
ppm in groundwater at MW-2 in 2014,
and TPH-G, which was monitored in the first two samples
collected at MW-2 at 150 and 170 ppm, still reported
concentrations of 150 ppm in June 2014

Slide 28
Improved Analysis through Modeling, LLC
Bottom Found
West
Mo
nro
e,
LA
H2O2 Injection
Ozone Injection
Product Occurrence Analysis (POA): Shallow Mass Suspected of
Draining During Dry Period to Yield Thin Product Layer at MW-2
What Caused Product
to Rebound?

Improved Analysis through Modeling, LLC
System Efficiency Evaluation (SEE): Clear Declining Trends for
Benzene Give the False Impression that All Remedial Goals will be Met
Slide 29
What Caused
Benzene Rebound?
West
Mo
nro
e,
LA

Improved Analysis through Modeling, LLC
SOURCE TRACKER: Rebound of Benzene at MW-2 Occurred at
Shallower DTWs; Thus, Confirming Missed Shallow Mass
Slide 30
West
Mo
nro
e,
LA

Improved Analysis through Modeling, LLC
Missed Mass
Shallow
Dual-Phase
100% of Injection
Technology problem sites
Critical Injection Technology (including ozone) Vulnerability: Mass
Above Water Table During Time of Injection
Bottom Found
H2O2 Injection
Ozone Injection
Cri
tical
Vu
lnera
bil
ity
Slide 31
142143144145146147148149150151152153154155156157158
Ele
vati
on
(ft
)
Cross-
sectional View
Upper
Layer
Inje
ctio
n

Improved Analysis through Modeling, LLC
SEE: Ozone Remedy Failed to Cause Any Reduction in Xylenes at MW-
2; Therefore, its Effectiveness is Chemical Dependent
Slide 32
Aside from increase
in Xylenes in sample
before and after
product emerged,
Xylenes is essentially
unchanged after
years of operation
West
Mo
nro
e,
LA
Improved Analysis through Modeling, LLC
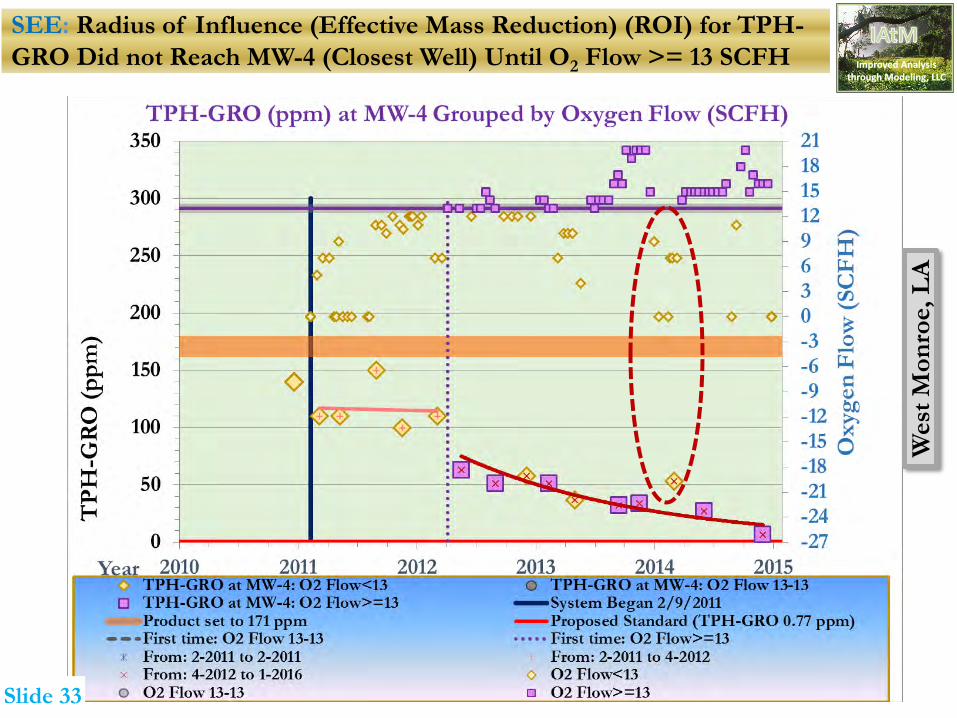
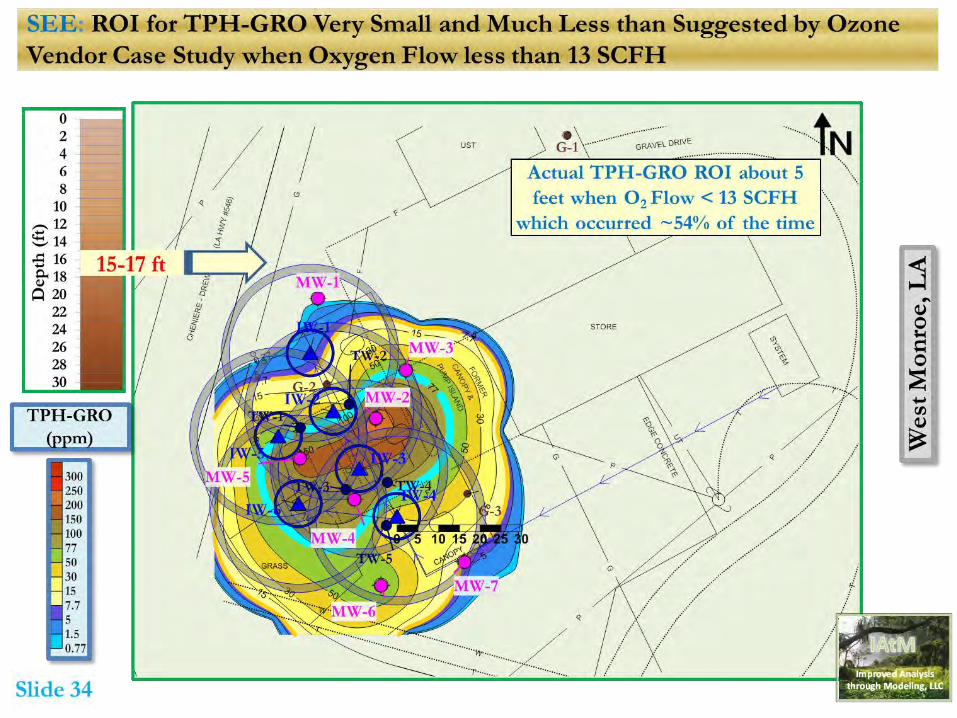
SEE: Radius of Influence (Effective Mass Reduction) (ROI) for TPH-
GRO Did not Reach MW-4 (Closest Well) Until O2 Flow >= 13 SCFH
Slide 33
West
Mo
nro
e,
LA


Improved Analysis through Modeling, LLC
Time to Standard: Estimating Time Needed to Reduce TPH-GRO at
MW-4 When O2 Flow High Enough to Reach Well
Slide 36
West
Mo
nro
e,
LA
Note:
Log
scale
Linear
Regression
Exponential
Regression
Improved Analysis through Modeling, LLC
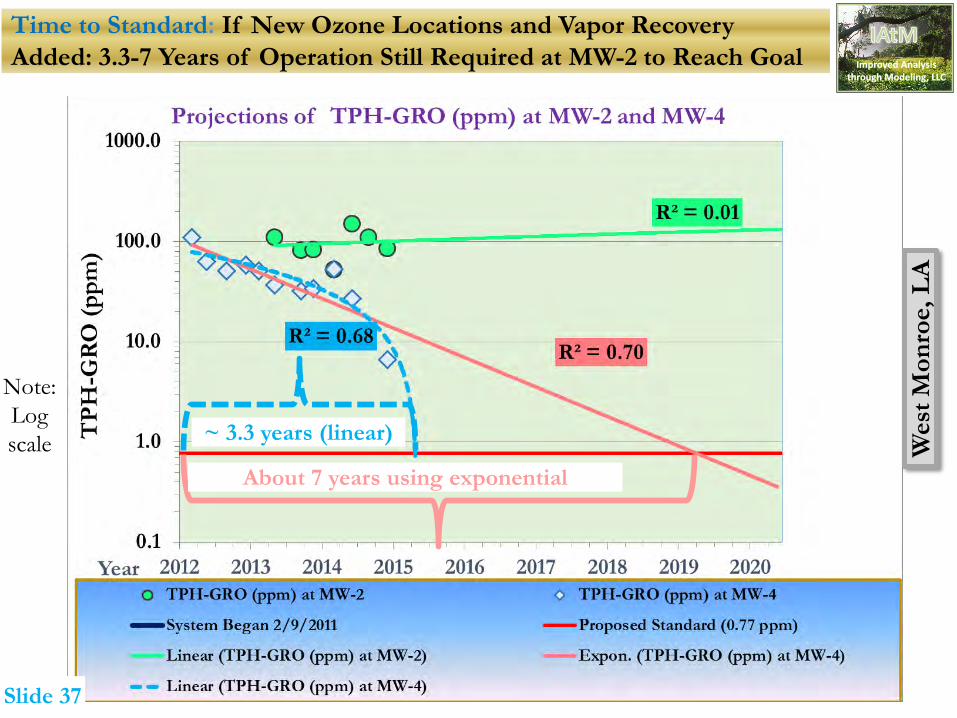
Time to Standard: If New Ozone Locations and Vapor Recovery
Added: 3.3-7 Years of Operation Still Required at MW-2 to Reach Goal
Slide 37
West
Mo
nro
e,
LA
~ 3.3 years (linear)
About 7 years using exponential
Note:
Log
scale


0.0 3.4 6.8 10.2 13.6 17.0 20.4 23.8 27.2 30.6 34.0
36
37
38
39
40
41
42
43
Groundwater Concentration (mg/L)
Dep
th (
ft)
MW-1: Maximum TPH-G/C8-C10 After SVE/AS
MW-1: Observed Maximum TPH-G/C8-C10 (mg/L) After SVE/AS Before Chem-OX
10x 20x 30x 40x 50x 60x 70x 80x 90x RS
Slide 40
Bastrop,
LA
Vadose Zone
SVE
Well
Saturated Air Sparge
SOURCE TRACKER: Concentrations by Depth
Missed Mass
Air sparge
SVE
Improved Analysis through Modeling, LLC
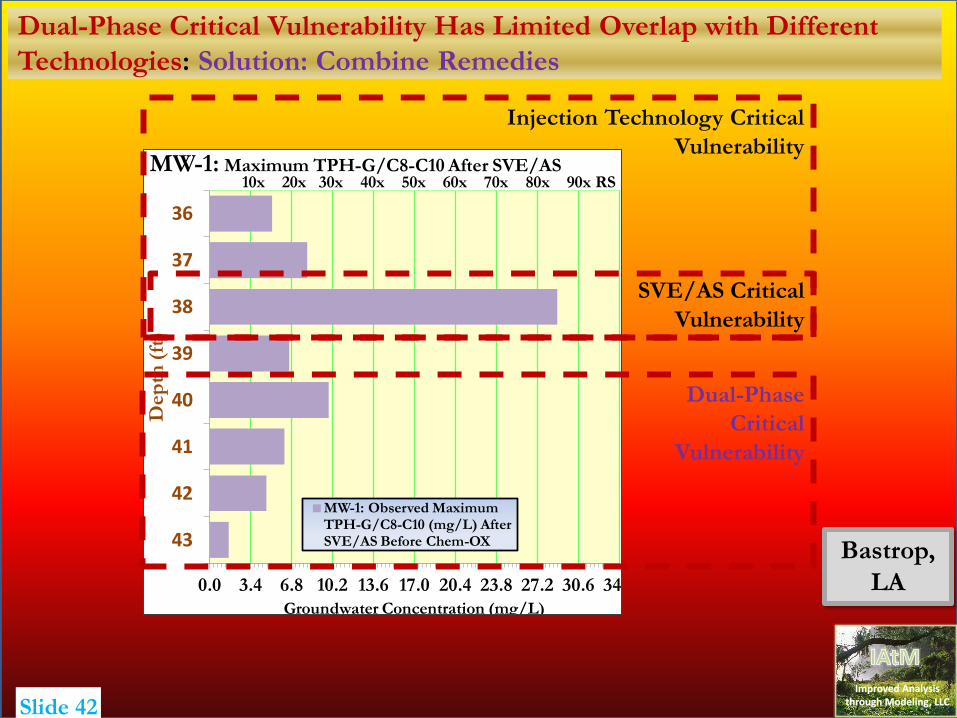
Critical SVE/AS Technology Vulnerability: Mass Below SVE Well and
Above Water Table During Time of Injection
56% of SVE/AS
problem sites
Critical
Vulnerability

Slide 41 Improved Analysis
through Modeling, LLC
Critical Dual-Phase (miss deep mass) and Injection or Air Sparging (miss
shallow mass) Vulnerabilities are vertically opposite
In Between recovery/
injection wells
OutSIDE treatment
area
Deep (below
remedy's
reach)
Shallow (above
remedy's
reach)
Remedy
Inefficieny
Multiple
Releases
Dual-Phase (32
Evaluations)74% 68% 65% 13% 45% 52% 71%
Injection (ISCO,
Ozone, Other)
(10 Evaluations)
50% 90% 10% 100% 20% 40% 80%
SVE/AS
(9 Evaluations)89% 89% 22% 56% 22% 56% 44%
Advanced Data Analysis (ADA) has Eyes to See Root Causes for Failure to
Cleanup in Nine States
Missed
Source Mass
Spatially Vertically Complications Waste (action
without
mass
reduction)
Suggested Solution: Couple dual-phase with air sparging or
injection technology during high water season
Slide 42
Bastrop,
LA
Improved Analysis through Modeling, LLC
Dual-Phase Critical Vulnerability Has Limited Overlap with Different
Technologies: Solution: Combine Remedies
0.0 3.4 6.8 10.2 13.6 17.0 20.4 23.8 27.2 30.6 34.0
36
37
38
39
40
41
42
43
Groundwater Concentration (mg/L)
Dep
th (
ft)
MW-1: Maximum TPH-G/C8-C10 After SVE/AS
MW-1: Observed Maximum TPH-G/C8-C10 (mg/L) After SVE/AS Before Chem-OX
10x 20x 30x 40x 50x 60x 70x 80x 90x RS
SVE/AS Critical
Vulnerability
Injection Technology Critical
Vulnerability
Dual-Phase
Critical
Vulnerability

Improved Analysis through Modeling, LLC
SOURCE BOTTOM: Missed Deeper Source Mass at MW-4 Prior to
ORC-A® Injections
West
Mo
nro
e,
LA
Slide 43
Bottom Found
ORC-A® Injection
Missed deeper source mass not
exposed to vapor recovery


Slide 46 Improved Analysis
through Modeling, LLC
The Complication of Multiple Releases Can Influence Site Conceptual
Model and All Remedies
In Between recovery/
injection wells
OutSIDE treatment
area
Deep (below
remedy's
reach)
Shallow (above
remedy's
reach)
Remedy
Inefficieny
Multiple
Releases
Dual-Phase (32
Evaluations)74% 68% 65% 13% 45% 52% 71%
Injection (ISCO,
Ozone, Other)
(10 Evaluations)
50% 90% 10% 100% 20% 40% 80%
SVE/AS
(9 Evaluations)89% 89% 22% 56% 22% 56% 44%
Advanced Data Analysis (ADA) has Eyes to See Root Causes for Failure to
Cleanup in Nine States
Missed
Source Mass
Spatially Vertically Complications Waste (action
without
mass
reduction)
Suggested Solution: Use ADA’s Source Release Assessment
if Multiple Releases are suspected
Estimated 16% of all MS sites and 32% of O&M Costs
Cause: Multiple releases not included in estimated source
extents used for remedial design
Slide 47 Improved Analysis
through Modeling, LLC
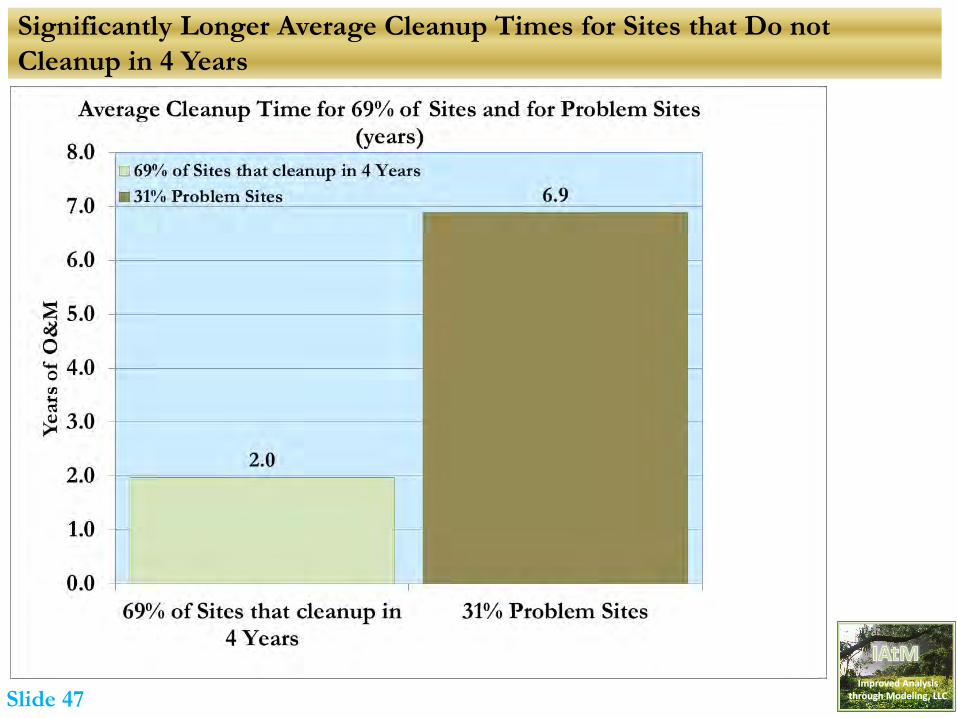
Significantly Longer Average Cleanup Times for Sites that Do not
Cleanup in 4 Years

Slide 48 Improved Analysis
through Modeling, LLC
Significantly Greater Costs for Sites that Do not Cleanup in 4 Years;
Solution: Apply ADA to Sites with exceedances after 2 to 3 years
Assumes an
average
monthly
O&M of
$8,000
53%
Chance
site will
become a
problem
site
72% Chance
site will
become a
problem site
ADA is
9.7% 2 year
O&M
or 6.5% of 3
year O&M