advanced chemical stability diagrams to predict the
TRANSCRIPT

RSC Advances
PAPER
Ope
n A
cces
s A
rtic
le. P
ublis
hed
on 2
6 Ju
ne 2
019.
Dow
nloa
ded
on 1
2/23
/202
1 3:
50:4
8 PM
. T
his
artic
le is
lice
nsed
und
er a
Cre
ativ
e C
omm
ons
Attr
ibut
ion-
Non
Com
mer
cial
3.0
Unp
orte
d L
icen
ce.
View Article OnlineView Journal | View Issue
Advanced chemic
Center for Electrochemical Science and Engi
and Engineering, University of Virginia, C
† Electronic supplementary informa10.1039/c9ra00228f
Cite this: RSC Adv., 2019, 9, 19905
Received 10th January 2019Accepted 17th June 2019
DOI: 10.1039/c9ra00228f
rsc.li/rsc-advances
This journal is © The Royal Society of C
al stability diagrams to predict theformation of complex zinc compounds ina chloride environment†
M. E. McMahon, * R. J. Santucci, Jr and J. R. Scully
A chemical stability map is advanced by incorporating ion complexation, solubility, and chemical
trajectories to predict ZnO, Zn(OH)2, ZnCO3, ZnCl2, Zn5(CO3)2(OH)6, and Zn5(OH)8Cl2$H2O precipitation
as a function of the total Zn content and pH of an NaCl solution. These calculations demonstrate
equilibrium stability of solid Zn products often not considered while tracking the consumed and
produced aqueous Zn ion species concentrations through chemical trajectories. The effect of Cl-based
ligand formation is incorporated into these stability predictions, enabling enhanced appreciation for the
local corrosion conditions experienced at the Zn surface in chloride-containing environments.
Additionally, the complexation of Cl� with Zn2+ is demonstrated to compete with the formation of solid
phases, making precipitation more difficult. The present work also extends the chemical stability diagram
derivations by incorporating a Gibbs–Thompson curvature relation to predict the effect of nanoscale
precipitate phase formation on species solubility. These thermodynamic predictions correlate well with
experimental results for Zn corrosion in full and alternate NaCl immersion, and have far-reaching utility
in a variety of fields requiring nanoscale, semiconductor, and/or structural materials.
1. Introduction
Chemical stability predictions inform decisions in the corro-sion engineering, chemical engineering, geology, soil science,energy, and biomedical elds. These technological eldsincreasingly demand the accurate understanding of chemicalsystem progression in increasingly complex conditions.1–5
Classical thermodynamic predictions of metal stability, envi-ronmental degradation, and eventual corrosion productformation have undergone extensive experimental vericationsince Marcel Pourbaix's original derivation of E–pH (chemicalstability) diagrams,2–7 however little work exists which activelyaims to further develop Pourbaix's prediction methods. Recentwork by Santucci et al.8 added to Pourbaix's chemical stabilitydiagram method by developing chemical trajectory expressionswhich track the progression of available ion content in theglobal system with respect to pH. The equilibriummetal (M) ionconcentration ([Mn+]) and pH conditions necessary for M-compound formation, as well as the changes in those condi-tions upon dissolution of the M-compound were graphicallydepicted in these improved chemical stability diagrams. Theionic concentration and pH trajectory trends were validated
neering, Department of Materials Science
harlottesville, VA 22904, USA. E-mail:
tion (ESI) available. See DOI:
hemistry 2019
through analysis of the work of Plagemann et al.,9 Lin et al.,10
and Xu et al.11 concerning previously published yet not fullyexplained experimental ndings, wherein customized chemicalstability diagrams produced thermodynamic predictions thatanswered open questions remaining from the interpretation ofpurely empirical experimental results.8 However, these analysesrequired equilibrium stability calculation for relatively simpleoxidation products whose precipitation could be predictedbased on known chemical potentials. More complex corrodingsystems that have considerable engineering relevance have yetto be fully assessed through chemical stability prediction, as thenecessary chemical potential data for such systems are notnecessarily known. Thus, these methods must be expanded inbreadth, complexity, and accuracy.
One element of increasing societal importance for materialsscience and engineering is zinc (Zn), which has been historicallyused in the design of brass alloys and for sacricial corrosionprotection. Corrosion in the Zn system has been thoroughlystudied due to the importance of this metal for cathodicprotection of steel,12 however formation of many typical andimportant Zn corrosion products are only qualitatively under-stood due to the complexity of their makeup.13 Today, Zn is alsoused in a wider variety of applications such as hazardmanagement, biomedical applications such as drug deliveryand antibiotics, as well as in electronics and data storage.14–20
Depending on the application, either metallic Zn or a specicZn corrosion product may be desired, for which the develop-ment of accurate stability/precipitation prediction methods
RSC Adv., 2019, 9, 19905–19916 | 19905

RSC Advances Paper
Ope
n A
cces
s A
rtic
le. P
ublis
hed
on 2
6 Ju
ne 2
019.
Dow
nloa
ded
on 1
2/23
/202
1 3:
50:4
8 PM
. T
his
artic
le is
lice
nsed
und
er a
Cre
ativ
e C
omm
ons
Attr
ibut
ion-
Non
Com
mer
cial
3.0
Unp
orte
d L
icen
ce.
View Article Online
would be benecial and may inform product development forlong-term use.
The complex makeup of many of the zinc compoundsrequires advancements in the derivation of expressions whichtrack the evolution of total Zn concentration ([Zn]Tot) in tandemwith pH as these compounds react electrochemically to achieveequilibrium in the aqueous phase. Complexities arise due toproton transfer reactions (as with Zn2+ + OH� and CO3
2� + H+)and complexation reactions (as with Zn2+ + Cl�). Therefore, thepresent work will quantify and predict corrosion productformation within the Zn system through thermodynamically-derived chemical stability diagrams based on known solubilityconstants that have not been broadly considered.21 The deriva-tion will include complexation effects due to chloride,hydroxide, and carbonate species as a function of bulk chem-istry. Lastly, surface effects due to precipitated solid phasecurvature will be incorporated into the method throughutilizing a Gibbs–Thompson relation, which will predict therequired conditions for spherical ZnO nanoparticle formationas a function of radius.
2. Theory/calculations
This work utilized recently developed solubility relations21 toderive chemical stability diagrams that encompass the spec-trum of experimentally observed Zn corrosion products thatform in non-sulfate-containing marine environment. Thesecorrosion products include zincite (ZnO), wulngite (Zn(OH)2,(amorphous as well as epsilon phase)), smithsonite (ZnCO3),zinc chloride (ZnCl2), simonkolleite (Zn5(OH)8Cl2$H2O), andzinc hydroxycarbonate (Zn5(CO3)2(OH)6).12,13 Previous workdemonstrated the utility of chemical stability diagrams whenderived based on thermodynamic chemical potential data,which enabled the stability prediction of relatively simplereaction products such as Mg(OH)2 or Li2CO3.8,22 In the Znsystem, however, the presence of complex corrosion productssuch as simonkolleite and zinc hydroxycarbonate require anexpansion on the previously demonstrated methods, as thechemical potentials for these complex products are not knownor easily determined.12 It is worth noting that the presentframework necessitates the use of molarity in the prediction ofthese complex Zn compounds, thus activity is not utilized inthese thermodynamic equilibrium calculations. Utilizingmolarity is of principal importance to allow for the tandemevaluation of the equilibrium boundary lines with the chemicaldissolution trajectories. Previous work has shown that activityapproaches unity in pure NaCl at concentrations increasinglyless than or increasingly greater than 1 M (with higherconcentration actually reaching unity at saturation) (see ESI,†where the reproduced data being mentioned apply only to thecase of pure NaCl).23 It is noteworthy that the Zn activity coef-cients will vary in magnitude as a function of saline concen-tration between different aqueous environments, or if differentionic species are introduced into a given environment, and thatspecic Zn ionic complexes will exhibit different activities fromone another in these scenarios. For mathematical purposes aswell as the availability of required thermodynamic data, the
19906 | RSC Adv., 2019, 9, 19905–19916
present calculations necessarily assume pure NaCl + H2O +XCO3 conditions, thus these results may be affected by theintroduction of pollutants, foreign ionic species, etc. The 0.06 MNaCl case analyzed here is the most likely to demonstratecalculation error based on known trends in activity in pure NaCl(see ESI†),23 so this concentration was chosen for experimentalvalidation, which will be detailed in an ensuing section.
2.1 Construction of equilibrium chemical stabilityboundaries: bulk formation
Baseline thermodynamic predictions in the present workneglected Cl� complexation effects, and so the calculation ofeach aqueous Zn ion's stability was necessary. The chosenenvironment was NaCl, though other Cl� environments mayalso be considered. In cases where the cation is simple and hasthe same charge and/or affinity for complexation with OH� andCl�, such as for KCl, the results of these thermodynamicpredictions will be the same until the solubility limit is reachedfor the less soluble salt. When the cation has greater charge andincreased affinity for complexation, the predictions will differfrom the NaCl scenario due to potential effects on the availablefree [Cl�], as well as effects on the activities of surroundingspecies. Lange's Handbook of Chemistry provided stabilityconstant values for the range of Zn ion species present inchloride-based, non-sulfate-containing saline environment.22
These data were utilized to create predominance diagrams forthe Zn system, which demonstrated that three zones of ionpredominance generally occur: Zn2+ (pH 9.0 and lower),Zn(OH)02 (pH 9.0 to pH 13.0), and Zn(OH)4
2� (pH 13.0 andhigher).6,12,22 Zinc predominance diagrams are common in theliterature, especially when considering nanoparticle formula-tion, and are useful to determine available ion content withinan electrochemical system as a function of pH.24–26 Thesepredominance results based on the Lange constants, whichdemonstrated Zn(OH)02 stability in the central pH region, werecompared with previous work by Pourbaix, which computeda different set of aqueous Zn ions thought at the time to bedominant (HZnO2
� was most stable in the central pH region).6
These comparisons showed good correlation between themodels, and demonstrated that, with self-consistent use ofa given thermodynamic database, use of a certain ion forrederivation of stability products (Ksp) is not necessary to yieldconsistent predictions. Corrosion product reactions were thenrederived with respect to Zn2+, Zn(OH)3
� (chosen to enable thestability prediction of Zn(OH)2 (s)), and Zn(OH)4
2�, creatingthree reactions and three Ksp values for each corrosion productwhich, when summed together, produce each equilibriumcompound stability boundary line across the entire pH range(for situations where ion complexation effects due to Cl� are notconsidered). These Ksp values are shown with respect to eachpredominant ion in Table 1. For example, in the case of theamorphous Zn(OH)2 reaction equilibrium can be establishedthrough the following routes:
(Acidic) Zn(OH)2 (s) ¼ Zn2+ (aq) + 2OH� (aq) (1)
(Near-neutral) Zn(OH)2 (s) + OH� (aq) ¼ Zn(OH)3� (aq) (2)
This journal is © The Royal Society of Chemistry 2019

Table 1 Zn-based solid corrosion product equilibrium stability constants, Ksp, and formation ratio with respect to predominance zone. a ¼ # ofavailable Zn cations required, b¼ # of available OH� species required, and c ¼ # of CO3
2� species required for corrosion product formation. Ksp
values are determined with respect to the dissolution of the compound to Zn2+, Cl�, CO32�, and OH�
Corrosion product
log(solubility product (Ksp)) for each ionpredominance zone
Species formationratio
Zn2+ Zn(OH)3� Zn(OH)2
2� a : b : c
ZnO Zincite �16.65 �2.51 1.01 1 : 2 : 0Zn(OH)2 (amorphous) Wulngite (am) �15.42 �1.28 �2.24 1 : 2 : 0Zn(OH)2 (epsilon) Wulngite (3) �17.04 �2.90 �1.62 1 : 2 : 0Zn(CO3) Smithsonite �10.92 3.22 6.74 1 : 0 : 1Zn5(CO3)2(OH)6 Zinc hydroxycarbonate �77.60 �6.90 10.70 5 : 6 : 2Zn5(OH)8Cl2$H2O Simonkolleite �73.80 �3.10 14.50 5 : 8 : 0
Table 2 Zn-based aqueous ion specific stability product constants, b,calculated based on formation from Zn2+
Zn–L ionspecies
log(stability product (b)),
b ¼ ½ZnðLÞx2�xl �½Zn2þ�½Ll��x
Zn(OH)+ 4.40Zn(OH)02 11.30Zn(OH)3
� 14.14Zn(OH)4
2� 17.66ZnCl+ 0.43ZnCl2 0.61ZnCl3
� 0.53ZnCl4
2� 0.20
Paper RSC Advances
Ope
n A
cces
s A
rtic
le. P
ublis
hed
on 2
6 Ju
ne 2
019.
Dow
nloa
ded
on 1
2/23
/202
1 3:
50:4
8 PM
. T
his
artic
le is
lice
nsed
und
er a
Cre
ativ
e C
omm
ons
Attr
ibut
ion-
Non
Com
mer
cial
3.0
Unp
orte
d L
icen
ce.
View Article Online
(Alkaline) Zn(OH)2 (s) + 2OH� (aq) ¼ Zn(OH)42� (aq) (3)
Utilizing these reactions, the solubility relation can bedetermined based on the Ksp constants in Table 1, such as foreqn (1):
log�Ksp
� ¼ log
ðZn2þÞðOH�Þ2
ZnðOHÞ2
!¼ �15:42 (4)
Derivation of the three chemical stability equations, one withrespect to each predominant aqueous Zn ion, when summedproduced a solubility-based chemical stability diagram forZn(OH)2 (am) based on the assumption that free dominant Znaq
ion availability is not limiting (always present in greater quan-tities than necessary for equilibrium corrosion product precip-itation). The method of calculating these equilibria followsfundamental solubility relations, which can be found inprevious work and elsewhere.8,22 The method of calculation andthe exact solubility relations utilized to construct the chemicalequilibrium diagrams are provided in detail in the ESI.†
In the presence of complexing species such as chloride,however, the necessary Znaq content required for unhinderedcorrosion product precipitation may not always exist, as theseligands compete for the use of this cation content throughligand formation (such as formation of ZnCl+, ZnCl3
�, etc.). Toaccount for this complexation competition, available, dominantZnaq content was quantied for each ion predominance zoneacross the pH spectrum to quantify the “actual” solubility ofeach corrosion product. In this treatment, the actual solubilityof Zn-compounds was calculated with respect to free Zn2+ bydetermining the actual [Zn2+] as a function of pH and [Cl�]. Thespecic stability constants, or b values, shown in Table 2, wereused to determine the ratio of each Zn-based ion present insolution to the total aqueous Zn concentration, [ZnTot]. Thederivation of this aqueous Zn ion availability equation isprovided in the ESI.† These equations were utilized to quantifythe ratio of free Zn2+ ion content to the total aqueous Znconcentration for the Zn2+ ion. Since the Zn2+ requirement forcorrosion product equilibrium was calculated from equationslike eqn (4), the total Znaq content required for corrosionproduct formation could be determined from this ratio.
This journal is © The Royal Society of Chemistry 2019
Chemical stability diagrams were then reconstructed to incor-porate complexation competition in this way, enabling thesediagrams to predict bulk Zn corrosion product formation undermore rigorous solubility conditions for the marine environmentof interest.
2.2 Construction of equilibrium chemical stabilityboundaries: nanoscale formation
The size scale of the corrosion product formation was alsoevaluated by incorporating the Gibbs–Thompson curvaturerelation into the chemical stability trend equations. For thispurpose, use of chemical potential was necessary instead ofsolubility, as has been practiced in previous work,6,8 whichenabled the differentiation of the bulk chemical potential fromthe curvature-dependent chemical potential for the corrosionproduct of interest:
mcurve ðconvexÞ ¼ mbulk þ2gU
r(5)
where g ¼ interfacial energy (J m�2), U ¼ molar volume (m3
mol�1), and r¼ radius of the nanosphere (m). As g andU can beexperimentally and mathematically understood, the effect ofcurvature on corrosion product stability may then be assessed atthe nanoscale. This derivation is conducted with respect toa spherical case, but these relations may be derived to consider
RSC Adv., 2019, 9, 19905–19916 | 19907

RSC Advances Paper
Ope
n A
cces
s A
rtic
le. P
ublis
hed
on 2
6 Ju
ne 2
019.
Dow
nloa
ded
on 1
2/23
/202
1 3:
50:4
8 PM
. T
his
artic
le is
lice
nsed
und
er a
Cre
ativ
e C
omm
ons
Attr
ibut
ion-
Non
Com
mer
cial
3.0
Unp
orte
d L
icen
ce.
View Article Online
more general curvature geometries also. In the case of the ZnOdissolution reaction in the Zn2+ predominance zone,
ZnO + H2O ¼ Zn2+ + 2OH� (6)
for example, the incorporation of the surface curvature wouldaffect the ZnO chemical potential component of the overallsolubility relation:
log
½Zn2þ�½OH��2
1
!
¼��ðmZn2þ þ 2mOH�Þ � �
mH2Oþ mbulk ZnO þ 2gU
r
��2:303 RT
(7)
where R is the ideal gas constant (J mol�1 K�1) and T istemperature (K). The gZnO value of 3.55 J m�2 was obtained fromtheoretical modeling literature (which does not incorporate theenvironment, but is a suitable baseline to evaluate trends instability) and describes the assumedly relaxed lattice state onthe (111) ZnO surface,27 which enabled the calculation ofa nanoscale ZnO chemical stability diagram. Use of this relationenables the derivation of chemical stability based on both“actual” solubility and surface curvature to enable thermody-namic prediction of the Zn ion concentration and pH bound-aries for ZnO nanostructure formation and dissolution.
2.3 Construction of chemical trajectory trends
The derivation of the chemical trajectory relations requiredunique expressions for each corrosion product or group ofcorrosion products having a specic and unique elementalratio. To rst quantify the ratio of produced cations and thecorresponding pH change associated with the dissolution ofeach corrosion product, consider the general Zn reaction fora simple hydroxide:
Ma(OH)b + nH+ ¼ aMn+ + bH2O (8)
where the desired cation (Mn+) to H+ ratio is a : n (the rela-tionship between metal ion charge and number of hydrogenions may require more sophisticated variable assignment inexceedingly complex reactions). Effects on chemical trajectorydue to the presence of a pH buffer have been considered andquantied in previous work.8 Aer applying the previouslydeveloped trajectory expressions to quantify the [Mn+] change asa function of pH for the corroding system,8 the followinggeneral chemical trajectory equation is produced:
log½Mnþ� ¼ log�½Mnþ�init þ
a
b
�10�pHinit � 10�pHinst
�
þ a
b
�10pHinst�14 � 10pHinit�14
��(9)
However, the effects of more complex corrosion productdissolution need to be assessed in the Zn system, in which existcomplex elemental ratios that must be accounted for. For
19908 | RSC Adv., 2019, 9, 19905–19916
instance, take the simonkolleite (Zn5(OH)8Cl2$H2O) dissolutionreaction:
Zn5OH8Cl2$H2O ¼ 5Zn2+ + 8OH� + 2Cl� + H2O (10)
In this reaction, the produced cation content must betracked according to the change in OH� or H+ concentration.During complexation competition, the available free OH�
content and its distribution between Zn(OH)+,Zn(OH)02, Zn(OH)3
�, or Zn(OH)42� will be affected by pH (Table
2). For that purpose, the fraction of hydroxylation (OH�
consumption to form aqueous OH-based complexes) thatoccurs for each released Mn+ may be tracked as f:
f ¼Pd[M(OH)dn�d]d˛[1,4] (11)
where d is the required number of OH� consumed duringhydroxylation and n is the charge of the free metal ion.When the given reaction occurs, such as simonkolleitedissolution, 8 OH� species are produced as well as 5 Zn2+
species (b ¼ 8, a ¼ 5, a : b ratio ¼ 5 : 8). The a : b ratio wouldquantify the chemical system progression ([Zn]tot) across thepH range of an Mn+–pH diagram without the complication ofspecies complexation; however, the subsequent complexa-tion of OH� species, according to the f function reduces theeffective increase in available OH� content as a function ofpH, requiring that eqn (11) incorporate such effects tobecome:
log½Mnþ� ¼ log
½Mnþ�init þ
a
b� af
�10�pHinit � 10�pHinst
�
þ a
b� af
�10pHinst�14 � 10pHinit�14
��(12)
Furthermore, the presence of carbonate species must also bequantied to establish the proper trend, as the availability ofCO3
2� is also inuenced by pH. The concentration of 5 mM waschosen for accuracy to typical atmospheric concentrations.28
While not considered here, the dissolved CO32� concentration
may vary with pH and CO2 partial pressure and is known toimpact the precipitation of various Zn corrosion products.29
Consider the dissolution of Zn hydroxycarbonate:
Zn5(CO3)2OH6 ¼ 5Zn2+ + 2CO32� + 6OH� (13)
For this reaction to occur, the availability of the pH-dependent species CO3
2� is necessary, as can be understoodthrough the following relation:
Zn(OH)f2�f + HF(CO3)c
�(2�F) ¼ Zn2+ + fOH� + cCO32�
+ FH+ (14)
where c is the required number of CO32� species. This
combined reliance on hydroxyl and carbonate species avail-ability produces the following chemical trajectory equationto quantify the progression of pH and [M+] dissolved insolution:
This journal is © The Royal Society of Chemistry 2019

Paper RSC Advances
Ope
n A
cces
s A
rtic
le. P
ublis
hed
on 2
6 Ju
ne 2
019.
Dow
nloa
ded
on 1
2/23
/202
1 3:
50:4
8 PM
. T
his
artic
le is
lice
nsed
und
er a
Cre
ativ
e C
omm
ons
Attr
ibut
ion-
Non
Com
mer
cial
3.0
Unp
orte
d L
icen
ce.
View Article Online
log½Mnþ� ¼ log
½Mnþ�init þ
a
bþ cF � af
�10�pHinit � 10�pHinst
�
þ a
bþ cF � af
�10pHinst�14 � 10pHinit�14
�
þ" �
CO32��
init
bþ cF � af
�G
CO32�
inst � GCO3
2�init
�#!(15)
where GCO32�
quanties the fraction of available CO32� in
a similar fashion as eqn (11). For the calculation of theremaining chemical trajectories necessary to describe thecorroding Zn system, the a : b : c ratio for each Zn corrosionproduct is included in Table 1. Together, these trend relationsenable the tracking of the available aqueous Zn ion concentra-tion from an initial pH/available CO3
2� condition in consider-ation OH�- and Cl�-based ligand formation.
3. Experimental methods
Titration testing was conducted in 0.06 M NaCl solution at theZn2+ concentrations of 10�3 M and 10�6 M to assess the accu-racy of the chemical stability diagram where the differencebetween activity and concentration would be highest (comparedto the 5.45 M [NaCl] scenario). Experiments were conductedwith actively stirred 10�3/10�6 M [Zn2+], 0.06 M [NaCl] solutionwhile actively measuring the pH. Titrant made of the samesolution plus several mL of NaOH to reach pH of approximately13 (above the stable region of solid Zn corrosion productformation) was added in 25 mL increments. Following 1 minuteof mixing aer each titration, the presence or absence of solidZn corrosion product was noted, for comparison to thermody-namic predictions.
Fig. 1 Speciation diagram depicting the fractional distribution of various Zthis case 5.45 M [Cl�]. Included is the function (dashed line) which describZn2+ to the system, as a function of pH. Transition points are marked by veThis system neglects carbonates.
This journal is © The Royal Society of Chemistry 2019
4. Results4.1 Ion predominance and chemical stability as a functionof bulk environment
To begin to develop amore inclusive chemical stability diagram forthe Zn system, the regions and type of Zn ion species predomi-nance must be understood based on the spectrum of Zn ionsknown to occur in a given solution. Consider a non-sulfate-containing chloride environment where Zn2+ is provided by anydissolution process thatmay occur during corrosion, drug delivery,Zn-rich coating depletion, oxide degradation, etc. The pertinentions are listed in Table 2. The state of chloride saturation at 5.45Mconcentration was rst assessed to evaluate predominance, asshown in Fig. 1. These diagrams are marked by threshold pHvalues at which a transition in the dominant, aqueous Zn ionspecies occurs. At this high chloride content, the ZnCl4
2� iondominates from pH �1.0 to 9.8 followed by Zn(OH)02 dominatingfrom pH 9.8 to 10.9, and lastly Zn(OH)4
2� dominates from pH 10.9to 16.0. Similar Zn ion predominance diagrams have been previ-ously produced in the literature for corrosion analysis at variousxed [Cl�] or [CO3
2�], many of which utilize the programMedusa-Hydra.30–34 However, these predominance diagrams are oenunderutilized and are not typically used to produce even basicchemical stability diagrams. As shown on the right y-axis in Fig. 1,the coordination of the dominant hydroxide species increases withincreasing overall amount of consumed hydroxyl ions (andincreasingly alkaline pH). To evaluate the effect of the chloridecomplexation further, ion predominance was calculated at thedilute condition of 0.06 M, as shown in Fig. 2. In the substantiallyreduced presence of Cl� the Zn2+ ion now dominates in the acidicregion to a pH of 8.3. However, the neutral and alkaline regionsremain unchanged, as transition between these aqueous ionpredominance regions remains at a pH of 10.9 and both theZn(OH)02 and Zn(OH)4
2� continue to dominate (Fig. 2). As can be
n-based species as a function of pH for a given ligand concentration, ines the number of OH�which would be consumed upon the addition ofrtical black lines where the dominant aqueous Zn ion identity changes.
RSC Adv., 2019, 9, 19905–19916 | 19909

Fig. 2 Speciation diagram depicting the fractional distribution of various Zn-based species as a function of pH for a given ligand concentration, inthis case 0.06M [Cl�]. Included is the function (dashed line) which describes the number of OH�which would be consumed upon the addition ofZn2+ to the system, as a function of pH. Transition points are marked by vertical black lines where the dominant aqueous Zn ion identity changes.This system neglects carbonates.
RSC Advances Paper
Ope
n A
cces
s A
rtic
le. P
ublis
hed
on 2
6 Ju
ne 2
019.
Dow
nloa
ded
on 1
2/23
/202
1 3:
50:4
8 PM
. T
his
artic
le is
lice
nsed
und
er a
Cre
ativ
e C
omm
ons
Attr
ibut
ion-
Non
Com
mer
cial
3.0
Unp
orte
d L
icen
ce.
View Article Online
seen in the total hydroxyl consumption, the chloride content doeshave some measurable impact on the hydroxide formation atneutral pH. As the more dilute conditions are common andchloride concentrations of approximately 2 M are necessary beforethe Zn2+ ion no longer dominates in the acidic region, thepredominant ions pertinent to the dilute scenario will be mainlyconsidered for recalculation of corrosion product solubility rela-tions to derive the chemical stability diagrams.
As a baseline, the Zn chemical stability diagram for saturatedchloride conditions (5.45 M) was rst developed neglecting Cl�
complexation effects (no limitation on available Znaq content),as shown in Fig. 3 zoomed in to focus on the key pH range of 3.0
Fig. 3 Chemical stability diagram for the Zn–water system. Relevantspecies are given for exposure in a Cl� (5.45 M) and CO3
2� (5.00 mM)containing environment. This diagram does not include the effect ofligand complexation due to the presence of Cl�.
19910 | RSC Adv., 2019, 9, 19905–19916
to 15.0. The exact chemical reactions necessary to constructFig. 3, as well as the chemical stability diagrams to follow, canbe found in the ESI.† Analyses of solid Zn corrosion productstability with respect to pH are present in the literature forsimple Zn-based corrosion products, but not for complexproducts such as Zn5(CO3)2(OH)8 and Zn5(OH)8Cl2$H2O.6,35 Atthese high chloride concentrations for a xed dissolvedcarbonate content of 5 mM, ZnCO3 is the most readily formedcorrosion product from pH 4.0 to 7.8, followed by Zn5(CO3)2(-OH)8 from a pH of 7.8 to 10.8, and lastly Zn(OH)2 (epsilon) frompH 10.2 to 15.0. These corrosion products require small Znconcentrations to form under these conditions, with the lowestrequirement being approximately 8 � 10�9 M and 6 � 10�8 MZnaq for Zn5(CO3)2(OH)8 and Zn(OH)2/ZnCO3 at pH 9.2,respectively. However, the condition of plentiful free Zn2+
content for corrosion product formation is unlikely, and freeZn2+ ion limited conditions must be quantied to more accu-rately predict corrosion product formation.
4.2 Chemical stability as a function of bulk environmentand complexation competition
For the same saturated chloride (5.45 M) condition, the Znchemical stability diagram was then recalculated to include theeffects of ion complexation, as shown in Fig. 4. Also included inFig. 4 are the chemical trajectories (Mn+, pH) to track the [ZnTot]progression of the system from an initial pH of 7 if Zn2+ wereadded to the solution via dissolution of the various compounds.Separate trajectory lines are necessary for each elemental ratiorequired to form the associated corrosion products (Table 1),thus the line color for the trajectories matches that of theassociated corrosion product equilibrium stability line. Forexample, the orange chemical trajectory corresponds to theorange equilibrium chemical stability curve for ZnCO3, whichhas the unique a : b : c of 1 : 0 : 1 (Table 1). A unique case exists
This journal is © The Royal Society of Chemistry 2019

Fig. 4 Chemical stability diagram for the Zn–water system. Relevantspecies are given for exposure in a Cl� (5.45 M) and CO3
2� (5.00 mM)containing environment. This diagram includes the effect of ligandcomplexation with Cl� on the stability of the zinc compounds.Included are chemical dissolution trajectories which describe how thesolution chemistry progresses after assuming some initial condition(pH ¼ 7, [ZnTot] ¼ 10�8) to a final equilibrium condition (where thetrajectory line intersects an equilibrium line). The trajectory line colormatches that of the compound being tracked with respect toconcentration and pH (black corresponds to the trajectory lineinvolving both Zn(OH)2 and ZnO due to the expense of their trajectorybeing the same (Table 1)). Note the incorporation of ligand complex-ation effects due to the presence of Cl�.
Fig. 5 Chemical stability diagram for the Zn–water system. Relevantspecies are given for exposure in a Cl� (0.06 M) and CO3
2� (5 mM)containing environment. This diagram includes the effect of ligandcomplexation on the stability of the zinc compounds. Included arechemical dissolution trajectories which describe how the solutionchemistry progresses to some initial condition (pH ¼ 7, [ZnTot] ¼ 10�8)to a final equilibrium condition (where the trajectory intersects anequilibrium line). The trajectory line color matches that of thecompound being tracked with respect to concentration and pH (blackcorresponds to both Zn(OH)2 and ZnO due to the expense of theirtrajectory being the same (Table 1)). For 10�3 M and 10�6 M aqueousZn concentration, titration data are overlaid with the model predic-tions, where (,) means completely solubilized and (-) means thatsolid Zn corrosion product formed.
Paper RSC Advances
Ope
n A
cces
s A
rtic
le. P
ublis
hed
on 2
6 Ju
ne 2
019.
Dow
nloa
ded
on 1
2/23
/202
1 3:
50:4
8 PM
. T
his
artic
le is
lice
nsed
und
er a
Cre
ativ
e C
omm
ons
Attr
ibut
ion-
Non
Com
mer
cial
3.0
Unp
orte
d L
icen
ce.
View Article Online
for Zn(OH)2 and ZnO, since both have a : b : c of 1 : 2 : 0 (Table1), thus the single chemical trajectory associated with thechemical stability curves for Zn(OH)2 and ZnO is shown inblack. The point of intersection between these chemicaltrajectories and the relevant equilibrium stability line has beencircled to indicate the total aqueous Zn concentration and pHrequired for equilibration of each corrosion product. It isrecognized that the equilibrium conditions may be met for theformation of a more stable compound upon the dissolution ofa less stable compound, resulting in compound transformationover time. As can be readily observed in Fig. 4, the inclusion ofcomplexation effects due to Cl� and OH� on corrosion productstability causes an increase in the required total aqueous Zncontent of two orders of magnitude to reach and establishequilibrium, and the chemical stability trends all shi towardsmore alkaline pH values. Chemical stability diagrams for the Znsystem that incorporate ligand complexation effects exist spar-ingly in the literature, such as in Tay et al.,35 which considersonly OH� complexation effects on aqueous Zn ion availability.However, no Zn stability diagrams exist to predict thecomplexity of corrosion products shown here, nor do any worksconsider Cl� and OH� complexation in a CO3
2�-containingenvironment, and none exist which also track such a complexsystem state via chemical trajectories. As shown in Fig. 4, ZnCO3
remains the most readily formed corrosion product from pH 6.0to 7.8 when Cl� complexation is considered, followed by
This journal is © The Royal Society of Chemistry 2019
Zn5(CO3)2(OH)8 from a pH of 7.8 to 10.8, and lastly Zn(OH)2(epsilon) from pH 10.2 to 13.7. At the point of least Zn contentrequirement for formation at pH 10.2, Zn5(CO3)2(OH)6 andZn(OH)2 (epsilon) require approximately 1 � 10�6 M and 2 �10�6 M [ZnTot]. The chemical trajectories for each corrosionproduct are relatively similar despite considerable differencesin elemental ratios required to form the range of products.
The effect of the chloride content and complexation was thenre-evaluated by recalculating the chemical stability diagram fora dilute chloride concentration of 0.06 M at xed dissolvedcarbonate concentration of 5 mM, as shown in Fig. 5. The rstreadily observed changes in the chemical stability trends arethat the ZnO and Zn(OH)2 trends atten in the neutral region,and the minima in zinc ion concentration required to reachequilibrium of the carbonate-/chloride-containing corrosionproducts shi towards pH of �8.5. Under these dilute chlorideconditions these minima also decrease the Zn ion requirementfor equilibrium by half an order of magnitude. The combinationof these changes causes intersection of the Zn5(CO3)2(OH)6 andZn(OH)2 (epsilon) stability curves with the chemical trajectorytrends near their minima, suggesting that formation of thesephases may occur at increasingly lower [ZnTot] until an initialpH of approximately 8 in the bulk system. The experimentaltitration results are overlaid with the thermodynamic predic-tions in Fig. 5 for the [ZnTot] of 10
�3 M and 10�6 M. For the
RSC Adv., 2019, 9, 19905–19916 | 19911
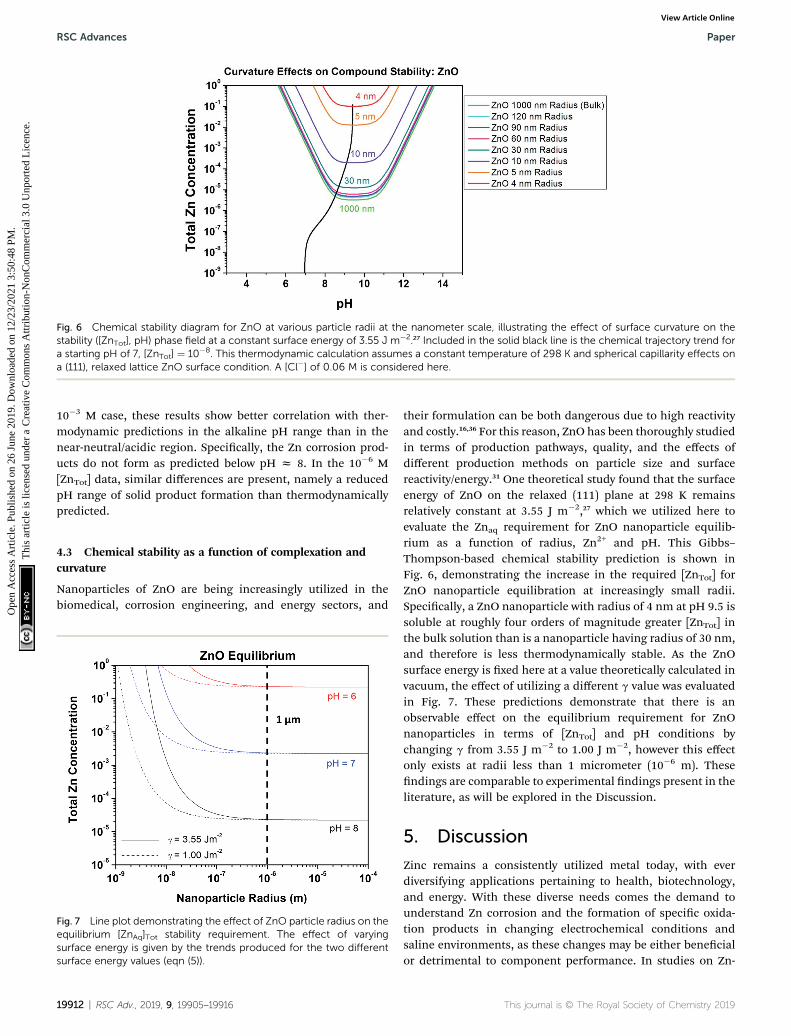
Fig. 6 Chemical stability diagram for ZnO at various particle radii at the nanometer scale, illustrating the effect of surface curvature on thestability ([ZnTot], pH) phase field at a constant surface energy of 3.55 J m�2.27 Included in the solid black line is the chemical trajectory trend fora starting pH of 7, [ZnTot] ¼ 10�8. This thermodynamic calculation assumes a constant temperature of 298 K and spherical capillarity effects ona (111), relaxed lattice ZnO surface condition. A [Cl�] of 0.06 M is considered here.
RSC Advances Paper
Ope
n A
cces
s A
rtic
le. P
ublis
hed
on 2
6 Ju
ne 2
019.
Dow
nloa
ded
on 1
2/23
/202
1 3:
50:4
8 PM
. T
his
artic
le is
lice
nsed
und
er a
Cre
ativ
e C
omm
ons
Attr
ibut
ion-
Non
Com
mer
cial
3.0
Unp
orte
d L
icen
ce.
View Article Online
10�3 M case, these results show better correlation with ther-modynamic predictions in the alkaline pH range than in thenear-neutral/acidic region. Specically, the Zn corrosion prod-ucts do not form as predicted below pH z 8. In the 10�6 M[ZnTot] data, similar differences are present, namely a reducedpH range of solid product formation than thermodynamicallypredicted.
4.3 Chemical stability as a function of complexation andcurvature
Nanoparticles of ZnO are being increasingly utilized in thebiomedical, corrosion engineering, and energy sectors, and
Fig. 7 Line plot demonstrating the effect of ZnO particle radius on theequilibrium [ZnAq]Tot stability requirement. The effect of varyingsurface energy is given by the trends produced for the two differentsurface energy values (eqn (5)).
19912 | RSC Adv., 2019, 9, 19905–19916
their formulation can be both dangerous due to high reactivityand costly.16,36 For this reason, ZnO has been thoroughly studiedin terms of production pathways, quality, and the effects ofdifferent production methods on particle size and surfacereactivity/energy.31 One theoretical study found that the surfaceenergy of ZnO on the relaxed (111) plane at 298 K remainsrelatively constant at 3.55 J m�2,27 which we utilized here toevaluate the Znaq requirement for ZnO nanoparticle equilib-rium as a function of radius, Zn2+ and pH. This Gibbs–Thompson-based chemical stability prediction is shown inFig. 6, demonstrating the increase in the required [ZnTot] forZnO nanoparticle equilibration at increasingly small radii.Specically, a ZnO nanoparticle with radius of 4 nm at pH 9.5 issoluble at roughly four orders of magnitude greater [ZnTot] inthe bulk solution than is a nanoparticle having radius of 30 nm,and therefore is less thermodynamically stable. As the ZnOsurface energy is xed here at a value theoretically calculated invacuum, the effect of utilizing a different g value was evaluatedin Fig. 7. These predictions demonstrate that there is anobservable effect on the equilibrium requirement for ZnOnanoparticles in terms of [ZnTot] and pH conditions bychanging g from 3.55 J m�2 to 1.00 J m�2, however this effectonly exists at radii less than 1 micrometer (10�6 m). Thesendings are comparable to experimental ndings present in theliterature, as will be explored in the Discussion.
5. Discussion
Zinc remains a consistently utilized metal today, with everdiversifying applications pertaining to health, biotechnology,and energy. With these diverse needs comes the demand tounderstand Zn corrosion and the formation of specic oxida-tion products in changing electrochemical conditions andsaline environments, as these changes may be either benecialor detrimental to component performance. In studies on Zn-
This journal is © The Royal Society of Chemistry 2019

Paper RSC Advances
Ope
n A
cces
s A
rtic
le. P
ublis
hed
on 2
6 Ju
ne 2
019.
Dow
nloa
ded
on 1
2/23
/202
1 3:
50:4
8 PM
. T
his
artic
le is
lice
nsed
und
er a
Cre
ativ
e C
omm
ons
Attr
ibut
ion-
Non
Com
mer
cial
3.0
Unp
orte
d L
icen
ce.
View Article Online
rich primers (ZRPs), for instance, not only are certain productssuch as Zn5(CO3)2(OH)6 known to be more passivating andprotective than others,13 but each corrosion product will alsohave a characteristic volume increase associated with itsformation that is known to affect coating porosity, Zn pigmentconnectivity, and the electrolyte ingress necessary for pigmentactivation to achieve effective corrosion protection on vitalalloys such as steel.13,37–43 Comparison of the present modelingresults with experimental ndings on Zn in the literature willenlighten the reader as to the accuracy and utility of these newdevelopments to advance the scope of the chemical stabilitydiagram. Furthermore, comparison will be drawn from the widespectrum of literature on ZnO nanoparticle formation19,31,36,44 todiscuss the potential for utilizing the Gibbs–Thompson reder-ivation of the ZnO chemical stability diagram.
Titration results provided initial insight into the utility of thepresent thermodynamic calculations to predict solid Zn-basedcorrosion product formation in NaCl. In order to furtherunderstand the utility of the presently developed chemicalstability diagram methods, a thorough literature review willdemonstrate notable experimental results and trends for thepure Zn system. Experimental studies demonstrate that Zncorrosion is largely dictated by anionic surface chemistry andbulk pH conditions, and that reaction kinetics play a signicantrole only in select situations, which suggests that chemicalstability diagrams could be a valuable predictive tool whenaccurately applied to the Zn system.12,30,45,46 At pH lower than 5.0or higher than 13.5, little to no corrosion product formationtypically occurs on Zn.12,47 At more intermediate pH values,experimental results have shown that Zn easily forms carbonatespecies, as dictated by the absorption and presence of CO3
2� inthe electrolyte.13,45 These ndings on pure Zn agree with alter-nate immersion studies on ZRPs, which nd an increasingpresence of CO3-containing Zn corrosion product formationwith increased drying time (and thus increasing concentrationof dissolved CO3
2� in the surface lm).13,37 Ohtsuka and Mat-suda demonstrated through use of in situ Raman spectroscopythat ZnO and Zn(OH)2 (epsilon) readily form on the Zn surfaceduring dry air exposure, and as the relative humidity (RH) isincreased to 75% Zn5(CO3)2(OH)6 also forms.37 At continuousRH of 80% or more, only Zn5(OH)8Cl2$H2O and aqueousZnCl02 formation occur on the Zn surface.37 When drying cyclesare introduced intermittent to the establishment of 88% RH,a combination of ZnO, Zn5(CO3)2(OH)6, Zn5(OH)8Cl2$H2O, andaqueous ZnCl02 are found on the Zn surface, with the amount ofZn5(CO3)2(OH)6 increasing as greater drying to wetting ratio wasallowed.37 Mouanga et al. and Ligier et al. also demonstratedthat Zn5(CO3)2(OH)6 and Zn5(OH)8Cl2$H2O were the majorcorrosion products formed on pure Zn following atmosphericexposure in dilute chloride, which is supported in the literatureby the known transformation of Zn(OH)2/ZnO to these morecomplex products as a function of dissolved carbonatecontent.13,48 In agreement with these proposed mechanisms,Marchebois et al. demonstrated that the formation of ZnOoccurs quickly on pure Zn in full simulated seawater immer-sion, followed by the formation of increasing amounts ofZn5(OH)8Cl2$H2O with time.40 The presently developed Zn
This journal is © The Royal Society of Chemistry 2019
chemical stability diagrams predict many of these experimentalresults and demonstrate strong utility for thethermodynamically-dictated Zn system.
Chemical stability diagrams are based on thermodynamicstability and cannot communicate the inuence of kinetics inthe formation of Zn corrosion products. However, crosscomparison of these diagrams with the extensive experimentalevidence present in the literature can suggest the utility of thesediagrams where stability, rather than kinetics, is dominant, andcan infer where the electrochemical kinetics may be necessaryto obtain the equilibrium Zn concentration. Fig. 5 demonstratesthat during dilute chloride immersion of the Zn surface, theformation of any Zn corrosion products outside of the pH valuerange of 4.5 to 13.5 would require 1 or more moles of aqueousZn content. The low probability of such a high Zn ion concen-tration being present agrees with the experimental ndingsshowing that little to no corrosion product forms outside the pHrange of 5.0 to 13.5.47 In dilute alkalinity, such as in theconditions which may occur where low RH is present, Fig. 5predicts the formation of Zn(OH)2 (epsilon) followed by ZnO.This prediction is in agreement with Ohtsuka and Matsuda.37
However, the dominance of ZnO formation with increasingexposure time suggests that Zn(OH)2 (epsilon) is affected moreby kinetic limitations such that ZnO is more readily formed.Additionally, it is possible that the assumed thermodynamicvariables utilized here may not accurately reect experiment, asthe conventional chemical potential for NiO was recentlyrevisited using rst-principle modelling.7 When RH < 80% ispresent, Zn5(CO3)2(OH)6 coexists with ZnO and Zn(OH)2 in thepresence of NaCl salt, which directly agrees with Fig. 5 at pH of10.7 or less. The acidication of the chloride solution to achievepH less than 10.1 would agree with the known effects ofatmospheric CO2 aqueous absorption to form carbonic acid,known on a large scale as the ocean acidication process.28
When utilizing the chemical trajectory trends from the examplestarting condition of pH 7.0, the Zn(OH)2 (epsilon)/ZnOformation (solid black trajectory line) would begin at morealkaline pH (8.30/8.55) than the formation of Zn5(CO3)2(OH)6(solid red trajectory line) (pH 8.00). Given a condition of suffi-cient wetting to increase [Cl�], the Zn(OH)2 (epsilon), ZnO, andZn5(CO3)2(OH)6 trends would shi slightly towards more alka-line values and Zn5(OH)8Cl2$H2O formation would more readilyoccur (Fig. 4). These trends are also in agreement with theresults of Ohtsuka and Matsuda, wherein increased RH causedthe stabilization of aqueous ZnCl02 and Zn5(OH)8Cl2$H2O in thethin lm.37 As illustrated in Fig. 1, aqueous ZnClx speciespredominate at pH 9.8 or less in conditions of high [Cl�], and insaturated NaCl conditions Fig. 4 would predict that Zn5(OH)8-Cl2$H2O stability would be reached prior to Zn(OH)2 (epsilon)/ZnO equilibration at pH 9.0 or less. Specically, recalculationof these ion predominance relations demonstrates that aqueousZnCl02 is the most abundant species when [Cl�] is between 0.7 Mand 1.2 M.
The thermodynamic predictions presented here also corre-late well with long-term, controlled atmospheric exposureresults on pure Zn where the [Cl�] and/or [CO3
2�] were limited.Qu et al. deposited dilute amounts of NaCl on the Zn surface
RSC Adv., 2019, 9, 19905–19916 | 19913

RSC Advances Paper
Ope
n A
cces
s A
rtic
le. P
ublis
hed
on 2
6 Ju
ne 2
019.
Dow
nloa
ded
on 1
2/23
/202
1 3:
50:4
8 PM
. T
his
artic
le is
lice
nsed
und
er a
Cre
ativ
e C
omm
ons
Attr
ibut
ion-
Non
Com
mer
cial
3.0
Unp
orte
d L
icen
ce.
View Article Online
and held 80% RH using puried water vapor and air for 25hours, which resulted in the formation of ZnO and Zn5(OH)8-Cl2$H2O.49 Svensson and Johansson performed similar experi-ments on pure Zn but for 420 hours at 70% RH, and onlyZn5(OH)8Cl2$H2O was observed through X-ray diffractionregardless of the amount of NaCl deposited on the Zn surfaceprior to exposure.50 In light of the known transformation ofZnO/Zn(OH)2 with increasing exposure time, these results agreewell with Fig. 5 for the initial pH of 7 due to the lack ofcarbonate species introduced during these experiments.Specically, these thermodynamic predictions would dictatethat ZnO would begin to form at pH of 8.5 and [Znaq] of 6 �10�6 M, while Zn5(OH)8Cl2$H2O formation would requirehigher concentration, [Znaq] of 1 � 10�5 M, at pH 8.5. In thecase of Svensson and Johansson, additional salt deposition at75% RH would increase [Cl�] towards saturation, which wouldexplain the dominance of the Zn5(OH)8Cl2$H2O formation; as[Cl�] increases, Zn5(OH)8Cl2$H2O becomes more stable thanZnO at pH below 10.0 as seen in the high [Cl�] case of Fig. 4.50
Ligier et al. evaluated pure Zn corrosion product formationfollowing exposure to simulated atmospheric electrolytes con-taining 5 � 10�3 M NaHCO3/1 � 10�3 H2O2 and 2 � 10�1 MNaCl/5 � 10�3 NaHCO3/1 � 10�3 M H2O2 for 4 days, anddemonstrated that the amount of Zn5(CO3)2(OH)6 formed on Zndepends on the [Cl�] concentration, as Zn5(OH)8Cl2$H2Oformation quickly dominates.13 These results do not correlatewell with the dilute [Cl�] or saturated [Cl�] prediction shown inFig. 4 and 5 for an initial pH of 7, suggesting that kineticlimitations may have more effect in Zn5(CO3)2(OH)6 than inZn5(OH)8Cl2$H2O formation; perhaps with a difference inCO3
2�/Cl� diffusivity. None of the aforementioned atmosphericexposures resulted in the formation of ZnCO3, despite thiscorrosion product being the most stable from pH 4.0 to 7.7 indilute chloride and from pH 5.7 to 7.8 in saturated chlorideconditions (Fig. 4 and 5). However, the 13–16 year marineexposures conducted on pure Zn by de la Fuente et al. demon-strate ZnO, ZnCO3, and Zn5(OH)8Cl2$H2O formation, suggest-ing that either the previous experiments did not reachsufficiently low pH or that ZnCO3 has slow formation kinetics.51
The present diagrams focus solely on a chloride-based salineenvironment with equilibrium carbonate concentration of5mM (adjustable to consider more dilute cases), which does notinclude the effects of impurities present in the electrolyte suchas sulfur, less common corrosion product formation, orchanging temperature (all calculations done at 25 �C) (for moredetail on the assumptions see the ESI†). However, furtheradvancement of these diagrams to incorporate such effects willprove useful for predicting Zn corrosion in unique settings,such as for the design of effective cathodic protection systems.Modern developments in the use of ZnO have produced a muchwider spectrum of uses for this material, however, in which thechemical stability diagram based on the Gibbs–Thompsonrederivation may also prove useful to predict performance.
Zinc oxide has the unique duality of a large direct band gapand the ability to form nanostructures, making the applicationsfor this material far-reaching: ranging from drug delivery andcancer therapy to piezoelectric power generation and
19914 | RSC Adv., 2019, 9, 19905–19916
spintronics.31 Considerable research has been dedicated toexpanding the growth and production procedures as well as todiscover new applications for ZnO, especially when used in theform of nanoparticles and nanorods.31,35,44 Such research ismotivated by the strong tunability of the size, shape, andmorphology of ZnO crystals in solutions such as ZnAc2.31,35
Specically, in this solution the ZnO size, density, growthuniformity, and crystal morphology may be tuned via control ofthe ZnAc2 concentration and the solution pH through additionor subtraction of NH4OH.31 Despite the typical use of organicsolutions to contain the ZnO formation reactions, common ZnOgrowth trends exist that enable correlation with the presentthermodynamic analysis in aqueous Cl-based environment.
Fig. 6 demonstrates the concept of the curvature-dependentchemical stability diagram derivation in NaCl for comparison tothe bulk thermodynamic predictions shown in Fig. 3–5,demonstrating that as much as 5 orders of magnitude increasein aqueous Zn concentration is necessary for ZnO to be ther-modynamically stable in Cl-containing environment atincreasing nanoscale size, from the bulk (greater than 1micrometer) to 4 nm particle radius. These predictions alsodemonstrate that the dependence of ZnO solubility on surfacecurvature is greater than the effect of [Cl�] complexation, whichis supported by the results of ZnO synthesis studies utilizingvarious ZnO precipitation methods in non-chloride-containingsolutions. Moazzen et al. observed that the average ZnO nano-particle size produced in Zn acetate dihydrate + sodiumhydroxide solution increased as the ratio of Zn acetate dihydrateto sodium hydroxide was decreased from 1 : 1 (20 nm ZnOparticle size) to 1 : 4 (36 nm ZnO particle size).52 When hydro-thermally growing ZnO nanorods in Zn acetate and ammonia,Tay et al. observed increasingly smaller, denser ZnO nanorodsforming as the Zn acetate concentration was increased fora given concentration of ammonia following three hours at 370K.35 Tay et al. utilized curvature relations based in nucleationtheory as well as a basic Zn chemical stability diagram predic-tion to support and explain these ndings, which arrived atsimilar conclusions as seen here.35 Recent work in lead-basedsystems has demonstrated utility of curvature-based solubilityrelationships for determining nanoparticle formation as well.53
These results also illuminate the effect of surface energy on thestability of capillary-affected surfaces. Fig. 7 illustrates thatlarger concentrations of aqueous Zn are indeed for surfaceswith higher surface energy. The curvature-dependent derivationillustrated here may easily be expanded to offer further insightinto mechanisms underlying ZnO growth in more favorable andeconomically viable media (out of the scope of the presentwork), especially as the solubility constants necessary for suchmathematical constructs are increasingly available for the Znspecies of interest to ZnO growth.21,22,54,55
6. Conclusion
The chemical stability diagram concept has been advancedwithin the present work to encompass (1) “actual” solubilitythrough accounting for all known species complexes; (2)chemical trajectories based on complex elemental ratios and
This journal is © The Royal Society of Chemistry 2019

Paper RSC Advances
Ope
n A
cces
s A
rtic
le. P
ublis
hed
on 2
6 Ju
ne 2
019.
Dow
nloa
ded
on 1
2/23
/202
1 3:
50:4
8 PM
. T
his
artic
le is
lice
nsed
und
er a
Cre
ativ
e C
omm
ons
Attr
ibut
ion-
Non
Com
mer
cial
3.0
Unp
orte
d L
icen
ce.
View Article Online
present species which predict pH and Mn+ conditions wherespecic corrosion products are expected to be in equilibriumwith specic compounds, as well as the Mn+ and pH rangeswhere these products are soluble, and (3) the dependence ofsolubility on surface curvature relevant to the prediction ofnanoscale growth and morphology. The utility of this methodwas demonstrated for the corroding Zn system on the bulkscale, and for the ZnO system at the nanoscale in NaCl envi-ronment. These thermodynamic bulk scale predictions corre-late relatively well with experiment for the Zn system in NaClwhere reaction kinetics are likely to have a limited role, andsuggest that the chemical stability diagram method shouldcontinue to be advanced for more accurate understanding ofreaction trends in technologically relevant metals and corrosionsystems.
Data availability statement
All thermodynamic constants utilized in the present work maybe found in raw form in the references provided, or derivedfrom the raw form using methods described in the ESI.†Calculations generated during this study are available in anopen access data repository, which can be accessed at DOI:10.17605/OSF.IO/Y39U6.
Author contributions
All authors contributed to the derivation and construction ofthese chemical stability diagrams, as well as to the structure andcomposition of this manuscript. M. E. M. provided literaturereview of Zn corrosion and draed the paper. R. J. S. Jr providedliterature review of publications utilizing speciation and/orchemical stability methods, created the graphical abstract,and modied the manuscript. J. R. S. reviewed, edited, andmodied the manuscript.
Conflicts of interest
The authors declare no competing interests.
Acknowledgements
The authors are grateful for the nancial support and contri-bution of the United States Office of Naval Research [Award #N000141512491] under the direction of Dr Airan Perez, theUnited States Office of the Undersecretary of Defense CorrosionUniversity Pilot Program [Award # FA7000-14-2-0010] under thedirection of Mr Daniel Dunmire, and the National ScienceFoundation [Award # NSF DMR #1309999].
References
1 F. M. Toma, J. K. Cooper, V. Kunzelmann, M. T. McDowell,J. Yu, D. M. Larson, N. J. Borys, C. Abelyan, J. W. Beeman,K. M. Yu, J. Yang, L. Chen, M. R. Shaner, J. Spurgeon,F. A. Houle, K. A. Persson and I. D. Sharp, Nat. Commun.,2016, 7, 1–11.
This journal is © The Royal Society of Chemistry 2019
2 M. Schuisky and A. Harsta, J. Electrochem. Soc., 1998, 145,4234–4239.
3 D. G. Kinniburgh and D. M. Cooper, Environ. Sci. Technol.,2004, 38, 3641–3648.
4 J. D. Hem, Hydrol. Sci. J., 1960, 5, 45–53.5 H. L. Bohn, R. A. Myer and G. A. O'Connor, in Soil Chemistry,John Wiley & Sons, Inc., New York, 3rd edn, 2001, pp. 201–206.
6 M. Pourbaix, Atlas of Electrochemical Equilibria in AqueousSolutions, National Association of Corrosion Engineers,1974.
7 L. F. Huang, M. J. Hutchison, R. J. Santucci, J. R. Scully andJ. M. Rondinelli, J. Phys. Chem. C, 2017, 121, 9782–9789.
8 R. J. Santucci, M. E. McMahon and J. R. Scully, npj Mater.Degrad., 2018, 2, 1.
9 P. Plagemann, J. Weise and A. Zockoll, Prog. Org. Coat., 2013,76, 616–625.
10 J. Lin, D. Battocchi and G. P. Bierwagen, Corrosion, 2017, 73,408–416.
11 W. Xu, N. Birbilis, G. Sha, Y. Wang, J. E. Daniels, Y. Xiao andM. Ferry, Nat. Mater., 2015, 14, 1229–1235.
12 X. G. Zhang, Corrosion and Electrochemistry of Zinc, PlenumPress, New York, 1st edn, 1996.
13 V. Ligier, M. Wery, J.-Y. Hihn, J. Faucheu and M. Tachez,Corros. Sci., 1999, 41, 1139–1164.
14 A. A. Bagabas, R. M. Mohamed, M. F. A. Aboud,M. M. M. Mostafa, A. S. Alshammari and Z. A. Al-Othman,US Pat., 8361324, 2013.
15 K. S. Suganthi, Flexible Printed Electron., 2018, 3, 1–11.16 H. Agarwal, S. Venkat Kumar and S. Rajeshkumar, Resour.-
Effic. Technol., 2017, 3, 406–413.17 W. Salem, D. R. Leitner, F. G. Zingl, G. Schratter, R. Prassl,
W. Goessler, J. Reidl and S. Schild, Int. J. Med. Microbiol.,2015, 305, 85–95.
18 P. K. Mishra, H. Mishra, A. Ekielski, S. Talegaonkar andB. Vaidya, Drug Discovery Today, 2017, 22, 1825–1834.
19 A. Krol, P. Pomastowski, K. Ranska, V. Railean-Plugaru andB. Buszewski, Adv. Colloid Interface Sci., 2017, 249, 37–52.
20 F. Verbakel, S. C. J. Meskers and R. A. J. Janssen, J. Appl.Phys., 2007, 102, 083701.
21 S. Hagemann, Entwicklung eines thermodynamischen Modellsfur Zink, Blei und Cadmium in salinaren Losungen,Gesellscha fur Anlagen- und Reaktorsicherheit, (GRS) mbH,Berlin, 1st edn, 2012.
22 G. S. James, Lange's Handbook of Chemistry, New York, 17thedn, 2017.
23 B. E. Conway, Electrochemical Data, Elsevier, Houston, 1952.24 K. J. Kim, P. B. Kreider, C. Choi, C. H. Chang and H. G. Ahn,
RSC Adv., 2013, 3, 12702–12710.25 C. H. Choi, J. B. Levin and C. H. Chang, CrystEngComm, 2016,
18, 8645–8652.26 S. E. A. Sharaf El-Deen, S. I. Moussa, Z. A. Mekawy,
M. K. K. Shehata, S. A. Sadeek and H. H. Someda,Radiochim. Acta, 2017, 105, 43–55.
27 C. Tang, M. J. S. Spencer and A. S. Barnard, Phys. Chem.Chem. Phys., 2014, 16, 22139–22144.
RSC Adv., 2019, 9, 19905–19916 | 19915

RSC Advances Paper
Ope
n A
cces
s A
rtic
le. P
ublis
hed
on 2
6 Ju
ne 2
019.
Dow
nloa
ded
on 1
2/23
/202
1 3:
50:4
8 PM
. T
his
artic
le is
lice
nsed
und
er a
Cre
ativ
e C
omm
ons
Attr
ibut
ion-
Non
Com
mer
cial
3.0
Unp
orte
d L
icen
ce.
View Article Online
28 S. E. Manahan, Environmental Chemistry, CRC Press, NewYork, 8th edn, 2005.
29 I. Odnevall Wallinder and C. Leygraf, Corrosion, 2017, 73,1060–1077.
30 S. Thomas, N. Birbilis, M. S. Venkatraman and I. S. Cole,Corrosion, 2012, 68, 015009.
31 Z. C. Feng, Handbook of Zinc Oxide and Related Materials:Volume 1, Materials, CRC Press, New York, 2013.
32 P. Volovitch, C. Allely and K. Ogle, Corros. Sci., 2009, 51,1251–1262.
33 M. Bockelmann, L. Reining, U. Kunz and T. Turek,Electrochim. Acta, 2017, 237, 276–298.
34 S. Thomas, N. Birbilis, M. S. Venkatraman and I. S. Cole,Corros. Sci., 2013, 69, 11–22.
35 C. B. Tay, S. J. Chua and K. P. Loh, J. Cryst. Growth, 2009, 311,1278–1284.
36 R. Brayner, S. A. Dahoumane, C. Yepremian, C. Djediat,M. Meyer, A. Coute and F. Fievet, Langmuir, 2010, 26,6522–6528.
37 T. Ohtsuka and M. Matsuda, Corrosion, 2003, 59, 407–413.38 O. Ø. Knudsen, U. Steinsmo and M. Bjordal, Prog. Org. Coat.,
2005, 54, 224–229.39 H. Marchebois, S. Joiret, C. Savall, J. Bernard and S. Touzain,
Surf. Coat. Technol., 2002, 157, 151–161.40 H. Marchebois, C. Savall, J. Bernard and S. Touzain,
Electrochim. Acta, 2004, 49, 2945–2954.41 S. Feliu, M. Morcillo and S. Feliu, Corrosion, 2001, 57, 591–
597.
19916 | RSC Adv., 2019, 9, 19905–19916
42 S. J. Feliu, R. Barajas, J. M. Bastidas, M. Morcillo and S. Feliu,Electrochem. Impedance Anal. ans Interpret. ASTM STP 1188,1993, pp. 438–449.
43 E. Diler, B. Rouvellou, S. Rioual, B. Lescop, G. Nguyen Vienand D. Thierry, Corros. Sci., 2014, 87, 111–117.
44 E. A. Meulenkamp, J. Phys. Chem. B, 1998, 102, 5566–5572.45 T. E. Graedel, J. Electrochem. Soc., 1989, 136, 193–203.46 I. Suzuki, Corros. Sci., 1985, 25, 1029–1034.47 B. E. Roetheli, G. L. Cox and W. B. Littreal, Met. Alloys, 1932,
3, 73–76.48 M. Mouanga, P. Berçot and J. Y. Rauch, Corros. Sci., 2010, 52,
3984–3992.49 Q. Qu, C. Yan, Y. Wan and C. Cao, Corros. Sci., 2002, 44,
2789–2803.50 J. E. Svensson and L. G. Johansson, Corros. Sci., 1993, 34,
721–740.51 D. de la Fuente, J. G. Castano and M. Morcillo, Corros. Sci.,
2006, 49, 1420–1436.52 M. A. M. Moazzen, S. M. Borghei and F. Taleshi, Appl.
Nanosci., 2013, 3, 295–302.53 C. Dai, J. Zhao, D. E. Giammar, J. D. Pasteris, X. Zuo and
Y. Hu, ACS Earth Space Chem., 2018, 2, 869–877.54 A. E. Martell and R. M. Smith, Critical Stability Constants,
Plenum Press, New York, 6th edn, 1989.55 R. Fernandez-Prini, A. H. Harvey and D. A. Palmer, Aqueous
Systems at Elevated Temperatures and Pressures, Elsevier,New York, 2004.
This journal is © The Royal Society of Chemistry 2019