advanced batteries: material ... - stanford universityqq146cv7478/phd thesis_yuan … · studied by...
TRANSCRIPT

ADVANCED BATTERIES: MATERIAL DEVELOPMENT AND DEVICE
FABRICATION
A DISSERTATION
SUBMITTED TO THE DEPARTMENT OF MATERIALS SCIENCE AND
ENGINEERING
AND THE COMMITTEE ON GRADUATE STUDIES
OF STANFORD UNIVERSITY
IN PARTIAL FULFILLMENT OF THE REQUIREMENTS FOR THE DEGREE OF
DOCTOR OF PHILOSOPHY
Yuan Yang
May 2012

http://creativecommons.org/licenses/by-nc/3.0/us/
This dissertation is online at: http://purl.stanford.edu/qq146cv7478
© 2012 by Yuan Yang. All Rights Reserved.
Re-distributed by Stanford University under license with the author.
This work is licensed under a Creative Commons Attribution-Noncommercial 3.0 United States License.
ii

I certify that I have read this dissertation and that, in my opinion, it is fully adequatein scope and quality as a dissertation for the degree of Doctor of Philosophy.
Yi Cui, Primary Adviser
I certify that I have read this dissertation and that, in my opinion, it is fully adequatein scope and quality as a dissertation for the degree of Doctor of Philosophy.
Nicholas Melosh
I certify that I have read this dissertation and that, in my opinion, it is fully adequatein scope and quality as a dissertation for the degree of Doctor of Philosophy.
Friedrich Prinz
Approved for the Stanford University Committee on Graduate Studies.
Patricia J. Gumport, Vice Provost Graduate Education
This signature page was generated electronically upon submission of this dissertation in electronic format. An original signed hard copy of the signature page is on file inUniversity Archives.
iii

ii
Copyright by Yuan Yang 2012
All Rights Reserved

iii

iv
ABSTRACT
Rechargeable batteries are vital in solving imminent energy and environmental issues.
Advanced batteries with superior performance and new functionality are desired for
applications including novel electronics, electric vehicles, and smart grids. In this thesis,
our work on designing novel materials, structures and devices for advanced batteries are
presented.
In the first part, progresses on high energy lithium sulfur (Li-S) batteries are
presented and discussed. The Li-S battery has a specific energy three to five times that of
state-of-the-art Li-ion batteries. However, the battery has a poor cycle life due to
limitations in the sulfur cathode. To improve the performance of Li-S battery, several
nanostructured sulfur cathode have been proposed and realized, including hollow carbon
nanofiber-encapsulated sulfur and conductive polymer-wrapped mesoporous
carbon/sulfur composite. Discharge capacity of 900 mAh/g and cycle retention of 85%
per 100 cycles have been achieved. Moreover, the reaction mechanism of Li-S battery is
studied by in-situ X-ray diffraction and imaging. It has been found that results based on
in-situ techniques are quite different from previous ex-situ results and common opinions.
These results illustrate the importance of in-situ studies and can help guide future designs
of Li-S batteries.
In the second part, our results on Li2S are presented. Li2S can avoid the safety issue
of metallic lithium anode in Li-S batteries. Furthermore, Li2S has capacity one order of
magnitude higher than current oxide/phosphate cathodes of Li-ion batteries, and thus
leads to rechargeable batteries with specific energy four to six times that of commercial
Li-ion batteries. However, Li2S is both electronic and ionically insulating. By using either
nanostructures or charging to high potential in the initial cycle, we demonstrate two
approaches to activate Li2S to be electrochemically active. Discharge capacity over 800

v
mAh/g has been achieved and capacity retention as high as 75% per 100 cycles are
demonstrated with a discharge capacity of ~550 mAh/g.
In the last part, our work on transparent Li-ion batteries is presented as a progress at
the device level. Transparent devices are one of the future trends for electronics. As a
critical component in electronics, the battery is not transparent yet as both electrode
materials and metallic substrate are opaque. We fabricate a grid-like electrode by
microfluidics-assisted method to solve this issue. As lines in the grid are smaller than
eye’s resolution and the gap among lines is filled with transparent PDMS, the whole
electrode appears transparent. Batteries with transparency of 60% and energy density of
10 Wh/L have been demonstrated. The energy density could reach 100 Wh/L by
optimization. Moreover, the grid-structured electrodes in the transparent battery are
stackable without sacrificing the transparency. Future work includes scaling up and
further optimization of full cell operations for commercial products.

vi
ACKNOWLEDGMENTS
It is my great fortune and honor to be guided by Prof. Yi Cui, whom I believe is one
of the best advisors on Stanford campus. I would like to acknowledge him for leading me
into the exciting world of nanoscience and energy storage, for having faith in me during
my hard time, and for supporting me strongly along the way.
I would like to thank Prof. Robert Huggins for mentoring. I have learned a lot from
him and his critical comments. I appreciate his support, especially for support in
fellowship and postdoc applications.
I would like to thank Prof. Thomas Jaramillo, Prof. Hongjie Dai, Prof. Robert
Huggins and Prof. Friedrich Prinz, for being my Ph.D. exam committee. I am grateful to
Prof. Nickolas Melosh and Prof. Friedrich Prinz for their time reading my thesis.
I would like to thank the whole Cui group for support and help in the past five years.
I would like to acknowledge help from Candace Chan and Dr. Riccardo Ruffo for their
tutoring. I would like to thank help from Dr. Hailin Peng and Dr. Chong Xie on the
LiMn2O4 project, Dr. Liangbing Hu and Dr. Jang Wook Choi for help in the paper battery
project, Sangmoo Jeong for the transparent battery project, Guangyuan Zheng, Matt
McDowell, Ariel Jackson, Weiyang Li and Zhi wei Seh for sulfur and Li2S projects. I
also appreciate support and help from all other group members, especially Desheng Kong
and Judy Cha.
I would like to thank Prof. Hongjie Dai and Hailiang Wang for pleasant collaboration
on graphene-based materials for rechargeable batteries, and Prof. Zhenan Bao and Dr.
Guihua Yu for working together on polymer-wrapped sulfur cathodes. I enjoy my
collaboration with Prof. Wendy Mao and Yu Lin for high pressure behaviors of LiMn2O4
nanostructures. I would like to thank Dr. Michael Toney, Dr. Johanna Nelson and Dr.
Sumohan Misra for collaboration on in-situ X-ray studies.

vii
I would like to acknowledge my mentors, Dr. Kang Sun and Prof. Xiaolei Zou. They
give me lots of suggestions on career development.
I also want to express my appreciation to my friends at Stanford. I enjoy the life here
in the last five years as I am lucky to know you. They include but not limited to Weizhe
Hong, Minbiao Ji, Bing Dai, Jianbin Wang, Xi Jin, Han Zhou, Yi Liu, Pei He, Su Chen,
Shuang Wang, Yu Wu, Zijian Li, Shuang Li, Dong Liang, Xiaoyi Liu, Shilin Zhu, Jiale
Liang, Yihong Chen, Mingliang Zhang, Xu Tan, Weigang Wang, Lin Xu,, Xiangrui
Meng, Liangliang Zhang, Huiliang Wang, Fuming Wang, Lu Zhang, Ken Wang,
Yuechen Zhong, Jingyi Xu, Zhen Zhu, He Yi, Bo Zhang, Amit Desai, Derrick Liu, Song
Han, Zuqin Liu, Ghyrn Loveness, Kan Wang and Dave DeBaun.
I also appreciate financial support from Stanford Graduate Fellowship, KAUST,
Global Climate and Energy Project (GCEP) and DOE funding. I cannot finish my PhD
without support from these agencies and fellowships.
Finally, I would like to thank my parents. I thank them for taking me as the most
important thing in their life and raising me up.

viii
TABLE OF CONTENTS
List of table……………………………………………...…………………………….x
List of figures……………………….………………….……………………………..xi
Chapter 1: Introduction………………………………………………………………..1
1.1 Lithium-ion Batteries……………………………….………………………..1
1.2 Important Parameters for Evaluating Battery Electrode Materials………...3
1.3 Materials Characterizations…………………………………………………...8
1.4 Electrochemical Methods…………………………………………………….10
Chapter 2: Nanostructured Sulfur Cathodes…………………………………………13
2.1 Introduction to Sulfur Cathodes……………………………………………...13
2.2 Hollow Carbon Nanofiber-Encapsulated Sulfur Cathode………………..….16
2.3 Conductive Polymer-wrapped Mesoporous Carbon/sulfur Composite...……25
2.4 Conclusion……………………………………………………………….......39
Chapter 3: In-situ X-ray Studies of Sulfur Cathodes……………..…………………41
3.1 Introduction…………………………………………………………………..41
3.2 Experimental Setup for In-situ X-ray Studies……………………………...42
3.3 In-situ X-ray Diffraction of Sulfur Cathodes………………………………..46
3.4 In-situ Transmission X-ray Microscopy of Sulfur Cathodes……………….49
3.5 Ex-situ Scanning Electron Microscopy of Sulfur Cathodes………..……….53
3.6 Conclusion………………………………………………………………….54
Chapter 4: Li2S Cathode for High Energy Lithium Ion Batteries ……………..……57
4.1 Introduction…………………………………………………………………57
4.2 Nanostructured Li2S/mesoporous Carbon Composite……………………..58
4.3 Activating Li2S by Intial Overcharging……………………………………...69
4.4 Conclusion…………………………………………………………………..90
Chapter 5: Transparent Lithium-Ion Batteries………… ……………..…….………92
5.1 Introduction…………………………………………………………………92

ix
5.2 Battery Design Principle……………………………………………………..94
5.3 Fabrication Process…………………………………………………………96
5.4 Microscopic Characterizations of the Transparent Battery………………99
5.5 Transparency Measurement……………………………….………………..101
5.6 Electrochemical Characterizations………………………………………….101
5.7 In-situ Raman Study Based on Transparent Batteries…………………….106
5.8 Discussion and Summary…………………………………………….…107
Chapter 6: Conclusions………………………………….……………..…….……109
APPENDIX A: Simulation on Ionic Transport in Li2S .…………..…….…………111
Bibliography …………………...…………..…………………………….………118

x
LIST OF TABLES
Number Page
Table 2.1 The percentage of elements in PEDOT:PSS and CMK-3/sulfur composite….33
Table 4.1 Effects of kinetic parameters on and j0…………………………………….85

xi
LIST OF FIGURES
Number Page
Figure 1.1 The working principle of Li-ion batteries………………………………........3
Figure 1.2 Schematic of reaction mechanism in batteries……………………………….6
Figure 1.3 Schematic of circuit elements and corresponding Nyquist plots……..……11
Figure 2.1 The discharge–charge profiles of a Li–S cell…………………….……….….14
Figure 2.2. Schematic of design and fabrication process of hollow carbon nanofiber
/sulfur composite structure…………………………………………………………….…17
Figure 2.3 SEM of hollow carbon nanofiber-encapsulated sulfur cathode…………19
Figure 2.4 TEM of hollow carbon nanofiber-encapsulated sulfur cathode……………21
Figure 2.5 Electrochemical performance of the carbon nanofiber-encapsulated sulfur
electrode …………………………………………………………………………………23
Figure 2.6 Electrochemical performance of the carbon nanofiber-encapsulated sulfur
electrode in electrolyte with LiNO3 additive………...…………………………………..23
Figure 2.7. The schematic of PEDOT:PSS-coated CMK-3/sulfur composite…...……....26
Figure 2.8 SEM images of CMK-3/sulfur particles before and after PEDOT:PSS coating
……… ………………………………………………………………………………….29
Figure 2.9 XPS characterization of PEDOT:PSS-coated CMK-3/sulfur particles………30
Figure 2.10 TEM characterization of PEDOT:PSS-coated CMK-3/sulfur particle.….…32

xii
Figure 2.11 Electrochemical performance of PEDOT:PSS-coated CMK-3/sulfur
composites …………………………..…………….……………………………………..34
Figure 2.12 Cycling performance of PEDOT:PSS-coated and bare CMK-3/sulfur
particles.………………………………………………………………….………………35
Figure 2.13 Electrochemical performance of pure PEDO:PSS film…......................……37
Figure 2.14 Impedance studies of PEDOT:PSS-coated CMK-3/sulfur electrodes………39
Figure 3.1 Schematic of Transmission X-ray Microscopy………………………………43
Figure 3.2 Experimental setup for in-situ X-ray studies…………………………………45
Figure 3.3. In-situ XRD results of a Li-S cell……………………………………………47
Figure 3.4 Integrated diffraction intensities of sulfur peaks for a Li-S cell………….…..48
Figure 3.5 In-situ TXM micrographs of a sulfur/Super P composite particle during
operation…………………………………………………………………………………50
Figure 3.6 Image contrast of a sulfur cathode in TXM micrographs……………….……52
Figure 3.7 Ex-situ SEM characterizations of the sulfur/Super P composite cathode……54
Figure 3.8 Ex-situ SEM micrographs of a sulfur cathode during discharge……………55
Figure 4.1 The theoretical specific energy of different Li-ion battery systems……...…..58
Figure 4.2 Schematic of a Li2S/Si battery………………………….…………………….59
Figure 4.3 TEM characterizations of Li2S/CMK-3 mesoporous carbon nanocomposite….
……………………………………………………………………………………………62
Figure 4.4 SEM characterizations of Li2S/CMK-3 nanocomposite……………………..62

xiii
Figure 4.5 X-ray diffraction characterization of Li2S/mesoporous carbon nanocomposite
particles ….…………………………………………………………...………………….63
Figure 4.6 Electrochemical performance of Li2S/Li half-cells and Li2S/Si full cells……65
Figure 4.7 Performance of silicon nanowire anode…………………………………….68
Figure 4.8 Power capability of Li2S/silicon full cell……………………………………..68
Figure 4.9 The schematic diagram illustrating the activation method of Li2S…..………70
Figure 4.10 SEM images of pristine and ball-milled Li2S particles……..……………72
Figure 4.11 The electrochemical characteristics of micron-sized Li2S electrodes...…..74
Figure 4.12 The in-situ X-ray diffraction patterns of Li2S electrode during the initial
charging ……………………………….…………………………………………………77
Figure 4.13 The voltage profile of Li2S electrode with polysulfide additives..………….79
Figure 4.14 The relation between current rates and overpotentials……………………...80
Figure 4.15 The effect of electronic transport on the overpotential…………..…………82
Figure 4.16 Characterizations related to ionic transport in Li2S……………...………….86
Figure 4.17 A summary of the charging model of Li2S………..………...……………..87
Figure 4.18 The impedance results of Li2S electrode with polysulfide additives……….89
Figure 5.1 Electrochemical and optical characterizations of an ITO electrode…….……93
Figure 5.2 The schematic of a transparent battery with grid-like patterned electrodes and
the fabrication process……………………………………………………………..95
Figure 5.3 Images of components of the transparent battery…………………………..100

xiv
Figure 5.4 The thickness distribution of electrode thickness over a single electrode…100
Figure 5.5 Cyclic voltammetry measurement on PDMS substrate covered with gold
film……………………………………………………………………………………102
Figure 5.6 Electrochemical performance of the transparent battery…………..………..104
Figure 5.7 The resistance of a transparent electrode upon bending……….……………105
Figure 5.8 Transparent Li-ion battery for lighting LED and in-situ Raman studies……106
Figure A.1 The lithium ion diffusivities in Li2S electrodes…….……..………………..114
Figure A.2 The COMSOL simulation results of ionic transport inside the Li2S particles
………..…………………………………………………………………………………116

CHAPTER 1 INTRODUCTION
Today the world faces severe energy and environmental challenges, such as global
warming and shortage in oil production.1 The success of tackling these challenges is vital
to a sustainable future. Among various solutions, two approaches have attracted
significant amount of attention. One is shifting electricity production from burning fuels
to renewable energy sources, such as solar energy and wind energy. The second solution
is moving the power of ground transportation towards electricity, as it takes 28% of
consumed fuels.1 Both solutions need advanced energy storage devices. The power
output of many renewable energy sources fluctuates significantly, such as wind and solar
energy. Subsequently energy storage devices are necessary to stabilize the power
generation. These devices include flywheels, compressed gas, and pumped water.
Batteries are very attractive as they are compact, movable and convenient. For vehicle
electrification, high-performance batteries are the key to its success as they act as the
power source for vehicles. In addition, batteries also play an important role in portable
electronics, a critical component in the information era.
However, current battery technology does not well satisfy applications in all of these
fields. Advanced batteries with higher energy density, faster charge/discharge capability,
longer cycle life and lower cost are desired.2–4
In the following pages, I will first talk
about background and principles of batteries. Then our developments on high-energy Li-
S batteries and high-capacity Li2S cathode will be discussed. In the last part of this thesis,
progresses in novel transparent batteries will be presented for future electronics.
1.1 Lithium-ion Batteries
A battery is an electrochemical device that converts chemical energy directly into
electrical energy.3,5,6
It consists of two electrodes, which are called cathode and anode,
respectively. The two electrodes have different electrochemical potentials, which means
that their capabilities to be reduced (or oxidized) are different. The difference in the

2
potentials equals to the output voltage at open circuit condition. When a load is connected
to the battery to form a complete circuit, reduction happens at the cathode and oxidation
takes place at anode, while the reverse reactions happen in the charge if the reaction is
reversible. As the two electrodes are separated by ionically conductive but electronically
insulating electrolyte, electron transfer in the redox reaction can only happen through the
external circuit, which forms the current.
Batteries can be divided into two catalogs: primary and rechargeable batteries. The
first one is designed to be used once and discarded. The second one has a reversible
reaction and can be used for multiple times. Rechargeable batteries play a more important
role in portable electronics, vehicle electrification and gird-level energy storage.
Lithium ion battery (LIB) is a family of rechargeable batteries in which lithium ions
move from the anode to the cathode during discharge, and move back in charge.
Chemistry, performance, cost, and safety characteristics vary across different types of
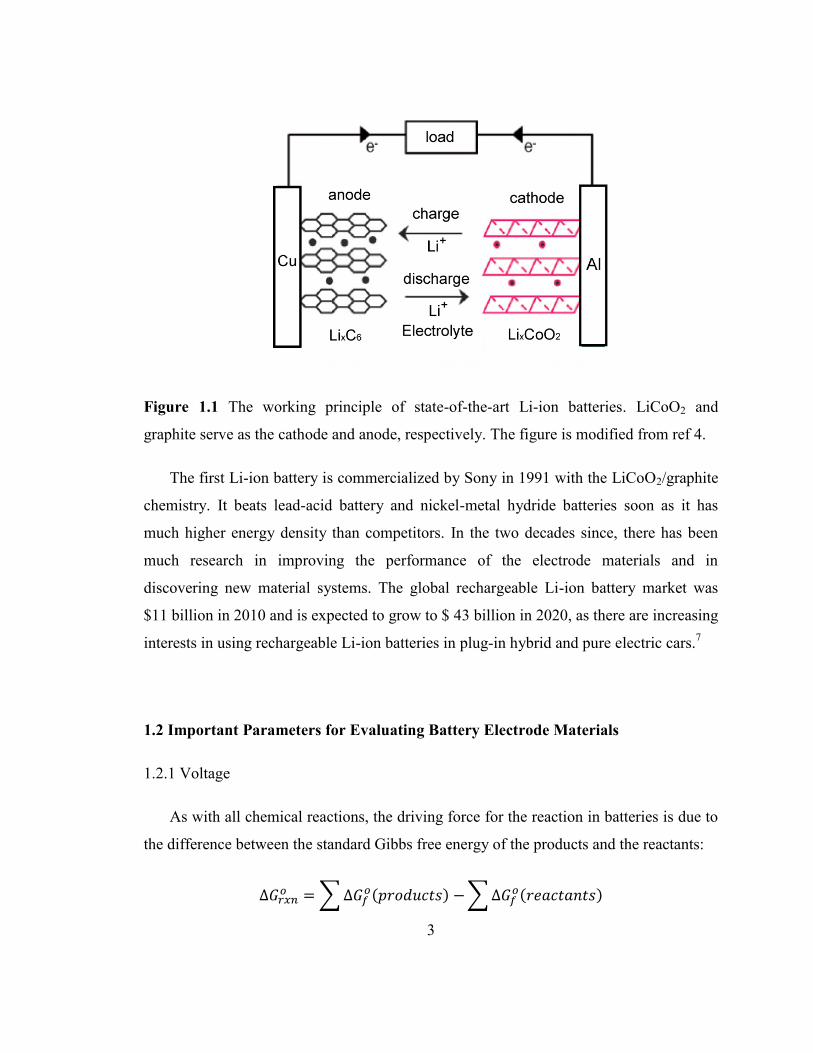
LIBs.2 Figure 1.1 illustrates the widely used LiCoO2/graphite system as an example for
explaining the operation principle of lithium ion batteries. Aluminum and copper foil are
employed as the current collector for the LiCoO2 cathode and graphite anode,
respectively. The active materials are always mixed with conductive carbon additives and
polymer binder (e.g. polyvinylidene fluoride) to form a conductive film supported by the
metal substrates. Organic electrolyte consists of carbonate ester as the solvent and LiPF6
as the salt. The two electrodes are physically separated by porous polymer film, which is
called separator. The whole battery is sealed inside a can as the system is air sensitive.
The as-made battery is in the discharged state, and following reaction happens in the
charging process:
Cathode: LiCoO2 → Li1-xCoO2 + x Li+ + x e
-,
Anode: 6 C + Li+ + e
- → LiC6,
while the reversed reaction occurs during discharge.
3
Figure 1.1 The working principle of state-of-the-art Li-ion batteries. LiCoO2 and
graphite serve as the cathode and anode, respectively. The figure is modified from ref 4.
The first Li-ion battery is commercialized by Sony in 1991 with the LiCoO2/graphite
chemistry. It beats lead-acid battery and nickel-metal hydride batteries soon as it has
much higher energy density than competitors. In the two decades since, there has been
much research in improving the performance of the electrode materials and in
discovering new material systems. The global rechargeable Li-ion battery market was
$11 billion in 2010 and is expected to grow to $ 43 billion in 2020, as there are increasing
interests in using rechargeable Li-ion batteries in plug-in hybrid and pure electric cars.7
1.2 Important Parameters for Evaluating Battery Electrode Materials
1.2.1 Voltage
As with all chemical reactions, the driving force for the reaction in batteries is due to
the difference between the standard Gibbs free energy of the products and the reactants:
∑
( ) ∑ ( )

4
This chemical driving force is equivalent to an electrostatic driving force,
,
where E is the voltage between the electrodes, n is the number of electrons consumed in
the electrode reaction, and F is the Faraday's constant, 9.64853 104 C/mol.
In Li-ion batteries, the voltage is related to the difference in chemical potential of
lithium in each electrode. At open circuit condition, the voltage between the two
electrodes can be expressed as:
( )
( )
,
where ( )
is the chemical potential of Li in the cathode and ( )
is the chemical
potential of Li in the anode. The chemical potential of Li can vary with its activity, and
the relation is described by the Nernst equation:
,
Where is the value of the chemical potential of species i in its standard state, is
the activity of species i, R is the ideal gas constant (8.31 J/mol), and T is the temperature.
The relation between activity (the effective concentration) and potential indicates that the
potential depends on the capacity, the amount of charges passing the electrode, which is
plotted as the voltage profile (figure 1.2).
In lithium ion batteries, the potential is always compared with the redox couple of
Li/Li+, which is -3.04 V vs. the standard hydrogen electrode. The potentials of several
common materials for Li-ion batteries are listed as follows (vs. Li/Li+):
Cathode: LiCoO2 : 3.8-4.3 V, LiFePO4 : 3.4 V
Anode: Graphite : 0 - 0.25 V Li4Ti5O12: 1.55 V

5
To understand the profile of voltage against the capacity, it is useful to utilize the
Gibbs phase rule, which further help illustrate the nature of the electrochemical reaction
in the electrode. The Gibbs phase rule states that
F = C – P + 2
Where F is the number of degrees of freedom, C is the number of components or
elements in the system, and P is the number of phases in the system. More specifically, F
represents the number of intensive thermodynamic parameters to define the system and
all associated properties, such as chemical potential and voltage.
The Gibbs phase rule means that the voltage curve indicates the number of phases
existing in the material at certain potential. For example, if the reaction is
A + x Li+ +x e
- →LixA
There are two elements in the system (Li and A), so C is 2. If Li insert into A as a
solid solution forming only one phase, so P is 1 and thus F is 3. Since pressure and
temperature need to be specified for an electrochemical reaction, only one freedom is
allowed. Because the concentration inside LixA is changing throughout the reaction, the
final parameter to describe the system can be x in LixA. This means that this single-phase
system and associated properties, such as potential, can be fully described by
temperature, pressure and amount of lithium (x). In other words, the potential vary with x,
which is exhibited as a sloped curve.
In contrast, if the insertion of Li leads to the nucleation of a new phase, for example,
LiA, then the reaction becomes
A + x Li+ + x e
- →x LiA + (1-x) A
Here C is still 2, but P is now 2 as two phases coexist. Then F is 2. After the temperature
and pressure are defined, there is no more parameter that needs to be specified.

6
Subsequently, the potential does not vary with the concentration of Li, as shown in figure
1.2.
Figure 1.2 Schematic of reaction mechanism in batteries. The plot shows profiles of
potential against state of charge of one-phase reaction (left) and two-phase reaction
(right). Figures adapted from ref 6.
1.2.2 Capacity
The capacity of an electrode material is the amount of charge that can be stored
inside. The gravimetric specific capacity can be expressed as
where x is the amount of Li in LixA, F is Faraday's constant, Mw is the molecular
weight of A and is the density of A.

7
Another important parameter related to the capacity is the Coulombic efficiency
(CE), which is defined as the ratio of the measured discharge (DC) and charge (C)
capacities. This value is an indicator of the reversibility of the lithiation process.
1.2.3 Energy Density
Energy density is one of the most important parameters to evaluate the performance
of a battery. The energy stored in a battery could be expressed as the integral of voltage
upon capacity:
∫
Its ratios to the total mass and the volume of a battery correspond to the gravimetric and
volumetric energy density, respectively. Strictly speaking, it is not correct to report the
energy density of a single electrode, as voltage is the difference between two electrodes.
However, conventionally the energy density of the cathode is reported based on the
voltage against a lithium anode and only the mass of cathode is included.
The specific energy (gravimetric energy density) is typically reported in units of
Wh/kg while the volumetric energy density is exhibited in Wh/L. Theoretical energy
densities of ~400 Wh/kg are obtained when only the active materials of the cathode and
anode are considered (for LiCoO2, LiMn2O4, or LiFePO4 against graphite). The
gravimetric energy density of the entire battery must include the weight of the electrolyte,
separator, current collectors, and other inactive components, which therefore lower the
value down to 1/3-1/2 of the theoretical energy density.
1.2.4 Power

8
The power that a battery can supply is equivalent to the product of the current and
voltage. A higher current typically lead to a lower voltage, as higher voltage drop exists
due to the IR losses, polarization, limits in solid-state diffusion and phase transformation.
Therefore, batteries are typically measured at different currents, and "C" rates are used to
identify the currents in galvanostatic (constant current) measurements. n C is defined as
the amount of current needed to fully discharge the battery in 1/n hour. In academic
research, especially on cathodes, C rate is based on the theoretical capacity of the
electrode material, while practical capacity is more often used for industry. In this thesis,
unless specified, all C rates are based on the theoretical capacity of the material.
Typically commercial lithium ion battery could be operated up to 1 - 2 C, and certain
high power Li-ion batteries could reach 5 - 10 C.
1.2.5 Cycle life
Cycle life is another important parameter for evaluating rechargeable battery. In
industry, the cycle life is defined as the number of cycles when the capacity decays down
to 80% of the initial capacity. In this thesis, the cycle life is generally expressed as
capacity retention of XX % per 100 cycles.
1.3 Materials characterizations
1.3.1 Electron microscopy and associated spectroscopy techniques
Scanning electron microscopy (SEM)8 and transmission electron microscopy (TEM)
9
are used to characterize the morphology of materials. For SEM, the electron beam is
focused into a tiny spot of 0.4 - 5 nm in diameter and scanned over the sample. The
electrons can be scattered and absorbed in the sample, and undergo elastic scattering,
inelastic scattering to emit secondary electrons, or emission of radiation such as X-rays.

9
The emitted secondary electrons, which come from the K-orbitals of atoms in the sample,
are collected with a photomultiplier and converted into an image. SEM is widely used to
characterize the morphology of microscopic materials and their arrangement on the
substrate. Images shown in this work were obtained using an FEI XL30 Sirion SEM in
Stanford Nanocharacterization Laboratory (SNL).
In TEM, the electron beam is transmitted through a very thin sample (typically less
than 200 nm). Through the interactions of the electron beam with the sample, an image or
diffraction pattern can be obtained. TEM is powerful for looking at particles that are too
small to see clearly in the SEM. TEM has a much higher resolution than other
microscopes as a result of the small de Broglie wavelength of electrons, which can even
image lattice fringes. The TEM images taken in this work are obtained with FEI Tecnai
G2 F20 X-TWIN Transmission Electron Microscope in SNL.
In both SEM and TEM, X-rays generated from the interaction between electron beam
and samples can be used in energy dispersive X-ray spectroscopy (often abbreviated as
EDS, EDX, or EDAX). The X-rays are emitted when an electron is ejected from an inner
shell and an electron from an outer shell takes its place. The energy difference between
the two shells, which is characteristic of the element, is released as X-ray. Detecting these
characteristic X-rays can allow for determination of the composition of the elements in
the sample.
1.3.2 X-ray Diffraction and Imaging
X-ray diffraction technique is a powerful method to study the phase of materials.10
In
this thesis, in-situ X-ray diffraction was performed to analyze the phase evolution in Li2S
and sulfur electrodes. It was recorded at 12.74 keV at beamline 11-3 at the Stanford
Synchrotron Radiation Lightsource (SSRL). Other XRD data shown in this work was
done using a PANalytical X’Pert diffractometer with Cu K-radiation in SNL.

10
Transmission X-ray Microscopy (TXM) is a recently developed technique.11,12
X-ray
has a high penetration depth, so it is convenient for in-situ study of batteries as the
electrochemical cell has to be sealed inside a package. The detailed working principle of
TXM will be described in chapter 3. TXM is performed using a full-field Xradia
microscope at SSRL beamline 6-2c. The beam energy is 6 KeV and the resolution is as
fine as 30 nm.
1.4 Electrochemical Methods
1.4.1 Cyclic Voltammetry
Cyclic voltammetry (CV) is a widely used technique in electrochemistry and can
provide a fast diagnostic and qualitative analysis of electrochemical reactions.13
In a CV
measurement, the potential between the working electrode and reference electrode is
scanned at a certain rate back and forth, typically between one hundredth millivolt to tens
of millivolt per second.
The electrochemical reaction can be represented as peaks in the current-voltage plot.
The anodic peak exists at higher potential while the cathodic peak shows up at a lower
potential. If the reaction is completely reversible, the difference in the peak position
equals to 2.22 RT/nF, where R is the ideal gas constant, T is the temperature, n is the
number of electrons transferred and F is the Faraday constant. However, in many systems
for energy storage applications, larger peak separations are observed due to factors such
as kinetic limitations, sluggish phase transformations, and polarization of the electrode.
For slow reaction process, the peak position in CV changes as a function of scan rate.
This is especially true for battery materials, where typical charge/discharge rates are
much slower than those used in CV.

11
1.4.2 Electrochemical Impedance Spectroscopy
Electrochemical impedance spectroscopy (EIS) is a powerful technique to probe
different processes in an electrochemical cell that occur at different time scales.6,13,14
In
impedance measurement, small AC signals of different frequencies are applied to the cell
with amplitudes of 5 – 20 mV. The response of an electrochemical cell can be modeled
with an equivalent circuit. For instance, when a lithium ion is inserted into the host
battery material, it experiences resistances from the electrolyte, a double-layer
capacitance, a charge-transfer resistance at the electrode-electrolyte interface, and solid-
state diffusion inside the material. The equivalent circuit for this system is shown in
figure 1.3 e. The resistances in series (Rs) include contribution of leads, electronic
resistance of the electrode and the ionic resistance of the electrolyte. The charge transfer
process can be described as a resistor (Rct) and a capacitor in parallel (figure 1.3 d). The
resistor represents for the resistance for the charge transfer process at the electrode-
electrolyte interface. The capacitor shows the double layer capacitance. If the electrode
does not allow the insertion of ions from the electrolyte, Rct is infinite. The diffusion of
lithium ions inside the solid phase is commonly described as the Warburg element, whose
mathematical expression is Z = A-1/2 – iA-1/
.2

12
Figure 1.3 Schematic of circuit elements and corresponding Nyquist plots. (a) Resistor,
(b) capacitor, (c) resistor and capacitor in series, (d) resistor and capacitor in parallel, (e)
resistor and capacitor in parallel with diffusion into the electrode. Figure adapted from
the thesis of Candace Chan at Stanford University.
The result of EIS is commonly plotted as the Nyquist plot, where the Y-axis is the
negative of the imaginary part of the impedance and the X-axis is the real part of the
impedance. Figure 1.3 shows the Nyquist plots of some basic circuits (a-d) and the
standard equivalent circuit of the lithium intercalation/deintercalation process (e). The
charge transfer process, represented by resistor (Rct) and capacitor in parallel, results in a
semicircle in the plot. The Warburg diffusion element is represented as a straight line
with a slope of 45o.
EIS can allow for the determination of many important values, including
conductivities and diffusion coefficients of battery materials, and help interpret the
evolution of electrode materials during cycling.

CHAPTER 2: NANOSTRUCTURED SULFUR CATHODES
2.1 Introduction to Sulfur Cathodes
The concept of elemental sulfur as a cathode electrode material was first introduced
by Herbet and Ulam in 1962.15
Sulfur has many advantages as the electrode material,
such as extremely low cost, high capacity and environmental benignity. Lots of efforts
have been devoted to alkali metal–sulfur batteries, such as high temperature Na–S
batteries, which operate at 300–350 C16
, and room temperature Li–S batteries. In a Li–S
cell, the overall reaction can be described as
S8 + 16 Li+ + 16e
- → 8 Li2S,
In this chemistry, sulfur could provide a theoretical specific capacity of 1673 mAh/g,
and the average voltage is 2.15 V vs. Li/Li+. As a result, the theoretical energy density of
Li-S battery is 2600 Wh/kg or 2800 Wh/L, which is significantly higher than the
theoretical energy density of current Li-ion batteries (~400 Wh/kg and ~ 1400 Wh/L).17,18
The Li-S battery comprised a positive electrode of elemental sulfur, carbon additives
and binders, and a metallic lithium anode separated by the organic electrolyte. In organic
liquid electrolyte, the discharge of the sulfur cell proceeds through multiple steps19,20
:
S8 +2 e- → S8
2-
3 S82-
+ 2 e- → 4 S6
2-
2 S62-
+2 e-→ 3 S4
2-
S42-
+ 4 Li+ +2 e
- → 2 Li2S2
Li2S2 + 2 Li+ + 2e
- → 2 Li2S
The first three steps form the so-called high-order polysulfides, which are soluble in
the electrolyte. In the last two steps, insoluble Li2S2 and Li2S are formed and they
precipitate out at the cathode. The first three steps have a fast kinetics as they stay in the
liquid phases. The fourth one has moderate kinetics following an overshoot of voltage

14
due to nucleation of the solid phase. The last step for conversion of Li2S2 to Li2S is the
most difficult, which is impeded due to the sluggishness of solid state diffusion in the
bulk. The reaction sequence of the sulfur cathode and the corresponding electrochemical
profiles are summarized in figure 2.1.
Figure 2.1 The discharge–charge profiles of a Li–S cell. Three steps of reaction exsist in
the reaction: (I) conversion of solid sulfur to soluble polysulfides; (II) conversion of
polysulfides to solid Li2S2; (III) conversion of solid Li2S2 to solid Li2S. Figure adapted
from ref 18.
Despite the considerable advantages of Li–S battery, it presents many challenges.
The first is the volume change of sulfur during charge and discharge. Sulfur has a density
of 2.03 g/cm3 while Li2S is lighter (1.66 g/cm
3). As a result, the volume expansion when
sulfur is fully converted to Li2S is as large as 80%. This volume expansion leads to
pulverization of active materials and thus fast capacity decay. Second, Li2S is both
electronically and ionically insulating, which impedes the possibility to reach the
theoretical capacity. Third, as polysulfides are soluble in the electrolyte, they will be
reduced to Li2S and passivate the surface of lithium, which results in both material loss
and increase in impedance. This will also lead to the so-called shuttle effect, where long
chain polysulfides (LCPs) diffuse to the surface of lithium anode and be reduced to short

15
chain polysulfides (SCPs). The SCPs can move back to cathode and be oxidized to LCPs.
This parasitic process takes place repeatedly, creating an internal ‘‘shuttle’’ phenomenon.
It decreases the active mass utilization in the discharge process and markedly reduces the
coulombic efficiency in the charge process.18
Besides issues related to the sulfur cathode,
severe safety concerns also arise from the metallic lithium anode, but are always
neglected in studies of sulfur batteries.
In the past decades, various approaches have been proposed to improve the
performance of sulfur cathodes. They could be divided into several catalogs: 1) carbon-
sulfur composite. In 2009, Nazar et al. reports a mesoporous carbon/sulfur composite to
improve the performance of the sulfur cathode.21
In this design, sulfur stays in the tiny
pores of mesoporous carbon (~3 nm) and the as-formed polysulfides are kept trapping
inside the pores. The ratio of sulfur to carbon is optimized so that enough space is left for
sulfur to expand. The small dimension of as-formed Li2S also improves its kinetics.
Along with this report, many other carbon-sulfur composite have been demonstrated,
such as other porous carbon – sulfur composite22–27
, carbon nanotube – sulfur
composite28–30
, and graphene – sulfur composite31,32
. Polymer-sulfur composites are also
proved to be helpful for improving the performance of the sulfur cathode.33–35
2)
Optimized additives or electrolyte. It has been reported that by replacing common PVdF
binders with gelatin binders, the performance of sulfur cathode was significantly
improved.36–38
Electrolyte also affects the performance of the sulfur cathode. Ionic liquid
can help improve the cycle life of sulfur cathode, and the reason is believed to be less
solubility of polysulfides in the electrode.39,40
3) Sulfur-contained polymer. In this
approach, sulfur is incorporated into the polymer, which alters the electrochemical
behaviors of sulfur. It was reported that theoretical capacity could be reached by this
method, but the voltage is lower (~1.8 V vs Li/Li+) and the mechanism is not well
understood.

16
Based on literature studies and our own research in the past several years, we believe
that an ideal structure for sulfur electrode should have the following characteristics24
: 1) a
closed structure for efficient polysulfides containment; 2) limited surface area for sulfur-
electrolyte contact; 3) sufficient space to accommodate sulfur volumetric expansion and
small dimension of the sulfur electrode to avoid pulverization; 4) a short transport
pathway for both electrons and Li ions to achieve high capacity at a high power rate; 5) a
large conductive surface area for depositing insulating Li2S2 and Li2S, in order to
preserve the morphology of electrodes;41
and 6) suitable electrolyte additives to passivate
lithium surface to minimize the shuttle effect. Some of these characteristics require
structure designs that are self-conflicting, such as the minimization of sulfur/electrolyte
contact and the large surface area needed for Li2S2 and Li2S plating, which explain why it
is very challenging to realize sulfur electrodes with high specific capacity and long cycle
life.
In the following sections, two new and rational designs of nanostructured sulfur
electrode will be presented to address these issues. These designs can efficiently suppress
the pulverization of active materials, improve the kinetics of Li2S, and trap polysulfides.
Consequently, better cycle life and higher capacity are realized based on these designs.
2.2 Hollow Carbon Nanofiber-Encapsulated Sulfur Cathode
2.2.1 Electrode Design and Fabrication
To address the six requirements in the previous section, a hollow carbon nanofiber-
encapsulated sulfur electrode structure is designed, comprising vertical arrays of hollow
carbon nanofibers filled with melted sulfur (figure 2.2 a). Anodic aluminum oxide (AAO)
membranes were used as templates for the fabrication of hollow carbon nanofibers,
through a polystyrene carbonization process. In this structure, sulfur was only coated onto
the inner surface of hollow nanofibers. The nanofiber diameters range from 200-300 nm

17
while the length is up to 60 m, corresponding to the AAO template structure. Sulfur is
effectively contained in the high-aspect-ratio carbon nanofibers and its contact with the
electrolyte is limited to the two openings. The hollow structure also provides large space
for sulfur expansion during cycling. As lithium can easily penetrate the thin carbon wall,
rapid ionic transport is also possible. The one-dimensional nature of conductive carbon
enables facile transport of electrons and a large area for depositing Li2S2 and Li2S. These
attributes of the hollow carbon nanofiber structure are important in ensuring high specific
capacity and stable cycle life of the sulfur cathode in Li-S battery.
The key point in this structure is that sulfur is only coated onto the inner surface of
hollow carbon nanofibers instead of the exterior surface. Multi-walled carbon
nanotubes/sulfur composite have previously been demonstrated but sulfur was mainly
coated onto the outer surface.27-29
Consequently sulfur was exposed to electrolyte without
any capping and the dissolution issue was not solved.

18
Figure 2.2 Schematic of design and fabrication process of hollow carbon
nanofeber/sulfur composite structure. (a) The design principle shows the high aspect ratio
of the carbon tube for effective trapping of polysulfides and (b) the fabrication process of
carbon/sulfur double layer tubes. (c) Digital camera images showing the contrast of AAO
template before and after carbon coating and sulfur infusion.
To realize the hollow carbon nanofiber-wrapped sulfur structure, a template-assisted
method was used. As shown in figure 2.2 b, anodic aluminum oxide (AAO) template
(Whatman, pore size ~200 nm, thickness ~60 m) was used as the template for making
hollow carbon nanofibers. Typically, 120 mg of AAO membrane was placed inside an
alumina boat, and 2 ml of 10 wt% polystyrene (PS) suspended in dimethylformamide
(DMF) was dropped onto the template as the carbon precursor. The carbonization was
done by heating the AAO/PS/DMF mixture at 750 ℃ for four hours under a slow flow of
N2 gas. After cooling down, carbon-coated AAO template was loaded into a small glass
vial, together with a controlled amount of 1% sulfur solution in toluene. The sample was
dried in a vacuum oven, before being heated up to 155 ℃ and kept for 12 hours to
ensure uniform sulfur diffusion into the carbon fibers. In this fabrication process, the
AAO membrane not only provided a template for hollow carbon nanofiber formation, but
also prevented sulfur from coating onto the external surface of the fiber wall. To remove
the AAO template, the AAO/carbon nanofiber/S composite is immersed in 2 M H3PO4
solution for 10 hours. Figure 2.2 c shows the digital camera images of pristine AAO
template before (white) and after (black) carbon coating and sulfur infusion, indicating
that sulfur was absorbed into the hollow carbon fibers.
2.2.2 Morphology and Structure Characterization

19
Scanning electron microscopy (SEM) images of the designed structures at different
stages of fabrication are shown in figure 2.3. After carbon coating at 750 ℃, continuous
hollow carbon nanofibers were formed inside the AAO template (figure 2.3 a). The outer
diameters of the nanofibers were about 200-300 nm, corresponding to the pore size of
AAO template. The weight gain after carbon coating was only ~2% of the AAO template.
Figure 2.3 b shows the image of hollow carbon nanofibers after sulfur infusion and AAO
etching. Typically, the weight ratio of sulfur to carbon was 3:1. The sulfur loading was
controlled so that there was enough free space for sulfur to expand during the formation
of Li2S. To confirm the presence of carbon and sulfur, EDS mappings were performed
over the cross section of the whole carbon nanofiber array, with the corresponding SEM
image in figure 2.3 c-e. Carbon and sulfur signals were detected uniformly over the
whole cross section, validating our structural design and indicating that sulfur was well
distributed within the hollow carbon nanofibers.

20
Figure 2.3 SEM characterizations of hollow carbon nanofiber-encapsulated sulfur. (a)
AAO template after carbon coating. (b) Carbon nanofiber-encapsulated sulfur after
etching away AAO template. (c) Cross section image of hollow carbon/sulfur nanofiber
arrays and elemental mapping of carbon (d) and sulfur (e) of figure 2.3 c.
Further evidence of sulfur containment within the carbon nanofiber was provided by
the transmission electron microscopy (TEM) images. Figure 2.4 a shows a hollow carbon
nanofiber with sulfur encapsulated inside. Sulfur appears darker under TEM as it is
heavier than carbon. An EDS line-scan (dashed red line) across the carbon nanofiber
further confirmed the presence of sulfur. The yellow spectrum represents the counts of
sulfur signal along the dashed line. The spectrum shows clearly that sulfur is present only
inside the hollow carbon nanofibers, but not outside. This is also verified by the sulfur
EDS mapping in figure 2.4 b. The full EDS spectrum over the whole tube (figure 2.4 c)
shows clearly the carbon and sulfur peaks but not any aluminum signal, indicating that
there is no or very little alumina residue. The wall thickness of the carbon nanofiber is
only 8-9 nm, which is important in allowing fast kinetic of lithium ion diffusion.

21
Figure 2.4 TEM characterizations of hollow carbon nanofiber-encapsulated sulfur. (a)
Bright field TEM image of an individual tube. The yellow line represents counts of sulfur
signal along the dashed red line. (b) Dark field STEM image (up) and EDS mapping of
sulfur (down, in yellow) of the tube. (c) The corresponding average EDS spectrum of the
hollow carbon nanofiber-encapsulated sulfur. Scale bars in figure 2.4 a and b are both
500 nm.
The above characterizations clearly show that hollow carbon nanofiber-encapsulated
sulfur was formed with the assist of AAO template. Raman spectroscopy and X-ray
diffraction (XRD) were also performed to understand the crystal structure of carbon and
sulfur in the final structure. The Raman measurement shows a typical spectrum of

22
partially graphitized carbon, indicated by the G band (1600 cm-1
) and D band (1360 cm-
1)30
. G band features the in-plane vibration of sp2 carbon atoms and D band originates
from the defects. The coexistence of the two bands indicated that the carbon was partially
graphitized with some defects and disorders.
XRD spectrum of the carbon/sulfur composites only shows a weak peak at 23.05,
corresponding to the strongest (222) peak of orthorhombic sulfur (PDF 00-001-0478).
This suggests that sulfur in the hollow nanofiber was very poorly crystallized, which was
consistent with previous observations that confined sulfur was less crystalline.10, 31
We
notice that there is no peak related to crystalline Al2O3 phase in the XRD pattern,
indicating that the AAO template was still amorphous after carbonization at 750℃ ,
which is crucial for the etching of Al2O3.
2.2.3 Electrochemical Performance
To evaluate the electrochemical performance of hollow carbon nanofiber-
encapsulated sulfur, 2032-type coin cells were fabricated. The prepared sample was
pressed onto Al substrate as the working electrode without any binder or conductive
additives. Lithium was used as the counter electrode. The electrolyte was 1 M lithium
bis(trifluoromethanesulfonyl)imide (LiTFSI) in 1,3-dioxolane and 1,2-dimethoxyethane
(volume ratio 1:1). The typical mass loading was 1.0 mg sulfur/cm2.
The voltage profiles of hollow carbon nanofiber-sulfur composites at different
current rates are shown in figure 2.5 a. The discharge/charge profile of both C/5 and C/2
show the typical two-plateau behavior of sulfur cathode, corresponding to the formation
of long chain polysulfides (Li2Sx, 4≤x≤8) at 2.3 V and short chain Li2S2 and Li2S at
2.1 V. Moreover, the second plateau is flat, suggesting a uniform deposition of Li2S with
little kinetic barriers.

23
Figure 2.5 Electrochemical performance of the carbon nanofiber-encapsulated sulfur
cathode. (a) Typical charge/discharge voltage profiles at C/5 and C/2. (b) Cycle life at
C/5 and C/2, as compared to a control sample in which the AAO was not etched away.
The voltage range is 1.7-2.6 V vs/ Li/Li+.
Figure 2.6 Electrochemical performance of the carbon nanofiber-encapsulated sulfur
electrode in electrolyte with LiNO3 additive. (a) Capacities for charge/discharge cycling
at C/5. (b) Comparison of coulombic efficiencies for samples with and without LiNO3
additive in the electrolyte, for cycling at C/5 and C/2.

24
Cycling performance at C/5 and C/2 is presented in figure 2.5 b, together with that of
the same carbon hollow fiber/S composite without removing AAO template. With AAO
etched away, the cathode structure showed impressive capacity retention. At C/5, the
reversible capacity was more than 900 mAh/g after 30 cycles of charge/discharge. This is
higher than the results reported for silica colloidal monolith (SCM) derived carbon/sulfur
composite, which shows a discharge capacity of around 500 mAh/g after 30 cycles at
C/5.14
A reversible capacity of around 730 mAh/g was observed after 150 cycles of
charge/discharge. The discharge capacity at C/2 also shows good cycling stability and the
reversible capacity was around 630 mAh/g after 150 cycles. These results show improved
performance in specific capacity as compared to our previous study on graphene-wrapped
sulfur cathode structures.17
In the control sample that the AAO template was not etched
away, the electrode has a much lower stable capacity of about 380 mAh/g. Interestingly,
the cycling stability of the non-etched sample was slightly better, as the capacity
stabilized after 15 cycles of charge/discharge and the decay was only about 3% for the
next 30 cycles before leveling off. This shows that the removal of AAO template is
necessary to improve charge transfer through the sidewall of the carbon fibers to achieve
high cycling capacity, but at the same time, alumina can potentially help trap polysulfides
to improve the cycle life.36
The mechanical support provided by the AAO template could
have also enhanced the stability of the cathode structure. Further optimization of the
etching time could realize the possibility of a sulfur electrode with better specific
capacity and cycle life.
To further improve the battery performance, 0.1 mol/L LiNO3 was added to the
electrolyte as additive. LiNO3 has been shown to passivate the surface of lithium anode
and thus reduce the shuttle effect.15,37
Figure 2.6 a shows that in the presence of LiNO3,
the initial discharge capacity was around 1560 mAh/g, approaching the theoretical
capacity of sulfur. The cycling stability is similar to the samples without LiNO3 additive.
More importantly, the average coulombic efficiency increases significantly from 84% to
over 99% at C/5 and from 87% to 98% at C/2 (figure 2.6 b). The improvement in

25
coulombic efficiency confirms that the LiNO3 additive can significantly reduce
polysulfides reaction at the lithium anode and thus the shuttle effect. The combination of
rational design of cathode structure and electrolyte additives can achieve high specific
capacity sulfur cathode with stable cycling performance and high efficiency.
2.2.4 Summary
In this section, we have developed a hollow carbon nanofiber-encapsulated sulfur
cathode to achieve high performance Li/S batteries. In this rational design, sulfur was
only coated onto the inner wall of carbon nanofibers by utilizing an AAO template. The
high aspect ratio of hollow carbon nanofibers reduces the random diffusion of
polysulfides in the organic electrolyte, while the thin carbon wall allows fast transport of
lithium ions. A stable discharge capacity of around 830 mAh/g was retained after more
than 60 cycles of charge/discharge at C/5. Addition of LiNO3 to the electrolyte
significantly improved the coulombic efficiency to 98% and 99% at C/2 and C/5
respectively. Our results show that the hollow carbon nanofiber-encapsulated sulfur
cathode structure could be a very promising candidate for high performance Li/S
batteries.
2.3 Conductive Polymer-wrapped mesoporous carbon/sulfur composite
2.3.1 Electrode design
As described in the introduction section of this chapter, mesoporous carbon has been
reported to be effective at trapping polysulfides due to their small pore size.21,27
Nevertheless, there is still a large surface area for polysulfides to escape, as the particle
size of the mesoporous carbon matrix is only 0.5 – 1 m (figure 2.7 a). As a result,
capacity decay of ~10% for the first 20 cycles was observed in mesoporous carbon/sulfur
composite. To tackle this issue, a polyethylene oxide (PEO) layer was linked on the

26
surface of mesoporous carbon to trap polysulfides.11
Though the discharge capacity was
improved, the cycling performance remained similar to cells without the PEO layer. This
is likely due to the fact that a monolayer of polymer is not enough to fully trap
polysulfides. In order to confine polysulfides more effectively, the surface coating layer
should be rigid and stable, but not too rigid to break during the expansion of sulfur upon
cycling. Moreover, it needs to be both ionically and electronically conductive, as
illustrated in figure 2.7 b. Poly(3,4-ethylenedioxythiophene)-poly(styrene sulfonate)
(PEDOT:PSS) is a good candidate based on these criteria, as it is stable and moderately
rigid in the electrochemical environment.42,43
PEDOT:PSS is also reported to be
thermally stable at 85 ℃ for over 1000 hours with minimal change on electrical
conductivity.44
Herein we explore the unique application of PEDOT:PSS-based
conductive polymer for further improving the electrode performance of CMK-3
mesoporous carbon/sulfur composite.
Figure 2.7 The scheme of PEDOT:PSS-coated CMK-3/sulfur composite for improving
the cathode performance. (a) In bare CMK-3/S particles (grey: CMK-3, yellow: sulfur),
polysulfides (green color) still diffuse out of the carbon matrix during
lithiation/delithiation. (b) With conductive polymer coating layer (blue color),

27
polysulfides could be confined within the carbon matrix, and lithium ions and electrons
can move through the polymer layer.
2.3.2 Material Synthesis and Electrode Fabrication
CMK-3 mesoporous carbon was synthesized according to established
procedures21,45–47
. First, SBA-15 mesoporous silica was synthesized as a template for the
creation of CMK-3. 1 g of Pluronic P123 (EO20PPO70EO20) was dissolved in 30 ml of 2
M HCl at 38 ºC. Tetraethylorthosilicate (2.1 g, Sigma Aldrich) was then added and the
solution was stirred for 6 minutes. After remaining still at 38 ºC for 24 h, the mixture was
transferred into an autoclave (Parr Co.) and heated at 100 ºC for another 24 h. After this
step, the powder was filtered, dried, and calcined in air at 550ºC. To create the CMK-3
mesoporous carbon from the SBA-15 mesoporous silica particles, 0.625 g of sucrose was
dissolved in 2.5 ml of water containing 0.07 g H2SO4, and 0.5 g of SBA-15 was dispersed
in the solution. The mixture was sonicated for 1 h, heated at 100 ºC for 6 h, and then
heated at 160 ºC for another 6 h. This sucrose infiltration process was then repeated with
a 2.5 ml aqueous solution containing 0.4 g sucrose and 45 mg H2SO4, and the same
heating schedule was employed. Finally, the composite was carbonized at 900 ºC in a
nitrogen atmosphere, and a 5% HF solution was used to remove the silica template by
soaking the composite particles for 4-8 hours. Infiltration of sulfur into CMK-3 porous
carbon was achieved by heating a well-mixed CMK-3/sulfur at 155 ℃ for 12 hours. The
weight ratio of carbon to sulfur was 1:1.
Poly(3,4-ethylenedioxythiophene) poly(styrene sulfonate) (PEDOT:PSS) solution
was prepared by filtering commercially available solution (~1 wt% solid content, Clevios
PH1000) and adding 5% dimethyl sulfoxide (DMSO), subsequently diluted with
deionized water at volume ratio of 1:10 (~0.1% wt%). 25 wt% extra ethanol was added to
improve the wetting between CMK-3/sulfur particles and the polymer solution (final

28
PEDOT:PSS concentration is ~0.08% wt%). To coat PEDOT:PSS onto cmk-3/sulfur
composites, 10 mg CMK-3/sulfur composite particles was added into 1 ml as-prepared
PEDOT:PSS solution and bath sonicated for 1 hour.
The sulfur electrode was made by drop casting the solution onto aluminum foil and
drying at 60 ℃ under vacuum. Then the sample was baked at 80 ℃ for another 30 min.
No binder or extra conductive additive was used. Control samples without PEDOT:PSS
coating were prepared in the same way. 2032-type coin cells were fabricated for
electrochemical testing. Lithium was used as the counter electrode. The electrolyte was 1
M lithium bis(trifluoromethanesulfonyl)imide (LiTFSI) in 1,3-dioxolane and 1,2-
dimethoxyethane (volume ratio 1:1). The typical mass loading of cathode materials was
1.0 mg /cm2 and the percentage of sulfur in the electrode is ~43%. Impedance
spectroscopy and cyclic voltammetry results were measured with lithium as both the
counter electrode and the reference electrode. The frequency range for impedance study
was 200 kHz – 0.1 Hz.
2.3.3 Morphology and structure characterization
Figure 2.8 a and b show scanning electron microscope (SEM) images of bare and
PEDOT:PSS-coated CMK-3/sulfur composite, respectively. The particle size of these
two kinds of samples is similar, about 0.5 – 1 m. However, it is obvious that the surface
looks different. In Figure 2.8 b, the CMK-3/sulfur particles are wrapped by a polymer
layer and the surface appears smoother. Polymer is also found between particles, as
indicated by the arrow. The polymer between particles acts as binder to improve the
adhesion between particles and between particles and aluminum substrate. The as-made
electrode sticks to the aluminum substrate very well.

29
Figure 2.8 SEM images of CMK-3/sulfur particles before (a) and after (b) PEDOT:PSS
coating. In the sample with polymer coating, the particles were wrapped by a polymer
layer. The arrows indicate polymer between particles.
X-ray photoelectron spectroscopy (XPS) was used to further confirm and
characterize the polymer coating layer on the surface of the sulfur electrode. Figure 2.9
a–c show the sulfur (2p) peak of pure PEDOT:PSS film, CMK-3/sulfur composite and
PEDOT:PSS coated CMK-3/sulfur from top to bottom. Pure PEDOT:PSS film exhibits
two peaks at 168.0 and 163.6 eV, respectively. Further fitting indicates that each peak can
be split into two peaks. The two with higher energies of 168.7 eV and 167.5 eV can be
assigned to poly(styrene sulfonate), and the other two at 165.3 eV and 163.5 eV are
attributed to PEDOT.48
CMK-3/sulfur shows two peaks at 163.2 and 164.3 eV, which are
the characteristic peaks of elemental sulfur. A weak broad peak centered between 169
and 170 eV is observed, which is likely due to the surface oxidation of sulfur or strong
interaction between sulfur and mesoporous carbon.49
The PEDOT:PSS coated CMK-
3/sulfur sample shows a XPS spectrum very similar to that of pure PEDOT:PSS film. The
peak at 168 eV is assigned to PSS. This proves that PEDOT:PSS presents on the surface
of CMK-3/sulfur particles. As the positions of the PEDOT peak and the CMK-3/sulfur
peak are too close to each other, it is hard to separate the contribution of PEDOT and
CMK-3/sulfur to the peak at 164 eV. However, as the intensity ratio of the two broad
peaks is close to that of pure PEDOT:PSS film, it is likely that most signals come from
PEDOT, not elemental sulfur. Furthermore, as the penetration depth of XPS is about 10

30
nm, it is likely that the possible elemental sulfur signal comes from places where the
polymer layer is thinner than 10 nm. The SEM and XPS results indicate that most surface
area of particles are covered with PEDOT:PSS polymer thus the coating is quite
conformal.
Figure 2.9. XPS characterization of PEDOT:PSS-coated CMK-3/sulfur particles. From
top to bottom: (a) pure PEDOT:PSS film, (b) bare CMK-3/sulfur particles and (c)
PEDOT:PSS coated CMK-3/sulfur particles.

31
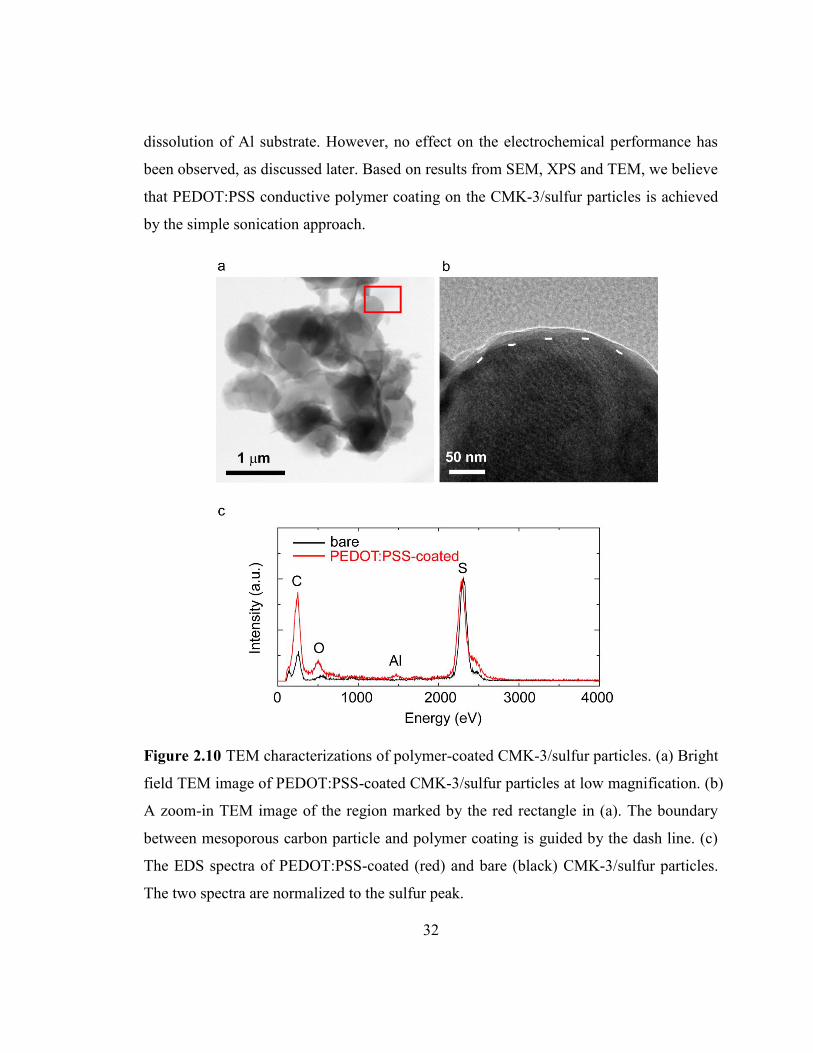
Transmission electron microscope (TEM) was used to examine the morphology and
property of PEDOT:PSS coating on individual CMK-3/sulfur particles. Figure 2.10 a
exhibits a bright field TEM image of agglomerated particles coated with PEDOT:PSS.
The particle size is close to 1 m. Figure 2.10 b shows a zoom-in image in the region
marked by the red rectangle in figure 2.10 a. In this figure, vague parallel lines can be
observed in the particle, which reflects the hexagonal packing structure of carbon tubes in
the CMK-3 mesoporous carbon.21
We observed that these lines did not extend to the edge
of particles, but they were surrounded by a thin amorphous layer with a thickness of ~10
nm, as guided by the dash lines. Such amorphous layer has been observed on most
particles, and the thickness was typically 10 - 20 nm. This is obviously different from
TEM images of their bare counterpart. In bare CMK-3/sulfur samples, the parallel lines
clearly reach the edge of particles and no coating is observed. The contrast between the
coating layer and CMK-3/sulfur particle is not strong, which could be explained by the
similar elemental composition of PEDOT and CMK-3/sulfur. As shown in Table 2.1,
PEDOT:PSS and CMK-3/sulfur composite contain almost the same amount of carbon in
weight (52% vs 50%), although PEDOT:PSS has less sulfur element (19% vs 50%) and
contains more oxygen (25%) and hydrogen (4%). Consequently, the coating layer
appears lighter under the bright field TEM but no significant contrast could be observed.
Corresponding energy-dispersive X-ray spectroscopy (EDS) of polymer-coated and bare
CMK-3/sulfur particles are illustrated in figure 2.10 c. The two spectra are normalized to
the sulfur peak. In the bare sample, the relative intensity of carbon peak is remarkably
lower, as the portion of carbon in bare CMK-3/sulfur is much less compared to the
PEDOT:PSS-coated sample (Table 2.1). Moreover, though trace amount of oxygen is
detected in bare particles due to surface oxidation and silica residue, the spectrum of
polymer-coated CMK-3/sulfur shows a significantly higher peak of oxygen at 0.51 keV,
since oxygen only exists in PEDOT:PSS, but not CMK-3/sulfur composite, this further
proves that the amorphous layer is PEDOT:PSS. Trace amount of Al was detected too.
This is due to the acidicity of PEDOT:PSS solution which leads to a small amount of
32
dissolution of Al substrate. However, no effect on the electrochemical performance has
been observed, as discussed later. Based on results from SEM, XPS and TEM, we believe
that PEDOT:PSS conductive polymer coating on the CMK-3/sulfur particles is achieved
by the simple sonication approach.
Figure 2.10 TEM characterizations of polymer-coated CMK-3/sulfur particles. (a) Bright
field TEM image of PEDOT:PSS-coated CMK-3/sulfur particles at low magnification. (b)
A zoom-in TEM image of the region marked by the red rectangle in (a). The boundary
between mesoporous carbon particle and polymer coating is guided by the dash line. (c)
The EDS spectra of PEDOT:PSS-coated (red) and bare (black) CMK-3/sulfur particles.
The two spectra are normalized to the sulfur peak.

33
Table 2.1 The weight percentage of elements in PEDOT:PSS and CMK-3/sulfur
composite
C S O H
PEDOT:PSS 52 19 25 4
CMK-3/sulfur 50 50 0 0
2.3.4 Electrochemical Performance
To study the electrochemical characteristics of PEDOT:PSS-coated CMK-3/sulfur
composites, cyclic voltammetry (CV) was first performed at a scan speed of 0.2 mV/s
(figure 2.14 a). The PEDOT:PSS-coated CMK-3/sulfur sample exhibited the same
characteristics as the sulfur electrode. Under anodic current, two oxidative peaks at 2.15
V and 1.80 V were observed, corresponding to the redox reaction of high order
polysulfides and Li2S2/Li2S, respectively. When voltage sweep was reversed, the CV plot
exhibited a broad peak at 2.63 V with a shoulder at 2.80 V. This indicates that two
reductive peaks exist and overlap with each other, which corresponds to the reversed
reactions. Little difference is observed between the first and the second scan, suggesting a
subtle decay in capacity upon cycling. The CV profile of the bare CMK-3/sulfur sample
is presented as the dashed line. The redox peaks exist at similar positions but their
amplitudes are smaller. The CV scan result of pure PEDOT:PSS film is also presented by
the blue curve. The absolute magnitude of current is two orders smaller than that of
PEDOT:PSS coated CMK-3/sulfur electrode; thus the contribution of PEDOT:PSS to the
capacity is negligible.
The voltage profiles of polymer-coated CMK-3/sulfur composites at different current
rates are shown in figure 2.11 b. Consistent with results from cyclic voltammetry, we
observed the typical two-plateau behavior of sulfur cathode, corresponding to the
formation of long chain polysulfides (Li2Sx, 4≤x≤8) at 2.3 V and short chain Li2S2 and
Li2S at 2.1 V. The discharge capacity of the second discharge cycle was 1179 mAh/g at a

34
current rate of C/10 (1C = 1673 mA/g), which is much higher than the bare
mesoporous/sulfur composite.21,50
The discharge capacity remained as high as 1092 and
885 mAh/g at C/5 and C/2, respectively. To separate the contribution of PEDOT:PSS and
sulfur to the overall capacity, the electrochemical characteristics of PEDOT:PSS film
were examined at a current rate of 100 mA/g. Capacity of less than 1.0 mAh/g can be
extracted from PEDOT:PSS itself (figure 2.12). This means that PEDOT:PSS used in our
experiment was not involved in any noticeable electrochemical reaction in the voltage
window of sulfur electrode (1.7 – 2.6 V vs Li/Li+). The voltage profile of bare CMK-
3/sulfur particles is shown by the red dashed line in figure 2.11 b. The discharge capacity
is 941 mAh/g, which is 14% less than that of polymer-coated CMK-3/sulfur. There are
two possible reasons. First, PEDOT:PSS coating help trap polysulfides so that more
polysulfides could be converted to Li2S. This is supported by the fact that the major
difference in capacity comes from the second discharge plateau. The other possible
reason is the high electronic conductivity of PEDOT:PSS51
as conductive coating is
capable of enhancing the rate performance of insulating materials.43,52–54
Figure 2.11 Electrochemical characterization of PEDOT:PSS-coated CMK-3/sulfur
particles. (a) The cyclic voltammetry of PEDOT:PSS-coated CMK-3/sulfur particles in
the first two cycles and pure PEDOT:PSS film. (b) The voltage profiles of PEDOT:PSS-
coated CMK-3/sulfur particles at different current rates (1C = 1673 mA/g). The second
charge/discharge curves are presented in the plot.
35
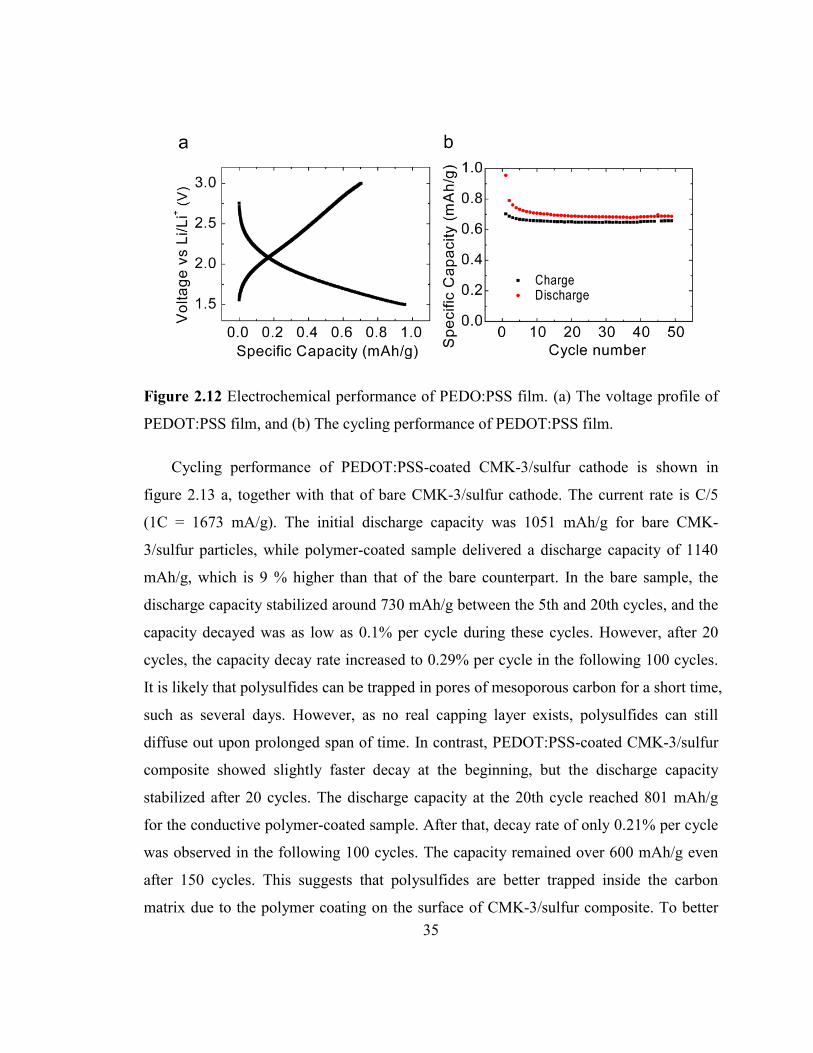
Figure 2.12 Electrochemical performance of PEDO:PSS film. (a) The voltage profile of
PEDOT:PSS film, and (b) The cycling performance of PEDOT:PSS film.
Cycling performance of PEDOT:PSS-coated CMK-3/sulfur cathode is shown in
figure 2.13 a, together with that of bare CMK-3/sulfur cathode. The current rate is C/5
(1C = 1673 mA/g). The initial discharge capacity was 1051 mAh/g for bare CMK-
3/sulfur particles, while polymer-coated sample delivered a discharge capacity of 1140
mAh/g, which is 9 % higher than that of the bare counterpart. In the bare sample, the
discharge capacity stabilized around 730 mAh/g between the 5th and 20th cycles, and the
capacity decayed was as low as 0.1% per cycle during these cycles. However, after 20
cycles, the capacity decay rate increased to 0.29% per cycle in the following 100 cycles.
It is likely that polysulfides can be trapped in pores of mesoporous carbon for a short time,
such as several days. However, as no real capping layer exists, polysulfides can still
diffuse out upon prolonged span of time. In contrast, PEDOT:PSS-coated CMK-3/sulfur
composite showed slightly faster decay at the beginning, but the discharge capacity
stabilized after 20 cycles. The discharge capacity at the 20th cycle reached 801 mAh/g
for the conductive polymer-coated sample. After that, decay rate of only 0.21% per cycle
was observed in the following 100 cycles. The capacity remained over 600 mAh/g even
after 150 cycles. This suggests that polysulfides are better trapped inside the carbon
matrix due to the polymer coating on the surface of CMK-3/sulfur composite. To better

36
compare the cycling performance of polymer-coated and bare CMK-3/sulfur particles,
the discharge capacity is normalized to that at the 20th cycles (figure 2.13 b). It is
obvious that polymer-coated samples showed a superior cycling performance in the long
run. Especially between 80th and 120th cycles, bare CMK-3/sulfur sample exhibited a
capacity decay of 40% per 100 cycles while PEDOT:PSS-coated counterpart decayed as
little as 15% per 100 cycles. This further proves that the decay accelerated in bare
samples but slowed down in those with protective polymer coating. There are two
possible reasons accounting for the remaining decay of 0.2% per cycle. First, small
amount of particles were not conformally coated with the polymer so that leakage path
for polysulfide dissolution still exists. Second, the volume expansion and contraction of
sulfur electrode might lead to the degradation of PEDOT coating layer under mechanical
strain. Optimization on the polymer concentration and selection of polymer in the future
could further minimize the polysulfides leakage and the fatigue of polymer coating. We
notice that recently there is a report on using commercial PEDOT:PSS binder to improve
the performance of mesoporous carbon/sulfur composite, which shows a capacity decay
of 20-25%/100 cycles at 0.1 C rate.35
The results are consistent with our observations.
The better trapping capability of PEDOT:PSS coating is also reflected in the
improved coulomb efficiency (figure 2.13 c). In bare samples, the coulomb efficiency of
sulfur electrode was about 92-94%. After polymer coating, the coulomb efficiency
increased to 96-98% at the same current rate. It was reported that 99.84% coulomb
efficiency is achieved based on bare CMK-3/sulfur sample.21
However, data of only one
cycle was presented. In our work, we notice that it was possible to achieve coulomb
efficiency between 99% and 101% in the first several cycles due to a competition
between shuttle effect and capacity decay during charging. However, it has never been
observed that coulomb efficiency could reach over 99% for more than several cycles. In
addition, both cycling and coulomb efficiency showed small fluctuation with a
periodicity of one day, which should be induced by variation of the environmental
temperature.

37
Figure 2.13 Cycling performance comparison of PEDOT:PSS-coated and bare CMK-
3/sulfur particles as cathode materials. (a) Absolute discharge capacity and (b)
normalized discharge capacity against cycle number. The decay accelerated in bare
samples while slowed down in polymer-coated ones. (c) The coulomb efficiency
comparison of both polymer-coated and bare samples in the first 100 cycles.
To further understand the effect of PEDOT:PSS coating on transport characteristics
of the sulfur electrode, electrochemical impedance spectroscopy (EIS) is performed on
both polymer coated and bare CMK-3/sulfur electrodes (figure 2.14). Three different
states are examined, including before discharging, the end of the first discharge and the

38
end of the first charge, as shown in figure 2.14 b–d. All impedance results show
depressive semicircles. At the beginning, the charge transfer resistance of PEDOT:PSS-
coated sample is smaller than that of bare CMK-3/sulfur particles. However, at the end of
discharge, the impedance of the polymer-coated sample increases to be slightly larger
than that of bare CMK-3/sulfur particles and there is likely a second semicircle in the
PEDOT:PSS-coated sample. This is possibly due to a lithiated PEDOT layer which
slightly impedes the charge transfer at the same time of blocking polysulfides diffusion.
After charging back, the impedance of PEDOT:PSS-coated and bare particles become
close to each other. These impedance results indicate that PEDOT:PSS coating layer can
transport lithium ions and electrons readily though small kinetic barrier may exist due to
the polymer layer. However, this barrier does not lead to lower capacity or poorer cycle
life. This means that the specific capacity and cycle life are dominated by polysulfides
diffusion and volume expansion of sulfur.
2.3.5 Summary
In this section, conductive polymer PEDOT:PSS coating on the surface of
mesoporous carbon/sulfur particles was demonstrated. The coating layer can effectively
trap polysulfides, and minimize the dissolution of polysulfides and the loss of active mass
in cathodes, which leads to the notable improvement of the performance of Li-S batteries.
The initial discharge capacity reached 1140 mAh/g, which is ~10% higher than that of
the bare counterpart. More significantly, the discharge capacity remained over 600
mAh/g at the 150th cycle. The cycle life and coulomb efficiency were markedly
improved. In prolonged cycling, the capacity retention enhanced from ~60%/100 cycles
to ~85%/100 cycles. Coulomb efficiency also increased from 93% to 97%. The strategy
of conductive polymer coating on the exterior surface of active electrodes can be
potentially generalized for improving the performance of other electrode materials in
lithium ion batteries.

39
Figure 2.14 Impedance study of PEDOT:PSS-coated CMK-3/sulfur electrodes. (a) The
voltage profile of PEDOT:PSS-coated CMK-3/sulfur electrode. (b - d) The impedance
spectrum of both bare and polymer-coated samples at different states indicated in figure
2.14 a.
2.4 Conclusion
Li-S battery is a promising candidate for next generation rechargeable battery due to
its high energy density. However, many challenges present for its commercialization.
There are three major issues related to the sulfur cathode: 1) Volume change of sulfur, 2)
the insulating nature of Li2S, and 3) soluble polysulfides. To solve these problems, an
idea sulfur electrode should have the following characteristics: 1) a closed structure for
efficient polysulfides containment; 2) limited surface area for sulfur-electrolyte contact;

40
3) sufficient space to accommodate sulfur volumetric expansion and small dimension of
the sulfur electrode to avoid pulverization; 4) a short transport pathway for both electrons
and Li ions to achieve high capacity at a high power rate; 5) a large conductive surface
area for depositing insulating Li2S2 and Li2S, in order to preserve the morphology of
electrodes; and 6) suitable electrolyte additives to passivate lithium surface to minimize
the shuttle effect. Some of these characteristics require structure designs that are self-
conflicting, such as the minimization of sulfur/electrolyte contact and the large surface
area needed for Li2S2 and Li2S plating, which explain why it is very challenging to realize
sulfur electrodes with high specific capacity and long cycle life.
In this chapter, two designs are presented to meet these criteria. First, a hollow
carbon nanofiber-encapsulated sulfur cathode was developed to achieve high
performance Li-S batteries. In this rational design, sulfur was only coated onto the inner
wall of carbon nanofibers by utilizing an AAO template. The high aspect ratio of hollow
carbon nanofibers reduces the random diffusion of polysulfides in the organic electrolyte,
while the thin carbon wall allows fast transport of lithium ions. Initial capacity of 1390
mAh/g is achieved at C/5 and the cycle life is significantly improved, with a capacity of
around 730 mAh/g is retained after more than 150 cycles of charge/discharge. The
second approach is conductive polymer PEDOT:PSS coating on the surface of
mesoporous carbon/sulfur particles was demonstrated. The coating layer can effectively
trap polysulfides, and thus minimize the dissolution of polysulfides and the loss of active
mass in cathodes, which leads to the notable improvement of the performance of Li-S
batteries. The initial discharge capacity reached 1140 mAh/g, which is ~10% higher than
that of the bare counterpart. More significantly, the discharge capacity remained over 600
mAh/g at the 150th cycle. The cycle life and coulomb efficiency were markedly
improved. In prolonged cycling, the capacity retention enhanced from ~60%/100 cycles
to ~85%/100 cycles. Coulomb efficiency also increased from 93% to 97%. These designs
pave roads for further optimization and even commercialization of rechargeable Li-S
batteries.

CHAPTER 3: IN-SITU X-RAY STUDIES OF SULFUR CATHODES
3.1 Introduction
As described in the previous chapter, sulfur cathodes are promising for next
generation rechargeable batteries and lots of progresses have been achieved in enhancing
their performance. However, the basic chemistry behind is still controversial and not
comprehensively understood.55
For example, there is disagreement on whether sulfur
reappears at the end of charging, and whether Li2S is crystalline at the end of discharge.
Previous studies on the phase evolution are based on ex-situ X-ray diffraction. Most of
them show the formation of crystalline Li2S by the end of the discharge and no oxidation
to crystalline sulfur by the end of the charge cycle.56–59
Two outliers to these results are
the work done by Wang et al. using gelatin as a binder, where elemental sulfur diffraction
peaks reappeared after a full charge, even after 50 cycles,60
and the work by Elazari et al.
studying Li-S batteries from Sion Power Inc. which used electron diffraction to show that
crystalline sulfur remained after full discharge in cells cycled fewer than 10 times and
Li2S was only evident in discharged cells cycled more than 10 times.61
Moreover, there
is also no study on the morphology evolution of these materials under electrochemical
reactions.
To guide better design of sulfur electrode, a more complete understanding of the
reaction mechanism is needed. Especially in-situ studies are favored because the same
battery is studied throughout the full electrochemical cycle without the addition of
artifacts from post treatments. Synchrotron-based techniques are powerful for in-situ
studies of battery as it has long penetration depth (e.g. ~ mm for carbon), high resolution
(~30 nm) and high brightness. In this chapter in-situ X-ray diffraction and imaging of
sulfur cathodes are performed. We find that recrystallization of sulfur is strongly
dependent on the cathode preparation technique. Conversely, crystalline Li2S never forms
at the end of discharge for all cathodes studied, which is counter to published ex-situ

42
XRD results. Furthermore, with the use of in-situ Transmission X-ray Microscopy
(TXM), we found that the bulk of soluble polysulfides remain trapped within the carbon;
although, ex-situ SEM studies on similarly prepared sulfur cathodes suggest a complete
or significant loss of soluble polysulfides to the electrolyte. Both our XRD and TXM
results are significantly different from previous ex-situ findings and demonstrate the
importance of in-situ studies.
3.2 Experimental Setup for in-situ X-ray studies
3.2.1 In-situ X-ray Diffraction
XRD measurements were recorded in-situ at 12.74 keV at beamline 11-3 at the
Stanford Synchrotron Radiation Lightsource (SSRL). The diffracted intensities were
recorded on a 2D Mar345 image plate detector (Marresearch GmbH) with 150 × 150 µm2
pixels. Measurements were done in transmission with a detector distance 145 mm from
the sample center. The incident beam on the sample was approximately 50 × 50 µm2. For
in-situ measurements, diffraction intensities were collected in five-minute intervals with
210-second exposure time. Data were internally calibrated using the aluminum
diffraction peaks.
3.2.2 In-situ X-ray Imaging
TXM was performed in-situ using a full-field Xradia microscope at SSRL beamline
6-2c, as shown in figure 3.1. The microscope is optimized to operate between ~ 5 to 14
keV. For the Li-S batteries, micrographs were taken at 6 keV, an energy that optimizes
both the sulfur contrast and the efficiency of the objective lens. The spatial resolution
provided by the instrument is as fine as 30 nm with a field of view typically around 15 –
30 µm. For the in-situ microscopy presented here, a total of five sample positions were

43
imaged at approximately 5 min intervals with a camera binning of 2. The raster scanning
capability of the microscope was used to image regions of ~ 40 × 40 µm2. Additional
details about the microscope are found in papers by Andrews et al.,62
and Liu et al.,63
.
Samples are imaged through a horizontal through-hole, which is designed with a cut-
away to permit X-rays to pass unobstructed even at large imaging angles. Finally, there is
an additional through-hole, which is not occluded by the sample and allows reference
images to be taken. Reference images were taken approximately every 25 minutes and
were used to remove imaging artifacts due to imperfections in the X-ray beam and
detector system. Micrographs were processed using TXM Wizard.63
Analyses include
reference correction, repeated exposure averaging, mosaic stitching, and alignment of
sequential images.

44
Figure 3.1 Schematic of Transmission X-ray Microscopy. (a) Principle of TXM and (b)
the real setup of TXM at SLAC
3.2.3 Cell Construction
X-ray transparent in-situ battery pouch cells were designed for both XRD and TXM (
figure 3.2). The pouch is made of polyester-based plastic bags with a thickness of 4.5
mils (~114 m). To maintain good electrical contact inside the in-situ pouch cells during
imaging, moderate pressure is applied using two parallel aluminum plates shown in
figure 3.2 a, where the pressure can be controlled by tightening four screws that hold the
plates together. Figure 3.2 b and c show a real Li-S cell for X-ray studies and
corresponding schematic, respectively.
The cells are composed of a lithium metal anode, a Celgard separator soaked in an
electrolyte of (1.0 M) lithium bis(trifluoromethanesulfonyl)imide (LiTFSI) in 1,3-
dioxolane and 1,2-dimethoxyethane (volume ratio 1:1), and a cathode of micron-sized
sulfur (37.5 wt%; Sigma-Aldrich), Super P carbon black (42.5 wt%; Timcal Graphite &
Carbon), and Kynar PVDF binder (20 wt%; Arkema Inc.). To prepare the electrode,
sulfur particles, and Super P (1:1 by weight) are ball-milled 10 min then heated to 155°
C. After cooling, the composite is mixed with PVDF binder (20 wt%) and additional
Super P (5 wt%) and ball milled another 10 min before being dispersed in N-methyl-2-
pyrrolidone to make a slurry, which is loaded onto an aluminum current collector. The
cells are assembled inside an argon-filled glovebox and heat-sealed in polyester pouches
(Kapak Co.) with aluminum and copper current collectors for cathode and anode
electrodes, respectively. The cells for both techniques were identical, except TXM cells
were approximately half the size to be compatible with the stricter sample size
restrictions. The cells were cycled at constant current, with a charge rate of C/8 – unless
otherwise noted – assuming a theoretical capacity of 1673 mA h g−1
with a MTI eight-
channel battery analyzer (0.002 – 1 mA).

45
Figure 3.2 Experimental setup for in-situ X-ray studies. (a) Zoom-in camera image of the
region for mounting sample. The battery cell is inserted into a holder with screws at
corners for applying pressure. (b) Camera image of a real Li-S cell for X-ray studies. (c)
Schematic of the structure of the cell. Polymer bag (grey), metal contact (orange), lithium
(purple), separator (green) and sulfur cathode (yellow).

46
3.3 In-situ X-ray Diffraction of Sulfur Cathodes
Figure 3.3 shows the in-situ XRD results on a Li-S cell during the first galvanostatic
electrochemical cycle, as a function of specific capacity. The XRD pattern at the start of
the discharge cycle is presented in figure 3.3 a with the diffraction peaks associated with
crystalline S (Q = 1.09, 1.63, 1.82, 1.89, 1.96, 3.27, and 3.65 Å−1
; JCPDS # 01-073-
5065), Li (Q = 2.53 and 5.07 Å−1
; JCPDS # 01-001-1131), and Al (Q = 2.69, 3.10, 4.39,
5.15, and 5.37 Å−1
; JCPDS # 01-004-0787) labeled. All unlabeled peaks are associated
with either the polymer pouch or polymer separator. Figure 3.3 b contains a magnified
view of the section of Q-space indicated by a red box in figure 3.3 a, as sulfur is reduced
in accordance with the electrochemical plot shown in figure 3.3 c. During reduction, the
sulfur peaks decrease in intensity and disappear completely before the end of the first
discharge plateau, indicating that all of the crystalline sulfur is reacting with lithium ions.
During the charging cycle, sulfur peaks reappear towards the end of the cycle indicating
that polysulfides have been oxidized to crystalline sulfur. This phase evolution is
consistent for a cell of the same electrode morphology cycled at C/20 suggesting that the
crystallinity and nature of products formed during the electrochemical cycle do not
depend on the current rate. These results are contrary to most previous ex-situ results,
which report the active material remains as polysulfides at the end of the charge cycle.58
To more clearly establish this behavior, the integrated intensities of the sulfur (222),
(026) and (206) Bragg peaks are plotted in figure 3.4 as a function of specific capacity.
To calculate the integrated intensities, the peaks were fit with pseudo-Voigt functions.
The relative integrated intensities of the three peaks of the pristine sulfur are different
than those at the end of the charge cycle, which indicates a possible reorientation of the
sulfur particles upon recrystallization. Similar changes in relative sulfur peak intensity are
also seen in the cell cycled at C/20. This prohibits any estimation of the amount of
crystalline sulfur present after the first charge cycle.

47
Notably, figure 3.3 shows no crystalline Li2S peak at 1.90 Å−1
(JCPDS # 01-089-
1730) at the end of discharge cycle in contrast to previous ex-situ reports.8,10,11,14,26-28
Nevertheless, according to the electrochemical cycle it is likely that amorphous Li2S is
forming; however, its existence in an amorphous state was not confirmed. The presence
of an amorphous rather than the crystalline form could have an influence on the
insulating nature of the Li2S on the cathode.
Figure 3.3. In-situ XRD patterns of a Li-S cell cycled at C/8 and with a cathode prepared
as a sulfur/Super P composite: (a) XRD pattern at the start of the discharge cycle, (b)
XRD patterns for the region of Q-space marked by the red box in (a) for points a – j
labeled in (c) the corresponding electrochemical plot. The XRD patterns show the
reappearance of sulfur diffraction peaks at the end of the first charge cycle. Sulfur peaks
in (b) are labeled with their Miller indices. Unlabeled peaks are from the polymer pouch
and separator. XRD patterns that are blue include sulfur peaks. The total discharge
capacity is 755 mA h g−1
and the total charge capacity is 707 mA h g−1
.

48
Figure 3.4 Integrated diffraction intensities of sulfur peaks for a Li-S cell cycled at C/8
and with a cathode prepared as a sulfur/Super P composite: (a) electrochemical plot
showing the first cycle of the Li-S cell, (b) and (c) integrated intensity plots for (222),
(026) and (206) Bragg peaks, which show the disappearance of crystalline sulfur by the
end of the first discharge plateau and its reappearance by the end of the charge cycle. The
blue arrows indicate the specific capacity regions over which the integrated intensities are
plotted. The dashed lines emphasize where sulfur peaks disappear and reappear. The total
discharge capacity is 755 mA h g−1
and the total charge capacity is 707 mA h g−1
. Error
bars on the integrated intensities were determined using Levenberg-Marquardt
minimization.
To explore whether or not the reappearance of crystalline sulfur and the lack of
crystalline Li2S are direct consequences of the preparation method of the sulfur/Super P
composite electrode or the in-situ nature of the experiment, two alternative preparation
methods were investigated at a rate of C/10. The first alternative was prepared as a slurry

49
of micron-sized sulfur particles mixed with Super P carbon black and PVDF binder. The
micron-sized sulfur particles were synthesized by mixing hydrochloric acid and sodium
thiosulfate aqueous solution together.55
The second was grapheme/polyethylene glycol
coated sulfur particles.31
For both of these alternative methods, diffraction peaks of Li2S
after discharge and elemental sulfur after charge were not visible. It follows that the
reappearance of crystalline sulfur is strongly dependent on the cathode morphology
dictated by the preparation technique. However, all three preparation methods studied did
not form crystalline Li2S during the discharge cycle.
To further test if the absence of crystalline Li2S is due to the cathode preparation
method or the in-situ nature of the experiment, ex-situ XRD data were recorded on a
discharged Li-S cell with sulfur/Super P composite electrode. After one day resting, ex-
situ XRD shows Li2S peaks. This suggests that amorphous Li2S is formed during
discharge and crystalline Li2S forms only when a discharged cell is allowed to rest.
Further investigations are required to determine the time window in which crystalline
Li2S forms and to verify the existence of amorphous Li2S. Nevertheless, these results
demonstrate that in-situ XRD is necessary for proper characterization of the Li-S battery
crystalline structure and that the previously observed Li2S may be an artifact of ex-situ
XRD.
3.4 In-situ Transmission X-ray Microscopy of Sulfur Cathodes
Figure 3.5 shows a series of TXM micrograph of a pristine Li-S cell with a ~ 10 µm
sized sulfur/Super P composite particle at different charge/discharge states. The one
before discharge is represented as figure 3.5 a. Because of the low absorption of carbon
compared to sulfur at 6 keV, the contrast between the sulfur/Super P composite particles
and the background is high. Furthermore, the brighter the particle the more sulfur it
contains throughout its thickness. These X-ray images are consistent with SEM/EDS
results, as shown in figure 3.7.

50
Figure 3.5 In-situ TXM micrographs of a sulfur/Super P composite particle during
operation, where the letters correspond to points along the electrochemical cycle labeled
a – i in figure 3.6 b. The majority of morphological changes occur between images a – c,
corresponding to the first plateau of the discharge. Micrographs were taken at 6 keV and
are an average of three 5-second exposures recorded approximately every 5 min with a
CCD binning of 2. The green outline around the particle in (a) replicated in (c) to show
the overall decrease in particle size and increased porosity. The yellow arrows show a
small particle that expands between (a) and (b). The scale bar is 10 µm.
The nine micrographs shown in figure 3.5 are a selection from those recorded every
5 min throughout the first electrochemical cycle of the pouch cell. The frame labels
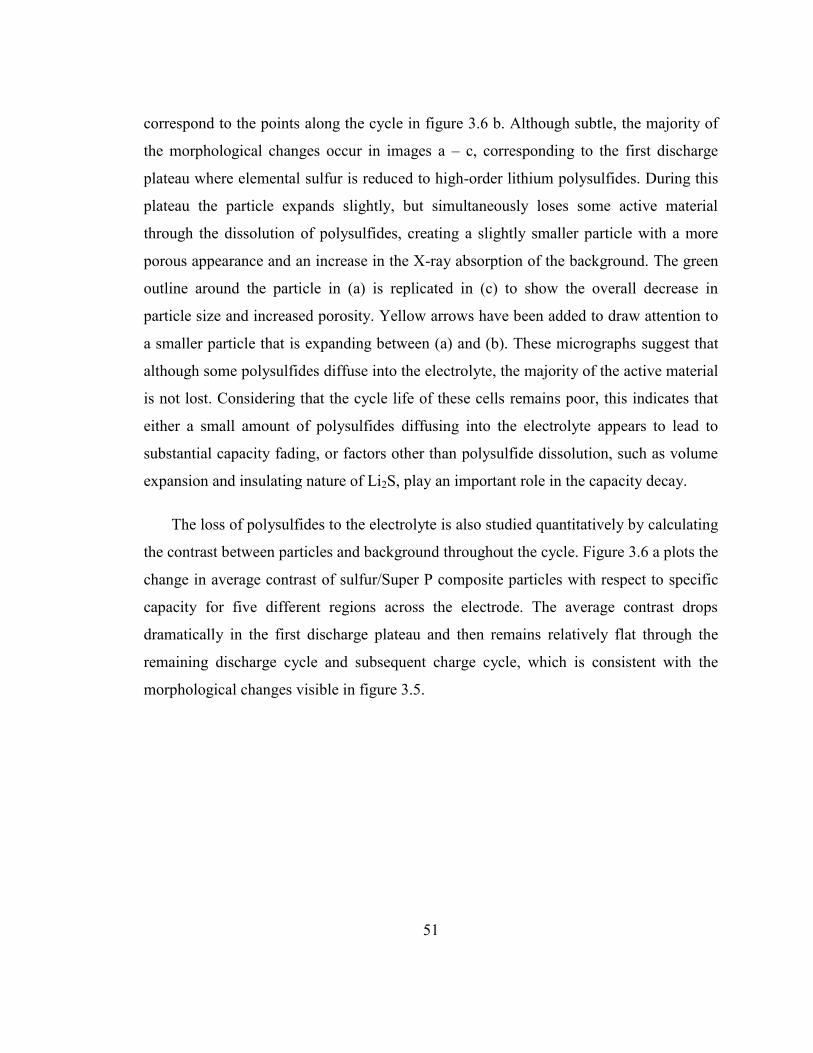
51
correspond to the points along the cycle in figure 3.6 b. Although subtle, the majority of
the morphological changes occur in images a – c, corresponding to the first discharge
plateau where elemental sulfur is reduced to high-order lithium polysulfides. During this
plateau the particle expands slightly, but simultaneously loses some active material
through the dissolution of polysulfides, creating a slightly smaller particle with a more
porous appearance and an increase in the X-ray absorption of the background. The green
outline around the particle in (a) is replicated in (c) to show the overall decrease in
particle size and increased porosity. Yellow arrows have been added to draw attention to
a smaller particle that is expanding between (a) and (b). These micrographs suggest that
although some polysulfides diffuse into the electrolyte, the majority of the active material
is not lost. Considering that the cycle life of these cells remains poor, this indicates that
either a small amount of polysulfides diffusing into the electrolyte appears to lead to
substantial capacity fading, or factors other than polysulfide dissolution, such as volume
expansion and insulating nature of Li2S, play an important role in the capacity decay.
The loss of polysulfides to the electrolyte is also studied quantitatively by calculating
the contrast between particles and background throughout the cycle. Figure 3.6 a plots the
change in average contrast of sulfur/Super P composite particles with respect to specific
capacity for five different regions across the electrode. The average contrast drops
dramatically in the first discharge plateau and then remains relatively flat through the
remaining discharge cycle and subsequent charge cycle, which is consistent with the
morphological changes visible in figure 3.5.

52
Figure 3.6 (a) Change in average contrast vs. specific capacity in TXM micrographs of a
Li-S battery cycled at C/8 and (b) the cell potential. Letters a – i correspond to the
capacities at which the micrographs shown in figure 3.5 were recorded. The average
contrast was calculated between the average pixel in a small region within a particle and
a similarly sized region of the background averaged for five different particles, each with
two different chosen particle and background regions. The inset gives an example of a
particle region in red, and background region in yellow.
Such behaviors in morphology have been observed in five different regions across
the electrode. Combining with in-situ XRD results, it is believed that sulfur is reduced,
but the resulting polysulfides are primarily trapped by the Super P carbon matrix.
Furthermore, because the particle does not grow in size during the second discharge
plateau (figure 3.5 d – f) and there is no formation of new particles, the material that is
lost does not solidify onto the existing particle or form new particles. Instead the
background remains more absorbing and isolated regions of low sulfur density form,

53
which are visible as darker, X-ray transparent regions. This suggests that the insoluble
polysulfides form thin films, which is in agreement with previous ex-situ results.
3.5 Ex-situ Scanning Electron Microscopy of Sulfur Cathodes
To confirm the interpretation of the in-situ TXM results, ex-situ SEM images were
recorded on sulfur/Super P composite electrodes. Figure 3.7 shows ex-situ SEM
micrographs and corresponding sulfur EDS maps of sulfur/Super P composite cathodes in
(a, b) pristine, (c, d) discharged to the end of the first plateau, and (e, f) fully discharged
states. The SEM micrograph of the pristine electrode (a) and EDS sulfur map (b) of the
same area indicate a correlation between particles and increased sulfur concentration.
Moreover, the zoom-in images are presented in figure 3.8.
The particles visible on the electrode discharged to the end of the first plateau (c) are
approximately the same size as those sulfur rich ones visible in the pristine electrode (a),
although the sulfur EDS signal is very low for this partially discharged electrode (d). This
negligible change in average particle size agrees with the conclusion that most of the
polysulfides that make up the particles are not lost to the electrolyte; however, the lack of
sulfur EDS signal suggests that the polysulfides trapped in the carbon matrix are washed
away during the SEM preparation, which give the fake impression that polysulfides
readily diffuse into the electrolyte. After discharge (e), the electrode is coated with a film
of insoluble Li2S2/Li2S species (figure 3.7 e and figure 3.8 c) and the EDS map (figure
3.7 f) shows a uniform distribution of sulfur. This uniform film-like plating based on
SEM and EDS of insoluble lithium sulfide species is also different from TXM results,
where contrast is clear. The reason is that EDS can only penetrate five to ten micrometers
while the thickness of the sulfur electrode is tens of micrometers. Consequently EDS and
SEM only give surface information. In contrast, X-ray can penetrate the whole film so
that the contrast given by TXM reflects the real composition more accurately than

54
SEM/EDS. These results highlight the importance of in-situ characterization of Li-S
batteries to eliminate artifacts introduced during SEM post-treatments.
Figure 3.7 Ex-situ SEM micrographs and corresponding EDS sulfur maps of the
sulfur/Super P composite cathode (a, b) uncycled, (c, d) after the first discharge plateau,
and (e, f) fully discharged. The scale bars are 10 µm.

55
Figure 3.8 Ex-situ SEM micrographs of a sulfur electrode a) before cycling, b) after the
first plateau, and c) discharged with (d) its corresponding electrochemical cycle (the unit
for the X axis is mAh/g and Y axis is volt). The scale bars are 1 µm.
3.6 Conclusion
By performing in-situ X-ray studies on Li-S cells during operation, the same cell
could be monitored in real time throughout its entire first cycle. The recrystallization of
sulfur after the charge cycle was found to only occur with the sulfur/Super P composite
electrodes. In-situ TXM allows individual particles to be tracked in real time throughout
the electrochemical cycle. Contrary to previous ex-situ studies, the sulfur/Super P
composite particles were not found to dissolve significantly during the first discharge
plateau. This trapping of the polysulfides may promote the crystallization of sulfur by the
end of the charge cycle. Nevertheless, even the small amount of polysulfides lost to the
electrolyte appears to have a significant impact on the cycle life. Finally, in-situ XRD
showed no formation of crystalline Li2S during the discharge cycle, which contradicts
previously reported ex-situ studies of Li-S batteries.

56
The results shown here highlight the need for in-situ characterization of Li-S
batteries. Such experiments reveal new insights by making observations during the entire
electrochemical cycle and eliminating post treatments.

CHAPTER 4: LI2S CATHODE FOR HIGH ENERGY LITHIUM ION BATTERIES
4.1 Introduction
Compare to sulfur cathodes, the advantage of Li2S is that it can be paired with
metallic lithium-free anode. Metallic lithium is notorious for its safety issues, which has
not been solved for over twenty years.64,65
In Li2S, as lithium is already stored in the
cathode, high capacity anode, such as silicon and tin, can be adapted, which also leads to
rechargeable batteries with high specific energy.
Li2S has a specific capacity of 1166 mAh/g, while traditional oxide/phosphate
cathodes have an intrinsic limit of 300 mAh/g in specific capacity.45,66
Consequently, the
specific energy for Li2S-based lithium ion battery could be 60% higher than the limit of
metal oxide/phosphate counterparts (figure 4.1), and three times that of current
LiCoO2/graphite system. The major bottleneck for utilizing Li2S is that it is both
electronically and ionically insulating. Subsequently Li2S was considered
electrochemically inactive. Early work by Dahn et al. shows that very limited capacity
could be extracted from Li2S even at a low current rate of C/60.67
Until today, there is
very limited number of reports on Li2S electrodes. Recently a ball milled Li2S electrode
with polymer electrolyte was reported to reach capacity close to the theoretical limit, but
with a large hysteresis (~1.6 V) and low energy efficiency (<50%) for the full cell.68
Discharge capacities around 300 mAh/g were also observed in carbon/Li2S composite
electrodes at room temperature.69,70
In this chapter, two new approaches to activate Li2S
are presented. In the first method, sulfur is filled into the tiny pores of mesoporous carbon
first, then n-butyllithium is used to convert sulfur to Li2S. This strategy leads to a
Li2S/porous carbon composite with dimension of Li2S in the range of 3 - 10 nm, which
significantly improve the performance of Li2S. In the second approach, we found that a
high voltage cut-off can help overcome the initial phase nucleation barrier, and Li2S
become active after climbing over the barrier. Discharge capacity over 800 mAh/g has

58
been realized and the cycle retention is as high as 75%/100 cycles with a discharge
capacity of 550 mAh/g.
Figure 4.1 Comparison of the theoretical specific energy of different Li-ion battery
systems. Li2S/silicon system could reach specific energy more than three times that of
current technology.
4.2 Nanostructured Li2S/mesoporous carbon composite
4.2.1. Electrode Design
One common approach to utilize insulating materials as battery electrode is shrinking
their size down to nanoscale. This approach is widely adopted for materials such as
LiFePO4 and LiMnPO4. However, it is not easy to make nanostructured Li2S. This
material is air/water reactive. Our experimental of ball milling can only shrink the size
down to ~ 500 nm. Inspired by the success of mesoporous carbon/sulfur composite21
, we
designed a two-step synthesis of Li2S/mesoporous carbon composite. First, mesoporous
carbon/sulfur composites are made as described in Chapter 2, then n-butyllithium is used
to convert sulfur to Li2S. Subsequently Li2S is trapped inside the some pores in the

59
mesoporous carbon. The dimension of Li2S is in the order of 5-10 nm, which can
significantly improve the kinetics of this material. We also test a full cell with silicon
nanowire anode (figure 4.2).
Figure 4.2 Schematic of a Li2S/Si battery. Schematic diagram of battery structure; the
cathode contains lithium sulfide (Li2S) encapsulated within ordered mesoporous carbon,
and the anode consists of silicon nanowires grown by the VLS mechanism.
4.2.2 Material Synthesis and Electrode Fabrication
CMK-3 porous carbon/sulfur composite is made as shown in section 2.3. Li2S/CMK-
3 electrodes were created by lithiating as-fabricated sulfur/CMK-3 electrodes. To make
the sulfur/CMK-3 electrodes, sulfur/CMK-3 nanocomposite particles were mixed with
Super P conductive carbon and PVdF binder with a typical weight ratio of 80:10:10 in
cyclopentanone to form a slurry. This slurry was coated onto carbon-coated aluminum

60
foil (Showa Denko America, Inc.) and dried under vacuum at room temperature. Next,
1.6 M n-butyllithium in hexane (10% more than the stoichiometric amount) was drop-
coated onto the electrode, and the electrode was heated at 65 ºC for two hours and then at
105 ºC for 18 hours in an argon environment to fully convert sulfur into Li2S. Results
from inductively coupled plasma atomic emission spectroscopy (ICP-AES) shows that
60% sulfur was left in the electrode. This suggests that thioether is formed during the
process, which is consistent with previous study on using sec-butyllthium to lithiate
sulfur71
:
2 C4H9-Li +2 S → C4H9-S-C4H9 + 2 Li2S
With the assumption that all remaining sulfur exists in the state of Li2S, the
composition of the final electrode is Li2S: CMK-3: Super P: PVDF = 37: 42: 10.5: 10.5
by weight. The typical mass loading of sulfur in the electrode is 0.8-1.0 mg cm-2
, which
corresponds to 0.7-0.8 mg cm-2
for Li2S.
The Li2S commercial powder electrode was comprised of 49% Li2S powder (Sigma
Aldrich, particle size ~ 10 - 20 m), 42.5% Super P, and 8.5% PVDF. To form the
electrode, the materials were mixed, dispersed in N-methyl-2-pyrrolidinone (NMP, Sigma
Aldrich), and coated onto carbon-coated aluminum foil following the same process as
used for the Li2S/CMK-3 electrode. For the fabrication of this electrode, however, all
procedures were performed within an argon-containing glove box.
The silicon nanowires were grown directly onto stainless steel substrates using the
vapor-liquid-solid method.72,73
A 50 nm Au film was first evaporated onto the substrate,
and the substrate was heated at 490 ºC for 30 min under vacuum before growth. The
nanowires were then grown with a SiH4/Ar flow rate of 50 sccm at 490 ºC for 30 min
during which the pressure of the system was maintained at 40 Torr.
For the synthesis of macroporous carbon, poly(methyl methacrylate) (PMMA)
nanospheres were first synthesized by polymerization of methyl methacrylate.74,75
The

61
nanospheres were centrifuged in water for 12 h to form an ordered colloidal crystal,
and then the water was allowed to evaporate. A resorcinol-formaldehyde (RF) solution
was then infiltrated into the pores between the close-packed nanospheres and heated at 85
ºC for 48 hours. Finally, the RF polymer was carbonized at 900 ºC in a nitrogen
environment, and the PMMA nanospheres were pyrolyzed during this process.
4.2.3 Morphology and Structure Characterization
Transmission electron microscopy (TEM) was employed to analyze the composition
and morphology of the as-prepared Li2S/CMK-3 nanocomposite. Figure 4.3 a shows a
bright field image of a nanocomposite particle. The typical size of these particles is on the
order of 0.5 – 1 m. Selected area electron diffraction (figure 4.3a inset) reveals no
diffraction spots from the nanocomposite particle, indicating either that the lithiated
sulfur is amorphous or the crystallite size is too small to generate diffraction spots due to
the sub-5 nm pore size of the mesoporous carbon. Figure 4.3 b and c display the
corresponding elemental maps of carbon and sulfur obtained by energy-dispersive X-ray
spectroscopy (EDS). Lithium is not included since it is a light element that cannot be
identified with EDS. These elemental maps clearly show that the element sulfur
distributes uniformly inside the mesoporous carbon matrix and that there is not a
significant portion of sulfur on the surface, which is confirmed by superimposing the two
elemental maps together (figure 4.3 d).
Scanning electron microscopy (SEM) characterization also supports this conclusion.
No obvious change in the morphology or size of the sulfur/CMK-3 nanocomposite
particles is observed after lithiation, which indicates formation of Li2S within the pores of
the CMK-3 particles (figure 4.4). However, the surface is visibly rougher, suggesting a
small amount of Li2S coating on the particles. This is likely due to the dissolution of
sulfur in hexane during the lithiation process.

62
Figure 4.3 TEM image and elemental mapping of Li2S/CMK-3 mesoporous carbon
nanocomposite. (a) TEM image of a single Li2S/CMK-3 mesoporous carbon
nanocomposite particle. The inset shows the corresponding selected area electron
diffraction pattern. (b) and (c) Elemental mapping of carbon (b) and sulfur (c) by energy-
dispersive X-ray spectroscopy (EDS). (d) Overlay of carbon and sulfur elemental maps
which shows uniform distribution of lithiated sulfur within the mesoporous carbon
matrix. The orange color indicates the presence of both sulfur and carbon as orange is the
result of mixing red (sulfur) and green (carbon) in a RG color scheme.
Figure 4.4 SEM characterization of sulfur/CMK-3 nanocomposite (A) before lithiation,
(B) after lithiation.

63
To further understand the composition and structure of the Li2S/CMK-3
nanocomposite particles, X-ray diffraction (XRD) is used. Figure 4.5 a shows a scan of a
mixture of sulfur and CMK-3 particles before heating, and sulfur peaks are clearly
present. These peaks disappear after heating because sulfur diffuses into the nanometer-
sized pores of the mesoporous carbon (figure 4.5 b), which is in agreement with previous
work.21
After sulfur is lithiated by reaction with n-butyllithium, no peaks belonging to
Li2S or sulfur are present (figure 4.5 c). In order to verify that Li2S is formed, sulfur was
also lithiated inside macroporous carbon, which has larger pores (200-300 nm) than
mesoporous carbon; these larger pores allow for the formation of Li2S crystals that are
large enough for detection with XRD. Figure 4.5 d shows a diffraction scan of lithiated
sulfur inside macroporous carbon, and as expected, Li2S peaks are clearly evident. We
believe that Li2S is also present in lithiated sulfur/CMK-3 mesoporous carbon, but the
sub-5 nm pores in the mesoporous carbon diminish the Li2S diffraction peaks by limiting
the crystallite size to a few nanometers. These results are consistent with TEM and SEM
observations and also suggest that Li2S is trapped inside the mesoporous carbon after
lithiation.

64
Figure 4.5 X-ray diffraction patterns of Li2S/mesoporous carbon nanocomposite
particles. (a) and (b), Scan of a mixture of sulfur and CMK-3 mesoporous carbon powder
before heating (a) and after heating at 155 ºC (b). (c) Scan of sulfur/CMK-3 mesoporous
carbon nanocomposite lithiated by reaction with n-butyllithium and heated at 105 ºC. The
aluminum and graphite peaks are due to the carbon-coated aluminum foil substrate. (d)
Scan of a sulfur/macroporous carbon nanocomposite lithiated by reaction with n-
butyllithium and heated at 105 ºC. The aluminum peaks are due to the aluminum foil
substrate. The peaks labeled “Background” in (c) and (d) result from a protective cover
used to prevent oxidation. Peaks are identified with the following symbols: Sulfur,
Aluminum, Graphite, Background, Li2S.
4.2.4 Electrochemical Performance of Li2S/lithium Half Cells
To understand the electrochemical behavior of the Li2S/mesoporous carbon cathode,
half cells with lithium foil as the counter electrode were tested. Figure 4.6 a shows the
voltage profile of a Li2S/CMK-3 mesoporous carbon cathode half cell. The first discharge
capacity of the Li2S/mesoporous carbon cathode reaches 950 mAh g-1
(all capacity
calculations are based on the mass of Li2S, not sulfur). As a result, about 80% of the
theoretical capacity is achieved, which is better than values in many reports of Li-S
batteries.30,36,76
The voltage profile is plotted as the quasi-straight line in figure 4.6 a, as
indicated by Li2S powder (~10 m in size), both of which contain the same fraction of
Li2S. The Li2S/mesoporous carbon electrode exhibits capacity 30 X that of the Li2S
powder electrode, which demonstrates the significantly improved kinetics resulting from
the rational design of the Li2S/mesoporous carbon particles.

65
Figure 4.6 Electrochemical tests of Li2S/Li half-cells and Li2S/Si full cells. All specific
discharge capacity values are given with respect to the mass of Li2S. (a) and (b) Voltage
profile (a) and specific discharge capacity with cycling (b) of a Li2S/CMK-3 mesoporous
carbon nanocomposite half-cell containing a lithium counter electrode. The current rate is
C/8 (146 mA g-1
) and the voltage range is 1.7-2.8 V for the first cycle and 1.7-2.6 V for
following cycles. The specific discharge capacity with cycling of a Li2S commercial
powder half-cell is also shown for comparison in (b). (c) and (d) Voltage profile (c) and
specific discharge capacity with cycling (d) of a full battery cell with a Li2S/CMK-3
mesoporous carbon nanocomposite cathode and a silicon nanowire anode. The current
rate is C/3 (389 mA g-1
) and the voltage range for the full cell is 1.2-2.6 V for the first
cycle and 1.2-2.5 V for following cycles.

66
It is evident from the voltage profile shown in figure 4.6 a that the first charge is
different than subsequent charges. The first charge voltage is higher and shows a clear
phase nucleation barrier at the onset of charging, while the voltage profile of the
following charge/discharge cycles is similar to that of typical lithium/sulfur batteries as
reported in other works: the upper plateau corresponds to the redox reaction of high-order
polysulfides (Li2Sx, 4 ≤ x ≤ 8), and the lower plateau is due to the reaction of low-
order sulfides (Li2S2 and Li2S)13, 29
. These observations might be attributed to the fact that
before cycling, the only electrochemically active phase in the cathode is Li2S, which is
different from that in lithium/sulfur batteries. At the beginning of charge in Li-S batteries,
the cathode contains a mixture of Li2S and Li2S2; the Li2S2 phase improves the kinetic
behavior of the cathode. Nevertheless, the difference in potential of only ~200 mV
between the first charge and subsequent charges, as shown in figure 4.6 a, further
demonstrates the substantially enhanced kinetics of Li2S resulting from its incorporation
in the mesoporous carbon nanocomposite. Figure 4.6 b shows the discharge capacity over
a number of cycles for the Li2S cathode. The first discharge capacity is 955 mAh g-1
, and
the capacity is stabilized after five cycles. We believe that further improvements in
cycling behavior and capacity retention can be attained through optimization of the
system, including utilization of better electrolytes and surface modifications of the
electrodes.
4.2.5 Electrochemical Performance of Li2S/silicon Full Cells
Since the key purpose of incorporating Li2S instead of sulfur as the active cathode
material is to avoid using potentially unsafe lithium metal anodes, full cells with silicon
nanowire anodes were fabricated. This full cell configuration can also demonstrate that
the source of lithium during charge and discharge is the Li2S cathode since there is no
other lithium in the cell. In contrast, the source of lithium in the Li2S/Li half-cells is
unclear since a lithium foil counter electrode is present. As the first step, silicon nanowire

67
electrodes were characterized and tested in a half-cell configuration with lithium foil
counter electrodes and the same electrolyte utilized in the Li2S/Li half-cells; the capacity
reached ~3000 mAh g-1
with moderate cycle life (figure 4.7). Next, fresh silicon
nanowire anodes prepared under identical conditions were assembled together with
Li2S/CMK-3 cathodes for full cell electrochemical tests. Figure 4.6 c shows the voltage
profiles of the first, second, and tenth charge and discharge cycles for a Li2S/Si battery at
a rate of C/3, which corresponds to 389 mA g-1
with respect to Li2S. The average
discharge voltage of the Li2S/Si full cell is ~1.7 V since the silicon anode has an average
discharge potential of ~0.4 V vs Li/Li+, and the first discharge capacity reaches 705 mAh
g-1
. The corresponding capacity retention with cycling for the Li2S/Si battery is shown in
figure 4.6 d. Even at a 1C current rate (1166 mA g-1
), the initial capacity remains similar
(656 mAh g-1
, Figure 4.8 a). The corresponding current density per unit area for a rate of
1C is about 0.6 mA cm-2
, which is more than ten times greater than the current density in
previous reports21, 22
. The discharge capacity can be further enhanced by lowering the
discharge current. At C/8 (146 mA g-1
), the first discharge capacity increases to 803 mAh
g-1
(figure 4.7 a), which results in an initial specific energy of 630 Wh kg-1
for the full
cell considering active materials only. If the masses of all electrode additives (CMK-3,
PVDF, Super P conductive carbon) are considered, the initial specific energy is calculated
to be 349 Wh kg-1
, which is similar to that of commercial Li-ion batteries (335 Wh kg-1
).
With further optimization of this battery, however, we project that the specific energy
could reach ~600 Wh kg-1
considering the total electrode mass. It should be noted that
since a 1C current rate for Li2S is about six to eight times that of layered oxides and
phosphates (140-200 mA g-1
), a rate of C/8 for a Li2S-based cathode would provide
adequate power for many applications.

68
Figure 4.7 Performance of silicon nanowire anode. (a) SEM image of as-synthesized
silicon nanowires. (b) Charge/discharge voltage profile of silicon nanowire electrode with
lithium foil counter electrode. The voltage range is from 50 mV to 0.7 V. (c) Discharge
capacity with cycling of silicon nanowire electrode.
Figure 4.8 (a) First discharge voltage profiles of full battery cells with Li2S/CMK-3
mesoporous carbon nanocomposite cathodes and silicon nanowire anodes at rates of 1C
(1166 mA/g) and C/8 (146 mA/g). (b) The plot of the first discharge specific capacity of
full cells operating at various current rates.
From comparison of figure 4.6 b and d, the specific capacity of the Li2S/Si full cell
decays faster than the specific capacity of the Li2S/Li half cell. This could be caused by
the following factors: 1) In full cells, there is a limited supply of Li ions, which can be

69
irreversibly lost in side reactions. In half- cells, Li ions that would be lost in a full cell
configuration can be replenished by the Li metal counter electrode, which is a virtually
unlimited source of Li ions. 2) The voltage of each electrode is not separately controlled
in full cells. The deep discharge or overcharge of Li2S or silicon is detrimental to cycling
performance, and this might occur during cycling since we only control the voltage of the
full cell. Although the capacity decay from the first to the 20th cycle from our proof-of-
concept Li2S/Si battery is better or comparable to many other reports on Li2S or Li-S
batteries34,57,67,76–79
, more research is required to overcome these issues and compete with
well-developed Li-ion battery systems.
4.2.6 Summary
In this section, we demonstrate a new type of rechargeable Li-ion battery containing
Li2S and silicon as the active materials in the cathode and anode, respectively. Li2S is
made electrochemically active by incorporating it within the pores of CMK-3
mesoporous carbon in the cathode. Silicon nanowire anodes are demonstrated to be ideal
for this battery system due to their high capacity, low reaction potential, and moderate
cycle life. The theoretical specific energy of this new battery is four times that of state-of-
the-art battery technology, and cells with 70% higher first discharge specific energy than
the commercial LiCoO2/graphite system have been fabricated. Additionally, this new
battery system avoids the intrinsic safety issues associated with the use of lithium metal
in previous Li-S batteries. The development of this novel battery system will have a
significant impact on applications that require high specific energy, such as batteries for
electric vehicles and portable electronics.
4.3 Activating Li2S by intial overcharging
4.3.1. Introduction

70
The nanostructuring method in section 4.2 is successful in activating Li2S and
achieving high capacity. However, the process is complicated and not fully compatible
with current battery fabrication techniques. Moreover, byproducts such as thioethers are
formed in the lithiation process, as discussed in the previous section. To avoid this issue,
we further explore this materials and a simple and scalable method has been realized
through initial overcharging. We find that there is a potential barrier of ~ 1 V at the
beginning of the first charging of Li2S. By simply applying a higher voltage cut-off to
overcome this barrier, Li2S can be oxidized to soluble polysulfides and rendered active
(figure 4.9). An initial discharge capacity higher than 800 mAh/g is observed. Moreover,
stable cycling has been achieved with a capacity of ~550 mAh/g based on the mass of
Li2S. The corresponding capacity retention is as high as ~75% per 100 cycles. This
method represents a simple and scalable approach to activate Li2S, which has not been
discovered before.
Figure 4.9 The schematic diagram illustrating the effect of applying a high cut-off to
activate Li2S. After overcoming the initial barrier, a polysulfide phase is formed and Li2S
become active.
4.3.2 Experimental Details

71
Li2S particles were purchased from Alfa Aesar. The sample without further
modification is denoted as “pristine”. Ball-milled Li2S particles were prepared by mixing
pristine Li2S and Al2O3 (Sigma Aldrich) with a weight ratio of 95:5, and ball milled for
six hours (SPEX 8000D miller). Lithium nitrate was also purchased from Sigma Aldrich.
Polysulfide solution was prepared by stirring pristine Li2S and sulfur in 1,3-dioxolane
overnight at 60 ºC. The as-synthesized solution has a nominal molecular formula of
Li2S8, and the concentration of sulfur is 0.2 M. To form electrodes for electrochemical
testing, Li2S particles, Super P carbon black and polyvinylidene fluoride (Kynar) were
ground together at a weight ratio of 40:45:15 in a mortar for 10 min and then stirred in N-
Methyl-2-pyrrolidone (NMP) for 12 hours. Next, the slurry was drop cast onto carbon
paper (AvCarb P50T) and heated at 110 ºC for one hour inside a glove box. The mass
loading of the electrode is 1 - 1.5 mg Li2S/cm2. 2032 coin cells (MTI Corp) were used for
two-electrode testing, and pouch cells with two pieces of lithium as reference and counter
electrodes, respectively, were used for three-electrode cyclic voltammetry and impedance
measurements. The electrolyte is 1.0 M lithium bis(Trifluoromethanesulfonyl)imide
(LiTFSI, Sigma Aldrich) in 1,3-dioxolane and 1,2-dimethoxyethane (v:v = 1:1). The
electrode preparation and cell assembly were done in a glove box with O2 and H2O less
than 2 and 0.1 ppm, respectively. All C-rates are based on the theoretical capacity of Li2S
(1C = 1166 mA/g). The frequency range for the impedance measurement is 200 kHz –
0.01 Hz. In-situ synchrotron diffraction was performed at Stanford Synchrotron Radiation
Lightsource beamline 11-3 with an X-ray energy of 12.74 keV. The experimental details
were described in our previous work.80
COMSOL 3.4 was used for simulation.
4.3.3 Microscopic and Electrochemical Characterizations
Figure 4.10 illustrates the morphology of both pristine and ball-milled Li2S particles.
The typical particle size of the pristine Li2S is ~10 m. Large particles with diameter up

72
to 20 m were also frequently observed in the pristine sample. After ball milling, the
particle size decreases to 1 - 3 m with an average size of 2 m.
Figure 4.10 SEM images of (A) pristine Li2S particles and (B) ball-milled Li2S particles.
Pristine samples have an average diameter of ~10 m while the size of the ball-milled
one is ~2 m.
The voltage profile in the initial three cycles for pristine Li2S at C/20 (58.3 mA/g) is
presented in figure 4.11 A. A large barrier is apparent up at the beginning of the first
charging. The voltage reached 3.45 V vs Li/Li+ at a charging capacity of 48 mAh/g and
then drops. A long flat plateau was observed afterwards, suggesting a two-phase reaction.
Extra capacity was also extracted above 3.5 V, which was likely due to the imperfect
mixing or poor contact between some Li2S particles and carbon additives. The total
capacity extracted in the initial charging was 982 mAh/g. In the first discharge, the
typical two-plateau behavior of sulfur cathode was observed22,27
and a discharge capacity
of 804 mAh/g has been achieved, which is ~70 % of the theoretical limit. The large
charging barrier disappeared in the following cycles, and the voltage profile became
similar to the common sulfur electrodes.27,31
This results in a low hysteresis (~0.2 V)
between charge and discharge, and thus high energy efficiency (85-90%), which is a
dramatic improvement compared to previous results.68
The charging barriers were observed in both pristine and ball-milled samples at
different rates (figure 4.11 B and C). The barrier heights were in the range of 0.9-1.3 V.
After overcoming the barrier, significant capacity could be discharged in all cases. For

73
example, an initial discharge capacity of 835 mAh/g was achieved at C/20 for ball-
milled Li2S electrodes, and the capacity at C/8 maintained at 696 and 626 mAh/g for ball-
milled and pristine Li2S electrodes, respectively. It should be noted that the theoretical
capacity of Li2S is only 70% of sulfur. To compare our results with sulfur cathode, which
is currently being intensively studied, the capacity based on the mass of sulfur in Li2S is
also plotted on the top axis. This activation behavior was also observed in our
Li2S/mesoporous carbon nanocomposite but with a much smaller amplitude (0.18 V), as
the size of Li2S was only about 3-10 nm.45
In general, this barrier is universal in Li2S
samples, but larger particle size and higher current rate result in a higher barrier. The
correlation among particle size, current rate and barrier height will be discussed later.
The cycling performance of pristine Li2S electrodes is illustrated in figure 4.11 D.
All samples were charged at C/25 to 3.8 V first, and then cycled at C/10 between 1.5 and
3.5 V vs Li/Li+. Without any additive, the Li2S electrode shows a fast decay, similar to
common sulfur cathodes.29,31,41,56
However, the cycling performance is improved
dramatically by introducing additives into the electrolyte. For example, with 1% LiNO3
in the electrolyte, the initial discharge capacity reaches 950 mAh/g at C/10. After 10
cycles, the discharge capacity was stabilized at ~550 mAh/g, and the capacity decay was
reduced to only 30%/100 cycles. Adding polysulfide into the electrolyte can also help
improve the cycle life. When 20 L Li2S8 solution ([S] = 0.2 M) was added into the
electrolyte, the cycle retention became as high as 75% per 100 cycles, and the initial
capacity is also around 550 mAh/g. The total amount of sulfur in the polysulfide additive
was ~10% of that in the Li2S electrode, so the majority of the capacity originates from
Li2S. The improvement is likely a result of minimized material loss on the surface of
lithium. LiNO3 is well known to passivate the surface of lithium metal and significantly
improve the coulomb efficiency.24,41,81
Polysulfide additives can compensate the material
loss due to side reaction on the surface of lithium. The fact that Li2S shrinks in the initial
charge instead of the expansion for sulfur may also contribute to the improved capacity
retention, as it has less damage to the electrode integrity. The coulomb efficiency is about

74
95-97% for samples with LiNO3 additives and 75-80% for those with polysulfide in
the electrolyte.

75
Figure 4.11 The electrochemical characteristics of micron-sized Li2S
electrodes: (A) The voltage profile of a pristine Li2S electrode in the initial three cycles.
The as-made cell is in discharged state and it is charged first. The potential barrier was
observed only at the beginning of the first charge. The electrode was charged to 4.1 V vs
Li/Li+ first, then cycled between 1.5 and 3.5 V. (B) and (C), the voltage profile of pristine
(B) and ball-milled (C) Li2S in the first cycle at C/20 and C/8. The voltage window is 1.5
– 4.1 V for C/20 and 1.5 - 4.0 V for C/8. The electrolyte used in (A-C) was 1.0 M LiTFSI
in DOL/DME without additive. The top axes in both B and C are based on the mass of
sulfur in the Li2S. (D) The cycling performance of pristine Li2S particles without additive
(blue), with 1% LiNO3 (black) and with 0.2 M polysulfide (red). All electrodes were
charged to 3.8 V at C/25 first, then cycled between 3.5 and 1.5 V at a current rate of C/10.
(E) The rate capability of pristine and ball-milled Li2S electrode with 1% LiNO3 additive
in the electrolyte. The capacities in the 2nd discharge were plotted. The capacity remains
over 700 mAh/g at 0.5 C (583 mA/g) for the ball-milled sample. The right axes in both D
and E are based on the mass of sulfur in the Li2S.
Good capacity retention at high rates was also observed in the Li2S electrodes (figure
4.11 E). For pristine samples, the capacity remains at 645 mAh/g at 0.5 C (583 mA/g),
which is 77% of that at 0.1 C. In the ball-milled samples, the capacity even reaches 738
mAh/g at 0.5 C, 86% of that at 0.1 C. In all rate capability tests, 1% LiNO3 was added to
the electrolyte to reduce the impedance at the lithium/electrolyte interface and prevent
material loss due to side reaction on the surface of metallic lithium.
4.3.4 Activation Mechanism
As described above, by applying a high voltage cut-off in the initial charging, we
demonstrated a simple and scalable method for activating Li2S, especially given the fact
that this material is air sensitive. No extra processing, such as lithiation or high
temperature processing to form carbon/Li2S composite, is needed. Moreover, our

76
approach is also compatible with the conventional liquid electrolyte and room
temperature operation. As far as we know, this activation behavior is novel and has not
been observed in other battery systems. It is thus meaningful to elucidate the mechanism
behind the phenomenon, in order to guide further improvement of this material. There are
two basic questions to answer: 1) What is the reaction mechanism, such as the charging
product and whether it is a single-phase or two-phase reaction? 2) What is the origin of
the large initial potential barrier?
To answer these questions, in-situ synchrotron diffraction was used first to study the
phase evolution in the initial charge. The diffraction patterns at different stages of
charging are plotted in Figure 4.12 A. The numbers on the right side represent the amount
of capacity extracted. All Li2S peak intensities decrease monotonously, showing that Li2S
is oxidized during the charging, which is further confirmed by changes of integrated
intensities for the Li2S (111) peak upon charging (figure 4.12 B). Meanwhile, no extra
peaks corresponding to sulfur were observed so that crystalline sulfur was not formed.
Several sharp peaks were observed at random stages of the charging. These were present
as points rather than rings in the MAR images and hence are artifacts which were also
observed in other tests even without Li2S electrodes. We also notice that the electrolyte
turns yellow during the charging process, which is a clear evidence of the formation of
soluble lithium polysufides. The color is closer to Li2S8 than that of Li2S6 and Li2S4.82
Furthermore, since the potential of the charging plateau is the same as the upper charging
plateau in sulfur cathodes, even if Li2S4 or Li2S6 were formed, they would be
immediately oxidized to Li2S8. As a result, the charging product is considered to be Li2S8.

77
Figure 4.12 The in situ X-ray diffraction results of Li2S electrode during charging. (A)
Li2S peaks are indicated with the Miller indices and disappeared on charging but no extra
peaks belonging to sulfur were detected. The numbers on the right represent the charging
capacity. (B) The integrated intensities for Li2S (111) peak plotted as a function of
charging capacity.
Q (Å 1)
1.0 1.5 2.0 2.5 3.0 3.5 4.0
Inte
nsi
ty (
a.u
.)
Specific Capacity (mAh/g Li2S)
0 150 300 450 600 750 900
Inte
gra
ted
In
ten
sity
(a.
u.)
0
5
10
15
20
Li2S (111)
0
88
198
393
600
795
954
(111)
(200) (220) (311)
PolymerLi
A
B

78
The long flat plateau in the charge (figure 4.11 A-C) and the initial barrier are both
characteristics of the two-phase reaction. The barrier could be explained by phase
nucleation where an extra driving force is needed to nucleate the new phase (polysulfides
in this system), as has been observed in other materials with the two-phase reaction
before, such as LiFePO4.83
This is further confirmed by the experiment of intentionally
adding polysulfide solution into the electrolyte. As shown in figure 4.13, the initial
barrier disappeared after adding polysulfide solution into the electrolyte, as polysulfide
nuclei already existed and thus extra free energy for phase nucleation was not required.
These results demonstrate that the initial charging of Li2S is a two-phase reaction
between Li2S and polysulfides (likely Li2S8), and the origin of the initial barrier is phase
nucleation. However, the barrier height may be not solely determined by phase
nucleation, the thermodynamic reason. Other kinetic factors, such as ionic transport,
electronic conductivity and charge transfer, could also contribute to the amplitude of the
potential barrier, especially at high current rates. It is important to determine the
dominant factor for this large barrier to obtain a complete understanding of the
electrochemical process and guide further improvement of Li2S.
We first examine the contribution of phase nucleation, which is approached at low
current where the effect of kinetic factors is negligible. Figure 4.14 A shows the profiles
of voltage barriers in a large range from C/8 to C/1000 for the ball-milled sample. The
barrier height strongly depends on the current rate, for example, 1.15 V at C/8 and only
25 mV at C/2000. The overpotentials at different current rates are plotted in Figure 4.13
B. The relation can be divided into two regions, as guided by the red line. At higher
current (>C/200), there is a linear relation between the overpotential and logarithm of the
current rate. In contrast, the overpotential is nearly constant and quite small at low current
(C/2000 - C/500), which is due to the phase nucleation barrier since this approaches the
zero-current limit and thus thermodynamics dominate.84
The inset in figure 4.14 B shows
the low current region. The overpotential approaches ~20 mV at zero current. This small

79
overpotential is negligible compared to the large barrier height (0.5~1 V) at moderate
rates (C/50 – C/8). As a result, kinetic factors are believed to determine the height of the
barrier when current is higher than C/100, reasonable rates for practical applications.
Similar behavior was also observed in pristine Li2S samples. However, thermodynamic
behavior was not reached even at current as low as C/5000 (0.23 mA/g) for pristine Li2S.
In order to keep the whole analysis consistent, ball-milled Li2S particles were used as the
model system for the following mechanism studies, although pristine Li2S samples
showed the same trend.
Figure 4.13 The voltage profile of Li2S electrode with polysulfide additives in the
electrolyte at C/100.

80
Figure 4.14 The relation between current rates and overpotentials. (A) The initial
potential barrier at C/8, C/50, C/200 and C/1000. 1C = 1166 mA/g. The inset is a zoom-
in image of the barrier at C/1000. (B) The relation between the current rate and the
overpotential. There are two regions. At rates higher than C/200, the overpotential
depends linearly on the logarithm of the current. At rates lower than C/300, the
overpotential is approximately constant. The inset plots the low rate region (<C/200).
The red line is for eye-guiding. The units in both insets are the same as the figures.
Three kinetic factors might be responsible for the large barrier: electronic
conductivity of Li2S, diffusivity of lithium ions in Li2S, and charge transfer process on
the surface of Li2S particles. Other factors, such as transport in the electrolyte, should
contribute little to the overpotential as the current density is low (~200 A/cm2 for C/8).

81
The solid electrolyte interphase on the lithium surface is also negligible since a
large overpotential was not observed after the initial barrier. To understand the effect of
these factors, we focus on the point when Li2S cathode was charged to the top of the
potential barrier, where the largest overpotential was reached.
The contribution of electronic conductivity was studied first as Li2S is an
electronically insulating material. Li2S is an ionic crystal and has a low electronic
conductivity. In order to estimate the contribution of electronic conduction to the
overpotential, we first calculate the charge relaxation time t of electrons to determine the
time scale for electrons to respond. t = , where is the dielectric permittivity of Li2S,
and is the electronic conductivity of Li2S. The relative permittivity of Li2S is
approximately 10, as most ionic crystal has a relative permittivity between 3 and 15.85
For example, the relative permittivity of Na2S is 5.
The electronic conductivity is estimated by supposing that all overpotential (total)
is due to the electronic conductivity of Li2S. Electrons need to move through a shell to
reach carbon additives, which results in the overpotential (Figure S4A). Consequently,
Where I is the applied current, l is the thickness of the shell and S is the total surface area
of Li2S particles. This model gives the lower limit of and thus the upper limit of t, as
not all overpotential is due to electronic conductivity. l is supposed to be 10 nm based on
the formula √ , where t = 1000s, the time to reach the barrier top at high current. D
= 10-15
cm2/s as shown in Appendix A. This value is about one order of magnitude lower
than the real situation, which further overestimates t (see Appendix A for more details). S
= 6m/d, where m is the mass of Li2S in the electrode, is the density of Li2S and d is
the diameter of Li2S particles. Subsequently, this model gives an overestimated charge
relaxation time t. The electronic conductivity is calculated to be 6 * 10-10
S/m, and the
relaxation time is ~0.2 s at maximum. More reasonable assumptions include l = 50 nm
and total = 0.2 V, which leads to a relaxation time of only 8 ms.

82
Figure 4.15 The effect of electronic transport on the overpotential. (A) The shell model
to estimate the electronic conductivity of Li2S. Electrons needs to move through a shell to
reach carbon black. (B) The voltage drop when current was turned off for ball-milled
Li2S at C/20 (upper) and C/200 (lower). 1 C = 1166 mA/g.
As a result, the contribution of electronic transport inside Li2S particles could be
estimated by the voltage drop within at most 1 s after the current is turned off. The value
is < 30 mV for both C/20 and C/200. These results indicate that the contribution of
electronic transport is very limited.
To understand the effect of lithium ion diffusivity and charge transfer, a suitable
model is needed to describe the electrochemical process in the barrier region. We
followed the work by the Newman group, where the Butler-Volmer model was used as
the governing equation.86,87
At the top of the potential barrier, the polysulfide phase is not
yet formed. Consequently, the process is still in the range of one-phase reaction:
Li2S → Li2-xS + x Li+ + x e
-,

83
The extracted lithium ions migrate into the electrolyte and electrons move to the
current collector through the carbon additives. As a result, the reaction only happens at
the boundary of the three phases: Li2S, carbon additives and the electrolyte. The relation
between the overpotential () and the current rate (j) can be described as
j=j0 (CS/CT)exp(1-F/RT)-exp(-F/RT)), (1)
where j0 is the exchange current, CS is the concentration of lithium ions on the
surface, CT is the concentration of lithium ions in stoichiometric Li2S. is the transfer
coefficient, F is the Faraday constant, R is the ideal gas constant and T is the temperature.
At the top of the barrier, the overpotential is a large positive value so that the second
exponential term is negligible, and the expression can be simplified to
j = j0 (CS/CT)
exp((1-F/RT), (2)
This expression illustrates that overpotential should be proportional to the logarithm
of the current, which is consistent with our results (figure 4.13 B), suggesting that the
process is dominated by charge transfer. It also shows that the overpotential only relates
to ionic transport inside Li2S through CS, the surface concentration of ions. The
contribution of ionic transport then can be calculated as the difference between two cases:
the real situation and the case that diffusivity is high so that lithium ions distribute
uniformly inside the Li2S particle.88
The overpotential due to ionic transport is expressed
as:
( )
, (3)
C’ is the average concentration of lithium ions inside the Li2S particle at the top of
the potential barrier (see Appendix A for details). The lithium ion concentration on the
surface of Li2S is very difficult to measure experimentally. Instead simulation was used
to obtain the surface concentration of lithium ions in different cases. The movement of
lithium ions and electrons were treated as a binary electrolyte and the Nernst-Planck

84
equation was used to describe the process.89
The lithium ion diffusivity was set to 10-15
cm2/s based on impedance results (figure 4.16 and Appendix A) and the electronic
conductivity was estimated from the voltage drop when the current was turned off. The
particle size was taken to be 2 m, which was the typical size for ball-milled samples.
We found that the surface concentration decreased as the current increased, as a larger
concentration gradient is needed at higher rate to maintain the continuous current at the
Li2S/electrolyte interface. For example, the concentration is ~35 % of that in
stoichiometric Li2S at C/20 while it is 85~90 % at C/200 (figure S6). The details of
simulation are discussed in the supporting information.
Using the simulated surface concentration of lithium ions and experimental
overpotential – current in equation (2), parameters such as and j0 could be
determined. is fitted to be 0.91 ± 0.01 and j0 is 3 ± 1 × 10⁻⁷
A/cm2 with a correlation
coefficient of 0.99. The high correlation coefficient suggests that the model adequately
described the electrochemical process. Our is a very large transfer coefficient as
common values for are between 0.3 and 0.7.13
The high means that the applied
overpotential is very ineffective in adjusting the energy barrier for the oxidation of Li2S.
Using in equation (3), overpotentials due to ionic transport (ion) were
calculated, as shown in figure 4.16 A. In the range of C/20 – C/200, ion accounts for
about 15-30% of the total overpotential, indicating that it contributes to the barrier to
certain extent, especially at high rates. However, it is not the dominant factor for the high
potential barrier. The sensibility of the result to CS is estimated by changes in fitting
parameters (e.g. and j0) at different diffusivities and mobilities. For example, if both the
diffusivity and mobility are doubled, though CS changes by about 50%, only lowers to
0.90 and j0 is not affected. Consequently ion decreases to only 60 mV as the ionic
transport is faster. When kinetic factors are halved, the charge transfer overpotential ct
still contributes over 50% of the total overpotential. The results are summarized in Table
4.1.

85
Table 4.1 Effects of kinetic parameters on and j0
CS/C0 ion j0 R
Measured 0.52 0.15 0.91±0.01 3±1 0.97
Double 0.79 0.07 0.92±0.01 3±1 0.98
Half 0.32 0.23 0.90±0.01 3±1 0.98
Generally speaking, changes in CS do not affect the conclusion that ionic transport is
not the dominant factor, as the charge transfer term in the Butler-Volmer model is an
exponent function while the diffusion term is only a power function and the power is
less than 1. The detailed discussions are shown in Appendix A. We would like to
emphasize the purpose of the analyses is to understand the mechanism behind the large
barrier, but not identify the contribution of each factors quantitatively.
The remaining overpotential is considered to arise from the charge transfer process.
This is consistent with a small j0 of 3 ± 1 × 10⁻⁷
A/cm2
based on the fitting results. This
value is several orders of magnitude smaller than traditional cathodes, such as LiCoO290
,
and LiFePO491
, indicating that the charge transfer is difficult for Li2S. As both lithium
ions and electrons are involved in the process (reaction *), it is hard to separate them and
answer which one dominates, but we believe that the overall charge transfer process
controls the overpotential and is the main reason for the large potential barrier.

86
Figure 4.16 (A) The contribution of ionic transport to the total overpotential at different
rates. Limitations in ionic transport account for 15-30% of the total overpotential. (B)
The evolution of impedance during the charging process. The numbers in the figure
indicate the amount of capacity extracted. The diameter of semicircles shrinks when more
capacity was extracted from the Li2S electrode, indicating better charge transfer upon
charging. The two semicircles in the middle of charging suggest a two-step charge

87
transfer process. The frequency range is 200 kHz – 0.01 Hz. Inset: zoom-in image of the
impedance results. The units are the same as the large figure.
Our model also explains other experimental observations, which further corroborate
its validity. It is consistent with the evolution of impedance results in the initial charge
(figure 4.16 B). Before charging, only a single semicircle was observed for the charge
transfer process, and the corresponding charge transfer resistance (Rct) is ~120 ohms. In
the middle of charging, for example, after 150 and 300 mAh/g capacity were extracted,
two semicircles with smaller Rct of 10-20 ohms were observed. However, at the end of
charging, only one semicircle remains with an even smaller Rct of ~3 ohms. Such
evolution could be explained as the electrochemical reaction varies along with the
charging (figure 4.17):
Before the barrier top (step 1 and 2): Li2S -> Li2-xS +x Li+ + x e
-
In the middle of charging (step 3): y Li2S -> Li2Sy + (2y-2) Li+ + (2y-2) e
-
Li2Sy -> y/8 Li2S8 + (2-y/4) Li+ + (2-y/4) e
-
At the end of charging (step 4): Li2Sy -> y/8Li2S8 + (2-y/4) Li+ + (2-y/4) e
-

88
Figure 4.17 A summary of the charging model of Li2S. Before reaching the top of
the potential barrier, Li2-xS exists as a single phase with a lithium-poor shell on the
surface. After overcoming the barrier, soluble polysulfides are formed and the kinetics
are significantly improved. At the end of charging, only the polysulfide phase exists with
a fast kinetics.
The first charge transfer process is slow according to analyses above, leading to a
large charge transfer resistance (figure 4.17, step 1 and 2). In the middle of charging, two
steps occur: from Li2S to polysulfides, and redox reaction between soluble polysulfide
species. As Li2S is more like polysulfides than electrolyte, it is reasonable to assume that
the charge transfer process is easier between Li2S and the polysulfide. The second step
should be quite fast as species involved are in the liquid phase. Consequently, two
semicircles with much smaller diameter (10-20 ohms) were observed in the middle of
charging (figure 4.17, step 3). At the end of charging, only the polysulfide phase exists
and thus only one semicircle remains (figure 4.17, step 4). The assumption of faster
kinetics between Li2S and polysulfide is validated by the impedance of Li2S electrode in
the electrolyte with polysulfide additives (figure 4.18). Even before charging, two
semicircles show up in the impedance as polysulfide acts as an intermediate species for
the charge transfer process. Moreover, the diameters of the two semicircles are only 30-
50 ohms, much smaller than that without polysulfide additives, which further confirms
that the charge transfer between Li2S and polysulfide is easier.

89
Figure 4.18 The impedance results of Li2S electrode with polysulfide additives. 50 L
polysulfide solution ([S] = 0.2 M) was added to the electrolyte. The frequency range is
200 k – 0.01 Hz.
The model above also answers why there is little overpotential after the initial
activation. First, as discussed above, the charge transfer process was significantly
improved after the formation of polysulfide nuclei in the electrolyte. Second, since
polysulfide nuclei occur in the electrolyte after activation, any small deficiency in lithium
ions at the surface of Li2S particles will lead to immediate phase separation and thus ln
(C’/CS) is close to 0. Consequently the overpotential due to ionic transport (ion) is also
negligible and a plateau with little overpotential was observed.
4.3.4 Summary
In this part, we demonstrate a simple and scalable approach to activate micron-sized
Li2S particles. By applying a high charging cut-off voltage to overcome the initial

90
potential barrier, polysulfide phase is formed and this dramatically improves the
kinetics of Li2S, such as the charge transfer process. This novel approach can turn even
10 m-sized Li2S electrochemically active, and lead to a discharge capacity as high as
850 mAh/g. With either polysulfide or LiNO3 additives in the electrolyte, the cycle
retention was improved to 75% per 100 cycles with a capacity of 500 – 550 mAh/g. The
mechanism behind this novel phenomenon is also studied. The origin of the barrier is due
to phase nucleation but the height of the barrier is mainly a result of poor charge transfer
at the surface of Li2S and limited diffusivity of lithium ions inside Li2S. The results
reported here provide a practical approach to utilize Li2S as lithium ion battery cathode. It
could potentially realize rechargeable batteries with specific energy four times that of the
state-of-the-art technology.
4.4 Conclusion
Li2S is a high-capacity cathode material for next generation lithium-ion batteries,
which can potentially realize rechargeable batteries with specific energy four times that
of the state-of-the-art technology. It can also avoid the safety issue of sulfur cathodes in
Li-S batteries. However, it is commonly considered as an electrochemically inactive
material due to its high electronic resistivity and low lithium ion diffusivity. To activate
this material, two approaches have been experimentally demonstrated. The first strategy
is to incorporate Li2S into mesoporous carbon. As the particle size shrinks down to sub
10 nm, the kinetics is significantly improved. Consequently discharge capacity as high as
950 mAh/g has been realized. However, this approach generates byproducts of thioethers
and shows an unsatisfied cycling life. Further exploration shows that Li2S can be
activated through a simple and scalable overcharging method, even for 10 m-sized
particles. By applying a high charging cut-off voltage to overcome the initial potential
barrier, polysulfide phase is formed and this dramatically improves the kinetics of Li2S,
such as the charge transfer process. This novel approach leads to a discharge capacity as

91
high as 850 mAh/g. With either polysulfide or LiNO3 additives in the electrolyte, the
cycle retention was improved to 75% per 100 cycles with a discharge capacity of 550
mAh/g. The mechanism behind this novel phenomenon is also studied. The origin of the
barrier is due to phase nucleation but the height of the barrier is mainly a result of poor
charge transfer at the Li2S/electrolyte interface and limited diffusivity of lithium ions
inside Li2S.
Our work on Li2S demonstrates promising approaches to activate Li2S for future
energy storage devices. The exploration of mechanism behind greatly deepens our
understanding of this material and can help guide future development of this material.

CHAPTER 5: TRANSPARENT LITHIUM ION BATTERIES
5.1 Introduction
Transparent electronics is an emerging and promising technology for the next
generation of optoelectronic devices. Transparent devices have been fabricated for
various applications, including transistors 92–97
, optical circuits98,displays
99–101, touch
screens102
and solar cells103–105
. However, the battery, a key component in portable
electronics, has not been demonstrated as a transparent device. Consequently, fully
integrated and transparent devices cannot be realized for the battery occupies a
considerable footprint area and volume in these devices (e.g. cell phones, tablet
computers). Typically, a battery is composed of electrode materials, current collectors,
electrolyte, separators, and packaging.5 None of them are transparent except for the
electrolyte. Furthermore, as these components are in series, all of them must be clear to
make the whole device transparent. A widely used method for making transparent
devices is to reduce the thickness of active materials down to much less than its optical
absorption length, as demonstrated in CNT96,98
, graphene102
and organic
semiconductors103,105
. However, this approach is not suitable for batteries, since, to our
knowledge, no battery material has an absorption length long enough in the full voltage
window. For example, LiCoO2 and graphite, the most common cathode and anode in Li-
ion batteries, are good absorber even with a thickness less than 1 m. Moreover, black
conductive carbon additive is always required in electrodes, which occupies at least 10%
of the total volume106
. In contrast, to power common portable electronics, the total
thickness of electrode material needs to be on the order of 100 m - 1 mm, much longer
than the absorption length of electrode materials. This dilemma comes from the fact that
the transparency of materials decays exponentially with the thickness while the amount of
energy stored increases only linearly with the thickness. Some transparent materials, such
as Indium oxide (In2O3), could be used as battery materials. However, upon cycling,
metal nanoparticles and lithium oxides are formed, significantly deteriorating the

93
transparency, as shown in figure 5.1.107
To overcome these challenges, we demonstrate
a novel microfluidics-assisted method to make a patterned grid-like battery electrode
filled with nanomaterials. The battery appears transparent as the patterned electrode
materials only cover a small portion of the whole area and the pattern features are smaller
than the detection limit of human eyes. Li-ion batteries with different transparency have
been fabricated. For example, full cell with energy density of 10 Wh/L including
packaging is demonstrated at a transparency of 60%. Furthermore, by aligning multiple
transparent batteries in series, the energy stored could scale up easily without sacrificing
the transparency of the device. Finally, we show that such a device is also a powerful tool
for in-situ optical studies of electrochemical reactions in batteries.

94
Figure 5.1 Electrochemical and optical characterizations of an ITO electrode. (a)
and (b), the voltage profile (a) and the cycling performance (b) of a 250 nm thick ITO
film on glass. (c), camera images of the ITO film at different charge/discharge states. a-e
in figure 5.1 c corresponds to A-E in figure 5.1 a, f is the UV-Vis spectroscopy of an ITO
thin film after two cycles (state D).
5.2 Battery Design Principle
To circumvent the intrinsic problem of the opacity of battery electrode materials, we
utilize a new strategy of designing patterned electrodes with very small features so that
the nontransparent materials cover only a small portion of the whole area of the device, as
illustrated in figure 5.2 a. The opaque battery electrode materials (black) and metal
current collectors (yellow) beneath are confined inside the grid, while the rest of the
electrode substrate is transparent. If the feature dimension of the lines is comparable or
less than the resolution of human eyes (50-100 m), the opaque electrode grid is
indistinguishable from the transparent substrate. Consequently the entire device appears
transparent. At a transparency of , the areal portion of opaque electrode materials is 1-.
Moreover, by aligning multiple layers of electrodes together, the transparency does not
decrease while the energy stored increases linearly. In contrast, the transparency of thin
film electrodes decreases exponentially when more cells are stacked in series.108,109
As a
result, a transparent battery with practical capacity for portable electronics can be
accomplished using patterned electrodes on clear substrates. Figure 5.2 b plots the
calculated transparency versus volumetric energy density of such devices. The theoretical
limit based on active materials only is shown in black, while the red line considers the
volume of all other components in a battery, including current collectors, separators and
packaging. At a transparency of 60%, the theoretical energy density is about 200 Wh/L
with packaging, as state-of-the-art Li-ion batteries have an energy density of 500-600
Wh/L. This value is comparable to that of lead acid and NiCd rechargeable batteries.5
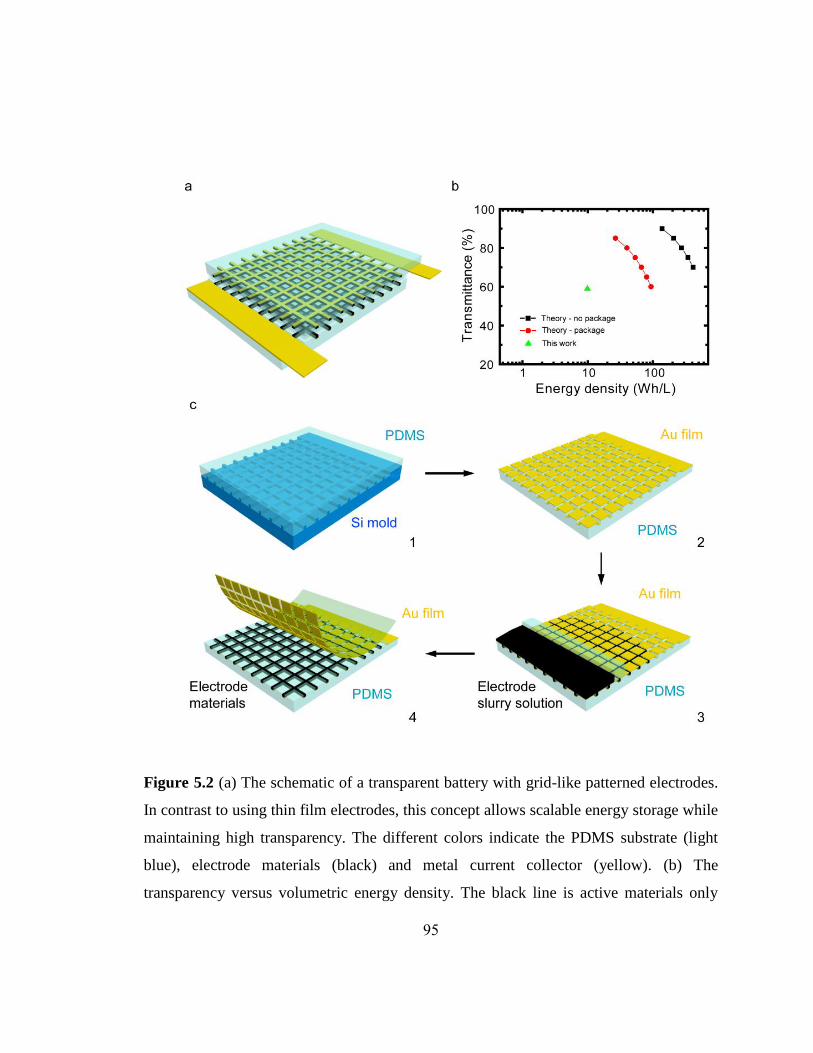
95
Figure 5.2 (a) The schematic of a transparent battery with grid-like patterned electrodes.
In contrast to using thin film electrodes, this concept allows scalable energy storage while
maintaining high transparency. The different colors indicate the PDMS substrate (light
blue), electrode materials (black) and metal current collector (yellow). (b) The
transparency versus volumetric energy density. The black line is active materials only

96
and the red line considers the volume of other components, such as separators,
current collectors and packaging. (c) The process flow of fabricating a transparent battery:
1) Transfer grid patterns from silicon mold to PDMS, 2) Evaporate gold current collector
onto the PDMS substrate, 3) Fill in battery electrode materials by a microfluidics-assisted
method, and 4) Peel off gold film on top of the PDMS substrate.
5.3 Fabrication Process
Traditional approaches are difficult to realize the grid-structured electrode. The
battery electrode is a thick porous film (typically 30 - 300 m), composed of
heterogeneous powders with entirely different properties: inorganic active materials,
carbon black nanoparticles, and an adhesive polymeric binder. Moreover, the
electrochemical performance of these materials is sensitive to damage110
and surface
modifications111
. Hence, traditional etching or lithography methods used in electronics
processing are not appropriate. Ink-jet printing is difficult to transfer enough solid mass
and print very narrow lines with low-viscosity inks. Moreover, materials patterned by
ink-jet printing without confinement are likely to crack and diffuse away from their initial
position, which could significantly decrease the transparency during long term operation.
To overcome these difficulties, a novel microfluidics-assisted method is used to
pattern battery materials (figure 5.2 c). This approach is related to microchannel guided
assembly of nanomaterials112,113
, but uses a distinct configuration. First, a
Polydimethylsiloxane (PDMS) substrate with grid-like trenches is fabricated by spin
coating a PDMS precursor (Sylgard 184) onto a silicon mold and curing it at 80 ℃ for 3
hours. The width of the trenches is 35 m and the depth is 70 m. After the PDMS is
peeled off from the silicon mold, a 100 nm gold film is evaporated onto it as the current
collector. Then, the sample is treated in air plasma for 90 s to make its surface
hydrophilic. A thin slide of PDMS, referred as the blocking PDMS in step 3, is placed at
one end of the trenches to form a narrow region of closed channels (2-3 mm in length).

97
The electrode material is composed of 90% active materials (LiMn2O4 or Li4Ti5O12), 7%
carbon black and 3% aqueous binder (Pred materials). The concentration of solid
materials in the solution is 18-20%.
To introduce the slurry solution to the pre-designed trenches, a thin slide of PDMS is
placed at one end of the electrode region to form an area of closed channels (figure 5.2 c,
step 3). Then the slurry solution is dropped onto one side of the channels. Due to the
capillary force, the aqueous solution is sucked into channels under the blocking PDMS
and then continues flowing in the channels not covered by PDMS. The flow speed is
about 1 cm/s. We find that nano-sized active materials filled the trenches more quickly
and evenly than micron-sized particles. This is likely because nanomaterials do not clog
the channels easily, even when the slurry solution is concentrated. As a result, LiMn2O4
nanorods110,114
and Li4Ti5O12 nanopowder are used as cathode and anode materials,
respectively. An analytical model on the estimate of the flow speed is made based on
simple closed round channels. The filling length L is equal to 2/1
2/1
2
cost
R
, where
R is the radius of channel, is the surface tension of water, is the contact angle, is the
viscosity of the slurry solution and t is the time. The time to fill a 1 cm channel will only
take 0.4 s, which is consistent with observations. Then the solution is dried and the
blocking PDMS piece is removed. Finally, a piece of Kapton tape is carefully pressed
onto the PDMS substrate and extra gold film is peeled off.
To make a full cell, aluminum strip is wrapped onto the side of each electrode. Then,
gel electrolyte is placed on the anode electrode first, and the transparent cathode is put on
the anode under optical microscope at 20 X. The full cell is sealed inside a highly
transparent poly(vinyl chloride) (PVC) thermoplastic bag with metal current collector
extending out. The cell configuration is very similar with a pouch cell except that all
components are transparent.
After drying and removing the blocking PDMS, all of the trenches are filled with

98
battery electrode material. The next step is to peel off extra gold on top of the PDMS
by Kapton tape (figure 5.2 c, step 4). The gold film is readily removed due to a low
surface energy of PDMS (19.8 J/m2).
115 After this process, a single transparent electrode
is successfully fabricated with both metal current collectors and electrode materials
confined in micro-trenches.
The gel electrolyte is made as follows. 2mL 1M LiClO4 in EC/DEC (50:50 vol) and
0.8 g PVDF-HFP (Kynar 2801) is dissolved in 12 mL Tetrahydrofuran (THF, Sigma
Aldrich). After stirring overnight, the clear solution is drop cast onto a glass slide. Then
the solution is vacuum dried for two hours to remove THF and a translucent gel
membrane is formed. Then the membrane is peeled off from the glass substrate and
soaked in 1 M LiClO4 in EC/DEC to turn it transparent again. Impedance shows that the
as-made gel electrolyte has an ionic conductivity of 2 × 10⁻³
S/cm.
Then the two electrodes and a piece of transparent gel electrolyte are assembled
together; this is another key step in this grid-based design. If the grid patterns in the two
electrodes do not match well to each other, the transparency will decrease exponentially
upon stacking, as in the case of thin film electrodes. Cell assembly is performed manually
under optical microscopy at a magnification of ~20 X, which results in an accuracy better
than 10 m. This assembly process can be done automatically in the future in real battery
production with better aligning accuracy. Finally, the sandwich structure is sealed inside
a transparent polymer bag with two pieces of aluminum strip extending out as the current
collector, which has the same configuration as pouch cell, except that all components are
transparent.
5.4 Microscopic Characterizations of the Transparent Battery
Figure 5.3 a-c show a series of images of an as-fabricated single transparent
electrode on a Polyethylene naphthalate (PEN) substrate at different magnifications. The

99
areal portion of trenches is 35%, indicating a theoretical transparency of 65%.
Characters behind the electrode can be seen clearly in the camera image (figure 5.3 a).
The electrode is also bendable and flexible. High magnification optical images (figure 5.3
b) and the SEM image (figure 5.3 c) illustrate that the electrode materials are confined to
the interior of the trenches, demonstrating that the microfluidics-assisted method is
successful in patterning battery electrodes. Optical microscope is used to study the
uniformity and thickness of battery electrode materials inside the trenches. The average
thickness is 50 m, which is about 70% of the trench depth and comparable with the
thickness of electrode materials in commercial batteries. Moreover, this concentration is
much higher than the concentration of solid material in the slurry (18-20%), suggesting
that the solution keeps moving towards the end of trenches upon evaporation of water.
The standard deviation of the thickness is 4 m, corresponding to a small variation of 8%
over the whole device (figure 5.4). This indicates that the microfluidics-assisted method
forms a uniform electrode film and the mass loading is suitable for practical use.
As mentioned before, the grid structure in electrodes must align with each other to
achieve high transparency and high energy at the same time. This is accomplished by
matching the electrodes manually under a microscope, but can be achieved automatically
in the future. Figure 5.3 e shows an optical image of an assembled transparent Li-ion
battery with two electrodes and a gel electrolyte membrane in between. It is clear that the
two electrodes align well with each other and only a small mismatch is observed at the
bottom left corner.

100
Figure 5.3 (a) Photographic image of a transparent and flexible battery electrode. (b) and
(c), Magnified optical image (b) and SEM image (c) of the battery electrode. Electrode
materials are only confined inside the trenches. (d) Transparent, flexible and stretchable
gel electrolyte. (e) Optical microscopic image of a full battery with electrodes matched to
each other. A small mismatch at the bottom left corner is marked by the red arrow. (f)
The UV-VIS spectrum of gel electrolyte, a single electrode and a full battery.

101
Figure 5.4 The thickness distribution of electrode thickness over a single electrode.
The standard deviation is only 8%.
5.5 Transparency Measurement
To quantitatively study the transparency of battery components and the full device,
UV-VIS spectroscopy is used to measure the transmittance of each component, as plotted
in figure 5.3 f. The gel electrolyte exhibits transmittance of about 99 %, so its effect on
the transparency of the full battery is negligible. A single electrode without packaging
showed a transmittance of 62% in the visible and near infrared, which is 3% lower than
the theoretical value based on the area of battery materials in the design. The difference
may originate from the coverage area of the battery material, but could also occur
because the UV-VIS spectrum only measures the direct transmittance, but not the diffuse
transmittance. The full cell with packaging exhibits a transmittance of 57%. The 5%
difference in transmittance between a single electrode and a full cell is likely a result of
the small mismatch (3-5 m) between the two electrodes, which is consistent with
observations from optical microscopy images (figure 5.3 e), or a small amount of
absorption from the packaging. Nevertheless, the transmittance of the full cell is much
higher than two electrodes randomly stacked (0.652 ~ 42%). When more electrodes are
stacked together, the difference will be even more significant. For example, a device with
three full cells in series will exhibit a transparency less than 10% if they are randomly
oriented. In contrast, well aligned cells show transparency similar to an individual
electrode (~60%).
5.6 Electrochemical Characterizations
Before investigating the performance of the transparent battery, the electrochemical
behavior of each component was examined with transparent packaging first. PDMS and

102
gold are new materials introduced into the transparent battery. PDMS has been
previously reported as a component in a copolymer electrolyte.116
Gold is inert in the
range of 1.0 - 4.4 V versus Li/Li+117
, in which the operating potential range of the chosen
cathode (3.5 - 4.25 V vs. Li/Li+ for LiMn2O4) and anode (1.3 - 1.8 V Li/Li
+ for Li4Ti5O12)
lie. To further test the stability of the gold film on PDMS, cyclic voltammetry (CV) is
performed, showing little reaction with lithium in the potential window (figure 5.5). A
small anodic peak is observed at 2.1 V, but it disappears after several scans. This
indicates that the initial coulomb efficiency might be slightly low at the anode side
(Li4Ti5O12). However, the current density is less than 10 A/cm2 at 2 mV/s, which is
much less than the current used in charging/discharging batteries (100 A/cm2).
Furthermore, since the peak diminishes quickly upon scanning and does not remain
within the potential window for the full cell, this side reaction has little effect on battery
performance after the first cycle. This argument is also supported by full cell cycling data
discussed later in this paper.
Figure 5.5 Cyclic voltammetry measurement on PDMS substrate with 100 nm gold
evaporated on top.

103
Figure 5.6 a exhibits the typical voltage profiles of Li4Ti5O12 nanopowder and
LiMn2O4 nanorods respectively. The profiles are similar to those observed in
conventional battery electrode114,118
and no significant overpotential is observed. To
quantitatively understand how the grid design affects the voltage profile, we measured
the resistance of the transparent electrodes. The sheet resistance is ~60 /sq for both
electrodes, suggesting an additional overpotential of only 3 mV in half cells at 100
A/cm2. The electrode is also flexible. Even after repeatedly bending down to a radius of
2 cm 100 times, the sheet resistance is still less than 100 /sq. After bending, only a
slightly higher overpotential is observed and the corresponding capacity is less than 5%
lower than before bending (figure 5.6 a, dash line). Resistances of the electrode bent to
different radii are measured and no dramatic change is observed at radii above 1 cm.
(figure 5.7). We attribute the good flexibility of transparent electrodes to two reasons: 1)
the flexibility of PDMS and 2) conductive carbon black can bridge cracked Au electrode
pieces. The cycling performance of these transparent electrodes is shown in figure 3b.
The LiMn2O4 nanorod and Li4Ti5O12 nanopowder electrodes showed initial discharge
capacities of 97 mAh/g and 142 mAh/g, and capacity retentions of 87 % and 93 % after
40 cycles at 100 A/cm2, respectively. To derive the specific capacity, the mass loading
is calculated based on the tapping density and the thickness of the electrode film. The
tapping density is estimated from electrode films with the same composition coated by
doctor blading with the same composition, which is 1.1 g/cm3 for LiMn2O4 and 1.2 g/cm
3
for Li4Ti5O12 electrodes, respectively. As a result, the estimated mass loading is 1.8
mg/cm2 for LiMn2O4 and 1.9 mg/cm
2 for Li4Ti5O12, which leads to specific capacity
consistent with previous reports114,118
. The Coulomb efficiency is above 97 % for both
electrodes. Passivation of PDMS with transparent materials (e.g. polymer or oxides)
could further improve the Coulomb efficiency.

104
Figure 5.6 (a) and (b) The voltage profile (a) and the cycling performance (b) of a
transparent cathode (LiMn2O4 nanorods) and anode (Li4Ti5O12 nanoparticles) in half cells
with lithium as the counter electrode. Solid and dashed lines represent as-fabricated
electrodes and electrodes after bending to 2 cm in radius 100 times, respectively. The
applied current is 100 A/cm2. The transparency of electrodes is about 65%. (c) and (d)
The voltage profile (c) and the cycling performance (d) of a transparent
LiMn2O4/Li4Ti5O12 full cell with transparency of 60%. The current is 100 A/cm2.

105
Figure 5.7 The resistance of a transparent electrode upon bending.
The transparent full cell is fabricated by sealing matched LiMn2O4 electrode/gel
electrolyte/Li4Ti5O12 electrode inside a transparent plastic bag, which has the same
configuration as pouch cell. The cell has a transparency of about 60%. Figure 5.6 c and d
show its voltage profile and cycling performance, respectively. The average discharge
voltage is 2.4 V, consistent with the difference between LiMn2O4 and Li4Ti5O12. The
initial discharge capacity is 100 mAh/g, and the capacity remains over 80 mAh/g after 15
cycles.
To demonstrate practical applications, the transparent full cell is used to repeatedly
light a red light emitting diode (LED), as shown in figure 5.8a. The LED is placed behind
a transparent battery and light shines through it. The energy density of this full cell is 50
Wh/L based on active electrode materials only and 10 Wh/L including all components.

106
Figure 5.8 (a) A transparent battery lighting a red LED. The LED is placed behind the
battery so that light goes through the transparent battery. (b) In-situ Raman spectrum of
LixMn2O4 nanorods at different charging states (x) measured in a transparent battery. The
two peaks at 498 and 717 cm-1
belong to PDMS, while peaks at 625 and 597 cm-1
can be
assigned to LiMn2O4 and -MnO2, respectively.
5.7 In-situ Raman Study Based on Transparent Batteries
Besides applications in transparent electronics, the transparent battery is also a useful
research tool for scientific studies. As the cell is transparent, electrode materials are
visible. Consequently, optical methods, such as Raman spectroscopy and Fourier

107
transform infrared spectroscopy (FTIR), could be applied to in-situ studies of
electrode materials. Furthermore, as the electrode is well patterned, it is possible to
investigate of the effect of geometry on the charge/discharge of electrode materials.
Figure 5.8 b shows in-situ microRaman spectra collected in a transparent battery. In this
case, the two electrodes are slightly mismatched so that the laser (Ar+, 514 nm)
illuminates on the LiMn2O4 electrode. Three spectra are collected upon charging,
corresponding to x = 1.0, 0.5 and 0.2 in LixMn2O4. Two peaks at 498 and 717 cm-1
originate from PDMS and do not change in all three spectra. PDMS exhibits another
small peak at 612 cm-1
, which is covered by the peak at 626 cm-1
, the A1g mode in
LiMn2O4119,120
. When x decreases to 0.5, this peak becomes lower and shifts to 620 cm-1
.
After more lithium is extracted and x further decreases down to 0.2, a strong peak at 597
cm-1
is observed, corresponding to the A1g mode in -MnO2119,120
. The observation of the
evolution of Raman peaks demonstrates the feasibility of using a transparent battery for
an in-situ optical spectroscopy study of fundamental electrochemical reactions.
5.8 Discussion and Summary
The theoretical energy density with packaging is 100 Wh/L, about one order of
magnitude higher than the transparent battery demonstrated. The difference mainly
comes from a thick PDMS substrate (~100 m) and thin electrode film (~50 m). With
further optimization, including reducing the thickness of PDMS substrate, increasing the
depth of the trenches and using materials with higher specific capacity and tapping
density (e.g. LiCoO2), we believe that the energy density could be increased to over 50
Wh/L.
Moreover, in some types of portable electronics and miniaturized devices, the
footprint area is limited, but the restriction on device thickness is less stringent. As a
result, the energy per area is more important than the energy per volume for certain
applications.121
Given the opportunity to stacking multiple cells in series, which increases

108
the areal energy density without sacrificing the transparency, our novel electrode grid
design is favorable to thin film designs, and will result in practical transparent batteries.
In this chapter, we have proposed and realized an approach to pattern battery
electrodes at the micron-scale to fabricate transparent batteries, which can function as the
power supply in transparent electronics. As the feature size of the patterned electrode is
less than the resolution of human eyes, the nontransparent electrode materials cannot be
distinguished from the transparent PDMS substrate, resulting in a transparent electrode.
The grid-like structure of the electrode is achieved by a novel method based on
microfluidic techniques and battery electrodes having a well-defined grid structure are
fabricated. Furthermore, by aligning multiple electrodes together, the transparency does
not decrease while the energy stored in the battery increases linearly with the number of
electrodes. The as-fabricated devices show transparency of 78, 60 and 30% and
corresponding energy density of 5, 10 and 20 Wh/L with packaging.

CHAPTER 6: CONCLUSION
Lithium ion batteries can help solve imminent energy and environmental issues, as
they play an important role in vehicle electrification and gird-level energy storage. They
are also critical to portable electronics. The performance of state-of-the-art battery
technology cannot fully satisfy requirement in these applications, and advanced batteries
with superior performance and new functionality are desired for applications including
novel electronics, electric vehicles, and smart grids.
In this thesis, we first demonstrate material development for high-specific-energy Li-
S batteries and high-specific-capacity Li2S cathode. These new systems could realize
batteries with specific energy three to five times that of state-of-the-art Li-ion batteries.
With rational design to solve issues presented in these systems, such as polysulfide
dissolution, volume expansion and insulating products, dramatically improved
performance have been realized for these systems. In sulfur cathode, discharge capacity
of 900 mAh/g and retention of 85% per 100 cycles have been achieved. For Li2S cathode,
the discharge capacity retention reaches 75% per 100 cycles with a discharge capacity of
550 mAh/g. In-situ X-ray diffraction and imaging are also employed to obtain a deeper
understanding of sulfur and Li2S electrodes. The results obtained from in-situ studies are
significantly different from previous ex-situ studies and expand our knowledge on these
materials.
Besides material development for high energy battery, progresses at the device level
are also important for advances of batteries. With creative thinking, we demonstrate the
first transparent Li-ion batteries for future electronics, which is the last missing piece for
fully transparent electronics. The transparent battery is realized by fabricating a grid-like
electrode with microfluidics-assisted method. Batteries with transparency of 60% and
energy density of 10 Wh/L have been demonstrated. The energy density could reach 100
Wh/L by further optimization.

110
As a final remark, advances in batteries lie on progresses three interactive aspects:
material development, mechanism understanding and device fabrication. Every step in
these three aspects will ultimately lead to advanced batteries with superior performance
and novel functionality.

APPENDIX A: SIMULATION ON IONIC TRANSPORT IN LI2S
A.1 Model
To understand the effect of ionic transport, we employ the standard model for Li-ion
battery simulation.87,89
The Bulter-Volmer equation for the electrochemical reaction:
j=j0 (Cs/CT)exp((1-F/RT)-exp(-F/RT)), (A1)
where Cs is the surface concentration of lithium ions, CT is the concentration of
lithium ions in intrinsic Li2S, is the overpotential neglecting the effect of electronic
transport and phase nucleation barrier, and is the transfer coefficient.
As we examined the charging process at rates higher than C/200, where the
overpotential at the top of the potential barrier is significantly larger than kT, the second
exponential term in the bracket is negligible. So
j=j0 (Cs/CT)
exp((1-F/RT), (A2)
This equation relates to process inside the particle (e.g. diffusion and migration of
lithium ions and electrons) only through the surface concentration of Li+ (Cs).
As Li2S has poor ionic diffusivity and electronic conductivity, both movement of
electrons and lithium ions were considered. We assumed that the system behaved like a
binary electrolyte, where the two components are lithium ions and electrons. Such system
is governed by the Nernst-Planck equation:

112
where c is the concentration of each species, D is the diffusivity of chemical species,
and is the corresponding mobility. is related to D according to the Einstein relation:
D=(kT/e).
The boundary conditions are based on the fact that constant current was applied for
charging:
JLi+ = J0.
J0 is the flux of lithium ions on the surface. As Li2S particles were well mixed with
carbon additives, it is reasonable to assume that the current on the surface of Li2S
particles were spatially uniform. So J0 = I0/F(6m/d), where I0 is the current applied and
F is the Faraday constant. For example, J0 = 3.35 * 10-7
mol/m2s for C/20.
The second set of boundary condition is:
Itotal = ILi++Ie- = 0.
This is due to that there is no charge accumulation inside the particle. As described in
the electronic conduction part above, the charge relaxation time is ~ 0.2 s at maximum,
which is much shorter than the simulation step (10 s) and the time to reach the top of
barrier (1500 - 15000 s). So the electronic and ionic current are the same in the absolute
value, but with opposite signs.
To estimate the overpotential due to ionic transport, we compared the overpotential
in two cases: 1) the measured diffusivity and mobility in Li2S. 2) The diffusivity and
mobility are large enough so that they have no effect on the overpotential and thus
lithium ions distribute uniformly. As a result,
j = j0 (Cs/CT)
exp((1-F/RT) ………………With measured diffusivity
j = j0 (C’/CT)
exp((1-F/RT)…………………Diffusivity is very large

113
As j is the same in the two cases, we have
(C’/CS) = exp ((1-)F(1-2)/RT)
ion = 1-2 = RT/(1-F*ln(C’/CS),
where C’ is the average concentration of lithium ions in Li2S at the barrier top. Cs is
the surface concentration of lithium ions based on COMSOL simulation mentioned
above.
A.2 Simulation
The diffusivity of lithium ions is extracted from impedance results (figure 4.16 B)
based on the semi-infinite linear diffusion model13
:
Re(Z) = Rct+-1/2,
Di = R2T
2/2S
2n
4F
4Cs
2
2,
where S is the total surface area for Li2S, n is the charge number, Cs is the
concentration of Li ions on the surface. Di at different charging stages for pristine and
ball-milled Li2S are plotted in figure A.1. Di is set to 10-15
cm2/s for the simulation, and
the corresponding mobility of Li ions is (e/kT)Di = 4 * 10-14
cm2/Vs.

114
Figure A.1 The lithium ion diffusivities of pristine and ball-milled Li2S electrodes at
different stages of charging.
The electronic conductivity is derived based on a similar process discussed in the
section of “Contribution of Electronic Conductivity of Li2S to the Overpotential”, with
= 10 mV and l = 10 nm. Then e = 6 * 10-10
S/cm, corresponding to a diffusivity is 2*10-
15 cm
2/s based on the Einstein relation and the electron density the same as Li ions. These
values are larger than their ionic counterparts, which imply that the process is limited by
ions.
The particle size is set to 2 m in diameter. The initial concentration of lithium ions
and electrons are both 7.22 * 104 mol/m
3, which equals to the amount of lithium ions in
stoichiometric Li2S.
COMSOL 3.4 Nernst-Planck axial symmetry (2D) module is used for the simulation.
The time step in the simulation is 10 s, and the mesh size is 2 nm on the boundary. The
moment reaching the top of the barrier is set as the end of the simulation.

115
A.3 Results
The simulation results are shown in figure A.2. The surface concentration of lithium
ions was lower when a larger current was applied (figure A.2). This is consistent with
intuition. A larger current requires a larger concentration gradient at the surface to
maintain the current continuity. The different points at the same current represent
samples with different times to reach the top of the barrier for different samples.
Figure A.2 B shows a mapping of lithium ion concentration on the crossing section
of the particle at C/50. The concentration gradient exists only within ~100 nm close to the
surface of the particle. The surface concentration is about half of that in the center, which
is the concentration in pristine Li2S (7.22*104 mol/m
3).
Figure A.2 C compares the effect of diffusion and migration. Clearly diffusion
dominates the process, and migration of ions and electrons does not contribute too much
to the total flux. This is because that electrons move faster than ions so that they can
catch up the movement of lithium ions. As a result, local charge neutrality is maintained
and thus the electric field to drive migration is not strong. Figure A.2 D confirms that
migration does not play an important role through the comparison between the binary
electrolyte model and pure Li ion diffusion model. Clearly the difference between the two
models is small, which further shows that diffusion dominates the process.

116
Figure A.2 The COMSOL simulation results of ionic transport inside the Li2S particles.
(A) The relative surface concentration of lithium ions at different current rates. (B) The
concentration mapping of lithium ions on the cross section of a Li2S particle with
diameter of 2 m. The unit is mol/m3. (C) The lithium ion flux of both diffusion and
migration. The effect of migration is minor as electrons can catch up the movement of
lithium ions. (D) A comparison of the binary electrolyte model and pure lithium ion
diffusion model. The two models give similar results as the effect of migration is not

117
significant. (B) – (D) are results at C/50 and the time to reach the barrier top is 1 hour and
50 mins.

118
BIBLIOGRAPHY
(1) Jacobson, M. Z. Energy Environmental Science 2009, 2, 148-173.
(2) Armand, M.; Tarascon, J.-M. Nature 2008, 451, 652-657.
(3) Arico, A. S.; Bruce, P.; Scrosati, B.; Tarascon, J. M.; Van Schalkwijk, W. Nature
Materials 2005, 4, 366-377.
(4) Manthiram, A.; Murugan, A. V.; Sarkar, A.; Muraliganth, T. Energy &
Environmental Science 2008, 1, 621-638.
(5) Tarascon, J. M.; Armand, M. Nature 2001, 414, 359-367.
(6) Huggins, R. A. Advanced Batteries: Materials Science Aspects; Springer, 2008.
(7) http://finance.yahoo.com/news/market-research-forecasts-lithium-ion-
080800784.html.
(8) Goldstein, J.; Newbury, D.; Joy, D.; Lyman, C.; Echlin, P.; Lifshin, E.; Sawyer, L.;
Michael, J. Scanning Electron Microscopy and X-ray Microanalysis; Goldstein, J.,
Ed.; Springer, 2003; Vol. 1.
(9) Williams, D. B.; Carter, C. B. Transmission Electron Microscopy: A Textbook for
Materials Science; Plenum Press, 1996; Vol. V1-V4.
(10) Cullity, B. D.; Stock, S. R. Elements of X-Ray Diffraction; Cohen, M., Ed.;
Prentice Hall, 2001.
(11) Chao, S.-C.; Yen, Y.-C.; Song, Y.-F.; Chen, Y.-M.; Wu, H.-C.; Wu, N.-L.
Electrochemistry Communications 2010, 12, 234-237.
(12) Meirer, F.; Cabana, J.; Liu, Y.; Mehta, A.; Andrews, J. C.; Pianetta, P. Journal of
Synchrotron Radiation 2011, 18, 773-781.
(13) Bard, A. J.; Faulkner, L. R. Electrochemical Methods Fundamentals and
Applications; Wiley And Sons, J., Ed.; John Wiley & Sons, 2001.

119
(14) Barsoukov, E.; Macdonald, J. R. Impedance Spectroscopy Theory, Experiment,
and Applications; Evgenij Barsoukov; J Ross Macdonald, Eds.; Wiley-Interscience,
2005.
(15) Herbert, D.; Ulam, J. U.S. Pat., 3043896 1962.
(16) Rauh, R. D.; Brummer, S. B. Electrochimica Acta 1978, 23, 501-507.
(17) Mikhaylik, Y. V.; Akridge, J. R. Journal of the Electrochemical Society 2004, 151,
A1969-A1976.
(18) Ji, X. L.; Nazar, L. F. Journal of Materials Chemistry 2010, 20, 9821-9826.
(19) Kumaresan, K.; Mikhaylik, Y.; White, R. E. Journal of the Electrochemical
Society 2008, 155, A576-A582.
(20) Yamin, H.; Peled, E. Journal of Power Sources 1983, 9, 281-287.
(21) Ji, X. L.; Lee, K. T.; Nazar, L. F. Nature Materials 2009, 8, 500-506.
(22) Jayaprakash, N.; Shen, J.; Moganty, S. S.; Corona, A.; Archer, L. A. Angewandte
Chemie-International Edition 2011, 50, 5904-5908.
(23) He, G.; Ji, X. L.; Nazar, L. Energy & Environmental Science 2011, 4, 2878-2883.
(24) Zheng, G.; Yang, Y.; Cha, J. J.; Hong, S. S.; Cui, Y. Nano Letters 2011, 11, 4462-
4467.
(25) Zhang, B.; Qin, X.; Li, G. R.; Gao, X. P. Energy & Environmental Science 2010, 3,
1531-1537.
(26) Lai, C.; Gao, X. P.; Zhang, B.; Yan, T. Y.; Zhou, Z. Journal of Physical Chemistry
C 2009, 113, 4712-4716.
(27) Liang, C. D.; Dudney, N. J.; Howe, J. Y. Chemistry of Materials 2009, 21, 4724-
4730.
(28) Guo, J.; Xu, Y.; Wang, C. Nano Letters 2011, 11, 4288-4294.
(29) Yuan, L. X.; Yuan, H. P.; Qiu, X. P.; Chen, L. Q.; Zhu, W. T. Journal of Power
Sources 2009, 189, 1141-1146.

120
(30) Han, S. C.; Song, M. S.; Lee, H.; Kim, H. S.; Ahn, H. J.; Lee, J. Y. Journal of the
Electrochemical Society 2003, 150, A889-A893.
(31) Wang, H.; Yang, Y.; Liang, Y.; Robinson, J. T.; Li, Y.; Jackson, A.; Cui, Y.; Dai,
H. Nano Letters 2011, 11, 2644-2647.
(32) Liu, J.; Cao, Y. L.; Li, X. L.; Aksay, I. A.; Lemmon, J.; Nie, Z. M.; Yang, Z. G.
Physical Chemistry Chemical Physics 2011, 13, 7660-7665.
(33) Yang, Y.; Yu, G.; Cha, J. J.; Wu, H.; Vosgueritchian, M.; Yao, Y.; Bao, Z.; Cui, Y.
ACS nano 2011, 5, 9187-9193.
(34) Sun, M. M.; Zhang, S. C.; Jiang, T.; Zhang, L.; Yu, J. H. Electrochemistry
Communications 2008, 10, 1819-1822.
(35) Li, X.; Cao, Y.; Qi, W.; Saraf, L. V.; Xiao, J.; Nie, Z.; Mietek, J.; Zhang, J.-G.;
Schwenzer, B.; Liu, J. Journal of Materials Chemistry 2011, 21, 16603-16610.
(36) Sun, J.; Huang, Y. Q.; Wang, W. K.; Yu, Z. B.; Wang, A. B.; Yuan, K. G.
Electrochimica Acta 2008, 53, 7084-7088.
(37) Wang, Q.; Wang, W.; Huang, Y.; Wang, F.; Zhang, H.; Yu, Z.; Wang, A.; Yuan, K.
Journal of the Electrochemical Society 2011, 158, A775-A779.
(38) Zhang, W.; Huang, Y.; Wang, W.; Huang, C.; Wang, Y.; Yu, Z.; Zhang, H.
Journal of the Electrochemical Society 2010, 157, A443-A446.
(39) Yuan, L. X.; Feng, J. K.; Ai, X. P.; Cao, Y. L.; Chen, S. L.; Yang, H. X.
Electrochemistry Communications 2006, 8, 610-614.
(40) Zhang, B.; Chen, S.-ting; Gao, X.-ping Journal of Electrochemistry 2010, 16, 35-
38.
(41) Barchasz, C.; Leprêtre, J.-C.; Alloin, F.; Patoux, S. Journal of Power Sources 2011,
199, 322-330.
(42) Zhan, C. M.; Zhan, L. Z.; Song, Z. P.; Zhang, J. Y.; Tang, J.; Zhan, H.; Zhou, Y. H.
Electrochimica Acta 2008, 53, 8319-8323.
(43) Murugan, A. V.; Muraliganth, T.; Manthiram, A. Electrochemistry
Communications 2008, 10, 903-906.

121
(44) Andreas Elschner Wilfried Lovenich, Udo Merker, Knud Reuter, S. K. PEDOT:
Principles and Applications of an Intrinsically Conductive Polymer; CRC Press,
2010; pp. 126-127.
(45) Yang, Y.; McDowell, M. T.; Jackson, A.; Cha, J. J.; Hong, S. S.; Cui, Y. Nano
Letters 2010, 10, 1486-1491.
(46) Yu, C. Z.; Fan, J.; Tian, B. Z.; Zhao, D. Y. Chemistry of Materials 2004, 16, 889-
898.
(47) Jun, S.; Joo, S. H.; Ryoo, R.; Kruk, M.; Jaroniec, M.; Liu, Z.; Ohsuna, T.; Terasaki,
O. Journal of the American Chemical Society 2000, 122, 10712-10713.
(48) Greczynski, G.; Kugler, T.; Salaneck, W. R. Thin Solid Films 1999, 354, 129-135.
(49) Toniazzo, V.; Mustin, C.; Portal, J. M.; Humbert, B.; Benoit, R.; Erre, R. Applied
Surface Science 1999, 143, 229-237.
(50) Ji, X.; Evers, S.; Black, R.; Nazar, L. F. Nature Communications 2011, 2, 325.
(51) Groenendaal, B. L.; Jonas, F.; Freitag, D.; Pielartzik, H.; Reynolds, J. R. Advanced
Materials 2000, 12, 481-494.
(52) Wang, Y.; Cao, G. Z. Advanced Materials 2008, 20, 2251-2269.
(53) Yamada, A.; Hosoya, M.; Chung, S. C.; Kudo, Y.; Hinokuma, K.; Liu, K. Y.;
Nishi, Y. Journal of Power Sources 2003, 119, 232-238.
(54) Chen, Z. H.; Dahn, J. R. Journal of the Electrochemical Society 2002, 149, A1184-
A1189.
(55) Nelson, J.; Misra, S.; Yang, Y.; Jackson, A.; Liu, Y.; Wang, H.; Dai, H.; Andrews,
J. C.; Cui, Y.; Toney, M. F. Journal of the American Chemical Society 2012, 134,
6337–6343.
(56) Choi, Y. J.; Chung, Y. D.; Baek, C. Y.; Kim, K. W.; Ahn, H. J.; Ahn, J. H. Journal
of Power Sources 2008, 184, 548-552.
(57) Jeong, S. S.; Lim, Y.; Choi, Y. J.; Cho, G. B.; Kim, K. W.; Ahn, H. J.; Cho, K. K.
Journal of Power Sources 2007, 174, 745-750.
(58) Cheon, S.-E.; Ko, K.-S.; Cho, J.-H.; Kim, S.-W.; Chin, E.-Y.; Kim, H.-T. Journal
of the Electrochemical Society 2003, 150, A796-A805.

122
(59) Ryu, H. S.; Guo, Z.; Ahn, H. J.; Cho, G. B.; Liu, H. Journal of Power Sources
2009, 189, 1179-1183.
(60) Wang, Y.; Huang, Y.; Wang, W.; Huang, C.; Yu, Z.; Zhang, H.; Sun, J.; Wang, A.;
Yuan, K. Electrochimica Acta 2009, 54, 4062-4066.
(61) Elazari, R.; Salitra, G.; Talyosef, Y.; Grinblat, J.; Scordilis-Kelley, C.; Xiao, A.;
Affinito, J.; Aurbach, D. Journal of the Electrochemical Society 2010, 157,
A1131-A1138.
(62) Andrews, J. C.; Almeida, E.; Van Der Meulen, M. C. H.; Alwood, J. S.; Lee, C.;
Liu, Y.; Chen, J.; Meirer, F.; Feser, M.; Gelb, J.; Rudati, J.; Tkachuk, A.; Yun, W.;
Pianetta, P. Microscopy and microanalysis the official journal of Microscopy
Society of America Microbeam Analysis Society Microscopical Society of Canada
2010, 16, 327-336.
(63) Liu, Y.; Andrews, J. C.; Wang, J.; Meirer, F.; Zhu, P.; Wu, Z.; Pianetta, P. Optics
Express 2011, 19, 540-545.
(64) Brissot, C.; Rosso, M.; Chazalviel, J. N.; Lascaud, S. Journal of Power Sources
1999, 81, 925-929.
(65) Liu, X. H.; Zhong, L.; Zhang, L. Q.; Kushima, A.; Mao, S. X.; Li, J.; Ye, Z. Z.;
Sullivan, J. P.; Huang, J. Y. Applied Physics Letters 2011, 98, 183107.
(66) Bruce, P. G.; Freunberger, S. A.; Hardwick, L. J.; Tarascon, J.-M. Nature
Materials 2012, 11, 19-30.
(67) Obrovac, M. N.; Dahn, J. R. Electrochemical and Solid State Letters 2002, 5, A70-
A73.
(68) Hassoun, J.; Scrosati, B. Angewandte Chemie (International ed. in English) 2010,
49, 2371-2374.
(69) Takeuchi, T.; Sakaebe, H.; Kageyama, H.; Senoh, H.; Sakai, T.; Tatsumi, K.
Journal of Power Sources 2010, 195, 2928-2934.
(70) Kim, J.; Hassoun, J.; Panero, S.; Sun, Y.-K.; Scrosati, B. Green 2011, 1, 323-328.
(71) Boscato, J.; Catala, J.; Franta, E.; Brossas, J. Tetrahedron Letters 1980, 21, 1519-
1520.
(72) Cui, Y.; Lieber, C. M. Science 2001, 291, 851-853.
123
(73) Chan, C. K.; Peng, H. L.; Liu, G.; McIlwrath, K.; Zhang, X. F.; Huggins, R. A.;
Cui, Y. Nature Nanotechnology 2008, 3, 31-35.
(74) Yan, H.; Sokolov, S.; Lytle, J. C.; Stein, A.; Zhang, F.; Smyrl, W. H. Journal of
the Electrochemical Society 2003, 150, A1102.
(75) Lee, K. T.; Lytle, J. C.; Ergang, N. S.; Oh, S. M.; Stein, A. Advanced Functional
Materials 2005, 15, 547-556.
(76) Marmorstein, D.; Yu, T. H.; Striebel, K. A.; McLarnon, F. R.; Hou, J.; Cairns, E. J.
Journal of Power Sources 2000, 89, 219-226.
(77) Zhou, Y. N.; Wu, C. L.; Zhang, H.; Wu, X. J.; Fu, Z. W. Electrochimica Acta 2007,
52, 3130-3136.
(78) Jeon, B. H.; Yeon, J. H.; Kim, K. M.; Chung, I. J. Journal of Power Sources 2002,
109, 89-97.
(79) Lee, Y. M.; Choi, N. S.; Park, J. H.; Park, J. K. Journal of Power Sources 2003,
119, 964-972.
(80) Nelson, J.; Misra, S.; Yang, Y.; Jackson, A.; Liu, Y.; Wang, H.; Dai, H.; Andrews,
J. C.; Cui, Y.; Toney, M. F. Journal of the American Chemical Society submitted.
(81) Aurbach, D.; Pollak, E.; Elazari, R.; Salitra, G.; Kelley, C. S.; Affinito, J. Journal
of the Electrochemical Society 2009, 156, A694.
(82) Li, Y.; Zhan, H.; Liu, S.; Huang, K.; Zhou, Y. Journal of Power Sources 2010, 195,
2945-2949.
(83) Wagemaker, M.; Mulder, F. M.; Van der Ven, A. Advanced Materials 2009, 21,
2703-2709.
(84) Meethong, N.; Huang, H.-Y. S.; Speakman, S. a.; Carter, W. C.; Chiang, Y.-M.
Advanced Functional Materials 2007, 17, 1115-1123.
(85) http://en.wikipedia.org/wiki/Relative_permittivity.
(86) Doyle, M.; Newman, J.; Gozdz, A. S.; Schmutz, C. N.; Tarascon, J.-M. Journal of
the Electrochemical Society 1996, 143, 1890-1903.
(87) Doyle, M.; Fuller, T. F.; Newman, J. Journal of the Electrochemical Society 1993,
140, 1526-1533.

124
(88) Srinivasan, V.; Newman, J. Journal of The Electrochemical Society 2004, 151,
A1517-A1529.
(89) Newman, J.; E. Thomas-Alyea, K. Electrochemical Systems; 3rd ed.; John wiley &
Sons, 2004.
(90) Zhao, J.; Wang, L.; He, X.; Wan, C.; Jiang, C. International Journal of the
Electrochemical Science 2010, 5, 478-488.
(91) Zhang, Y.; Feng, H.; Wu, X.; Wang, L.; Zhang, A.; Xia, T.; Dong, H.; Liu, M.
Electrochimica Acta 2009, 54, 3206-3210.
(92) Ju, S.; Facchetti, A.; Xuan, Y.; Liu, J.; Ishikawa, F.; Ye, P.; Zhou, C.; Marks, T. J.;
Janes, D. B. Nature Nanotechnology 2007, 2, 378-384.
(93) Yu, G.; Cao, A.; Lieber, C. M. Nature Nanotechnology 2007, 2, 372-377.
(94) Cao, Q.; Hur, S. H.; Zhu, Z. T.; Sun, Y. G.; Wang, C. J.; Meitl, M. A.; Shim, M.;
Rogers, J. A. Advanced Materials 2006, 18, 304-309.
(95) Wang, L.; Yoon, M.-H.; Lu, G.; Yang, Y.; Facchetti, A.; Marks, T. J. Nature
Materials 2006, 5, 893-900.
(96) Artukovic, E.; Kaempgen, M.; Hecht, D. S.; Roth, S.; Grüner, G. Nano Letters
2005, 5, 757-760.
(97) Nomura, K.; Ohta, H.; Ueda, K.; Kamiya, T.; Hirano, M.; Hosono, H. Science
2003, 300, 1269-1272.
(98) Wu, Z.; Chen, Z.; Du, X.; Logan, J. M.; Sippel, J.; Nikolou, M.; Kamaras, K.;
Reynolds, J. R.; Tanner, D. B.; Hebard, A. F.; Rinzler, A. G. Science 2004, 305,
1273-1276.
(99) Park, S.-I.; Xiong, Y.; Kim, R.-H.; Elvikis, P.; Meitl, M.; Kim, D.-H.; Wu, J.;
Yoon, J.; Yu, C.-J.; Liu, Z.; Huang, Y.; Hwang, K.-chih; Ferreira, P.; Li, X.;
Choquette, K.; Rogers, J. A. Science 2009, 325, 977-981.
(100) Ju, S.; Li, J.; Liu, J.; Chen, P.-C.; Ha, Y.-G.; Ishikawa, F.; Chang, H.; Zhou, C.;
Facchetti, A.; Janes, D. B.; Marks, T. J. Nano Letters 2008, 8, 997-1004.
(101) Görrn, P.; Sander, M.; Meyer, J.; Kröger, M.; Becker, E.; Johannes, H. H.;
Kowalsky, W.; Riedl, T. Advanced Materials 2006, 18, 738-741.

125
(102) Bae, S.; Kim, H.; Lee, Y.; Xu, X.; Park, J.-S.; Zheng, Y.; Balakrishnan, J.; Lei, T.;
Kim, H. R.; Song, Y. I.; Kim, Y.-J.; Kim, K. S.; Ozyilmaz, B.; Ahn, J.-H.; Hong,
B. H.; Iijima, S. Nature Nanotechnology 2010, 5, 574-578.
(103) Lee, J.-Y.; Connor, S. T.; Cui, Y.; Peumans, P. Nano Letters 2010, 10, 1276-1279.
(104) Yoon, J.; Baca, A. J.; Park, S.-I.; Elvikis, P.; Geddes, J. B.; Li, L.; Kim, R. H.;
Xiao, J.; Wang, S.; Kim, T.-H.; Motala, M. J.; Ahn, B. Y.; Duoss, E. B.; Lewis, J.
A.; Nuzzo, R. G.; Ferreira, P. M.; Huang, Y.; Rockett, A.; Rogers, J. A. Nature
Materials 2008, 7, 907-915.
(105) Huang, J.; Li, G.; Yang, Y. Advanced Materials 2008, 20, 415-419.
(106) Hong, J.; Jong, H. L.; Oh, S. M. Journal of Power Sources 2002, 111, 90-96.
(107) Ho, W.; Li, C.; Liu, H.; Yen, S. Journal of Power Sources 2008, 175, 897-902.
(108) Chen, P.-C.; Shen, G.; Sukcharoenchoke, S.; Zhou, C. Applied Physics Letters
2009, 94, 043113.
(109) Martín, F.; Navarrete, E.; Morales, J.; Roldán, C.; Ramos-Barrado, J. R.; Sánchez,
L. Journal of Materials Chemistry 2010, 20, 2847-2852.
(110) Yang, Y.; Xie, C.; Ruffo, R.; Peng, H. L.; Kim, D. K.; Cui, Y. Nano Letters 2009,
9, 4109-4114.
(111) Kang, B.; Ceder, G. Nature 2009, 458, 190-193.
(112) Gates, B.; Qin, D.; Xia, Y. Advanced Materials 1999, 11, 466-469.
(113) Kim, E.; Xia, Y.; Whitesides, G. M. Advanced Materials 1996, 8, 245-247.
(114) Kim, D. K.; Muralidharan, P.; Lee, H. W.; Ruffo, R.; Yang, Y.; Chan, C. K.; Peng,
H.; Huggins, R. A.; Cui, Y. Nano Letters 2008, 8, 3948-3952.
(115) Xue, M.; Zhang, Z.; Zhu, N.; Wang, F.; Zhao, X. S.; Cao, T. Langmuir The Acs
Journal Of Surfaces And Colloids 2009, 25, 4347-4351.
(116) Bouridah, A. Solid State Ionics 1985, 15, 233-240.
(117) Mui, S. C.; Trapa, P. E.; Huang, B.; Soo, P. P.; Lozow, M. I.; Wang, T. C.; Cohen,
R. E.; Mansour, A. N.; Mukerjee, S.; Mayes, A. M.; Sadoway, D. R. Journal of the
Electrochemical Society 2002, 149, A1610-A1615.

126
(118) Zaghib, K.; Simoneau, M.; Armand, M.; Gauthier, M. Journal of Power Sources
1999, 81-82, 300-305.
(119) Ammundsen, B.; Burns, G. R.; Islam, M. S.; Kanoh, H.; Roziere, J. Society 1999,
103, 5175-5180.
(120) Huang, W.; Frech, R. Journal of Power Sources 1999, 81-82, 616-620.
(121) Long, J. W.; Dunn, B.; Rolison, D. R.; White, H. S. Chemical Reviews 2004, 104,
4463-4492.