advanced airline sourcing 2015 by gillespie
TRANSCRIPT
Advanced Airline Sourcing
Scott GillespieCEO, tClara

Scott Gillespie’s BioCEO, tClara – Travel Data Made Brighter
Founder and CEO, Travel Analytics (acquired by TRX)
Managed 300+ airline sourcing projects
Analyzed $20 billion of corporate air spend
Clients included 40% of BTN’s Top 100
Author of a U.S. patent covering airline bid analysis
Author of Gillespie’s Guide to Travel + Procurement
Former travel sourcing expert at A.T. Kearney
MBA, University of Chicago
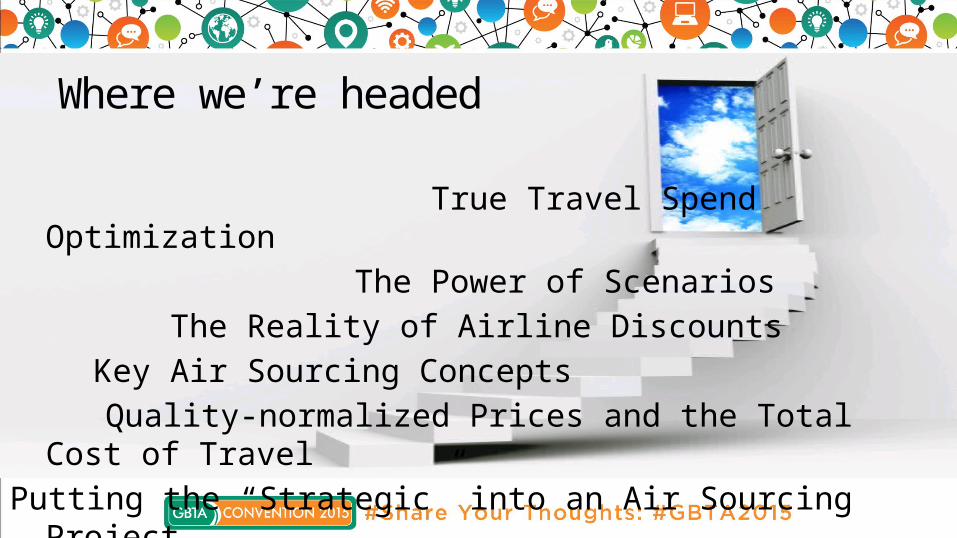
Where we’re headed
True Travel Spend Optimization The Power of Scenarios
The Reality of Airline Discounts Key Air Sourcing Concepts Quality-normalized Prices and the Total Cost of TravelPutting the “Strategic” into an Air Sourcing Project

Putting the “Strategic” into an Air Sourcing Project

Why CEOs Like ProcurementPurchased goods and services can be more than half of a firm’s total revenue
…without layoffs
~ 60%~
Purchased Goods and
Services
25%
Salaries, Wages and
Benefits
10%
Taxes, Depreciation and Interest
5%
ProfitBefore
100%
Total Revenue
8%
ProfitAfter
5% Reduced spending falls right to the bottom line…

How does Strategic Sourcing work?
Buyer Buyer
FragmentedSuppliers
ConsolidatedSuppliers

• Procurement adopted Total Cost of Ownership in the ‘90s– Fleet procurement considers
capital costs, fuel economy, maintenance and insurance costs, and safety ratings
We mustdo the same
in travel
The key strategic goal is reducing the
Total Cost of Ownership
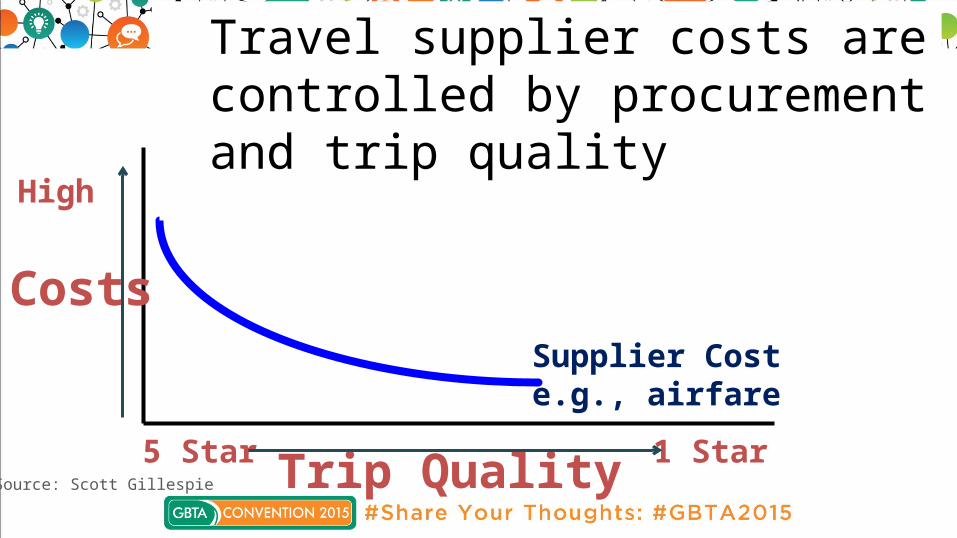
Trip Quality5 Star 1 Star
High
CostsSupplier Coste.g., airfare
Travel supplier costs are controlled by procurement and trip quality
Source: Scott Gillespie

High
Costs
Supplier Cost
Traveler friction is the hidden cost of travel. It’s an HR issue
Human Cost, or Traveler Friction
• Lost productivity• Reluctance to travel• Negative impacts on
recruiting & retention• Traveler health issues
Trip Quality5 Star 1 StarSource: Scott Gillespie

Joe Road Warrior’s Last Year
10 weeks away from
home
Over 200 hours in flight, 65% done on
personal time
More flight hours on own time than
annual vacation time
Crossed 80+ time zones
Source: tClara’s Trip Friction database
High
Costs
Supplier Cost
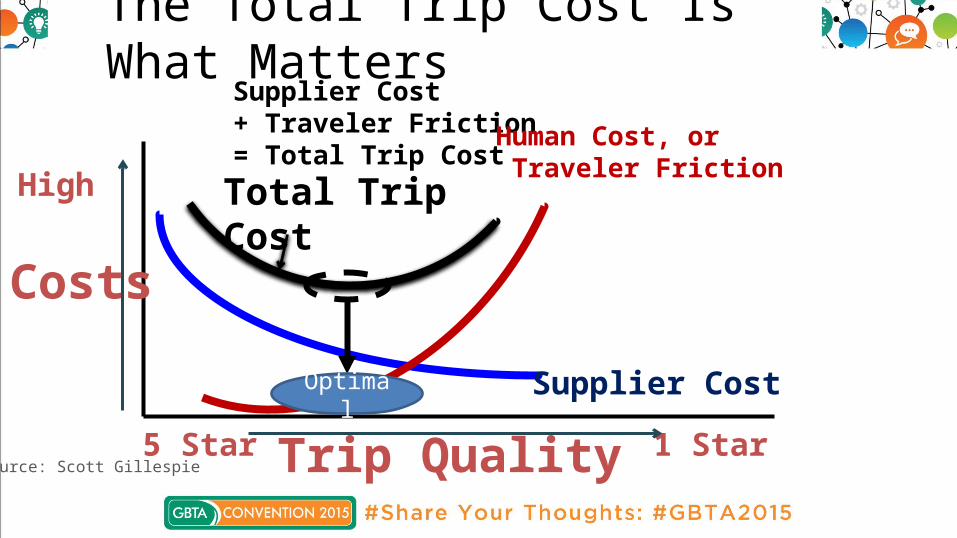
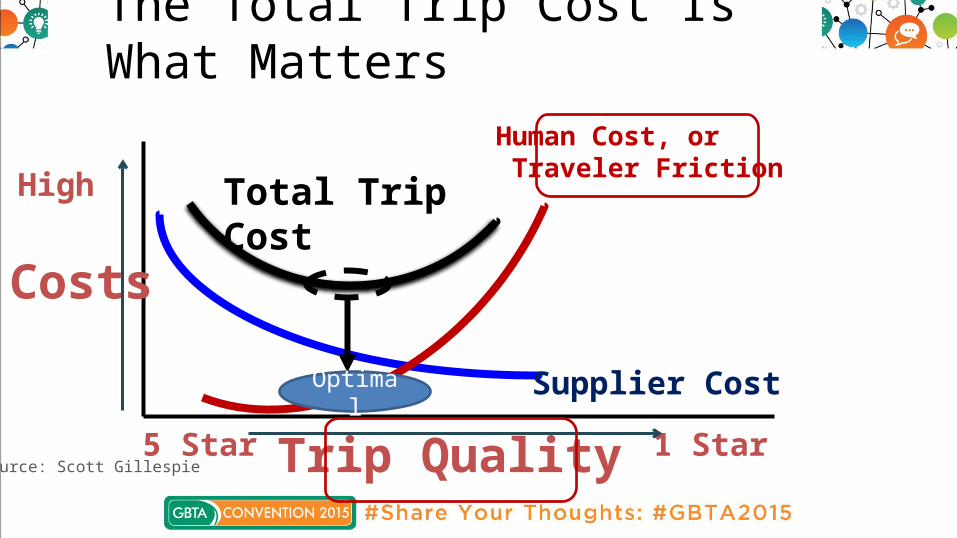
The Total Trip Cost Is What Matters
Total Trip Cost
Supplier Cost+ Traveler Friction = Total Trip Cost
Trip Quality5 Star 1 Star
Human Cost, or Traveler Friction
Optimal
Source: Scott Gillespie

High
Costs
Supplier Cost
Are you measuring what matters?
Total Trip Cost
Trip Quality5 Star 1 Star
Human Cost, or Traveler Friction
Optimal
Source: Scott Gillespie

Discounts and average ticket prices are poor procurement KPIs
Avg. Discount
8%
10%
Avg. Ticket Net Price
$525
$475
Firm A
Firm B
Which firm is getting the better deal?Price per
Mile$0.24
$0.22
We can’t tell from these metricsbecause they don’t measure trip quality
Trip Quality
Non-stop, on time
1-stop, 2 hr delay

High
Costs
Supplier Cost
We Need New Metrics
Total Trip Cost
Trip Quality5 Star 1 Star
Human Cost, or Traveler Friction
Source: Scott Gillespie

Travel sourcing needs these new KPIs
Travel Procurement KPIs
Trip Quality
Traveler Friction KPIs
Attrition Rate
Time to Replace
Work Days Lost
Focusing on Road Warriors
Quality-normalized Prices

“Measure what matters”
The Quality-normalized Price per Hour
Or Price per MileOr Room RateOr Daily Rate

Airline networks have different prices
Source: DB1B Q3 2014, tClara analysis. Flight time estimates per ticket are a function of miles flown and number of coupons. American includes US Air; Southwest includes AirTran
It cost
~ $100-110 an hour to fly in the US, on average
Network prices vary, even among similar airlines

Airlines have different trip qualities
Source: DOT. American includes US Air; Southwest includes AirTran. No data for Spirit
On-time RatesSchedulesFleetsSeatsWiFiPre-boardsTerminals

$125
Delta’s Price per hour
86%Delta’s Trip
Quality
The Quality-normalized Price
$146/hr=
Quality-normalized Prices
$120
UA’s Priceper hour
77%UA’s Trip Quality
$156/hr=

$12586%
Delta’s Trip Quality
The Quality-normalized Price
$146/hr=
Why is this a better KPI?
Decrease this, or
Increase this
This KPI comes down
Delta’s Price per hour
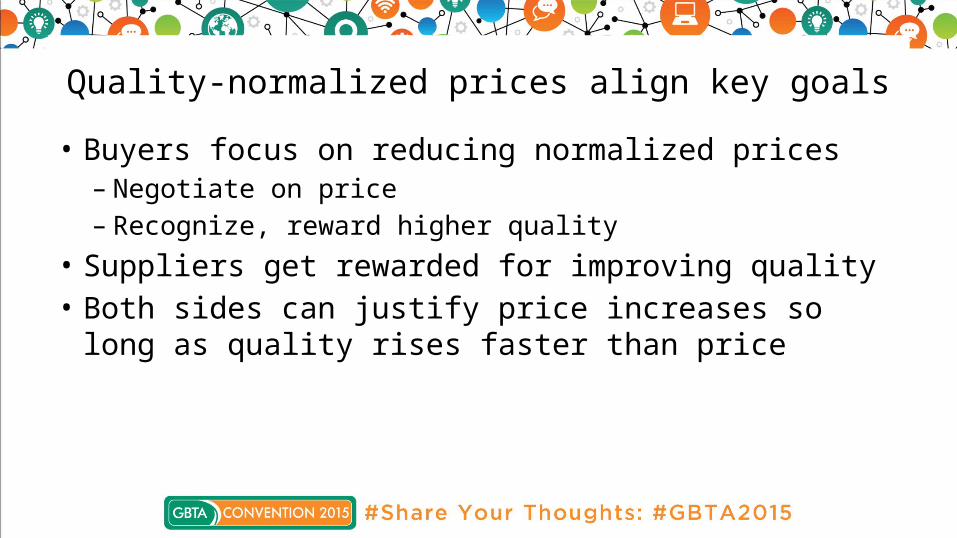
Quality-normalized prices align key goals• Buyers focus on reducing normalized prices
– Negotiate on price– Recognize, reward higher quality
• Suppliers get rewarded for improving quality• Both sides can justify price increases so long as
quality rises faster than price

Measure strategic success with four KPIs
Jan Feb Mar Apr May Jun Jul Aug80%85%90%95%
100%105%110%115%120%
Trends in Our Total Cost of Air TravelPrice per Hour
Quality Price per Hour
Trip Quality
Road Warrior Attrition Rate

Key Air Sourcing Concepts

25
More market share!
Lower prices!
made simpleAirline sourcing

Travel Policies Are Key to Sourcing Efforts
Purchase Process•Pre-trip approval•Booking•Payment
HowQuality Specs•Cabin•Connex•Hotels•Car size
WhatPreferred Suppliers•Air•Car•Hotel•TMC
WhoSavingsSafetyReimbursementConsequences
Why
Weak “Who” Travel Policy = Weak Discounts

27
credible
promises

28
credible
threats

29
Recognize
a good deal

Revenue Management 101Illustrative 100-seat Aircraft
$50,000
$900X 30 Seats
$400X 70 Seats
$55,000
$500X 100 Seats
$1,500 X 10 Seats
$1,200 X 20 Seats
$700 X 30 Seats
$300 X 40 Seats
$72,000

Airfare Inventory Booking Classes
Illustrative
How Buyers Benefitfrom Revenue Management
High prices help ensure last-minute
availability
Low prices make planned trips more
affordable
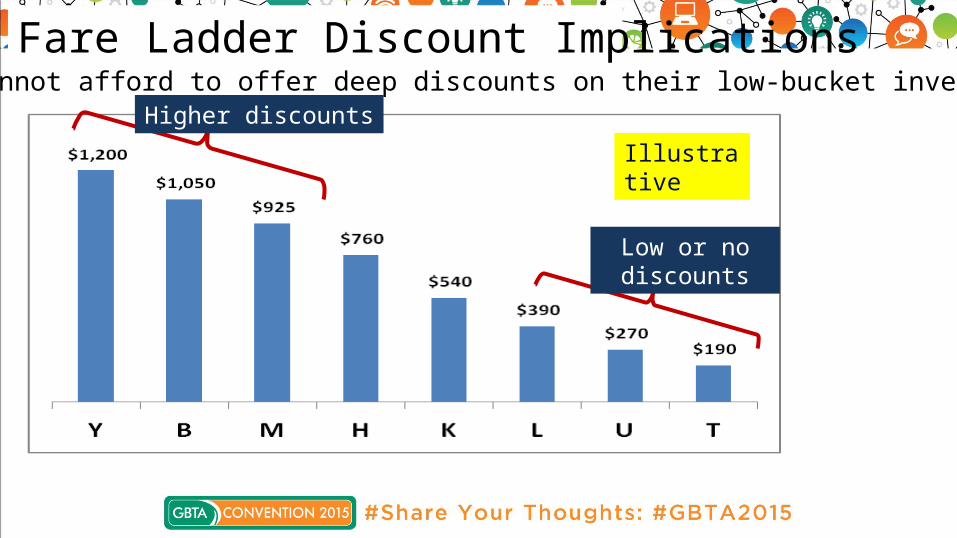
Fare Ladder Discount Implications
Higher discounts
Low or no discounts
Airlines cannot afford to offer deep discounts on their low-bucket inventory
Illustrative

Essential Air Sourcing Data Fields
Key Field: POS-CP-CR-BC Two Data Fields
Point of Sale (POS)
City Pair (CP) Code
Carrier (CR) Code
Booking (BC) Code
One-Way Equiv.
Segments
Ticketed Spend
USA ORDLHR UA B 1,000 $1,200,000
USA ORDLHR BA H 500 $550,000
Each in-scope country
Non-directional airport codes
Trimmed from fare basis code.NOT Cabin class
Half a round trip, regardless of connections

Fare Mix, Discounts and NESR, aka WAD(Net Effective Savings Rate, aka Weighted Avg. Discount)
• Fare mix is key to calculating savings
• Historic fare mix determines the spend-weighted Net Effective Savings Rate
Booked Fare Class
Share of Spend X
Contract Discount =
Net Effective Savings Rate
J 10% 30% 3.0%Y 20% 20% 4.0%M 40% 15% 6.0%T 30% 0% 0.0%
13.0%Net Effective Savings Rate = 100%
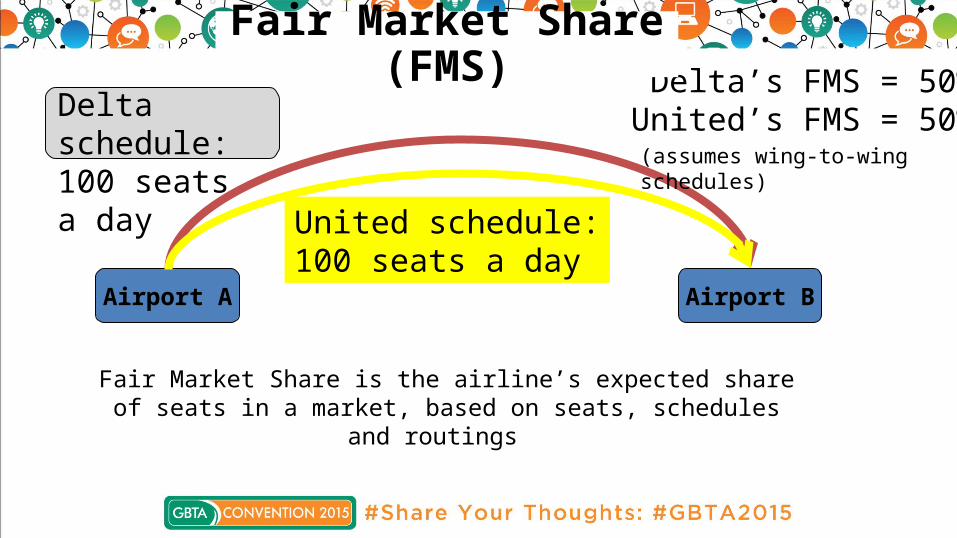
Fair Market Share is the airline’s expected share of seats in a market, based on seats, schedules and routings
Airport A Airport B
Delta schedule:100 seats a day
United schedule:100 seats a day
Delta’s FMS = 50%United’s FMS = 50%
(assumes wing-to-wing schedules)
Fair Market Share (FMS)

Airport A Airport B
Delta’s FMS = 40%United’s FMS = 40%
Southwest = 20%
Connecting Airport
Southwest:100 seats a day
Less weight for connections, and for longer connections
United schedule:100 seats a day
Delta schedule:100 seats a day
Fair Market Share (FMS)

Getting FMS: Inputs are City Pairs and their spend
Fair Market Share (FMS,
aka QSI) Calculator
Beware – many versions of “Fair” - include or ignore extra connections? - JV/Alliance/Interline, or not? - Define “good” connection?
City Pair Ticketed Spend
LHRORD $52,305CDGJFK $47,629LAXMSP $41,056MCOPHX $36,954ATLDFW $26,740

Getting FMS: Inputs are City Pairs and their spend
City Pair Ticketed Spend
LHRORD $52,305CDGJFK $47,629LAXMSP $41,056MCOPHX $36,954ATLDFW $26,740
Fair Market Share (FMS, aka QSI) Calculator
Carrier FMS %
Delta 56%
United 21%
Sun Country 10%
American 7%
Southwest 6%

39
City Pair Spend = $100kCoverage = 70% or $70K
AA FMS
40%
UA FMS
30%
FMS Coverage and Overlap
FMS: Fair Market Share

40
AA FMS
40%
UA FMS
30%
City Pair Spend = $100k Overlap = 60% or $60K
FMS Coverage and Overlap

41
Most Buyers Want High Coverage And Low To Moderate Overlap
Carriers Coverage OverlapAA,UA 70% 30%AA,DL 68% 5%
AA,WN 65% 15%DL, UA 58% 26%DL,WN 42% 14%
WN, UA 42% 10%
42
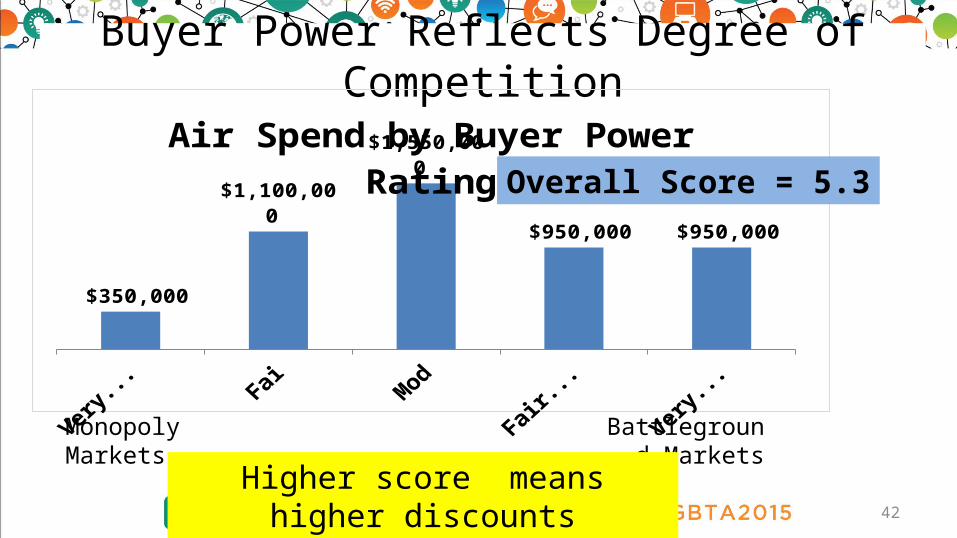
Buyer Power Reflects Degree of Competition
Very Weak (1) Fairly Weak Moderate (5) Fairly Strong Very Strong (9)
$350,000
$1,100,000
$1,550,000
$950,000 $950,000
Air Spend by Buyer Power Rating
Monopoly Markets
Battleground Markets
Overall Score = 5.3
Higher score means higher discounts

43
The Reality of Airline Discounts

What Really Drives Discounts?
Two Key Factors:1. Movement: Ability to
move share
2. Margin: Profit contribution
Essential for figuring out how much to pay for revenue

Discount Drivers: Why Volume Doesn’t Matter
Supplier’s Revenue from an Account
Minimum Maximum
$500K Gross
$400K
Profit ContributionCost to Serve
$800K
$200K
$1,000K Gross
$100K Worst Case
Source: Gillespie’s Guide to Travel+Procurement
Best Case

What’s the Maximum Discount?
$800K
$100K
Supplier’s Revenue from an Account
Minimum Maximum
$500K Gross
$400K
$1,000K Gross
Worst Case
$100K Worst Case,NOT Negotiable
$100K Negotiable
= 10%
Maximum Discount
$100K Negotiable
$1,000K Gross
Source: Gillespie’s Guide to Travel+Procurement
Profit ContributionCost to Serve
$200K

47
The Power of Scenarios
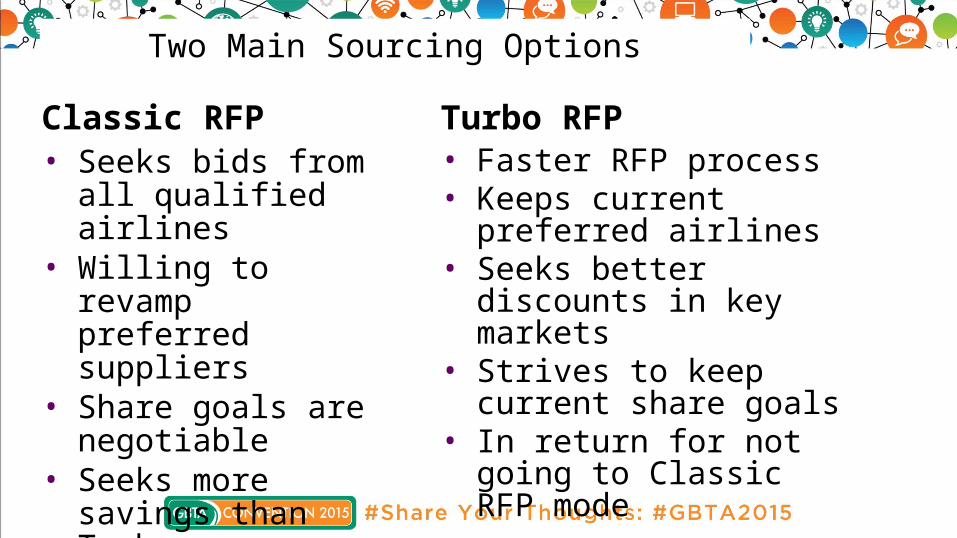
Two Main Sourcing Options
Turbo RFP• Faster RFP process• Keeps current preferred
airlines• Seeks better discounts in
key markets• Strives to keep current
share goals• In return for not going to
Classic RFP mode
Classic RFP• Seeks bids from all
qualified airlines• Willing to revamp
preferred suppliers• Share goals are
negotiable• Seeks more savings
than Turbo

Why Use Scenarios?
• Scenarios are built to test specific sourcing strategies:
• Maximize or minimize a carrier’s spend• Compare alliance deals• Shift toward LCCs• Minimize traveler friction• Maximize savings

Sample Scenario ResultsLast year’s Program Net Spend was $3,000K
Scenario Scenario Total Net Spend($000s)
Scenario Savings ($000s)
DL’s Net Spend ($000s)
1. DL/JV, then Star 2,950 50 700
2. DL/JV+AA, then UA/LH 2,980 20 400
3. Star, then DL/JV+WN 2,910 90 300
4. Avoid DL 2,970 30 200

Scenario ImplicationsScenario Scenario Total
Net Spend($000s)
Scenario Savings ($000s)
DL’s Net Spend ($000s)
1. DL/JV, then Star 2,950 50 700
2. DL/JV+AA, then UA/LH 2,980 20 400
3. Star, then DL/JV+WN 2,910 90 300
4. Avoid DL 2,970 30 200
Buyer prefers: DL/JV prefers:

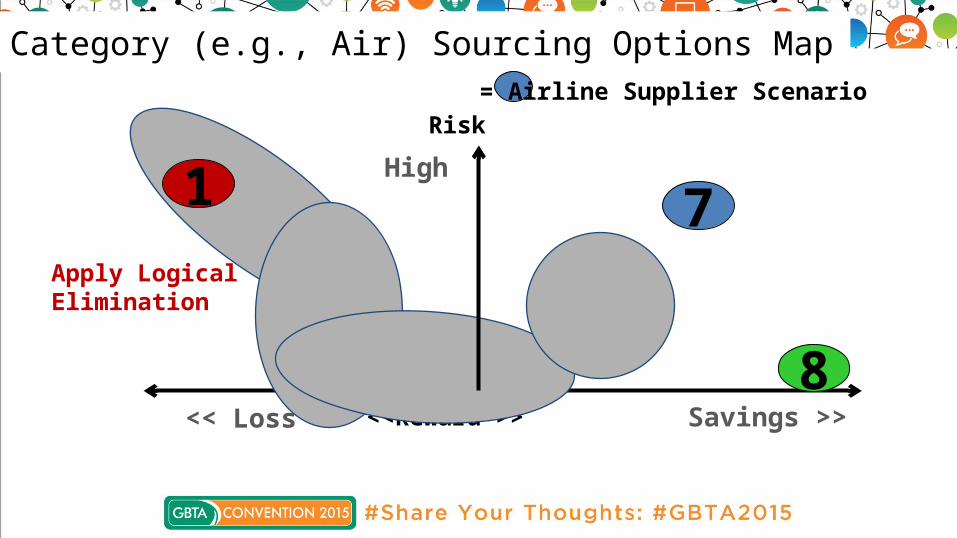
Category (e.g., Air) Sourcing Options Map
<<Reward >><< Loss Savings >>
Risk
High
3 4
56
72
1
8
= Airline Supplier Scenario
<<Reward >><< Loss Savings >>
Risk
High
3 4
56
72
1
8
Apply Logical Elimination
Category (e.g., Air) Sourcing Options Map= Airline Supplier Scenario

Sourcing Options for CEOs
Risk
High
4 6
7“We recommend Option 6, but if you really want 7…”
= Airline Supplier Scenario
<<Reward >><< Loss Savings >>

55
True Travel Spend Optimization
High
Costs
Supplier Cost
The Total Trip Cost Is What Matters
Total Trip Cost
Trip Quality5 Star 1 Star
Human Cost, or Traveler Friction
Optimal
Source: Scott Gillespie

Manage Travel More Strategically
Jan Feb Mar Apr May Jun Jul Aug80%
85%
90%
95%
100%
105%
110%
115%
120%
Trends in Our Total Cost of Air TravelPrice per Hour
Quality Price per Hour
Trip Quality
Road Warrior Attrition Rate
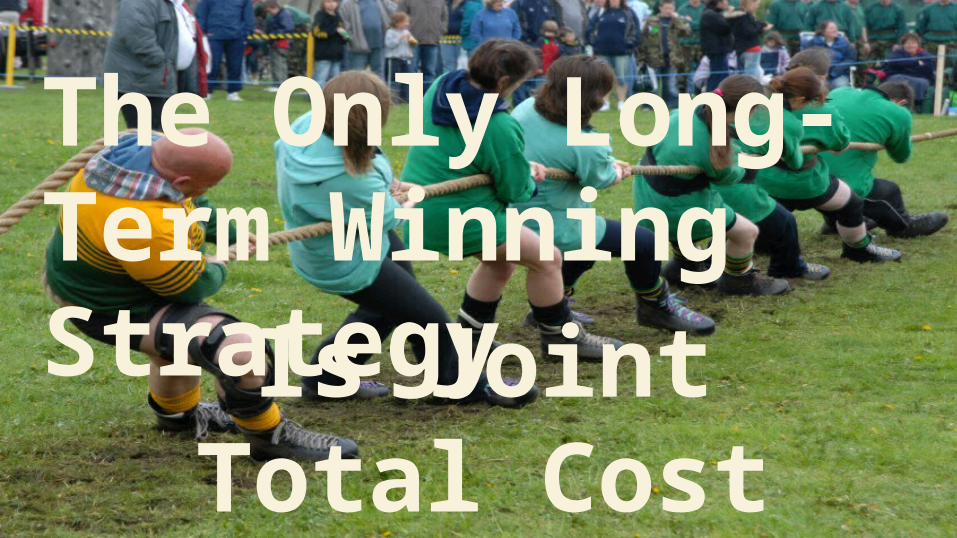
Is Joint Total Cost Reduction
The Only Long-Term Winning Strategy


Thank You for Attending
Don’t forget, we want your feedback!
Please take a moment now to complete a brief evaluation at:
www.gbta.org/2015Survey