advance notice of methodological changes for … letter in accordance with section 1853(b)(2) of the...
TRANSCRIPT

1
February 19, 2016
NOTE TO: Medicare Advantage Organizations, Prescription Drug Plan Sponsors, and
Other Interested Parties
SUBJECT: Advance Notice of Methodological Changes for Calendar Year (CY) 2017 for
Medicare Advantage (MA) Capitation Rates, Part C and Part D Payment Policies and 2017
Call Letter
In accordance with section 1853(b)(2) of the Social Security Act, we are notifying you of
planned changes in the MA capitation rate methodology and risk adjustment methodology
applied under Part C of the Act for CY 2017. Also included with this notice are proposed
changes in the payment methodology for CY 2017 for Part D benefits and annual adjustments for
CY 2017 to the Medicare Part D benefit parameters for the defined standard benefit. For 2017,
CMS will announce the MA capitation rates and final payment policies on Monday, April 4,
2016, in accordance with the timetable established in the Medicare Prescription Drug,
Improvement, and Modernization Act of 2003 (MMA).
Attachment I shows the preliminary estimates of the national per capita MA growth percentage
and the national Medicare fee-for-service growth percentage, which are key factors in
determining the MA capitation rates. Attachment II sets forth changes in the Part C payment
methodology for CY 2017. Attachment III sets forth the changes in payment methodology for
CY 2017 for Part D benefits. Attachment IV presents the annual adjustments for CY 2017 to the
Medicare Part D benefit parameters for the defined standard benefit. Attachment V presents the
preliminary risk adjustment factors.
Attachment VI provides the draft CY 2017 Call Letter for MA organizations; section 1876 cost-
based contractors; prescription drug plan (PDP) sponsors; demonstrations; Programs of All-
Inclusive Care for the Elderly (PACE) organizations; and employer and union-sponsored group
plans, including both employer/union-only group health plans and direct contract plans. The CY
2017 Call Letter contains proposals relating to the quality rating system and information these
plan sponsor organizations will find useful as they prepare their bids for the new contract year.
Finally, CMS would like to note that Title II, § 201 of the Consolidated Appropriations Act of
2016, provides a one-year moratorium for 2017 of the Annual Fee on Health Insurance Providers
that was originally established in Sec. 9010 of the Affordable Care Act. In keeping with current
policy regarding the treatment of this fee in MA and Part D bids, we expect that MA
Organizations and Part D Plan Sponsors will reflect the impact of this moratorium in their 2017
bid submissions. Wherever possible, we would expect MA Organizations to reflect these lower
costs through lower bids, higher rebates and more supplemental benefits for Medicare Advantage
enrollees.

2
Comments or questions may be submitted electronically to the following address:
Comments may be made public, so submitters should not include any confidential or personal
information. In order to receive consideration prior to the April 4, 2016 release of the final
Announcement of Calendar Year 2017 Medicare Advantage Capitation Rates and Medicare
Advantage and Part D Payment Policies, comments must be received by 6:00 PM Eastern
Standard Time on Friday, March 4, 2016.
/ s /
Sean Cavanaugh
Deputy Administrator, Centers for Medicare and Medicaid Services
Director, Center for Medicare
/ s /
Jennifer Wuggazer Lazio, F.S.A., M.A.A.A.
Director
Parts C & D Actuarial Group
Office of the Actuary
Attachments
3
2017 ADVANCE NOTICE
TABLE OF CONTENTS
Attachment I. Preliminary Estimates of the National Per Capita Growth Percentage and the
National Medicare Fee-for-Service Growth Percentage for Calendar Year 2017 . . . . . . 5
Section A. MA Growth Percentage . . . . . . . . . . . . . . . . . . . . . . . . . . . . . . . . . . . . . . . . . 5
Section B. FFS Growth Percentage . . . . . . . . . . . . . . . . . . . . . . . . . . . . . . . . . . . . . . . . . 6
Attachment II. Changes in the Part C Payment Methodology for CY 2017 . . . . . . . . . . . . . . . 9
Section A. MA Benchmark, Quality Bonus Payments and Rebate . . . . . . . . . . . . . . . . . . . 9
Section B. Calculation of Fee for Service Cost . . . . . . . . . . . . . . . . . . . . . . . . . . . . . . . . 16
Section C. IME Phase Out . . . . . . . . . . . . . . . . . . . . . . . . . . . . . . . . . . . . . . . . . . . . . . . 21
Section D. ESRD Rates . . . . . . . . . . . . . . . . . . . . . . . . . . . . . . . . . . . . . . . . . . . . . . . . . 21
Section E. Clinical Trials . . . . . . . . . . . . . . . . . . . . . . . . . . . . . . . . . . . . . . . . . . . . . . . 21
Section F. Location of Network Areas for PFFS Plans in Plan Year 2018 . . . . . . . . . . . . 23
Section G. MA Employer Group Waiver Plans . . . . . . . . . . . . . . . . . . . . . . . . . . . . . . . . 23
Section H. CMS-HCC Risk Adjustment Model for CY 2017 . . . . . . . . . . . . . . . . . . . . . 27
Section I. Medicare Advantage Coding Pattern Adjustment . . . . . . . . . . . . . . . . . . . . . . 42
Section J. Normalization Factors . . . . . . . . . . . . . . . . . . . . . . . . . . . . . . . . . . . . . . . . . . 43
Section K. Frailty Adjustment for PACE organizations and FIDE SNPs . . . . . . . . . . . . . 45
Section L. Medical Loss Ratio Credibility Adjustment . . . . . . . . . . . . . . . . . . . . . . . . . . 46
Section M. Encounter Data as a Diagnosis Source for 2017 . . . . . . . . . . . . . . . . . . . . . . 46
Attachment III. Changes in the Payment Methodology for Medicare Part D for CY 2017. . . . 48
Section A. Update of the RxHCC Model . . . . . . . . . . . . . . . . . . . . . . . . . . . . . . . . . . . . 48
Section B. Encounter Data as a Diagnosis Source for 2017 . . . . . . . . . . . . . . . . . . . . . . . 50
Section C. Part D Risk Sharing . . . . . . . . . . . . . . . . . . . . . . . . . . . . . . . . . . . . . . . . . . . 51
Section D. Medicare Part D Benefit Parameters: Annual Adjustments for Defined
Standard Benefit in 2017 . . . . . . . . . . . . . . . . . . . . . . . . . . . . . . . . . . . . . . . . . . . . 53
Section E. Reduced Coinsurance for Applicable Beneficiaries in the Coverage Gap . . . . . 58
Section F. Dispensing Fees and Vaccine Administration Fees for Applicable Drugs in
the Coverage Gap . . . . . . . . . . . . . . . . . . . . . . . . . . . . . . . . . . . . . . . . . . . . . . . . . 58
Section G. Part D Calendar Year Employer Group Waiver Plans . . . . . . . . . . . . . . . . . . . 59
Attachment IV. Medicare Part D Benefit Parameters for the Defined Standard Benefit:
Annual Adjustments for 2017 . . . . . . . . . . . . . . . . . . . . . . . . . . . . . . . . . . . . . . . . . . 61
Section A. Annual Percentage Increase in Average Expenditures for Part D Drugs per
Eligible Beneficiary (API) . . . . . . . . . . . . . . . . . . . . . . . . . . . . . . . . . . . . . . . . . . . 61
Section B. Annual Percentage Increase in Consumer Price Index (CPI) . . . . . . . . . . . . . . 62
Section C. Calculation Methodology . . . . . . . . . . . . . . . . . . . . . . . . . . . . . . . . . . . . . . . 62
Section D. Retiree Drug Subsidy Amounts . . . . . . . . . . . . . . . . . . . . . . . . . . . . . . . . . . . 65

4
Section E. Estimated Total Covered Part D Spending at Out-of-Pocket Threshold for
Applicable Beneficiaries . . . . . . . . . . . . . . . . . . . . . . . . . . . . . . . . . . . . . . . . . . . . 66
Attachment V. CMS-HCC and RxHCC Risk Adjustment Factors . . . . . . . . . . . . . . . . . . . . . 68
Attachment VI. CY2017 Draft Call Letter . . . . . . . . . . . . . . . . . . . . . . . . . . . . . . . . . . . . . . 88
How to Use This Call Letter . . . . . . . . . . . . . . . . . . . . . . . . . . . . . . . . . . . . . . . . . . . . . . 91
Section I – Parts C and D . . . . . . . . . . . . . . . . . . . . . . . . . . . . . . . . . . . . . . . . . . . . . . . . 92
Section II – Part C . . . . . . . . . . . . . . . . . . . . . . . . . . . . . . . . . . . . . . . . . . . . . . . . . . . . 155
Section III – Part D . . . . . . . . . . . . . . . . . . . . . . . . . . . . . . . . . . . . . . . . . . . . . . . . . . . 178
Section IV – Medicare-Medicaid Plans . . . . . . . . . . . . . . . . . . . . . . . . . . . . . . . . . . . . . 211
Appendix 1 – Contract Year 2017 Guidance for Prescription Drug Plan (PDP) Renewals
and Non-Renewals (Updated) . . . . . . . . . . . . . . . . . . . . . . . . . . . . . . . . . . . . . . . 216
Appendix 2 – Contract Year 2017 Guidance for Prescription Drug Plan (PDP) Renewals
and Non-Renewals Table . . . . . . . . . . . . . . . . . . . . . . . . . . . . . . . . . . . . . . . . . . 220
Appendix 3 – Improvement Measures (Part C & D) . . . . . . . . . . . . . . . . . . . . . . . . . . . 226

5
Attachment I. Preliminary Estimates of the National Per Capita Growth Percentage and
the National Medicare Fee-for-Service Growth Percentage for Calendar Year 2017
The Affordable Care Act, by amendments to section 1853 of the Social Security Act, establishes
a new methodology for calculating each MA county rate as a percentage of Fee for Service (FFS)
spending in each respective county. The Affordable Care Act provides for a transitional period
during which each county rate is calculated as a blend of the pre-Affordable Care Act rate set
under section 1853(k)(1) of the Social Security Act (the “applicable amount”) and the new FFS-
based Affordable Care Act rate set under section 1853(n)(2) of the Social Security Act (the
“specified amount”). For 2017, all counties will be fully transitioned to the new rate
methodology. Section 1853(n)(4) of the Social Security Act requires that the benchmark (which
is increased by quality bonus payment percentages where applicable) be capped at the level of
the 1853(k)(1) applicable amount.
For 2017, the MA county rates are now based on the specified amount (100 percent of the 2017
FFS rate, estimated as described herein). As required under section 1853(n)(4) of the Act, the
benchmark is capped at the level of the 1853(k)(1) applicable amount. The 2017 FFS rate is
calculated, in part, using the FFS growth percentage. CMS intends to rebase the county FFS rates
for 2017 as part of the calculation of the rates for 2017.
Throughout this document, the Social Security Act will be referred to as “the Act.”
Section A. MA Growth Percentage
The current estimate of the change in the national per capita MA growth percentage for aged and
disabled enrollees combined in CY 2017 is 2.92 percent. This estimate reflects an underlying
trend change for CY 2017 in per capita cost of 2.68 percent and, as required under section
1853(c)(6)(C) of the Act, adjustments to the estimates for prior years as indicated in the table
below.
Table I-1 below summarizes the estimates for the change in the national per capita MA growth
percentage for aged/disabled beneficiaries.
Table I-1. Increase in the National Per Capita MA Growth Percentages for 2017
Prior Increases Current Increases NPCMAGP for 2017
With §1853(c)(6)(C)
adjustment1 2003 to 2016 2003 to 2016 2016 to 2017 2003 to 2017
Aged+Disabled 50.20% 50.56% 2.68% 54.58% 2.92%
1Current increases for 2003-2017 divided by the prior increases for 2003-2016

6
Section B. FFS Growth Percentage
Section 1853(n)(2) of the Act, as amended by the Affordable Care Act, requires that the
specified amount for a county be calculated as a percentage of the county FFS costs. Table I-2
below provides the current estimate of the change in the Aged/Disabled FFS United States per
capita cost (USPCC), which will be used for the county FFS rate. The percentage change in the
FFS USPCC is shown as the current projected FFS USPCC for 2017 divided by the prior
projected FFS USPCC for 2016.
Table I-2 also shows the change in the FFS USPCC for dialysis-only ESRD. Statewide dialysis-
only ESRD rates are determined by applying a historical average geographic adjustment to a
projected FFS dialysis-only ESRD USPCC. We will use a 5-year average of State data to
determine the average geographic adjustment, similar to the method used to determine the
geographic adjustments for non-ESRD rates.
Table I-2 - Increase in the USPCC Growth Percentage for CY 2017
Total USPCC – Non-ESRD FFS USPCC – Non-ESRD Dialysis-only ESRD
USPCC Current projected 2017 USPCC $840.69 $824.73 $6,983.84
Prior projected 2016 USPCC $816.83 $800.21 $7,155.20
Percent increase 2.92% 3.06% −2.39%
Table I-3 compares last year’s estimate of the total non-ESRD USPCC with current estimates for
2003 to 2019, and Table I-4 compares last year’s FFS non-ESRD USPCC estimates with current
estimates. The total USPCCs are the basis for the National Per Capita MA Growth Percentages.
In addition, these tables show the current projections of the USPCCs through 2019. Caution
should be employed in the use of this information. It is based upon nationwide averages, and
local conditions can differ substantially from conditions nationwide. None of the data presented
here pertain to the Medicare prescription drug benefit.

7
Table I-3 - Comparison of Current & Previous Estimates of the Total USPCC – Non-ESRD
Part A Part B Part A & Part B
Calendar
Year
Current
Estimate
Last
Year’s
Estimate
Current
Estimate
Last
Year’s
Estimate
Current
Estimate
Last
Year’s
Estimate
Ratio
2003 $296.18 $296.18 $247.66 $247.64 $543.84 $543.82 1.000
2004 $314.08 $314.08 $271.06 $271.03 $585.14 $585.11 1.000
2005 $334.83 $334.83 $292.86 $292.83 $627.69 $627.66 1.000
2006 $345.30 $345.30 $313.70 $313.67 $659.00 $658.97 1.000
2007 $355.44 $355.47 $330.68 $330.65 $686.12 $686.12 1.000
2008 $371.90 $371.93 $351.04 $351.01 $722.94 $722.94 1.000
2009 $383.93 $383.89 $367.95 $367.92 $751.88 $751.81 1.000
2010 $382.99 $385.42 $376.82 $376.84 $759.81 $762.26 0.997
2011 $389.78 $389.75 $386.30 $386.33 $776.08 $776.08 1.000
2012 $379.27 $379.07 $392.89 $392.90 $772.16 $771.97 1.000
2013 $381.31 $381.24 $399.71 $400.31 $781.02 $781.55 0.999
2014 $371.88 $371.91 $418.26 $419.91 $790.14 $791.82 0.998
2015 $372.27 $369.18 $430.39 $430.51 $802.66 $799.69 1.004
2016 $377.08 $375.14 $441.70 $441.69 $818.78 $816.83 1.002
2017 $384.26 $386.12 $456.43 $460.23 $840.69 $846.35 0.993
2018 $392.68 $405.23 $467.97 $484.64 $860.65 $889.87 0.967
2019 $402.45 $493.14 $895.59
Table I-4 - Comparison of Current & Previous Estimates of the FFS USPCC – Non-ESRD
Part A Part B Part A & Part B
Calendar
Year
Current
Estimate
Last
Year’s
Estimate
Current
Estimate
Last
Year’s
Estimate
Current
Estimate
Last
Year’s
Estimate
Ratio
2010 $369.90 $373.09 $374.91 $374.89 $744.81 $747.98 0.996
2011 $373.81 $373.73 $384.47 $384.47 $758.28 $758.20 1.000
2012 $359.57 $359.23 $392.07 $392.02 $751.64 $751.25 1.001
2013 $365.58 $365.16 $395.98 $396.51 $761.56 $761.67 1.000
2014 $365.88 $364.88 $408.37 $409.90 $774.25 $774.78 0.999
2015 $368.49 $362.92 $423.11 $422.05 $791.60 $784.97 1.008
2016 $370.96 $368.54 $430.57 $431.67 $801.53 $800.21 1.002
2017 $377.29 $380.46 $447.44 $451.24 $824.73 $831.70 0.992
2018 $385.22 $398.27 $458.41 473.81 $843.63 $872.08 0.967
2019 $394.43 $482.65 $877.08
These estimates are preliminary and could change when the final rates are announced on April 4,
2016 in the Announcement of CY 2017 Medicare Advantage Capitation Rates and Medicare
Advantage and Part D Payment Policies. Further details on the derivation of the national per
8
capita MA growth percentage and the fee-for-service growth percentage will also be presented in
the April 4, 2016 Announcement.

9
Attachment II. Changes in the Part C Payment Methodology for CY 2017
Section A. MA Benchmark, Quality Bonus Payments and Rebate
As noted in Attachment I, the Affordable Care Act (ACA) amends section 1853 of the Act to
establish a new methodology for calculating each MA county rate as a percentage of FFS
spending in each county. The Affordable Care Act provides for a transitional period during
which each county rate is calculated as a blend of the pre-Affordable Care Act rate set under
section 1853(k)(1) of the Social Security Act (the “applicable amount”) and the new FFS-based
Affordable Care Act rate set under section 1853(n)(2) of the Social Security Act (the “specified
amount”). (Please note that throughout this document, the terms “benchmark” and ”county rate”
are used interchangeably, and the term “service area benchmark” indicates the bidding target for
a plan.)
Section 1853(c)(1)(D)(ii) of the Act requires CMS to rebase the county FFS rates, which form
the basis of the specified amount, periodically but not less than once every three years. When
the rates are rebased, CMS updates its estimate of each county’s FFS costs using more current
FFS claims information. CMS intends to rebase the county FFS rates for 2017.
The Program for All Inclusive Care for the Elderly (PACE) is exempt from the MA blended
benchmark provisions, per section 1853(n)(5) of the Act.
A1. Applicable Amount
The applicable amount is the pre-Affordable Care Act rate established under section 1853(k)(1)
of the Act. As CMS will rebase the rates in 2017, the applicable amount for 2017 is the greater
of: (1) the county’s 2017 FFS rate or (2) the 2016 applicable amount increased by the CY 2017
National Per Capita Medicare Advantage Growth Percentage. Note that, for 2017, the MA
county rates are now fully transitioned to the specified amount. However, as discussed in
Section A7, Section 1853(n)(4) of the Act requires that the benchmark for each county must be
capped at the county’s applicable amount.
A2. Specified Amount
The specified amount is based upon the following formula:
(2017 FFS rate minus IME phase-out amount) × (applicable percentage + applicable percentage
quality increase)
Where:
IME phase-out amount is the indirect costs of medical education phase-out amount as
specified at section 1853(k)(4);

10
Applicable percentage is a statutory percentage applied to the county’s base payment
amount, as described at section 1853(n)(2)(B); and
Applicable percentage quality increase, referred to in this document as the quality bonus
payment (QBP) percentage, is a percentage point increase to the applicable percentage
for a county in a qualifying plan’s service area.
Section 1853(n)(2)(C) of the Act requires CMS to determine applicable percentages for a year
based on county FFS rate rankings for the most recent year that was a rebasing year. To
determine the CY 2017 applicable percentages for counties in the 50 States and the District of
Columbia, CMS will rank counties from highest to lowest based upon their 2016 average per
capita FFS costs, because 2016 is the most recent FFS rate rebasing year prior to 2017. CMS
will then place the rates into four quartiles. For the territories, CMS will assign an applicable
percentage to each county based on where the county rate falls in the quartiles established for the
50 States and the District of Columbia. CMS is publishing the 2017 applicable percentages by
county with the Advance Notice at https://www.cms.gov/Medicare/Health-Plans/
MedicareAdvtgSpecRateStats/Ratebooks-and-Supporting-Data.html. Each county’s applicable
percentage is assigned based upon its quartile ranking, as follows:
Table II-1. FFS Quartile Assignment Rules
under the Affordable Care Act
Quartile
Applicable
Percentage
4th (highest) 95%
3rd 100%
2nd 107.5%
1st (lowest) 115%
Section 1853(n)(2)(D) of the Act provides that, beginning in 2013, if there is a change in a
county’s quartile ranking for a payment year compared to the county’s ranking in the previous
year, the applicable percentage for the area for the year shall be the average of: (1) the applicable
percentage for the previous year and (2) the applicable percentage for the current year. For both
years, CMS will calculate the applicable percentage that would otherwise apply for the area for
the year in the absence of this transitional provision. For example, if a county’s ranking changed
from the second quartile to the third quartile, the applicable percentage would be 103.75 percent
for the year of the change – the average of 107.5 percent and 100 percent.

11
A3. Quality Bonus Payment Percentage
The Affordable Care Act provides for CMS to make quality bonus payments to MA
organizations that meet quality standards measured under a five-star quality rating system.1 In
this document, we refer to this quality bonus as the quality bonus payment (QBP) percentage
instead of using the statutory term applicable percentage quality increase. The QBP percentage
is a percentage point increase to the applicable percentage for each county in a qualifying plan’s
service area, before multiplying the percentage by the FFS rate for the year to determine the
specified amount.
Table II-2 shows the QBP percentage for each Star Rating for 2017 payments. For CY 2017
payments, plans with fewer than 4 stars will not receive a QBP percentage increase to the county
rates, and plans with 4 or more stars will receive a QBP percentage increase to the county rates,
as set forth in sections 1853(n) and 1853(o) of the Act. See Section A8 for rebate percentages
for CY 2017.
Table II-2 Percentage Add-on to Applicable Percentage
for Quality Bonus Payments
Star Rating 2017 QBP Percentage*
Fewer than 3 stars 0%
3 stars 0%
3.5 stars 0%
4 stars 5%
4.5 stars 5%
5 stars 5%
*The QBP percentage is a percentage point increase to the
applicable percentage for a county in a qualifying plan’s service area.
An MA plan’s Star Rating is the rating assigned to its contract. MA plans with a Star Rating of 4
or more stars will bid against their service area benchmarks that include the 5 percentage point
QBP add-on to the applicable percentage for the benchmark in each county in the service area.
For 2017, MA plans with a Star Rating of fewer than 4 stars will bid against service area
benchmarks that do not include QBP add-ons to the county rates, with the exceptions of new MA
plans and low enrollment plans. As discussed below, all benchmarks are capped at the section
1853(k)(1) amount – that is, what the benchmark would have been under the pre-ACA rules, as
per section 1853(n)(4) of the Act.
1 Star Ratings are determined at the contract level; the contract rating is applied to each plan under that contract.

12
New MA Plans
The method for determining the QBP percentage for a new MA plan is different from the method
described above. Per section 1853(o)(3)(A)(iii)(II) of the Act, for the purpose of determining a
QBP percentage, the term “new MA plan” refers to an MA plan offered by a parent organization
that has not had another MA contract in the preceding three-year-period. New MA plans are
treated as qualifying plans that are eligible to receive a QBP percentage increase to the county
rates, except that the QBP percentage will be 3.5 percentage points, per section
1853(o)(3)(A)(iii)(I)(cc) of the Act. That is, new MA plans will bid against a service area
benchmark that reflects a 3.5 percentage point increase to the applicable percentage used to set
the benchmark for each county in the plan’s service area. As discussed below, all rates are
capped at the section 1853(k)(1) amount – that is, what the benchmark would have been under
the pre-ACA rules, as per section 1853(n)(4) of the Act.
Note that for a parent organization that has had a contract with CMS in the preceding three-year-
period, any new MA contract under that parent organization will receive an enrollment-weighted
average of the Star Ratings earned by the parent organization’s existing MA contracts. Such
plans may qualify for a QBP increase based on the enrollment-weighted average rating of the
parent organization. CMS finalized this policy in the 2012 Announcement (page 2), found on the
CMS website at https://www.cms.gov/Medicare/Health-Plans/MedicareAdvtgSpecRateStats/
Announcements-and-Documents.html, and will continue to apply it for 2017.
The Medicare Access and CHIP Reauthorization Act of 2015 (MACRA) contained provisions to
permit reasonable cost reimbursement contracts to transition into MA plans by CY 2019, and
allowed Medicare Advantage Organizations (MAOs) to deem the enrollment of their cost
enrollees into successor affiliated MA plans that meet specific conditions. MACRA amended
Section 1853(o)(4) of the Social Security Act such that, for the first three years as a converted
MA plan receiving deemed enrollment, the converted plan shall not be treated as a new MA plan
as defined in Section 1853(o)(3)(A)(iii)(II).
Low Enrollment Plans
Section 1853(o)(3)(A)(ii)(II) of the Act, as implemented at § 422.258(d)(7)(iv)(B),2 provides that
for 2013 and subsequent years, CMS shall develop a method for determining whether an MA
plan with low enrollment is a qualifying plan for purposes of receiving an increase in payment
under section 1853(o). We apply this determination at the contract level, and thus determine
whether a contract (meaning all plans under that contract) is a qualifying contract. Pursuant to §
422.252, a low enrollment contract is one that could not undertake Healthcare Effectiveness Data
and Information Set (HEDIS) and Health Outcome Survey (HOS) data collections because of a
2 All regulatory cites are to Title 42 of the Code of Federal Regulations unless otherwise noted.

13
lack of a sufficient number of enrollees to reliably measure the performance of the health plan.
For additional information regarding low enrollment contracts, please refer to the Call Letter.
Section 1853(o)(3)(A)(ii) of the Act does not address the amount of the increase for low
enrollment contracts. As in 2016, for 2017 payments, we propose that low enrollment contracts
be included as qualifying contracts that receive the QBP percentage of 3.5 percentage points,
similar to the QBP percentage increase applied to new MA plans. We interpret section
1853(o)(3) of the Act as establishing two types of qualifying plans for purposes of applying the
QBP, with the amount of the QBP determined by the basis for treatment of the plan as a
qualifying plan (i.e., whether the amount is based on the score produced under the Star Rating
system or based on the default increase specified in the case of new MA plans). Because the
rationale for treating new MA plans as qualifying plans is the same as doing so in the case of low
enrollment plans (i.e., there is no reliable data on which to assign a star value), we believe that
new MA plans and low enrollment MA plans should receive the same treatment for the purpose
of establishing the amount of quality bonus payments. Further, this is consistent with our
treatment of low enrollment contracts for purposes of determining the rebate available to the
plan.
A4. Qualifying County Bonus Payment
Beginning with payment year 2012, section 1853(o)(2) of the Act extends a double QBP
percentage to a qualifying plan located in a “qualifying county.” Section 1853(o)(3)(B) of the
Act defines a qualifying county as a county that meets the following three criteria:
(1) has an MA capitation rate that, in 2004, was based on the amount specified in section
1853(c)(1)(B) for a Metropolitan Statistical Area with a population of more than 250,000;
(2) as of December 2009, had at least 25 percent of MA-eligible beneficiaries residing in
the county enrolled in a MA plan; and
(3) has per capita FFS county spending for 2017 that is less than the national monthly per
capita cost for FFS for 2017.
For example, a qualifying plan with a rating of 4.5 stars will have 5 QBP percentage points
added to the applicable percentage of each county in its service area. For a qualifying county in
that plan’s service area, an additional 5 percentage points would be added to that county’s
applicable percentage for a total increase of 10 percentage points used to calculate the
benchmark. If this qualifying county otherwise has an applicable percentage of 95 percent, this
is increased to 105 percent to reflect the quality bonus payment percentage for that county. As
discussed below, all benchmarks are capped at the section 1853(k)(1) amount – that is, what the
benchmark would have been under the pre-ACA rules, as per section 1853(n)(4) of the Act.

14
CMS will publish a complete list of qualifying counties in the final 2017 Announcement. The
listing will contain all counties that meet all three criteria stated above. Two of the three
elements for determining a qualifying county (2004 urban floors (Y/N) for each county) and
2009 Medicare Advantage penetration rates can be found in the 2016 Rate Calculation Data file
(columns Y and Z) on the CMS website at https://www.cms.gov/Medicare/Health-Plans/
MedicareAdvtgSpecRateStats/Ratebooks-and-Supporting-Data.html. The 2017 FFS rates, which
are necessary for the third criterion, are not available at the time this Advance Notice is
published. The FFS rates and the national average FFS spending amount will be published in the
final 2017 Announcement.
A5. Affordable Care Act County Rates Transitional Phase-In
The blend of the specified amount and applicable amount used to set the county benchmarks, as
discussed above, was phased in on a transitional basis. This transition began in 2012 and will be
complete in 2017. For 2012, each county was assigned to one of three transition periods – two,
four, or six years. CMS determined a county’s specific transition period by calculating the
difference between the county’s projected 2010 benchmark amount and 2010 applicable amount.
The county transition period assignment is based on the size of the difference between these two
amounts, with six year counties having the largest differential (at least $50). The projected 2010
benchmark amount was a one-time-only calculation, which has been employed solely for the
purpose of assigning each county its appropriate transition period, in accordance with the
Affordable Care Act.
The transition period for each county (2, 4, or 6 years) was published with the 2012 Advance
Notice and can be found on the CMS website at https://www.cms.gov/Medicare/Health-Plans/
MedicareAdvtgSpecRateStats/Announcements-and-Documents.html.
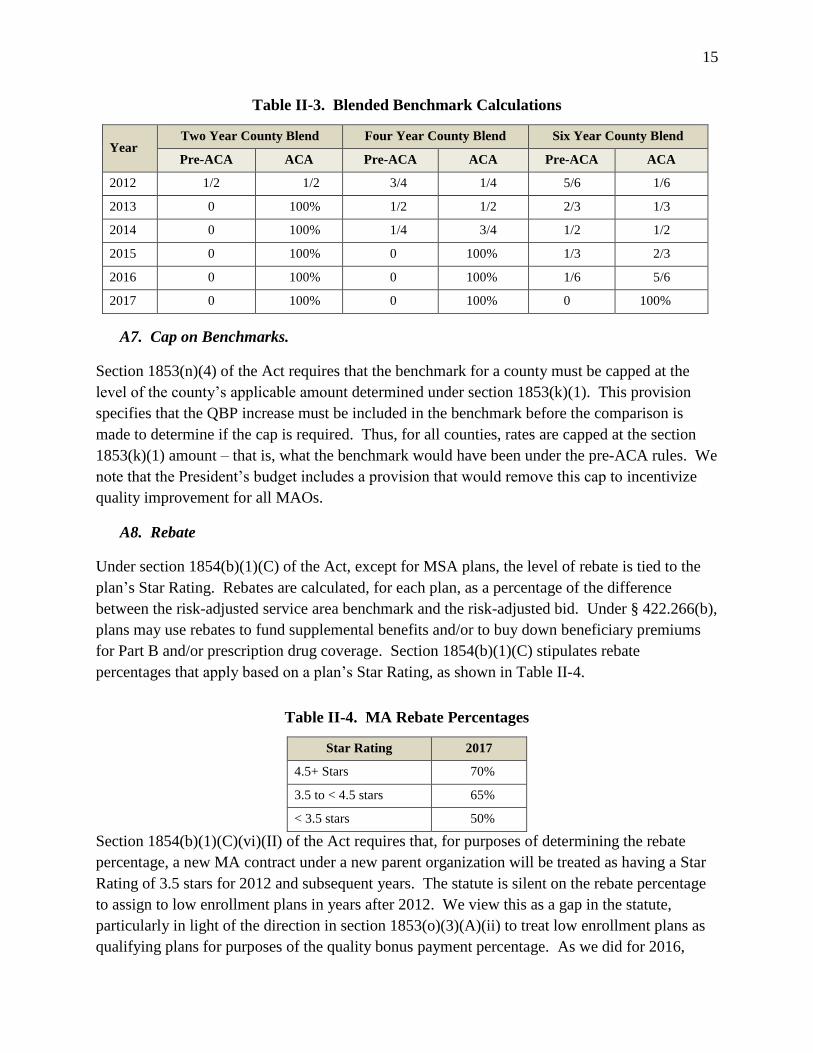
A6. Blended Benchmark Calculations.
Section 1853(n)(1) and (3) of the Act sets forth the rules for calculating the blended benchmark,
depending on the assigned transition period.
15
Table II-3. Blended Benchmark Calculations
Year Two Year County Blend Four Year County Blend Six Year County Blend
Pre-ACA ACA Pre-ACA ACA Pre-ACA ACA
2012 1/2 1/2 3/4 1/4 5/6 1/6
2013 0 100% 1/2 1/2 2/3 1/3
2014 0 100% 1/4 3/4 1/2 1/2
2015 0 100% 0 100% 1/3 2/3
2016 0 100% 0 100% 1/6 5/6
2017 0 100% 0 100% 0 100%
A7. Cap on Benchmarks.
Section 1853(n)(4) of the Act requires that the benchmark for a county must be capped at the
level of the county’s applicable amount determined under section 1853(k)(1). This provision
specifies that the QBP increase must be included in the benchmark before the comparison is
made to determine if the cap is required. Thus, for all counties, rates are capped at the section
1853(k)(1) amount – that is, what the benchmark would have been under the pre-ACA rules. We
note that the President’s budget includes a provision that would remove this cap to incentivize
quality improvement for all MAOs.
A8. Rebate
Under section 1854(b)(1)(C) of the Act, except for MSA plans, the level of rebate is tied to the
plan’s Star Rating. Rebates are calculated, for each plan, as a percentage of the difference
between the risk-adjusted service area benchmark and the risk-adjusted bid. Under § 422.266(b),
plans may use rebates to fund supplemental benefits and/or to buy down beneficiary premiums
for Part B and/or prescription drug coverage. Section 1854(b)(1)(C) stipulates rebate
percentages that apply based on a plan’s Star Rating, as shown in Table II-4.
Table II-4. MA Rebate Percentages
Star Rating 2017
4.5+ Stars 70%
3.5 to < 4.5 stars 65%
< 3.5 stars 50%
Section 1854(b)(1)(C)(vi)(II) of the Act requires that, for purposes of determining the rebate
percentage, a new MA contract under a new parent organization will be treated as having a Star
Rating of 3.5 stars for 2012 and subsequent years. The statute is silent on the rebate percentage
to assign to low enrollment plans in years after 2012. We view this as a gap in the statute,
particularly in light of the direction in section 1853(o)(3)(A)(ii) to treat low enrollment plans as
qualifying plans for purposes of the quality bonus payment percentage. As we did for 2016,

16
CMS is proposing to treat low enrollment plans as having a Star Rating of 3.5 stars for purposes
of determining the rebate percentage for 2017.
As mentioned above, MACRA amended Section 1853(o)(4) of the Act such that, for the first
three years as a converted MA plan receiving deemed enrollment, the converted plan shall not be
treated as a new MA plan.
Section B. Calculation of Fee for Service Cost
The FFS cost for each county is a product of (1) the national FFS cost, or United States per-
capita cost (USPCC), and (2) a county-level geographic index called the average geographic
adjustment (AGA).
In the 2016 Announcement, we announced updates and refinements to the AGA calculation
methodology to reflect changes in FFS payment rules. Historical claims data were repriced to
reflect the most current wage and cost indices. CMS re-priced hospital inpatient, hospital
outpatient, skilled nursing facility, and home health claims to reflect the most current wage
indices, and re-tabulated physician claims with the most current Geographic Practice Cost Index.
Also in 2016, we repriced historical claims to account for the changes made by the ACA to
payments to disproportionate share hospitals. We also repriced durable medical equipment
claims to account for the change in prices associated with the competitive bidding program.
For 2017, we are proposing to update the claims data used to calculate the AGAs, and to
continue the repricing of historical data in the AGA calculation. Repricing historical claims, in
conjunction with rebasing rates for 2017, ensures that the 2017 FFS county rates reflect the most
current FFS fee schedules and payment rules. We are also proposing a change to the tabulation
of county-level risk scores, which are used to standardize the AGAs for the risk profile of the
population.
B1. AGA Methodology for 2017
In the first step, CMS is proposing to add the 2014 cost and enrollment data, and drop the 2009
cost and enrollment data, to the historical claims experience used to develop new geographic cost
indices for each county. As a result, the five year rolling average will be based on claims data
from 2010 – 2014.
In the second step, CMS will exclude hospice expenditures and FFS claims paid on behalf of
cost plan enrollees from the 2014 claims. Comparable adjustments were previously made to 2010
– 2013 claims data.
For Puerto Rico, CMS will continue to only include claims and enrollment for beneficiaries with
Part A eligibility and Part B enrollment for all five years (2010 – 2014). While most Medicare
beneficiaries are automatically enrolled in Part B and must opt out to decline it, beneficiaries in

17
Puerto Rico must take affirmative action to opt-in to Part B coverage. CMS believes it is
appropriate to adjust the FFS rate calculation in Puerto Rico used to determine MA rates so that
it is based on beneficiaries who are enrolled in both Part A and Part B in order to produce a more
accurate projection of FFS costs per capita in Puerto Rico.
Some stakeholders have suggested that there is insufficient FFS data in Puerto Rico to set
accurate MA benchmarks in the Commonwealth and, therefore, CMS should instead use a proxy
to set benchmarks for counties in the Commonwealth. These stakeholders have recommended
that an appropriate proxy would be the state with the next lowest benchmarks.
CMS is not proposing to use a proxy to set Puerto Rico benchmarks for several reasons. First,
after investigating this issue extensively over the past 12 months, we believe that the FFS data in
Puerto Rico are sufficient for establishing accurate MA benchmarks. We have not been able to
validate any of the criticisms of the current rates identified by these stakeholders. Moreover, we
note that even if CMS concurred that the FFS data from Puerto Rico were insufficient for
establishing accurate MA benchmarks, we cannot arbitrarily choose benchmarks from another
jurisdiction as a proxy for Puerto Rico. The law requires that Medicare Advantage benchmarks
be based on a county’s average Medicare Fee-for-Service per-capita cost. There is no evidence
that fee-for-service costs in Puerto Rico are higher than the costs observed in the FFS claims
data, and thus no basis for overhauling Puerto’s Rico’s Medicare Advantage benchmarks. We
believe the law requires us to use data that best approximate the actual FFS costs in Puerto Rico.
We have seen no evidence to suggest that FFS costs in another jurisdiction are a reliable proxy
for FFS in Puerto Rico. We believe that the benchmarks in Puerto Rico are reasonable as
currently calculated.
One of the criticisms of the FFS data used to establish MA benchmarks in Puerto Rico is the fact
that a larger proportion of FFS beneficiaries in Puerto Rico have zero claims than is found in
other parts of the United States. Stakeholders have suggested this will unfairly bias the MA
benchmarks. We appreciate this input and are exploring it further. We are concerned that in
Puerto Rico there is a disproportionate percentage of beneficiaries who enroll in MA compared
with the rest of the nation, which may be causing the FFS claims experience in Puerto Rico not
to be representative of the FFS costs that MA beneficiaries in Puerto Rico would accrue if they
were enrolled in FFS. For example, we are exploring the possibility of adjusting the FFS
experience in Puerto Rico to reflect the propensity of zero claimants nationwide. We will review
the data and comments and determine in the final Rate Announcement any actuarially
supportable adjustment that may be necessary. We are seeking comment on this or alternative
methodologies. We welcome public input on the magnitude of this effect and suggestions as to
corrective actions that could be taken, if appropriate.
In the third step, CMS will re-price the historical inpatient, hospital outpatient, skilled nursing
facility, and home health claims from 2010 – 2014 to reflect the most current (i.e., FY 2016)
wage indices, and re-tabulate physician claims with the most current (i.e., CY 2016) Geographic

18
Practice Cost Index. For 2017, CMS will also continue to adjust historical FFS claims to account
for section 3133 of the ACA, which replaced 75 percent of hospital Medicare Disproportionate
Share Hospital (DSH) Payments with uncompensated care payments (UCP) beginning on
October 1, 2013. Consistent with the methodology implemented for 2016, CMS would adjust
claims for fiscal year (FY) 2010 through FY 2013 for each DSH hospital to reflect the reduction
in DSH payments and the allocation of the UCP by incorporating the corresponding
requirements of the final FY 2016 Inpatient Prospective Payment System (IPPS) rule. Similarly,
we are proposing to adjust the UCP represented in the FY 2014 and 1st quarter FY 2015 claims to
reflect the requirements of the final FY 2016 IPPS rule. For 2017, repricing will reflect the
Consolidated Appropriations Act, 2016 (P.L. 114-113, section 601), which amended Section
1886(d)(9)(E) of the Social Security Act (42 U.S.C. 1395ww(d)(9)(E)) to increase the Medicare
inpatient rates for hospitals in Puerto Rico.
Also for 2017, we will continue re-pricing Durable Medical Equipment (DME) claims from 2010
– 2014 to reflect the most current DME prices associated with the Competitive Bidding
Program (CBP), and will continue using the Round 1 and Round 2 prices in making these
adjustments. Section 1847(b)(5) of the Social Security Act requires that “single payment
amounts” replace the current Medicare DMEPOS fee schedule amounts for selected DMEPOS
items in specific competitive bidding areas (CBAs). Included in Round 2, 8 HCPC codes for
diabetic supplies were expanded beyond CBAs to be part of a National Mail Order (NMO)
program. In addition to previous re-pricing of historical FFS claims for CBP adjustments, we are
proposing to also include in the single payment amounts for NMO DMEPOS items to re-price
the historical payments for DME claims. Starting January 1, 2016, the ACA generally mandates
adjustments to the fee schedule amounts in non CBAs based on CBP payment information. The
adjusted fee schedule amounts were developed using the average of SPAs from CBPs to be
applied in eight different regions and separated by rural and non-rural areas. For the first 6
months the payments will be phased in based on 50% of the unadjusted fee schedule amount and
50 percent of the adjusted fee schedule amount. Beginning on July 1, 2016, the fully adjusted
fees will apply. We are proposing to use the fully adjusted fees to adjust the FFS claims to
reflect the payments that will be in place for 2017.
We are proposing to make an additional adjustment to the 2012, 2013, and 2014 claims to
account for shared savings payments and shared losses made to Medicare Shared Savings
Program (MSSP) ACOs and Pioneer ACOs. The key aspects of these adjustments are:
Allocate ACO shared savings or shared loss amounts geographically, as applicable based
on each ACO’s unique experience, according to the distribution of counties in which each
ACO’s assigned beneficiaries reside.
Represent such allocated shared savings payments and shared losses on per-capita basis
based on total FFS enrollment as of July 1 of the experience year.
Exclude per-capita shared savings and losses attributed to beneficiaries in ESRD status as
of July 1 of the experience year.

19
Shared savings payments made to providers in the MSSP and Pioneer programs will be
reflected as additional expenditures in the experience (i.e., when the payments were
incurred rather than when they were paid) year. Shared losses will be included as
negative expenditures in the experience year. The amounts will be represented in the
county level Part A and Part B expenditures proportional to the Part A and Part B share
of the FFS USPCC for the experience year.
We are also proposing to change the source of the county designation of beneficiaries used in the
summarization of the risk scores, to be consistent with the county assignment used for the
ratebook FFS claims and enrollment. For contract years 2016 and earlier, the county assignment
for each fee-for-service (FFS) beneficiary was based on the zip code associated with the
beneficiary’s mailing address. Beginning with the 2017 ratebook, we are proposing to use the
county provided by the Social Security Administration, which is the same county assignment as
the ratebook FFS claims and enrollment.
The statutory component of the Regional MA benchmarks will also be based on this proposed
change to the county designation of beneficiaries. Under our implementation of section
1858(f)(2), the standardized PPO benchmark for each MA region includes a statutory component
consisting of the weighted average of the county capitation rates across the region for each
appropriate level of star rating. Under this proposal, the enrollment weights for the statutory
component will reflect the change in county designation of beneficiaries.
As in prior years, CMS will (1) make additional adjustments to the FFS rates for the items
detailed below, and (2) the average of the five year geographic indices, based on the adjusted
claims data, will be divided by the county’s average five-year risk score from the 2017 risk
model in order to develop the AGA for that county.
Additional Adjustments
As in prior years, CMS will make additional adjustments to the FFS rates for certain items listed
below.
These adjustments are made after the AGA is calculated:
Direct Graduate Medical Education: removed from FFS county rates (section
1853(c)(1)(D)(i) of the Act)
Indirect Medical Education: removed from FFS county rates, as per phase-out schedule in
MIPPA (section 1853(k)(4) of the Act)
Credibility: for counties with less than 1,000 members, blend county experience with that
of others in the market area
DOD: apply a cost ratio (an increase to claim costs) to counties with significant Tricare
enrollment in the Uniformed Services Family Health Plan (USFHP) (section
1853(c)(1)(D)(iii) of the Act).

20
VA: apply an adjustment to the county quality bonus payment (QBP) rates for experience
of Medicare beneficiaries who are also eligible to receive care through the Veterans
Health Administration (VHA).
B2. Adjustment to FFS per Capita Costs for DoD Costs
For CY 2017, we are proposing to continue to adjust the FFS rates by the Department of Defense
(DoD) ratios applied to the CY 2016 FFS rates. We are proposing an additional adjustment for
beneficiaries who receive care through Veterans Affairs.
B3. Adjustment to FFS per Capita Costs for Veterans Affairs (VA) Costs
To approximate an adjustment to the county fee for service (FFS) payment rates, we first
analyzed the cost impact of removing Veterans Affairs (VA) dual-benefit eligibles from the
Medicare claims and enrollments.3 Specifically, we calculated the ratio of standardized per
capita costs of all Medicare beneficiaries excluding VA dual-benefit eligibles (or all non-veteran
beneficiaries) to all Medicare beneficiaries (or all beneficiaries) for each county. The analysis
was based on FFS data for calendar years 2011 – 2013.
We then multiplied 2016 FFS rates by the ratios calculated and analyzed the resulting change in
rates for each county. We looked at the rate changes between the 2016 FFS rates calculated for
all beneficiaries and the rates calculated for the non-VA beneficiaries only. The rate changes do
not reflect the impact of any payment rate minimums. OACT found that the impact for adjusting
total FFS costs to non-VA FFS costs produces results that approximately 76% of the counties
would receive an increase, and 24% of the counties would receive a decrease. The average of the
impact on 2016 FFS rate is $6.23. (i.e., a rate increase of $6.23).
When we looked at the QBP payment rate, we found that the impact is somewhat smaller than
the impact on the FFS rate. For 0 percentage point QBP rate, approximately 67% of the counties
would receive an increase, 33% of the counties would receive a decrease, and the average impact
is an increase of $4.70. For 3.5 percentage point QBP rate, approximately 60% of the counties
would receive an increase, 40% of the counties would receive a decrease, and the average impact
is an increase of $3.98. For 5 percentage point QBP rate, approximately 58% of the counties
would receive an increase, 42% of the counties would receive a decrease, and the average impact
is an increase of $3.73.
Based on the above analysis, we propose to make appropriate adjustments to the 2017 QBP rates
for experience of VA dual-benefit eligible beneficiaries.
3 For this analysis, VA dual-benefit eligibles are defined as those Medicare beneficiaries who are
also eligible to receive care through the Veterans Health Administration (VHA).

21
Section C. IME Phase Out
Section 161 of the Medicare Improvements for Patients and Providers Act of 2008 (MIPPA)
amended section 1853(k)(4) of the Act to require CMS to phase out indirect medical education
(IME) amounts from MA capitation rates. Pursuant to section 1894(d)(3) of the Act, PACE
programs are excluded from the IME payment phase-out. Payment to teaching facilities for
indirect medical education expenses for MA plan enrollees will continue to be made under fee-
for-service Medicare.
For purposes of making this adjustment for 2017, we will first calculate the 2017 FFS rates
including the IME amount. This initial amount will serve as the basis for calculating the IME
reduction that we will carve out of the 2017 rates. The absolute effect of the IME phase-out on
each county will be determined by the amount of IME included in the initial FFS rate. Under
section 1853(k)(4)(B)(ii) of the Act, the maximum reduction for any specific county in 2017 is
4.8 percent of the FFS rate. To help plans identify the impact, CMS will separately identify the
amount of IME for each county rate in the 2017 ratebook. We will also publish the rates with
and without the IME reduction for the year.
Section D. ESRD Rates
In developing the 2017 ESRD Medicare Advantage benchmarks, we obtain the FFS dialysis
reimbursement and enrollment data for each state for the years 2010 – 2014. For each year, we
compute the per capita costs by state. The geographic indices for each year are calculated by
dividing the state per capita cost by the total per capita cost of the nation. The average
geographic adjustment (AGA) by state is then determined by calculating a 5-year weighted
average of the geographic indices, which is standardized by dividing by the 5-year average risk
scores. We calculated the 2014 FFS ESRD dialysis United States per capita cost (USPCC) based
on the 2014 data above, and using trend factors, develop the prospective 2017 FFS ESRD
dialysis USPCC. The 2017 ESRD dialysis rates by state are determined by multiplying the 2017
FFS ESRD dialysis USPCC by the state AGA. The 2017 ESRD dialysis rate is adjusted by
removing the direct graduate medical education (GME) expenses and gradually removing the
indirect medical education (IME) expenses.
Section E. Clinical Trials
In 2017, CMS will continue to pay on a fee-for-service basis for qualified clinical trial items and
services provided to MA enrollees in clinical trials that are covered under the Clinical Trials
National Coverage Determination (Medicare NCD Manual, Pub. 100-3, Part 4, Section 310.1).
Therefore, the payment and coverage standards applicable to NCDs under 42 CFR 422.109
apply. CMS has previously made the determination that all clinical trials covered under NCD
310.1 trigger the significant cost threshold such that coverage and payment are controlled by §
422.109(c).

22
As detailed in the 2016 Rate Announcement, MA enrollees are able to participate in any
qualifying clinical trial that is open to beneficiaries in original Medicare. CMS does not require
MA enrollees to relinquish their MA coverage if they wish to participate in a clinical trial.
CMS requires MAOs, in accordance with § 422.109(c)(2), to provide coverage for: (1) services
to diagnose conditions covered by clinical trial services, (2) most services furnished as follow-up
care to clinical trial services, and (3) services already covered by the MAO. Should an MA
enrollee choose to participate in a clinical trial, he or she may remain in his or her MA plan while
paying FFS costs for a qualifying clinical trial. As finalized in the CY 2011 Rate Announcement,
effective for CY 2011 and subsequent years, MAOs must reimburse enrollees for cost-sharing
incurred for clinical trial services that exceed the MA plans’ in-network cost sharing for the same
category of service. The MAO owes this difference even if the enrollee has not yet paid the
clinical trial provider. The enrollee’s clinical trial cost sharing must also count towards their in-
network out-of-pocket maximum. This cost-sharing requirement applies to all qualifying clinical
trials; MAOs cannot choose the clinical trials or clinical trial items and services for which this
policy applies.
By requiring MAOs to provide in-network cost sharing for clinical trial services, CMS is
requiring MAOs to provide MA enrollees with coverage for clinical trial services consistent with
the coverage they have for all other services. These policies ensure that MA enrollees do not
have unexpected cost sharing for clinical trials, as those cost sharing amounts will not be
different from the cost sharing amounts applicable to in-network services of a similar kind.
If an MAO conducts its own clinical trial, the MAO can explain to its enrollees the benefits of
participating in its clinical trial; however, the MAO may not require prior authorization for
participation in a Medicare-qualified clinical trial not sponsored by the MAO, nor may it create
impediments to an enrollee’s participation in a non-MAO-sponsored clinical trial, even if the
MAO believes it is sponsoring a clinical trial of a similar nature. However, an MAO may
request, but not require, that enrollees notify the MAO when they choose to participate in
Medicare-qualified clinical trials.
In addition, clinical trial sponsors/providers are permitted to submit original Medicare “paid”
clinical trial claims to MAOs on behalf of MA enrollees in order to obtain reimbursement for the
difference between original Medicare cost sharing liabilities and in-network MA cost sharing
liabilities. A trial sponsor/provider need only collect cost sharing from such an enrollee once
both original Medicare and the MAO have paid.
The policy of requiring MAOs to pay the difference between original Medicare cost sharing and
in-network cost sharing for clinical trial services is unchanged from 2011. For more information
on these policies, please refer to the Medicare Managed Care Manual, Pub. 100-16, Chapter 4
(Benefits and Beneficiary Protections), section 10.7 (Clinical Trials).

23
Section F. Location of Network Areas for PFFS Plans in Plan Year 2018
Section 1852(d) of the Act requires MA organizations offering certain non-employer MA PFFS
plans in network areas to enter into signed contracts with a sufficient number of providers to
meet the access standards applicable to coordinated care plans. Specifically, non-employer MA
PFFS plans that are offered in a network area (as defined in section 1852(d)(5)(B) of the Act)
must meet the access standards described in section 1852(d)(4)(B) through signed contracts with
providers. These PFFS plans may not meet access standards by establishing payment rates that
are not less than the rates that apply under Original Medicare and having providers deemed to be
contracted as described in 42 CFR 422.216(f).
Network area is defined in section 1852(d)(5)(B) of the Act, for a given plan year, as an area that
the Secretary identifies (in the announcement of the risk and other factors to be used in adjusting
MA capitation rates for each MA payment area for the previous plan year) as having at least 2
network-based plans (as defined in section 1852(d)(5)(C) of the Act) with enrollment as of the
first day of the year in which the announcement is made. We will include a list of network areas
for plan year 2018 in the final Announcement of Calendar Year (CY) 2017 Medicare Advantage
Capitation Rates and Medicare Advantage and Part D Payment Policies. We will also include
the list on the CMS website at https://www.cms.gov/Medicare/Health-Plans/
PrivateFeeforServicePlans/NetworkRequirements.html. We will use January 1, 2016 enrollment
data to identify the location of network areas for plan year 2018.
Section G. MA Employer Group Waiver Plans
We are proposing to waive the bidding requirements for all MA employer/union-only group
waiver plans (EGWPs). CMS has authority under section 1857(i) of the Act to waive or modify
requirements that hinder the design of, the offering of, or the enrollment in employment-based
Medicare plans offered by employers and unions to their members. CMS believes that waiving
the requirement to submit 2017 Part C bids will facilitate the offering of Part C plans for
employers and unions seeking to establish high quality coverage for their Medicare eligible
retirees by avoiding the cost and administrative burden of submitting complex bids.
In connection with this waiver, CMS is proposing an alternate payment policy for EGWPs. For
MA EGWPs in 2017, CMS is proposing, as a condition of the waiver of the bidding
requirements and the waivers otherwise provided to EGWPs, to establish payment amounts as
described here. Beginning with the 2017 contract year, Part C entities offering employer/union-
only group waiver plans would not be required to submit Part C bids.
Specifically, we are proposing to use individual market non-EGWP plan bids, including RPPOs,
submitted for 2017 to establish Part C county level payment amounts for EGWPs. We are
proposing to calculate the EGWP county payment rates as follows:

24
First, a weighted average bid-to-benchmark ratio will be calculated at the quartile4
level. The calculation would be: (weighted average of the intra-service area rate
adjustment (ISAR) adjusted county bid amounts by actual enrollment)/(weighted average
of the county standardized benchmarks by actual enrollment) = percentage by quartile. 5
The percentages will be applied to each of the published 5%, 3.5% and 0% bonus county
ratebook rates to establish Part C base payment amounts for EGWPs based on their star
rating for each county.
In order to calculate a county rebate payment, each county level EGWP Part C base
payment amount will then be compared to the corresponding published 5%, 3.5% and 0%
bonus county benchmarks to determine the amount of savings. The savings amount will
be multiplied by the corresponding star rebate percentage to determine the Part C EGWP
county level rebate amount.
The EGWP Part C base payment amount will be added to the Part C EGWP rebate
amount to establish the county level EGWP total payment amount.
The total payment amount will be risk adjusted in payment using beneficiary-specific risk
scores. Therefore, the formula applied for payment will be: (base county payment rate +
county rebate) * beneficiary level risk score
CMS would release county level total payment amounts by star rating (base county payment rate
+ county rebate) at the same time that the Regional MA benchmarks are released.
As a result of this proposal, each 3-star EGWP in a given county would receive the same
payment amount that includes the same rebate amount, multiplied by their beneficiaries’ risk
scores. MA EGWPs would no longer be able to distinguish between the amount they are paid
for basic benefits and the amount they are paid for rebates. In light of this, CMS would waive
the requirement for MA EGWPs to allocate rebate dollars to any specific purpose. MA EGWPs
would also no longer be permitted to buy down Part B premiums for their enrollees from the Part
C payment. Under current rules, when an MAO uses rebates to buy-down a portion of the Part B
premiums for their beneficiaries, CMS retains the rebate amount identified by the MAO and
coordinates directly with the Social Security Administration to ensure that each beneficiary’s
Part B premiums is appropriately calculated and withheld from the beneficiary’s Social Security
check or billed to the beneficiary. However, under this proposal, since specific rebate amounts
will not be identifiable, this process would no longer be available to MA EGWPs. Very few MA
EGWPs currently use rebate dollars to buy down any portion of the Part B premium for their
4 As described in more detail in Section A2 above, to determine the CY 2017 applicable percentages CMS
ranks counties from highest to lowest based upon their 2016 average per capita FFS costs and places the
rates into four quartiles. The 2017 quartile rakings will be used for this calculation. 5 Territories will not be included in the weighted average bid-to-benchmark ratio, but will be assigned the
weighted average of the quartile within which their counties fall.
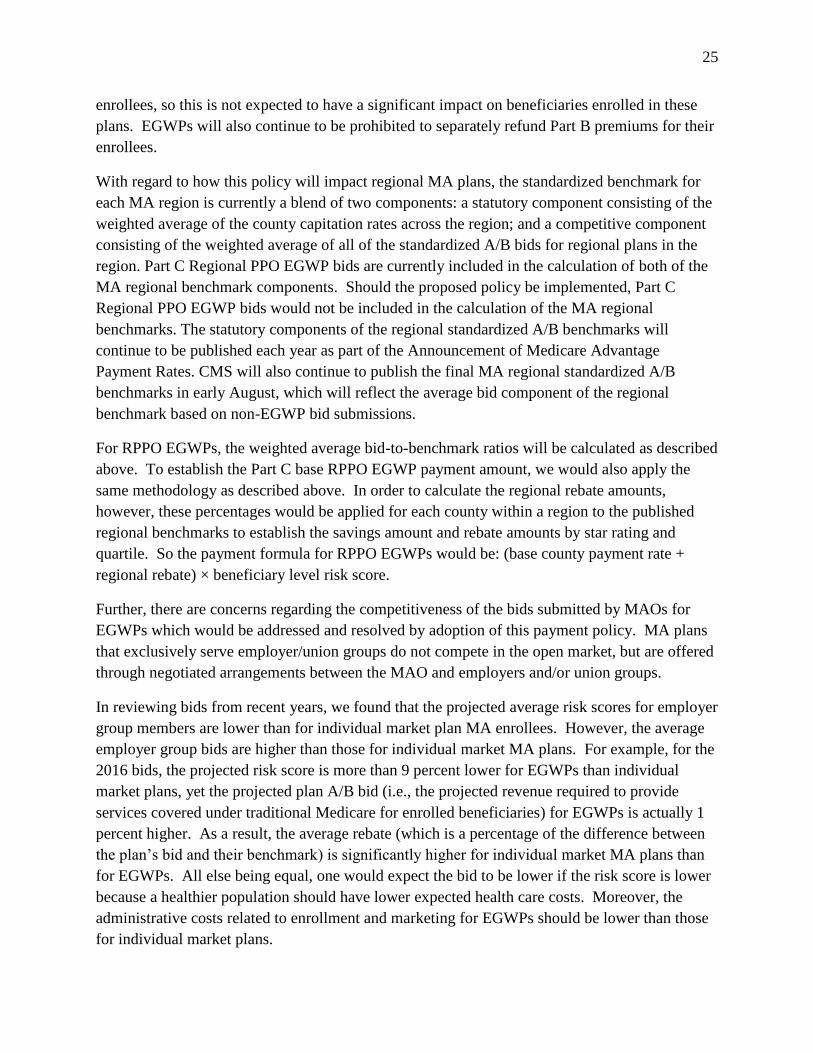
25
enrollees, so this is not expected to have a significant impact on beneficiaries enrolled in these
plans. EGWPs will also continue to be prohibited to separately refund Part B premiums for their
enrollees.
With regard to how this policy will impact regional MA plans, the standardized benchmark for
each MA region is currently a blend of two components: a statutory component consisting of the
weighted average of the county capitation rates across the region; and a competitive component
consisting of the weighted average of all of the standardized A/B bids for regional plans in the
region. Part C Regional PPO EGWP bids are currently included in the calculation of both of the
MA regional benchmark components. Should the proposed policy be implemented, Part C
Regional PPO EGWP bids would not be included in the calculation of the MA regional
benchmarks. The statutory components of the regional standardized A/B benchmarks will
continue to be published each year as part of the Announcement of Medicare Advantage
Payment Rates. CMS will also continue to publish the final MA regional standardized A/B
benchmarks in early August, which will reflect the average bid component of the regional
benchmark based on non-EGWP bid submissions.
For RPPO EGWPs, the weighted average bid-to-benchmark ratios will be calculated as described
above. To establish the Part C base RPPO EGWP payment amount, we would also apply the
same methodology as described above. In order to calculate the regional rebate amounts,
however, these percentages would be applied for each county within a region to the published
regional benchmarks to establish the savings amount and rebate amounts by star rating and
quartile. So the payment formula for RPPO EGWPs would be: (base county payment rate +
regional rebate) × beneficiary level risk score.
Further, there are concerns regarding the competitiveness of the bids submitted by MAOs for
EGWPs which would be addressed and resolved by adoption of this payment policy. MA plans
that exclusively serve employer/union groups do not compete in the open market, but are offered
through negotiated arrangements between the MAO and employers and/or union groups.
In reviewing bids from recent years, we found that the projected average risk scores for employer
group members are lower than for individual market plan MA enrollees. However, the average
employer group bids are higher than those for individual market MA plans. For example, for the
2016 bids, the projected risk score is more than 9 percent lower for EGWPs than individual
market plans, yet the projected plan A/B bid (i.e., the projected revenue required to provide
services covered under traditional Medicare for enrolled beneficiaries) for EGWPs is actually 1
percent higher. As a result, the average rebate (which is a percentage of the difference between
the plan’s bid and their benchmark) is significantly higher for individual market MA plans than
for EGWPs. All else being equal, one would expect the bid to be lower if the risk score is lower
because a healthier population should have lower expected health care costs. Moreover, the
administrative costs related to enrollment and marketing for EGWPs should be lower than those
for individual market plans.

26
We believe there is an incentive for EGWPs to bid as close as possible to the benchmark in order
to maximize revenue for the plan. EGWPs do not need to use the rebate dollars (and the
supplemental benefits they support) in order to attract enrollees, as is the case in the individual
market. As the Medicare Payment Advisory Commission (MedPAC) noted in its March 2009
Report to Congress (page 259), “the closer the bid is to the benchmark the better it is for the
plans and employer, because a higher bid brings in more revenue from Medicare, potentially
offsetting expenses that would have required a higher pay-in from employers.6”
Due to this bidding behavior, the bid-to-FFS ratio and payment-to-FFS ratio have been much
lower for non-EGWPs than EGWPs for the past several years. These findings are consistent
with MedPAC’s conclusions. In particular, MedPAC found that the average bid, in 2014, of
non-employer plans was 86 percent of their benchmarks, while EGWPs submitted bids that
averaged 95 percent7. In 2015, MedPAC found that the average bid for EGWPs was 105 percent
of the FFS rate, whereas the average bid for all MA plans was 94 percent of the FFS rate.
Excluding EGWP plans from that calculation lowered the average non-EGWP bid to 92 percent
of the FFS rate8.
As of 2015, about 3 million beneficiaries, or approximately 19 percent of all MA enrollees, were
enrolled in EGWPs. CMS first expressed concern regarding EGWP bids in the 2012 Advance
Notice and asked for comments to explain and address the differences in EGWP bidding. The
comments received did not seem to provide strong evidence for why EGWP plans have higher
costs but lower risk scores. CMS’ more recent review of bids has continued to find that EGWP
bids are higher with no apparent rationale or explanation for the higher costs. CMS believes it is
likely that CMS’ current payments to EGWPs help subsidize the wrap-around coverage
otherwise covered by employers. CMS also recognizes that, to the extent that CMS’ payments
are reduced, the result would be that employers pay higher premiums for current levels of
supplemental coverage or that employers would choose to reduce the supplemental coverage
provided to employees under these plans.
Notwithstanding the proposed changes to payment as described above, entities offering MA
EGWPs must continue to meet all of the CMS requirements that are not otherwise specifically
waived or modified, including, but not limited to, submitting information related to plan service
areas and plan benefit packages. CMS would establish this new payment policy under our
Section1857(i) waiver authority, by requiring plans to agree to the payment terms as a condition
6 MedPAC has recognized the EGWP bidding patterns and has publicly reported on this issue several
times see, e.g. http://medpac.gov/documents/reports/march-2009-report-to-congress-medicare-payment-
policy.pdf (p.259); http://www.medpac.gov/documents/reports/chapter-13-the-medicare-advantage-
program-status-report-(march-2015-report).pdf?sfvrsn=0 (p. 325) 7 http://medpac.gov/documents/reports/mar14_entirereport.pdf (p. 334) 8 http://www.medpac.gov/documents/reports/chapter-13-the-medicare-advantage-program-status-report-
(march-2015-report).pdf?sfvrsn=0
27
of the waivers provided to such plans (e.g., enrollment, service area, marketing, submission of
bids, etc.).
The proposed changes align Part C payments for EGWPs with the approach we use for Part D
payments to EGWPs.9 Under this approach, payments to EGWPs will more closely align with
payments made to MAOs under a competitive MA bidding structure.
Section H. CMS-HCC Risk Adjustment Model for CY 2017
In 2017, CMS proposes to implement an updated version of the CMS-HCC risk adjustment
model. We propose to use this updated CMS-HCC model in Part C payment for aged/disabled
beneficiaries enrolled in MA plans, including Medicare-Medicaid Plans (MMPs). The proposed
model would encompass the following updates:
Updates to the data years used to recalibrate the model;
Revisions to the community model that replace the single community segment with six
separate model segments (non-dual aged, non-dual disabled, full benefit dual aged, full
benefit dual disabled, partial benefit dual aged, partial benefit dual disabled); each
segment would have relative factors that are independently developed for that segment
and would reflect the specific relative costs for an HCC for that subgroup;
Updates to disease interactions; and
Updates to the community and long term institutional (LTI) segments, such that the
community risk score will depend on the dual status in the payment month and the LTI
risk scores will include a Medicaid factor based on Medicaid status in the payment year.
CMS received numerous comments on the HPMS memo “Proposed Changes to the CMS-HCC
Risk Adjustment Model for Payment Year 2017,” released in October 2015. A compilation of
the 87 comments received prior to the comment deadline is posted at
https://www.cms.gov/Medicare/Health-Plans/MedicareAdvtgSpecRateStats/Risk-Adjustors-
Items/RiskProposedChanges.html. Most of the commenters commended CMS and offered
support for the work CMS is conducting to revise the CMS-HCC Model and appreciate CMS’
transparency with results of the analyses, particularly the predictive ratios. Commenters
highlighted that the revised model will eliminate payment inaccuracies and provide an equitable
approach to improve the overall accuracy of the risk-adjustment model for complex vulnerable
populations, including full benefit dual aged and full benefit dual disabled beneficiaries. They
specifically supported the incorporation of dual status in the payment year and advocated for
implementation of the model without a phase in period.
9 In 2008, CMS eliminated bidding for Part D EGWPs and since then has based our direct subsidy
payments to Part D EGWPs on the average of individual Part D plan bids.

28
Commenters that opposed our proposed approach to revising the model expressed concerns
about payment changes for plans that did not enroll many full benefit dual eligible beneficiaries.
These commenters made several suggestions, including that, in order to focus on correcting
payment accuracy for dual eligible beneficiaries, CMS apply an adjustment factor only to the
payment for dual eligible beneficiaries. They also suggested delaying implementation of the
model or making the model change budget neutral for the MA program. Plan sponsors that
enroll a large partial dual population also expressed concern.
Commenters also asked for clarification regarding a number of issues. A few commenters were
interested in the addition of other disease interaction terms to the model. Commenters also asked
about the ability of the model to predict for low risk disabled beneficiaries and offered
suggestions to improve the prediction of their costs. Some commenters wanted more
information on our methodology and rationale used to develop the proposed model. A number
of commenters requested that CMS provide the impact of the proposed model on the MA
program overall.10 A number of commenters also asked for coefficients ahead of the PY2017
Advance Notice so that they could have more than 14 days to predict their risk scores under the
new model and make meaningful comments.
We received numerous comments from PACE organizations in response to our proposal to
implement a revised CMS-HCC risk adjustment model for both MAOs and PACE organizations:
although commenters expressed interest in the new model structure, they also expressed concern
about changing to a different set of HCCs. One comment we received requested that CMS
recognize that some beneficiaries in Puerto Rico would be partial dual eligible if the
Commonwealth established a program for QMBs and SLMBs, and account for that population
for MA payment purposes.
In drafting this section of the Advance Notice (related to the revision of the CMS-HCC model),
we incorporated additional information in order to address many of the comments we received.
We note that many of the comments we received related to how CMS would implement the new
model in payment. Questions include how CMS would identify monthly dual eligible status in
payment, how CMS would make updates to monthly payments as States reported new or
changing dual status after prospective payments had been made, and how the MMR and other
reports would be changed to reflect the risk scores used in payment. CMS is in the process of
developing technical specifications for how we would implement the proposed model and plan to
release information regarding the operational implementation after the CY 2017 Rate
Announcement has been published.
10 In response to these comments, CMS posted risk score data for each contract on January 23rd on the Health Plan
Management System (HPMS) web page, as well as risk model coefficients, which are posted at
https://www.cms.gov/Medicare/Health-Plans/MedicareAdvtgSpecRateStats/Risk-Adjustors-Items/
RiskProposedChanges.html?DLPage=1&DLEntries=10&DLSort=0&DLSortDir=descending.

29
Background
The CMS-HCC risk adjustment model is used to calculate risk scores to adjust capitated
payments made for aged and disabled beneficiaries enrolled in Medicare Advantage (MA) plans
and certain demonstrations. The CMS-HCC model has historically been calibrated using two full
risk segments with separate coefficients to reflect the unique cost patterns of beneficiaries in the
community and beneficiaries residing in long term care institutional facilities. The community
segment of the model predicts costs for beneficiaries who reside in the community or have been
in an institution for fewer than 90 days. The institutional segment of the model predicts costs for
beneficiaries who have been in an institution for 90 days or longer.
The CMS-HCC risk adjustment model is prospective: it uses health status in a base year to
predict costs in the following year (payment year). In addition to diagnoses, base year factors in
the current models include Medicaid status. There are different Medicaid factors by gender,
aged/disabled Medicare entitlement status, and whether a beneficiary lives in the community or
in an institution. These Medicaid factors complement the diagnoses in the model as prospective
predictors of costs. The coefficients for the Medicaid factors reflect that, on average, dual
eligible beneficiaries cost more than non-dual eligible beneficiaries with otherwise similar
disease and demographic profiles. Medicaid status is defined as having at least one month of
Medicaid eligibility during the base year.
Research and Findings
In response to new Medicare products that focus on enrolling exclusively dual eligible
beneficiaries, along with concerns raised about the accuracy of the current model for predicting
costs for dual eligible beneficiaries, CMS’ research and model development work focused on
determining the accuracy of the CMS-HCC model for paying for dual eligible beneficiaries and
identifying model changes to improve payment accuracy. Specifically, CMS studied how well
the model predicts costs based on beneficiaries’ dual eligible statuses in the payment year, which
is when beneficiaries are enrolled in the health plan that is being paid for them. CMS has not
undertaken a revision of the set of HCCs included in the model.
To measure model performance, CMS calculated predictive ratios for key subgroups of
beneficiaries. A predictive ratio—the ratio of a group’s predicted cost to its actual cost—
measures the accuracy of the model in predicting the average cost of a group. A predictive ratio
close to 1.0 indicates that the model is accurately predicting that group’s average cost. A ratio
greater than 1.0 indicates over-prediction, while a ratio less than 1.0 indicates under-prediction.
The 2014 model predicts accurately overall, and for diseases and characteristics included in the
model. We note that we calculated predictive ratios using the Fee-For-Service (FFS) population
because we did not have expenditures for the MA-enrolled population.

30
CMS measured the predictive ratios (PR) for the beneficiaries based on community and
institutional status by dual status, and also on dual status by aged/disabled status.
Institutional Segment. Since the long-term institutionalized population is predominantly dual
eligible (83.5%) – and specifically, full benefit dual eligible (83.3%) – the institutional segment
of the model predicts very well for dual eligible beneficiaries (the predictive ratio for all dual
eligible beneficiaries is 0.998; the predictive ratio for full benefit dual eligible beneficiaries is
0.999).
Community Segment. Our findings show that the community segment of the 2014 model
overpredicts for both non-dual eligible beneficiaries (PR=1.015) and for partial benefit dual
eligible beneficiaries (PR=1.092), while it under-predicts for full benefit dual eligible
beneficiaries (PR=0.914) (see Table II-5). Based on these findings, we focused our model
development efforts on the community segment of the CMS-HCC model.
Table II-5. Predictive Ratios for Community Population, 2014 Model
FFS population 1.000
Non-dual 1.015
Dual 0.957
Full benefit duals 0.914
Partial benefit duals 1.092 Notes: Predictive ratios are the ratio of predicted cost to actual cost for the applicable subgroup.
Dual status is defined in the payment year.
Source: RTI International analysis of 2010-2011 Medicare 100% data.
Model Development
Given our findings, we focused on making at least two specific changes: (1) splitting the
community dual eligibles into full benefit duals and partial benefit duals and (2) incorporating
dual status from the payment year (rather than using prior year dual status to predict payment
year costs).
In order to improve the ability of the model to predict costs for full benefit and partial benefit
dual eligible beneficiaries in the community, CMS explored different approaches to revising the
CMS-HCC risk adjustment model by developing several analytic models and assessing their
impact on the ability of the model to predict costs for various dual eligible groups, including:
1. Creating separate concurrent factors for full and partial benefit duals within a single
community segment of the model;
2. Developing multiplicative factors for full and partial benefit duals, relative to a base
community model;
3. Creating three community segments for non-dual, full benefit, and partial benefit dual
beneficiaries;
31
4. Creating six community segments for non-dual aged and non-dual disabled, full benefit dual
aged and full benefit dual disabled, and partial benefit dual aged and partial benefit dual
disabled beneficiaries; and
5. Exploring whether combining some subgroups (i.e., having fewer than six community
segments in the model) could simplify the model without reducing the ability of the model to
predict costs.
In developing each model for analysis, we defined dual status by month and identified non-duals,
full benefit duals, and partial benefit duals as follows (see Table II-6):
Full benefit dual eligibles are those who are eligible for full Medicaid benefits under title
XIX of the Social Security Act. Full benefit dual eligibles include those who are eligible
as Qualified Medicare Beneficiaries (QMBs) or Specified Low Income Medicare
Beneficiaries (SLMBs) in addition to full Medicaid benefits (i.e., QMB Plus and SLMB
Plus).
Partial benefit dual eligibles include those who are eligible only as a Qualified Medicare
Beneficiaries (QMBs), a Specified Low Income Medicare Beneficiaries (SLMBs), and
under other categories of beneficiaries who are not eligible for full Medicaid benefits
under title XIX.
For payment purposes, we will use Medicaid data from three sources: the MMA State files, the
Point of Sale data, and the monthly Medicaid file that the Commonwealth of Puerto Rico
submits to CMS. We will identify full benefit dual status for a month using dual status codes 02,
04, and 08, and presence on the Puerto Rico file to indicate full dual status. We will identify
partial benefit dual status for a month using dual codes 01, 03, 05, and 06.
We note that Puerto Rico has requested that, for payment purposes, CMS treat some of their non-
duals as partial benefit duals, since the Commonwealth has not established a Medicaid program
for QMBs and SLMBs (categories that are classified as “partial benefit duals”). Puerto Rico has
proposed that CMS establish a ratio of the average risk scores for partial duals vs non-duals,
estimate a proportion of beneficiaries who would be treated as partial benefit duals within the
Puerto Rico non-dual population enrolled in MA plans by using the proportion of partial duals to
non-duals in MA plans in the non-Territory jurisdictions, and use these data to apply a partial
dual factor to the entire non-dual population in Puerto Rico. CMS is requesting comment on this
proposal, including whether or not we should proceed with a different methodology for
determining dual status for beneficiaries enrolled in Puerto Rico plans, whether this approach of
applying an adjustment amount to non-dual risk scores in Puerto Rico is reasonable, and whether
we should use data from all non-Territory jurisdictions or from specific States instead. Further,
we seek comment on whether there are other approaches, such as identifying specific
beneficiaries who should be considered partials duals in Puerto Rico and having the
Commonwealth identify them on their monthly files, so that an adjustment would be made to

32
individual risk scores and flow through payment as it does for all beneficiaries. We seek
comment on how to identify individuals who would be partial benefit duals if QMB and SLMB
benefits were part of the Puerto Rico Medicaid program and on factors that could be used as
proxies for partial dual status. Because of the payment implications of such risk score
adjustments, we are trying to determine if an adjustment to risk scores of non-duals enrolled in
Puerto Rico MA plans - either by using an adjustment that reflects the estimated proportions of
partial dual and non-dual beneficiaries in Puerto Rico or by identifying specific individuals to
consider as partial dual beneficiaries - would increase payment accuracy.
Table II-6. Dual Status Codes for Beneficiaries Who are Entitled to Medicare
Dual Status
Code
Category
01 QMB only
02 QMB and Medicaid coverage
03 SLMB only
04 SLMB and Medicaid coverage
05 Qualified Disabled and Working Individuals (QDWI)
06 Qualifying individuals (QI)
08 Other Dual Eligibles (Non QMB, SLMB, QWDI or QI) with Medicaid
coverage
09 Other Dual Eligibles but without Medicaid coverage
In analyzing the various model approaches, our research explored whether the coefficients
differed significantly for different populations and whether the predictive ratios for each
subgroup were improved relative to the current model. Our findings included the following:
In one analytical revised version of the CMS-HCC model, we retained a single community
segment but replaced the existing prospective Medicaid factors with new concurrent factors.
These new concurrent Medicaid factors were additive in the same manner as the existing
Medicaid factors and the HCCs, and we created one each for full benefit and partial benefit
duals. CMS found that, while the regression coefficients were not significantly different
from the current CMS-HCC model, the overall predictive ratios for most of the six subgroups
were improved. However, for some deciles, the predictive ratios for the subgroups were
further from 1.0 than those under the current model.
In another analytical revised version of the CMS-HCC model, we created three community
segments (non-dual, full dual, and partial dual). When we compared the coefficients among
these three community segments, we found substantial differences in the regression

33
coefficients for both the age-sex factors and HCCs. The majority of regression coefficients
for the full benefit duals were higher than those for the partial benefit duals. Similarly, the
majority of the coefficients for the partial benefit duals were higher than those for the non-
duals. With the three community segment model, predictive ratios at the HCC level and
demographic level are 1.0 for each of the 3 dual status groups.
We also assessed an analytical revised version of the CMS-HCC model that retained a single
community segment, but replaced the existing Medicaid factors with multiplicative factors,
i.e., factors that multiplied a base risk score by a uniform factor, depending on dual status.
We note that, in determining whether or not multiplicative factors would improve the ability
of the model to predict costs by dual status, we compared the coefficients of the analytical
revised version model with three community segments, and found that the relationships
between the coefficients were not consistent across factors. For example, not all of the
coefficients were higher by the same amount. This suggests that a multiplicative term for
either full and/or partial duals would be an imprecise approach to improving the predictive
ability of the model, thus limiting its effectiveness in improving the model. In fact, the
predictive ratios for the multiplicative approach show that this model variant does not
improve predictive ratios across deciles.
In considering the value added of a six community-segment model versus a three
community-segment model, our analyses showed that the cost and disease patterns of the
non-dual, full benefit dual, and partial benefit dual, and the aged versus disabled segments,
were distinct, both within the dual types (e.g., full benefit dual aged versus full benefit dual
disabled) and between the dual types (e.g., full benefit dual disabled versus partial benefit
dual disabled). Furthermore, the differences in cost patterns varied significantly both overall
and by HCC disease category. We note that the predictive ratio for each of the six groups
would be 1.0 under either a 3- or 6-segment model. The key differences are that the model
with six community segments produces predictive ratios that are substantially similar or
closer to 1.0 at the decile level and the predictive ratios for each of the 6 subgroups are 1.0 at
the HCC level only with the 6-segment model. See section below on “Initial Results of
Proposed Model” for more information.
Because the cost and disease patterns for the six dual subgroups are distinct, we believe that in
order to improve the ability of the model to predict costs by dual status, it is appropriate to
establish six separate segments. For payment year 2017, we propose a CMS-HCC model with a
separate community model segment for each of the six subgroups of dual eligibles described
above.
Disease interactions
Since the proposed CMS-HCC community model contains separate segments by aged/disabled
dual status, it effectively contains interactions for disease, dual status, and aged/disabled status

34
for every payment HCC. The majority of the predictive ability of the proposed model is captured
additively across the demographic factors and the HCCs and, as a result, adding disease-disease
(HCC x HCC) interactions only marginally increases the model’s explanatory power. However,
to better recognize the medical characteristics of each of the six community populations, we re-
examined the disease-disease interactions for the revised model. After extensive analysis, we
have determined that all of the community model segments will have six disease-disease
interactions, with one additional disease-disease interaction term for the disabled model
segments.
CMS examined high frequency disease-disease interactions for each of the six subgroups (non-
dual aged, non-dual disabled, partial benefit dual aged, partial benefit dual disabled, full benefit
dual aged, and full benefit dual disabled) separately. We examined individual HCC x individual
HCC interactions, individual HCC x HCC group interactions, and HCC group x HCC group
interactions. Disease-disease interactions were evaluated based on several criteria,
including: sample size, magnitude of coefficient, statistical significance, statistical stability, and
clinical plausibility. We identified disease-disease interactions that were clinically significant,
empirically strong, and improved the predictive accuracy for the segment subgroups, and
reviewed these disease interaction candidates with clinicians. For example, the simultaneous
presence of Congestive Heart Failure (CHF) and Chronic Obstructive Pulmonary Disease
(COPD) leads to higher expected costs than would be calculated by adding the separate
increments for CHF and COPD alone. The disease-disease interactions for each of the six
separate community models are the same, except for one disease-disease interaction (Substance
Abuse and Psychiatric) that is only included in the three disabled community models.
Below is the list of disease interactions that will be used in the 6-segment community model:
All Aged and Disabled Segments
Cancer HCC group × disorders of immunity individual HCC
CHF individual HCC ×diabetes HCC group
CHF individual HCC ×COPD HCC group
CHF individual HCC ×renal HCC group
CHF individual HCC ×specified heart arrhythmias individual HCC
COPD HCC group ×cardio respiratory failure HCC group
Disabled Segments Only
Psych HCC group × substance abuse HCC group
Institutional segment. Other than recalibrating the institutional segment of the CMS-HCC model,
the only change we are proposing is to measure dual status concurrently (based on payment year
status). Although the institutional segment of the model already predicts well for dual eligibles,
we are making this change to be consistent with the community segments of the revised model.

35
We will retain a single institutional segment. We explored creating separate dual factors for full
benefit duals and partial benefit duals, but our model showed that separate risk factors for full
benefit dual status and partial benefit dual status did not meaningfully improve the overall
predictive accuracy of the institutional model. As a result, we decided to continue including a
single risk factor for any dual status (full benefit or partial benefit).
New enrollee segment. The new enrollee segment of the CMS-HCC model is used in Part C
payment for beneficiaries who do not have adequate diagnoses history to calculate a risk score.
We operationalize this approach by defining new enrollees as those beneficiaries without 12
months of Part B enrollment in the data collection year. The new enrollee segment of the CMS-
HCC model comprises demographic factors: age, sex, Medicaid status, and originally disabled
status. The new enrollee model for payment year 2017 is recalibrated on 2014 Medicare FFS
claims data. Otherwise, the new enrollee model is unchanged from the new enrollee segment of
the 2014 CMS-HCC model. Medicaid status in the new enrollee model is already concurrent in
the payment year and our model research showed that separate risk factors for full benefit dual
status and partial benefit dual status did not meaningfully improve the overall predictive
accuracy of the new enrollee model. As a result, we decided to continue including a single
factor for any dual status (full benefit or partial benefit).
Initial Results of Proposed Model
Predictive ratios for each of the six community subgroups, defined by dual eligible status and
aged/disabled status, are 1.0 for the revised model, indicating that the six segment model predicts
costs more accurately than the 2014 model (see Table II-7). The non-dual and partial benefit dual
aged and disabled subgroups are no longer over-predicted, and the full benefit dual aged and
disabled subgroups are no longer under-predicted. In addition, the predictive ratios at the HCC
level and demographic level are 1.0 for each of the six community subgroups, which is an
important improvement over the 2014 model. Furthermore, the revised model improves
prediction for each of the six subgroups across deciles of predicted costs. The deciles were
created by sorting the predicted expenditures in ascending order, then equally dividing each
subpopulation amongst the ten groups. For the non-dual aged, full benefit dual aged, and partial
benefit dual aged segments, the predictive ratios for the revised model are closer to 1.0 compared
to those for the 2014 model across most deciles (see Table II-7).
We note that the CMS-HCC model has typically under-predicted expenditures for low risk
beneficiaries. The majority of beneficiaries in the lowest predicted groups have no HCCs
included in the model. The predicted costs for beneficiaries without model HCCs are determined
by CMS-HCC model demographic factors only and the values for these demographic factors are
the same for both beneficiaries without HCCs and those with model HCCs. For those
beneficiaries with HCCs, the age-sex factors have modest importance in explaining costs. The
actual effect in dollars of the under-prediction in lower deciles is quite small; it is a percentage of
a relatively small expenditure level.

36
For beneficiaries in the highest decile of predicted costs for all six model segments, the revised
model effectively eliminates the over-prediction for non-dual and partial benefit dual
beneficiaries and the under-prediction for full benefit dual beneficiaries.
For the non-dual disabled and partial benefit dual disabled segments, the revised model predicts
costs more accurately than the 2014 model does for deciles four through ten. For the full benefit
dual disabled segment, the revised model’s predictive ratios are generally closer to 1.0 for deciles
five through ten than the 2014 model’s predictive ratios. However, for the lower risk deciles in
all three dual disabled segments, the under-prediction for costs observed under the 2014 model is
not fully eliminated by the revised model. We note the majority of beneficiaries in these lowest
deciles have few or no HCCs that are included in the model.
Table II-7. Comparison of Predictive Ratios by Deciles of Predicted Expenditures,
Community Beneficiaries – 2014 Model and Revised CMS-HCC Model
Non-Dual Aged Full Benefit Dual Aged Partial Benefit Dual Aged
Decile 2014
model Revised
model 2014
model Revised
model 2014
model Revised model
Overall 1.012 1.000 0.892 1.000 1.123 1.000
1st 0.904 0.935 0.814 0.961 1.043 0.933
2nd 0.925 0.952 0.862 0.954 1.206 0.968
3rd 0.950 0.970 0.952 0.987 1.234 0.966
4th 0.968 0.977 0.906 0.993 1.174 0.977
5th 1.006 1.007 0.920 1.005 1.152 0.994
6th 1.001 1.003 0.908 0.999 1.146 0.997
7th 1.021 1.015 0.908 1.014 1.138 1.022
8th 1.026 1.014 0.901 1.014 1.133 1.022
9th 1.040 1.019 0.892 1.013 1.103 1.022
10th 1.036 1.000 0.868 0.995 1.074 0.997
Non-Dual Disabled Full Benefit Dual
Disabled Partial Benefit Dual
Disabled
Decile 2014
model
Revised
model 2014
model
Revised
model 2014
model Revised model
Overall 1.042 1.000 0.947 1.000 1.072 1.000
1st 0.787 0.928 0.860 0.949 0.799 0.912
2nd 0.886 0.910 0.888 0.880 0.865 0.884
3rd 1.012 0.952 0.837 0.873 0.950 0.891
4th 0.905 0.953 1.061 0.904 1.069 0.978
5th 1.033 0.969 1.009 0.993 1.165 1.030
6th 1.061 0.989 1.036 1.024 1.120 1.014
7th 1.072 1.004 1.024 1.029 1.133 1.025
8th 1.092 1.032 1.004 1.053 1.140 1.041
9th 1.114 1.053 0.968 1.050 1.114 1.039
10th 1.039 0.997 0.877 0.991 1.049 0.991
Source: RTI International analysis of 2011-2012 Medicare 100% data.
Calibration

37
CMS calibrated the revised CMS-HCC model using 2013-2014 Medicare FFS data. Specifically,
2013 diagnoses were used to predict 2014 expenditures. We did not conduct a clinical revision of
the hierarchical condition categories (HCCs) for the proposed model revision. Each of the six
community model segments (non-dual aged, non-dual disabled, full benefit dual aged, full
benefit dual disabled, partial benefit dual aged, and partial benefit dual disabled) will have the
same HCCs that were in the 2014 model, while the coefficients will differ by segment to reflect
the specific relative costs for a demographic factor or an HCC for each subgroup. The
demographic factors (e.g., age, sex, originally disabled) will remain the same, with the exception
of the Medicaid factors, which are no longer included in the model as an additional factor. The
Medicaid factors are no longer necessary, since there are separate segments based on dual status.
As in all model calibrations, the denominator will be the average predicted cost across the FFS
Medicare population and will be used to convert model coefficients in each segment into relative
factors. For the proposed CMS-HCC model, the denominator year is 2015 and the denominator
is $9,350.78. The denominator sets the average FFS risk score to 1.0 in the year of the
denominator. We note that, in setting the average risk score at 1.0 in a year, all risk scores are
relative to this average. In other words, if, in updating the model, some beneficiaries’ risk scores
increase to reflect a higher predicted relative risk, other beneficiaries’ risk scores will decrease to
reflect a lower predicted relative risk.
We note that several commenters asked that we implement the model so that it is budget neutral
to the MA program. We are not proposing to make any changes to the model in order to retain
the average MA risk score at the same level that it was under the current model. The change in
the aggregate MA risk score is almost entirely due to the different distribution of duals than is in
FFS. Given that we believe that this model improves the predictive ability of the model, it is
appropriate to allow MA risk scores to change in response to the revised model.
The model sample comprises beneficiaries who have at least one month in FFS in the prediction
year (2014) and all twelve months of FFS in the prior year (2013). Community versus Long
Term Institutional (LTI) status is determined in the prediction year (2014) and on a monthly
basis; the appropriate month is placed into the appropriate model segment. If a beneficiary has
LTI status in a month, then that month’s costs are placed in the LTI model segment. Dual status
(non-dual, full benefit dual, and partial benefit dual) is assigned in the LTI segment if the
beneficiary is dual any time in the prediction year.
Similarly, if a beneficiary has community status in a month, then that month’s costs are placed in
the appropriate segment among the six community segments. Dual status (non-dual, full benefit
dual, and partial benefit dual) is assigned for these community segments in the prediction year
and on a monthly basis.
CMS will continue to determine age for a year as of February 1, and this age will determine
whether a beneficiary is considered either aged or disabled for purposes of selecting the

38
appropriate model segment(s) during that year. For each segment, model coefficients for
hierarchical condition categories (HCCs) are estimated by regressing the total annualized
expenditure for Medicare Parts A and B benefits for each beneficiary onto their demographic
factors and hierarchical condition categories, as indicated by their diagnoses. Expenditures are
based on annualized costs of months that a beneficiary is in for each relevant status: LTI or one
of six community segments.
The distribution of beneficiaries in the model sample is shown in Table II-8: 13.4% of the model
sample are full benefit duals and 5.3% are partial benefit duals. We observed that full benefit
duals have higher costs than partial benefit duals, and partial benefit duals have higher costs than
non-duals (also see Table II-8 for average costs by subgroup).
For payment, we would determine the appropriate risk score for each monthly payment based on
a beneficiary’s status in the payment month. If a beneficiary has LTI status in a payment month,
we will apply an LTI risk score for payment. If a beneficiary has community status in a payment
month, the appropriate community segment is used (the six community segments are mutually
exclusive) for a month. This is similar to how we determine which risk score to use in payment
today. Further, similar to how we currently determine LTI v community status in payment, we
will use available information when we initially calculate prospective monthly payments and
then, at a later date, retroactively reconcile monthly payments with actual monthly dual status.
As we mention above, we are developing technical specifications for implementing the proposed
model in payment and will provide operational detail at a later date.
New enrollee model. In the revised HCC model that we are proposing for 2017, we will again
directly estimate each possible risk score, as we did for the 2014 CMS-HCC model. For
example, we directly estimate the risk score for a specific new enrollee type, such as female 70-
74, Medicaid, and originally disabled. We took this approach for the 2014 CMS-HCC model and
are continuing with the practice.
New Enrollee Risk Scores for Chronic SNPs. Beginning in 2011, in accordance with changes
that Section 3205 of the Affordable Care Act made to section 1853(a)(1)(C)(iii) of the Act, CMS
implemented a new enrollee risk adjustment model designed specifically to pay new enrollees in
chronic care special needs plans (C-SNPs). This model is based on the known underlying risk
profile and health status of C-SNP enrollees generally, given that these beneficiaries must have
certain conditions to be enrolled in these plans. New enrollee risk scores are used to pay for
those beneficiaries who do not have 12 months of Part B in the data collection year. Because
chronic SNP enrollees must as a condition of enrollment have specific conditions, the average
new enrollee risk score is likely to understate these beneficiaries’ risks.
The C-SNP new enrollee factors were developed by calculating an average risk score for
continuing enrollees in C-SNPs using the standard new enrollee model. We then adjusted the
current new enrollee risk scores to take into account the incremental risk of continuing enrollees

39
in chronic SNPs. As with the standard new enrollee model, the C-SNP new enrollee factors
include factors that differ depending on age, sex, Medicaid, and originally disabled status. The
C-SNP new enrollee factors comprise the standard new enrollee factors, plus an incremental
amount.
For 2017, CMS will continue to utilize new enrollee risk scores calculated from the C-SNP
segment of the revised CMS-HCC model in Part C payment for aged/disabled beneficiaries
enrolled in C-SNPs.
Table II-8. Costs and Percent of Model Sample of Different Full Risk Subgroups (2014)
Mean actual costs Proportion of model
sample
Community full benefit dual – aged $15,204 6.5%
Community full benefit dual – disabled $10,684 6.9%
Community partial benefit dual – aged $10,689 2.8%
Community partial benefit dual – disabled $9,649 2.5%
Community non-dual – aged $8,968 72.0%
Community non-dual –disabled $8,152 6.8%
Institutional $18,714 2.5% Source: RTI International analysis of 2013-2014 Medicare 100% data.
Table II-9 compares the current CMS-HCC model to the proposed CMS-HCC model.
Table II-9. Comparison of the 2014 Model and Revised CMS-HCC Model
2014 Model Revised Model
Segments Two Full Risk segments:
Institutional
Community
Seven Full Risk Segments
Institutional
Community: Full benefit dual
aged
Community: Full benefit dual
disabled
Community: Partial benefit
dual aged
Community: Partial benefit
dual disabled
Community: Non-dual aged
Community: Non-dual disabled
Dual status
for full risk
beneficiaries
identified in:
Base year Payment year

40
2014 Model Revised Model
Hierarchical
condition
categories
79 HCCs Same HCCs as 2014 model
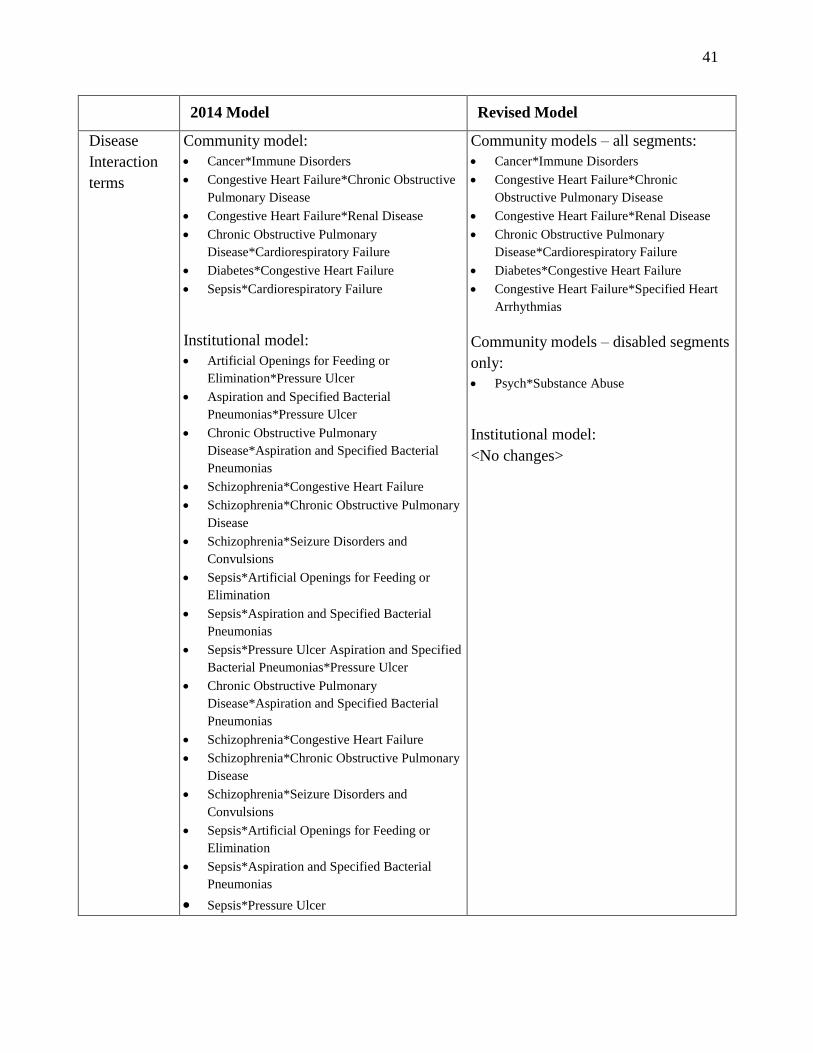
41
2014 Model Revised Model
Disease
Interaction
terms
Community model:
Cancer*Immune Disorders
Congestive Heart Failure*Chronic Obstructive
Pulmonary Disease
Congestive Heart Failure*Renal Disease
Chronic Obstructive Pulmonary
Disease*Cardiorespiratory Failure
Diabetes*Congestive Heart Failure
Sepsis*Cardiorespiratory Failure
Institutional model:
Artificial Openings for Feeding or
Elimination*Pressure Ulcer
Aspiration and Specified Bacterial
Pneumonias*Pressure Ulcer
Chronic Obstructive Pulmonary
Disease*Aspiration and Specified Bacterial
Pneumonias
Schizophrenia*Congestive Heart Failure
Schizophrenia*Chronic Obstructive Pulmonary
Disease
Schizophrenia*Seizure Disorders and
Convulsions
Sepsis*Artificial Openings for Feeding or
Elimination
Sepsis*Aspiration and Specified Bacterial
Pneumonias
Sepsis*Pressure Ulcer Aspiration and Specified
Bacterial Pneumonias*Pressure Ulcer
Chronic Obstructive Pulmonary
Disease*Aspiration and Specified Bacterial
Pneumonias
Schizophrenia*Congestive Heart Failure
Schizophrenia*Chronic Obstructive Pulmonary
Disease
Schizophrenia*Seizure Disorders and
Convulsions
Sepsis*Artificial Openings for Feeding or
Elimination
Sepsis*Aspiration and Specified Bacterial
Pneumonias
Sepsis*Pressure Ulcer
Community models – all segments:
Cancer*Immune Disorders
Congestive Heart Failure*Chronic
Obstructive Pulmonary Disease
Congestive Heart Failure*Renal Disease
Chronic Obstructive Pulmonary
Disease*Cardiorespiratory Failure
Diabetes*Congestive Heart Failure
Congestive Heart Failure*Specified Heart
Arrhythmias
Community models – disabled segments
only:
Psych*Substance Abuse
Institutional model:
<No changes>

42
Summary:
Our analyses indicate that the revised CMS-HCC model would improve predictive performance
for aged and disabled full benefit dual, partial benefit dual, and non-dual beneficiaries in the
community. The updated model results in more appropriate relative weights for the HCCs
because the relative weights reflect the disease and expenditure patterns of each of the six
community segments. For PY2017, we propose to apply this revised model to payment to
MAOs.
In light of comments submitted by PACE organizations, we have decided not to implement the
revised model HCC model with six community dual segments for PACE organizations for 2017,
but we will continue to study the feasibility and value of such a model for PACE for future
payment years. We propose to continue to use the same risk adjustment model for PACE
payments we have used from 2012 through 2016.
In Attachment V of this Notice, we provide draft relative factors for each HCC in each segment
of the aged-disabled model. Table 1 in Attachment V provides the draft factors of the community
and institutional segments of the CMS-HCC model. Table 2 provides the new enrollee risk
scores. Table 3 provides the C-SNP new enrollee risk scores. Table 4 provides the hierarchies for
the HCCs.
Section I. Medicare Advantage Coding Pattern Adjustment
For 2017, CMS proposes to update the MA coding adjustment factor to the statutory minimum of
5.66 percent. In order to properly pay health plans that enroll sicker-than-average beneficiaries,
CMS adjusts payments to MAOs for the relative risk of their enrolled population. CMS uses
claims data from FFS to estimate the risk adjustment model and applies this model to diagnostic
data submitted by MAOs. While this approach is a significant improvement over previous risk
adjustment methodologies (which relied largely on demographic data), it can result in higher
payments for the same levels of risk when MAOs submit diagnoses more comprehensively than
is done in FFS. The higher level of reported diagnoses can arise for a variety of reasons
including plans seeking to better understand the health status of their enrollees so they can
provide better care to plans reporting more diagnoses for enrollees to generate higher revenue.
While the motivation behind the higher level of reported diagnoses can vary, the effect on the
risk adjustment model is the same. That is, higher levels of diagnostic documentation generally
lead to higher payments than would be the case if MAOs coded like FFS providers.
CMS has engaged in two bodies of work to correct for this. First, risk adjustment data validation,
also known as RADV reviews diagnoses for a sample of enrollees at selected plans to identify
diagnoses that are unsupported by the medical record.

43
Second, at the direction of Congress, each year CMS implements an across-the-board adjustment
to offset the effects of higher levels of coding intensity in MA. For 2017, this statutorily-
required offset will be 5.66 percent.
As enrollment in Medicare Advantage grows, the imperative for CMS to adjust payments
appropriately in response to greater coding intensity will grow. MA coding has the potential to
threaten the solvency of the Hospital Insurance (HI) trust fund and lead to higher part B
premiums for all Medicare enrollees, not just Medicare Advantage enrollees. For example, a 1%
increase in MA risk scores due to differential coding for 2017 would increase government
payments to plans by about $2 billion. For this reason, CMS will continue to monitor coding
intensity closely and will utilize its authority to increase the coding intensity offset as
appropriate.
Section J. Normalization Factors
When we calibrate a risk adjustment model, we produce a fixed set of dollar coefficients
appropriate to the population and data for that calibration year. We set the average risk score to
1.0 in the denominator year. When the model with fixed coefficients is used to predict
expenditures for other years, average risk scores are no longer 1.0. Because average predicted
expenditures change after the model calibration year due to coding and population changes, CMS
applies a normalization factor to adjust beneficiaries’ risk scores so that the average risk score in
FFS is held to 1.0 in subsequent years.
The normalization factor is derived by first using the risk model to be used in the payment year
to calculate risk scores over a number of historical years. We then fit a trend line to the risk
scores. For the 2016 payment year, CMS applied a quadratic functional form to the historical risk
scores; this functional form better reflected more recent changes in the population trends. For the
2017 payment year, we propose to again use a quadratic functional form and to apply that
functional form to the updated set of historical risk scores. We will use 2012 through 2015 risk
scores to calculate the normalization factor for the CMS-HCC model, PACE model, ESRD
Dialysis model, and Functioning Graft model. The preliminary normalization factors and annual
trends for each of these models are shown below in J1 through J3.
We will use 2011 through 2014 risk scores to calculate the normalization factor for the RxHCC
model; these factors and annual trends are shown in J4. The final normalization factors will be
published in the final 2017 Announcement, to be released April 4, 2016.
The formula used to calculate each normalization factor is as follows:
Factor = b0 + (b1 × Y) + (b2 × Y2), where Y = the year

44
We provide the historical risk scores used to calculate each normalization factor in the sections
below. Using this formula, the normalization factor is calculated as the projected average risk
score for PY 2017.
J1. Normalization for the CMS-HCC Model
The preliminary 2017 normalization factor for the model implemented in 2017 is: 0.993.
The Part C normalization factor for the CMS-HCC risk adjustment models is applied to the
following risk scores: community non-dual aged, community non-dual disabled, community full
benefit dual aged, community full benefit dual disabled, community partial benefit dual aged,
community partial benefit dual disabled, institutional aged/disabled, aged/disabled new enrollee,
and C-SNP new enrollee. The trend is calculated on the population of FFS beneficiaries.
The risk scores used to calculate the preliminary annual trend for the CMS-HCC model are:
2012: 0.9806
2013: 0.9787
2014: 0.9822
2015: 0.9832
J2. Normalization Factor for the PACE Model
The preliminary 2017 normalization factor for the CMS-HCC risk adjustment model used for the
PACE program is 1.067.
The normalization factor for the CMS-HCC model used for PACE is applied to the following
risk scores: aged/disabled community, aged/disabled institutional, and aged/disabled new
enrollee. The trend is calculated on the population of FFS beneficiaries.
The risk scores used to calculate the preliminary annual trend for the PACE model are:
2012: 1.0424
2013: 1.0426
2014: 1.0480
2015: 1.0516
J3. Normalization Factor for the ESRD Dialysis Model
The preliminary 2017 normalization factor for the ESRD dialysis model is 1.017.
The normalization factor for the CMS-HCC ESRD model is applied to the following risk scores:
dialysis, dialysis new enrollee, and transplant. The trend is calculated on the population of FFS
beneficiaries.

45
The risk scores used to calculate the annual trend for the ESRD Dialysis model are:
2012: 0.9722
2013: 0.9739
2014: 0.9808
2015: 0.9891
J4. Normalization Factor for Functioning Graft Model
The preliminary 2017 normalization factor for the Functioning Graft segment of the ESRD risk
adjustment model is 1.067.
The normalization factor for the CMS-HCC functioning graft model is applied to the following
risk scores: functioning graft community, functioning graft institutional, and functioning graft
new enrollee. The trend is calculated on the population of FFS beneficiaries.
The risk scores used to calculate the annual trend for the CMS-HCC model are:
2012: 1.0424
2013: 1.0426
2014: 1.0480
2015: 1.0516
J5. Normalization Factor for the Rx Hierarchical Condition Category (RxHCC) Model
The preliminary 2017 normalization factor for the RxHCC model is 0.996. The normalization
factor for the RxHCC model is applied to all Part D risk scores for beneficiaries enrolled in a
Part D plan. The trend is calculated on the population of both FFS and MA beneficiaries.
The risk scores used to calculate the annual trend for the RxHCC model are:
2011: 0.9956
2012: 1.0018
2013: 0.9946
2014: 0.9999
Section K. Frailty Adjustment for PACE organizations and FIDE SNPs
Section 1894(d)(2) of the Act requires CMS to take into account the frailty of the PACE
population when making payments to PACE organizations, and Section 1853(a)(1)(B)(iv) allows
CMS to pay a frailty adjustment to Fully Integrated Dual Eligible (FIDE) Special Needs Plans
(SNPs) if the SNP has similar average levels of frailty to the PACE program. The frailty model
is used to explain costs that are not explained by diagnoses in the CMS-HCC model and is
updated whenever the CMS-HCC model is updated. Since CMS is proposing an updated CMS-
HCC model for 2017 MAOs, we have also updated the frailty factors for 2017 to be used to
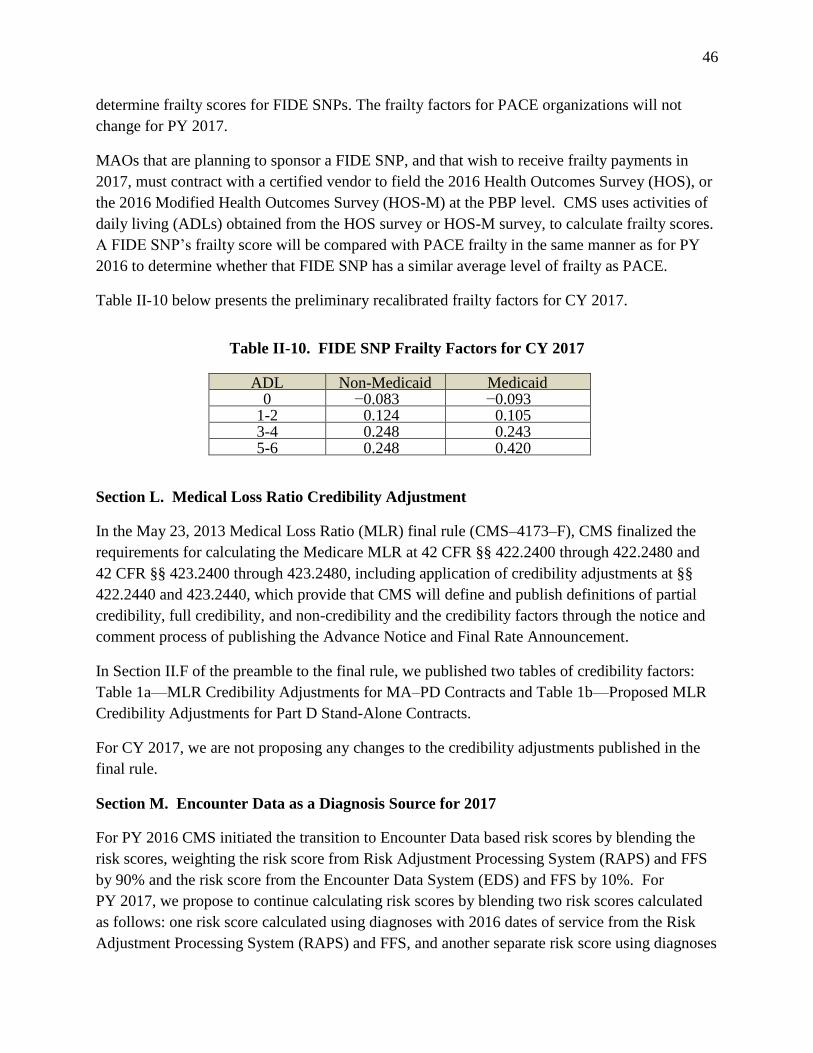
46
determine frailty scores for FIDE SNPs. The frailty factors for PACE organizations will not
change for PY 2017.
MAOs that are planning to sponsor a FIDE SNP, and that wish to receive frailty payments in
2017, must contract with a certified vendor to field the 2016 Health Outcomes Survey (HOS), or
the 2016 Modified Health Outcomes Survey (HOS-M) at the PBP level. CMS uses activities of
daily living (ADLs) obtained from the HOS survey or HOS-M survey, to calculate frailty scores.
A FIDE SNP’s frailty score will be compared with PACE frailty in the same manner as for PY
2016 to determine whether that FIDE SNP has a similar average level of frailty as PACE.
Table II-10 below presents the preliminary recalibrated frailty factors for CY 2017.
Table II-10. FIDE SNP Frailty Factors for CY 2017
ADL Non-Medicaid Medicaid 0 −0.083 −0.093
1-2 0.124 0.105 3-4 0.248 0.243 5-6 0.248 0.420
Section L. Medical Loss Ratio Credibility Adjustment
In the May 23, 2013 Medical Loss Ratio (MLR) final rule (CMS–4173–F), CMS finalized the
requirements for calculating the Medicare MLR at 42 CFR §§ 422.2400 through 422.2480 and
42 CFR §§ 423.2400 through 423.2480, including application of credibility adjustments at §§
422.2440 and 423.2440, which provide that CMS will define and publish definitions of partial
credibility, full credibility, and non-credibility and the credibility factors through the notice and
comment process of publishing the Advance Notice and Final Rate Announcement.
In Section II.F of the preamble to the final rule, we published two tables of credibility factors:
Table 1a—MLR Credibility Adjustments for MA–PD Contracts and Table 1b—Proposed MLR
Credibility Adjustments for Part D Stand-Alone Contracts.
For CY 2017, we are not proposing any changes to the credibility adjustments published in the
final rule.
Section M. Encounter Data as a Diagnosis Source for 2017
For PY 2016 CMS initiated the transition to Encounter Data based risk scores by blending the
risk scores, weighting the risk score from Risk Adjustment Processing System (RAPS) and FFS
by 90% and the risk score from the Encounter Data System (EDS) and FFS by 10%. For
PY 2017, we propose to continue calculating risk scores by blending two risk scores calculated
as follows: one risk score calculated using diagnoses with 2016 dates of service from the Risk
Adjustment Processing System (RAPS) and FFS, and another separate risk score using diagnoses

47
with dates of service from 2016 from the Encounter Data System (EDS) and FFS. We propose
to blend the two risk scores, weighting the risk score from RAPS and FFS by 50% and the risk
score from EDS and FFS by 50%. CMS has been working with plans since 2012 to assist in the
submissions of encounter data, and we will continue to do so. Our proposal for 2017 is a
reasonable progression toward ultimately relying exclusively on encounter data for plan-
submitted diagnosis information, particularly given that it will be the fifth year of the encounter
data initiative.
For PACE organizations, we propose to continue the same method of calculating risk scores as
used for the 2016 payment year, which is to pool diagnoses from the following sources to
calculate a single risk score (with no weighting): (1) EDS data valid for risk adjustment with
2016 dates of service; (2) RAPS data valid for risk adjustment with 2016 dates of service; and
(3) diagnoses from FFS claims valid for risk adjustment.

48
Attachment III. Changes in the Payment Methodology for Medicare Part D for CY 2017
Section A. Update of the RxHCC Model
For 2017, we are proposing to implement an updated version of the RxHCC risk adjustment
model used to adjust direct subsidy payments for Part D benefits offered by stand-alone
Prescription Drug Plans (PDPs) and Medicare Advantage-Prescription Drug Plans (MA-PDs).
The 2017 model will encompass the following changes:
1) Update to reflect the 2017 benefit structure; and,
2) Updates to the data years used to calibrate the model.
A1. Update to reflect the 2017 benefit structure
CMS recalibrated the RxHCC risk adjustment model to reflect the 2017 benefit structure. This
update involved making adjustments to the Prescription Drug Event (PDE) data from the
prediction year to approximate the 2017 benefit structure. The adjustments to the PDE data are
similar to those made in previous years’ model calibrations in that we incorporated the payment
year plan liability in the coverage gap. For 2017, plan liability for non-LIS beneficiaries in the
coverage gap will be 49 percent for non-applicable (generic) drugs and 10 percent plan liability
for applicable (brand) drugs in the coverage gap. In addition, we mapped all PDEs to the defined
standard benefit across all phases of the Part D benefit. All other things being equal, the increase
in plan liability as a result of the cost sharing reduction for non-applicable drugs and applicable
drugs will differentially affect the risk scores of LIS and non-LIS beneficiaries. This is because
plan liability for non-LIS populations, relative to LIS populations, will increase.
A2. Update to the data years used to calibrate the model
The model being used for PY 2016 is calibrated on 2012 diagnoses and 2013 expenditure data
from the PDE records. As part of this recalibration for 2017, we updated the underlying data,
using diagnosis data from 2013 fee-for-service (FFS) claims and MA-PD RAPS files, along with
2014 expenditure data from PDE records.
A3. Chronic Viral Hepatitis C RxHCC
Several medications to treat chronic Hepatitis C entered the market in 2013 and 2014. These
newly approved medications have high cure rates and are substantially more costly than
previously approved therapies. Due to the effectiveness of these new agents and the prevalence
of chronic Hepatitis C, the cost of these medications is having a significant impact in Medicare
Part D.
The PY 2016 RxHCC model was calibrated using diagnosis data from 2012 and expenditure data
from 2013. Therefore, the estimated coefficient for the RxHCC for chronic Hepatitis C did not
initially account for expenditures associated with treating patients with Hepatitis C with the new

49
medications. To capture the substantial cost of these medications that were expected in the
payment year, CMS applied an actuarial adjustment to the coefficient of the new chronic
Hepatitis C RxHCC. In the 2016 Advance Notice, CMS stated we would continue to monitor the
patterns of diagnosis and expenditures of chronic Hepatitis C medications. In addition, we noted
that the influx of these new medications in 2014 could result in an overestimated coefficient
when we calibrated the PY 2017 RxHCC model using 2013-2014 data. As a result, we
anticipated the need to apply a downward adjustment to the chronic Hepatitis C coefficient for
the 2017 payment year.
As part of recalibration of the RxHCC model on more recent data (2013-2014), we reviewed
patterns of chronic Hepatitis C medication utilization for beneficiaries with one of the chronic
Hepatitis C diagnoses that map to the payment model. Based on the diagnosis data from 2013
and PDEs from 2006 through 2015, a small percentage of beneficiaries with the chronic
Hepatitis C diagnosis received treatment for chronic Hepatitis C and a majority of treatment
occurred in either 2014 or 2015. The projected coefficient for chronic Hepatitis C RxHCC
reflects the costs of drug therapy in 2014 for beneficiaries with chronic Hepatitis C diagnosis in
the payment model of 2013. The relative factor for PY 2017 is lower than the PY 2016 relative
factor for several reasons, including: 1) the PY 2016 factor included an actuarial adjustment to
the coefficient based on an estimation of what plan liability would have been (assuming 100% of
beneficiaries were treated), had the recently approved chronic Hepatitis C medications existed in
2013, and 2) the PY 2017 factor reflects the actual percentage of beneficiaries treated for chronic
Hepatitis C in 2014. The diagnosis and utilization data suggests continued uncertainty regarding
the pattern of chronic Hepatitis C among Medicare beneficiaries and current expenditures
continue to reflect the influx of these medications onto the market. As a result, CMS is proposing
not to apply a downward adjustment to the coefficient for PY 2017.
Similar to other CMS-HCC risk adjustment models, the RxHCC model is prospective; in other
words, we use historical data to predict future costs. Our objective using a prospective model is
to identify chronic, predictable conditions, not acute events. Thus, the Part D risk adjustment
model is not designed to predict the costs based on diseases that are primarily diagnosed, treated
and cured in the same year. CMS recognizes that chronic Hepatitis C treatment over the next few
years presents a unique situation. Given the clinical ramifications, as well as the continued
uncertainty regarding the future pattern of diagnosis and utilization, CMS will continue to
closely observe the pattern of the diagnosis and treatment of chronic Hepatitis C.
A4. Recalibration
To recalibrate the model for payment year 2017, diagnoses from FFS and MA-PD beneficiaries
enrolled in a Part D plan were used; 2013 diagnoses were used to predict 2014 expenditures. To
be included in the model estimation sample, beneficiaries must be: (1) FFS or Medicare
Advantage (MA-PD or MA-only) for all 12 months of the base year (2013); and (2) enrolled in
a PDP or an MA-PD for at least one month in the payment year (2014).

50
Coefficients for condition categories were estimated by regressing the plan liability, adjusted as
discussed above, for the Part D basic benefit for each beneficiary onto their demographic factors
and condition categories, as indicated by their diagnoses. Resulting dollar coefficients represent
the marginal (additional) cost of the condition or demographic factor (for example, age/sex
group, low income subsidy status, disability status). Changes in the coefficients for each
condition category are the result of the extent to which each category predicts plan liability for
Medicare Part D benefits.
In order to use the risk adjustment model to calculate risk scores for payment, we created relative
factors for each demographic factor and RxHCC in the model. The relative factors were used to
calculate risk scores for individual beneficiaries, which will average 1.0 in the denominator year.
We created relative factors by dividing all the dollar coefficients by the average per capita
predicted expenditure for a specific year. The denominator for the revised RxHCC risk
adjustment model was developed by using data from Medicare beneficiaries enrolled in both
MA-PDs and PDPs. We do this in order to set the average RxHCC risk score to 1.0 for the
enrolled Part D population. We used a denominator of average per capita cost for 2014 to create
the relative factors for the model. The denominator, which is used to create relative factors for all
segments of the model, is $1,014.31.
In a final step, hierarchies were imposed on the condition categories, ensuring that more
advanced and costly forms of a condition are reflected in a higher coefficient.
When recalibrating a model based on more recent data, differences between the current model
and the revised model will occur for several reasons. Changes in the marginal cost attributable to
an RxHCC and relative to changes in the average cost can alter the relative factor associated with
that RxHCC. Recalibration of the RxHCC model can result in changes in risk scores for
individual beneficiaries and for plan average risk scores, depending on each individual
beneficiary’s combination of diagnoses.
In Attachment V of this Notice, we provide draft factors for each RxHCC for each segment of
the model.
Section B. Encounter Data as a Diagnosis Source for 2017
For PY 2016 CMS initiated the transition to Encounter Data based risk scores by blending the
risk scores, weighting the risk score from Risk Adjustment Processing System (RAPS) and FFS
by 90% and the risk score from the Encounter Data System (EDS) and FFS by 10%. For PY
2017, we propose to continue calculating risk scores by blending two risk scores calculated as
follows: one risk score calculated using diagnoses with dates of service of 2016 from the Risk
Adjustment Processing System (RAPS) and FFS and another separate risk score using diagnoses
with 2016 dates of service from the Encounter Data System (EDS) and FFS. We will blend the
two risk scores, weighting the risk score from RAPS and FFS by 50% and the risk score from

51
EDS and FFS by 50%. CMS has been working with plans since 2012 to assist in the
submissions of encounter data, and we will continue to do so. We believe that our proposal for
2017 is a reasonable progression toward ultimately relying exclusively on encounter data for
plan-submitted diagnosis information, particularly given that it will be the fifth year of the
encounter data initiative.
For PACE organizations, we propose to continue the same method of calculating risk scores as
used for the 2016 payment year, which is to pool diagnoses from the following sources to
calculate a single risk score (with no weighting): (1) EDS data valid for risk adjustment with
2016 dates of service; (2) RAPS data valid for risk adjustment with 2016 dates of service; and
(3) diagnoses from FFS claims valid for risk adjustment.
Section C. Part D Risk Sharing
The risk sharing payments provided by CMS limit Part D sponsors’ exposure to unexpected drug
expenses. Pursuant to section 1860D-15(e)(3)(C) of the Act and the regulations at 42 CFR
423.336 (a)(2)(ii), CMS may establish a risk corridor with higher threshold risk percentages for
Part D risk sharing beginning in contract year 2012. Widening the risk corridor would increase
the risk associated with providing the Part D benefit and reduce the risk sharing amounts
provided (or recouped) by CMS. While CMS may widen the risk corridors, the statute does not
permit CMS to narrow the corridors relative to the 2011 thresholds.
CMS has evaluated the risk sharing amounts for 2007 – 2014 to assess whether they have
decreased or stabilized. A steady decline or stabilization in the Part D risk sharing amounts
would suggest that Part D sponsors have significantly improved their ability to predict Part D
expenditures. However, CMS has found that risk sharing amounts continue to vary significantly
in aggregate from year to year and among Part D sponsors in any given year. Therefore, we do
not believe it is appropriate to adjust the parameters at this time, and we will apply no changes to
the current threshold risk percentages for contract year 2017. We will continue to evaluate the
risk sharing amounts each year to determine if wider corridors should be applied for Part D risk
sharing.
Thus, the risk percentages and payment adjustments for Part D risk sharing are unchanged from
contract year 2016. The risk percentages for the first and second thresholds remain at 5 percent
and 10 percent of the target amount, respectively, for 2017. The payment adjustments for the
first and second corridors are 50 percent and 80 percent, respectively. Figure 1 below illustrates
the risk corridors for 2017.

52
Figure 1. Part D Risk Corridors for 2017
+ 5%
+ 10%
- 10%
- 5%
Plan Pays 100%
Plan Keeps 100%
Government
Pays 50%
Plan Pays
50%
Government
Pays 80%
Plan Pays
20%
Plan Keeps
50%
Government
Recoups 50%
Government
Recoups 80%
Plan Keeps
20%
Target Amount
C1. Risk sharing when a plan’s adjusted allowable risk corridor costs (AARCC) exceed
the target amount
For the portion of a plan’s adjusted allowable risk corridor costs (AARCC) that is between the
target amount and the first threshold upper limit (105 percent of the target amount), the Part D
sponsor pays 100 percent of this amount. For the portion of the plan’s AARCC that is between
the first threshold upper limit and the second threshold upper limit (110 percent of the target
amount), the government pays 50 percent and the plan pays 50 percent. For the portion of the
plan’s AARCC that exceeds the second threshold upper limit, the government pays 80 percent
and the plan pays 20 percent.
Example: If a plan’s AARCC is $120 and its target amount is $100, the Part D sponsor and the
government cover $9.50 and $10.50, respectively, of the $20 in unanticipated costs. The
sponsor’s responsibility is calculated as follows:
100% of ($105 − $100) + 50% of ($110 − $105) + 20% of ($120 − $110).
53
C2. Risk sharing when a plan’s adjusted allowable risk corridor costs (AARCC) are below
the target amount
If a plan’s AARCC is between the target amount and the first threshold lower limit (95 percent
of the target amount), the plan keeps 100 percent of the difference between the target amount and
the plan’s AARCC. If a plan’s AARCC is between the first threshold lower limit and the second
threshold lower limit (90 percent of the target amount), the government recoups 50 percent of the
difference between the first threshold lower limit and the plan’s AARCC. The plan would keep
50 percent of the difference between the first threshold lower limit and the plan’s AARCC as
well as 100 percent of the difference between the target amount and first threshold lower limit.
If a plan’s AARCC is less than the second threshold lower limit, the government recoups 80
percent of the difference between the plan’s AARCC and the second threshold lower limit as
well as 50 percent of the difference between the first and second threshold lower limits. In this
case, the plan would keep 20 percent of the difference between the plan’s AARCC and the
second threshold lower limit, 50 percent of the difference between the first and second threshold
lower limits, and 100 percent of the difference between the target amount and the first threshold
lower limit.
Example: If a plan’s AARCC is $80 and its target amount is $100, the Part D sponsor keeps
$9.50 while the government recoups $10.50 of the $20 in unexpected savings generated. The
sponsor’s share is calculated as follows:
100% of ($100 − $95) + 50% of ($95 − $90) + 20% of ($90 − $80).
Section D. Medicare Part D Benefit Parameters: Annual Adjustments for Defined
Standard Benefit in 2017
In accordance with section 1860D-2(b) of the Act, CMS must update the statutory parameters for
the defined standard Part D prescription drug benefit each year. As required by statute, the
following Part D benefit parameters are updated using the annual percentage increase in average
expenditures for Part D drugs per eligible beneficiary (“Annual Percentage Increase” or API):
the deductible, initial coverage limit, and out-of-pocket threshold11 for the defined
standard benefit;
minimum copayments for costs above the annual out-of-pocket threshold;
maximum copayments below the out-of-pocket threshold for certain low-income full
subsidy eligible enrollees;
the deductible for partial low-income subsidy (LIS) eligible enrollees; and
11 According to section 1860D-2(b)(4)(B)(i)(IV), for years 2016 through 2019, the out-of-pocket threshold is
updated from the previous year by the lesser of the API or two percentage points plus the annual percentage increase
in the consumer price index.

54
maximum copayments above the out-of-pocket threshold for partial LIS eligible
enrollees.
The remaining parameters are indexed to the annual percentage increase in the Consumer Price
Index (CPI) (all items, U.S. city average). Accordingly, the actuarial value of the drug benefit
changes along with any change in Part D drug expenses, and the defined standard Part D benefit
continues to cover a constant share of Part D drug expenses from year to year.
D1. Annual Percentage Increase in Average Expenditures for Part D Drugs
The benefit parameters indexed to the API will be increased by 11.75% for 2017, as summarized
by Table III-1 below. This increase reflects the 2016 annual percentage trend of 6.99% as well
as a multiplicative update of 4.45% for prior year revisions. Please see Attachment IV for
additional information on the calculation of the annual percentage increase.
Per 42 CFR 423.886(b)(3), the cost threshold and cost limit for qualified retiree prescription drug
plans are also indexed to the API. Thus, the cost threshold and cost limit for qualified retiree
prescription drug plans will be increased by 11.75% from their 2016 values.
D2. Annual Percentage Increase in Consumer Price Index
Section 1860D-14(a)(4) of the Act requires CMS to use the annual percentage increase in the
CPI for the 12 month period ending in September 2016 to update the maximum copayments up
to the out-of-pocket threshold for full benefit dual eligible enrollees with incomes not exceeding
100 percent of the Federal poverty line for 2017. These maximum copayments will be increased
by 0.18% for 2017 as summarized in Table III-1 below.
This increase reflects the 2016 annual percentage trend in CPI of 1.67% as well as a
multiplicative update of −1.46% for prior year revisions.
Additionally, section 1860D-2(b)(4) of the Act requires that the out-of-pocket threshold for
contract years 2016 through 2019 be updated from the previous year by the lesser of (1) the API
or (2) two percentage points plus the annual percentage increase in CPI. The change in CPI in
this case is measured over the 12-month period ending in July of the previous year, as required
by statute. The cumulative annual percentage increase in CPI for 2016 as of July 2016 is
−0.15%. This figure reflects the 2016 annual percentage increase in CPI of 1.13% as well as a
multiplicative update of −1.26% for prior year revisions. This value plus two percentage points
is less than the 11.75% cumulative API described above. Thus, the out-of-pocket threshold will
be increased by 1.85% for 2017.
Please see Attachment IV for additional information on the calculation of the annual percentage
increase in the CPI.

55
D3. Determining Total Covered Part D Spending at Out-of-Pocket Threshold
Each year, CMS releases the Total Covered Part D Spending at the Out-of-Pocket Threshold,
which is the amount of total drug spending, regardless of payer, required to reach the out-of-
pocket threshold in the defined standard benefit. Due to reductions in beneficiary cost sharing
for drugs in the coverage gap phase for applicable (i.e., non-LIS) beneficiaries per section
1860D-2 of the Act, the total covered Part D spending may be different for applicable and non-
applicable (i.e., LIS) beneficiaries. Therefore, CMS is releasing the two values described below:
Total Covered Part D Spending at Out-of-Pocket Threshold for Non-Applicable
Beneficiaries. This is the amount of total drug spending for a non-applicable (i.e., LIS)
beneficiary to reach the out-of-pocket threshold in the defined standard benefit. If the
beneficiary has additional prescription drug coverage through a group health plan,
insurance, government-funded health program or similar third party arrangement, this
amount may be higher. This amount is calculated based on 100% cost sharing in the
deductible and coverage gap phases and 25% in the initial coverage phase.
Estimated Total Covered Part D Spending at Out-of-Pocket Threshold for Applicable
Beneficiaries. This is an estimate of the average amount of total drug spending for an
applicable (i.e., non-LIS) beneficiary to reach the out-of-pocket threshold in the defined
standard benefit. If the beneficiary has additional prescription drug coverage through a
group health plan, insurance, government-funded health program or similar third party
arrangement, this amount may be higher. This amount is estimated based on 100%
beneficiary cost sharing in the deductible phase, 25% in the initial coverage phase, and in
the coverage gap, 51% cost sharing for non-applicable (generic) drugs and 90% for
applicable (brand) drugs. Please see Attachment IV for additional information on the
calculation of the estimated total covered Part D spending for applicable beneficiaries.
The values can be found in Table III-1 below.
Enhanced alternative coverage plans must use these values when mapping their enhanced
alternative benefit to the defined standard benefit, as the Total Covered Part D Spending at the
Out-of-Pocket Threshold is necessary to calculate the covered plan paid (CPP) amounts reported
on the prescription drug event (PDE) records.

56
Table III-1. Updated Part D Benefit Parameters for Defined Standard Benefit, Low-
Income Subsidy, and Retiree Drug Subsidy
Annual Percentage Increases
Annual
percentage
trend for
2016
Prior
year
revisions
Annual
percentage
increase
for 2017
API: Applied to all parameters but (1) and (2) 6.99% 4.45% 11.75%
July CPI (all items, U.S. city average): Applied to (1)
September CPI (all items, U.S. city average): Applied to (2)
1.13%
1.67%
−1.26%
−1.46%
−0.15%
0.18%
Part D Benefit Parameters
2016 2017
Standard Benefit
Deductible $360 $400
Initial Coverage Limit $3,310 $3,700
Out-of-Pocket Threshold $4,850 $4,950
Total Covered Part D Spending at Out-of-Pocket Threshold for Non-
Applicable Beneficiaries (3) $7,062.50 $7,425.00
Estimated Total Covered Part D Spending for Applicable Beneficiaries (4) $7,515.22 $8,071.16
Minimum Cost-Sharing in Catastrophic Coverage Portion of the Benefit
Generic/Preferred Multi-Source Drug $2.95 $3.30
Other $7.40 $8.25
Full Subsidy-Full Benefit Dual Eligible (FBDE) Individuals (6)
Deductible $0.00 $0.00
Copayments for Institutionalized Beneficiaries (category code 3) $0.00 $0.00
Copayments for Beneficiaries Receiving Home and Community-Based
Services (5) (category code 3) $0.00 $0.00
Maximum Copayments for Non-Institutionalized Beneficiaries
Up to or at 100% FPL (category code 2)
Up to Out-of-Pocket Threshold (1)
Generic/Preferred Multi-Source Drug (6) $1.20 $1.20
Other (6) $3.60 $3.70
Above Out-of-Pocket Threshold $0.00 $0.00
Over 100% FPL (category code 1)
Up to Out-of-Pocket Threshold
Generic/Preferred Multi-Source Drug $2.95 $3.30
Other $7.40 $8.25
Above Out-of-Pocket Threshold $0.00 $0.00
Full Subsidy-Non-FBDE Individuals

57
2016 2017
Applied or eligible for QMB/SLMB/QI or SSI and income at or below
135% FPL and resources ≤ $8,780 (individuals) or ≤ $13,930 (couples)
(7) (category code 1)
Deductible $0.00 $0.00
Maximum Copayments up to Out-of-Pocket Threshold
Generic/Preferred Multi-Source Drug $2.95 $3.30
Other $7.40 $8.25
Maximum Copayments above Out-of-Pocket Threshold $0.00 $0.00
Partial Subsidy
Applied and income below 150% FPL and resources below $13,640
(individual) or $27,250 (couples) (7) (category code 4)
Deductible (6) $74.00 $82.00
Coinsurance up to Out-of-Pocket Threshold 15% 15%
Maximum Copayments above Out-of-Pocket Threshold
Generic/Preferred Multi-Source Drug $2.95 $3.30
Other $7.40 $8.25
Retiree Drug Subsidy Amounts
Cost Threshold $360 $400
Cost Limit $7,400 $8,250
(1) Pursuant to section 1860D-2(b)(4)(B)(i)(IV) of the Act, for each of years 2016 through 2019, the Out-of-Pocket Threshold increase is the
lesser of the annual percentage increase or the July CPI plus two percentage points.
(2) September CPI adjustment applies to copayments for non-institutionalized beneficiaries up to or at 100% FPL.
(3) For beneficiaries who are not considered an “applicable beneficiary” as defined at section 1860D-14A(g)(1) and are not eligible for the
coverage gap program, this is the amount of total drug spending required to reach the out-of-pocket threshold in the defined standard benefit.
Enhanced alternative plans must use this value when mapping enhanced alternative plans to the defined standard benefit for the purpose of
calculating covered plan paid amounts (CPP) reported on prescription drug event (PDE) records.
(4) For beneficiaries who are considered an "applicable beneficiary" as defined at section 1860D-14A(g)(1) and are eligible for the coverage
gap discount program, this is the estimated average amount of total drug spending required to reach the out-of-pocket threshold in the
defined standard benefit. Enhanced alternative plans must use this value when mapping enhanced alternative plans to the defined standard
benefit for the purpose of calculating covered plan paid amounts (CPP) reported on prescription drug event (PDE) records.
(5) Per section 1860D-14(a)(1)(D)(i) of the Act, full-benefit dual eligibles who would be institutionalized individuals (or couple) if the
individual (couple) was not receiving home and community-based services qualify for zero cost-sharing.
(6) The increases to the LIS deductible, generic/preferred multi-source drugs and other drugs copayments are applied to the unrounded 2016
values of $73.79, $1.21, and $3.64, respectively.
(7) These resource limit figures will be updated for contract year 2017.

58
Section E. Reduced Coinsurance for Applicable Beneficiaries in the Coverage Gap
The Affordable Care Act phases in a reduction in beneficiary cost sharing for drugs in the
coverage gap phase of the Medicare Part D benefit. This gradual reduction in cost sharing began
in CY 2011 and continues through CY 2020, ultimately resulting in 75 percent cost sharing for
applicable drugs, prior to the application of the 50 percent manufacturer discounts required by
the ACA, and 25% cost sharing for other covered Part D drugs (non-applicable drugs).
Applicable drugs are defined at section 1860D-14A(g)(2) of the Act and are generally covered
Part D brand drugs that are either approved under a new drug application (NDA) under section
505(b) of the Federal Food, Drug, and Cosmetic Act or, in the case of a biologic, licensed under
section 351 of the Public Health Service Act (BLA). Non-applicable drugs are covered Part D
drugs that do not meet the definition of an applicable drug (i.e., generic drugs). The reductions
in cost sharing, in conjunction with the coverage gap discount program, will serve to effectively
close the Medicare Part D benefit coverage gap for non-LIS beneficiaries by CY 2020.
In 2017, the beneficiary coinsurance under basic prescription drug coverage is reduced to 51
percent for non-applicable covered Part D drugs purchased during the coverage gap phase of the
Part D benefit. After having applied the 50 percent manufacturer discount, the beneficiary
coinsurance under basic prescription drug coverage is reduced to 40 percent for applicable
covered Part D drugs purchased during the coverage gap phase of the Part D benefit in 2017.
To be eligible for reduced cost sharing, a Part D enrollee must have incurred gross covered drug
costs above the initial coverage limit but true out-of-pocket costs (TrOOP) below the out-of-
pocket threshold. Moreover, Medicare beneficiaries enrolled in a qualified retiree prescription
drug plan or those entitled to the low-income subsidy are not eligible for this reduced cost
sharing.
As beneficiary liability for covered Part D drug costs in the coverage gap decreases, plan liability
increases. Therefore, we further specify that the increased plan liability amounts do not count
toward TrOOP. Part D sponsors must account for the reductions in cost sharing and increased
plan liability when developing their Part D bids for payment year 2017.
Section F. Dispensing Fees and Vaccine Administration Fees for Applicable Drugs in the
Coverage Gap
As described in the previous section, the Affordable Care Act phases in a reduction in
beneficiary cost sharing for drugs in the coverage gap phase of the Medicare Part D benefit.
Consistent with our policy on liability for dispensing and vaccine administration fees, as
described in the Announcement of Calendar Year (CY) 2013 Medicare Advantage Capitation
Rates and Medicare Advantage and Part D Payment Policies and Final Call Letter, applicable
beneficiaries will pay a portion of the dispensing fee (and vaccine administration fee, if any) that
is commensurate with their coinsurance in the coverage gap. The Part D sponsor will pay the
remainder of the dispensing fee (and vaccine administration fee, if any). In 2017, applicable

59
beneficiaries will pay 40 percent and plans will pay 60 percent of dispensing fees and vaccine
administration fees for applicable drugs in the coverage gap.
Section G. Part D Calendar Year Employer Group Waiver Plans
For the first two years Part D was in effect, Calendar Year Employer Group Waiver Plans (CY
EGWPs) submitted bids for Part D coverage to CMS. In early 2007, CMS decided to waive the
Part D bid submission requirement for EGWPs beginning with payment year (PY) 200812. CMS
modified several payment methodologies and operations to accommodate bids not being
submitted as a result of the waiver. For EGWPs offering Part D13, the payment methodology
was changed as follows: (1) monthly Part D risk adjusted direct subsidy payments are based on
the Part D national average bid14; (2) monthly low-income premium subsidy (LIPS) payments
are based on the national Base Beneficiary Premium15; (3) reinsurance payments are paid
retrospectively during reconciliation with no prospective amounts paid monthly16; (4) LICS
payment amounts are paid retrospectively during reconciliation with no prospective amounts
paid monthly17; and (5) risk sharing payments are not available18.
The rationale articulated for the bid waiver was that waiving the requirement to submit Part D
bids would increase the number of plans for employers and unions seeking to retain coverage for
their Medicare eligible retirees by avoiding the cost and administrative burden of submitting
bids. At that time, CMS also believed that reinsurance payments to EGWP sponsors would
continue to be relatively small since most employers/unions would be providing enhanced drug
coverage through supplemental arrangements, resulting in the majority of these beneficiaries not
reaching catastrophic benefit phase. The determination to pay reinsurance retrospectively was
due in part to the fact that EGWPs were no longer able to provide an estimate of their per capita
reinsurance costs in the course of bidding, which is what CMS uses to provide non-EGWP Part
D sponsors with monthly prospective reinsurance payments throughout a payment year.
With the recent trend in specialty drug costs, however, catastrophic drug costs for EGWP
sponsors have increased significantly and will likely continue to do so in the future. In light of
the concerns about catastrophic costs and their impact on EGWPs in the Part D program, we
12 42 CFR 423.265(b) (Requirement to submit a bid) waived 13 These are the rules that apply to CY EGWPs – non-CY EGWPs do not receive reinsurance payments at
all. 14 42 CFR 423.329(a)(1) (Basis of the risk adjusted direct subsidy) waiver to modify rule 15 42 CFR 423.800(b) (Administration of low-income premium subsidy (LIPS) payments) waiver to
modify rule 16 42 CFR 423.329(c) (Catastrophic reinsurance payment methodology) waiver to modify rule 17 42 CFR 423.329(d)(2)(i) (Prospective LIS cost-sharing payments) waiver to modify rule 18 42 CFR 423.336 (Risk corridor payments) waived
60
propose a modification of the current waiver. Under the modified waiver, beginning in 2017 we
would pay prospective reinsurance to CY EGWPs based on a CMS calculated methodology.
CMS has authority under Sections 1857(i) and 1866D-22(b) of the Social Security Act to waive
or modify requirements that hinder the design of, the offering of, or enrollment in Part D plans
that combine the Part D benefit with supplemental drug coverage offered by an employer.
EGWP plans are either administered by insurance companies (“800-series EGWPs”) or by
employers or unions (Direct Contract EGWPs). Current regulations detailing the manner by
which plans are to be paid reinsurance, are “based on a method that CMS determines” and for
prospective payments made during the coverage year, CMS is to “establish a payment method by
which payments of amounts under this section are made on a monthly basis during the year
based on either estimated or incurred allowable reinsurance costs” per 42 CFR 423.329(c).
For 2017, CMS is proposing to make prospective reinsurance payments to all CY EGWPs based
on the average per member per month (PMPM) actual reinsurance amounts paid to CY EGWPs
for 2014. The 2014 reconciliation data is the most current actual total reinsurance amount
available for publication in the 2017 Advance Notice/Rate Announcement. CMS is proposing
this methodology as it is based on the most currently available actual CY EGWP experience.
The average PMPM reinsurance amount paid to CY EGWPs for 2014 reconciliation was $26.50.
This proposal will apply to all CY EGWPs. CMS is not proposing to change the current policy
of not paying reinsurance payments to non-calendar year EGWPs. CMS seeks comments on this
proposal.

61
Attachment IV. Medicare Part D Benefit Parameters for the Defined Standard Benefit:
Annual Adjustments for 2017
The Medicare Prescription Drug, Improvement, and Modernization Act of 2003 (MMA) directs
CMS to update the statutory parameters for the defined standard Part D drug benefit each year.
These parameters include the standard deductible, initial coverage limit, catastrophic coverage
threshold, and minimum copayments for costs above the annual out-of-pocket threshold. In
addition, CMS is statutorily required to update the parameters for the low income subsidy benefit
and the cost threshold and cost limit for qualified retiree prescription drug plans eligible for the
Retiree Drug Subsidy. Included in this notice are (1) the methodologies for updating these
parameters, (2) the updated parameter amounts for the Part D defined standard benefit and low-
income subsidy benefit for 2017, and (3) the updated cost threshold and cost limit for qualified
retiree prescription drug plans.
All of the Part D benefit parameters are updated using one of two indexing methods specified by
statute:
(i) the annual percentage increase in average expenditures for Part D drugs per eligible
beneficiary (API); or
(ii) the annual percentage increase in the Consumer Price Index (CPI) (all items, U.S. city
average).
Accordingly, the actuarial value of the drug benefit increases along with any increase in drug
expenses, and the defined standard Part D benefit continues to cover a constant share of drug
expenses from year to year.
Section A. Annual Percentage Increase in Average Expenditures for Part D Drugs per
Eligible Beneficiary (API)
Section 1860D-2(b)(6) of the Act defines the API as “the annual percentage increase in average
per capita aggregate expenditures for covered Part D drugs in the United States for Part D
eligible individuals, as determined by the Secretary for the 12-month period ending in July of the
previous year using such methods as the Secretary shall specify.” The following parameters are
updated using the “annual percentage increase”:
Deductible: From $360 in 2016 and rounded to the nearest multiple of $5.
Initial Coverage Limit: From $3,310 in 2016 and rounded to the nearest multiple of $10.
Minimum Cost-Sharing in the Catastrophic Coverage Portion of the Benefit: From $2.95
per generic or preferred drug that is a multi-source drug, and $7.40 for all other drugs in 2016,
and rounded to the nearest multiple of $0.05.

62
Maximum Copayments up to the Out-of-Pocket Threshold for Certain Low Income Full
Subsidy Eligible Enrollees: From $2.95 per generic or preferred drug that is a multi-source
drug, and $7.40 for all other drugs in 2016, and rounded to the nearest multiple of $0.05.
Deductible for Low Income (Partial) Subsidy Eligible Enrollees: From $7419 in 2016 and
rounded to the nearest $1.
Maximum Copayments above the Out-of-Pocket Threshold for Low Income (Partial)
Subsidy Eligible Enrollees: From $2.95 per generic or preferred drug that is a multi-source
drug, and $7.40 for all other drugs in 2016, and rounded to the nearest multiple of $0.05.
Section B. Annual Percentage Increase in Consumer Price Index (CPI)
Section 1860D-14(a)(4) of the Act specifies that the annual percentage increase in the CPI, All
Urban Consumers (all items, U.S. city average) as of September of the previous year is used to
update the maximum copayments up to the out-of-pocket threshold for full benefit dual eligible
enrollees with incomes not exceeding 100 percent of the Federal poverty line. These
copayments are increased from $1.20 per generic or preferred drug that is a multi-source drug,
and $3.60 for all other drugs in 201620, and rounded to the nearest multiple of $0.05 and $0.10,
respectively.
Additionally, section 1860D-2(b)(4) of the Act requires that the “annual percentage increase”
applied to the out-of-pocket threshold in 2017 is CPI+2%, which is the lesser of API and
CPI+2%. The change in CPI in this case is measured over the 12-month period ending in July of
the previous year, as required by statute. The threshold is increased from $4,850 in 2016 and
rounded to the nearest multiple of $50.
Section C. Calculation Methodology
Annual Percentage Increase in Average Expenditures for Part D Drugs per Eligible
Beneficiary (API)
For contract years 2007 and 2008, the APIs, as defined in section 1860D-2(b)(6) of the Act, were
based on the National Health Expenditure (NHE) prescription drug per capita estimates because
sufficient Part D program data was not available. Beginning with contract year 2009, the APIs
19 Consistent with the statutory requirements of 1860D-14(a)(4)(B) of the Act, the update for the
deductible for low income (partial) subsidy eligible enrollees is applied to the unrounded 2016
value of $73.79. 20 Consistent with the statutory requirements of 1860D-14(a)(4)(A) of the Act, the copayments
are increased from the unrounded 2016 values of $1.21per generic or preferred drug that is a
multi-source drug, and $3.64 for all other drugs.

63
are based on Part D program data. For the 2017 contract year benefit parameters, Part D
program data is used to calculate the annual percentage trend as follows:
𝐴𝑢𝑔𝑢𝑠𝑡 2015– 𝐽𝑢𝑙𝑦 2016
𝐴𝑢𝑔𝑢𝑠𝑡 2014– 𝐽𝑢𝑙𝑦 2015=
$3,615.90
$3,379.72= 1.0699
In the formula, the average per capita cost for August 2014 – July 2015 ($3,379.72) is calculated
from actual Part D prescription drug event (PDE) data and the average per capita cost for August
2015 – July 2016 ($3,615.90) is calculated based on actual Part D PDE data incurred from
August 2015 – December 2015 and projected through July 2016.
The 2017 benefit parameters reflect the 2016 annual percentage trend as well as an update for
revision to prior year estimates for API. Based on updated NHE prescription drug per capita
costs and PDE data, the annual percentage increases are now estimated as summarized by Table
IV-1.
Table IV-1. Revised Prior Years’ Annual Percentage Increases
Year Prior Estimates of
Annual Percentage
Increases
Revised Annual
Percentage
Increases
2007 7.30% 7.30%
2008 5.92% 5.92%
2009 4.17% 4.69%
2010 3.07% 3.14%
2011 2.48% 2.36%
2012 2.45% 2.16%
2013 1.95% 2.53%
2014 −2.72% −3.13%
2015 9.18% 10.03%
2016 6.37% 9.91%
Accordingly, the 2017 benefit parameters reflect a multiplicative update of 4.45 percent for prior
year revisions. In summary, the 2016 parameters outlined in Section A are updated by 11.75
percent for 2017, as summarized by Table IV-2.

64
Table IV-2. Annual Percentage Increase
Annual percentage trend for July 2016 6.99%
Prior year revisions 4.45%
Annual percentage increase for 2017 11.75%
Note: Percentages are multiplicative, not additive.
Values are carried to additional decimal places and may
not agree to the rounded values presented above.
Annual Percentage Increase in Consumer Price Index, September (September CPI)
To ensure that plan sponsors and CMS have sufficient time to incorporate the cost-sharing
requirements into the development of the benefit, any marketing materials, and necessary
systems, the methodology to calculate the annual percentage increase in the CPI for the 12 month
period ending in September 2016 includes an estimate of the September 2016 CPI based on
projections from the President’s FY2017 Budget.
The September 2015 value is from the Bureau of Labor Statistics. The annual percentage trend
in the September CPI for contract year 2017 is calculated as follows:
Projected September 2016 CPI
Actual September 2015 CPI 𝑜𝑟
241.918
237.945= 1.0167
(Source: President’s FY2017 Budget and Bureau of Labor Statistics, Department of Labor)
The 2017 benefit parameters reflect the 2016 annual percentage trend in the September CPI of
1.67 percent, as well as a revision to the prior estimate for the 2015 CPI increase over the 12
month period ending in September 2015. Based on the actual reported CPI for September 2015,
the September 2015 CPI increase is now estimated to be −0.04 percent. Accordingly, the 2017
update reflects a −1.46 percent multiplicative correction for the revision to last year’s estimate.
In summary, the maximum copayments below the out-of-pocket threshold for full benefit dual
eligible enrollees with incomes not exceeding 100 percent of the Federal poverty line are updated
by 0.18 percent for 2017, as summarized by Table IV-3.
Table IV-3. Cumulative Annual Percentage Increase in September CPI
Annual percentage trend for September 2016 1.67%
Prior year revisions −1.46%
Annual percentage increase for 2017 0.18%
Note: Percentages are multiplicative, not additive. Values are carried
to additional decimal places and may not agree to the rounded values
presented above.

65
Annual Percentage Increase in Consumer Price Index, July (July CPI)
As is the case when calculating the annual CPI trend as of September 2016, the methodology to
calculate the annual percentage increase in the CPI for the 12 month period ending in July 2016
includes an estimate of the July 2016 CPI based on projections from the President’s FY2017
Budget.
The July 2015 value is from the Bureau of Labor Statistics. The annual percentage trend in CPI
for contract year 2017 is calculated as follows:
Projected July 2016 CPI
Actual July 2015 CPI 𝑜𝑟
241.344
238.654= 1.0113
(Source: President’s FY2017 Budget and Bureau of Labor Statistics, Department of Labor)
The 2017 benefit parameters reflect the 2016 annual percentage trend in the July CPI of 1.13
percent as well as a revision to the prior estimate for the 2015 CPI increase. Based on the actual
reported CPI for July 2015, the CPI increase over the 12 month period ending in July 2015 is
estimated to be 0.17 percent. The prior year revision here reflects the difference between this
actual 0.17 percent increase in CPI observed in July 2015 and the 2015 CPI increase estimate
from the CY 2016 Rate Announcement, which erroneously used September instead of July CPI
values. Accordingly, the 2017 update reflects a -1.26 percent multiplicative correction for the
revision to last year’s estimate.
In summary, the cumulative annual percentage increase in July CPI for 2017 is -0.15 percent, as
summarized by Table IV-4. This value plus two percentage points is less than the 11.75 percent
cumulative API for 2017 described above. Thus, the out-of-pocket threshold will be increased
by 1.85 percent for 2017.
Table IV-4. Cumulative Annual Percentage Increase in July CPI
Annual percentage trend for July 2016 1.13%
Prior year revisions −1.26%
Annual percentage increase for 2017 −0.15%
Note: Percentages are multiplicative, not additive. Values are carried
to additional decimal places and may not agree to the rounded values
presented above.
Section D. Retiree Drug Subsidy Amounts
Per 42 CFR 423.886(b)(3), the cost threshold and cost limit for qualified retiree prescription drug
plans are also updated using the API, as defined previously in this document. The updated cost
threshold is rounded the nearest multiple of $5 and the updated cost limit is rounded to the
nearest multiple of $50. The cost threshold and cost limit are defined as $320 and $6,600,

66
respectively, for plans that end in 2015, and, as $360 and $7,400, respectively, for plans that end
in 2016. For 2017, the cost threshold is $400 and the cost limit is $8,250.
Section E. Estimated Total Covered Part D Spending at Out-of-Pocket Threshold for
Applicable Beneficiaries
For 2017, the total covered Part D spending at out-of-pocket threshold for applicable
beneficiaries is $8,071.16. The figure is calculated given the following basic assumptions:
100 percent beneficiary cost sharing in the deductible phase.
25 percent beneficiary cost sharing in the initial coverage phase and in the coverage gap.
51 percent beneficiary cost sharing for non-applicable (generic) drugs purchased in the
coverage gap phase of the benefit.
90 percent cost sharing for the ingredient cost and sales tax for applicable (brand) drugs
purchased in the coverage gap phase of the benefit – 40 percent beneficiary coinsurance
and 50 percent coverage gap discount program discount.
40 percent cost sharing for the dispensing and vaccine administration fees for applicable
(brand) drugs purchased in the coverage gap phase of the benefit.
In this estimate, it is also assumed that the dispensing and vaccine administration fees account
for 0.11 percent of the gross covered brand drug costs used by non-LIS beneficiaries in the
coverage gap. Therefore, a 60 percent reduction in cost sharing for dispensing and vaccine
administration fees results in an overall reduction of 0.05 percent to 89.95 percent in cost sharing
for applicable (brand) drugs in the coverage gap.
The estimated total covered Part D spending at out-of-pocket threshold for applicable
beneficiaries is calculated as follows:
ICL+100% beneficiary cost sharing in the gap
weighted gap coinsurance factor 𝑜𝑟 3,700 +
$3,725.00
85.218%= $8,071.16
ICL is the Initial Coverage Limit equal to $3,700
One hundred percent beneficiary cost sharing in the gap is the estimated total drug
spending in the gap assuming 100 percent coinsurance.
One hundred percent cost sharing in the gap is calculated as follows:
OOP threshold − OOP costs up to the ICL or $4,950 − $1,225.00 = $3,725.00
Weighted gap coinsurance factor is calculated as follows:
(Brand GDCB % for non-LIS × 89.95% gap cost sharing for applicable drugs) + (Generic
GDCB % for non-LIS × 51% gap cost sharing for non-applicable drugs)

67
or
(87.9% × 89.95%) + (12.1% × 51%) = 85.218%
Brand GDCB % for non-LIS is the percentage of gross covered drug costs below the out-
of-pocket threshold for applicable beneficiaries (i.e., non-LIS) attributable to applicable
(brand) drugs, as reported on the 2015 PDEs.
Gap cost sharing for applicable drugs is the coinsurance incurred by applicable
beneficiaries (i.e., non-LIS) for applicable (brand) drugs in the coverage gap, where:
Coinsurance for applicable drugs = [(percentage of gross covered brand drug costs
attributable to ingredient cost and sales tax) × (cost sharing percentage)] +
[(percentage of gross covered brand drug costs attributable to dispensing and vaccine
administration fees) × (cost sharing coinsurance percentage)]
or
89.95% = [(99.89% × 90%) + (0.11% × 40%)]
Generic GDCB % for non-LIS is the percentage of gross covered drug costs below the out-
of-pocket threshold for applicable beneficiaries (i.e., non-LIS) attributable to non-applicable
(generic) drugs as reported on the 2015 PDEs.
Gap cost sharing for non-applicable drugs is the coinsurance incurred by applicable
beneficiaries (i.e., non-LIS) for non-applicable (generic) drugs in the coverage gap.

68
Attachment V. CMS-HCC and RxHCC Risk Adjustment Factors
Table 1. 2017 CMS-HCC Model Relative Factors for Community and Institutional
Beneficiaries . . . . . . . . . . . . . . . . . . . . . . . . . . . . . . . . . . . . . . . . . . . . . . . . . . . . . . 69
Table 2. 2017 CMS-HCC Model Relative Factors for Aged and Disabled New Enrollees . . . . 76
Table 3. 2017 CMS-HCC Model Relative Factors for New Enrollees in Chronic Condition
Special Needs Plans (C-SNPs) . . . . . . . . . . . . . . . . . . . . . . . . . . . . . . . . . . . . . . . . . 77
Table 4. Disease Hierarchies for the 2017 CMS-HCC Model . . . . . . . . . . . . . . . . . . . . . . . . 78
Table 5. RxHCC Model Relative Factors for Continuing Enrollees . . . . . . . . . . . . . . . . . . . . 79
Table 6. RxHCC Model Relative Factors for New Enrollees, Non‑Low Income . . . . . . . . . . . 84
Table 7. RxHCC Model Relative Factors for New Enrollees, Low Income . . . . . . . . . . . . . . . 85
Table 8. RxHCC Model Relative Factors for New Enrollees, Institutional . . . . . . . . . . . . . . . 86
Table 9. List of Disease Hierarchies for RxHCC Model . . . . . . . . . . . . . . . . . . . . . . . . . . . . 87
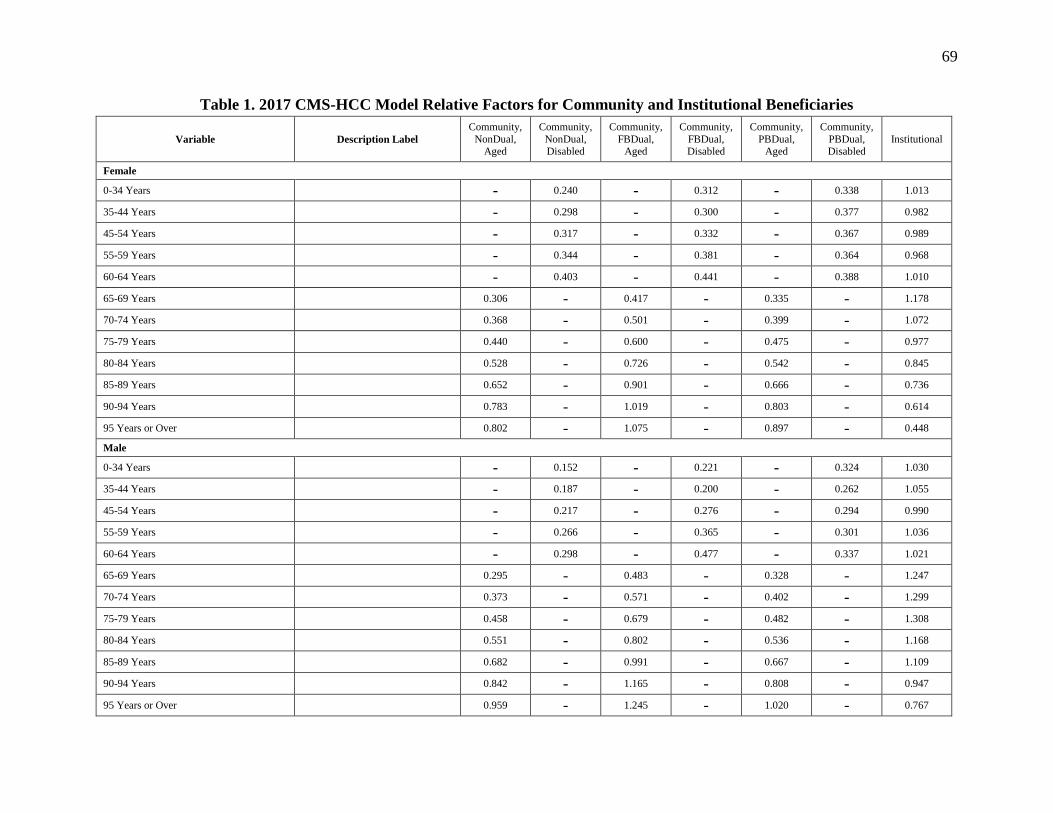
69
Table 1. 2017 CMS-HCC Model Relative Factors for Community and Institutional Beneficiaries
Variable Description Label
Community,
NonDual, Aged
Community,
NonDual, Disabled
Community,
FBDual, Aged
Community,
FBDual, Disabled
Community,
PBDual, Aged
Community,
PBDual, Disabled
Institutional
Female
0-34 Years - 0.240 - 0.312 - 0.338 1.013
35-44 Years - 0.298 - 0.300 - 0.377 0.982
45-54 Years - 0.317 - 0.332 - 0.367 0.989
55-59 Years - 0.344 - 0.381 - 0.364 0.968
60-64 Years - 0.403 - 0.441 - 0.388 1.010
65-69 Years 0.306 - 0.417 - 0.335 - 1.178
70-74 Years 0.368 - 0.501 - 0.399 - 1.072
75-79 Years 0.440 - 0.600 - 0.475 - 0.977
80-84 Years 0.528 - 0.726 - 0.542 - 0.845
85-89 Years 0.652 - 0.901 - 0.666 - 0.736
90-94 Years 0.783 - 1.019 - 0.803 - 0.614
95 Years or Over 0.802 - 1.075 - 0.897 - 0.448
Male
0-34 Years - 0.152 - 0.221 - 0.324 1.030
35-44 Years - 0.187 - 0.200 - 0.262 1.055
45-54 Years - 0.217 - 0.276 - 0.294 0.990
55-59 Years - 0.266 - 0.365 - 0.301 1.036
60-64 Years - 0.298 - 0.477 - 0.337 1.021
65-69 Years 0.295 - 0.483 - 0.328 - 1.247
70-74 Years 0.373 - 0.571 - 0.402 - 1.299
75-79 Years 0.458 - 0.679 - 0.482 - 1.308
80-84 Years 0.551 - 0.802 - 0.536 - 1.168
85-89 Years 0.682 - 0.991 - 0.667 - 1.109
90-94 Years 0.842 - 1.165 - 0.808 - 0.947
95 Years or Over 0.959 - 1.245 - 1.020 - 0.767
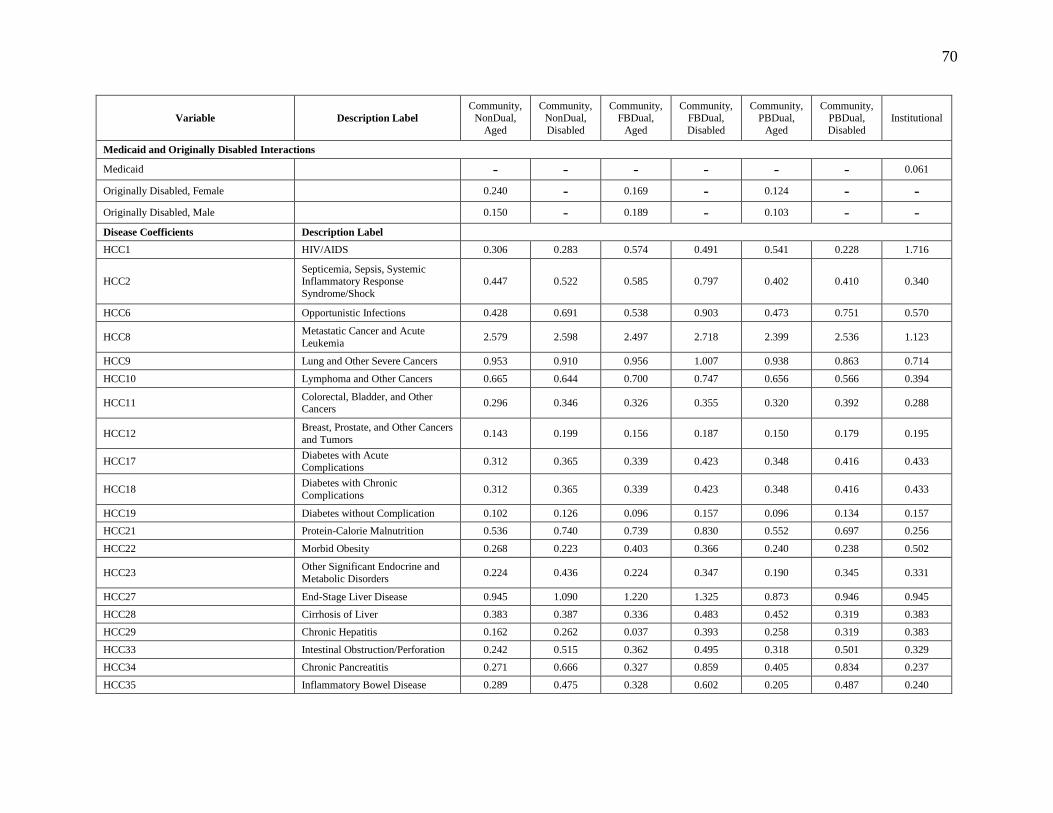
70
Variable Description Label
Community, NonDual,
Aged
Community, NonDual,
Disabled
Community, FBDual,
Aged
Community, FBDual,
Disabled
Community, PBDual,
Aged
Community, PBDual,
Disabled
Institutional
Medicaid and Originally Disabled Interactions
Medicaid - - - - - - 0.061
Originally Disabled, Female 0.240 - 0.169 - 0.124 - -
Originally Disabled, Male 0.150 - 0.189 - 0.103 - -
Disease Coefficients Description Label
HCC1 HIV/AIDS 0.306 0.283 0.574 0.491 0.541 0.228 1.716
HCC2 Septicemia, Sepsis, Systemic Inflammatory Response
Syndrome/Shock
0.447 0.522 0.585 0.797 0.402 0.410 0.340
HCC6 Opportunistic Infections 0.428 0.691 0.538 0.903 0.473 0.751 0.570
HCC8 Metastatic Cancer and Acute
Leukemia 2.579 2.598 2.497 2.718 2.399 2.536 1.123
HCC9 Lung and Other Severe Cancers 0.953 0.910 0.956 1.007 0.938 0.863 0.714
HCC10 Lymphoma and Other Cancers 0.665 0.644 0.700 0.747 0.656 0.566 0.394
HCC11 Colorectal, Bladder, and Other Cancers
0.296 0.346 0.326 0.355 0.320 0.392 0.288
HCC12 Breast, Prostate, and Other Cancers
and Tumors 0.143 0.199 0.156 0.187 0.150 0.179 0.195
HCC17 Diabetes with Acute Complications
0.312 0.365 0.339 0.423 0.348 0.416 0.433
HCC18 Diabetes with Chronic
Complications 0.312 0.365 0.339 0.423 0.348 0.416 0.433
HCC19 Diabetes without Complication 0.102 0.126 0.096 0.157 0.096 0.134 0.157
HCC21 Protein-Calorie Malnutrition 0.536 0.740 0.739 0.830 0.552 0.697 0.256
HCC22 Morbid Obesity 0.268 0.223 0.403 0.366 0.240 0.238 0.502
HCC23 Other Significant Endocrine and
Metabolic Disorders 0.224 0.436 0.224 0.347 0.190 0.345 0.331
HCC27 End-Stage Liver Disease 0.945 1.090 1.220 1.325 0.873 0.946 0.945
HCC28 Cirrhosis of Liver 0.383 0.387 0.336 0.483 0.452 0.319 0.383
HCC29 Chronic Hepatitis 0.162 0.262 0.037 0.393 0.258 0.319 0.383
HCC33 Intestinal Obstruction/Perforation 0.242 0.515 0.362 0.495 0.318 0.501 0.329
HCC34 Chronic Pancreatitis 0.271 0.666 0.327 0.859 0.405 0.834 0.237
HCC35 Inflammatory Bowel Disease 0.289 0.475 0.328 0.602 0.205 0.487 0.240
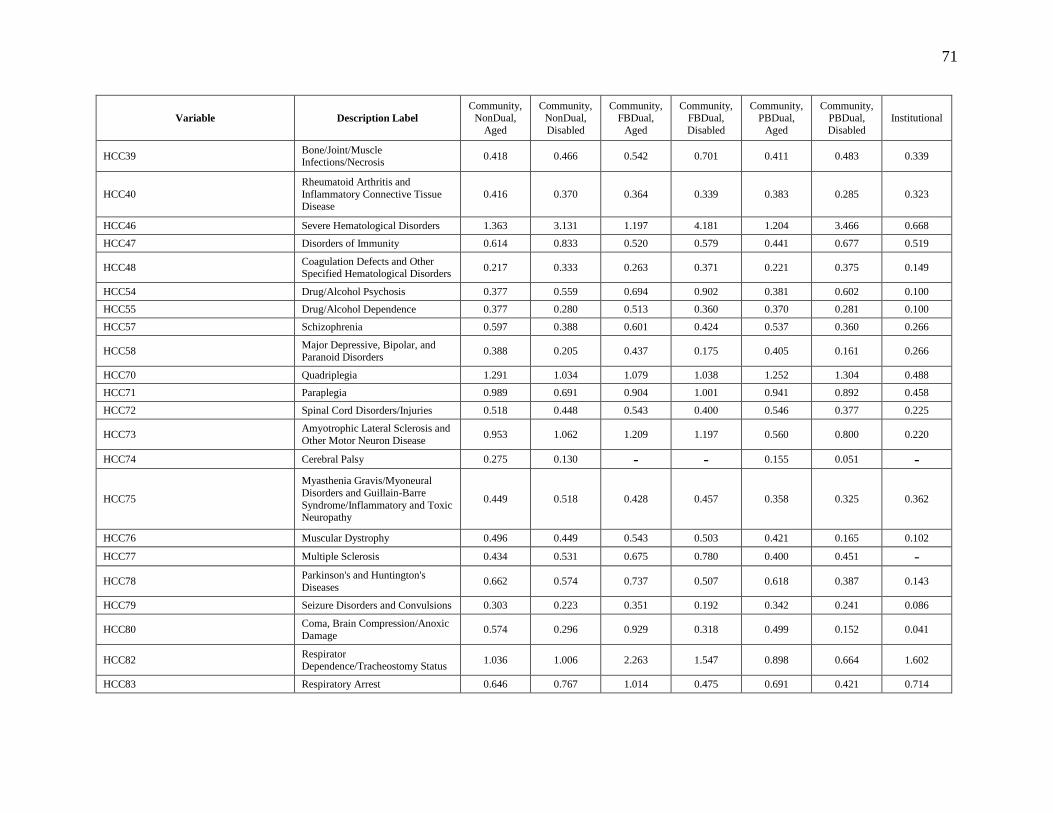
71
Variable Description Label
Community, NonDual,
Aged
Community, NonDual,
Disabled
Community, FBDual,
Aged
Community, FBDual,
Disabled
Community, PBDual,
Aged
Community, PBDual,
Disabled
Institutional
HCC39 Bone/Joint/Muscle Infections/Necrosis
0.418 0.466 0.542 0.701 0.411 0.483 0.339
HCC40
Rheumatoid Arthritis and
Inflammatory Connective Tissue Disease
0.416 0.370 0.364 0.339 0.383 0.285 0.323
HCC46 Severe Hematological Disorders 1.363 3.131 1.197 4.181 1.204 3.466 0.668
HCC47 Disorders of Immunity 0.614 0.833 0.520 0.579 0.441 0.677 0.519
HCC48 Coagulation Defects and Other Specified Hematological Disorders
0.217 0.333 0.263 0.371 0.221 0.375 0.149
HCC54 Drug/Alcohol Psychosis 0.377 0.559 0.694 0.902 0.381 0.602 0.100
HCC55 Drug/Alcohol Dependence 0.377 0.280 0.513 0.360 0.370 0.281 0.100
HCC57 Schizophrenia 0.597 0.388 0.601 0.424 0.537 0.360 0.266
HCC58 Major Depressive, Bipolar, and Paranoid Disorders
0.388 0.205 0.437 0.175 0.405 0.161 0.266
HCC70 Quadriplegia 1.291 1.034 1.079 1.038 1.252 1.304 0.488
HCC71 Paraplegia 0.989 0.691 0.904 1.001 0.941 0.892 0.458
HCC72 Spinal Cord Disorders/Injuries 0.518 0.448 0.543 0.400 0.546 0.377 0.225
HCC73 Amyotrophic Lateral Sclerosis and
Other Motor Neuron Disease 0.953 1.062 1.209 1.197 0.560 0.800 0.220
HCC74 Cerebral Palsy 0.275 0.130 - - 0.155 0.051 -
HCC75
Myasthenia Gravis/Myoneural
Disorders and Guillain-Barre
Syndrome/Inflammatory and Toxic Neuropathy
0.449 0.518 0.428 0.457 0.358 0.325 0.362
HCC76 Muscular Dystrophy 0.496 0.449 0.543 0.503 0.421 0.165 0.102
HCC77 Multiple Sclerosis 0.434 0.531 0.675 0.780 0.400 0.451 -
HCC78 Parkinson's and Huntington's
Diseases 0.662 0.574 0.737 0.507 0.618 0.387 0.143
HCC79 Seizure Disorders and Convulsions 0.303 0.223 0.351 0.192 0.342 0.241 0.086
HCC80 Coma, Brain Compression/Anoxic
Damage 0.574 0.296 0.929 0.318 0.499 0.152 0.041
HCC82 Respirator Dependence/Tracheostomy Status
1.036 1.006 2.263 1.547 0.898 0.664 1.602
HCC83 Respiratory Arrest 0.646 0.767 1.014 0.475 0.691 0.421 0.714

72
Variable Description Label
Community, NonDual,
Aged
Community, NonDual,
Disabled
Community, FBDual,
Aged
Community, FBDual,
Disabled
Community, PBDual,
Aged
Community, PBDual,
Disabled
Institutional
HCC84 Cardio-Respiratory Failure and Shock
0.296 0.568 0.462 0.475 0.296 0.421 0.292
HCC85 Congestive Heart Failure 0.317 0.405 0.349 0.408 0.315 0.360 0.187
HCC86 Acute Myocardial Infarction 0.229 0.300 0.465 0.607 0.275 0.431 0.489
HCC87 Unstable Angina and Other Acute
Ischemic Heart Disease 0.214 0.300 0.330 0.607 0.275 0.431 0.489
HCC88 Angina Pectoris 0.138 0.119 0.067 0.201 0.172 0.216 0.489
HCC96 Specified Heart Arrhythmias 0.264 0.279 0.362 0.370 0.278 0.254 0.220
HCC99 Cerebral Hemorrhage 0.259 0.277 0.466 0.678 0.273 0.275 0.112
HCC100 Ischemic or Unspecified Stroke 0.259 0.191 0.466 0.351 0.266 0.228 0.112
HCC103 Hemiplegia/Hemiparesis 0.529 0.319 0.538 0.427 0.592 0.394 0.031
HCC104 Monoplegia, Other Paralytic
Syndromes 0.388 0.254 0.367 0.375 0.549 0.394 0.031
HCC106 Atherosclerosis of the Extremities with Ulceration or Gangrene
1.435 1.479 1.713 1.710 1.427 1.573 0.868
HCC107 Vascular Disease with
Complications 0.393 0.477 0.530 0.742 0.436 0.539 0.315
HCC108 Vascular Disease 0.293 0.327 0.318 0.314 0.310 0.320 0.092
HCC110 Cystic Fibrosis 0.609 2.493 0.967 3.305 0.351 2.811 0.299
HCC111 Chronic Obstructive Pulmonary Disease
0.322 0.257 0.414 0.348 0.351 0.287 0.299
HCC112 Fibrosis of Lung and Other
Chronic Lung Disorders 0.206 0.257 0.132 0.317 0.169 0.171 0.056
HCC114 Aspiration and Specified Bacterial
Pneumonias 0.589 0.521 0.694 0.482 0.654 0.366 0.066
HCC115 Pneumococcal Pneumonia, Empyema, Lung Abscess
0.217 0.126 0.159 0.048 0.297 0.216 0.066
HCC122 Proliferative Diabetic Retinopathy
and Vitreous Hemorrhage 0.213 0.168 0.219 0.279 0.272 0.191 0.452
HCC124 Exudative Macular Degeneration 0.490 0.378 0.273 0.088 0.330 0.112 0.224
HCC134 Dialysis Status 0.415 0.491 0.660 0.626 0.428 0.503 0.454
HCC135 Acute Renal Failure 0.415 0.491 0.660 0.626 0.428 0.503 0.454
HCC136 Chronic Kidney Disease, Stage 5 0.233 0.139 0.240 0.164 0.181 0.144 0.428
HCC137 Chronic Kidney Disease, Severe (Stage 4)
0.233 0.139 0.240 0.078 0.181 0.034 0.198
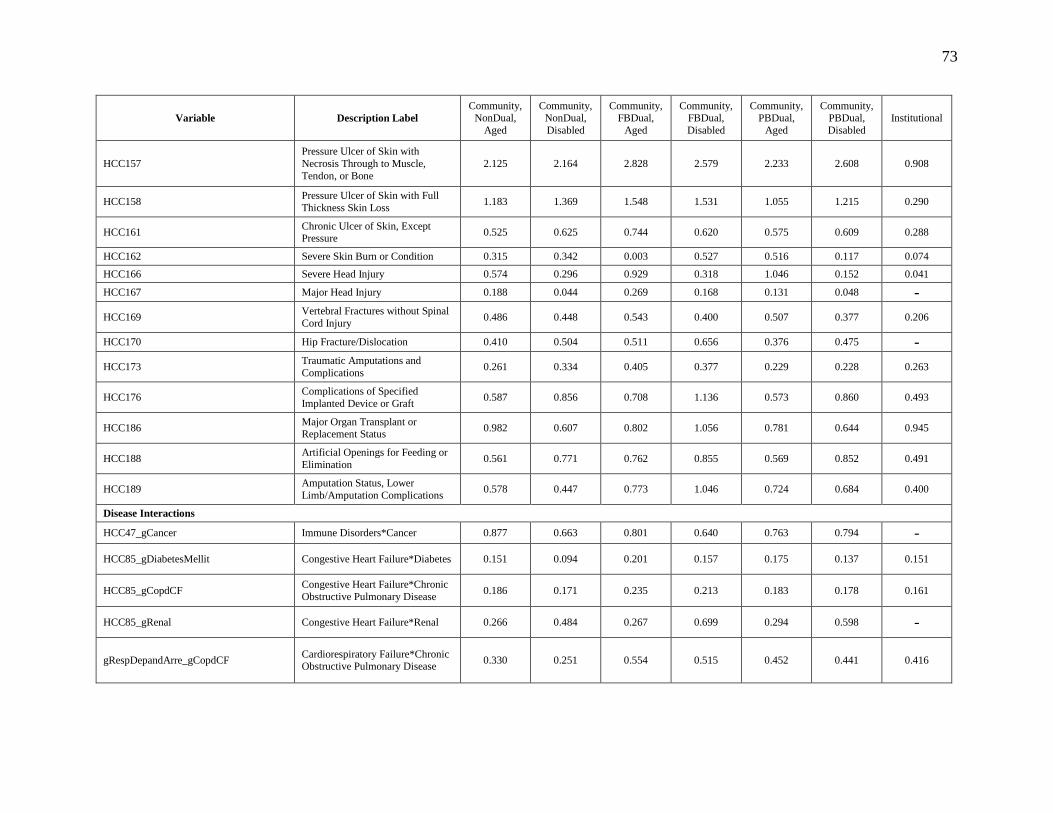
73
Variable Description Label
Community, NonDual,
Aged
Community, NonDual,
Disabled
Community, FBDual,
Aged
Community, FBDual,
Disabled
Community, PBDual,
Aged
Community, PBDual,
Disabled
Institutional
HCC157
Pressure Ulcer of Skin with
Necrosis Through to Muscle,
Tendon, or Bone
2.125 2.164 2.828 2.579 2.233 2.608 0.908
HCC158 Pressure Ulcer of Skin with Full
Thickness Skin Loss 1.183 1.369 1.548 1.531 1.055 1.215 0.290
HCC161 Chronic Ulcer of Skin, Except Pressure
0.525 0.625 0.744 0.620 0.575 0.609 0.288
HCC162 Severe Skin Burn or Condition 0.315 0.342 0.003 0.527 0.516 0.117 0.074
HCC166 Severe Head Injury 0.574 0.296 0.929 0.318 1.046 0.152 0.041
HCC167 Major Head Injury 0.188 0.044 0.269 0.168 0.131 0.048 -
HCC169 Vertebral Fractures without Spinal
Cord Injury 0.486 0.448 0.543 0.400 0.507 0.377 0.206
HCC170 Hip Fracture/Dislocation 0.410 0.504 0.511 0.656 0.376 0.475 -
HCC173 Traumatic Amputations and
Complications 0.261 0.334 0.405 0.377 0.229 0.228 0.263
HCC176 Complications of Specified
Implanted Device or Graft 0.587 0.856 0.708 1.136 0.573 0.860 0.493
HCC186 Major Organ Transplant or Replacement Status
0.982 0.607 0.802 1.056 0.781 0.644 0.945
HCC188 Artificial Openings for Feeding or
Elimination 0.561 0.771 0.762 0.855 0.569 0.852 0.491
HCC189 Amputation Status, Lower
Limb/Amputation Complications 0.578 0.447 0.773 1.046 0.724 0.684 0.400
Disease Interactions
HCC47_gCancer Immune Disorders*Cancer 0.877 0.663 0.801 0.640 0.763 0.794 -
HCC85_gDiabetesMellit Congestive Heart Failure*Diabetes 0.151 0.094 0.201 0.157 0.175 0.137 0.151
HCC85_gCopdCF Congestive Heart Failure*Chronic
Obstructive Pulmonary Disease 0.186 0.171 0.235 0.213 0.183 0.178 0.161
HCC85_gRenal Congestive Heart Failure*Renal 0.266 0.484 0.267 0.699 0.294 0.598 -
gRespDepandArre_gCopdCF Cardiorespiratory Failure*Chronic Obstructive Pulmonary Disease
0.330 0.251 0.554 0.515 0.452 0.441 0.416

74
Variable Description Label
Community, NonDual,
Aged
Community, NonDual,
Disabled
Community, FBDual,
Aged
Community, FBDual,
Disabled
Community, PBDual,
Aged
Community, PBDual,
Disabled
Institutional
HCC85_HCC96 Congestive Heart Failure*Specified Heart
Arrhythmias
0.103 0.280 0.196 0.398 0.114 0.313 -
gSubstanceAbuse_gPsychiatric Substance Abuse*Psychiatric - 0.187 - 0.229 - 0.226 -
SEPSIS_PRESSURE_ULCER Sepsis*Pressure Ulcer - - - - - - 0.248
SEPSIS_ARTIF_OPENINGS Sepsis*Artificial Openings for
Feeding or Elimination - - - - - - 0.558
ART_OPENINGS_PRESSURE_ULCER Artificial Openings for Feeding or Elimination*Pressure Ulcer - - - - - - 0.325
gCopdCF_ASP_SPEC_BACT_PNEUM Chronic Obstructive Pulmonary Disease*Aspiration and Specified
Bacterial Pneumonias - - - - - - 0.249
ASP_SPEC_BACT_PNEUM_PRES_ULC Aspiration and Specified Bacterial Pneumonias*Pressure Ulcer - - - - - - 0.360
SEPSIS_ASP_SPEC_BACT_PNEUM Sepsis*Aspiration and Specified
Bacterial Pneumonias - - - - - - 0.316
SCHIZOPHRENIA_gCopdCF Schizophrenia*Chronic
Obstructive Pulmonary Disease - - - - - - 0.357
SCHIZOPHRENIA_CHF Schizophrenia*Congestive Heart Failure - - - - - - 0.170
SCHIZOPHRENIA_SEIZURES Schizophrenia*Seizure Disorders
and Convulsions - - - - - - 0.475
Disabled/Disease Interactions
DISABLED_HCC85 Disabled, Congestive Heart Failure - - - - - - 0.315
DISABLED_PRESSURE_ULCER Disabled, Pressure Ulcer - - - - - - 0.597
DISABLED_HCC161 Disabled, Chronic Ulcer of the
Skin, Except Pressure Ulcer - - - - - - 0.362
DISABLED_HCC39 Disabled, Bone/Joint Muscle
Infections/Necrosis - - - - - - 0.557
DISABLED_HCC77 Disabled, Multiple Sclerosis - - - - - - 0.418
DISABLED_HCC6 Disabled, Opportunistic Infections - - - - - - 0.272
NOTES:

75
1. The denominator is $9,350.78
2. In the “disease interactions” and “disabled interactions,” the variables are defined as follows:
Immune Disorders = HCC 47
Cancer = HCCs 8-12
Congestive Heart Failure = HCC 85
Diabetes = HCCs 17-19
Chronic Obstructive Pulmonary Disease = HCCs 110-112
Renal = HCCs 134 – 137
Cardiorespiratory Failure = HCCs 82-84
Specified Heart Arrhythmias = HCC 96
Substance Abuse = HCCs 54-55
Psychiatric = HCCs 57-58
Sepsis = HCC 2
Pressure Ulcer = HCCs 157-158
Artificial Openings for Feeding or Elimination = HCC 188
Aspiration and Specified Bacterial Pneumonias = HCC 114
Schizophrenia = HCC 57
Seizure Disorders and Convulsions = HCC 79
Chronic Ulcer of Skin, except Pressure = HCC 161
Bone/Joint/Muscle Infections/Necrosis = HCC 39
Multiple Sclerosis = HCC 77
Opportunistic Infections = HCC 6
SOURCE: RTI International analysis of 2013-2014 Medicare 100% data and RTI International analysis of 2013-2014 Medicare 100% institutional
sample.

76
Table 2. 2017 CMS-HCC Model Relative Factors for Aged and Disabled New Enrollees
Non-Medicaid &
Non-Originally
Disabled
Medicaid &
Non-Originally
Disabled
Non-Medicaid &
Originally
Disabled
Medicaid &
Originally
Disabled
Female
0-34 Years 0.652 0.968 - -
35-44 Years 0.920 1.199 - -
45-54 Years 1.017 1.313 - -
55-59 Years 0.986 1.318 - -
60-64 Years 1.102 1.412 - -
65 Years 0.513 1.040 1.110 1.539
66 Years 0.507 0.929 1.147 1.591
67 Years 0.535 0.929 1.147 1.591
68 Years 0.571 0.929 1.147 1.591
69 Years 0.594 0.929 1.147 1.591
70-74 Years 0.662 0.958 1.147 1.591
75-79 Years 0.876 1.072 1.147 1.591
80-84 Years 1.047 1.371 1.147 1.591
85-89 Years 1.300 1.432 1.147 1.591
90-94 Years 1.300 1.648 1.147 1.591
95 Years or Over 1.300 1.648 1.147 1.591
Male
0-34 Years 0.448 0.753 - -
35-44 Years 0.653 1.075 - -
45-54 Years 0.819 1.333 - -
55-59 Years 0.873 1.397 - -
60-64 Years 0.906 1.554 - -
65 Years 0.505 1.179 0.776 1.584
66 Years 0.523 1.186 0.940 1.584
67 Years 0.565 1.186 0.987 2.163
68 Years 0.630 1.186 1.055 2.163
69 Years 0.659 1.288 1.374 2.163
70-74 Years 0.762 1.288 1.374 2.163
75-79 Years 1.022 1.337 1.374 2.163
80-84 Years 1.247 1.575 1.374 2.163
85-89 Years 1.484 1.817 1.374 2.163
90-94 Years 1.484 1.817 1.374 2.163
95 Years or Over 1.484 1.817 1.374 2.163
NOTES:
1. The denominator is $9,350.78
2. For payment purposes, a new enrollee is a beneficiary who did not have 12 months of Part B eligibility in
the data collection year. CMS-HCC new enrollee models are not based on diagnoses, but include factors for
different age and gender combinations by Medicaid and the original reason for Medicare entitlement.
SOURCE: RTI International analysis of 2013-2014 100% Medicare data.

77
Table 3. 2017 CMS-HCC Model Relative Factors for New Enrollees in Chronic Condition
Special Needs Plans (C-SNPs)
Non-Medicaid &
Non-Originally
Disabled
Medicaid &
Non-Originally
Disabled
Non-Medicaid
& Originally
Disabled
Medicaid &
Originally
Disabled
Female
0-34 Years 1.116 1.604 - -
35-44 Years 1.384 1.835 - -
45-54 Years 1.481 2.031 - -
55-59 Years 1.590 2.085 - -
60-64 Years 1.659 2.139 - -
65 Years 0.985 1.519 1.716 2.123
66 Years 0.979 1.519 1.753 2.175
67 Years 1.044 1.541 1.773 2.232
68 Years 1.080 1.541 1.773 2.232
69 Years 1.103 1.541 1.773 2.232
70-74 Years 1.247 1.745 1.898 2.372
75-79 Years 1.453 1.938 2.059 2.530
80-84 Years 1.657 2.124 2.212 2.793
85-89 Years 1.886 2.339 2.212 2.793
90-94 Years 1.886 2.556 2.212 2.793
95 Years or Over 1.886 2.556 2.212 2.793
Male
0-34 Years 1.027 1.306 - -
35-44 Years 1.232 1.629 - -
45-54 Years 1.477 1.920 - -
55-59 Years 1.601 2.054 - -
60-64 Years 1.641 2.148 - -
65 Years 0.953 1.452 1.626 2.185
66 Years 0.972 1.458 1.662 2.185
67 Years 0.997 1.572 1.675 2.318
68 Years 1.062 1.572 1.703 2.318
69 Years 1.092 1.673 1.749 2.318
70-74 Years 1.279 1.864 1.841 2.314
75-79 Years 1.495 2.043 1.964 2.536
80-84 Years 1.727 2.189 2.214 2.536
85-89 Years 2.011 2.499 2.214 2.536
90-94 Years 2.011 2.499 2.214 2.536
95 Years or Over 2.011 2.499 2.214 2.536
Notes:
1. For payment purposes, a new enrollee is a beneficiary who did not have 12 months of Part B eligibility in the data
collection year. CMS-HCC new enrollee models are not based on diagnoses, but include factors for different age
and gender combinations by Medicaid and the original reason for Medicare entitlement.
2. The relative factors in this table were calculated by estimating the incremental amount to the standard new enrollee
risk model needed to predict the risk scores of continuing enrollees in C-SNPs.
Source: RTI analysis of 2013-2014 Medicare C-SNP community continuing enrollees.

78
Table 4. Disease Hierarchies for the 2017 CMS-HCC Model
Hierarchical
Condition
Category
(HCC)
If the Disease Group is Listed in this column… …Then drop the Disease
Group(s) listed in this
column
Hierarchical Condition Category (HCC) LABEL
8 Metastatic Cancer and Acute Leukemia 9,10,11,12
9 Lung and Other Severe Cancers 10,11,12
10 Lymphoma and Other Cancers 11,12
11 Colorectal, Bladder, and Other Cancers 12
17 Diabetes with Acute Complications 18,19
18 Diabetes with Chronic Complications 19
27 End-Stage Liver Disease 28,29,80
28 Cirrhosis of Liver 29
46 Severe Hematological Disorders 48
54 Drug/Alcohol Psychosis 55
57 Schizophrenia 58
70 Quadriplegia 71,72,103,104,169
71 Paraplegia 72,104,169
72 Spinal Cord Disorders/Injuries 169
82 Respirator Dependence/Tracheostomy Status 83,84
83 Respiratory Arrest 84
86 Acute Myocardial Infarction 87,88
87 Unstable Angina and Other Acute Ischemic Heart
Disease
88
99 Cerebral Hemorrhage 100
103 Hemiplegia/Hemiparesis 104
106 Atherosclerosis of the Extremities with Ulceration or
Gangrene
107,108,161,189
107 Vascular Disease with Complications 108
110 Cystic Fibrosis 111,112
111 Chronic Obstructive Pulmonary Disease 112
114 Aspiration and Specified Bacterial Pneumonias 115
134 Dialysis Status 135,136,137
135 Acute Renal Failure 136,137
136 Chronic Kidney Disease, Stage 5 137
157 Pressure Ulcer of Skin with Necrosis Through to
Muscle, Tendon, or Bone
158,161
158 Pressure Ulcer of Skin with Full Thickness Skin Loss 161
166 Severe Head Injury 80,167
How Payments are Made with a Disease Hierarchy: EXAMPLE: If a beneficiary triggers Disease Groups 135
(Acute Renal Failure) and 136 (Chronic Kidney Disease, Stage 5), then DG 136 will be dropped. In other words,
payment will always be associated with the DG in column 1, if a DG in column 3 also occurs during the same
collection period. Therefore, the organization’s payment will be based on DG 135 rather than DG 136.

79
Table 5. RxHCC Model Relative Factors for Continuing Enrollees
Continuing Enrollees (CE) RxHCC Model Segments
Variable Disease Group
Community,
Non-Low Income,
Age≥65
Community,
Non-Low Income,
Age<65
Community,
Low Income,
Age≥65
Community,
Low Income,
Age<65
Institutional
Female
0-34 Years - 0.290 - 0.423 1.918
35-44 Years - 0.477 - 0.637 1.886
45-54 Years - 0.563 - 0.735 1.682
55-59 Years - 0.543 - 0.710 1.556
60-64 Years - 0.504 - 0.645 1.414
65-69 Years 0.264 - 0.407 - 1.491
70-74 Years 0.264 - 0.396 - 1.382
75-79 Years 0.251 - 0.385 - 1.285
80-84 Years 0.237 - 0.357 - 1.197
85-89 Years 0.221 - 0.328 - 1.113
90-94 Years 0.183 - 0.268 - 1.002
95 Years or Over 0.126 - 0.178 - 0.813
Male
0-34 Years - 0.227 - 0.470 1.660
35-44 Years - 0.382 - 0.606 1.791
45-54 Years - 0.498 - 0.660 1.618
55-59 Years - 0.519 - 0.649 1.450
60-64 Years - 0.478 - 0.595 1.334
65-69 Years 0.274 - 0.351 - 1.332
70-74 Years 0.279 - 0.353 - 1.275
75-79 Years 0.246 - 0.347 - 1.218
80-84 Years 0.188 - 0.317 - 1.167
85-89 Years 0.149 - 0.289 - 1.098
90-94 Years 0.093 - 0.260 - 1.021
95 Years or Over 0.071 - 0.216 - 0.864
Originally Disabled Interactions with Sex
Originally Disabled_Female 0.101 - 0.180 - 0.066
Originally Disabled_Male - - 0.127 - 0.066
Disease Coefficients Description Label
RXHCC1 HIV/AIDS 2.913 3.350 3.437 3.881 2.206
RXHCC5 Opportunistic Infections 0.221 0.011 0.145 0.148 0.160
RXHCC15 Chronic Myeloid Leukemia 6.271 6.682 7.000 8.912 4.011
RXHCC16 Multiple Myeloma and Other
Neoplastic Disorders 3.405 3.628 2.791 3.246 1.044

80
Continuing Enrollees (CE) RxHCC Model Segments
Variable Disease Group
Community, Non-Low
Income,
Age≥65
Community, Non-Low
Income,
Age<65
Community, Low
Income,
Age≥65
Community, Low
Income,
Age<65
Institutional
RXHCC17
Secondary Cancers of Bone,
Lung, Brain, and Other Specified
Sites; Liver Cancer
1.435 1.390 1.346 1.385 0.421
RXHCC18 Lung, Kidney, and Other
Cancers 0.255 0.281 0.280 0.287 0.050
RXHCC19 Breast and Other Cancers and
Tumors 0.087 0.029 0.078 0.085 0.050
RXHCC30 Diabetes with Complications 0.396 0.437 0.461 0.608 0.431
RXHCC31 Diabetes without Complication 0.263 0.259 0.300 0.354 0.299
RXHCC40 Specified Hereditary
Metabolic/Immune Disorders 2.785 11.019 2.945 9.727 0.138
RXHCC41
Pituitary, Adrenal Gland, and
Other Endocrine and Metabolic Disorders
0.111 0.179 0.052 0.183 0.064
RXHCC42 Thyroid Disorders 0.095 0.160 0.092 0.155 0.065
RXHCC43 Morbid Obesity 0.067 - 0.066 0.068 0.169
RXHCC45 Disorders of Lipoid Metabolism 0.054 0.038 0.094 0.126 0.063
RXHCC54 Chronic Viral Hepatitis C 1.921 2.461 1.713 1.989 0.508
RXHCC55 Chronic Viral Hepatitis, Except Hepatitis C
0.322 0.396 0.860 0.586 0.251
RXHCC65 Chronic Pancreatitis 0.239 0.238 0.148 0.163 0.143
RXHCC66
Pancreatic Disorders and
Intestinal Malabsorption, Except
Pancreatitis
0.094 0.238 0.084 0.163 0.106
RXHCC67 Inflammatory Bowel Disease 0.470 0.403 0.388 0.718 0.205
RXHCC68 Esophageal Reflux and Other
Disorders of Esophagus 0.098 0.074 0.151 0.170 0.076
RXHCC80 Aseptic Necrosis of Bone 0.162 0.201 0.149 0.135 0.108
RXHCC82 Psoriatic Arthropathy and
Systemic Sclerosis 0.720 0.792 1.116 1.802 0.538
RXHCC83 Rheumatoid Arthritis and Other Inflammatory Polyarthropathy
0.318 0.383 0.406 0.710 0.172
RXHCC84
Systemic Lupus Erythematosus,
Other Connective Tissue
Disorders, and Inflammatory Spondylopathies
0.202 0.331 0.233 0.341 0.107
RXHCC87 Osteoporosis, Vertebral and
Pathological Fractures 0.054 0.152 0.121 0.195 -
RXHCC95 Sickle Cell Anemia 0.085 0.185 0.070 0.777 0.482
RXHCC96 Myelodysplastic Syndromes and
Myelofibrosis 0.738 0.883 0.653 0.682 0.518
RXHCC97 Immune Disorders 0.428 0.448 0.484 0.403 0.377
RXHCC98 Aplastic Anemia and Other
Significant Blood Disorders 0.085 0.180 0.070 0.228 0.039
RXHCC111 Alzheimer`s Disease 0.475 0.206 0.180 0.093 -

81
Continuing Enrollees (CE) RxHCC Model Segments
Variable Disease Group
Community, Non-Low
Income,
Age≥65
Community, Non-Low
Income,
Age<65
Community, Low
Income,
Age≥65
Community, Low
Income,
Age<65
Institutional
RXHCC112 Dementia, Except Alzheimer`s Disease
0.198 0.094 0.040 - -
RXHCC130 Schizophrenia 0.291 0.336 0.457 0.756 0.203
RXHCC131 Bipolar Disorders 0.291 0.319 0.317 0.509 0.203
RXHCC132 Major Depression 0.154 0.269 0.185 0.364 0.189
RXHCC133 Specified Anxiety, Personality,
and Behavior Disorders 0.154 0.239 0.179 0.362 0.106
RXHCC134 Depression 0.150 0.191 0.140 0.227 0.106
RXHCC135 Anxiety Disorders 0.060 0.112 0.092 0.197 0.101
RXHCC145 Autism 0.154 0.239 0.374 0.410 0.106
RXHCC146 Profound or Severe Intellectual Disability/Developmental
Disorder
0.026 0.114 0.374 0.309 -
RXHCC147
Moderate Intellectual
Disability/Developmental Disorder
0.026 - 0.224 0.172 -
RXHCC148
Mild or Unspecified Intellectual
Disability/Developmental
Disorder - - 0.098 0.030 -
RXHCC156 Myasthenia Gravis, Amyotrophic Lateral Sclerosis
and Other Motor Neuron Disease
0.316 0.632 0.323 0.542 0.142
RXHCC157 Spinal Cord Disorders 0.138 0.161 0.082 0.059 0.074
RXHCC159 Inflammatory and Toxic Neuropathy
0.212 0.421 0.219 0.388 0.088
RXHCC160 Multiple Sclerosis 1.904 3.250 1.807 3.809 0.856
RXHCC161 Parkinson`s and Huntington`s Diseases
0.496 0.716 0.313 0.430 0.208
RXHCC163 Intractable Epilepsy 0.293 0.494 0.260 0.899 0.078
RXHCC164
Epilepsy and Other Seizure
Disorders, Except Intractable Epilepsy
0.112 0.046 0.034 0.139 -
RXHCC165 Convulsions 0.062 - 0.034 0.087 -
RXHCC166 Migraine Headaches 0.142 0.257 0.126 0.150 0.126
RXHCC168 Trigeminal and Postherpetic
Neuralgia 0.133 0.260 0.149 0.181 0.185
RXHCC185 Primary Pulmonary Hypertension
0.621 1.784 0.570 1.468 0.229
RXHCC186 Congestive Heart Failure 0.176 0.120 0.230 0.136 0.135
RXHCC187 Hypertension 0.141 0.078 0.204 0.109 0.065
RXHCC188 Coronary Artery Disease 0.130 0.035 0.142 - 0.012
RXHCC193 Atrial Arrhythmias 0.230 0.097 0.098 0.014 0.068
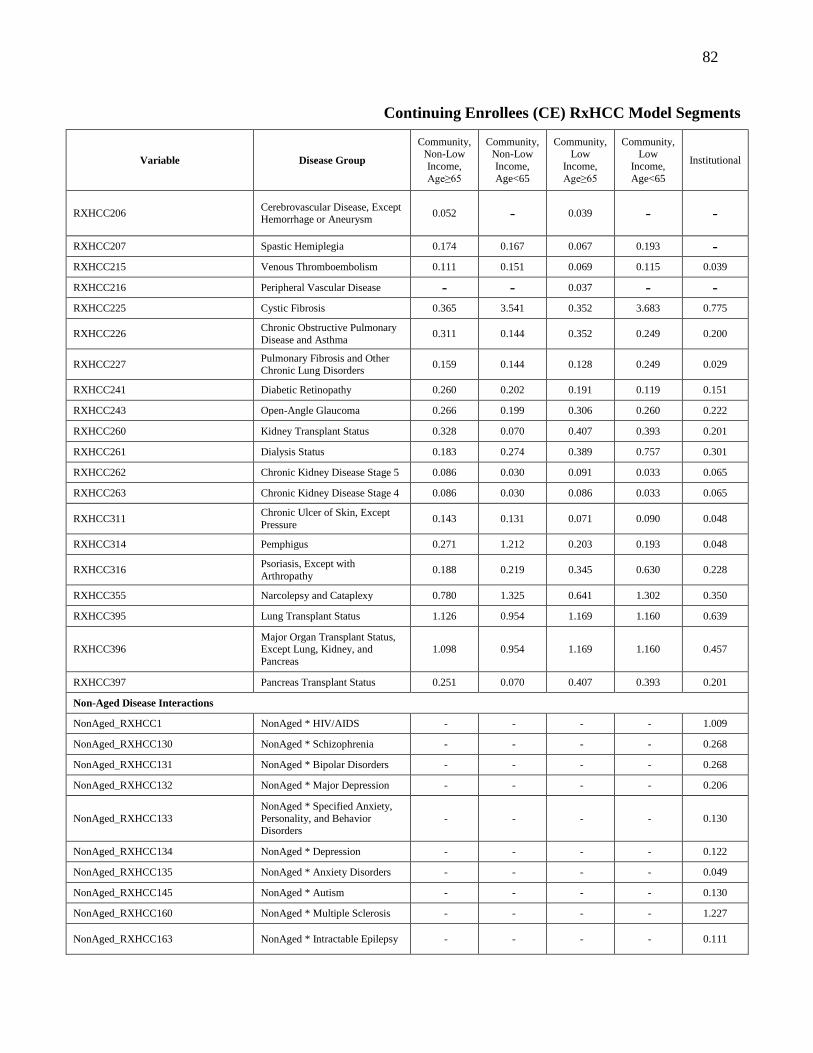
82
Continuing Enrollees (CE) RxHCC Model Segments
Variable Disease Group
Community, Non-Low
Income,
Age≥65
Community, Non-Low
Income,
Age<65
Community, Low
Income,
Age≥65
Community, Low
Income,
Age<65
Institutional
RXHCC206 Cerebrovascular Disease, Except Hemorrhage or Aneurysm
0.052 - 0.039 - -
RXHCC207 Spastic Hemiplegia 0.174 0.167 0.067 0.193 -
RXHCC215 Venous Thromboembolism 0.111 0.151 0.069 0.115 0.039
RXHCC216 Peripheral Vascular Disease - - 0.037 - -
RXHCC225 Cystic Fibrosis 0.365 3.541 0.352 3.683 0.775
RXHCC226 Chronic Obstructive Pulmonary
Disease and Asthma 0.311 0.144 0.352 0.249 0.200
RXHCC227 Pulmonary Fibrosis and Other Chronic Lung Disorders
0.159 0.144 0.128 0.249 0.029
RXHCC241 Diabetic Retinopathy 0.260 0.202 0.191 0.119 0.151
RXHCC243 Open-Angle Glaucoma 0.266 0.199 0.306 0.260 0.222
RXHCC260 Kidney Transplant Status 0.328 0.070 0.407 0.393 0.201
RXHCC261 Dialysis Status 0.183 0.274 0.389 0.757 0.301
RXHCC262 Chronic Kidney Disease Stage 5 0.086 0.030 0.091 0.033 0.065
RXHCC263 Chronic Kidney Disease Stage 4 0.086 0.030 0.086 0.033 0.065
RXHCC311 Chronic Ulcer of Skin, Except
Pressure 0.143 0.131 0.071 0.090 0.048
RXHCC314 Pemphigus 0.271 1.212 0.203 0.193 0.048
RXHCC316 Psoriasis, Except with
Arthropathy 0.188 0.219 0.345 0.630 0.228
RXHCC355 Narcolepsy and Cataplexy 0.780 1.325 0.641 1.302 0.350
RXHCC395 Lung Transplant Status 1.126 0.954 1.169 1.160 0.639
RXHCC396 Major Organ Transplant Status, Except Lung, Kidney, and
Pancreas
1.098 0.954 1.169 1.160 0.457
RXHCC397 Pancreas Transplant Status 0.251 0.070 0.407 0.393 0.201
Non-Aged Disease Interactions
NonAged_RXHCC1 NonAged * HIV/AIDS - - - - 1.009
NonAged_RXHCC130 NonAged * Schizophrenia - - - - 0.268
NonAged_RXHCC131 NonAged * Bipolar Disorders - - - - 0.268
NonAged_RXHCC132 NonAged * Major Depression - - - - 0.206
NonAged_RXHCC133
NonAged * Specified Anxiety,
Personality, and Behavior Disorders
- - - - 0.130
NonAged_RXHCC134 NonAged * Depression - - - - 0.122
NonAged_RXHCC135 NonAged * Anxiety Disorders - - - - 0.049
NonAged_RXHCC145 NonAged * Autism - - - - 0.130
NonAged_RXHCC160 NonAged * Multiple Sclerosis - - - - 1.227
NonAged_RXHCC163 NonAged * Intractable Epilepsy - - - - 0.111

83
Continuing Enrollees (CE) RxHCC Model Segments
Variable Disease Group
Community, Non-Low
Income,
Age≥65
Community, Non-Low
Income,
Age<65
Community, Low
Income,
Age≥65
Community, Low
Income,
Age<65
Institutional
NonAged_RXHCC164
NonAged * Epilepsy and Other
Seizure Disorders, Except
Intractable Epilepsy
- - - - -
NonAged_RXHCC165 NonAged * Convulsions - - - - -
Note: The Part D Denominator used to calculate relative factors is $1,014.31. This Part D Denominator is based on
the combined PDP and MA-PD populations.
Source: RTI Analysis of 100% 2014 PDE, 2013 Carrier NCH, 2013 Inpatient SAF, 2013 Outpatient SAF, 2014
HPMS, 2014 CME, 2013-2014 Denominator, Part D Intermediate File, and 2013 Medicare Advantage Diagnoses
File.

84
Table 6. RxHCC Model Relative Factors for New Enrollees, Non‑Low Income
Variable
Not
Concurrently
ESRD, Not
Originally
Disabled
Concurrently
ESRD, Not
Originally
Disabled
Originally
Disabled, Not
Concurrently
ESRD
Originally
Disabled,
Concurrently
ESRD
Female
0-34 Years 0.653 0.653 - -
35-44 Years 1.074 1.100 - -
45-54 Years 1.290 1.536 - -
55-59 Years 1.228 1.732 - -
60-64 Years 1.227 1.898 - -
65 Years 0.562 1.756 1.163 1.756
66 Years 0.616 1.756 1.111 1.756
67 Years 0.623 1.756 1.111 1.756
68 Years 0.645 1.756 1.111 1.756
69 Years 0.669 1.756 1.111 1.756
70-74 Years 0.688 1.756 1.100 1.756
75-79 Years 0.687 1.756 0.687 1.756
80-84 Years 0.643 1.756 0.643 1.756
85-89 Years 0.537 1.756 0.537 1.756
90-94 Years 0.317 1.756 0.317 1.756
95 Years or Over 0.317 1.756 0.317 1.756
Male
0-34 Years 0.427 0.714 - -
35-44 Years 0.803 0.885 - -
45-54 Years 1.091 1.493 - -
55-59 Years 1.152 1.493 - -
60-64 Years 1.110 1.836 - -
65 Years 0.595 1.773 0.961 1.773
66 Years 0.657 1.773 0.925 1.773
67 Years 0.668 1.773 0.925 1.773
68 Years 0.686 1.773 0.925 1.773
69 Years 0.714 1.773 0.925 1.773
70-74 Years 0.745 1.773 0.762 1.773
75-79 Years 0.737 1.773 0.737 1.773
80-84 Years 0.657 1.773 0.657 1.773
85-89 Years 0.545 1.773 0.545 1.773
90-94 Years 0.332 1.773 0.332 1.773
95 Years or Over 0.332 1.773 0.332 1.773
Notes:
1. The Part D Denominator used to calculate relative factors is $1,014.31. This Part D Denominator is based on
the combined PDP and MA-PD populations.
2. Originally Disabled is defined as originally entitled to Medicare by disability only (OREC = 1).
3. For new enrollees, the concurrent ESRD marker is defined as at least one month in the payment year of ESRD
status—dialysis, transplant, or post-graft.
Source: RTI Analysis of 100% 2014 PDE, 2013 Carrier NCH, 2013 Inpatient SAF, 2013 Outpatient SAF, 2014
HPMS, 2014 CME, 2013-2014 Denominator, Part D Intermediate File, and 2013 Medicare Advantage Diagnoses
File.

85
Table 7. RxHCC Model Relative Factors for New Enrollees, Low Income
Variable
Not
Concurrently
ESRD, Not
Originally
Disabled
Concurrently
ESRD, Not
Originally
Disabled
Originally
Disabled, Not
Concurrently
ESRD
Originally
Disabled,
Concurrently
ESRD
Female
0-34 Years 1.003 2.079 - -
35-44 Years 1.494 2.079 - -
45-54 Years 1.538 2.170 - -
55-59 Years 1.428 2.224 - -
60-64 Years 1.325 2.081 - -
65 Years 0.924 2.084 1.186 2.084
66 Years 0.600 2.084 0.906 2.084
67 Years 0.600 2.084 0.906 2.084
68 Years 0.600 2.084 0.906 2.084
69 Years 0.600 2.084 0.906 2.084
70-74 Years 0.616 2.084 0.749 2.084
75-79 Years 0.683 2.084 0.683 2.084
80-84 Years 0.683 2.084 0.683 2.084
85-89 Years 0.683 2.084 0.683 2.084
90-94 Years 0.534 2.084 0.534 2.084
95 Years or Over 0.534 2.084 0.534 2.084
Male
0-34 Years 0.869 2.154 - -
35-44 Years 1.265 2.125 - -
45-54 Years 1.390 2.131 - -
55-59 Years 1.251 1.968 - -
60-64 Years 1.161 1.847 - -
65 Years 0.831 1.921 0.978 1.921
66 Years 0.507 1.921 0.569 1.921
67 Years 0.507 1.921 0.569 1.921
68 Years 0.507 1.921 0.569 1.921
69 Years 0.507 1.921 0.569 1.921
70-74 Years 0.523 1.921 0.612 1.921
75-79 Years 0.536 1.921 0.536 1.921
80-84 Years 0.559 1.921 0.559 1.921
85-89 Years 0.487 1.921 0.487 1.921
90-94 Years 0.362 1.921 0.362 1.921
95 Years or Over 0.362 1.921 0.362 1.921
Notes:
1. The Part D Denominator used to calculate relative factors is $1,014.31. This Part D Denominator is based on
the combined PDP and MA-PD populations.
2. Originally Disabled is defined as originally entitled to Medicare by disability only (OREC = 1).
3. For new enrollees, the concurrent ESRD marker is defined as at least one month in the payment year of ESRD
status—dialysis, transplant, or post-graft.
Source: RTI Analysis of 100% 2014 PDE, 2013 Carrier NCH, 2013 Inpatient SAF, 2013 Outpatient SAF, 2014
HPMS, 2014 CME, 2013-2014 Denominator, Part D Intermediate File, and 2013 Medicare Advantage Diagnoses
File.

86
Table 8. RxHCC Model Relative Factors for New Enrollees, Institutional
Variable
Not
Concurrently
ESRD
Concurrently
ESRD
Female
0-34 Years 2.353 2.767
35-44 Years 2.353 2.767
45-54 Years 2.405 2.767
55-59 Years 2.400 2.767
60-64 Years 2.137 2.767
65 Years 2.280 2.767
66 Years 1.970 2.767
67 Years 1.970 2.767
68 Years 1.970 2.767
69 Years 1.970 2.767
70-74 Years 1.820 2.767
75-79 Years 1.545 2.767
80-84 Years 1.514 2.767
85-89 Years 1.321 2.767
90-94 Years 1.082 2.767
95 Years or Over 1.082 2.767
Male
0-34 Years 2.290 2.614
35-44 Years 2.692 2.614
45-54 Years 2.340 2.614
55-59 Years 2.124 2.614
60-64 Years 2.011 2.614
65 Years 2.002 2.614
66 Years 1.889 2.614
67 Years 1.889 2.614
68 Years 1.889 2.614
69 Years 1.889 2.614
70-74 Years 1.791 2.614
75-79 Years 1.676 2.614
80-84 Years 1.467 2.614
85-89 Years 1.343 2.614
90-94 Years 1.343 2.614
95 Years or Over 1.343 2.614
Notes:
1. The Part D Denominator used to calculate relative factors is $1,014.31. This Part D Denominator is based on
the combined PDP and MA-PD populations.
2. For new enrollees, the concurrent ESRD marker is defined as at least one month in the payment year of ESRD
status—dialysis, transplant, or post-graft.
Source: RTI Analysis of 100% 2014 PDE, 2013 Carrier NCH, 2013 Inpatient SAF, 2013 Outpatient SAF, 2014
HPMS, 2014 CME, 2013-2014 Denominator, Part D Intermediate File, and 2013 Medicare Advantage Diagnoses
File.

87
Table 9. List of Disease Hierarchies for RxHCC Model
Rx Hierarchical Condition
Category (RxHCC) If the Disease Group is listed in this column…
…Then drop the Disease Group(s) listed in
this column
Rx Hierarchical Condition Category (RxHCC) LABEL 15 Chronic Myeloid Leukemia 16 ,17 ,18 ,19 ,96 ,98
16 Multiple Myeloma and Other Neoplastic Disorders 17 ,18 ,19 ,96 ,98
17 Secondary Cancers of Bone, Lung, Brain, and Other Specified Sites; Liver Cancer
18 ,19
18 Lung, Kidney, and Other Cancers 19
30 Diabetes with Complications 31
54 Chronic Viral Hepatitis C 55
65 Chronic Pancreatitis 66
82 Psoriatic Arthropathy and Systemic Sclerosis 83 ,84 ,316
83 Rheumatoid Arthritis and Other Inflammatory Polyarthropathy 84
95 Sickle Cell Anemia 98
96 Myelodysplastic Syndromes and Myelofibrosis 98
111 Alzheimer's Disease 112
130 Schizophrenia 131 ,132 ,133 ,134 ,135 ,145 ,146 ,147 ,148
131 Bipolar Disorders 132 ,133 ,134 ,135
132 Major Depression 133 ,134 ,135
133 Specified Anxiety, Personality, and Behavior Disorders 134 ,135
134 Depression 135
145 Autism 133 ,134 ,135 ,146 ,147 ,148
146 Profound or Severe Intellectual Disability/Developmental Disorder 147 ,148
147 Moderate Intellectual Disability/Developmental Disorder 148
163 Intractable Epilepsy 164 ,165
164 Epilepsy and Other Seizure Disorders, Except Intractable Epilepsy 165
185 Primary Pulmonary Hypertension 186 ,187
186 Congestive Heart Failure 187
225 Cystic Fibrosis 226 ,227
226 Chronic Obstructive Pulmonary Disease and Asthma 227
260 Kidney Transplant Status 261 ,262 ,263 ,397
261 Dialysis Status 262 ,263
262 Chronic Kidney Disease Stage 5 263
395 Lung Transplant Status 396 ,397
396 Major Organ Transplant Status, Except Lung, Kidney, and Pancreas 397
How Payments are made with a Disease Hierarchy: EXAMPLE: If a beneficiary triggers Disease Groups 163
(Intractable Epilepsy) and 164 (Epilepsy and Other Seizure Disorders, Except Intractable Epilepsy), then DG 164
will be dropped. In other words, payment will always be associated with the DG in column 1, if a DG in column 3
also occurs during the same collection period. Therefore, the organization’s payment will be based on DG 163 rather
than DG 164.
Source: RTI International.

88
Attachment VI. CY2017 Draft Call Letter
CY2017 Call Letter
Table of Contents
How to Use This Call Letter . . . . . . . . . . . . . . . . . . . . . . . . . . . . . . . . . . . . . . . . . . . . . . 91
Section I – Parts C and D . . . . . . . . . . . . . . . . . . . . . . . . . . . . . . . . . . . . . . . . . . . . . . . . 92
Annual Calendar . . . . . . . . . . . . . . . . . . . . . . . . . . . . . . . . . . . . . . . . . . . . . . . . . . . 92
Incomplete and Inaccurate Bid Submissions . . . . . . . . . . . . . . . . . . . . . . . . . . . . . . . 98
Incomplete Submissions . . . . . . . . . . . . . . . . . . . . . . . . . . . . . . . . . . . . . . . . . . . 98
Inaccurate Submissions . . . . . . . . . . . . . . . . . . . . . . . . . . . . . . . . . . . . . . . . . . . . 99
Plan Corrections . . . . . . . . . . . . . . . . . . . . . . . . . . . . . . . . . . . . . . . . . . . . . . . . . . 100
Contracting Organizations with Ratings of Fewer Than Three Stars in Three
Consecutive Years – Timeline for Application of Termination Authority . . . . . 100
Enhancements to the 2017 Star Ratings and Beyond . . . . . . . . . . . . . . . . . . . . . . . . 101
Medicare Parts C & D Program Audits . . . . . . . . . . . . . . . . . . . . . . . . . . . . . . . . . . 151
Proposed Release Date for the 2017 Part C and Part D Program Audit Protocols . 151
Medicare Parts C & D Enforcement Actions . . . . . . . . . . . . . . . . . . . . . . . . . . . . . . 153
Civil Money Penalty (CMP) Calculation Methodology . . . . . . . . . . . . . . . . . . . . 153
Compliance and Enforcement Actions Related to Part D Auto-Forwards . . . . . . . 153
Enforcement Actions Related to One Third Financial Audit Findings . . . . . . . . . 154
Innovations in Health Plan Design . . . . . . . . . . . . . . . . . . . . . . . . . . . . . . . . . . . . . 154
Medicare Advantage Value-Based Insurance Design Model Test . . . . . . . . . . . . 154
Part D Enhanced MTM Model . . . . . . . . . . . . . . . . . . . . . . . . . . . . . . . . . . . . . 155
Section II – Part C . . . . . . . . . . . . . . . . . . . . . . . . . . . . . . . . . . . . . . . . . . . . . . . . . . . . 155
Guidance on the Future of Provider Directory Requirements and Best Practices . . . . 155
Overview of CY 2017 Benefits and Bid Review . . . . . . . . . . . . . . . . . . . . . . . . . . . 157
Plans with Low Enrollment . . . . . . . . . . . . . . . . . . . . . . . . . . . . . . . . . . . . . . . . . . 158
Meaningful Difference (Substantially Duplicative Plan Offerings) . . . . . . . . . . . . . . 159
Total Beneficiary Cost (TBC) . . . . . . . . . . . . . . . . . . . . . . . . . . . . . . . . . . . . . . . . . 161
Maximum Out-of-Pocket (MOOP) Limits . . . . . . . . . . . . . . . . . . . . . . . . . . . . . . . . 163
Per Member Per Month (PMPM) Actuarial Equivalent (AE) Cost Sharing Limits . . . 165
Part C Cost Sharing Standards . . . . . . . . . . . . . . . . . . . . . . . . . . . . . . . . . . . . . . . . 165
Part C Optional Supplemental Benefits . . . . . . . . . . . . . . . . . . . . . . . . . . . . . . . . . . 168
Plan Benefit Package (PBP) Updates and Guidance . . . . . . . . . . . . . . . . . . . . . . . . . 168
Medical Services Performed in Multiple Health Care Settings . . . . . . . . . . . . . . 168
Medicare-Covered Preventive Services . . . . . . . . . . . . . . . . . . . . . . . . . . . . . . . 171
Policy Updates . . . . . . . . . . . . . . . . . . . . . . . . . . . . . . . . . . . . . . . . . . . . . . . . . . . . 171
Tiered Cost Sharing of Medical Benefits . . . . . . . . . . . . . . . . . . . . . . . . . . . . . . 171
Cost Sharing /Bundling and Facility . . . . . . . . . . . . . . . . . . . . . . . . . . . . . . . . . 171

89
Interoperability-MA Plans and Contracted Providers . . . . . . . . . . . . . . . . . . . . . 173
Alternative Payment Models (APMs) . . . . . . . . . . . . . . . . . . . . . . . . . . . . . . . . 173
Connecting Beneficiaries to Care . . . . . . . . . . . . . . . . . . . . . . . . . . . . . . . . . . . 174
Counseling and Related Support Services . . . . . . . . . . . . . . . . . . . . . . . . . . . . . 174
Prohibition on Billing Medicare-Medicaid Enrollees for Medicare Cost-Sharing . 174
Medicare Advantage Organization Responsibilities for Clinical Trials . . . . . . . . 176
Dual-Eligible Special Needs Plans . . . . . . . . . . . . . . . . . . . . . . . . . . . . . . . . . . . . . 177
D-SNP Non-Renewals . . . . . . . . . . . . . . . . . . . . . . . . . . . . . . . . . . . . . . . . . . . 177
D-SNP Model of Care . . . . . . . . . . . . . . . . . . . . . . . . . . . . . . . . . . . . . . . . . . . 177
Section III – Part D . . . . . . . . . . . . . . . . . . . . . . . . . . . . . . . . . . . . . . . . . . . . . . . . . . . 178
Formulary Submissions . . . . . . . . . . . . . . . . . . . . . . . . . . . . . . . . . . . . . . . . . . . . . 178
CY 2017 Formulary Submission Window . . . . . . . . . . . . . . . . . . . . . . . . . . . . . 178
CY 2017 Formulary Reference File . . . . . . . . . . . . . . . . . . . . . . . . . . . . . . . . . . 178
Appropriate Utilization of Prior Authorization Requirements to Determine Part D
Drug Status . . . . . . . . . . . . . . . . . . . . . . . . . . . . . . . . . . . . . . . . . . . . . . . 179
Medication Therapy Management (MTM) . . . . . . . . . . . . . . . . . . . . . . . . . . . . . . . . 180
Annual MTM Eligibility Cost Threshold . . . . . . . . . . . . . . . . . . . . . . . . . . . . . . 180
Annual MTM Submission and Approval Process . . . . . . . . . . . . . . . . . . . . . . . . 181
Submission Requirements for Enhanced MTM Model Participants . . . . . . . . . . . 182
Part D Reporting Requirements for MTM . . . . . . . . . . . . . . . . . . . . . . . . . . . . . 182
Improving Clinical Decision-Making for Certain Part D Coverage Determinations . . 183
Access to Preferred Cost-Sharing Pharmacies . . . . . . . . . . . . . . . . . . . . . . . . . . . . . 185
Part D Benefit Parameters for Non-Defined Standard Plans . . . . . . . . . . . . . . . . . . . 186
Tier Labeling and Composition . . . . . . . . . . . . . . . . . . . . . . . . . . . . . . . . . . . . . 186
Benefit Review . . . . . . . . . . . . . . . . . . . . . . . . . . . . . . . . . . . . . . . . . . . . . . . . 188
Specialty Tiers . . . . . . . . . . . . . . . . . . . . . . . . . . . . . . . . . . . . . . . . . . . . . . . . . 192
Generic Tier $0 Copay Plans . . . . . . . . . . . . . . . . . . . . . . . . . . . . . . . . . . . . . . . 193
Part D Employer Group Waiver Plans (EGWPs) . . . . . . . . . . . . . . . . . . . . . . . . . . . 194
Improving Drug Utilization Review Controls in Medicare Part D . . . . . . . . . . . . . . . 196
New Expectation for Entering Opioid Point of Sale Claims Edit Information in
the Medicare Advantage and Prescription Drug System (MARx) . . . . . . . . 197
Results of Overutilization Policy . . . . . . . . . . . . . . . . . . . . . . . . . . . . . . . . . . . . 198
Updates to Overutilization Policy for Contract Year (CY) 2017 . . . . . . . . . . . . . . . . 199
Discontinuation of APAP Reporting through the OMS . . . . . . . . . . . . . . . . . . . . 199
Opioids . . . . . . . . . . . . . . . . . . . . . . . . . . . . . . . . . . . . . . . . . . . . . . . . . . . . . . 199
Point of Sale Pilot . . . . . . . . . . . . . . . . . . . . . . . . . . . . . . . . . . . . . . . . . . . . . . . . . 207
Extended Days’ Supply and First Fill Quantity Limits . . . . . . . . . . . . . . . . . . . . . . . 208
Establishing Mail Order Protocols for Urgent Need Fills to Prevent Gaps in Therapy 209

90
Coordination of Benefits (COB) User Fee . . . . . . . . . . . . . . . . . . . . . . . . . . . . . . . . 210
Part D Low Enrollment . . . . . . . . . . . . . . . . . . . . . . . . . . . . . . . . . . . . . . . . . . . . . 210
Section IV – Medicare-Medicaid Plans . . . . . . . . . . . . . . . . . . . . . . . . . . . . . . . . . . . . . 211
Medicare-Medicaid Plan Annual Requirements and Timeline for CY 2017 . . . . . . . . 211
Network Adequacy Determinations . . . . . . . . . . . . . . . . . . . . . . . . . . . . . . . . . . 212
Model of Care (MOC) . . . . . . . . . . . . . . . . . . . . . . . . . . . . . . . . . . . . . . . . . . . 212
Formulary and Supplemental Drug Files . . . . . . . . . . . . . . . . . . . . . . . . . . . . . . 213
Plan Benefit Package (PBP) . . . . . . . . . . . . . . . . . . . . . . . . . . . . . . . . . . . . . . . 213
Past Performance Information and Eligibility for Passive and Opt-in Enrollment . 215
Appendix 1 – Contract Year 2017 Guidance for Prescription Drug Plan (PDP) Renewals
and Non-Renewals (Updated) . . . . . . . . . . . . . . . . . . . . . . . . . . . . . . . . . . . . . . . 216
1. New Plan Added . . . . . . . . . . . . . . . . . . . . . . . . . . . . . . . . . . . . . . . . . . . . . . . . 217
2. Renewal Plan . . . . . . . . . . . . . . . . . . . . . . . . . . . . . . . . . . . . . . . . . . . . . . . . . . . 217
3. Consolidated Renewal Plan. . . . . . . . . . . . . . . . . . . . . . . . . . . . . . . . . . . . . . . . . 217
4. Renewal Plan with a Service Area Expansion (“800 Series” EGWPs only). . . . . . 218
5. Terminated Plan (Non-Renewal) . . . . . . . . . . . . . . . . . . . . . . . . . . . . . . . . . . . . . 218
6. Consolidated Plans Under a Parent Organization . . . . . . . . . . . . . . . . . . . . . . . . . 218
Appendix 2 – Contract Year 2017 Guidance for Prescription Drug Plan (PDP) Renewals
and Non-Renewals Table . . . . . . . . . . . . . . . . . . . . . . . . . . . . . . . . . . . . . . . . . . 220
Appendix 3 – Improvement Measures (Part C & D) . . . . . . . . . . . . . . . . . . . . . . . . . . . 226

91
How to Use This Call Letter
The 2017 Call Letter contains information on the Part C and Part D programs that Medicare
Advantage Organizations (MAOs), Part D sponsors, and Medicare-Medicaid Plans (MMPs) need
to take into consideration in preparing their 2017 bids.
CMS has designed the policies contained in this Call Letter to improve the overall management
of the Medicare Advantage and Prescription Drug programs with four major outcomes in mind.
These outcomes are: 1) improvement in quality of care for individuals, 2) promotion of
alternative payment models, 3) program integrity and beneficiary/tax-payer value, and 4)
improvement in beneficiary experience. This year, to achieve these outcomes, CMS’s Call Letter
activities follow four major themes: improving bid review, decreasing costs, promoting creative
benefit designs, and improving beneficiary protections.
If you have questions concerning this Call Letter, please contact: Wanda Pigatt-Canty at
[email protected] (Part C issues), Lucia Patrone at [email protected]
(Part D issues) and [email protected] (MMP issues).
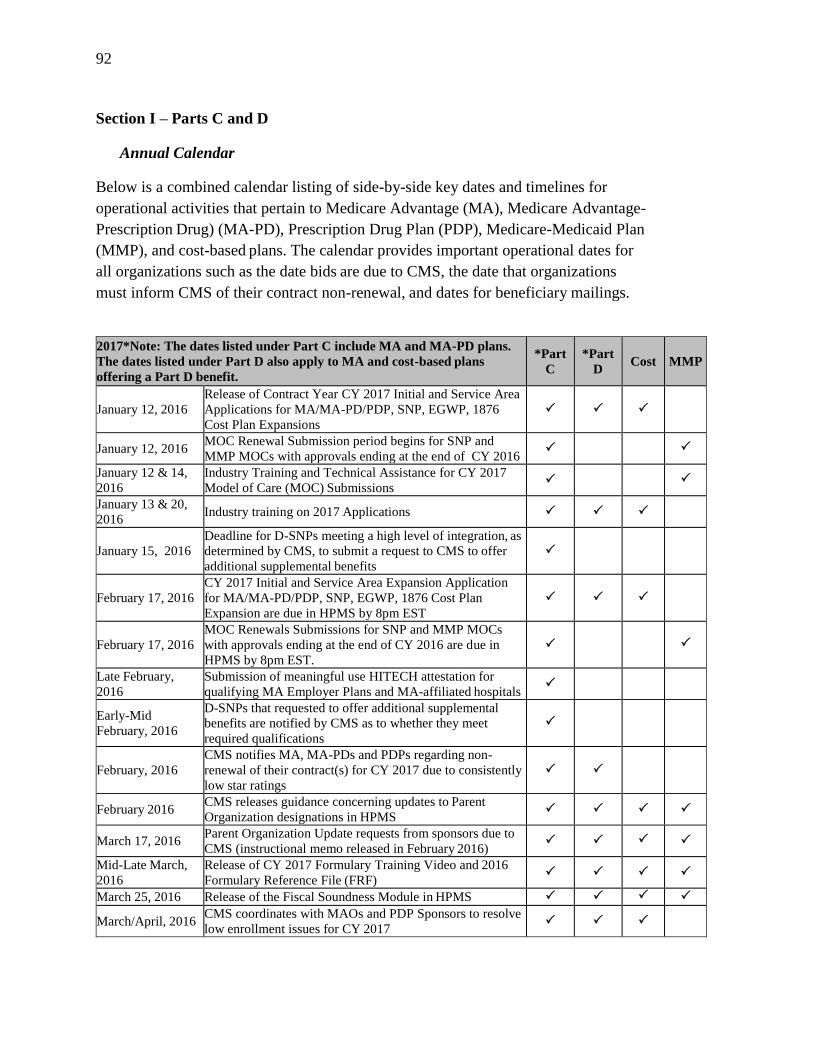
92
Section I – Parts C and D
Annual Calendar
Below is a combined calendar listing of side-by-side key dates and timelines for
operational activities that pertain to Medicare Advantage (MA), Medicare Advantage-
Prescription Drug) (MA-PD), Prescription Drug Plan (PDP), Medicare-Medicaid Plan
(MMP), and cost-based plans. The calendar provides important operational dates for
all organizations such as the date bids are due to CMS, the date that organizations
must inform CMS of their contract non-renewal, and dates for beneficiary mailings.
2017*Note: The dates listed under Part C include MA and MA-PD plans.
The dates listed under Part D also apply to MA and cost-based plans
offering a Part D benefit.
*Part
C
*Part
D Cost MMP
January 12, 2016
Release of Contract Year CY 2017 Initial and Service Area
Applications for MA/MA-PD/PDP, SNP, EGWP, 1876
Cost Plan Expansions
January 12, 2016 MOC Renewal Submission period begins for SNP and
MMP MOCs with approvals ending at the end of CY 2016
January 12 & 14,
2016
Industry Training and Technical Assistance for CY 2017
Model of Care (MOC) Submissions
January 13 & 20,
2016 Industry training on 2017 Applications
January 15, 2016
Deadline for D-SNPs meeting a high level of integration, as
determined by CMS, to submit a request to CMS to offer
additional supplemental benefits
February 17, 2016
CY 2017 Initial and Service Area Expansion Application
for MA/MA-PD/PDP, SNP, EGWP, 1876 Cost Plan
Expansion are due in HPMS by 8pm EST
February 17, 2016
MOC Renewals Submissions for SNP and MMP MOCs
with approvals ending at the end of CY 2016 are due in
HPMS by 8pm EST.
Late February,
2016
Submission of meaningful use HITECH attestation for
qualifying MA Employer Plans and MA-affiliated hospitals
Early-Mid
February, 2016
D-SNPs that requested to offer additional supplemental
benefits are notified by CMS as to whether they meet
required qualifications
February, 2016
CMS notifies MA, MA-PDs and PDPs regarding non-
renewal of their contract(s) for CY 2017 due to consistently
low star ratings
February 2016 CMS releases guidance concerning updates to Parent
Organization designations in HPMS
March 17, 2016 Parent Organization Update requests from sponsors due to
CMS (instructional memo released in February 2016)
Mid-Late March,
2016
Release of CY 2017 Formulary Training Video and 2016
Formulary Reference File (FRF)
March 25, 2016 Release of the Fiscal Soundness Module in HPMS
March/April, 2016 CMS coordinates with MAOs and PDP Sponsors to resolve
low enrollment issues for CY 2017

93
2017*Note: The dates listed under Part C include MA and MA-PD plans.
The dates listed under Part D also apply to MA and cost-based plans
offering a Part D benefit.
*Part
C
*Part
D Cost MMP
Early April, 2016
CY 2017 Out Of Pocket Cost (OOPC) model and OOPC
estimates for each plan made available to MAOs, 1876 Cost
Plans submitting MA conversion bids, and Part D sponsors
for download from the CMS website. Information will assist
plans in meeting meaningful difference and Total
Beneficiary Cost (TBC) requirements prior to bid
submission
Early April, 2016 Information about renewal options for contract year 2017
(including HPMS crosswalk charts) provided to plans
April 2016 Conference call with industry to discuss the 2017 Call
Letter
April 4, 2016
Release of the 2017 Final Announcement of Medicare
Advantage Capitation Rates and MA and Part D Payment
Policies released, including the CY 2017 Call Letter
April 6, 2016 Industry training on CY 2017 Formulary Submission
April 8, 2016 Release of the 2017 Plan Benefit Package (PBP) online
training module
April 8, 2016 Release of the 2017 Plan Creation Module, PBP, and Bid
Pricing Tool (BPT) software in HPMS
April 11, 2016 Deadline for MAOs to submit requests for full contract
consolidations for CY 2017
Mid-April, 2016 Release of HPMS Memo: Contract Year 2017 Medicare
Advantage Bid Review and Operations Guidance
April 18, 2016 Release of the 2017 Medication Therapy Management
(MTM) Program Submission in HPMS
April 22, 2016 Industry training dedicated to Annual Part D Formulary and
Benefit Compliance Training
Mid-Late April,
2016
MAOs submit plan requests for tiering of medical benefits
and justifications to CMS for review and consideration
Late April, 2016 Total Beneficiary Cost data for CY 2017 Bid Preparation
Release
May, 2016
Final ANOC/EOC, LIS rider, Part D EOB, formularies,
transition notice, provider directory, pharmacy directory,
and MMP models for 2017 available for all organizations
May 1, 2016
MA, MA-PD and PDP plans to notify CMS of intention to
non- renew a county (ies) for individuals, but continue the
county (ies) for “800 series” EGWP members, convert to
offering employer-only contracts, or reduce its service area
at the contract level. This will allow CMS to make the
required changes in HPMS to facilitate the correct upload of
bids in June
May 2, 2016
Deadline for submission of CY 2017 MTM Programs from
all sponsors offering Part D including Medicare-Medicaid
Plans (except those participating in the Enhanced MTM
Model test) (11:59pm PDT)

94
2017*Note: The dates listed under Part C include MA and MA-PD plans.
The dates listed under Part D also apply to MA and cost-based plans
offering a Part D benefit.
*Part
C
*Part
D Cost MMP
May 5, 2016 2016 Medicare Advantage & Prescription Drug Plan Spring
Conference & Webcast
May 6, 2016 Release of the 2017 Bid Upload Functionality in HPMS
May 6, 2016 Release of 2017 Actuarial Certification Module in HPMS
May 16, 2016 Release of 2017 Formulary Submission Module in HPMS
Mid-Late May,
2016 Release of CY 2017 Formulary Reference File Update
May 27, 2016 Plans/Part D sponsors begin to upload agent/broker
compensation information in HPMS
May 27, 2016
Release of the 2017 Marketing Module in HPMS.
Plans/Part D sponsors begin to submit 2017 marketing
materials
Late May/Early
June, 2016
Release of the 2017 Medicare Marketing Guidelines in
HPMS
Late May, 2016
CMS sends qualification determinations to applicants based
on review of the 2017 applications for new contracts or
service area expansions
June 2016 Release of state-specific marketing guidance for MMPs.
June 1, 2016 Release of the 2015 DIR Submission Module in HPMS
June 6, 2016
Deadline for submission of CY 2017 bids (including
Service Area Verification) for all MA plans, MA-PD plans,
PDP, cost-based plans offering a Part D benefit, Medicare-
Medicaid Plans (MMPs), “800 series” EGWP and direct
contract EGWP applicants and renewing organizations;
deadline for cost-based plans wishing to appear in the 2017
Medicare Plan Finder to submit PBPs (11:59 p.m. PDT)
Deadline for submission of CY 2017 Formularies,
Transition Attestations, Prior Authorization/Step Therapy
(PA/ST) Attestations, and P&T Attestations due from all
sponsors offering Part D including Medicare-Medicaid
Plans (11:59 p.m. PDT)
Deadline for submission of a CY 2017 contract non-
renewal, service area reduction notice to CMS from MA
plans, MA-PD plans, PDPs and Medicare cost-based
contractors and cost- based sponsors to Deadline also
applies to an MAO that intends to terminate a current MA
and/or MA-PD plan benefit package (i.e., Plan 01, Plan 02)
for CY 2017
Non-
bid
related
items
only
Early June to Early
September, 2016
CMS completes review and approval of 2017 bid data.
Plans/Part D sponsors submit attestations, contracts, initial
actuarial certifications, and final actuarial certifications
June 7-10, 2016 Window for submitting first round of crosswalk exception
requests through HPMS
June 10, 2016
Deadline for submission of CY 2017 Supplemental
Formulary files, Free First Fill file, Partial Gap file,
Excluded Drug file, Over the Counter (OTC) drug file,
Home Infusion file, and Non-Extended Day Supply file
through HPMS (11:59 a.m. EDT)

95
2017*Note: The dates listed under Part C include MA and MA-PD plans.
The dates listed under Part D also apply to MA and cost-based plans
offering a Part D benefit.
*Part
C
*Part
D Cost MMP
June 10, 2016
Deadline for submission of Medicare Advantage Value
Based Insurance Design (VBID) file (Only applicable to
Medicare Advantage Plans that have been preapproved for
Part D VBID benefits) (11:59 a.m. EDT)
June 10, 2016
Deadline for submission of Additional Demonstration Drug
(ADD) file (Medicare-Medicaid Plans Only) (11:59 a.m.
EDT)
June 16, 2016 2016 MA and PDP Audit and Enforcement Conference and
Webcast
Late June, 2016
CMS sends an acknowledgement letter to all MA, MA-PD,
MMP, PDP and Medicare cost-based plans that are non-
renewing or reducing their service area
Early July, 2016 2017 Plan Finder pricing test submissions begin
July 1, 2016 Deadline for D-SNPs to upload required State Medicaid
Agency Contract and Contract Matrix to HPMS
July 1, 2016
Deadline for D-SNPs requesting to be reviewed as Fully
Integrated Dual-Eligible (FIDE) SNPs to submit their FIDE
SNP Matrix to HPMS.
July 5, 2016 Plans’ deadline to submit non-model Low Income Subsidy
(LIS) riders to the appropriate Regional Office for review.
Mid July 2016 Release of CY 2017 FRF Update in advance of the Limited
Formulary Update Window
Mid-Late July,
2016 CY 2017 Limited Formulary Update Window
Late July, 2016 Submission deadline for agent/broker compensation
information via HPMS
Mid-Late July 2016 Second window for submitting HPMS crosswalk exceptions
Late July / Early
August, 2016
CMS releases the 2017 Part D national average monthly bid
amount, the Medicare Part D base beneficiary premium, the
Part D regional low-income premium subsidy amounts, the
Medicare Advantage regional PPO benchmarks, and the de
minimis amount
Late July / Early
August, 2016
Rebate reallocation period begins after release of the above
bid amounts
No Later Than July
29, 2016
CMS informs currently contracted organizations of its
decision to not renew a contract for 2017
August 1, 2016 Plans expected to submit model Low Income Subsidy (LIS)
riders in HPMS
August 16, 2016
Deadline for organizations to complete the plan
connectivity data in HPMS to ensure timely approval of
contracts.
August 18-22,
2016
CY 2017 preview of the 2017 Medicare & You plan data in
HPMS prior to printing of the CMS publication (not
applicable to EGWPs)

96
2017*Note: The dates listed under Part C include MA and MA-PD plans.
The dates listed under Part D also apply to MA and cost-based plans
offering a Part D benefit.
*Part
C
*Part
D Cost MMP
August 24-26, 2016 First CY 2017 Medicare Plan Finder (MPF) Preview and
Out- of-Pocket Cost (OOPC) Preview in HPMS
MPF
only
August 31, 2016 2017 MTM Program Annual Review completed
Late August 2016 Contracting Materials submitted to CMS
End of
August/Early
September 2016
Plan preview periods of Part C & D Star Ratings in HPMS
Early September
2016
CMS begins accepting plan correction requests upon
contract approval
Mid- September
2016
All 2017 contracts fully executed (signed by both parties:
Part C/Part D Sponsor and CMS)
September 6-9,
2016
Second CY 2017Medicare Plan Finder (MPF) Preview and
Out-of-Pocket Cost (OOPC) Preview in HPMS
MPF
only
September 16 -30,
2016
CMS mails the 2017 Medicare & You handbook to
Medicare beneficiaries
Late September,
2016
D-SNPs that requested review for FIDE SNP determination
notified as to whether they meet required qualifications
September 21,
2016
Deadline for Part D sponsors, cost-based, MA and MA-PD
organizations to request a plan correction to the plan benefit
package (PBP) via HPMS.
September 30,
2016
The following documents are due to current enrollees by
September 30, 2016:
Standardized Annual Notice of Change/Evidence of
Coverage (ANOC/EOC) for all MA, MA-PD, PDP, and
cost-based plans (including those not offering Part D and
those that do offer Part D).
Standardized ANOC with the Summary of Benefits for
D-SNPs and MMPs that choose to separate the ANOC
from the EOC.
Abridged or comprehensive formularies
LIS rider
Pharmacy/Provider directories
The multi-language insert should be sent with the
ANOC/EOC and the SB.
The documents identified above are the only documents
permitted to be sent prior to October 1, 2016

97
2017*Note: The dates listed under Part C include MA and MA-PD plans.
The dates listed under Part D also apply to MA and cost-based plans
offering a Part D benefit.
*Part
C
*Part
D Cost MMP
October 1, 2016
Organizations may begin marketing their CY 2017 plan
benefits.
Note: Once an organization begins marketing CY 2017
plans, the organization must cease marketing CY 2016
plans through mass media or direct mail marketing (except
for age-in mailings). Organizations may still provide CY
2016 materials upon request, conduct one-on-one sales
appointments, and process enrollment applications
October 1, 2016
Tentative date for 2017 plan and drug benefit data to be
displayed on Medicare Plan Finder on Medicare.gov (not
applicable to EGWPs)
October 2, 2016
The final personalized beneficiary non-renewal notification
letter must be received by PDP, MA plan, MA-PD plan, and
cost-based plan enrollees
PDPs, MA plans, MA-PD plans, and Medicare cost-based
organizations may not market to beneficiaries of non-
renewing plans until after October 2, 2016
October 13, 2016 Part C & D Star Ratings go live on medicare.gov on or
around October 13, 2016
October 15, 2016 Part D sponsors must post PA and ST criteria on their
websites for the 2017 contract year
October 15, 2016
2017 Annual Election Period begins
All organizations/sponsors must hold open enrollment (for
EGWPs, see Chapter 2 of the Medicare Managed Care
Manual, Section 30.1)
Mid October, 2016
Release of the online CY 2018 Notice of Intent to Apply for
a New Contract or a Contract Expansion (MA, MA-PD,
MMP, PDPs, and “800 series” EGWPs and Direct Contract
EGWPs)
November 14, 2016
Notices of Intent to Apply (NOIA) for CY 2018 due for MA
and MA-PD plans, MMP, PDPs, and “800 series” EGWPs
and Direct Contract EGWPs.
Early November,
2016
First display of Plan Finder data for sponsors/MA
organizations that submitted a plan correction request after
bid approval
Late November,
2016
Part C & D display measures data are posted in HPMS for
plan preview
November –
December, 2016
CMS issues “close out” information and instructions to MA
plans, MA-PD plans, MMPs, PDPs, and cost-based plans
that are non- renewing or reducing service areas
December 1, 2016 Enrollees in Medicare cost-based plans not offering Part D
must receive the combined ANOC/EOC
December 1, 2016 Cost-based plans must publish notice of non-renewal, as per
§417.494 of Title 42 of the CFR.
December 7, 2016 End of the Annual Election Period

98
2017*Note: The dates listed under Part C include MA and MA-PD plans.
The dates listed under Part D also apply to MA and cost-based plans
offering a Part D benefit.
*Part
C
*Part
D Cost MMP
Mid December,
2016 Part C & D display measures data on cms.gov updated
December 31, 2016 Deadline for MMPs that separated the ANOC from the
EOC to provide the EOC to enrollees
2017
January 1, 2017 Plan Benefit Period Begins
January 1 –
February 14, 2017
Annual 45-Day Medicare Advantage Disenrollment Period
(MADP)
Early January 2017 Release of CY 2018 MAO/MA-PD/MMP/PDP/SAE/EGWP
applications
Mid-January, 2017 Industry training on CY 2018 applications
Mid-February 2017 Applications due for CY 2018
Incomplete and Inaccurate Bid Submissions
Incomplete Submissions
Under Sections 1854(a)(1)(A) and 1860D-11(b) of the Social Security Act, initial bid
submissions for all MA, MA-PD, PDPs and cost-based plans are due the first Monday in June
and shall be in a form and manner specified by the Secretary. Therefore, for CY 2017, the bid
submission deadline is June 6, 2016 at 11:59 PM Pacific Daylight Time.
The following components are required, if applicable, to constitute a complete bid submission:
Plan Benefit Package (PBP) and Bid Pricing Tool (BPT)
Service Area Verification (SAV)
Plan Crosswalk (if applicable)
Formulary Submission (if offering a Part D plan with a formulary)
Formulary Crosswalk (if offering a Part D plan with a formulary)
Substantiation (supporting documentation for bid pricing)
Cost-sharing justification (supporting documentation for MA benefit costs)
MA, MA-PD, PDP, and cost-based plans are responsible for confirming that complete and
accurate bids are submitted by the June deadline. Consistent with past years, CMS reminds
organizations that all required components of an organization’s bid must be submitted by the
deadline in order for the bid to be considered complete. If any of the required components are not
submitted by the deadline, the bid submission will be considered incomplete and not accepted by
CMS absent extraordinary circumstances. This policy is consistent with previous years (for
99
example, please refer to the memo “Release of Contract Year (CY) 2016 Bid Upload
Functionality in HPMS,” dated May 8, 2015).
The Health Plan Management System (HPMS) Bid Upload functionality, which is made
available to organizations in May, allows organizations to submit each required bid component
well in advance of the deadline. The Bid Upload functionality includes reporting tools that track
those components that were successfully submitted and those that are still outstanding. CMS
expects organizations to take advantage of these resources and make certain that all components
of their bid are submitted successfully and accurately by the submission deadline.
All organizations are expected to contact CMS about any technical upload or validation errors
well in advance of the bid submission deadline. CMS will not accept late submissions unless
they are the result of a technical issue beyond the organization’s control, in what is expected to
be very rare and unique circumstances. All organizations should make sure that appropriate
personnel are available both before and after the bid submission deadline to address any ongoing
bid upload and/or validation issues that might prevent the bid from proceeding to desk review.
Inaccurate Submissions
CMS reminds organizations that it will only approve a Part D bid under 42 CFR §423.272(b) if
the organization offering the plan’s bid complies with all applicable Part D requirements,
including those related to the provision of qualified prescription drug coverage and actuarial
determinations. In addition, all Part C bids under §422.254 (a)(3) must be complete, timely, and
accurate or CMS has the authority to impose sanctions or may choose not to renew the contract.
See also §§ 422.256 and 423.265. Bids that contain inaccurate information and/or fail to meet
established thresholds may, among other things, result in an unnecessary diversion of CMS and
organizations’ time and resources and call into question an organization’s ability and intention to
fully comply with Part C and D requirements.
Examples of bids containing information that is clearly inaccurate under Part D requirements and
established thresholds are:
An MA-PD bid that does not offer required prescription drug coverage throughout its
service area as required under §423.104(f)(2) (see also section 20.4.4 of Chapter 5 of the
Prescription Drug Benefit Manual),
A PDP bid for a non-defined standard plan that does not meet the Part D Benefit
Parameters set forth in the applicable law and defined benefit thresholds specified in this
Call Letter, or
A Part D bid that includes an incorrect PBP-to-formulary crosswalk.
Organizations and sponsors that submit clearly inaccurate bids on June 6, 2016 and organizations
that resubmit bids prior to approval to change or correct items, such as rebate reallocation and

100
fail to meet Part C and D requirements, and/or established thresholds, will receive a compliance
notice in the form of a letter and/or a corrective action plan. In addition, organizations and
sponsors that submit inaccurate bids may not be allowed to revise their bids to correct
inaccuracies, and the bids may be denied. Organizations and sponsors should engage in sufficient
due diligence to make certain their bids are accurate before submission.
Plan Corrections
As required by 42 CFR §§422.254, 423.265(c)(3) and 423.505(k)(4), submission of the final
actuarial certification serves as documentation that the final bid submission has been verified and
is complete and accurate at the time of submission. A request by an organization or sponsor for a
plan correction indicates the presence of inaccuracies and/or the incompleteness of a bid and
calls into question an organization’s or sponsor’s ability to submit correct bids and the validity of
the final actuarial certification and bid attestation.
After bids are approved, CMS will not reopen the submission gates to correct errors identified by
the organization or sponsor until the plan correction window in September. The plan correction
window will be open from early September to late September 2016. The only changes to the PBP
that will be allowed during the plan correction period are those that modify the PBP data to align
with the BPT. No changes to the BPT are permitted during the plan correction period.
In advance of the bid submission deadline, CMS will provide organizations and sponsors the
guidance and tools necessary for a complete and accurate bid submission. These tools will
include a Medicare Plan Finder (MPF) summary table report that will be released in HPMS in
May. Organizations and sponsors can upload their bid multiple times in HPMS prior to bid
submission so that they can confirm that MPF data are being displayed accurately. Organizations
and sponsors are encouraged to use this time prior to the submission deadline to verify their bid
will not require a plan correction. Organizations and sponsors submitting plan corrections will
receive a compliance action and will be suppressed in MPF until the first MPF update in
November. In addition, CMS may issue more severe compliance actions such as warning letters
and corrective action plans to organizations/sponsors that have demonstrated a consistent pattern
of bid submission errors over multiple contract years and/or previously received a compliance
notice for CY 2016.
Contracting Organizations with Ratings of Fewer Than Three Stars in Three Consecutive
Years – Timeline for Application of Termination Authority
CMS may, under our regulatory authority at 42 C.F.R. §§ 422.510(a)(4)(xi) and
423.509(a)(4)(x), terminate the contracts of organizations that have failed to achieve a rating of
three stars or better on their Part C or Part D performance in three consecutive years. Since CMS
announced through rulemaking in 2012 that we would consider consistently low Star Ratings as
a basis for terminating a Part C or Part D contract, a significant number of organizations have
taken steps to improve the performance of their poor performing contracts. In other instances,

101
organizations have non-renewed low-rated contracts or consolidated their operations into
different, higher-rated contracts. As a result, the overall quality of Medicare plan options
available to beneficiaries continues to improve.
In the CY 2016 Call Letter, CMS announced that contracts that earned their third consecutive
Part C or Part D rating of less than three stars with the release of the 2016 ratings in the fall of
2015 would receive non-renewal notices from CMS in February 2016 with an effective date of
December 31, 2016, at 11:59 pm EST. We also announced that we would not calculate or
publish 2017 Star Ratings associated with the non-renewed contracts.
CMS advises MAOs and PDP sponsors that we will conduct future star rating-based terminations
according to a similar timeline. That is, CMS will issue contract non-renewal notices in
February of each year, with an effective date of December 31st of the same year, to all contracts
that meet the criteria for a star rating-based termination with the release of the set of star ratings
issued in October of the preceding year. In March, following the issuance of the non-renewal
notices, beneficiaries enrolled in plans offered under the non-renewed contracts will receive
notices advising them that they will need to choose a new plan during the next annual election
period to continue their Part C and Part D plan enrollment without interruption during the
following benefit year. Finally, CMS will not calculate or publish Star Ratings for non-renewed
contracts during the year in which CMS issues the non-renewal notice, so terminated contracts
should not expect there to be an opportunity for CMS to reverse its determination based on the
contract’s improved Star Rating performance during its last year of operation.
Enhancements to the 2017 Star Ratings and Beyond
One of CMS’ most important strategic goals is to improve the quality of care and health status of
Medicare beneficiaries. For the 2017 Star Ratings, CMS continues to enhance the Star Ratings
methodology so it further aligns with our policy goals. Our priorities include enhancing the
measures and methodology to reflect the true performance of organizations and sponsors,
ensuring stability due to the link to payment, and providing advance notice of future proposals.
In this document, we describe the enhancements being proposed for the 2017 Star Ratings and
beyond. CMS is not considering adding any new measures for 2017 Star Ratings. Except as
noted below, we anticipate the methodology remaining the same as the 2016 Star Ratings.
For reference, the list of measures and a description of the methodology for the 2016 Star
Ratings are included in the Technical Notes available on the CMS webpage:
https://www.cms.gov/Medicare/Prescription-Drug-Coverage/PrescriptionDrugCovGenIn/
PerformanceData.html.
The cut points to determine star assignments for all measures and case-mix coefficients for the
Consumer Assessment of Healthcare Providers and Systems (CAHPS) survey and Health
Outcomes Survey (HOS) will be updated for 2017 using the most current data available.
102
As announced in previous years, we will review data quality across all measures, variation
among organizations and sponsors, and measures’ accuracy and validity before making a final
determination about inclusion of measures in the Star Ratings.
We appreciate the feedback we received from approximately 90 organizations to the November
12, 2015 Health Plan Management System (HPMS) memo, Request for Comments:
Enhancements to the Star Ratings for 2017 and Beyond.21 The proposals below reflect those
comments where appropriate. Requests for clarification and concerns about measure
specifications have been passed along to measure developers and stewards, even if not
specifically mentioned below. Also, CMS has posted a summary of the comments as well as the
individual comments received on CMS.gov at: https://www.cms.gov/Medicare/Prescription-
Drug-Coverage/PrescriptionDrugCovGenIn/PerformanceData.html.
A. Changes to Measures for 2017
CMS’ general policies regarding specification changes to Star Ratings measures include the
following:
If a specification change to an existing measure is announced in advance of the
measurement period, the measure remains in the Star Ratings; it will not be moved to the
display page.
If the change announced during the measurement period significantly expands the
denominator or population covered by the measure, the measure is moved to the display
page for at least one year.
If the change announced during the measurement period does not significantly impact the
numerator or denominator of the measure, the measure will continue to be included in the
Star Ratings (e.g., when during the measurement period additional codes are added that
would increase the number of numerator hits for a measure).
The methodology for the following measures is being modified:
1. Improvement measures (Part C & D). While the methodology for incorporating measures
into the calculation of the two improvement measures (one each for Part C and D) remains
the same as in prior years, we have updated the measures used for each improvement
measure to account for measures with at least two years of data. Please refer to Appendix 3
for updates to the measures to be used to calculate the 2017 improvement measures. If a
contract’s CAHPS measure score moved to very low reliability with the exclusion of the
enrollees with less than 6 months of continuous enrollment for the 2015 survey
administration, then the 2014 CAHPS measure score (used in 2015 Star Ratings) will be
21 The Request for Comment can be found at: https://www.cms.gov/Medicare/Prescription-Drug-
Coverage/PrescriptionDrugCovGenIn/Downloads/2017-Star-Ratings-Request-for-Comments.pdf

103
used instead as the baseline for the 2017 improvement calculation for that measure. If the
contract has missing 2015 CAHPS data due to very low reliability, we would use the 2014
CAHPS data only if there is a significant improvement from 2014 to 2016. This policy
would affect very few contracts, but this would hold contracts harmless from missing data.
2. Appeals Timeliness/Reviewing Appeals Decisions measures (Part C) and Appeals
Upheld measure (Part D). Currently, these measures include cases that are reopened and
decided by April 1 of the following contract year. In some instances, appeals filed in the 4th
quarter of the year and then subsequently reopened may not be determined by the
Independent Review Entity (IRE) by April 1. We propose for the 2017 Star Ratings to
modify these measure specifications so that if a reopening occurs and is decided prior to
May 1, 2016, the reopened decision would be used. Reopenings decided on or after May 1,
2016 would not be reflected in these data, and the original decision result would be used.
3. Contract Enrollment Data (Part C & D). Contract enrollment numbers are pulled from
HPMS for the Part C and D “Complaints about the Health/Drug Plan” and the Part D
“Appeals Auto-Forward” measures. Additionally, plan-level enrollment is pulled for the
three Part C “Care for Older Adults” measures when the eligible population data are not
included in the HEDIS submission. For these measures, twelve months of enrollment files
are pulled from HPMS, and the average enrollment from those months is used in the
measure calculations. In the Request for Comments, we discussed changing the twelve
month period from January through December to February through January of the relevant
measurement period. Further review of the enrollment data over the past five years has
shown that new contracts have enrollment data showing in the January enrollment file that is
not significantly different from subsequent months. Therefore, we are not proposing making
this change to the enrollment data used in the Star Ratings.
4. Transition from ICD-9 to ICD-10 (Part C & D). The measure stewards, such as the
National Committee for Quality Assurance (NCQA) and the Pharmacy Quality Alliance
(PQA), have reviewed their measure specifications with diagnosis-related requirements to
transition from ICD-9 to ICD-10.
NCQA has incorporated the ICD-10 codes in the 2016 Healthcare Effectiveness Data and
Information Set (HEDIS). During the transition period, both ICD-9 and ICD-10 codes will
be used due to the look-back periods for some measures.
The transition to ICD-10 is not relevant to PQA measures currently used in Star Ratings.
We will review changes made by PQA as appropriate for current or future measures used by
CMS.
5. Appeals Upheld measure (Part D). This measure shows how often an Independent
Reviewer thought the drug plan’s decision to deny an appeal was fair. For the 2016 Star

104
Rating Upheld measure, we excluded appeal cases for beneficiaries enrolled in hospice at
any point during 2014. As noted in the 2016 Call Letter, this exclusion was only necessary
for the 2016 measure as it is based on 2014 data that may have been affected by policy
changes in 2014. CMS policy has not changed since 2014, so it is no longer necessary to
exclude hospice appeal cases. This exclusion will not be continued for the 2017 Star Rating
Appeals Upheld measure.
6. Medication Therapy Management (MTM) Program Completion Rate for
Comprehensive Medication Reviews (CMR) measure (Part D). We will add a detailed
file during each HPMS plan preview period to list each contract’s underlying denominator,
numerator, and Data Validation score since exclusions are applied to the plan-reported
MTM data.
The CMR rate measure is an initial measure of the delivery of MTM services, and we
continue to look forward to the development and endorsement of outcomes-based MTM
measures as potential companion measures to the current MTM Star Rating. More
information is provided later in this section about the Center for Medicare and Medicaid
Innovation’s Part D Enhanced MTM Model. Lastly, we will be implementing additional
data integrity checks (discussed later in this section) to safeguard against inappropriate
attempts to bias the data used for this measure.
B. Removal of Measures from Star Ratings
1. Improving Bladder Control (Part C). This measure, collected through the Health
Outcomes Survey (HOS), assesses the percentage of beneficiaries with urine leakage who
discussed their problem with their provider and received treatment for the issue. NCQA made
three changes to this measure. First, NCQA changed the denominator of both indicators to
include all adults with urinary incontinence, as opposed to limiting the denominator to those
who consider urinary incontinence to be a problem. This will remove a potential bias toward
only sampling patients who were treated unsuccessfully. Second, NCQA changed the
treatment indicator to assess whether treatment was discussed, as opposed to it being
received. This will change the measure focus from receiving potentially inappropriate
treatments, which often have adverse side effects, to shared decision making between the
patient and provider about the appropriateness of treatment. Third, NCQA added an outcome
indicator to assess how much urinary incontinence impacts quality of life for beneficiaries.
Data from this outcome indicator will be analyzed further before any new measure (or
measure specification change) is proposed as part of the Star Rating.
These changes required revising the underlying survey questions in HOS. The revised
questions were first collected in 2015. As a result of these changes, this measure will not be
reported in the 2017 Star Ratings. The revised measure will be reported on the 2017 display
page. The 2016 display measure uses data from the old questions.

105
2. High Risk Medication (Part D). The High Risk Medication (HRM) measure calculates the
percent of Medicare Part D beneficiaries 65 and older who received two or more prescription
fills for the same HRM drug with a high risk of serious side effects in the elderly. The
measure is endorsed by the PQA and National Quality Forum (NQF), and the HRM rate is
calculated using the PQA specifications and medication list based on American Geriatrics
Society (AGS) recommendations. The AGS recently released the 2015 update of the Beers
Criteria, which serve as the foundation for the AGS recommendations.
The HRM measure will be removed from the Star Ratings and moved to the display
measures for 2017. This proposal is based on a number of factors. While the AGS states that
the criteria may be used as both an educational tool and quality measure, it further states that
the intent is not to apply the criteria in a punitive manner. Specifically, the addition of a drug
to the HRM list is not a contraindication to use, rather an encouragement to avoid use in the
senior population without consideration of risks and benefits based on individual patient
characteristics. This is a very difficult decisional balance to evaluate in a drug plan that does
not have access to full clinical information. As the measure can be calculated only by using
prescription drug event (PDE) data, medications cannot be included on the HRM List that
have risks conditional on clinical factors that cannot be measured using PDE data alone. As
a result, some “Avoid” medications are included in the measure, while others are not. This
may create unintended consequences including the inappropriate encouragement of certain
non-HRM medications, which may not be the best choice for an individual beneficiary’s
clinical circumstance.
Lastly, because it is under direct provider control and should not be affected by non-clinical
beneficiary characteristics, the HRM measure was not included in CMS’ overall analysis to
assess the impact of socio-economic status (SES) on the Star Ratings (discussed later in this
draft Call Letter). However, our initial analysis found that after controlling for contract
effects and dual eligible or low income subsidy status, there is a significant association
between dual eligible/low income status and HRM use. This association remains after further
controlling for age, sex, and race/ethnicity. We recommend that the measure developers
further review this measure to better understand the associations.
Avoiding potentially inappropriate medications in older adults remains important for quality
of care for Medicare beneficiaries. Therefore, the HRM measure will move to the 2017
display page. We will continue to provide HRM measure reports to Part D sponsors on a
monthly basis through the Patient Safety Analysis website, and we will continue to identify
outliers.
This measure may be considered again in the future for the Star Ratings. Measure
specification updates endorsed by the PQA will be implemented by CMS with sufficient lead
time ahead of formulary and bid deadlines. The PQA made two changes to the HRM

106
measure specifications. First, any patient with a hospice indicator at any point during the
measurement year will be excluded from the denominator calculation. We propose to
implement this change immediately for the 2017 display measure based on 2015 data.
Second, the PQA revised the criteria to calculate the average dose for doxepin, reserpine, and
digoxin. We propose to implement this change for the 2018 measure based on 2016 data.
Any additional updates endorsed by the PQA by the 2017 formulary and bid deadlines in
May and June 2016 may be considered for adoption in the 2019 measures (using 2017 data).
C. Data Integrity
It is essential that the data used for CMS’ Star Ratings are accurate and reliable. CMS’ policy is
to reduce a contract’s measure rating to 1 star if it is determined that biased or erroneous data
have been submitted. This would include cases where CMS finds mishandling of data,
inappropriate processing, or implementation of incorrect practices by the organization/sponsor
have resulted in biased or erroneous data. Examples would include, but are not limited to: a
contract’s failure to adhere to HEDIS, HOS, or CAHPS reporting requirements; a contract’s
failure to adhere to Plan Finder or PDE data requirements; a contract’s errors in processing
coverage determinations/exceptions or organization determinations found through program
audits or other reviews; compliance actions due to errors in operational areas that would directly
impact the data reported or processed for specific measures; or a contract’s failure to pass Part C
and D Reporting Requirements Data Validation related to organization/sponsor-reported data for
specific measures.
CMS has taken several steps in the past years to protect the integrity of the data; however, we
continue to identify new vulnerabilities where inaccurate or biased data could exist. We also
must safeguard against the Star Ratings Program creating perverse incentives for sponsors. CMS
program audits will soon include review of Part D sponsors’ MTM programs, which will allow a
more comprehensive assessment of Part D sponsors’ MTM programs. More information will be
released about the MTM audit criteria. Findings identified during pilots of these new MTM
audit criteria would not be applied to Star Ratings. Once criteria are finalized, we would review
and apply any relevant MTM program audit findings that could demonstrate systemic failures by
sponsors that resulted in biased MTM data, outside of the Data Validation results. CMS is
concerned about sponsor activities that may not be detected by Data Validation standards, such
as attempts to restrict eligibility from their approved MTM programs, encouraging beneficiary
opt-out of MTM programs within the first 60-days, or reporting CMRs that do not meet CMS’
definition per guidance.
Data Validation standards primarily focus on compliance with CMS’ reporting requirements, and
CMS considers failing to meet these standards to represent systemic issues that would result in
biased data. Data Validation element-level failures can indicate that incomplete or inaccurate
data were reported for use in Star Ratings. It is possible for a sponsor to receive a passing score
for a section, but have specific element-level failures that directly impact the validity of their

107
measure. For example, if the Data Validation found a sponsor’s errors in the numbers of
beneficiaries enrolled in the MTM, or receiving CMR, regardless of the overall MTM DV score,
CMS would still have concerns about the accuracy of the sponsor’s MTM CMR numerator and
denominator.
CMS may perform additional audits or reviews to ensure the validity of data for specific
contracts. Without rigorous validation of Star Ratings data, there is risk that CMS will reward
contracts with falsely high ratings.
D. Impact of Socio-economic and Disability Status on Star Ratings
A key goal of the MA and Part D programs is to achieve greater value and quality for all
beneficiaries; therefore, an important corollary is that we do not distort quality signals in our
measures, or mask true differences in quality of care. CMS continuously reviews the Star
Ratings methodology to improve the process, incentivize plans, and provide information that is a
true reflection of the performance and experience of the enrollees. The policies implemented
must result in high quality of care and improved health outcomes for all of our beneficiaries,
while acknowledging the unique challenges of serving traditionally underserved subsets of the
population.
A number of MA organizations and PDP sponsors believe that enrollment of a high percentage
of dual eligible (DE) enrollees and/or enrollees who receive a low income subsidy (LIS) limits
their plans’ ability to achieve high MA or Part D Star Ratings. CMS has responded to the
concern from our stakeholders by comprehensively gathering information to determine if the Star
Ratings are sensitive to the LIS/DE and disability status of a contract’s enrollees. If adjustments
are made to address this issue, they must be data driven. For example, if a disparity is due to
challenges in serving disabled beneficiaries, rather than in serving LIS/DE beneficiaries, then the
adjustment should clearly focus on disability status of beneficiaries. Similarly, unless our methods
are transparent and open to input from a breadth of sources, MA organizations and Part D sponsors
will not be able to easily translate our findings into actionable quality improvement steps.
With support from our contractors, CMS has undertaken research to provide scientific evidence
as to whether MA organizations or Part D sponsors that enroll a disproportionate number of
vulnerable beneficiaries are systematically disadvantaged by the current Star Ratings. In 2014,
we issued a Request for Information to gather information directly from organizations to
supplement the data that CMS collects, as we believe that plans and sponsors are uniquely
positioned to provide both qualitative and quantitative information that is not available from
other sources. In February and September 2015, we released details on the findings of our
research.22 We have also reviewed reports about the impact of socio-economic status (SES) on
22 The February release can be found at https://www.cms.gov/medicare/prescription-drug-
coverage/prescriptiondrugcovgenin/performancedata.html

108
quality ratings, such as the report published by the National Quality Forum (NQF) posted at
www.qualityforum.org/risk_adjustment_ses.aspx and both the Medicare Payment Advisory
Commission’s (MedPAC) Report to the Congress: Medicare Payment Policy posted at
http://www.medpac.gov/documents/reports/mar2015_entirereport_revised.pdf and their recent
presentation released on September 10th entitled Factors Affecting Variation in Medicare
Advantage Plan Star Ratings posted at http://www.medpac.gov/documents/september-2015-
meeting-presentation-factors-affecting-variation-in-medicare-advantage-plan-star-ratings.pdf.
The IMPACT Act (P.L. 113-185) instructs the Office of the Assistant Secretary for Planning and
Evaluation (ASPE) to conduct a study that examines the effect of individuals’ SES on quality
measures, resource use, and other measures for individuals under the Medicare program and
report its findings to Congress by October 2016. Because ASPE’s research agenda aligns closely
with our goals, we have and will continue to work collaboratively with ASPE and other
governmental agencies to broaden and expand the focus of the issue. We note that, as instructed
by Congress in the IMPACT Act, ASPE is conducting further research in this area and may
make recommendations for additional changes in the future. We look forward to ASPE’s
continued input.
CMS has also engaged measure developers, NCQA and the PQA, to examine their measure
specifications used in the Star Ratings Program to determine if measure re-specification is
warranted. The majority of measures used for the Star Ratings Program are consensus-based. As
such, those measure scores cannot be adjusted for differences in enrollee case-mix unless
required by the measure specification. Measure specifications can be changed only by the
measure steward (the owner and developer of the measure). Measure re-specification is a multi-
year process. For example, NCQA has a standard process for reviewing any measure and
determining whether a measure requires re-specification. NCQA’s re-evaluation process is
designed to ensure any resulting measure updates abide by NCQA’s desirable attributes of
relevance, scientific soundness, and feasibility. Relevance describes the extent to which the
measure captures information important to different groups, e.g., consumers, purchasers,
policymakers. To determine relevance, NCQA assesses issues such as health importance,
financial importance, and potential for improvement among entities being measured. Scientific
soundness captures the extent to which the measure adheres to clinical evidence and whether its
attributes are valid, reliable, and precise. Feasibility captures the extent to which a measure can
be collected at reasonable cost and without undue burden. To determine feasibility, NCQA also
assesses whether a measure is precisely specified and can be audited. The overall process for
assessing the value of re-specification emphasizes multi-stakeholder input, use of evidence-based
guidelines and data, and wide public input.
CMS Research
The September release can be found at https://www.cms.gov/Medicare/Prescription-Drug-
Coverage/PrescriptionDrugCovGenIn/Downloads/Research-on-the-Impact-of-Socioeconomic-
Status-on-Star-Ratingsv1-09082015.pdf

109
As stated in the 2016 Final Call Letter, CMS believed additional research into the nature of the
differential performance on a subset of measures was necessary before any interim or permanent
changes in the Star Ratings measurements could be developed and implemented. The additional
research conducted after the publication of the 2016 Final Call Letter allowed for further
examination of LIS/DE differences (“effects”) and their magnitude. Due to the considerable
overlap between LIS/DE beneficiaries and disabled beneficiaries, the research was expanded to
consider the possible role of disability status. The research considered the association between
the performance on Star Ratings measures and enrollment of LIS/DE/disabled beneficiaries, and
the variability across contracts of differences in performance on each measure to gain a better
understanding of LIS/DE differences revealed in the preliminary research.23
The methodology employed permitted the estimation of within-contract differences associated
with LIS/DE and/or disability. Within-contract differences are differences that may exist
between subgroups of enrollees in the same contract (e.g., if LIS/DE enrollees within a contract
have a different mean or average performance on a measure than non-LIS/DE enrollees in the
same contract). These differences may be favorable or unfavorable for LIS/DE and/or disabled
beneficiaries. Between-contract differences in performance associated with LIS/DE and/or
disability status (“between-contract LIS/DE and/or disability disparities”) are the possible
additional differences in performance between contracts associated with the contract’s proportion
of LIS/DE and disabled enrollees that remain after accounting for within-contract disparities by
LIS/DE and disability status. If LIS/DE and/or disabled beneficiaries are more or less likely than
other beneficiaries to be enrolled in lower-quality contracts, then between-contract disparities
may represent true differences between contracts in quality. Because of this possibility,
between-contract disparities may not be appropriate for adjustment due to the risk of masking
true differences in quality. Adjusting for within-contract disparities is an approach aligned with
the consensus reflected in the NQF report on sociodemographic adjustment, which states that,
“…only the within-unit effects are adjusted for in a risk adjustment procedure because these are
the ones that are related specifically to patient characteristics rather than differences across
units” (National Quality Forum, 2014). Our research focused on measuring within-contract
differences in performance for LIS/DE and/or disabled compared to non-LIS/DE and non-
disabled beneficiaries.
Our additional research findings were consistent with the preliminary results shared in the 2016
Final Call Letter. The research to date has provided scientific evidence that there exists a within-
23 The research focused on a total of 16 clinical quality measures. A measure was excluded from
analysis if the measure was already case-mix adjusted for SES (i.e., CAHPS and HOS measures),
if the focus of the measurement was not a beneficiary-level issue but rather a plan-level issue
(e.g., appeals, call center, Part D price accuracy), if the measure was scheduled to be retired or
revised, or if the measure was applicable to only Special Needs Plans (SNPs) (i.e., SNP Care
Management, Care for Older Adults measures).
110
contract LIS/DE and disability effect for a subset of the Star Ratings measures. The size of the
effect differs across measures and is not exclusively negative.
CMS is firmly committed to building the foundation for a long-term solution that appropriately
addresses the issue at hand and aligns with our policy goals. Any policy response must delineate
the two distinct aspects of the LIS/DE and/or disability issue - quality and payment. The Star
Ratings Program focuses on accurately measuring the quality of care provided, so any response
must focus on enhancing the ability to measure actual quality differences among contracts. To
address the LIS/DE and disability issue we must accurately address any sensitivity of the ratings
to the composition of the beneficiaries enrolled in a contract at the basic building block of the
rating system, the measure. CMS has encouraged the measure stewards to examine our findings
and undertake an independent evaluation of the measures’ specifications to determine if measure
re-specification is warranted. Additionally, the payment response focuses on payment accuracy
for beneficiaries with different dual statuses, differentiated by aged or disabled status, by
improving the predictive performance of the CMS-HCC risk-adjustment model to take into
account the unique cost patterns of each of these subgroups of beneficiaries. CMS is considering
changes in the risk adjustment models used for payment and issued a separate Request for
Comments on October 28, 2015 to obtain feedback on potential revisions. Based in part on the
strong support we received to the Request for Comments, we have proposed revisions to the
CMS-HCC risk adjustment models for Payment Year 2017 in the Advance Notice.
Interim Analytical Adjustments
While the measure stewards undertake a comprehensive review of their measures used in the Star
Ratings Program and ASPE continues its work under the IMPACT Act, CMS has been exploring
two options for interim analytical adjustments to address the LIS/DE and disability effect: (1) a
Categorical Adjustment Index (CAI) and (2) Indirect Standardization (IS) as noted in the
“Request for Comments: Enhancements to the Star Ratings for 2017 and Beyond” released on
November 12, 2015.24 We believe the proposed methods, discussed briefly below and explained
more fully during the User Call on December 3, 2015,25 align with the goals of making
adjustments that reflect the actual magnitude of the differences observed in the data, providing
valid quality ratings to facilitate consumer choice, and providing incentives for MA and Part D
quality improvement.
We recognize the need for an interim policy that is both transparent and feasible to implement
pending any changes to measure specifications that may be made by the measure stewards. In
24 The Request for Comment can be found at: https://www.cms.gov/Medicare/Prescription-Drug-
Coverage/PrescriptionDrugCovGenIn/Downloads/2017-Star-Ratings-Request-for-Comments.pdf 25 The User Call slides can be found at: https://www.cms.gov/Medicare/Prescription-Drug-
Coverage/PrescriptionDrugCovGenIn/Downloads/Potential-Options-for-SES-and-Disability-
Adjustments_120315.pdf

111
addition, the integrity of the Star Ratings and the core of its methodology must be maintained.
Further, the adjustment must not result in unnecessary complexity and burden to plans and
sponsors. CMS sought to develop a method to afford plans and sponsors the time needed to
validate their data and not impinge on the time allotted for the plan preview period. Plans must
feel confident in their ability to understand the methodology and reproduce their Overall and
Summary Ratings.
The Categorical Adjustment Index (CAI) is a factor that would be added to or subtracted from a
contract’s Overall and/or Summary Star Rating to adjust for the average within-contract
disparity; the adjustment factor varies by a contract’s proportion of DE/LIS and disabled
beneficiaries. The CAI approximates the effect of case-mix adjustment of contract performance
scores for DE/LIS and disabled status. MA contracts would have up to three adjustments – one
for the Overall Star Rating and one for each of the Summary Ratings (Part C and Part D). PDPs
would have one adjustment for the Part D Summary Rating.
To calculate the CAI, first case-mix adjustment is applied to a subset of the Star Ratings measure
scores using a beneficiary-level fixed-effects logistic regression model with contract intercepts
and beneficiary-level indicators of LIS/DE and disability status. This type of adjustment is
similar to the approach currently used to adjust CAHPS patient experience measures. However,
unlike CAHPS case mix adjustment, the only adjusters are LIS/DE and disability status.
Adjusted measure scores are then converted to measure-level stars using the rating year measure
cutoffs and used to calculate an Adjusted Overall and Summary Star Ratings. Unadjusted
Overall and Summary Star Ratings are also determined per contract.
To determine the value of the CAI, contracts are first divided into an initial set of categories
based on the combination of a contract’s LIS/DE and disability proportions. For the adjustment
for the Overall and Part C and D Summary Ratings for MA contracts, the initial groups would be
formed by the deciles of LIS/DE and quintiles of disability, thus resulting in 50 initial categories.
For PDPs, the initial groups would be formed using quartiles for both LIS/DE and disability. The
mean differences between the Adjusted Overall or Summary Star Rating and the corresponding
Unadjusted Star Rating for contracts in each initial category are determined and examined. The
initial categories are collapsed to form final adjustment groups using criteria developed for the
method and detailed later within this document. The CAI values are the mean differences
between the Adjusted Overall or Summary Star Rating and the corresponding Unadjusted Star
Rating for contracts within each final adjustment group. Separate CAI values are computed for
the Overall and Summary Star Ratings, and the rating-specific CAI value would be the same for
all contracts that fall within the same final adjustment category.
Indirect Standardization (IS), the alternative proposal for adjustment, would be applied to the
same subset of the individual measures that are adjusted for the determination of the CAI. The
focus of the adjustment is the within-contract LIS/DE and/or disability status difference in the

112
measure scores while allowing for the existence of true differences in quality by contract. The
standardization would employ the current year’s measure scores.
The methodology for IS includes the calculation of an expected measure score based on a
contract’s composition of LIS/DE and disabled beneficiaries using adjusted national means per
selected measure. The ratio between a contract’s actual (observed) and expected measure score
is used to determine an adjusted measure score and likewise, an adjusted measure-level Star
Rating. The conversion from an adjusted measure score to adjusted measure-level star would
use cut points based on the adjusted scores. The adjusted measure-level stars are then used in
conjunction with all other Star Ratings measures to arrive at the Adjusted Overall and Summary
Star Ratings.
Simulations
Using the 2016 Star Rating’s data, CMS simulated the change in the distribution of ratings to the
Overall and Part C and D Summary Star Ratings for MA organizations and Part D Summary
Rating for PDP contracts after the application of the CAI values and IS.
The measures selected for adjustment were determined by our research and include the measures
that had the greatest differences in outcomes between LIS/DE and/or disability beneficiaries and
non-LIS/DE and/or non-Disabled beneficiaries within the same contracts. The measures selected
for adjustment include the following six Part C measures for MA (MA-only, MA-PD) and 1876
contracts: Breast Cancer Screening, Colorectal Cancer Screening, Diabetes Care – Blood Sugar
Controlled, Osteoporosis Management in Women who had a Fracture, Rheumatoid Arthritis
Management, and Reducing the Risk of Falling. In addition, Medication Adherence for
Hypertension (RAS antagonists) would be adjusted for MA-PDs and PDPs.26
Please note the general simulation results do not include contracts that exclusively serve Puerto
Rico. The simulation results for Puerto Rico and a discussion of the LIS Indicator are presented
in a separate section.
Below, we produce separate simulations of how both CAI and IS affect (i) the Overall Star
Rating for MA-PDs; (ii) the Part C Summary Star Rating for MA-PDs; (iii) the Part D Summary
Star Rating for MA-PDs; and (iv) the Part D Summary Star Rating for PDPs. Contracts will be
able to review their simulation results in HPMS beginning on February 22, 2016.
Simulations for MA contracts
i. Overall Star Rating
Categorical Adjustment Index (CAI)
26 The research showed that the median absolute difference in performance between LIS/DE and
non-LIS/DE enrollees was greater than 5% for PDPs for Medication Adherence for
Hypertension. It was slightly smaller for MA-PDs, but to apply consistent adjustments across
MA-PDs and PDPs it is included for both delivery systems.

113
The simulation for the CAI used all reportable overall MA enrollment contract proportions for
LIS/DE and disabled beneficiaries to determine the cutoffs for the initial categories.27 Tables 1
and 2 provide the range of the percentages that correspond to the LIS/DE deciles and disability
quintiles. The upper limit for each initial category is not included in that category, but rather the
next higher category. For example, if a contract’s percentage of LIS/DE beneficiaries is 12.60%,
the contract’s LIS/DE decile would be 3. The exceptions for the upper limit exclusion for a class
are the tenth decile for LIS/DE and the fifth quintile for disabled. Both of these initial categories
include the upper limit of the category of 100%.
Table 1: Categorization of MA Contracts into Deciles of LIS/DE for Initial Categories for
the Overall Summary Star Rating
LIS/DE Decile Percentage of Contract’s LIS/DE Beneficiaries
1 0.00% to less than 8.94%
2 8.94% to less than 12.60%
3 12.60% to less than 15.70%
4 15.70% to less than 19.00%
5 19.00% to less than 23.90%
6 23.90% to less than 30.37%
7 30.37% to less than 46.30%
8 46.30% to less than 73.90%
9 73.90% to less than 99.00%
10 99.00% to 100.00%
Table 2: Categorization of MA Contracts into Disability Quintiles for the Overall
Summary Star Rating
Disability Quintile Percentage of Contract’s Disabled Beneficiaries
1 0.00% to less than 9.00%
2 9.00% to less than 13.10%
3 13.10% to less than 18.86%
4 18.86% to less than 26.50%
5 26.50% to 100.00%
The initial categories were collapsed to form the final adjustment categories in a manner that
enforced monotonicity and ensured each category included at least 20 contracts to provide
stability in the estimates. In other words, initial categories were combined such that as the
27 The working definition for LIS/DE beneficiaries is defined as beneficiaries who qualify at any
point in the measurement year for a low income subsidy through the application process and/or
who are full or partial Dual (Medicare and Medicaid) beneficiaries. Disability status for
beneficiaries is based on the Original Reason for Entitlement for Medicare.
114
proportion of DE/LIS and disability beneficiaries within a contract increases, the adjustment
(value of the CAI) does not decrease. Table 3 provides the description of each of the final
adjustment categories and the associated value of the CAI per category.

115
Table 3: Final Simulated Adjustment Categories and Corresponding Values of the CAI for
the Overall Star Rating
Final Adjustment
Category Description
CAI
Value
1 %LIS/DE Decile 1, %Disability Quintile 1 −0.016
2 %LIS/DE Deciles 2-9, %Disability Quintile 1
%LIS/DE Deciles 1-6, %Disability Quintile 2 −0.006
3 %LIS/DE Deciles 1-5, %Disability Quintiles 3-5
%LIS/DE Decile 6, %Disability Quintile 3 0.002
4 %LIS/DE Deciles 7-8, %Disability Quintiles 2-3 0.014
5
%LIS/DE Decile 10, %Disability Quintiles 1-4
%LIS/DE Decile 9, %Disability Quintiles 2-4
%LIS/DE Deciles 6-8, %Disability Quintile 4
0.025
6 %LIS/DE Deciles 6-8, %Disability Quintile 5 0.029
7 %LIS/DE Decile 9, %Disability Quintile 5 0.055
8 %LIS/DE Decile 10, %Disability Quintile 5 0.081
The CAI table would become part of the Technical Notes for the rating year.
The tables below show the number of contracts that achieve specified star ratings using both
unadjusted and adjusted star ratings under each of the two interim analytical adjustments. The
general format of the matrix that comprises Table 4 is used throughout this section. The cells that
comprise the main diagonal of the matrix are shaded grey. Any contract that is counted in a cell
on the main diagonal would not realize a change in its Star Rating after the application of the
interim analytical adjustment. Any contract that is counted in a cell that lies above the main
diagonal would realize an increase in its Star Rating after the application of the interim analytical
adjustment. The cells directly above the main diagonal correspond to an increase of half-star
after the application of the analytical adjustment and are shaded green. Any contract that is
counted in a cell that lies directly below the main diagonal would realize a decrease in its Star
Rating after the application of the interim analytical adjustment. The cells that lie directly below
the main diagonal are shaded red. Further discussion of the movement of the contracts after the
application of the adjustment is presented later within this section. Each table presented is
specific to a particular rating (Overall, Part D Summary, or Part D Summary) and interim
analytical adjustment (CAI or IS).
Table 4 details the movement of the Overall Star Rating with the application of the CAI as
compared to the Unadjusted Overall Star Rating.

116
Table 4: Comparison between Unadjusted Overall Star Rating and CAI-Adjusted Overall
Star Rating
Overall CAI-Adjusted Star Rating
Unadjusted
Star Rating 1.0 1.5 2.0 2.5 3.0 3.5 4.0 4.5 5.0
Unadjusted
total/rating
1.0 0 0 0 0 0 0 0 0 0 0
1.5 0 0 0 0 0 0 0 0 0 0
2.0 0 0 1 0 0 0 0 0 0 1
2.5 0 0 0 9 1 0 0 0 0 10
3.0 0 0 0 0 67 5 0 0 0 72
3.5 0 0 0 0 0 133 3 0 0 136
4.0 0 0 0 0 0 1 121 2 0 124
4.5 0 0 0 0 0 0 0 66 0 66
5.0 0 0 0 0 0 0 0 0 12 12
CAI
total/rating 0 0 1 9 68 139 124 68 12
Total number of
contracts 421
As shown in Table 5, the vast majority of contracts did not experience a change in their Overall
Star Rating after applying the CAI. We note that many contracts have their Overall Rating
reduced by a small amount by the CAI methodology, but that this ultimately did not affect their
Overall Star Rating. A total of 12 contracts had a half-star change in their Overall Star Rating:
11 increased their Overall Rating by a half-star, and one decreased by a half-star. Of the
contracts that received an increase in their Overall Star Rating, 10 enrolled a majority of LIS/DE
beneficiaries and a variable proportion of disabled beneficiaries. The distribution of contracts
that gain or lose stars could be different in future years depending on the proximity of the
unrounded Star Rating to a particular cutoff. As detailed in the 2016 Star Rating Technical
Notes available on the CMS webpage (https://www.cms.gov/Medicare/Prescription-Drug-
Coverage/PrescriptionDrugCovGenIn/PerformanceData.html), Overall and Summary Star
Ratings are rounded following criteria to the nearest half-star.
Table 5: Summary of Changes to Overall Star Rating under CAI
CAI vs Unadjusted Star Rating Number of Contracts Percent of Contracts
No Difference 409 97.1%
Up By ½ Star 11 2.6%
Down By ½ Star 1 0.2%
Table 6 summarizes the number of beneficiaries in contracts whose Overall Star Rating would
have changed after the application of the CAI. In addition, the table summarizes the mean
percentage of LIS/DE and disabled beneficiaries in the plans that realized a change in their
Overall Rating. Based on the CAI simulation, there were 276,937 beneficiaries in contracts that
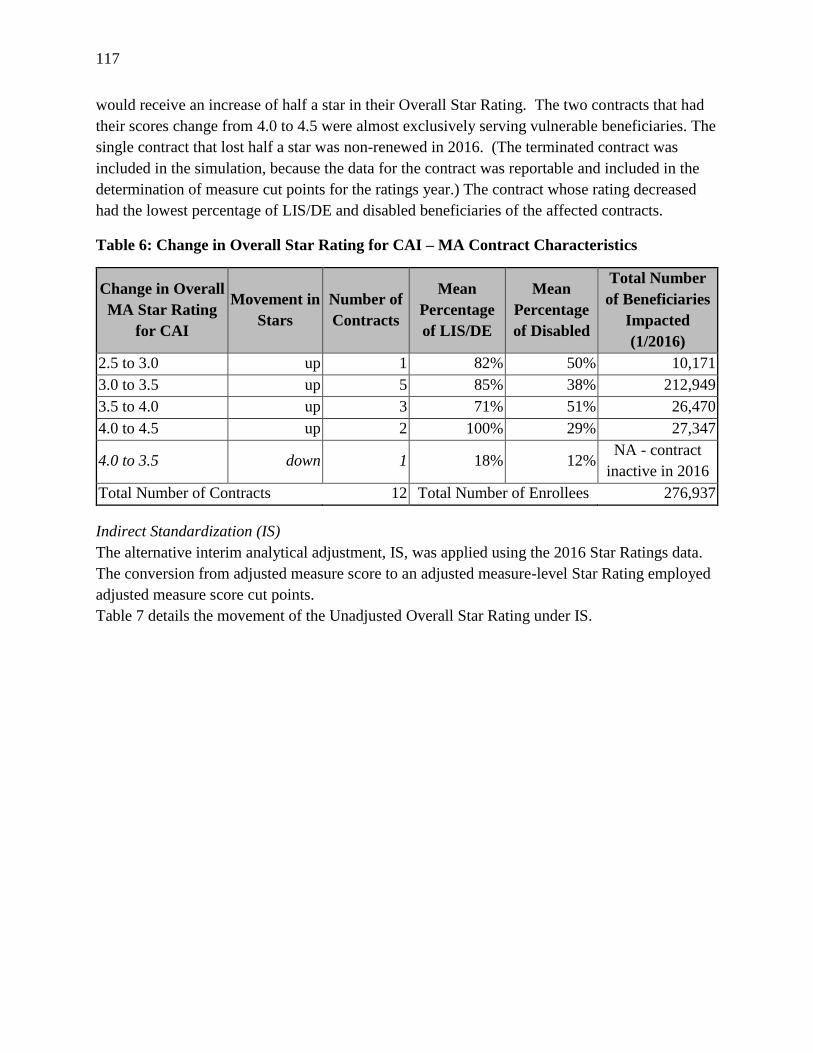
117
would receive an increase of half a star in their Overall Star Rating. The two contracts that had
their scores change from 4.0 to 4.5 were almost exclusively serving vulnerable beneficiaries. The
single contract that lost half a star was non-renewed in 2016. (The terminated contract was
included in the simulation, because the data for the contract was reportable and included in the
determination of measure cut points for the ratings year.) The contract whose rating decreased
had the lowest percentage of LIS/DE and disabled beneficiaries of the affected contracts.
Table 6: Change in Overall Star Rating for CAI – MA Contract Characteristics
Change in Overall
MA Star Rating
for CAI
Movement in
Stars
Number of
Contracts
Mean
Percentage
of LIS/DE
Mean
Percentage
of Disabled
Total Number
of Beneficiaries
Impacted
(1/2016)
2.5 to 3.0 up 1 82% 50% 10,171
3.0 to 3.5 up 5 85% 38% 212,949
3.5 to 4.0 up 3 71% 51% 26,470
4.0 to 4.5 up 2 100% 29% 27,347
4.0 to 3.5 down 1 18% 12% NA - contract
inactive in 2016
Total Number of Contracts 12 Total Number of Enrollees 276,937
Indirect Standardization (IS)
The alternative interim analytical adjustment, IS, was applied using the 2016 Star Ratings data.
The conversion from adjusted measure score to an adjusted measure-level Star Rating employed
adjusted measure score cut points.
Table 7 details the movement of the Unadjusted Overall Star Rating under IS.

118
Table 7: Comparison between Unadjusted Overall Star Rating and IS-Adjusted Overall
Star Rating
Overall Star Rating for IS-Adjusted Star
Unadjusted
Star Rating 1.0 1.5 2.0 2.5 3.0 3.5 4.0 4.5 5.0
Unadjusted
total/rating
1.0 0 0 0 0 0 0 0 0 0 0
1.5 0 0 0 0 0 0 0 0 0 0
2.0 0 0 1 0 0 0 0 0 0 1
2.5 0 0 0 10 0 0 0 0 0 10
3.0 0 0 0 2 66 4 0 0 0 72
3.5 0 0 0 0 4 131 1 0 0 136
4.0 0 0 0 0 0 9 110 5 0 124
4.5 0 0 0 0 0 0 10 56 0 66
5.0 0 0 0 0 0 0 0 2 10 12
IS
total/rating 0 0 1 12 70 144 121 63 10
Total number of
contracts 421
As shown in Table 8, the majority of contracts did not experience a change in their Overall Star
Rating using IS. A total of 37 contracts realized a half-star change in their Overall Star Rating.
Approximately three-quarters of the impacted contracts experienced lower ratings, while a little
over one-quarter of the 37 contracts that experienced a change gained half a star. Over half of
the contracts that had their Overall Rating increase by half a star enrolled a majority of LIS/DE
beneficiaries, while the other half of the contacts that realized a half-star increase did not. As
with the CAI, the overall movement and number of contracts impacted by the application of IS
can change from year to year and thus, the distribution of star increases and decreases as shown
in Table 8 can vary in subsequent years.
Table 8: Summary of Changes to Overall Star Rating under IS
IS vs Unadjusted Star Rating Number of Contracts Percent of Contracts
No Difference 384 91.2%
Up By ½ Star 10 2.4%
Down By ½ Star 27 6.4%
Using IS, 124,425 beneficiaries would be in contracts that received an increase of half a star and
715,786 beneficiaries would be in contracts that lost half a star. Table 9 summarizes the number
of beneficiaries that would be in contacts whose Overall Rating changed. The contracts that
experienced an increase to their Overall Rating tended to be the contracts that served a higher
mean percentage of vulnerable beneficiaries as compared to the contracts that lost a half-star.
However, two of the five contracts that had their Overall Rating change from 4.0 to 4.5 had very

119
low percentages of LIS/DE and disabled beneficiaries. One of the nine contracts whose score
changed from 4.0 to 3.5 served almost exclusively LIS/DE beneficiaries. Three of the four
contracts that experienced a change in their Overall Rating from 3.5 to 3.0 served a majority of
LIS/DE beneficiaries.
Table 9: Change in Overall Star Rating for IS – MA Contract Characteristics
Change in Overall
MA Star Rating for
IS
Movement
in Stars
Number of
Contracts
Mean
Percentage
of LIS/DE
Mean
Percentage
of Disabled
Total Number
of Beneficiaries
Impacted
(1/2016)
3.0 to 3.5 up 4 65% 24% 52,819
3.5 to 4.0 up 1 100% 68% 6,259
4.0 to 4.5 up 5 64% 24% 65,347
3.0 to 2.5 down 2 31% 23% 25,026
3.5 to 3.0 down 4 35% 16% 70,021
4.0 to 3.5 down 9 25% 0% 173,247
4.5 to 4.0 down 10 16% 13% 355,949
5.0 to 4.5 down 2 13% 10% 91,543
Total Number of Contracts 37 Total Number of Enrollees 840,211
ii. Part C Summary Rating
CAI
Tables 10 and 11 provide the range of the percentages that correspond to the LIS/DE deciles and
disability quintiles for the initial categories for the determination of the CAI values for the Part C
Summary Rating.
Table 10: Categorization of MA Contracts into Deciles of LIS/DE for Initial Categories for
the Part C Summary Adjustment
LIS/DE Decile Percentage of Contract’s LIS/DE Beneficiaries
1 0.00% to less than 8.72%
2 8.72% to less than 12.38%
3 12.38% to less than 15.56%
4 15.56% to less than 18.81%
5 18.81% to less than 23.56%
6 23.56% to less than 29.84%
7 29.84% to less than 45.43%
8 45.43% to less than 71.92%
9 71.92% to less than 99.01%
10 99.01% to 100.00%
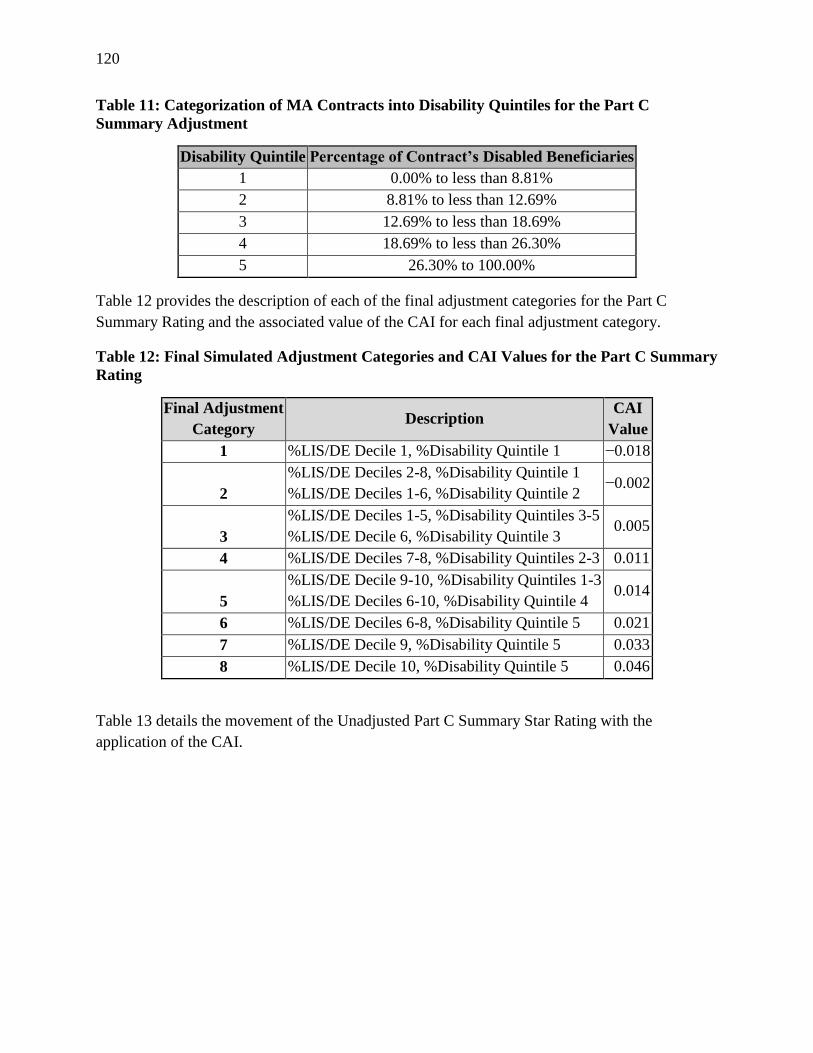
120
Table 11: Categorization of MA Contracts into Disability Quintiles for the Part C
Summary Adjustment
Disability Quintile Percentage of Contract’s Disabled Beneficiaries
1 0.00% to less than 8.81%
2 8.81% to less than 12.69%
3 12.69% to less than 18.69%
4 18.69% to less than 26.30%
5 26.30% to 100.00%
Table 12 provides the description of each of the final adjustment categories for the Part C
Summary Rating and the associated value of the CAI for each final adjustment category.
Table 12: Final Simulated Adjustment Categories and CAI Values for the Part C Summary
Rating
Final Adjustment
Category Description
CAI
Value
1 %LIS/DE Decile 1, %Disability Quintile 1 −0.018
2
%LIS/DE Deciles 2-8, %Disability Quintile 1
%LIS/DE Deciles 1-6, %Disability Quintile 2 −0.002
3
%LIS/DE Deciles 1-5, %Disability Quintiles 3-5
%LIS/DE Decile 6, %Disability Quintile 3 0.005
4 %LIS/DE Deciles 7-8, %Disability Quintiles 2-3 0.011
5
%LIS/DE Decile 9-10, %Disability Quintiles 1-3
%LIS/DE Deciles 6-10, %Disability Quintile 4 0.014
6 %LIS/DE Deciles 6-8, %Disability Quintile 5 0.021
7 %LIS/DE Decile 9, %Disability Quintile 5 0.033
8 %LIS/DE Decile 10, %Disability Quintile 5 0.046
Table 13 details the movement of the Unadjusted Part C Summary Star Rating with the
application of the CAI.
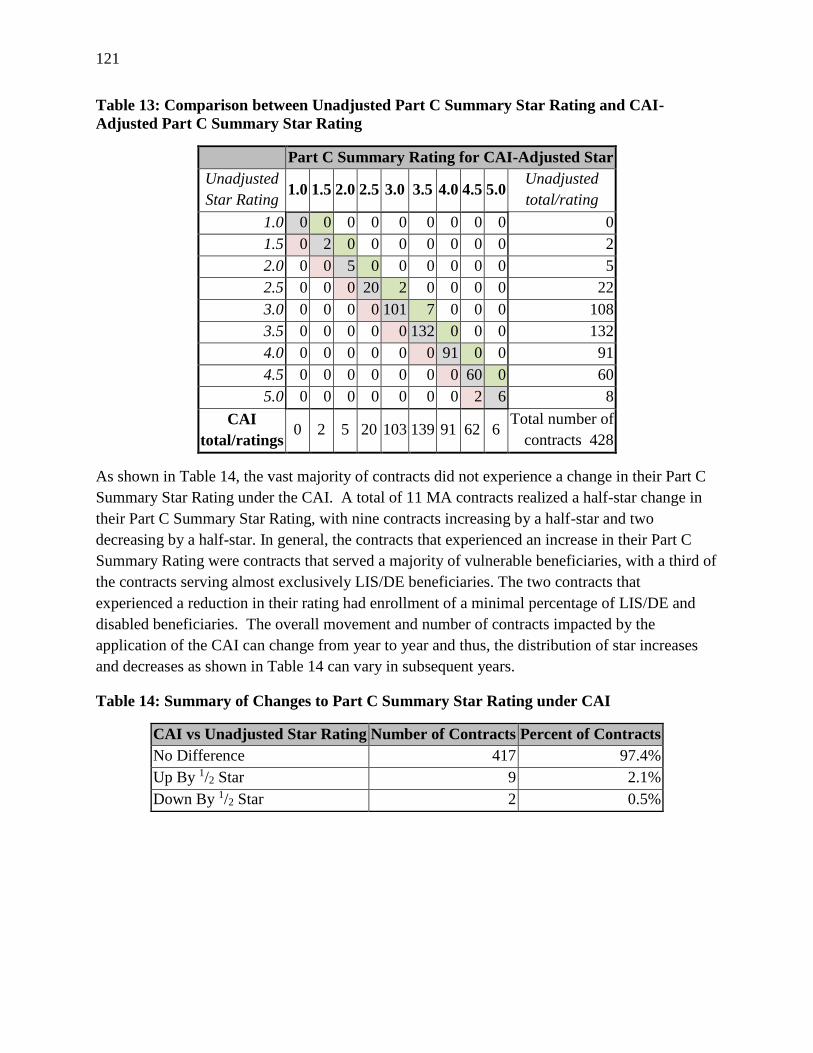
121
Table 13: Comparison between Unadjusted Part C Summary Star Rating and CAI-
Adjusted Part C Summary Star Rating
Part C Summary Rating for CAI-Adjusted Star
Unadjusted
Star Rating 1.0 1.5 2.0 2.5 3.0 3.5 4.0 4.5 5.0
Unadjusted
total/rating
1.0 0 0 0 0 0 0 0 0 0 0
1.5 0 2 0 0 0 0 0 0 0 2
2.0 0 0 5 0 0 0 0 0 0 5
2.5 0 0 0 20 2 0 0 0 0 22
3.0 0 0 0 0 101 7 0 0 0 108
3.5 0 0 0 0 0 132 0 0 0 132
4.0 0 0 0 0 0 0 91 0 0 91
4.5 0 0 0 0 0 0 0 60 0 60
5.0 0 0 0 0 0 0 0 2 6 8
CAI
total/ratings 0 2 5 20 103 139 91 62 6
Total number of
contracts 428
As shown in Table 14, the vast majority of contracts did not experience a change in their Part C
Summary Star Rating under the CAI. A total of 11 MA contracts realized a half-star change in
their Part C Summary Star Rating, with nine contracts increasing by a half-star and two
decreasing by a half-star. In general, the contracts that experienced an increase in their Part C
Summary Rating were contracts that served a majority of vulnerable beneficiaries, with a third of
the contracts serving almost exclusively LIS/DE beneficiaries. The two contracts that
experienced a reduction in their rating had enrollment of a minimal percentage of LIS/DE and
disabled beneficiaries. The overall movement and number of contracts impacted by the
application of the CAI can change from year to year and thus, the distribution of star increases
and decreases as shown in Table 14 can vary in subsequent years.
Table 14: Summary of Changes to Part C Summary Star Rating under CAI
CAI vs Unadjusted Star Rating Number of Contracts Percent of Contracts
No Difference 417 97.4%
Up By 1/2 Star 9 2.1%
Down By 1/2 Star 2 0.5%

122
IS
Table 15 details the movement of the Unadjusted Part C Summary Star Rating under IS.
Table 15: Comparison between Unadjusted Part C Summary Rating and IS-Adjusted Part
C Summary Star Rating
Part C Summary Rating for IS-Adjusted Star
Unadjusted
Star Rating 1.0 1.5 2.0 2.5 3.0 3.5 4.0 4.5 5.0
Unadjusted
total/rating
1.0 0 0 0 0 0 0 0 0 0 0
1.5 0 2 0 0 0 0 0 0 0 2
2.0 0 0 5 0 0 0 0 0 0 5
2.5 0 0 0 18 4 0 0 0 0 22
3.0 0 0 0 0 104 4 0 0 0 108
3.5 0 0 0 0 1 129 2 0 0 132
4.0 0 0 0 0 0 11 79 1 0 91
4.5 0 0 0 0 0 0 6 54 0 60
5.0 0 0 0 0 0 0 0 2 6 8
IS
total/ratings 0 2 5 18 109 144 87 57 6
Total number of
contracts 428
As shown in Table 16, the majority of contracts did not experience a change in their Part C Star
Rating under the IS. A total of 31 MA contracts realized a half-star change in their Part C
Summary Star Rating, with about half of the impacted contracts experiencing an increase.
Approximately half of the contracts that realized an increase in their rating served a majority of
LIS/DE beneficiaries. One of the twenty contracts that experienced a decrease in their Part C
Summary Rating had enrollments of LIS/DE beneficiaries of greater than 50%. The overall
movement and number of contracts impacted by the application of IS can change from year to
year and thus, the distribution of star increases and decreases as shown in Table 16 could vary in
subsequent years.
Table 16: Summary of Changes to Part C Summary Star Rating under IS
IS vs Unadjusted Star Rating Number of Contracts Percent of Contracts
No Difference 397 92.8%
Up By ½ Star 11 2.6%
Down By ½ Star 20 4.7%

123
iii. Part D Summary Rating for MA-PDs
CAI
Tables 17 and 18 provide the range of the percentages that correspond to the LIS/DE deciles and
the disability quintiles for the initial categories for the determination of the CAI values for the
Part D Summary Rating for MA-PDs.
Table 17: Categorization of MA Contracts into Deciles of LIS/DE for Initial Categories for
the Part D Summary Adjustment for MA-PDs
LIS/DE Decile Percentage of Contract’s LIS/DE Beneficiaries
1 0.00% to less than 8.94%
2 8.94% to less than 13.01%
3 13.01% to less than 16.11%
4 16.11% to less than 20.43%
5 20.43% to less than 26.25%
6 26.25% to less than 32.62%
7 32.62% to less than 47.87%
8 47.87% to less than 78.88%
9 78.88% to less than 99.60%
10 99.60% to 100.00%
Table 18: Categorization of MA Contracts into Disability Quintiles for the Part D
Summary Adjustment for MA-PDs
Disability Quintile Percentage of Contract’s Disabled Beneficiaries
1 0.00% to less than 9.39%
2 9.39% to less than 13.58%
3 13.58% to less than 19.95%
4 19.95% to less than 29.71%
5 29.71% to 100.00%
Table 19 provides the description of each of the final adjustment categories for the Part D
Summary Rating for MA-PDs and the associated values of the CAI for each final adjustment
category.

124
Table 19: Final Simulated Adjustment Categories and CAI Values for the Part D Summary
Rating for MA-PDs
CAI Category Description CAI Value
1 %LIS/DE Deciles 1-5, %Disability Quintiles 1-2 −0.007
2 %LIS/DE Deciles 1-5, %Disability Quintiles 3-5 −0.002
3 %LIS/DE Deciles 6-10, %Disability Quintiles 1-3 0.001
4 %LIS/DE Deciles 6-10, %Disability Quintile 4 0.027
5 %LIS/DE Deciles 6-8, %Disability Quintile 5 0.052
6 %LIS/DE Decile 9, %Disability Quintile 5 0.088
7 %LIS/DE Decile 10, %Disability Quintile 5 0.092
Table 20 details the movement of the Unadjusted Part D Summary Rating for MA-PDs with the
application of the CAI.
Table 20: Comparison between Unadjusted Part D Summary Star Rating and CAI-
Adjusted Part D Summary Star Rating for MA-PDs
Part D Summary Rating for CAI-Adjusted Star
Unadjusted
Star Rating 1.0 1.5 2.0 2.5 3.0 3.5 4.0 4.5 5.0
Unadjusted
total/rating
1.0 0 0 0 0 0 0 0 0 0 0
1.5 0 0 0 0 0 0 0 0 0 0
2.0 0 0 0 1 0 0 0 0 0 1
2.5 0 0 0 10 1 0 0 0 0 11
3.0 0 0 0 0 28 6 0 0 0 34
3.5 0 0 0 0 0 117 9 0 0 126
4.0 0 0 0 0 0 0 144 5 0 149
4.5 0 0 0 0 0 0 0 92 2 94
5.0 0 0 0 0 0 0 0 0 51 51
CAI
total/ratings 0 0 0 11 29 123 153 97 53
Total number of
contracts 466
As shown in Table 21, the majority of contracts did not experience a change in their Part D Star
Rating under CAI. All MA-PD contracts that realized change in their Part D Summary Star
experienced a half-star increase in their Part D Summary Rating. Twenty of the twenty-four
contracts whose Part D Summary Rating increased by a half-star had proportions of LIS/DE of
greater than 50%. Ten of the contracts that realized a change in the Part D Summary Rating
under CAI served a majority of disabled beneficiaries. The overall movement and number of
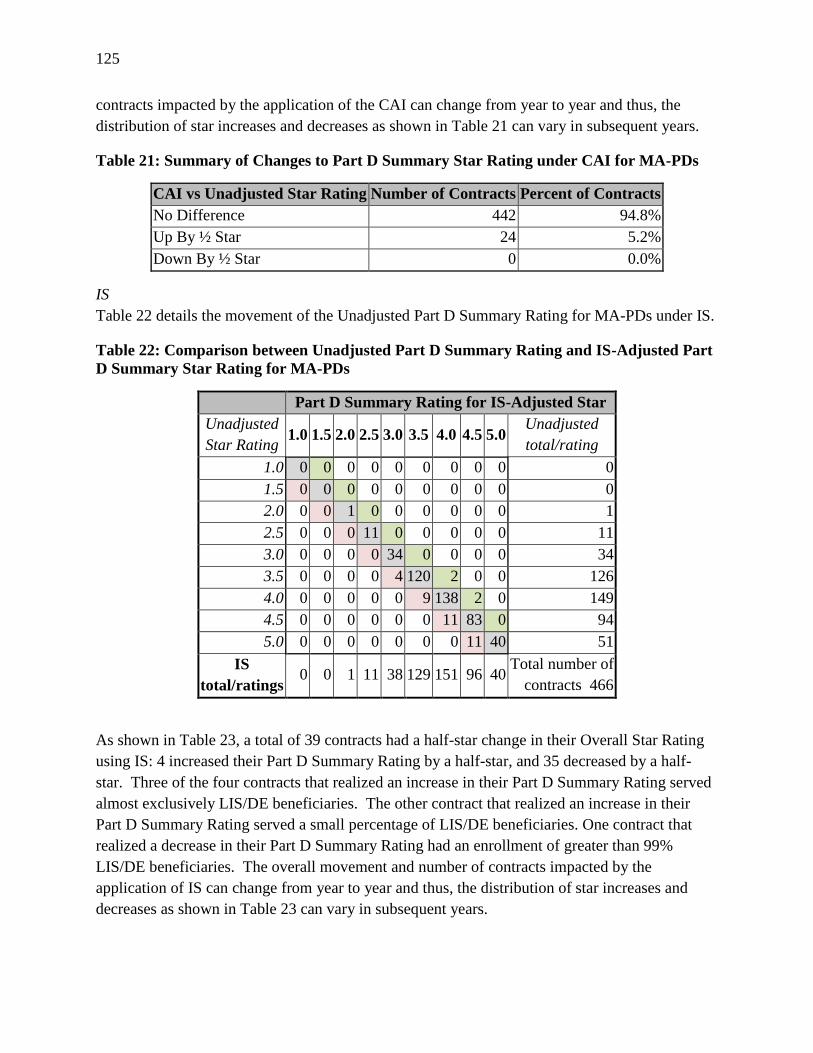
125
contracts impacted by the application of the CAI can change from year to year and thus, the
distribution of star increases and decreases as shown in Table 21 can vary in subsequent years.
Table 21: Summary of Changes to Part D Summary Star Rating under CAI for MA-PDs
CAI vs Unadjusted Star Rating Number of Contracts Percent of Contracts
No Difference 442 94.8%
Up By ½ Star 24 5.2%
Down By ½ Star 0 0.0%
IS
Table 22 details the movement of the Unadjusted Part D Summary Rating for MA-PDs under IS.
Table 22: Comparison between Unadjusted Part D Summary Rating and IS-Adjusted Part
D Summary Star Rating for MA-PDs
Part D Summary Rating for IS-Adjusted Star
Unadjusted
Star Rating 1.0 1.5 2.0 2.5 3.0 3.5 4.0 4.5 5.0
Unadjusted
total/rating
1.0 0 0 0 0 0 0 0 0 0 0
1.5 0 0 0 0 0 0 0 0 0 0
2.0 0 0 1 0 0 0 0 0 0 1
2.5 0 0 0 11 0 0 0 0 0 11
3.0 0 0 0 0 34 0 0 0 0 34
3.5 0 0 0 0 4 120 2 0 0 126
4.0 0 0 0 0 0 9 138 2 0 149
4.5 0 0 0 0 0 0 11 83 0 94
5.0 0 0 0 0 0 0 0 11 40 51
IS
total/ratings 0 0 1 11 38 129 151 96 40
Total number of
contracts 466
As shown in Table 23, a total of 39 contracts had a half-star change in their Overall Star Rating
using IS: 4 increased their Part D Summary Rating by a half-star, and 35 decreased by a half-
star. Three of the four contracts that realized an increase in their Part D Summary Rating served
almost exclusively LIS/DE beneficiaries. The other contract that realized an increase in their
Part D Summary Rating served a small percentage of LIS/DE beneficiaries. One contract that
realized a decrease in their Part D Summary Rating had an enrollment of greater than 99%
LIS/DE beneficiaries. The overall movement and number of contracts impacted by the
application of IS can change from year to year and thus, the distribution of star increases and
decreases as shown in Table 23 can vary in subsequent years.
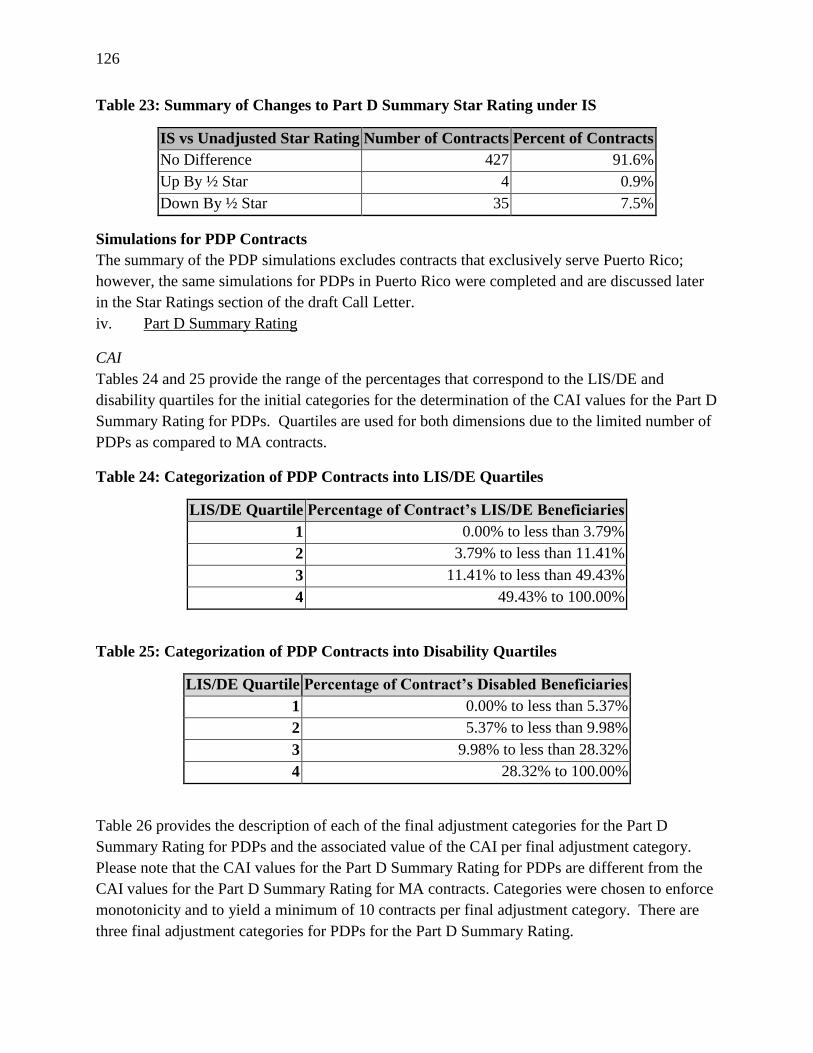
126
Table 23: Summary of Changes to Part D Summary Star Rating under IS
IS vs Unadjusted Star Rating Number of Contracts Percent of Contracts
No Difference 427 91.6%
Up By ½ Star 4 0.9%
Down By ½ Star 35 7.5%
Simulations for PDP Contracts
The summary of the PDP simulations excludes contracts that exclusively serve Puerto Rico;
however, the same simulations for PDPs in Puerto Rico were completed and are discussed later
in the Star Ratings section of the draft Call Letter.
iv. Part D Summary Rating
CAI
Tables 24 and 25 provide the range of the percentages that correspond to the LIS/DE and
disability quartiles for the initial categories for the determination of the CAI values for the Part D
Summary Rating for PDPs. Quartiles are used for both dimensions due to the limited number of
PDPs as compared to MA contracts.
Table 24: Categorization of PDP Contracts into LIS/DE Quartiles
LIS/DE Quartile Percentage of Contract’s LIS/DE Beneficiaries
1 0.00% to less than 3.79%
2 3.79% to less than 11.41%
3 11.41% to less than 49.43%
4 49.43% to 100.00%
Table 25: Categorization of PDP Contracts into Disability Quartiles
LIS/DE Quartile Percentage of Contract’s Disabled Beneficiaries
1 0.00% to less than 5.37%
2 5.37% to less than 9.98%
3 9.98% to less than 28.32%
4 28.32% to 100.00%
Table 26 provides the description of each of the final adjustment categories for the Part D
Summary Rating for PDPs and the associated value of the CAI per final adjustment category.
Please note that the CAI values for the Part D Summary Rating for PDPs are different from the
CAI values for the Part D Summary Rating for MA contracts. Categories were chosen to enforce
monotonicity and to yield a minimum of 10 contracts per final adjustment category. There are
three final adjustment categories for PDPs for the Part D Summary Rating.
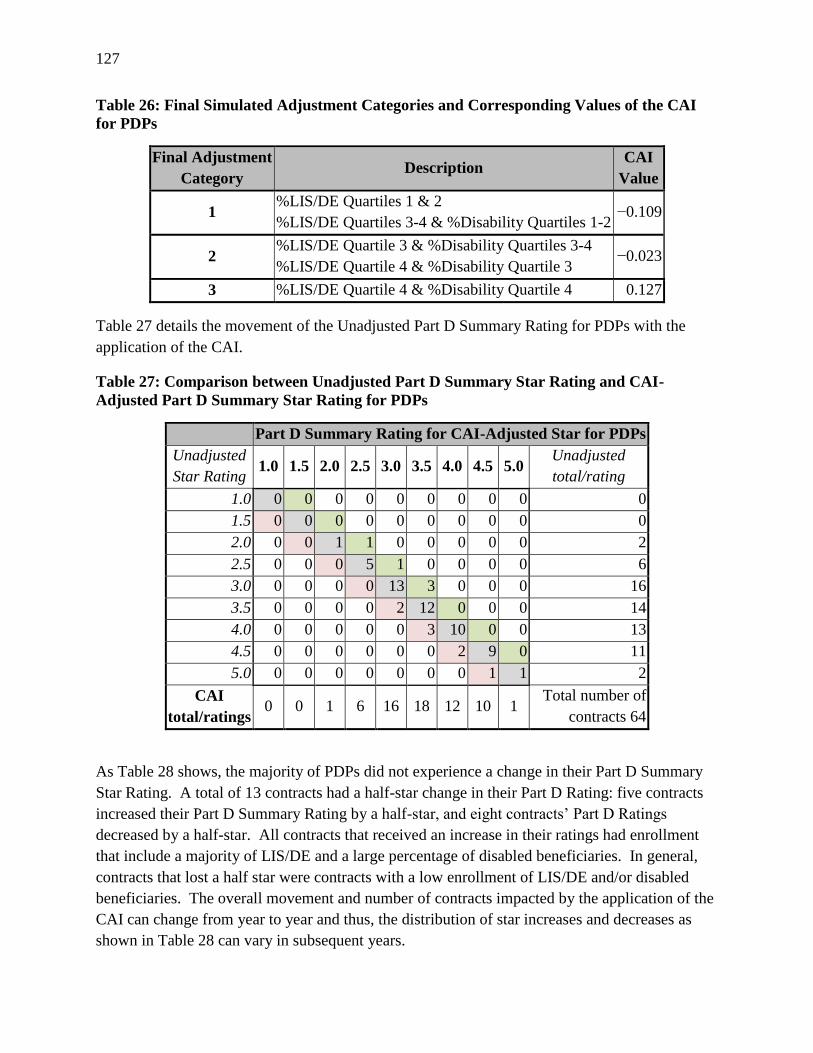
127
Table 26: Final Simulated Adjustment Categories and Corresponding Values of the CAI
for PDPs
Final Adjustment
Category Description
CAI
Value
1 %LIS/DE Quartiles 1 & 2
%LIS/DE Quartiles 3-4 & %Disability Quartiles 1-2 −0.109
2 %LIS/DE Quartile 3 & %Disability Quartiles 3-4
%LIS/DE Quartile 4 & %Disability Quartile 3 −0.023
3 %LIS/DE Quartile 4 & %Disability Quartile 4 0.127
Table 27 details the movement of the Unadjusted Part D Summary Rating for PDPs with the
application of the CAI.
Table 27: Comparison between Unadjusted Part D Summary Star Rating and CAI-
Adjusted Part D Summary Star Rating for PDPs
Part D Summary Rating for CAI-Adjusted Star for PDPs
Unadjusted
Star Rating 1.0 1.5 2.0 2.5 3.0 3.5 4.0 4.5 5.0
Unadjusted
total/rating
1.0 0 0 0 0 0 0 0 0 0 0
1.5 0 0 0 0 0 0 0 0 0 0
2.0 0 0 1 1 0 0 0 0 0 2
2.5 0 0 0 5 1 0 0 0 0 6
3.0 0 0 0 0 13 3 0 0 0 16
3.5 0 0 0 0 2 12 0 0 0 14
4.0 0 0 0 0 0 3 10 0 0 13
4.5 0 0 0 0 0 0 2 9 0 11
5.0 0 0 0 0 0 0 0 1 1 2
CAI
total/ratings 0 0 1 6 16 18 12 10 1
Total number of
contracts 64
As Table 28 shows, the majority of PDPs did not experience a change in their Part D Summary
Star Rating. A total of 13 contracts had a half-star change in their Part D Rating: five contracts
increased their Part D Summary Rating by a half-star, and eight contracts’ Part D Ratings
decreased by a half-star. All contracts that received an increase in their ratings had enrollment
that include a majority of LIS/DE and a large percentage of disabled beneficiaries. In general,
contracts that lost a half star were contracts with a low enrollment of LIS/DE and/or disabled
beneficiaries. The overall movement and number of contracts impacted by the application of the
CAI can change from year to year and thus, the distribution of star increases and decreases as
shown in Table 28 can vary in subsequent years.

128
Table 28: Summary of Changes to Part D Summary Star Rating using CAI for PDPs
CAI vs Unadjusted Star Rating Number of Contracts Percent of Contracts
No Difference 51 79.7%
Up By ½ Star 5 7.8%
Down By ½ Star 8 12.5%
Simulations of the application of the CAI resulted in a total of 2,117,550 beneficiaries in
contracts that received an increase of half a star, and 818,431 beneficiaries in contracts that lost
half a star. Table 29 summarizes the number of beneficiaries that would be in contacts whose
Part D Summary Star Rating changed. The PDPs that experienced an increase in their Part D
Summary Rating were the contracts that served a higher percentage of vulnerable beneficiaries
as compared to the PDPs that lost a half-star.
Table 29: Change in Part D Summary Rating for CAI – PDP Contract Characteristics
Change in Part
D Star Rating
for CAI
Movement
in Stars
Number of
Contracts
Mean
Percentage of
LIS/DE
Mean
Percentage of
Disabled
Total Number of
Beneficiaries
Impacted
(1/2016)
2.0 to 2.5 up 1 79% 46% 1,143
2.5 to 3.0 up 1 1% 29% 965,070
3.0 to 3.5 up 3 76% 44% 1,151,337
3.5 to 3.0 down 2 12% 9% 385,563
4.0 to 3.5 down 3 4% 4% 385,057
4.5 to 4.0 down 2 5% 7% 39,853
5.0 to 4.5 down 1 2% 1% 7,958
Total Number of Contracts 13 Total Number of Enrollees 2,935,981

129
IS
Table 30 details the movement of the Unadjusted Part D Summary Star Rating with the
application of the IS for PDPs.
Table 30: Comparison between Unadjusted Part D Summary Star Rating and IS-Adjusted
Part D Summary Star Rating for PDPs
Part D Summary Rating for IS-Adjusted Star for PDPs
Unadjusted
Star Rating 1.0 1.5 2.0 2.5 3.0 3.5 4.0 4.5 5.0
Unadjusted
total/rating
1.0 0 0 0 0 0 0 0 0 0 0
1.5 0 0 0 0 0 0 0 0 0 0
2.0 0 0 1 1 0 0 0 0 0 2
2.5 0 0 0 6 0 0 0 0 0 6
3.0 0 0 0 0 16 0 0 0 0 16
3.5 0 0 0 0 2 12 0 0 0 14
4.0 0 0 0 0 2 0 10 1 0 13
4.5 0 0 0 0 0 0 2 9 0 11
5.0 0 0 0 0 0 0 0 0 2 2
IS
total/rating 0 0 1 7 20 12 12 10 2
Total number of
contracts 64
Table 31 shows the majority of PDPs did not experience a change in their Part D Summary Star
Rating under IS. A total of six contracts had a half-star change (increase or decrease) in their
Part D Summary Star Rating, and two contracts experienced a one-star decrease in their Part D
Summary Star Ratings. The contracts that experienced an increase in their Part D rating had
very different compositions of enrollees. One contract had the majority of enrollees classified as
either LIS/DE or disabled, while the other contract served a minimal percentage of vulnerable
beneficiaries. The overall movement and number of contracts impacted by the application of IS
can change from year to year and thus, the distribution of star increases and decreases as shown
in Table 31 could vary in subsequent years.
Table 31: Summary of Changes to PDP Star Rating under IS
IS vs 2016 Star Ratings Number of Contracts Percent of Contracts
No Difference 56 87.5%
Up By ½ Star 2 3.1%
Down By ½ Star 4 6.3%
Down by 1 Star 2 3.1%

130
The application of IS resulted in a total of 7,342 beneficiaries in contracts that received an
increase of half a star and 425,416 beneficiaries in contracts that lost half a star and 83,124
beneficiaries in contrast that lost one star. Table 32 summarizes the number of beneficiaries that
would be in contacts whose Part D Summary Star Rating changed. The one PDP that
experienced an increase in their Part D Summary Rating from 2.0 to 2.5 served a higher
percentage of vulnerable beneficiaries as compared to the other PDPs with changes. The
contracts that experienced a decrease in their stars served a minimal percentage of
LIS/DE/disabled beneficiaries.
Table 32: Change in Part D Summary Star Rating for IS – PDP Contract Characteristics
Change in Part
D Star Rating
for IS
Movement
in Stars
Number of
Contracts
Mean
Percentage of
LIS/DE
Mean
Percentage of
Disabled
Total Number of
Beneficiaries
Impacted
(1/2016)
2.0 to 2.5 up 1 78% 46% 1,143
4.0 to 4.5 up 1 2% 8% 6,199
3.5 to 3.0 down 2 12% 9% 385,563
4.5 to 4.0 down 2 5% 7% 39,853
4.0 to 3.0 down 2 3% 4% 83,124
Total Number of Contracts 8 Total Number of Enrollees 515,882
Summary and Policy Proposal
The simulations suggest that there is less movement, in the Overall and Summary Star Ratings,
with the application of the CAI compared to IS. The CAI adjustments result in modest negative
adjustments for contracts that have low percentages of dual/disabled enrollees and larger positive
adjustments for contracts with higher percentages of LIS/DE and disabled enrollees. By design,
the values of the CAI are monotonic and thus, contracts with a larger percentage of vulnerable
beneficiaries would realize more positive adjustments. The values of the CAI thus, align with
the findings of our research. The changes that result due to the application of IS are not as
consistent with the research findings. The application of IS affected some contracts in an
unexpected direction, such that some contracts with high LIS/DE and disabled proportions
received a negative adjustment, while some contracts with low enrollments of vulnerable
beneficiaries experienced gains to their Star Ratings. The simulations confirm that, based on the
2016 Star Ratings, the CAI tends to increase the ratings for contracts with higher proportions of
LIS/DE and disabled beneficiaries, while IS does not seem to do so as specifically and to the
same degree as does the CAI.
After careful consideration of all input from our many stakeholders, comments received in
response to this year’s Request for Comments, evidence from multiple sources including our
HHS partners and ASPE, findings from our internal research, and the simulation results, CMS

131
proposes to move forward with the proposed interim analytical adjustment of the CAI beginning
with the 2017 Star Ratings.
Methodology
This section provides further details of the methodology that was employed to determine the
2017 CAI values for the Overall and Summary Star Ratings.
As discussed previously, the CAI is a factor that would be added to or subtracted from a
contract’s Overall and/or Summary Star Rating to adjust for the average within-contract
disparity. Contracts would be categorized based on their percentages of LIS/DE and/or disabled
beneficiaries, and the CAI value would be the same for all contracts within each final adjustment
category. The CAI value is a star adjustment applied to a contract’s Overall or Summary Star
Rating whose value varies by the final adjustment category. MA plans would have up to three
adjustments – one for the Overall Star Rating and one for each of the Summary Ratings (Part C
and Part D). PDPs would have one adjustment for the Part D Summary Rating.
The CAI values would be computed by comparing the mean Overall and/or Summary contract
Star Ratings derived from measure scores that are adjusted for LIS/DE and disability status to the
mean Star Rating derived under the traditional methodology. The measures proposed for
adjustment were determined by our research28 and include the following six Part C measures for
MA (MA-only, MA-PD) and 1876 contracts and one Part D measure: Breast Cancer Screening,
Colorectal Cancer Screening, Diabetes Care – Blood Sugar Controlled, Osteoporosis
Management in Women who had a Fracture, Rheumatoid Arthritis Management, Reducing the
Risk of Falling, and Medication Adherence for Hypertension (RAS antagonists).
The adjusted measure scores will be determined from regression models of beneficiary-level
measure scores that adjust for the average within-contract difference in measure scores by
LIS/DE and disability status for MA or PDP contracts, without masking potential differences in
quality across contracts. The models adjust for the average within-contract differences in
measure scores by LIS/DE and/or disability status for MA and/or PDP contracts. The regression
models quantify the relationship between the measure score of interest and LIS/DE and disability
status, controlling for between-contract differences using contract fixed effects. The measure
score adjustment is done without masking potential differences in quality between contracts.
This approach approximates case-mix adjustment or patient-mix adjustment in a patient-level
logistic regression model with contract fixed effects and beneficiary-level indicators of LIS/DE
and disability status, similar to the approach currently used to adjust CAHPS patient experience
measures. However, unlike CAHPS case-mix adjustment, the only adjusters are LIS/DE and
disability status. Measure scores are adjusted first and then the adjusted measure score is
28 The findings from the research can be found at https://www.cms.gov/Medicare/Prescription-
Drug-Coverage/PrescriptionDrugCovGenIn/Downloads/Research-on-the-Impact-of-
Socioeconomic-Status-on-Star-Ratingsv1-09082015.pdf

132
converted to a measure-level Star Rating using the measure thresholds for the given Star Ratings
year. The unadjusted measure score cut points are employed in order to compare changes in
measure stars using adjusted measure scores relative to unadjusted measure scores. Further, the
CAI is applied to the Unadjusted Overall and Summary Star Ratings, again justifying the use of
the unadjusted measure thresholds. Since the CAI will be added to the Unadjusted Overall Star
Rating, the reward factor (formerly known as the I-factor) would be based on unadjusted scores.
The Part C and D Improvement measures will use unadjusted measure scores for both years
being compared.
Once the measures selected for adjustment have been converted to measure-level star ratings, the
CAI values are determined using the following methodology:
Note: In order to provide plans the values of the CAI for the Star Ratings year, the values for the
CAI would be determined using the previous year’s Star Ratings data.
(1) Contracts are divided into an initial set of categories based on some combination of a
contract’s LIS/DE and disability proportions.29 As done in the simulations, for the Overall
Summary Star Rating and the Part C Summary Rating, 50 initial categories are formed
corresponding to the 10 deciles of LIS/DE and the quintiles for disability. For the Part D
Summary Star Rating adjustment for PDPs, the initial categories consist of the 16 combinations
of LIS/DE quartile and disability quartile.
(2) The Adjusted Overall and Summary Star Ratings per contract are calculated using the
adjusted measure-level stars of the measures selected for adjustment.
(3) For each contract and each rating type, the difference between the Adjusted Overall or
Summary Star Rating and the corresponding Unadjusted Star Ratings is computed.
(4) Within each of the initial categories, the mean difference between the Adjusted Overall or
Summary Star Rating and the corresponding Unadjusted Star Rating is determined.
(5) The mean differences for the initial categories in step (4) are examined and categories
combined into final adjustment groups to ensure at least 20 MA contracts or 10 PDPs in each
category and attain monotonicity with increasing proportions of LIS/DE and disability.
(6) Using the contracts that fall within the final adjustment groups, the mean difference between
the Adjusted Overall or Summary Star Rating and the corresponding Unadjusted Star Rating is
computed. The mean difference per final adjustment group is the CAI value for the group.
(7) Step 6 is repeated for each final adjustment group and the set of values for each group results
in the CAI values.
29 A contract’s proportion of LIS/DE and disabled beneficiaries will be based on enrollment
during the measurement year.

133
(8) For each contract, the Adjusted Overall and/or Summary Star Rating is computed by adding
the corresponding CAI value based on the contract’s proportion of LIS/DE and disabled to a
contract’s Unadjusted Overall and/or Summary Star Rating. (There are separate CAI values for
the Overall, Part C, and Part D Summary Ratings.)
The number of initial categories employed in the first step of the methodology will be
determined based on the distribution of the composition of the contracts’ enrollees. Each initial
category does not need to contain the same number of contracts. The initial categories will be
collapsed to form the final adjustment categories in a manner as to enforce monotonicity. In
other words, initial categories are combined such that, as the proportion of LIS/DE or disability
beneficiaries within a category increases and the other dimension does not decrease, the
adjustment (value of the CAI) increases. It is possible that some initial categories will have only
a small number of contracts or perhaps no contracts based on the distribution of the contracts’
proportions for LIS/DE and disabled. Alternative initial groupings may be considered if
numerous cells are underpopulated. The final adjustment categories will be created with a
minimum number of 20 contracts per each final MA adjustment group and 10 contracts per each
final PDP adjustment group. The guideline for the number of contracts per final adjustment
groups is designed to maintain the stability of the estimates. If possible, final adjustment
categories will be collapsed such that CAI values differ by at least 0.01 units in at least one of the
two dimensions (LIS/DE and disability). (It may not always be possible to have final CAI
category values differing by at least 0.01 units in at least one dimension given the goal of
imposing monotonicity across both the DE/LIS and disability dimensions.)
The measure specification for every measure used in Star Ratings Program remains unchanged
by the adjustment. The CAI is applied outside of the specification and is applied to each
contract’s current year Overall and/or Summary Star Ratings. Each contract within a given final
adjustment group receives the same adjustment to its Overall and/or Summary Star Rating. The
CAI values would be determined using the prior year’s Star Rating data. For the 2017 Star
Ratings, the CAI values would be based on the reportable values for the 2016 Star Ratings year
using data from all contracts that meet reporting requirements. The percentage dual/LIS and
disabled per contract will be determined using enrollment data from CY 2015. The CAI values
would be available and released in the Final Call Letter. The values of the CAI would be
presented in a series of four user-friendly tables – one each for the Overall and the Part C
Summary Star Ratings, and two for the Part D Summary Star Ratings (one for MA-PDs and one
for PDPs). The values for the index and all applicable rounding rules that would be employed
would be detailed and available in the Medicare Part C & D Star Rating Technical Notes for the
applicable year.
This simulation employed the 2016 Star Ratings data. Under our proposal, the simulation results
would be the adjustments used for the 2017 Star Ratings. Tables 33, 34, 35 and 36 provide the
CAI values for the 2017 Star Ratings.
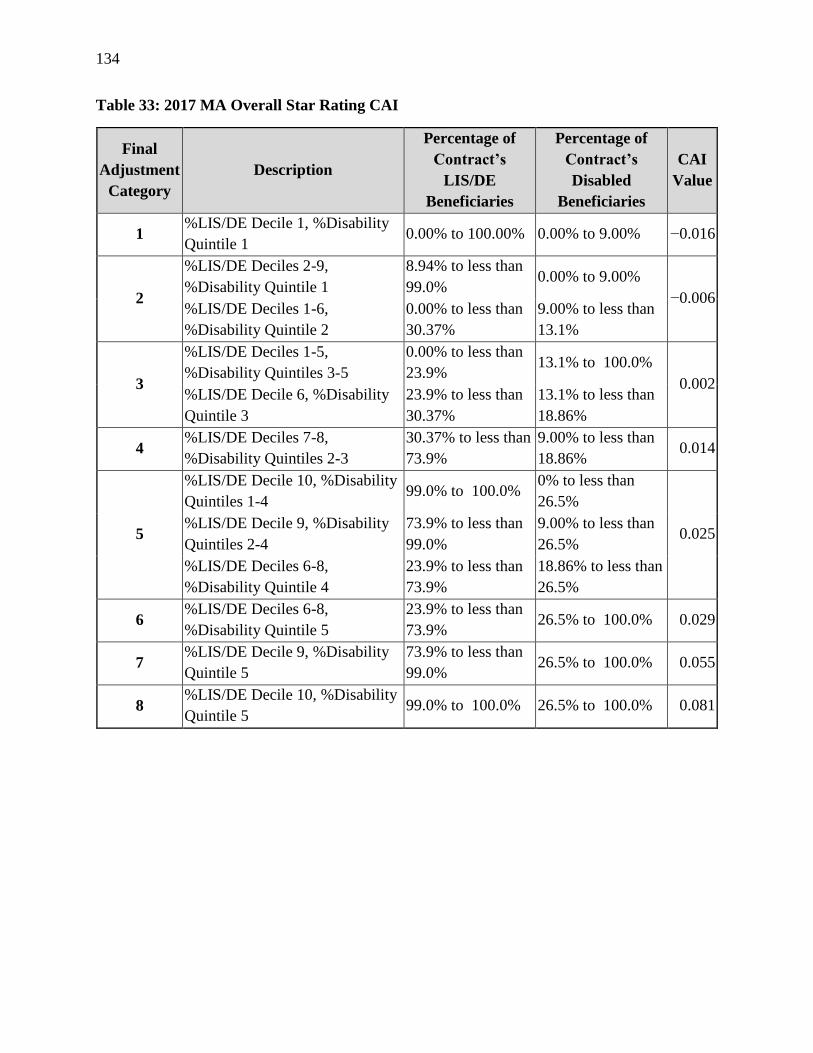
134
Table 33: 2017 MA Overall Star Rating CAI
Final
Adjustment
Category
Description
Percentage of
Contract’s
LIS/DE
Beneficiaries
Percentage of
Contract’s
Disabled
Beneficiaries
CAI
Value
1 %LIS/DE Decile 1, %Disability
Quintile 1 0.00% to 100.00% 0.00% to 9.00% −0.016
2
%LIS/DE Deciles 2-9,
%Disability Quintile 1
8.94% to less than
99.0% 0.00% to 9.00%
−0.006 %LIS/DE Deciles 1-6,
%Disability Quintile 2
0.00% to less than
30.37%
9.00% to less than
13.1%
3
%LIS/DE Deciles 1-5,
%Disability Quintiles 3-5
0.00% to less than
23.9% 13.1% to 100.0%
0.002 %LIS/DE Decile 6, %Disability
Quintile 3
23.9% to less than
30.37%
13.1% to less than
18.86%
4 %LIS/DE Deciles 7-8,
%Disability Quintiles 2-3
30.37% to less than
73.9%
9.00% to less than
18.86% 0.014
5
%LIS/DE Decile 10, %Disability
Quintiles 1-4 99.0% to 100.0%
0% to less than
26.5%
0.025 %LIS/DE Decile 9, %Disability
Quintiles 2-4
73.9% to less than
99.0%
9.00% to less than
26.5%
%LIS/DE Deciles 6-8,
%Disability Quintile 4
23.9% to less than
73.9%
18.86% to less than
26.5%
6 %LIS/DE Deciles 6-8,
%Disability Quintile 5
23.9% to less than
73.9% 26.5% to 100.0% 0.029
7 %LIS/DE Decile 9, %Disability
Quintile 5
73.9% to less than
99.0% 26.5% to 100.0% 0.055
8 %LIS/DE Decile 10, %Disability
Quintile 5 99.0% to 100.0% 26.5% to 100.0% 0.081
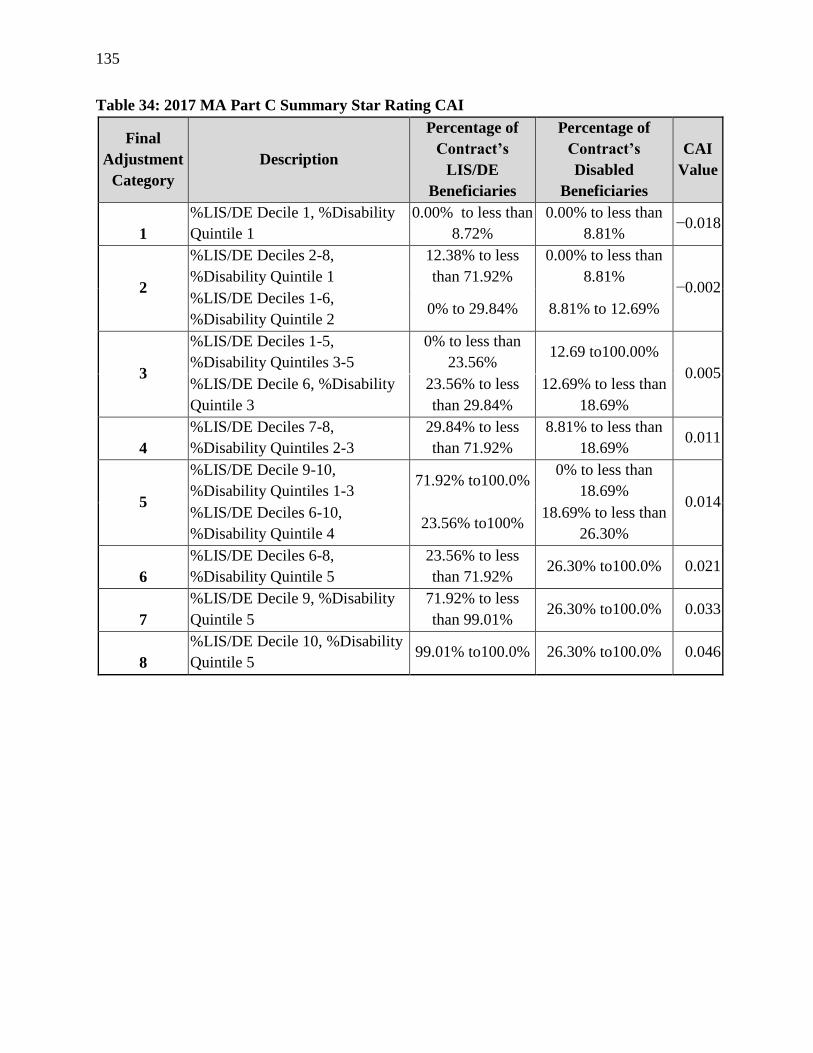
135
Table 34: 2017 MA Part C Summary Star Rating CAI
Final
Adjustment
Category
Description
Percentage of
Contract’s
LIS/DE
Beneficiaries
Percentage of
Contract’s
Disabled
Beneficiaries
CAI
Value
1
%LIS/DE Decile 1, %Disability
Quintile 1
0.00% to less than
8.72%
0.00% to less than
8.81% −0.018
2
%LIS/DE Deciles 2-8,
%Disability Quintile 1
12.38% to less
than 71.92%
0.00% to less than
8.81% −0.002
%LIS/DE Deciles 1-6,
%Disability Quintile 2 0% to 29.84% 8.81% to 12.69%
3
%LIS/DE Deciles 1-5,
%Disability Quintiles 3-5
0% to less than
23.56% 12.69 to100.00%
0.005 %LIS/DE Decile 6, %Disability
Quintile 3
23.56% to less
than 29.84%
12.69% to less than
18.69%
4
%LIS/DE Deciles 7-8,
%Disability Quintiles 2-3
29.84% to less
than 71.92%
8.81% to less than
18.69% 0.011
5
%LIS/DE Decile 9-10,
%Disability Quintiles 1-3 71.92% to100.0%
0% to less than
18.69% 0.014
%LIS/DE Deciles 6-10,
%Disability Quintile 4 23.56% to100%
18.69% to less than
26.30%
6
%LIS/DE Deciles 6-8,
%Disability Quintile 5
23.56% to less
than 71.92% 26.30% to100.0% 0.021
7
%LIS/DE Decile 9, %Disability
Quintile 5
71.92% to less
than 99.01% 26.30% to100.0% 0.033
8
%LIS/DE Decile 10, %Disability
Quintile 5 99.01% to100.0% 26.30% to100.0% 0.046
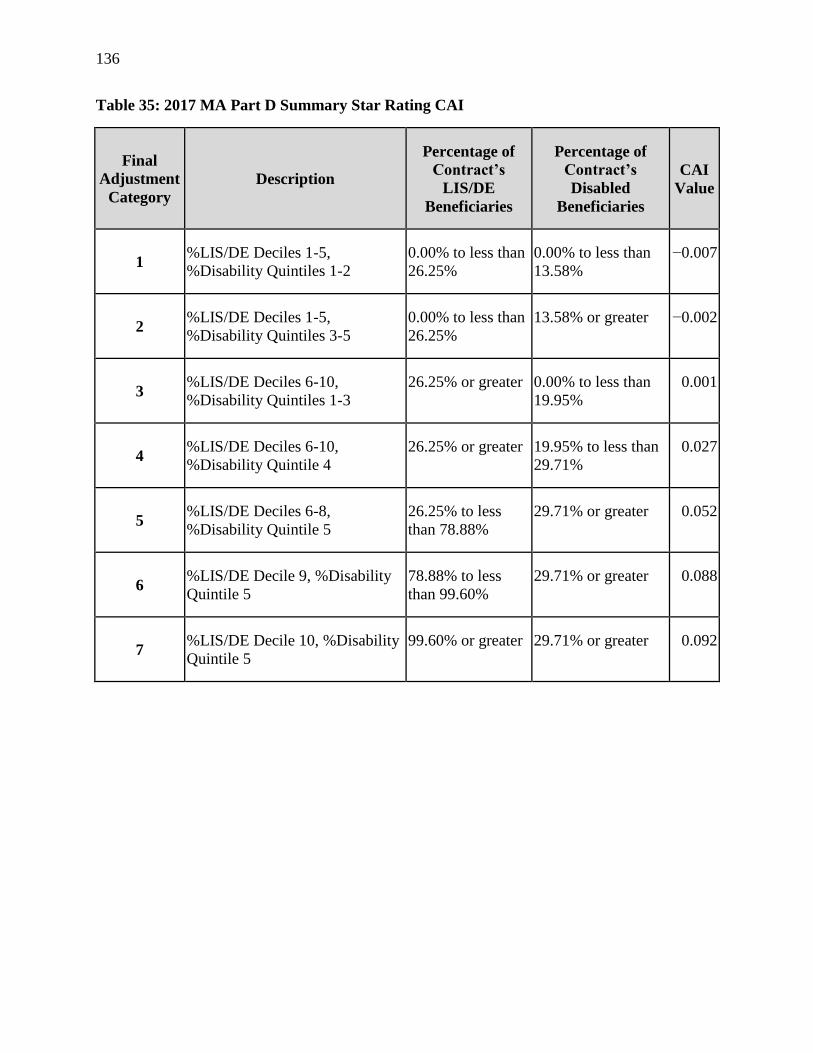
136
Table 35: 2017 MA Part D Summary Star Rating CAI
Final
Adjustment
Category
Description
Percentage of
Contract’s
LIS/DE
Beneficiaries
Percentage of
Contract’s
Disabled
Beneficiaries
CAI
Value
1 %LIS/DE Deciles 1-5,
%Disability Quintiles 1-2
0.00% to less than
26.25%
0.00% to less than
13.58%
−0.007
2 %LIS/DE Deciles 1-5,
%Disability Quintiles 3-5
0.00% to less than
26.25%
13.58% or greater −0.002
3 %LIS/DE Deciles 6-10,
%Disability Quintiles 1-3
26.25% or greater 0.00% to less than
19.95%
0.001
4 %LIS/DE Deciles 6-10,
%Disability Quintile 4
26.25% or greater 19.95% to less than
29.71%
0.027
5 %LIS/DE Deciles 6-8,
%Disability Quintile 5
26.25% to less
than 78.88%
29.71% or greater 0.052
6 %LIS/DE Decile 9, %Disability
Quintile 5
78.88% to less
than 99.60%
29.71% or greater 0.088
7 %LIS/DE Decile 10, %Disability
Quintile 5
99.60% or greater 29.71% or greater 0.092

137
Table 36: 2017 PDP Part D Summary Star Rating CAI
Final
Adjustment
Category
Description
Percentage of
Contract’s
LIS/DE
Beneficiaries
Percentage of
Contract’s
Disabled
Beneficiaries
CAI
Value
1
%LIS/DE Quartiles 1 & 2 0.00% to less than
11.41% 0.00% to 100%
−0.109 %LIS/DE Quartiles 3-4 &
%Disability Quartiles 1-2
11.41% to 100% 0.00% to less than
9.98
2
%LIS/DE Quartile 3 &
%Disability Quartiles 3-4
11.41% to less
than 49.43% 9.98% to 100%
−0.023 %LIS/DE Quartile 4 &
Disability Quartile 3
49.43% to 100% 9.98% to less than
28.32%
3 %LIS/DE Quartile 4 &
%Disability Quartile 4
49.43% to 100% 28.32% to 100% 0.127
Additional response to address lack of an LIS indicator for enrollees in Puerto Rico
Another issue we continue to examine is the manner to address the unique aspects of
implementation of Medicare in Puerto Rico. Under statute, many Department of Health and
Human Services’ (HHS) programs, including Medicare and Medicaid, are implemented
differently in Puerto Rico. In addition, Puerto Rico has a unique health care market with many
low-income individuals in both Medicare and Medicaid and a complex legal history that affects
the health care system in many ways. We are cognizant of the particular challenges in not only
Puerto Rico, but in all territories without LIS and propose an additional analytical adjustment for
contracts serving these areas exclusively to address the fact that the Part D low income subsidy
(LIS) is not available there.
Representatives of and advocates for Puerto Rico and MA organizations have expressed
additional concerns about the sensitivity of the Star Ratings. CMS has listened and is responding
by considering two additional provisions in the 2017 Star Ratings to specifically address the
concerns regarding quality ratings in Puerto Rico. CMS is proposing for contracts that are solely
serving the population of beneficiaries in Puerto Rico: (1) the use of an LIS indicator that would
be used in conjunction with the analytical adjustment and (2) a differentiated weighting scheme
for the Part D medication adherence measures in the calculation of the Overall and Summary
Star Ratings.
Notably, Puerto Rican beneficiaries are not eligible for LIS, which is an important element of the
methodology for the analytical adjustment. (Beneficiaries in the 50 states and DC are eligible for
LIS if their income is less than 150% of the Federal Poverty Level (FPL) and they meet the
applicable resource requirement). To make the proposed analytical adjustment equitable, CMS is
considering an additional adjustment for contracts in Puerto Rico to identify beneficiaries in

138
Puerto Rico’s contracts whose incomes would result in an LIS designation in the 50 states and
DC. Although LIS in the states depends on both income and resources, a data source for resource
information for PR enrollees is not available. Thus, the simulations use only income information
to simulate the LIS indicator. The value for the LIS indicator in Puerto Rico would then be used
in the application of the analytical adjustment for the Overall and Summary Star Ratings.
Currently, none of the territories, except Puerto Rico, have contracts that serve exclusively
beneficiaries within the territory. The proposed changes discussed in this section would also
apply to other territories without LIS if contracts serve exclusively beneficiaries in the territory.
In order to determine the LIS indicator for contracts in Puerto Rico, CMS must use a data source
that is readily available at this time. For the 2017 Star Ratings, CMS proposes to employ the
overall mean proportion of DE beneficiaries in Puerto Rico calculated using the rating year data
and the mean proportion of beneficiaries at or below 150% of the FPL using the American
Community Survey data for Puerto Rico. CMS has explored other sources of data for use in
determining the LIS indicator for the upcoming rating year, but at this time no other source has
been identified that can be employed. CMS will continue to explore sources for data to best
estimate the LIS indicator for contracts in Puerto Rico. The data source for the LIS indicator
must provide valid, reliable estimates for use in the Star Ratings. We encourage stakeholders in
Puerto Rico to explore and suggest other data sources to determine the LIS indicator.
Having heard the voices of multiple stakeholders, including sponsors and beneficiaries in Puerto
Rico, CMS proposes to move forward and implement the interim estimates for the LIS indicator
instead of waiting for the availability of a different data source.
The contract-level modified LIS/DE proportion for Puerto Rico would be developed from two
sources of information: (1) the overall proportion of beneficiaries in Puerto Rico with incomes
less than 150% of the FPL and (2) each contract’s proportion of DE beneficiaries. A linear
regression model would be developed to predict the percentage of LIS in a contract using the
percentage of DE using MA contracts in the 10 states with the highest poverty.30 This model
would then be adjusted for use in Puerto Rican contracts (i.e., contracts with a service area only
in Puerto Rico) using Puerto Rico’s mean percentage of DE and mean of LIS (using the
percentage of Puerto Rico’s population with incomes less than 150% of the FPL using the
American Community Survey as the basis for the estimate). Using the model developed, each
contract’s proportion of DE beneficiaries in Puerto Rico would have a corresponding proportion
30 The preliminary modelling suggested employing the 50 states and the District of Columbia
results in very high accuracy in predicting contract-level LIS from contract-level DE. There is
an insignificant impact on the model coefficients when restricting the data source to the lower-
income subsets of states. CMS is proposing to use the percentage of DE using MA contracts in
the 10 states with the highest poverty to create a contract-level measure of LIS/DE percentage to
be used in the CAI.

139
of LIS to create a contract-level measure of LIS/DE percentage to be used in the CAI. We
welcome comments on this proposed approach to approximate the percentage of LIS by contract
in Puerto Rico, or other possible suggestions of ways to estimate this percentage.
CMS recognizes the additional challenge unique to Puerto Rico related to the medication
adherence measures in the Star Ratings Program. It has been shown that beneficiaries’ out-of-
pocket costs may adversely affect medication adherence, which presents an additional barrier for
Puerto Rican contracts serving beneficiaries whose incomes would result in an LIS designation
in the states. In the past, one option considered was to reduce the weights of the three Part D
Medication Adherence measures for Puerto Rican contracts. A prior proposal in the 2015 draft
Call Letter to reduce the weight of the three Part D Medication Adherence measures to 1.5 as
access measures for all Part D sponsors was not supported by the majority of commenters. In the
2015 Final Call Letter, CMS decided not to move forward with the proposal to reduce the
weights of the adherence measures for all contracts.
We commend the Puerto Rican contracts on their improved performance overall across the 2016
Star Ratings and in particular the Part D Medication Adherence measures. This year, CMS is
considering an additional option to the LIS/DE adjustment noted above, one that is similar to a
previous proposal, but limited to MAOs and PDPs that operate solely in Puerto Rico or other
non-continental territories in order to address the unique challenges of improving medication
adherence in those areas. For the 2017 Star Ratings, CMS is proposing to reduce the weights of
the three Part D Medication Adherence measures to zero for the calculation of the Overall and
Summary Ratings, and retain the values and the associated weight of the three adherence
measures for the calculation of the improvement factor.
The simulations for Puerto Rico employing the LIS Indicator and CAI, resulted in one contract
realizing an increase in their Overall Star Rating by half a star, while with IS, one contract would
experience a decline in their Overall Rating by half a star. There are no changes in the Part C or
Part D Summary Ratings for PR contracts for the CAI simulation. For the IS simulation, one
MA PR contract would experience a decline by half a star in their Part C Summary Rating and
another MA contract would experience a decline by half a star in their Part D Summary Rating.
The simulations of the down weighting of the adherence measures for Puerto Rico resulted in
four MA-PDs increasing by a half-star in their Overall Rating, independent of making a SES
adjustment. With the down weighting of the adherence measures, one PDP increased one star in
their Part D Summary Rating.
E. 2017 CMS Display Measures
Display measures on CMS.gov are not part of the Star Ratings. These may include measures that
have been transitioned from the Star Ratings, new measures that are being tested before inclusion
into the Star Ratings, or measures displayed for informational purposes. Similar to the process
used in 2016, organizations and sponsors will have the opportunity to preview their data for the

140
display measures prior to release on CMS’ website. Data for measures moved to the display page
will continue to be collected and monitored; poor scores on display measures may reveal
underlying compliance and performance issues that are subject to enforcement actions by CMS.
It is expected that all 2016 display measures will continue to be shown on CMS.gov in 2017.
CMS will continue to provide advance notice regarding measures considered for implementation
as future Star Ratings measures. Other display measures may be provided as information only.
Below are a number of revised or new measures for the 2017 display page.
1. Timely Receipt of Case Files for Appeals (Part D) & Timely Effectuation of Appeals
(Part D). For the 2016 display measures, the data time frame for both measures was
01/01/2015 – 6/30/2015. CMS proposes to change the data time frame from the first six
months of the current year to January 1 – December 31 of the previous year. For example,
the 2017 display measures would be based on IRE data from January 1, 2015-December 31,
2015. This change will allow the appeal display measures to match the same timeframe used
for the Part D Appeal Star Ratings measures.
2. Medication Reconciliation Post Discharge (Part C). The Medication Reconciliation Post-
Discharge (MRP) measure assesses the percentage of discharges from acute or non-acute
inpatient facilities for members 66 years of age and older for whom medications were
reconciled within 30 days of discharge. This measure has been collected in SNP HEDIS
since 2008. NCQA made two changes: 1) expanded the coverage on this measure from
Medicare SNPs only to all MA plans; and 2) expanded the age range to members 18 years
and older. Both of these changes for HEDIS 2016 are seen as important steps to measure the
quality of care coordination post-discharge for MA beneficiaries as well as ensuring patient
safety. CMS is planning to include this measure on the 2017 display page and in the 2018
Star Ratings. Please refer to the NCQA HEDIS 2016 Technical Specifications for Health
Plans Volume 2 for measure construction and technical specifications.
3. Hospitalizations for Potentially Preventable Complications (Part C). NCQA added to
HEDIS 2016 a risk-adjusted measure of hospitalization for ambulatory care sensitive
conditions based on the NQF-endorsed Prevention Quality Indicators (PQI), developed by
AHRQ. This measure assesses the rate of hospitalization for complications of chronic and
acute ambulatory care-sensitive conditions. The measure is therefore an important indicator
of care coordination. CMS is planning to include this measure on the 2017 display page and
is planning to include it in the 2018 Star Ratings. Please refer to the NCQA HEDIS 2016
Technical Specifications for Health Plans Volume 2 for measure construction and technical
specifications.
4. Statin Therapy for Patients with Cardiovascular Disease (Part C). NCQA has added two
sets of statin therapy measures to HEDIS aligned with the 2013 ACC/AHA blood cholesterol
guidelines. These measures are focused on two of the major statin benefit groups described in
the guidelines: patients with clinical atherosclerotic cardiovascular disease and patients with

141
diabetes. Since some of these HEDIS measures overlap with the measures developed by the
PQA, CMS is planning to include only one of the HEDIS measures on the 2017 display page
where we propose it remain for two years. After gaining experience with the new treatment
guidelines and metric, we plan to include this measure in the 2019 Star Ratings. This
measure focuses on statin therapy for patients with cardiovascular disease. It is the
percentage of males 21 to 75 years of age and females 40 to 75 years of age who were
identified as having clinical atherosclerotic cardiovascular disease and were dispensed at
least one high or moderate-intensity statin medication during the measurement year.
5. Asthma Measures (Part C). NCQA has expanded its asthma measures to include older
adults. HEDIS 2016 includes two measures for older adults. Medication Management for
People with Asthma is the percentage of members 5 to 85 years of age who were identified
as having persistent asthma and were dispensed appropriate medications that they remained
on during the treatment period (i.e., first prescription date through end of measurement year).
The Asthma Medication Ratio is the percentage of members who were identified as having
persistent asthma and had a ratio of controller medications to total asthma medications of
0.50 or greater during the measurement year. CMS is planning to include these on the 2017
and possibly 2018 display page and will consider these for inclusion in Star Ratings for
future years.
6. Statin Use in Persons with Diabetes (SUPD) (Part D). This new PQA-endorsed measure,
Statin Use in Persons with Diabetes (SUPD), calculates the percentage of patients between
40 and 75 years old who received at least two diabetes medication fills and also received a
statin medication during the measurement period. Beneficiaries in hospice according to the
Enrollment Database (EDB) will be excluded from the denominator of the SUPD measure
for the entire year. Part D sponsors have received year of service 2015 SUPD measure
reports on a monthly basis through the Patient Safety Analysis website, and we will add the
SUPD measure to the 2017 display page (using 2015 data) where we propose it remain for
two years. After gaining experience with the new treatment guidelines and metric, we
propose adding the SUPD measure to the 2019 Star Ratings (using 2017 data).
Lastly, in January 2015, the PQA’s Quality Metrics Expert Panel (QMEP) considered
whether beneficiaries taking proprotein convertase subtilisin/kexin type 9 (PCSK-9)
inhibitors should be excluded from the measure denominator. At this time, the QMEP
decided not to exclude beneficiaries taking PCSK-9 inhibitors from SUPD measure
denominator. It is our understanding that the PQA will review the measure specifications
again when more information is available about this new therapeutic class.
Forecasting to 2018 and Beyond

142
The following describes changes to existing measures and potential new measures. CMS will
also monitor any additional measures developed by NCQA or PQA for potential incorporation
into the Star Ratings.
F. New Measures:
See section E above which describes a number of new measures under consideration for the 2018
Star Ratings that will be reported as 2017 display measures. The following are additional
measures under consideration for the Star Ratings or display measures for 2018 and beyond.
1. Care Coordination Measures (Part C). Effective care coordination contributes to improved
health outcomes. CMS believes that 5-star contracts perform well on our Star Ratings
measures because they understand how to effectively coordinate care for their enrollees. Our
assumption about plan care coordination activities, however, is based largely on anecdote and
discussions with high performing plans, as well as on data we collect from CAHPS surveys,
which reflect enrollees’ experiences with the care they receive.
CMS is working to expand efforts in this area. To identify potential new care coordination
measures, CMS is utilizing experts to conduct targeted research, extensive literature reviews,
and data analysis, and to engage in discussions with expert panels and high performing plans.
As part of this effort, we are considering various data sources; whether the measures should
be focused on subgroups of MA enrollees or all MA enrollees; the activities that best
represent care coordination such as ensuring seamless transitions across settings, appropriate
follow up after inpatient and emergency department visits, communication across providers,
and comprehensive assessments; as well as the relationship between the plan and provider in
care coordination activities. NCQA, using administrative and medical record data, will begin
testing the following proposed measures using 2015 data: primary care provider (PCP)
notification of inpatient admissions, summary of care record in PCP chart, follow-up with
PCP/specialist following hospital discharge or emergency department visit, and in the
ambulatory setting whether there is a comprehensive assessment performed and documented
by the PCP/specialist and whether there is a specialist visit summary in the PCP chart.
Additionally, CMS has recently awarded another contract to develop care coordination
measures using administrative data, including MA encounter data and Part D data. CMS
continues to welcome comments on measures that could be developed using MA encounter
data. We will provide updates to the industry as this work progresses.
2. Depression Measures (Part C). NCQA has adapted a provider-level depression outcome
measure developed by Minnesota Community Measurement for use in HEDIS. Depression
Remission or Response in Adolescents and Adults (DRR) uses a patient-reported outcome
measure, the PHQ-9 tool, to assess whether patients with depression have achieved remission
or have an improvement in their symptoms. The measure assesses the percentage of
individuals age 12 and older with depression and an elevated PHQ-9 score (greater than 9)
who achieve a PHQ-9 score of less than 5 at six months or have a 50% reduction in their
143
PHQ-9 score. This measure also uses a new data collection methodology for HEDIS, relying
on data coming from electronic clinical data systems (e.g., EHRs, clinical registries, case
management records). If approved, the new measure would be published in HEDIS 2017.
CMS shared with NCQA comments received as part of our Request for Comments on this
topic and will continue to monitor the development of this measure.
3. Appropriate Pain Management (Part C). NCQA is exploring opportunities to develop a
new measure(s) focusing on appropriate pain management. The intent is to assess the quality
of pain management and treatment. There is no definite timeline established for the
development of this measure.
4. Use of Opioids from Multiple Providers or at High Dosage in Persons without Cancer
(Part D). In the 2016 Call Letter, we noted that three opioid overutilization measures were
in development by the PQA. We further stated that if these measures were endorsed by the
PQA prior to the 2017 bid deadline in June 2016 that we may adopt them as future display
measures or alternatively use them in the Overutilization Monitoring System (OMS). The
measures were endorsed by the PQA in May 2015.
PQA’s three opioid measures examine multi-provider, high dosage opioid use among
individuals 18 years and older without cancer and not in hospice care.
Measure 1 (Opioid High Dosage): The proportion (XX out of 1,000) of individuals without
cancer or hospice receiving prescriptions for opioids with a daily dosage greater than 120 mg
morphine equivalent dose (MED) for 90 consecutive days or longer.
Measure 2 (Multiple Prescribers and Multiple Pharmacies): The proportion (XX out of
1,000) of individuals without cancer or hospice receiving prescriptions for opioids from four
(4) or more prescribers AND four (4) or more pharmacies.
Measure 3 (Multi-Provider, High Dosage): The proportion (XX out of 1,000) of individuals
without cancer or hospice receiving prescriptions for opioids with a daily dosage greater than
120 mg morphine equivalent dose (MED) for 90 consecutive days or longer, AND who
received opioid prescriptions from four (4) or more prescribers AND four (4) or more
pharmacies.
We tested the measures using the PQA specifications. We will develop new patient safety
reports for the three opioid overutilization measures to provide to Part D sponsors on a
monthly basis through the Patient Safety Analysis website, similar to the other patient safety
measures. The website also includes the OMS. The reports will allow sponsors to track their
performance over time and allow for contract level trending and outlier analyses. Reports
will be distributed beginning with 2016 dates of service. After at least one year to gain
experience with the measures and pending new guidelines (e.g., from CDC), we will consider
adding these three measures to the 2019 Part D display page (using 2017 data). We do not

144
recommend adding these measures to the Star Ratings at this time due to concerns (1) about
the current lack of consensus clinical guidelines for the use of opioids to treat chronic, non-
cancer pain and potential exceptions due to medical necessity and (2) pending additional
analysis on diagnosis data sources, such as newly available encounter data for Medicare Part
C and resolving timing issues of RAPS file updates, which are used to identify exclusions for
certain cancer conditions.
Additionally, NCQA is adapting the three opioid overuse measures developed by the PQA
for potential use in HEDIS.
5. Antipsychotic Use in Persons with Dementia (APD) (Part D). CMS has been particularly
concerned with the unnecessary use of antipsychotic drugs in nursing homes and, as a result,
has pursued strategies to increase awareness of antipsychotic use in long term care settings.
In 2013, we began to calculate a general atypical antipsychotic utilization rate, called Rate of
Chronic Use of Atypical Antipsychotics by Elderly Beneficiaries in Nursing Homes, for
inclusion in the Part D display measures. The average rates decreased from approximately
24.0% in 2011 to 21.4% in 2013.
There continues to be increased attention on this important issue. The United States
Government Accountability Office (GAO) released a report31 in January 2015 describing the
inappropriate use of antipsychotics in Part D beneficiaries with dementia, in both community
(i.e., outside of nursing homes) and long-stay nursing home residents during 2012, with
recommendations for CMS to address this problem. The GAO conducted this study due to
concerns raised regarding the use of antipsychotic drugs to address the behavioral symptoms
associated with dementia, the FDA’s boxed warning that these drugs may cause an increased
risk of death when used by older adults with dementia, and because the drugs are not
approved for this use.
In addition, the PQA endorsed the measure, Antipsychotic Use in Persons with Dementia
(APD). This provides CMS with a new measure developed through a consensus process to
monitor the inappropriate use of antipsychotics in both the nursing home and community
settings across Medicare Part D plans.
We tested this measure based on the PQA specifications. We calculated the APD measure
rate in aggregate for all contracts, MA-PDs, and PDPs, and at the individual contract level,
for all beneficiaries, community-only residents (never a nursing home resident), and both
short-term and long-term nursing home residents that met the inclusion and exclusion
criteria. Beneficiaries were identified as long-stay nursing home residents if they had stays
greater than 100 cumulative days in a nursing home during the year based data in the Long
31 Antipsychotic Drug Use: HHS Has Initiatives to Reduce Use among Older Adults in Nursing
Homes, but Should Expand Efforts to Other Settings. http://www.gao.gov/products/GAO-15-
211. GAO-15-211: Published: Jan 30, 2015. Publicly Released: March 2, 2015

145
Term Care Minimum Data Set (MDS). Each beneficiary was counted in only one category
for the entire measurement period within a contract and not considered separately for time
spent in different settings (e.g., a beneficiary who experienced both short-term and long-term
nursing home stays was included only in the long-term category).
To identify the numerator and denominator populations, we used diagnosis data obtained
from inpatient (IP), outpatient (OP), and carrier claims from the Common Working File
(CWF) and RxHCCs from the RAPS. OP and Carrier claims are available for PDP contracts
only. We also adjusted rates based on the number of months beneficiaries are enrolled in
each Part D contract (i.e., member-years adjustment).
We conducted reliability testing using mixed effect logistic regression with varying intercept.
The testing results indicate that the rate variations at the contract level are statistically
significant, providing evidence that the measure is reliable.
A report, Antipsychotic Use in Part D Enrollees with Dementia, which summarizes the
testing results, is posted on CMS.gov at: https://www.cms.gov/Medicare/Prescription-Drug-
Coverage/PrescriptionDrugCovGenIn/Downloads/Antipsychotic-Use-in-Part-D-Enrollees-
with-Dementia-v12092015.pdf.
We will develop new patient safety APD measure reports to provide to Part D sponsors on a
monthly basis through the Patient Safety Analysis website beginning with year of service
2016. We also propose adding the overall APD measure plus breakout rates for community-
only residents, short-term nursing home residents, and long-term nursing home stay residents
to the 2018 Part D display measure set (using 2016 data) to continue to draw attention to the
inappropriate use of antipsychotics in persons with dementia without an appropriate mental
health diagnosis in both the community and nursing home settings. The APD measure will
replace the Rate of Chronic Use of Atypical Antipsychotics by Elderly Beneficiaries in
Nursing Homes display measure. However, we do not propose adding this measure to the
Star Ratings pending additional research on diagnosis data sources, such as newly available
encounter data for Medicare Part C and resolving timing issues of RAPS file updates.
G. Changes to Existing Star Ratings and Display Measures and Potential Future Changes:
1. Colorectal Cancer Screening (Part C Star Rating). The Colorectal Cancer Screening
(COL) measure assesses the percentage of adults 50-75 years of age who had appropriate
screening for colorectal cancer. This measure is based on the U.S. Preventative Services Task
Force (USPSTF) guideline on colorectal cancer screening in adults age 50-75. NCQA is
monitoring updates to the guideline as the USPSTF has recently released a draft
recommendation statement. NCQA will consider revisions to the COL measure once the
USPSTF final recommendation statement is published. It is anticipated that the final release
of recommendations will not occur until late 2016.

146
2. Fall Risk Management (Part C Star Rating). The Fall Risk Management (FRM) measure,
collected through the Health Outcomes Survey, consists of the following two indicators: 1)
Discussing Fall Risk assesses the percentage of Medicare members 75 years of age and older
or 65-74 years of age with a balance or walking problem or fall in the past 12 months who
discussed falls or problems with balance or walking with their current practitioner; and 2)
Managing Fall Risk assesses the percentage of Medicare members 65 years of age and older
who had a fall or had problems with balance or walking in the past 12 months and received
fall risk intervention from their current practitioner (defined as suggesting use of a cane or
walker, a vision or hearing test, physical therapy or exercise, or taking of a postural blood
pressure). NCQA is currently re-evaluating this measure to align with the most current U.S.
Preventive Services Task Force (USPSTF) guidelines. NCQA is proposing to 1) revise the
denominator in the Discussing Fall Risk indicator to include all Medicare members age 65
and older and 2) revise the numerator for the Managing Fall Risk indicator to include plan
members who report having had an intervention. The survey question will list examples of
interventions (such as use of vitamin D) to prompt survey respondents to recall if they
received any fall risk management intervention from their provider. These proposed changes,
if approved, would be published in HEDIS 2017 or HEDIS 2018.
3. Pneumococcal Vaccination Status for Older Adults (Part C Display). The Pneumococcal
Vaccination Status for Older Adults (PNU) measure, collected through the Medicare CAHPS
survey, assesses the percentage of Medicare members 65 years of age and older who have
ever received a pneumococcal vaccination. In 2014, The Advisory Committee on
Immunization Practices (ACIP) released new recommendations that all adults 65 years of age
and older should receive sequential administration of both PCV13 and PPSV23. NCQA is
considering changes to the measure to align with the most current guidelines. Specifically,
they are evaluating the feasibility of developing a new measure of pneumococcal vaccination
based on alternative data sources, such as administrative claims, state immunization registries
and electronic health records. In the meantime they recommend the following wording
changes to the existing CAHPS measure: “Have you ever had one or more pneumonia shots?
Two shots are usually given in a person’s lifetime and these are different from a flu shot. It is
also called the pneumococcal vaccine”. Pending OMB approval the new wording would be
utilized for 2017 CAHPS implementation. This measure is on the CMS display page.
4. CAHPS measures (Part C & D). Patient experience surveys such as CAHPS focus on how
patients experienced or perceived key aspects of their care, not how satisfied they were with
their care. CAHPS surveys follow scientific principles in survey design and development.
The surveys are designed to reliably assess the experiences of a large sample of
patients. They use standardized questions and data collection protocols to ensure that
information can be compared across health care settings. CAHPS surveys are developed with
broad stakeholder input, including a public solicitation of measures and a technical expert

147
panel, and the opportunity for anyone to comment on the survey through multiple public
comments period through the Federal Register.
The current MA & PDP CAHPS Survey includes the core CAHPS 4.0 Health Plan Survey.
CMS conducted an experiment in 2015 to understand how CAHPS measures differ between
4.0 and 5.0, and based on the results we propose to update the survey for future years to
reflect AHRQ’s CAHPS 5.0 Health Plan Survey. The findings from the experiment suggest
that these changes are associated with a small increase in scores for several evaluative MA
measures. These small increases did not significantly differ across contracts. Since there are
no longer fixed thresholds for Star Ratings and they are based on the actual distribution of
scores, there should be no shifts in Star Ratings due to transition to the version 5.0 instrument
compared to what would have been the case with 4.0. Every contract would have the same
expected Star Rating whether version 4.0 or 5.0 is used, and the correlation between this
year’s Star Ratings and next year’s Star Ratings should be the same regardless of whether 4.0
or 5.0 is used next year.
The 5.0 update applies recent improvements in survey design that resulted from development
and testing of the Clinician & Group Surveys. The 5.0 version of the CAHPS Health Plan
Survey incorporates some minor changes into the wording of core items, and a change in the
placement of one core item that also resulted in the deletion of a screener item. The following
are the changes in the 5.0 version of the Health Plan Surveys:
The items about access to urgent and non-urgent appointment items were modified
to ask respondents if they were able to get an appointment as soon as they needed, as
opposed to as soon as they thought they needed. Non-urgent appointments are described
as a check-up or routine care rather than health care. In addition, the phrase, “…not
counting the times you needed care right away” was deleted from these questions. These
revisions simplify the items and make them consistent with questions in other CAHPS
surveys.
The item about how often it was easy to get appointments with specialists was
revised to ask respondents if they got an appointment to see a specialist as soon as they
needed. This revision makes the item consistent with other CAHPS items that ask about
access to care.
The item about how often it was easy to get care, tests, or treatment was moved from
the Your Health Plan section to the Your Health Care in the Last 6 Months section,
because respondents had difficulty attributing this item to the health plan.
The screener item about getting care, tests, or treatment through the health plan
was deleted because the subsequent question was moved to an earlier section of the
survey and no longer required a screener.

148
These changes would take effect for the 2017 CAHPS survey administration (used for 2018
Star Ratings) based on OMB approval. Since we are modifying question wording, we
propose the following standard for deciding that a specification change has occurred for a
CAHPS measure for the purposes of excluding it from the improvement measure calculation:
(1) at least one item within the measure changed in wording, had a wording change in its
screener, or had a wording change in the immediately preceding item, and (2) the measure
score in version 5.0 was significantly different from the measure score in version 4.0 in the
5.0 experiment. Three MA measures met this standard: Getting Care Quickly, Customer
Service, and Care Coordination. Thus, these three measures would be excluded from the
Part C improvement measure for the 2018 Star Ratings.
We are also considering changing the sampling for CAHPS in future years when a contract is
listed in HPMS as a consolidation between July of the prior year and January of the current
year when the CAHPS sample is drawn. The sampling frame for the surviving contract
would include the enrollees for all members of all contracts involved if two or more contracts
consolidate under the same parent organization. We will continue to study this and would
give advance notice before making any changes to the methodology.
5. Medication Adherence for Hypertension (RAS Antagonists) (Part D Star Rating). Based
on PQA specification change, the measure will exclude from the denominator those patients
with one or more claims for sacubitril/valsartan. This exclusion will be applied for the 2017
Star Ratings.
6. MPF Price Accuracy (Part D Star Rating). As stated in the 2016 Call Letter, CMS is
considering a few updates to this measure for the 2018 Star Ratings. The first proposed
change is related to the method by which claims are excluded from the measure. Currently,
the measure is limited to claims filled for 30-day supply at pharmacies reported by sponsors
as retail only or retail and limited access only in their MPF Pharmacy Cost files. That is,
claims that are not filled for exactly 30-day supply, or claims filled for 60 and 90 days’
supply are excluded. Additionally, claims filled by retail pharmacies that are also long term
care, mail order, or home infusion pharmacies are excluded. These restrictions result in the
exclusion of many PDEs, thus potentially biasing the reliability of the measure.
We propose to include claims with 28-34 day supply, as we believe it would be appropriate
to compare their PDE costs to MPF’s fixed display of 1 month pricing. We also propose to
include 60-62 and 90-93 day supply claims for a more comprehensive evaluation of PDE
claims. Beginning with CY2015 MPF submissions, plans must provide brand and generic
dispensing fees for 60 and 90 day supply claims in the Pharmacy Cost file. CMS can use
these data, along with 60 and 90 day supply Pricing File data, to compare MPF and PDE
costs.

149
Additionally, we propose to use the PDE-reported Pharmacy Service Type code in
conjunction with the MPF Pharmacy Cost data to identify retail claims. CMS began requiring
pharmacies to populate the Pharmacy Service Type field on all PDEs at the end of February
2013. We recommend expanding the retail claims identification process to include all PDEs
that are from retail pharmacies according to the Pharmacy Cost data and have a Pharmacy
Service Type of either Community/Retail or Managed Care Organization (MCO). Although
some sponsors cited concern about the accuracy of these data as reported by pharmacists,
Part D sponsors are ultimately responsible for the accuracy of their submitted PDE to CMS.
According to PDE requirements, CMS expects “…sponsors and their network pharmacies to
develop and implement controls to improve the accuracy of this information during 2013…”
This methodology change would increase the number of PDEs eligible for inclusion in the
Price Accuracy Scores while continuing to identify only retail claims.
We are also considering changes to the methodology by which price accuracy is calculated.
The current methodology measures the magnitude, but not the frequency of a contract’s PDE
prices being higher than the MPF prices. A contract’s accuracy score can be significantly
impacted by high cost PDEs. As a result, contracts with divergent accurate price reporting
and/or consistency can receive the same Price Accuracy Score. CMS is interested in
modifying the methodology to factor in both how much and how often PDE costs exceeded
MPF costs. The frequency of inaccuracy by a contract would be the percent of claims where
PDE cost is greater than MPF cost. The numerator is the number of claims where PDE cost is
greater than MPF cost, and the denominator is the total number of claims. This ratio is then
subtracted from 1 and multiplied by 100 to calculate the Claim Percentage Score, with 100 as
the best possible score and 0 as the worst possible score. The contract’s accuracy score would
be a composite of the Price Accuracy Score and the Claim Percentage Score.
By capturing the frequency of inaccuracy as well as the magnitude, the measure would better
depict the reliability of a contract’s MPF advertised prices. CMS is aware that while the MPF
display is updated every two weeks, real time pricing, at the point of sale, can change as
often as every day. Some sponsors have expressed concern that in order to perform well in
the Price Accuracy measure, they cannot offer lower prices at point of sale in real time than
the prices are displayed on MPF. We note that PDEs priced lower than MPF displayed
pricing do not lower a contract’s score in this measure. CMS’ simulation of this proposal
found little change in the range of contracts’ accuracy scores. Other options we explored
include measuring the magnitude of inaccuracy as a percentage cost difference, instead of the
current measure’s use of absolute cost difference. Testing however found this method may
overstate small differences between PDE and MPF costs for low-cost claims. For example,
when using percentage cost differences, a claim with a $2.00 PDE cost and a $1.00 MPF cost
would be considered equally overpriced as a claim with a $200.00 PDE cost and a $100.00
MPF cost.
As noted in the 2016 Call Letter, we propose that these changes are implemented for the
2018 Star Ratings (using 2016 PDE and MPF data). We believe the proposed changes will

150
greatly improve the Price Accuracy Scores, making them a more comprehensive assessment
of contracts’ price reporting for Part D beneficiaries. For consistency, we propose these
changes are also implemented for the 2018 display measure, Plan Submitted Higher Prices
for Display on MPF.
7. Drug-Drug Interactions (DDI) (Part D Display). The PQA-endorsed DDI measure is
currently a Part D display measure. This measure is defined as the percent of Medicare Part
D beneficiaries who received a prescription for a target medication during the measurement
period and who were dispensed a prescription for a contraindicated medication with or
subsequent to the initial prescription.
The PQA has conducted an extensive review of the drug-drug pairs included in the DDI
measure. They engaged a DDI expert panel convened by the University of Arizona on
PQA's behalf, which completed the review, including a comparison to the DDI list developed
for the Office of the National Coordinator for Health Information Technology (ONC). The
Expert Panel's recommendations were reviewed by the PQA’s Measure Update Panel for
consideration by the PQA’s Quality Metrics Expert Panel (QMEP). Next, the PQA will test
the DDI measure specifications because there will be extensive changes. We will closely
monitor any updates to this measure, test updated specifications when available, and propose
changes in the future for the Part D display measure and patient safety reporting.
8. Center for Medicare and Medicaid Innovation Model Tests.
We note that some stakeholders (and commenters to the Request for Comments) have
expressed concern regarding the potential for the improvements in quality resulting from the
Medicare Advantage Value-Based Insurance Design (MA-VBID) and the Part D Enhanced
MTM Model test to adversely influence the Star Ratings of contracts ineligible to participate
(or that include some PBPs ineligible to participate). As stated in the Request for Comments,
the goal is to not penalize participants or non-participants in either model.
As the model tests are implemented, we will closely monitor performance trends of
participating plans across individual measures and determine if any changes are warranted.
For the MA-VBID Model test, CMS is considering the exclusion of some of the model-
participants’ data when calculating measure-level cut points. We welcome any comments on
this or other means of how to address any potential differences in performance between
participating and non-participating plans.
The Part D plans participating in the Part D Enhanced MTM Model test will be waived from
the MTM requirements under Section 1860D–4(c)(2) and 42 CFR 423.153(d) and the Part D
Reporting Requirements for MTM. However, Part D sponsors will not be waived from
establishing MTM programs in compliance with current requirements and reporting data for
the remaining plans under each Part D contract. Therefore, the MTM Program CMR

151
Completion Rates will be calculated using available plan-reported data from the remaining
plans under the Part D contract.
Some commenters have expressed concern that Enhanced MTM Model participants will
sometimes be significantly advantaged or disadvantaged by the removal of the participating
PBPs from the calculation of the CMR completion rate measure at the contract level, and
have suggested the elimination of this measure for PDP contracts with model-participating
plans. Some alternative possible options are to establish different cut points for model
participants or to case mix adjust scores for the purpose of determining cut points. We are
aware that the national scope of many PDP contracts must be taken into consideration in
evaluating options for addressing potential differences in performance between participating
and non-participating plans. We welcome comments on these or any other potential
approaches to adjustments to the CMR completion rate percentage.
H. Measurement and Methodological Enhancements
CMS is committed to continuing to improve the Part C and D Star Ratings by identifying new
measures and methodological enhancements. Feedback or recommendations can help CMS’
continuing analyses, as well as our collaboration with measurement development entities such as
NCQA and PQA. We welcome comments and input on issues not described in earlier sections.
Based on feedback received from the Star Ratings Request for Comments concerning our Call
Center Monitoring methodology, CMS is considering whether to allow the interpreter an extra
60 seconds to address an introductory question that is asked prior to three specific plan benefit
questions. Any changes made to the 2017 call center monitoring methodology would be
announced in a fall 2016 HPMS memo.
Finally, we note that CMS has a rigorous Quality Assurance and Audit process over the test call
process that involves multiple layers of review before, during and after each monitoring
period. We encourage plans/sponsors to request and review their raw call data to validate the
results. CMS believes that validation of the information by plans/sponsors is an important tool
in our overall review of the monitoring contractor’s performance, and we encourage
plans/sponsors to contact CMS if they believe an error occurred.
Medicare Parts C & D Program Audits
Proposed Release Date for the 2017 Part C and Part D Program Audit Protocols
Each year, the Medicare Parts C & D Oversight & Enforcement Group (MOEG) releases the Part
C and Part D audit protocols to the industry in an effort to be as transparent as possible about our
audit approach. We remain committed to continuous improvement in the development of our
audit processes and protocols, and value the input and feedback of all sponsors and stakeholders.
We have received feedback previously that sponsors would appreciate our audit protocols being
152
released well in advance of the audit year, to allow more time to implement the new protocols
and prepare for audits.
Therefore, beginning with the 2017 audit protocols, we are planning to release the following
year’s protocols by the end of July, instead of mid-to-late fall. In other words, the 2017
protocols will be released in July of 2016. This release date should allow sponsors sufficient
time to program their systems to pull accurate audit universes, conduct self-assessments, and
prepare for an audit.
We recognize that by releasing the audit protocols in July, it will delay our ability to incorporate
sponsors’ feedback on protocols into the next year’s versions. Instead, feedback gathered on
2016 protocols would be incorporated into the 2018 protocols. We welcome comments on the
proposed July release date and the consequences of release on that timetable.
This new release cycle will have a particular impact on the two audit protocols that are being
piloted in 2016, the Medication Therapy Management (MTM) and Provider Network Adequacy
(PNA) protocols.
We gather feedback from sponsors who take part in an audit with pilot protocols and use their
feedback and experience to evaluate if updates and changes are needed to our pilot protocols
prior to finalizing them. Since we will begin the process of finalizing the 2017 protocols only a
few months into the 2016 pilot audit period, we do not believe that we will have gathered enough
feedback on the pilot protocols prior to the July release date. Therefore, we are proposing to
extend the pilot of these protocols into 2017 in order to allow time to gather feedback and
determine if revisions are needed to the pilot audit protocols.
As a reminder, sponsors subject to pilot protocols do not receive a score for the pilot, nor does it
factor into their overall audit score. Finally, the results from the pilot audit protocol do not
appear in the final audit report.
We would also like to acknowledge that the Provider Network Adequacy protocol will not be
administered as a normal audit protocol and will not happen in conjunction with the remainder of
our program audits. As mentioned in Section II of this document, wide scale monitoring efforts
are underway with respect to network adequacy and provider directory. The Medicare Parts C &
D Oversight and Enforcement Group (MOEG), in coordination with the Medicare Parts C & D
Contract Administration Group (MCAG) are taking a comprehensive approach to monitor, audit
and validate compliance with these requirements. Therefore, MOEG will be using the results of
MCAG’s monitoring each year to audit and validate correction of any deficiencies identified
throughout the year. Those organizations who fail to correct and come into compliance with
these requirements may be subject to possible enforcement action, including civil money
penalties or enrollment sanctions.

153
Medicare Parts C & D Enforcement Actions
Civil Money Penalty (CMP) Calculation Methodology
When CMS makes a determination that a plan sponsor’s operational deficiencies adversely
affected or had the substantial likelihood of adversely affecting enrollees, the agency imposes
Civil Money Penalties (CMPs) in accordance with Subpart O of 42 C.F.R. §§ 422 and 423. A
number of plan sponsors and industry groups have requested more information on the approach
CMS uses to determine CMP amounts and how the impact of certain deficiencies are factored
into a given CMP. In response to this interest, CMS plans to release a memo describing our
interpretation of the applicable rules in a CMP Methodology by 2017, but will provide an
opportunity for industry to comment before finalizing. This CMP methodology may be modified
and republished on an as needed basis.
Compliance and Enforcement Actions Related to Part D Auto-Forwards
Part D plan sponsors are required to have procedures for making timely coverage determinations
and redeterminations and for notifying enrollees of those decisions within the required
adjudication timeframes. If notice of the decision is not provided within the required timeframe,
the case must be automatically forwarded to the Part D Independent Review Entity (IRE). While
all auto-forwarded cases represent non-compliance with CMS requirements for timely
processing, of particular concern to CMS are plan sponsors with inordinately high levels of cases
that are auto-forwarded throughout the plan year due to the plan sponsor’s failure to meet the
required adjudication timeframes. The requirements related to auto-forwarding untimely cases to
the Part D IRE are set forth at 42 CFR Part 423, Subpart M and in Chapter 18 of the Medicare
Prescription Drug Benefit Manual.
The volume of cases auto-forwarded to the IRE has been significant and sustained over the past
several years. CMS has been monitoring auto-forward rates with the expectation that there
would be a meaningful reduction of this volume over time as Part D plan sponsors gained
program experience. CMS is notifying Part D plan sponsors that in 2017 we will continue to
increase the level and severity of the compliance and enforcement actions imposed on plans that
substantially fail to comply with adjudication requirements for coverage determinations and
redeterminations. CMS will use data to determine which plan sponsors are outliers with respect
to untimely decisions and the corresponding rate at which cases are auto-forwarded to the Part D
IRE. Pursuant to § 423.752(c)(1)(i), CMS has the authority to impose CMPs against sponsors
that substantially fail to comply with the requirements related to coverage determinations,
appeals and grievances in accordance with § 423.509(a)(4)(ii). A plan sponsor’s inordinately
high auto-forward rate is evidence of substantial failure to comply with the requirements to
notify enrollees of coverage determination and redetermination decisions within the required
timeframes. These failures adversely affect (or have the substantial likelihood of adversely

154
affecting) beneficiaries by causing inappropriate delays in accessing needed prescription drugs
and/or financial hardship to beneficiaries.
Enforcement Actions Related to One Third Financial Audit Findings
Sections 1857(d)(1) and 1860D-12(b)(c) of the Social Security Act require the HHS Secretary to
provide for the annual audit of the financial records of at least one-third of the Medicare
Advantage Organizations (MAOs) and Prescription Drug Plans (PDPs). The one-third financial
audit program is designed to examine the health plans’ financial records, internal controls over
payment disbursements, Medicare utilization and costs, and the computation of Part C & D
bids. Findings of noncompliance from these audits have identified significant financial errors,
disallowed costs, and internal control weaknesses. While sponsors are required to put a
corrective action in place and rectify their deficiencies, certain findings with adverse beneficiary
impact, such as incorrect or increased cost-sharing or copayments for beneficiaries, warrant
further enforcement actions. As a result, CMS is notifying Part C & D plan sponsors that
starting with audits conducted in 2017 (based on CY 2015), we will begin to consider the
findings of noncompliance from the one-third financial audits for potential enforcement actions,
in accordance with 42 CFR §§422.752(c)(i) and 423.752(c)(i).
Innovations in Health Plan Design
The CMS Innovation Center is responsible for developing and testing new payment and service
delivery models that will lower costs and improve quality for Medicare, Medicaid, and CHIP
beneficiaries. In the CY 2016 Call Letter, CMS indicated its intention to partner with private
payers to test innovations in health plan design for CMS beneficiaries.
Since the CY 2016 Call Letter, CMS has announced the Medicare Advantage Value-Based
Insurance Design (MA-VBID) and the Part D Enhanced Medication Therapy Management
(MTM) Model tests, both scheduled to begin on January 1, 2017. These model tests are
described below.
CMS continues to consider potential Innovation Center models in health plan design. We
welcome stakeholder suggestions and input around potential approaches.
Medicare Advantage Value-Based Insurance Design Model Test
The MA-VBID Model test is an opportunity for MAOs to offer mandatory supplemental benefits
or reduced cost sharing to enrollees with CMS-specified chronic conditions, focused on the
services that are of highest clinical value to them. Only those MAOs approved by CMS to
participate in the model may do so, and only within PBPs accepted into the model test. The
model will test whether these interventions can improve health outcomes and lower expenditures
for Medicare Advantage enrollees. CMS is conducting the model test in seven states, and the
application period for joining the model in CY 2017 closed last month.

155
Part D Enhanced MTM Model
The Part D Enhanced MTM Model will test whether providing Part D sponsors with additional
payment incentives and regulatory flexibilities will engender enhancements in the MTM
program, leading to improved therapeutic outcomes, while reducing net Medicare expenditures.
The model is an opportunity for stand-alone basic Part D plans to right-size their investments in
MTM services, identify and implement innovative strategies to optimize medication use,
improve coordination of care between plans and providers, and strengthen system linkages.
Stand-alone PDP basic plans that have applied and been approved to participate in the CMS
Innovation Center’s Enhanced MTM Model will offer MTM programs subject to the terms and
conditions of the model test in the five selected Part D regions. All other Part D plans, including
any ineligible plans offered by the PDP sponsors of participating plans, will remain subject to the
current regulatory requirements for MTM programs and must include those costs in their 2017
Part D bids. None of the waivers or funding available to model-participating plans is applicable
to the other ineligible plans offered by those PDP sponsors. A participating plan sponsor may
use lessons learned from model beneficiary and provider engagement and intervention strategies
to increase participation within its mandatory MTM programs in other plans, to the extent
allowable outside of the model. For more information, please visit: https://innovation.cms.gov/
initiatives/enhancedmtm/.
Section II – Part C
Guidance on the Future of Provider Directory Requirements and Best Practices
CMS wants to further emphasize the importance of providing accurate provider directories to
MA enrollees. Inaccurate provider directories can impede access to care and bring into question
the adequacy and validity of the MAO’s network as a whole. In concert with previously released
guidance, our focus remains making sure provider directories are accurate for Medicare
beneficiaries and their caregivers who rely on them to make informed decisions regarding their
health care choices.
CMS is aware of pilot programs being tested by some MAOs to use new technology to simplify
the process of updating provider directories for physicians and other network participants. We
are supportive of industry efforts to improve provider directories and encourage MAOs and
providers to continue to work collaboratively to develop more effective and efficient methods of
maintaining accurate provide directories. We see great potential with the use of technologies that
capitalize on machine readable information. To foster the development of such technologies, we
urge both industry and provider community to strive to provide data, including provider
information on network participation, in a machine readable format. CMS has purposefully not
prescribed the means by which MAOs must update their provider directories in order to allow
innovation in this area such as updating provider directories by gathering a digital representation
of provider participation and contact information directly from a provider’s web page.

156
Preliminary data gathered by CMS, as well as continued stakeholder concerns, has intensified
our concerns with provider directory accuracy. We will continue to aggressively identify and
pursue instances of non-compliance by using a host of oversight methods. For example, with
contractor support, we have developed a comprehensive process for monitoring provider
directory accuracy, which is currently underway. The data collected through our monitoring
activities could drive additional reviews of network adequacy, as well as future monitoring
and/or audit-based activities. Moreover, identified areas of non-compliance may be subject to
compliance and/or enforcement actions, including civil money penalties or enrollment sanctions.
CMS also remains committed to making provider directory requirements across CMS programs
consistent. As such, the MA program is taking steps to harmonize the requirements and provide
organizations that operate across multiple CMS programs consistency in the application of
provider directory requirements.
Currently among MA, QHPs and the Medicaid managed care programs, MA provides the least
prescriptive provider directory requirements. (See 42 C.F.R. §422.111(b)(3)(i) and explained in
sections 60.4 and 100.4 of the Medicare Marketing Guidelines (https://www.cms.gov/Medicare/
Health-Plans/ManagedCareMarketing/Downloads/2016-Medicare-Marketing-Guidelines-
Updated.pdf). The MA program also has the fewest data elements required for its provider
directory. In addition, both Medicaid and the QHPs have moved toward some level of machine
readability for online provider directory content (see 45 C.F.R. 156.230(c) with additional
guidance provided via Draft 2017 Letter to Issuers in the Federally-facilitated Marketplaces; and
Proposed Medicaid Final Rule CMS–2390–P, 42 C.F.R. 438.10(h)(4)), while MA has not. The
Office of Management and Budget (OMB) defines "machine readable" as a format in a standard
computer language (not English text) that can be read automatically by a web browser or
computer system.
Regulatory updates to § 422.111 would generally be needed to require MA organizations to issue
provider directories that include the additional elements. CMS intends to propose such revisions
in the future and encourages the inclusion of the elements listed below in provider directory
requirements as a best practice and urges MAOs to incorporate them into their production of
such directories in advance of future rulemaking.
The following are the provider directory data elements we believe are appropriate to use in
current MAOs’ provider directories:
Machine readable content
Provider medical group
Provider institutional affiliation
Non-English languages spoken by provider
Provider website address
Accessibility for people with physical disabilities

157
In addition, to further facilitate the ease with which enrollees’ access providers, we encourage
MAOs to also institute the best practice of incorporating a “warm transfer” policy to their
customer service call centers. For enrollees calling to request help finding a provider, the CSR
would close the call by calling the provider’s office, establishing the need(s) of the enrollee, and
transferring the enrollee to the provider’s office to complete the appointment process.
Overview of CY 2017 Benefits and Bid Review
Portions of this guidance apply to cost-based plans and MA plans (including EGWPs, Dual-
Eligible Special Needs Plans (D-SNPs), Chronic Care Special Needs Plans (C-SNPs), and
Institutional Special Needs Plans (I-SNPs)). We currently do not evaluate whether employer
group plans, D-SNPs, and 1876 Cost Plans are duplicative under §422.256(b)(4), also referred to
as the “meaningful difference” evaluation. Similarly, employer group plans and 1876 Cost Plans
are not evaluated for low enrollment under §422.506(b)(1)(iv) and (b)(2). CMS reserves the right
to review employer group plans for low enrollment and/or meaningful difference in future years.
Medicare-Medicaid Plans in Capitated Financial Alignment Demonstrations are not subject to
the review criteria summarized in the table below and benefits and benefit review guidance for
these plans will be provided separately.
CMS makes all of the necessary tools and information available to MAOs in advance of the bid
submission deadline, and therefore expects all MAOs to submit their best, accurate, and
complete bid(s) on or before the Monday, June 6, 2016 deadline. Any organization whose bid
fails the published Part C Service Category Cost Sharing, PMPM Actuarial Equivalent Cost
Sharing, Meaningful Difference, Total Beneficiary Cost (TBC), and/or Optional Supplemental
Benefit requirements at any time prior to final approval will receive a compliance notice, even if
the organization is allowed to correct the deficiency. The severity of compliance notice may
depend on the type and/or severity of errors.
The following chart displays key MA bid review criteria and identifies which criteria apply to
the plan types identified in the column headings.
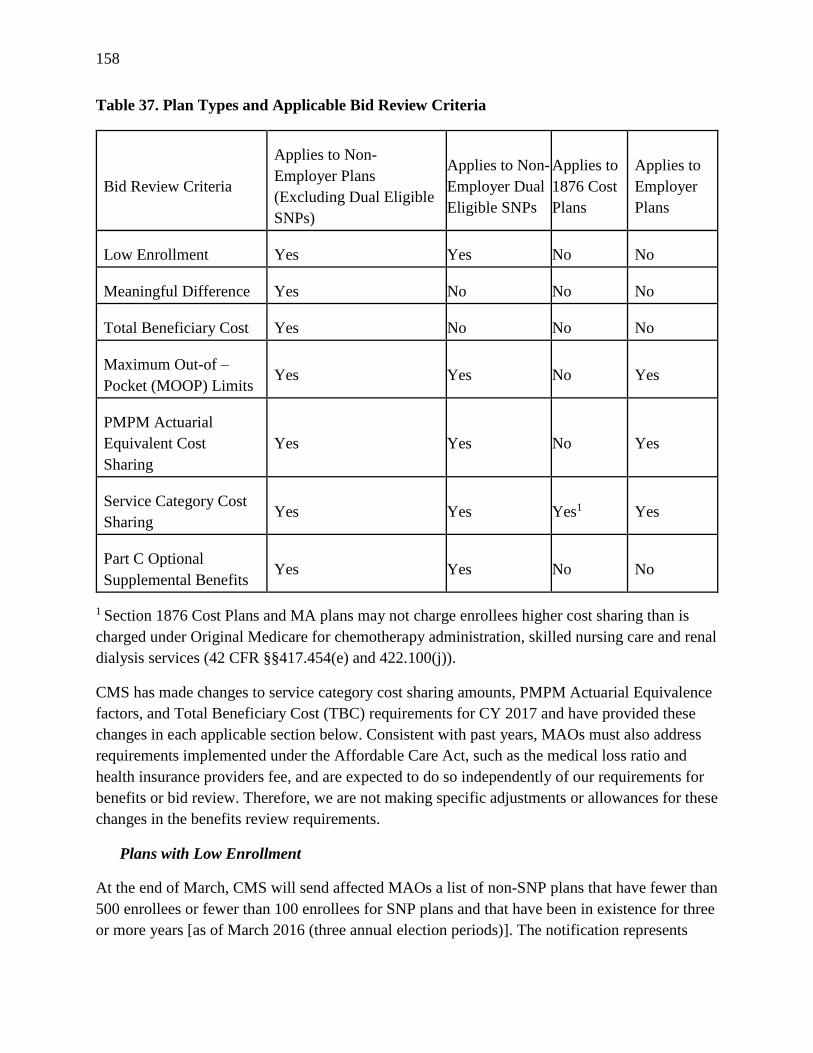
158
Table 37. Plan Types and Applicable Bid Review Criteria
Bid Review Criteria
Applies to Non-
Employer Plans
(Excluding Dual Eligible
SNPs)
Applies to Non-
Employer Dual
Eligible SNPs
Applies to
1876 Cost
Plans
Applies to
Employer
Plans
Low Enrollment Yes Yes No No
Meaningful Difference Yes No No No
Total Beneficiary Cost Yes No No No
Maximum Out-of –
Pocket (MOOP) Limits Yes Yes No Yes
PMPM Actuarial
Equivalent Cost
Sharing
Yes Yes No Yes
Service Category Cost
Sharing Yes Yes Yes1 Yes
Part C Optional
Supplemental Benefits Yes Yes No No
1 Section 1876 Cost Plans and MA plans may not charge enrollees higher cost sharing than is
charged under Original Medicare for chemotherapy administration, skilled nursing care and renal
dialysis services (42 CFR §§417.454(e) and 422.100(j)).
CMS has made changes to service category cost sharing amounts, PMPM Actuarial Equivalence
factors, and Total Beneficiary Cost (TBC) requirements for CY 2017 and have provided these
changes in each applicable section below. Consistent with past years, MAOs must also address
requirements implemented under the Affordable Care Act, such as the medical loss ratio and
health insurance providers fee, and are expected to do so independently of our requirements for
benefits or bid review. Therefore, we are not making specific adjustments or allowances for these
changes in the benefits review requirements.
Plans with Low Enrollment
At the end of March, CMS will send affected MAOs a list of non-SNP plans that have fewer than
500 enrollees or fewer than 100 enrollees for SNP plans and that have been in existence for three
or more years [as of March 2016 (three annual election periods)]. The notification represents

159
CMS’ decision not to renew such plans under 42 CFR §422.506(b)(1)(iv) and (b)(2). The list
will not include plans with low enrollment that CMS determines are located in service areas that
do not have a sufficient number of competing options of the same plan type (such that the low
enrollment plan still represents a viable plan option for enrollees).
Through return e-mail, MAOs must either (1) confirm that each of the low enrollment plans
identified by CMS will be eliminated or consolidated with another of the organization’s plans for
CY 2017, or (2) provide a justification for renewal. If CMS does not find a unique or compelling
reason that the low enrollment plan is a viable independent option for enrollees, CMS will
instruct the organization to eliminate or consolidate the plan. Instructions and the timeframe for
submitting business cases and the information required in those submissions will be included
with the list of low enrollment plans sent to the MAO. Note: These requirements do not apply to
Section 1876 cost plans, employer plans, or MA Medical Savings Account (MSA) plans.
CMS recognizes there may be certain factors, such as the specific populations served and
geographic location of the plan, that lead to a plan’s low enrollment. SNPs, for example, may
legitimately have low enrollments because they focus on a subset of enrollees with certain
medical conditions. CMS will consider this information when evaluating whether specific plans
should be non-renewed based on insufficient enrollment. MAOs should follow CMS
renewal/non-renewal guidance (see the Medicare Managed Care Manual: section 150 of Chapter
4, and/or section 60.2 of Chapter 16B) to determine whether a low enrollment plan may be
consolidated with another plan(s). CMS will continue to evaluate and implement low enrollment
requirements on an annual basis.
Meaningful Difference (Substantially Duplicative Plan Offerings)
Pursuant to §422.254(a)(4), MAOs offering more than one plan in a given service area must
guarantee the plans are substantially different so that beneficiaries can easily identify the
differences between those plans in order to determine which plan provides the highest value at
the lowest cost to address their needs. For CY 2017, CMS will use plan-specific per member per
month (PMPM) out-of-pocket cost (OOPC) estimates to identify meaningful differences in
beneficiary costs among the same plan types. For CY 2017, benefits and the reduction in cost
sharing that are offered as part of the Value-Based Insurance Design (VBID) model test will not
be included in the meaningful difference evaluation. Documentation and instructions for the
OOPC model are available at: https://www.cms.gov/Medicare/Prescription-Drug-Coverage/
PrescriptionDrugCovGenIn/OOPCResources.html.
CMS considers HMO and HMO-POS as one plan type, unless the HMO-POS plan covers all
Parts A and B services outside the network, in which case the HMO-POS plan is considered
meaningfully different from the HMO plan. Consistent with CY 2016, this standard for
evaluating meaningful difference will not include geographic or provider limitations on the out-
of-network benefits. However, CMS in future years may consider HMO-POS plans

160
meaningfully different only if the plans do not place geographic or provider limitations on the
out-of-network benefits.
For CY 2017, CMS will evaluate meaningful differences among CY 2017 non-employer and
non-cost contractor plans offered by the same MAO, in the same county and, under the same
contract, as follows:
1. The MAO’s plan offerings will be separated into five plan type groups on a county basis: (1)
HMO and HMO-POS not offering all Parts A and B services out-of-network; (2) HMO POS
offering all Parts A and B services out-of-network; (3) Local PPO; (4) Regional PPO; and (5)
PFFS.
2. SNP plan offerings will be further separated into groups representing the specific target
populations served by the SNP. Chronic Care SNPs will be separated by the chronic disease
served and Institutional SNPs will be separated into the following three categories: Institutional
(Facility); Institutional Equivalent (Living in the Community); and a combination of Institutional
(Facility) and Institutional Equivalent (Living in the Community). We currently do not apply the
meaningful difference evaluation to D-SNPs.
3. Plans within each plan type group will be further divided into MA-only and MA-PD sub-
groups for evaluation. That is, the presence or absence of a Part D benefit is considered a
meaningful difference.
4. The OOPC (Part C and Part D) PMPM estimate will be calculated for each plan. CMS
considers a difference of at least $20.00 PMPM between the OOPC for each plan offered by the
same MAO in the same county to be meaningful for purposes of applying the meaningfully
different standard.
(CMS may conduct this evaluation at either the legal entity or parent organization level in future
years.)
Note that plan characteristics such as premium, variations in provider networks, and/or serving
different populations are not considered meaningfully different characteristics. CMS is
maintaining the exclusion of premium from the criteria because the regulatory meaningful
difference requirement is intended to be an objective measure of benefits between two plans; the
inclusion of premium would introduce risk selection, costs, and margin into the evaluation,
resulting in a negation of the evaluation’s objectivity. Network differences have also been
excluded from our criteria because having a provider in one plan and not the other is not a
change in benefit coverage.
CMS expects MAOs to submit CY 2017 plan bids that meet the meaningful difference standards,
but will not prescribe how the MAOs should redesign benefit packages to achieve the
differences. Furthermore, MAOs will have access to the necessary tools to calculate OOPC
161
estimates for each plan prior to bid submission. CMS will not approve plan bids that do not meet
these standards.
CMS notes that meaningful difference will be evaluated based on the "as submitted formulary"
prior to rebate reallocation, and "first approved formulary" following rebate reallocation. MAOs
must follow the CY 2017 renewal/non-renewal guidance in the Final Call Letter to determine if
their plans may be consolidated with other plans.
NOTE: Please see policy updates below for changes to PBP that will impact the OOPC model
and may potentially affect the meaningful difference evaluation for certain plans.
Total Beneficiary Cost (TBC)
CMS will exercise its authority under section 1854(a)(5)(C)(ii) of the Act to deny MAO bids, on
a case-by-case basis, if it determines the bid proposes too significant an increase in cost sharing
or decrease in benefits from one plan year to the next through the use of the TBC standard. A
plan’s TBC is the sum of the plan-specific Part B premium, plan premium, and estimated
beneficiary out-of-pocket costs. The change in TBC from one year to the next captures the
combined financial impact of premium changes and benefit design changes (i.e., cost sharing
changes) on plan enrollees; an increase in TBC is indicative of a reduction in benefits. By
limiting excessive increases in the TBC from one year to the next, CMS is able to confirm
enrollees who continue enrollment in the same plan are not exposed to significant cost increases.
As in past years, CMS will evaluate TBC for non-employer plans (excluding D-SNPs). For CY
2017, benefits and cost sharing that are offered as part of the Value-Based Insurance Design
(VBID) model test will not be included in the TBC evaluation. The MA plans that are
participating in the VBID model test will be evaluated under the TBC calculation, including plan
premium and non-VBID benefits and cost sharing.
Under §422.254, CMS will reserve the right to further examine and request changes to a plan bid
even if a plan’s TBC is within the required amount. This approach not only protects enrollees
from significant increases in cost sharing or decreases in benefits, but also confirms enrollees
have access to viable and sustainable MA plan offerings.
CMS has focused on sharing information with and providing transparency to the MAOs as it
relates to the TBC year-to-year evaluation. CMS is proposing to modify the payment adjustment
in a different way than indicated in the CY 2016 Final Call Letter. Rather than “discounting” the
plan-specific payment adjustment (including a coding intensity component), CMS proposes to
eliminate the coding intensity adjustment factor. Since most of the ACA payment changes have
been implemented, it is our expectation that MAOs are better positioned to share payment
changes and provide affordable and effective benefits for beneficiaries. Going forward, the
payment adjustment in the TBC calculation would account for changes in county benchmarks,
quality bonus payment, and/or rebate percentages.

162
Consistent with past years, CMS will continue to incorporate the technical and payment
adjustments described below and expect organizations to address other factors, such as risk
adjustment model changes and payment of the health insurance provider’s fee independently of
our TBC requirement. As such, plans are expected to anticipate and manage changes in payment
and other environmental factors to minimize changes in benefit and cost sharing over time. CMS
also reminds MAOs that the Office of the Actuary extends flexibility on margin requirements so
MAOs can satisfy the TBC requirement.
In mid-April, as in past years, CMS will provide plan specific CY 2016 TBC values and the
following adjustments that are incorporated in the TBC calculation to account for changes from
one year to the next:
Technical Adjustments: (1) annual changes in OOPC model software and (2) maximum
Part B premium buy-down amount change in the bid pricing tool, if applicable (no
change for CY 2017).
Payment Adjustments: (1) county benchmark, and (2) quality bonus payment and/or
rebate percentages.
CMS will maintain the TBC change threshold at $32.00 PMPM for CY 2017. A plan
experiencing a net increase in adjustments must have an effective TBC change amount below the
$32.00 PMPM threshold to avoid denial of the bid under section 1854(a)(5)(C)(ii). Conversely,
a plan experiencing a net decrease in adjustments may have an effective TBC change amount
above the $32.00 PMPM threshold. In an effort to support plans that improve quality
compensation and experience large payment adjustments, along with holding plans accountable
for lower quality, CMS plans to apply the TBC evaluation as follows.
For CY 2017, the TBC change evaluation will be treated differently for the following specific
situations:
Plans with an increase in quality bonus payment and/or rebate percentage, and an overall
payment adjustment amount greater than $32.00 PMPM will have a TBC change
threshold of $0.00 PMPM (i.e., −1 times the TBC change limit of $32 PMPM) plus
applicable technical adjustments.
Plans with a decrease in quality bonus payments and/or rebate percentage, and an overall
payment adjustment amount less than -$32.00 PMPM will have a TBC change threshold
of $64.00 PMPM (i.e., 2 times TBC change limit of $32.00 PMPM) plus applicable
technical adjustments. That is, plans would not be allowed to make changes that result in
greater than $64.00 worth of decreased benefits or increased premiums.
Plans with a star rating below 3.0 and an overall payment adjustment amount less than
−$32.00 PMPM will have a TBC change threshold of $64.00 PMPM (i.e., 2 times TBC

163
change limit of $32.00) plus applicable technical adjustments.
Plans not accounted for in the three specific situations above will be evaluated at the $32
PMPM limit, similar to last year.
CMS received feedback subsequent to last year’s Call Letter suggesting that CMS make changes
to the TBC evaluation for Special Needs Plans for End Stage Renal Disease (ESRD), which are
subject to larger increases and/or decreases in payment amounts. To moderate potentially large
payment changes and provide MAOs with the ability to maintain benefit stability year-to-year,
while helping provide protection for this vulnerable beneficiary population, CMS is proposing to
apply limits to the payment adjustment for ESRD plans as described below:
Plans with an increase in the overall payment adjustment amount greater than $32.00
PMPM will have a TBC change threshold of $0.00 PMPM (i.e., −1 times the TBC
change limit of $32 PMPM) plus applicable technical adjustments.
Plans with a decrease in the overall payment adjustment amount less than -$32.00
PMPM will have a TBC change threshold of $64.00 PMPM (i.e., 2 times TBC change
limit of $32.00 PMPM) plus applicable technical adjustments. That is, plans would not
be allowed to make changes that result in greater than $64.00 worth of decreased
benefits or increased premiums.
As indicated in the CY 2016 Final Call Letter, CMS proposed that each individual plan being
consolidated into another plan must meet the TBC requirement on its own merit. For CY 2017,
CMS will be moving forward with this proposal; therefore, organizations consolidating multiple
plans into a single plan will no longer be permitted to use the enrollment-weighted average TBC
change of the consolidating plans. This approach affords greater protection for beneficiaries and
enrollees in non-renewing plans will be able to actively select another MA plan from the same or
competing organization based on CMS non-renewal guidance.
NOTE: Please see policy updates below for changes to PBP that will impact the OOPC model
and may potentially affect the TBC evaluation for certain plans.
Maximum Out-of-Pocket (MOOP) Limits
As codified at 42 CFR §422.100(f)(4) and (5) and §422.101(d)(2) and (3), all MA plans,
including employer group plans and SNPs, must establish limits on enrollee out-of-pocket
spending that do not exceed the annual maximum amounts set by CMS. Although the MOOP
requirement is for Parts A and B services, an MAO can include supplemental benefits as services
subject to the MOOP. MA plans may establish as their MOOP any amount within the ranges
shown in the table.
Table 38 below displays the CY 2017 mandatory and voluntary MOOP amounts and the
combined (catastrophic) MOOP amount limits applicable to Local PPOs and Regional PPOs. A
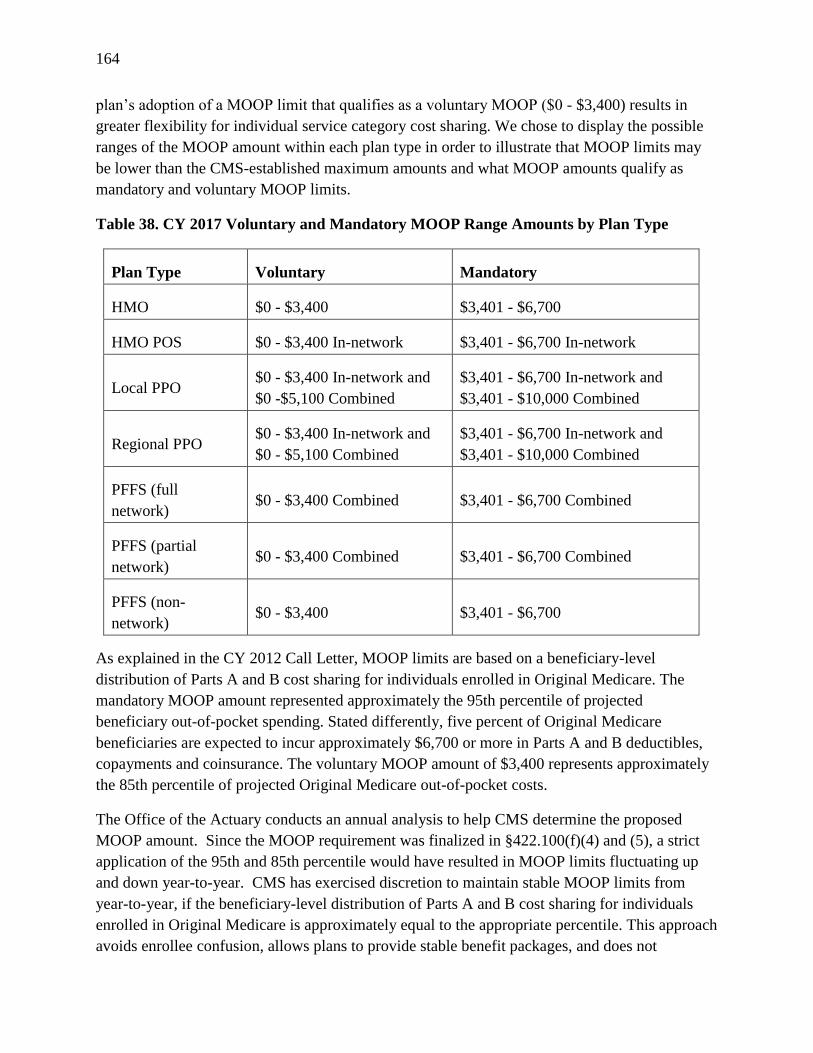
164
plan’s adoption of a MOOP limit that qualifies as a voluntary MOOP ($0 - $3,400) results in
greater flexibility for individual service category cost sharing. We chose to display the possible
ranges of the MOOP amount within each plan type in order to illustrate that MOOP limits may
be lower than the CMS-established maximum amounts and what MOOP amounts qualify as
mandatory and voluntary MOOP limits.
Table 38. CY 2017 Voluntary and Mandatory MOOP Range Amounts by Plan Type
Plan Type Voluntary Mandatory
HMO $0 - $3,400 $3,401 - $6,700
HMO POS $0 - $3,400 In-network $3,401 - $6,700 In-network
Local PPO $0 - $3,400 In-network and
$0 -$5,100 Combined
$3,401 - $6,700 In-network and
$3,401 - $10,000 Combined
Regional PPO $0 - $3,400 In-network and
$0 - $5,100 Combined
$3,401 - $6,700 In-network and
$3,401 - $10,000 Combined
PFFS (full
network) $0 - $3,400 Combined $3,401 - $6,700 Combined
PFFS (partial
network) $0 - $3,400 Combined $3,401 - $6,700 Combined
PFFS (non-
network) $0 - $3,400 $3,401 - $6,700
As explained in the CY 2012 Call Letter, MOOP limits are based on a beneficiary-level
distribution of Parts A and B cost sharing for individuals enrolled in Original Medicare. The
mandatory MOOP amount represented approximately the 95th percentile of projected
beneficiary out-of-pocket spending. Stated differently, five percent of Original Medicare
beneficiaries are expected to incur approximately $6,700 or more in Parts A and B deductibles,
copayments and coinsurance. The voluntary MOOP amount of $3,400 represents approximately
the 85th percentile of projected Original Medicare out-of-pocket costs.
The Office of the Actuary conducts an annual analysis to help CMS determine the proposed
MOOP amount. Since the MOOP requirement was finalized in §422.100(f)(4) and (5), a strict
application of the 95th and 85th percentile would have resulted in MOOP limits fluctuating up
and down year-to-year. CMS has exercised discretion to maintain stable MOOP limits from
year-to-year, if the beneficiary-level distribution of Parts A and B cost sharing for individuals
enrolled in Original Medicare is approximately equal to the appropriate percentile. This approach
avoids enrollee confusion, allows plans to provide stable benefit packages, and does not

165
discourage the adoption of the lower voluntary MOOP amount if the limit increases one year and
then decreases the next. CMS expects to increase MOOP limits if a consistent pattern of
increasing costs emerges over a period of time.
Although it may be rare that a dual-eligible enrollee would be responsible for paying any cost
sharing (because the State Medicaid program is making those payments on his/her behalf), all
MA plans must track enrollees’ actual out-of-pocket spending for covered services in order to
make certain an enrollee does not spend more than the MOOP amount limit established by the
plan. If the plan charges cost sharing for covered services, some dual-eligible enrollees may
incur cost sharing and any enrollee losing his/her Medicaid eligibility would be responsible for
cost sharing. D-SNPs have the flexibility to establish $0 as the MOOP amount, thereby
guaranteeing there is no cost sharing for plan enrollees, including those who are liable for
Medicare cost sharing. Otherwise, if the D-SNP does charge cost sharing for Medicare covered
or non-covered services, it must track enrollees’ out-of-pocket spending and it is up to the plan to
develop the process and vehicle for doing so.
Per Member Per Month (PMPM) Actuarial Equivalent (AE) Cost Sharing Limits
Total MA cost sharing for Parts A and B services must not exceed cost sharing for those services
in Original Medicare on an actuarially equivalent basis. CMS will apply this requirement
separately to the following service categories for CY 2017: Inpatient, Skilled Nursing Facility
(SNF), Durable Medical Equipment (DME), and Part B drugs. CMS will provide additional
information and an illustrative comparison of service-level actuarial equivalent costs (as in past
years) in the Final Call Letter.
Part C Cost Sharing Standards
For CY 2017, CMS will continue the current policy of affording MA plans greater flexibility in
establishing Parts A and B cost sharing by adopting a lower voluntary MOOP limit than is
available to plans that adopt a higher, mandatory MOOP limit. Table 39 below summarizes the
standards and cost sharing amounts by MOOP type (e.g., mandatory or voluntary) for local and
regional MA plans that we will not consider discriminatory or in violation of the applicable
standards. CY 2017 bids must reflect enrollee cost sharing for in-network services no greater
than the amounts displayed below. For LPPOs and RPPOs, these standards will be applied only
to in-network services. All standards and cost sharing are inclusive of applicable service category
deductibles, copayments and coinsurance, but do not include plan level deductibles. Inpatient
standards have been updated to reflect estimated changes in Original Medicare cost for CY 2017.

166
Table 39. CY 2017 In-Network Service Category Cost Sharing Requirements
Cost Sharing Limits
Service Category PBP Section B
data entry field
Voluntary
MOOP
Mandatory
MOOP
Inpatient - 60 days 1a N/A $4,177
Inpatient - 10 days 1a $2,471 $1,977
Inpatient - 6 days 1a $2,251 $1,801
Mental Health Inpatient - 60 days 1b $2,606 $2,085
Mental Health Inpatient - 15 days 1b $1,988 $1,590
Skilled Nursing Facility – First 20 Days1 2a $20/day $0/day
Skilled Nursing Facility – Days 21 through 1002 2a $164.50/day $164.50/day
Emergency Care/Post Stabilization Care 4a $75 $75
Urgently Needed Services3 4b $65 $65
Partial Hospitalization 5 $55/day $55/day
Home Health 6a 20% or $35 $0
Primary Care Physician 7a $35 $35
Chiropractic Care 7b $20 $20
Occupational Therapy 7c $40 $40
Physician Specialist 7d $50 $50
Psychiatric and Mental Health Specialty Services 7e and 7h $40 $40
Physical Therapy and Speech-language Pathology 7i $40 $40
Therapeutic Radiological Services 8b 20% or $60 20% or $60
DME-Equipment 11a N/A 20%
DME-Prosthetics 11b N/A 20%
DME-Medical Supplies 11b N/A 20%

167
Cost Sharing Limits
Service Category PBP Section B
data entry field
Voluntary
MOOP
Mandatory
MOOP
DME-Diabetes Monitoring Supplies 11c N/A 20% or $10
DME-Diabetic Shoes or Inserts 11c N/A 20% or $10
Dialysis Services 12 20% or $30 20% or $30
Part B Drugs-Chemotherapy4 15 20% or $75 20% or $75
Part B Drugs-Other 15 20% or $50 20% or $50
1 MA plans and 1876 Cost Plans may not charge enrollees higher cost sharing than is charged under Original Medicare for
chemotherapy administration, skilled nursing care and renal dialysis services (42 CFR §§417.454(e) and 422.100(j)).
2 MA plans may have cost sharing for the first 20 days of a SNF stay. The per-day cost sharing for days 21 through 100 must not
be greater than the Original Medicare SNF amount. Total cost sharing for the overall SNF benefit must be no higher than the
actuarially equivalent cost sharing in Original Medicare, pursuant to §1852(a)(1)(B).
3 Emergency Care and Urgently Needed Care benefits are not subject to plan level deductible amount and/or out-of-network
providers.
4 Part B Drugs - Chemotherapy cost sharing displayed is for services provided on an outpatient basis and includes administration
services. MAOs have the option to charge either coinsurance or a copayment for most service category benefits. For example,
based on the cost sharing requirements indicated above for Part B Drugs – Chemotherapy, a plan can choose to either assign up
to a 20% coinsurance or $75 copayment to that particular benefit.
Please note that MAOs with benefit designs which use a coinsurance or copayment amount for
which CMS does not have an established amount (e.g., coinsurance for inpatient or copayment
for durable medical equipment) must submit documentation with their initial bid that clearly
demonstrates how the coinsurance or copayment amount satisfies CMS service category
requirements. This documentation must be submitted as part of supporting documentation for the
Bid Pricing Tool as described in the Instructions for Completing the Medicare Advantage Bid
Pricing Tools for Contract Year 2017, Appendix B-Supporting Documentation. CMS annually
evaluates available Medicare data and other information to apply MA requirements in
accordance with applicable law. Organizations are afforded the flexibility to design their benefits
as they see fit so long as they satisfy Medicare coverage requirements.
As indicated in the table above, for SNF days 1 through 20, CMS will reduce the cost sharing
limit for CY 2017 voluntary MOOP plans from $40 per day to $20 per day for beneficiary
protection. In addition, we also intend to reduce the cost sharing limit from $20 per day to $0
per day for CY 2018 MA plans so that SNF cost sharing will align with Original Medicare for
both voluntary and mandatory MOOP.
CMS has traditionally afforded MAOs greater flexibility in establishing Parts A and B cost
sharing by adopting a lower, voluntary maximum out-of-pocket (MOOP) limit than is available

168
to plans that adopt a higher, mandatory MOOP limit. The number of MA plans with voluntary
MOOPs has decreased significantly over the past several years which may call into question the
value of allowing cost sharing flexibility and serve to minimize the impact of changes made to
this policy. As a result, CMS intends to reduce or eliminate cost sharing flexibility in other
service categories for voluntary MOOP plans, which would be accomplished over the next few
years to minimize disruption to plans and enrollees.
CMS requests comments about whether current incentives should still be available to voluntary
MOOP plans, and suggestions about other incentives to encourage MAOs to offer plans with a
lower voluntary MOOP for enrollees. For example, flexibilities to highlight voluntary MOOP
plans in marketing materials or a special indicator or priority sorting on Medicare Plan Finder.
These types of marketing-related incentives may encourage plans and brokers to educate
beneficiaries on the MOOP and its value to their overall financial protection should they
experience large medical expenses during a plan year.
Part C Optional Supplemental Benefits
As part of our evaluation whether the bid and benefits are not discriminatory against enrollees
with specific (or high cost) health needs, CMS will continue to review non-employer bid
submissions to verify enrollees electing optional supplemental benefits are receiving reasonable
value. As in CY 2016, CMS considers a plan to be not discriminatory when the total value of all
optional supplemental benefits offered to non-employer plans under each contract meets the
following thresholds: (a) the enrollment-weighted contract-level projected gain/loss margin, as
measured by a percent of premium, is no greater than 15% and (b) the sum of the enrollment-
weighted contract-level projected gain/loss margin and non-benefit expenses, as measured by a
percent of premium, is no greater than 30%.
CMS understands some supplemental benefits are based on a multi-year basis, but the plan bids
submitted each year are evaluated based on that particular plan year.
Plan Benefit Package (PBP) Updates and Guidance
Medical Services Performed in Multiple Health Care Settings
In our continuing effort to avoid duplication of medical services entered in the PBP, CMS is
offering additional guidance on how to place services that can be performed in different health
care settings (e.g., physician office, outpatient hospital, and free standing facility) in the
appropriate service category and correctly complete data entry within the PBP.
The outpatient hospital service category in the PBP has historically included a variety of services
that may have their own dedicated PBP category. By including the same service in multiple
locations throughout the PBP, we are concerned that marketing materials may be confusing and
that CMS cost sharing requirements could be compromised. Based on the out-of-pocket cost
169
(OOPC) model methodology, including services with zero cost sharing for the minimum amount
in a multiple service category will reduce the estimated out-of-pocket costs used by beneficiaries
in comparing plans on Medicare Plan Finder and adversely affect CMS bid review for
meaningful difference and Total Beneficiary Cost (TBC).
Our goal is to ultimately have PBP service categories reflect cost sharing for services provided in
different places of service. For example, Cardiac and Pulmonary Rehabilitation Services can be
administered in a variety of health care settings including outpatient hospitals, free- standing
facilities, or a physician’s office. Instead of having these services appear in multiple PBP service
categories, we expect cost sharing for these services to appear only in PBP Service Category 3
(Cardiac and Pulmonary Rehabilitation Services). The minimum/maximum data fields allow
plans to reflect the varying cost sharing associated with different places of service, when needed.
The note for this service category will describe the cost sharing associated with the various
places of service and must be consistent with the data entry. Cardiac and Pulmonary
Rehabilitation Services in any other section of the PBP will not satisfy CMS requirements and
the organization will be asked to correct its bid submission.
Another area of particular concern is Medicare-covered preventive services. All Medicare-
covered zero dollar cost sharing preventive services must be included in PBP Service Category
14a and must not be included in any other service category (i.e., those benefits that are rated as A
or B by the United States Preventive Services Task Force). For example, we do not expect to see
a zero in the minimum data field in 9a (Outpatient hospital services) with a note that explains the
zero dollar amount is for preventive services. All of the zero dollar Medicare-covered preventive
services are to be placed in 14a only.
For CY 2016, plans were required to reflect cost sharing for the service categories listed in the
table below appropriately within each designated service category:

170
PBP Sec. B Service Category
3 Cardiac and Pulmonary Rehabilitation Services
7a Primary Care Physician Services
7d Physician Specialist Services excluding Psychiatric Services
7f Podiatry Services
9d Outpatient Blood Services
11b Prosthetics/Medical Supplies
12 Dialysis Services
14a Medicare-Covered Zero Cost-Sharing Preventive Services
15 Medicare Part B Rx Drugs and Home Infusion Drugs
In addition to the service categories listed above, plans must enter cost sharing for the service
categories shown in the table below appropriately within each designated service category for
CY 2017. These services should not be referenced in any other service category. We anticipate
these changes will improve transparency and streamline the data entry so the cost sharing
associated with those PBP service categories below reflects the services provided across a
variety of healthcare settings.
PBP Sec. B Service Category
7c Occupational Therapy Services
7g Other Health Care Professional Services
7i Physical therapy and Speech Language Pathology Services
8a Outpatient Diagnostic Procedures and Tests and Lab Services
8b Outpatient Diagnostic and Therapeutic Radiological Services
9a Outpatient Hospital Services
9b Ambulatory Surgical Center Services (ASC)
We continue to evaluate opportunities to streamline data entry and avoid duplication in the PBP
and request comments for improving this process.

171
Medicare-Covered Preventive Services
In previous years, MAOs were able to include non-zero dollar Medicare-covered preventive
services in multiple service categories. CMS is modifying the PBP to rename B14a from
"Medicare-covered Preventive Services" to "Medicare-covered Zero Dollar Preventive Services,"
and will create a new service category where all other Medicare-covered preventive services and
any cost sharing (if applicable) can be identified clearly. This new services category will be
B14e "Other Medicare-Covered Preventive Services," and will replace B14e "Diabetes Self-
Management Training." PBP service category B14e "Other Medicare-Covered Preventive
Services" will include cost sharing fields for the glaucoma screening benefit, diabetes self-
management training, as well as up to five other optional Medicare-covered preventive services
for which a copayment may be required that can be entered by the MAO.
Policy Updates
Tiered Cost Sharing of Medical Benefits
MAOs may choose to tier the cost sharing for contracted providers as an incentive to encourage
enrollees to seek care from providers the plan identifies based on efficiency and quality data. In
addition to other standards for this plan design that are provided in the Medicare Managed Care
Manual, Chapter 4, the tiered cost sharing must be applied so that all plan enrollees are charged
the same cost sharing amount for any specific provider and all providers are available and
accessible to all enrollees in the plan. For CY 2017, MAOs will be submitting tiering requests
through an electronic mailbox. Details regarding the process will be provided in an HPMS
memo in April.
Cost Sharing /Bundling and Facility
CMS is concerned about the transparency of costs sharing for Medicare Advantage beneficiaries.
Beneficiaries should be readily able to understand their cost sharing responsibilities. Specifically,
MA plans should not unbundle Medicare services and establish multiple cost sharing for
services.
For example, we are aware that in some cases an enrollee may receive a service in a facility
setting that includes an additional facility fee that does not apply when the service is furnished in
a physician’s office. While MA plans may have higher copays based on place of service, they
should to the extent possible include the enrollee’s entire cost sharing responsibility in a single
copay. This approach will make it easier for enrollees to understand and anticipate the cost
sharing they will incur prior to receiving services. This is consistent with Medicare Advantage
disclosure requirements at 42 CFR section 422.111(b)(2) which require that MA plans clearly
and accurately disclose benefits and cost sharing. Accordingly, in situations where there is a
difference in cost sharing based on place of service, those fees are to be combined (bundled) into

172
the cost sharing amount for that particular place of service and clearly reflected as a total
copayment in appropriate materials distributed to beneficiaries.
Our goal is not to prevent appropriate cost sharing, but to ensure that cost sharing is transparent
and meets CMS cost sharing standards.

173
Interoperability-MA Plans and Contracted Providers
Background
Interoperability is the ability of systems to exchange and use electronic health information from
other systems without special effort on the part of the user.32 The health care industry is moving
towards interoperability because it promotes more effective exchange of health information,
seamless care transitions, improved care coordination and enrollee health outcomes and enables
providers and communities to deliver smarter, safer and more efficient care.
We believe that commercial payers as well as the Medicaid program have taken steps to promote
interoperability across provider settings, and align with the Office of the National Coordinator
for Health Information Technology (ONCHIT) standards for meaningful use and certified
electronic health records (EHRs). CMS issued a Medicaid final rule on October 16, 2015
requiring eligible professionals to utilize certified technology to promote health information
exchange as part of the Medicare and Medicaid EHR Incentive Program. This is a broader effort,
however, to support delivery system reform and quality initiatives focused on patient outcomes.
In addition, §13112 of the American Recovery and Reinvestment Act of 2009 (ARRA), requires
that our contracts require MAOs to utilize, where available, health information technology
systems and products that meet standards and implementation specifications adopted under §
3004 of the Public Health Services Act, as amended by § 13101 of the ARRA.
In alignment with the referenced legislation and Medicaid, CMS is currently exploring how best
to encourage the adoption of technology that supports interoperability between Medicare
Advantage (MA) plans and their contracted providers, and the need for rulemaking to require
such adoption. CMS seeks comment from the industry regarding their experience with these
activities, including barriers to successful adoption.
Alternative Payment Models (APMs)
Alternative Payment Models (APMs) are provider payment structures that incentivize health care
quality, emphasize value over volume and care coordination activities. To help incentivize the
transformation of our health care delivery system away from rewarding volume over value, the
Administration has set a goal to have 30 percent of Medicare fee-for-service payments made
based on APMs by the end of 2016 and 50 percent by the end of 2018.
In the Contract Year (CY) 2016 Call Letter, CMS indicated that we would reach out to MAOs to
gain a better understanding of their use of provider incentives and value based contracting for
physician services. Subsequently, CMS had conversations with a number of MAOs concerning
32Institute of Electrical and Electronic Engineers-
http://www.ieee.org/200Bindex.html?WT.mc_id=mn_ieee

174
their use of alterative payment models. As a result of the high level of interest in the use of
APMs and the long term HHS payment goals, CMS has added APM questions to the Part C
reporting requirements. Specifically, CMS will ask MAOs to report on the proportion of
payments made to providers based on the HHS developed four categories of value based
payment: fee-for-service with no link to quality; fee-for-service with a link to quality; alternative
payment models built on fee-for-service architecture; and population-based payment.
In order to maintain consistency with HHS goals of increasing the proportion of payment made
based on quality and value, CMS will continue to support MAOs efforts to improve cost
efficiency, reduce costs, and improve health outcomes through the use of APMs. In order to
better support the continued implementation, growth, and sustainability of these models in
Medicare Advantage, CMS is seeking comments from the industry regarding challenges and
concerns associated with the use of APMs in Medicare Advantage.
Connecting Beneficiaries to Care
As a reminder, MA beneficiaries are entitled to an introductory “Welcome to Medicare”
preventive visit within their first twelve months in Medicare. Each year thereafter, MA
beneficiaries are then entitled to an Annual Wellness Visit (AWV). CMS recognizes the
importance of yearly preventive visits to drive quality improvement in the care enrollees receive
and is looking at ways in which MAOs can further engage enrollees and connect them to
preventive and needed care. We welcome stakeholder suggestions and input around existing or
potential approaches.
Counseling and Related Support Services
Recognizing that Alzheimer’s disease and related dementias pose a serious and growing threat to
Medicare beneficiaries and their families, CMS encourages MAOs to offer enrollees who are
diagnosed with Alzheimer’s or other related dementias innovative supplemental benefits that
could enable their enrollees to remain in the community. Such benefits would provide a defined
set of counseling and related supports to the enrollee or to the enrollee together with their
informal (non-paid) caregivers. In designing their supplemental benefits, MAOs can take
advantage of a variety of resources, including those provided by the Alzheimer’s Association,
and learning from models such as the New York University Caregiver Intervention (NYUCI) and
the Department of Veterans’ Affairs Resources for Enhancing Alzheimer’s Caregivers Health
(REACH) program.
Prohibition on Billing Medicare-Medicaid Enrollees for Medicare Cost-Sharing
We remind all Medicare Advantage (MA) plans of their obligation to protect dual eligible
beneficiaries from incurring liability for Medicare cost-sharing. In July 2015, CMS released a
study finding that confusion and inappropriate balance billing persist notwithstanding laws
prohibiting Medicare cost-sharing charges for QMB beneficiaries, Access to Care Issues Among
175
Qualified Medicare Beneficiaries (QMB) (“Access to Care”) https://www.cms.gov/Medicare-
Medicaid-Coordination/Medicare-and-Medicaid-Coordination/Medicare-Medicaid-
Coordination-Office/Downloads/
Access_to_Care_Issues_Among_Qualified_Medicare_Beneficiaries.pdf. These findings
underscore the need to re-educate providers, plans, and beneficiaries about proper billing
practices for dual eligible enrollees.
Under 42 CFR §422.504(g)(1)(iii), all MAOs --without exception-- must educate providers about
balance billing protections applicable to dual eligible enrollees. Federal law bars Medicare
providers from collecting Medicare Part A and Medicare Part B deductibles, coinsurance, or
copayments from those enrolled in the Qualified Medicare Beneficiaries (QMB) program, a dual
eligible program which exempts individuals from Medicare cost-sharing liability. (See Section
1902(n)(3)(B) of the Social Security Act, as modified by 4714 of the Balanced Budget Act of
1997). Balance billing prohibitions may likewise apply to other dual eligible beneficiaries in MA
plans if the State Medicaid Program holds these individuals harmless for Part A and Part B cost
sharing. See 42 CFR §422.504(g)(1)(iii). For more information about dual eligible categories
and benefits, please visit: https://www.cms.gov/Outreach-and-Education/Medicare-Learning-
Network-MLN/MLNProducts/downloads/
medicare_beneficiaries_dual_eligibles_at_a_glance.pdf.
In contracts with providers, MAOs must specify these balance billing prohibitions and instruct
providers to either accept the MA payment as payment in full or bill the State for applicable
Medicare cost-sharing for enrollees that are eligible for both Medicare and Medicaid. MA plans
can find information about an enrollee’s dual eligible status in the Monthly Membership Detail
Data File. (See Appendix F.12, # 85 Dual Status Code in the Plan Communications User Guide
Appendices at https://www.cms.gov/Research-Statistics-Data-and-Systems/CMS-Information-
Technology/mapdhelpdesk/Plan_Communications_User_Guide.html).
In addition, CMS encourages MAOs to take affirmative steps to address common points of
confusion among providers regarding balance billing. For example, we urge MAOs to explain
that all MA providers-- not only those that accept Medicaid-- must abide by the balance billing
prohibitions. Further, CMS suggests that plans clarify that balance billing restrictions apply
regardless of whether the State Medicaid Agency is liable to pay the full Medicare cost sharing
amounts. (Federal law allows State Medicaid Programs to reduce or negate Medicare cost-
sharing reimbursements for QMBs in certain circumstances. See Section 1902(n)(3)(B) of the
Social Security Act, as modified by 4714 of the Balanced Budget Act of 1997)).
Finally, to monitor provider compliance with balance billing rules and target provider outreach,
CMS encourages MAOs to identify problem areas from plan grievance and CMS Complaint
Tracking Module data. These steps will complement continued MAO efforts to remediate
individual violations and clarify appropriate billing procedures.

176
Medicare Advantage Organization Responsibilities for Clinical Trials
We want to remind MAOs of their responsibilities regarding clinical trials. These
responsibilities are also specified in Chapter 4 of the Medicare Managed Care Manual. While
Original Medicare is generally responsible for payment of costs for most clinical trials, under
NCD 310.1, MAOs are responsible for payment in the following instances:
Category A and B investigational device exemption trials
MAOs are responsible for payment of claims related to enrollees’ participation in both
Category A and B investigational device exemption (IDE) studies that are covered by the
Medicare Administrative Contractor (MAC) with jurisdiction over the MA plan’s service
area. The MAO is responsible for payment of routine care items and services in CMS-
approved Category A IDE studies and for routine care items and services, as well as the
Category B device under study in Category B IDE studies.
The local MAC(s) with jurisdiction over the Medicare Advantage plan’s service area
determines coverage of IDE studies.
NCDs for clinical trials with coverage with evidence development
In separate National Coverage Determinations (NCDs) requiring coverage with evidence
development (CED), original Medicare covers items and services in CMS-approved CED
studies. MAOs are responsible for payment of items and services in CMS-approved CED
studies unless CMS determines, for each NCD, that the significant cost threshold is
exceeded for that item or service (see 42 CFR §422.109). Approved CED studies are
posted on the CMS Coverage with Evidence Development webpage (see
http://www.cms.gov/Medicare/Coverage/Coverage-with-Evidence-
Development/index.html). Billing instructions are issued for each NCD.
In the case of IDE trials and clinical trials with CED, plans may cover these benefits as they do
any other, that is, they may require pre-authorization and that enrollees follow all other plan
rules.
In the case of clinical trials that are paid for by Original Medicare under NCD 310.1, we require
MAOs, to provide coverage for: (1) services to diagnose conditions covered by clinical trial
services, (2) most services furnished as follow-up care to clinical trial services and (3) services
already covered by the MA organization. Should an MA plan beneficiary choose to participate
in a clinical trial, he or she may remain in his or her MA plan while paying Original Medicare
costs for a qualifying clinical trial.33
33 Clinical trials are covered under the Clinical Trials National Coverage Determination (NCD)
(NCD manual, Pub. 100-3, Part 4, Section 310)

177
Please see section 10.7 of Chapter 4 of the Medicare Managed Care Manual for further
information on MAO responsibilities for clinical trials.
Dual-Eligible Special Needs Plans
For CY 2017, we intend to continue our efforts to use administrative flexibilities to facilitate the
integration of Medicare and Medicaid benefits by Dual-Eligible Special Needs Plans (D-SNPs)
and improve the experience of care for dually-eligible Medicare-Medicaid enrollees in those
plans. We will continue our work to improve marketing materials and model notices to better
explain both the Medicare and Medicaid benefits provided by integrated D-SNPs. In addition, we
propose the following policy clarifications that we believe will help D-SNPs deliver an array of
benefits and services that meet the needs of Medicare-Medicaid enrollees and improve Medicare-
Medicare enrollees’ understanding of the coverage they receive.
D-SNP Non-Renewals
States that contract with D-SNPs to provide Medicaid benefits have an interest in providing D-
SNP members in their states with accurate information regarding any changes to the delivery of
their Medicaid benefits and facilitating the transition to new coverage that can accompany the
nonrenewal or year-end termination of a D-SNP. A number of states therefore include in their
MIPPA contracts with D-SNPs requirements that the plan inform the state about pending
nonrenewals, service area reductions, or terminations so that the state can plan ahead for any
outreach efforts to impacted D-SNP members in the state. While the MIPAA contract
requirements are helpful for state planning purposes, we believe CMS can further assist states by
providing notice to states in advance of any public announcement regarding nonrenewing or
terminating D-SNPs that contract to provide Medicaid benefits to Medicare-Medicaid enrollees
in these states. This would facilitate a more robust role for states in informing Medicare-
Medicaid enrollees about how changes to their D-SNP coverage will impact delivery of their
Medicaid benefits. This would build on our efforts in CY 2015 to include information on
changes to Medicaid coverage in the integrated D-SNP nonrenewal notice. We seek comment
from D-SNP sponsors and states on how best to implement this exchange of information with
states on pending nonrenewals, service area reductions and terminations.
D-SNP Model of Care
An integrated D-SNP that provides Medicaid long-term services and supports must have a model
of care (MOC) that incorporates provision of those services and their integration with the
medical and prescription drug benefits the D-SNP provides under its Medicare contract (see
§422.101(f)). States have the ability, through their contracting with D-SNP sponsors, to require
that the D-SNP MOC fully integrates long-term services and supports and coordinates the
provision of all Medicare and Medicaid services. We are interested in exploring ways for
interested states to add specificity to existing elements that describe state requirements related to
the management of long term services and supports to the CMS review criteria for D-SNP

178
MOCs. In addition, rather than having two separate and parallel processes for review of D-SNP
MOCs—one by the state under the state contract and one by NCQA for Medicare approval— we
would like to explore allowing states to review MOCs against their requirements concurrent with
NCQA’s review of MOCs in HPMS. This would leverage the current MOC review process and
encompass delivery of both Medicare and Medicaid benefits. We note that the joint review
process would not in any way change the current CMS requirements for review and approval of
D-SNP MOCs by NCQA. This effort would build on a process successfully implemented in
Minnesota under our Partnership to Align Administrative Functions for Improvements in
Medicare-Medicaid Beneficiary Experience, as well as under the Financial Alignment Initiative
for Medicare-Medicaid Plans. We seek comment on the potential benefits and operational
challenges of a concurrent CMS-state MOC review, in particular from states that are potentially
interested in participating in such a review process.
Section III – Part D
Formulary Submissions
CY 2017 Formulary Submission Window
The CY 2017 HPMS formulary submission window will open this year on May 16, 2016 and
close at 11:59 pm PDT on June 6, 2016. CMS must be in receipt of a successfully submitted and
validated formulary submission by the deadline of June 6, 2016 in order for the formulary to be
considered for review. The formulary used in a Part D plan is part of the plan’s complete bid and
therefore a failure to submit and link a formulary to each plan that uses a formulary by the June
6th deadline will result in denial of that bid submission.
CY 2017 Formulary Reference File
CMS will release the first CY 2017 Formulary Reference File (FRF) in March 2016. The March
FRF release will be used in the production of the Out-of-Pocket Cost (OOPC) model tool,
scheduled to be released in April 2016, in order to assist plan sponsors in satisfying meaningful
difference and MA TBC requirements prior to bid submission. Sponsors should note that the
OOPC model released in April will not be modified to incorporate any subsequent FRF updates,
as described below.
In May 2016, CMS is planning to provide a release of the 2017 FRF just prior to the June 6th
formulary submission deadline. Given the limited timeframe between the May release of the
2017 FRF and the June 6th deadline, CMS is unable to accommodate an updated version of the
2017 OOPC model to incorporate the May FRF changes. Therefore, CMS cautions plan sponsors
that any newly added drugs on the May release of the 2017 FRF will not be included in the 2017
OOPC model.

179
CMS will continue to offer a summer formulary update; however, formulary changes during this
particular update submission will be limited to: 1) the addition of drugs that are new to the
summer release of the FRF (historically posted in July); and 2) the submission of negative
changes on brand drugs, only if the equivalent generic is added to the summer FRF and
corresponding formulary file. Thus, plan sponsors need to carefully consider any newly added
drugs on the May release of the 2017 FRF, since additional limitations will be imposed on the
summer formulary update window.
Part D sponsors are reminded that they may enhance their formularies (i.e., add Part D drugs,
reduce beneficiary cost-sharing, or remove utilization management edits) between the summer
update window and the first HPMS submission of the upcoming plan year. Consistent with
section 60.5 of the Medicare Marketing Guidelines, these enhancements must be included in the
Part D sponsor’s marketing materials and must be submitted during the next HPMS formulary
submission window. Sponsors are encouraged to directly notify beneficiaries of formulary
additions in a timely manner since in some cases, such as new generics, an earlier conversion
could lead to better value for the beneficiary and potentially reduce program costs.
In an effort to better align plan sponsors’ submission of quantity limits (QLs) with CMS’ review,
a new column will be added to the HPMS-posted FRF that indicates the unit for which sponsors
must submit their QLs. While the vast majority of submitted QLs, such as those for solid oral
dosage forms are straightforward, this additional information will be useful for products such as
kits that contain prefilled syringes. The HPMS formulary submission will not be validated
against this field. Rather, it will serve as a point of reference for CMS and Part D sponsors
during the review of submitted QLs. Finally, we are evaluating the feasibility of including an
informational column on the FRF that would periodically track price changes for FRF drugs.
Appropriate Utilization of Prior Authorization Requirements to Determine Part D
Drug Status
Consistent with 42 CFR §423.153(b), CMS reminded sponsors in the 2015 Call Letter that they
must establish utilization management controls, such as prior authorization (PA), in order to
reduce costs and to prevent inappropriate utilization of prescribed medications under Part D.
Currently, we permit Part D sponsors to implement point of sale (POS) PA edits to determine
whether a drug is: 1) covered under Medicare Parts A or B; 2) being used for a Part D medically-
accepted indication (MAI) (as defined in section 1860D-2(e)(4) of the Social Security Act); or
3) a drug, drug class, or has a medical use that is excluded from coverage or otherwise restricted
under Part D as defined in section 1860D-2(e)(2) of the Act (e.g., when used for cosmetic
purposes or hair growth). While CMS allows sponsors to implement these PAs during transition
(either for new enrollees into a plan or for current enrollees affected by formulary changes) to
prevent Part D coverage for excluded drugs or for non-medically-accepted indications of Part D
drugs, sponsors continue to be confused about which POS PA edits are permitted during
transition. Section 30.4.8 of Chapter 6 of the Prescription Drug Benefit Manual (available at

180
https://www.cms.gov/Medicare/Prescription-Drug-Coverage/PrescriptionDrugCovContra/
Downloads/Part-D-Benefits-Manual-Chapter-6.pdf) discusses edits for transition fills. The
requirements for Part D sponsors to limit coverage to Part D drugs and Part D medically-
accepted indications, assist in preventing over-utilization and under-utilization of prescribed
medications, and utilize quality assurance measures and systems to reduce medication errors and
adverse drug interactions and improve medication use apply regardless of the transitional status
of an enrollee’s medication(s). In other words, POS PA edits for such purposes are appropriate
even during transition.
The 2015 Call Letter encouraged sponsors to utilize PA for drugs that have a high likelihood of
use for a non-medically-accepted indication. Section 10.6 of Chapter 6 of the Prescription Drug
Benefit Manual discusses medically-accepted indication (available at:
https://www.cms.gov/Medicare/Prescription-Drug-Coverage/PrescriptionDrugCovContra/
Downloads/Part-D-Benefits-Manual-Chapter-6.pdf)
The 2015 Call Letter specified Transmucosal Immediate Release Fentanyl (TIRF) products and
Cialis as examples of drugs that have a high likelihood of use for non-medically-accepted
indications. Our guidance is focused on those drugs that pose the greatest risk for non-medically
accepted indications, and, therefore, CMS does not expect to see POS PA edits during transition
to determine the indication on most Part D drugs.
Coverage duration is a required component of criteria that are submitted to CMS as part of the
formulary review process for PA approval. Sponsors often approve criteria for the duration of
the plan year or for one calendar year from the initial approval date. Once a PA is approved,
sponsors are not prohibited from utilizing “grandfathering” policies that allow beneficiaries to
receive a drug from year to year without a requirement to satisfy the PA criteria in the future. In
general, policies that facilitate appropriate access to medications for beneficiaries with chronic
conditions are looked upon favorably by CMS. However, if such policies are implemented for
products that have significant safety concerns and the high potential for non-MAI use (e.g., TIRF
drugs), we expect sponsors to periodically confirm that beneficiaries continue to use these drugs
for medically-accepted indications. This confirmation can be accomplished by establishing
limits to the “grandfathering” processes for these drugs or through robust retrospective drug
utilization review processes. This expectation would also apply to cases where members are
moving across plans or when a new PBM is being utilized, for example.
Medication Therapy Management (MTM)
Annual MTM Eligibility Cost Threshold
Targeted beneficiaries for a Part D plan’s MTM program, in general, are enrollees who meet all
of the following criteria: have multiple chronic diseases, are taking multiple Part D drugs, and
are likely to incur annual Part D drug costs that meet or exceed a certain threshold. Per
§423.153(d), for 2012 and subsequent years, the annual cost threshold for targeting beneficiaries

181
is specified as costs for covered Part D drugs in an amount greater than or equal to $3,000
increased by the annual percentage specified in §423.104(d)(5)(iv). The 2016 MTM program
annual cost threshold is $3,507. The 2017 MTM program annual cost threshold will be adjusted
based on the annual percentage and finalized in the 2017 Call Letter.
Annual MTM Submission and Approval Process
A memo containing MTM program guidance and submission instructions is released each year
by CMS and is available on the CMS.gov MTM page at: https://www.cms.gov/Medicare/
Prescription-Drug-Coverage/PrescriptionDrugCovContra/MTM.html. The guidance memo for
CY 2017 will be released approximately one month before the 2017 MTM program submission
deadline. Questions regarding the MTM submission process or policy may be sent via email to
Annually, Part D plan sponsors must submit an MTM program description to CMS through the
Health Plan Management System (HPMS) for review and approval. CMS evaluates each
program description to verify that it meets the current minimum requirements for the program
year.
Due to enhancements to the HPMS MTM submission module and expanded guidance and
submission instructions over the years, MTM program submissions have increasingly high rates
of initial approval. Beginning with the CY 2017 submissions, we propose to implement a
modified annual MTM program review process and add attestations to the HPMS submission
module as described below.
All Part D sponsors will continue to submit an MTM program description through
HPMS each year. Sponsors will continue to submit change requests throughout
the year.
Attestations of the Part D sponsor’s compliance with Part D MTM program
requirements will be added to the MTM submission module in HPMS.
Sponsors must attest to meeting the MTM program requirements during the
annual submission. Sponsors must re-attest when they submit change requests.
The user completing the MTM submission and attestations in HPMS must have
the authority to attest on behalf of the organization.
A subset of MTM program submissions will be comprehensively reviewed:
o Any new contracts;
o Any contracts whose MTM submission failed initial review the prior year;
o Any contracts that failed reporting requirements data validation or audit for
MTM (when implemented);

182
o Any contracts that scored less than 3 stars on the MTM comprehensive
medication review completion rate measure;
o A random sample of other program submissions.
We will continue to monitor beneficiary complaints, validation results of plan-reported MTM
data, and CMS program audits of MTM programs.
Submission Requirements for Enhanced MTM Model Participants
The CMS Center for Medicare and Medicaid Innovation announced the Part D Enhanced MTM
Model, an opportunity for stand-alone basic Prescription Drug Plans (PDPs) in selected regions
to offer innovative MTM programs, aimed at improving the quality of care while also reducing
costs. More information about the model test is available at https://innovation.cms.gov/
initiatives/enhancedmtm/.
The Enhanced MTM Model test will begin January 1, 2017 with a five-year performance
period. CMS will test the model in 5 Part D regions: Region 7 (Virginia), Region 11 (Florida),
Region 21 (Louisiana), Region 25 (Iowa, Minnesota, Montana, Nebraska, North Dakota, South
Dakota, Wyoming), and Region 28 (Arizona). Eligible defined standard, actuarially equivalent,
or basic alternative stand-alone PDPs in these regions, upon approval from CMS, can vary the
intensity and types of MTM items and services based on beneficiary risk level and seek out a
range of strategies to individualize beneficiary and prescriber outreach and engagement.
The current MTM requirements are waived for the PBPs approved to participate in the Enhanced
MTM Model and data on participating PBPs must not be reported per the Part D Reporting
Requirements under the current MTM program. This MTM data will instead be reported in
accordance with model terms and conditions. CMS will notify the subset of plans that are NOT
subject to current MTM requirements.
Plan sponsors with contracts that include PBPs that are not eligible to participate in the model
must ensure that those non-participating plans comply with all standard MTM program
requirements, including the submission of MTM program details in HPMS. More information
will be provided in the annual MTM program guidance and submission instruction memo for CY
2017.
Part D Reporting Requirements for MTM
For monitoring purposes, Part D sponsors are responsible for reporting several data elements to
CMS related to their MTM program per the Part D Reporting Requirements. Element X,
“Topics discussed with the beneficiary during the comprehensive medication review (CMR),
including the medication or care issue to be resolved or behavior to be encouraged”, is suspended
for the 2016 Part D Reporting Requirements until a more standardized set of data can be
collected.

183
The industry, including the Pharmacy Quality Alliance (PQA) and the Academy of Managed
Care Pharmacy (AMCP), is working on a framework to define drug therapy problems (DTPs).
Sponsors should begin to develop the capacity to collect and report drug therapy problems using
a standard framework and common terminology. We plan to propose new data elements for the
Part D Reporting Requirements through the Paperwork Reduction Act (PRA) process as early as
2017 to capture drug therapy problems at the beneficiary-level using standard categories and
definitions.
Improving Clinical Decision-Making for Certain Part D Coverage Determinations
The regulations for Part D coverage determinations prescribe that a plan sponsor must notify the
enrollee of its decision no more than 72 hours from receipt of the request for standard requests
for benefits, and no more than 24 hours from receipt of the request for expedited requests for
benefits. For exception requests, the adjudication timeframe does not begin until the plan
receives the prescriber’s supporting statement. CMS established significantly shorter
adjudication timeframes for Part D than for Medicare Advantage because the majority of Part D
coverage requests involve prescription drugs an enrollee has not yet received, which increases
the risk of adverse clinical outcomes if access to the drug is delayed. Enrollee access to drugs
that require prior authorization (PA) or step therapy (ST) generally requires review by the plan
sponsor to determine if the PA or step requirements have been satisfied (or if an exception
request should be approved). The required adjudication timeframes for Part D coverage
determinations are set forth at 42 CFR Part 423, Subpart M and in Chapter 18 of the Medicare
Prescription Drug Benefit Manual.
If a Part D plan is not able to obtain the information needed to approve coverage before the
adjudication timeframe expires despite its outreach efforts, it must issue a denial notice and
process new information received subsequent to the denial as a redetermination. Based on ten
years of program experience, including plan audits, CMS has observed that when the 24 or
72 hour adjudication timeframe is impacted by a weekend or holiday (or both), the plan may be
less likely to reach the prescriber to obtain necessary information before the adjudication
timeframe expires. In these situations, CMS is concerned that expediency may occur at the
expense of sound clinical decision-making, resulting in access delays for affected enrollees due
to the need to go through the redetermination process which has longer maximum adjudication
timeframes (72 hours from receipt of the request for expedited requests, and 7 days from receipt
of the request for standard requests). A decision to deny the coverage request based solely on the
lack of clinical information places the burden on the enrollee to request an appeal in order to
have the request reviewed on its merits based on appropriate clinical documentation. We have
additional concerns that not permitting Part D plans to extend the coverage determination
timeframe in certain limited situations may result in increased program costs due to the fact that
all redeterminations related to medical necessity must be made by a physician.

184
To address these concerns, CMS is contemplating rulemaking that would allow extensions to
Part D adjudication timeframes in certain limited circumstances such as:
The coverage determination level;
Situations where the timeframe is impacted by a weekend or holiday;
Requests for drugs that require PA or ST pursuant to the plan’s CMS-approved
formulary; and
Cases where the plan does not have all necessary information from the prescriber
required to make a clinically appropriate decision based on approved criteria.
Extensions would not be permitted for exception requests (including exceptions to PA or ST
criteria), because our rules already provide for tolling the adjudication timeframe on the front-
end until the plan receives the prescriber’s supporting statement.
Any regulatory proposal would bear the following principles in mind:
Because of the importance of timely processing of coverage requests, as described
above, extensions in Part D should have a shorter maximum timeframe than MA
extensions, which is up to 14 days.
Extensions would be regulated in a manner similar to existing requirements for
MA extensions in that they would be permitted only when justified in limited,
non-routine circumstances as described above, and only when in the best interest
of the enrollee.
Written notification requirements to the enrollee would be established whenever
an extension is taken.
It would not be appropriate for a Part D plan to invoke an extension due to the
plan’s failure to conduct timely outreach as described in Chapter 18.
We are soliciting comments from stakeholders on the value of proposing regulatory changes that
would permit Part D plans to extend the adjudication timeframe for certain coverage
determination requests for drugs subject to PA or ST where: (1) the plan has been unable to
obtain needed clinical information from the prescriber despite reasonable efforts to do so, and (2)
the adjudication timeframe has been impacted by a weekend or holiday. We are particularly
interested in hearing from physicians and other prescribers on potential benefits and drawbacks
of such a change and any potential unintended consequences. We welcome additional
suggestions from stakeholders on other potential changes related to this issue.
We note that any change to the Part D adjudication timeframes, including permitting the limited
use of extensions, will require changes to the regulations in Subpart M as well as to the guidance
in Chapter 18 of the Medicare Prescription Drug Benefit Manual. We will consider all

185
comments received as we determine appropriate next steps, including considering the feasibility
of conducting a pilot to test potential changes that could improve the accuracy of clinical
decision-making at the initial coverage decision, avoid potential delays in access to needed
prescription drugs, and reduce costs associated with the Subpart M appeals process.
Access to Preferred Cost-Sharing Pharmacies
In the CY 2016 Call Letter, CMS announced several steps we would take to address low access
to preferred cost sharing pharmacies (PCSPs). First, we announced that we would post
information about 2016 PCSP access levels on the CMS website. Second, we announced that we
would require plans who were outliers with respect to access to PCSPs to disclose that their
plan’s PCSP network offered lower access than other plans. Outliers were set at the bottom 10th
percentile compared to all Part D plans in a given geographic type, using 2014 data. CMS
required marketing materials to include specific disclaimer language for plans offering access
within 2 miles of less than 40% of beneficiaries’ residences in urban areas, within 5 miles of less
than 87% of beneficiaries’ residences in suburban areas, and within 15 miles of less than 70% of
beneficiaries’ residences in rural areas. Finally, we announced that we would work with plans
that were extreme outliers to address concerns about beneficiary access and marketing
representations relating to preferred cost sharing. We worked with several such plans to either
improve access or develop targeted marketing strategies to ensure that beneficiaries selecting
these plans were aware of their status as extreme outliers.
CMS is pleased to note that plans increased PCSP access dramatically for 2016. As shown in the
table below, the bottom 10th percentile of plans in 2016 offer access within two miles to 71% of
urban beneficiaries, compared to 40% in 2014.
Table 40. PCSP Access Rates for the Bottom 10th Percentile of Plans, 2014 through 2016
2014 2015 2016 Convenient Access Standard
for All Retail Pharmacies
Urban Access Rate 40% 62% 71% 90%
Suburban Access Rate 87% 92% 95% 90%
Rural Access Rate 77% 77% 82% 70%
Because we believe the current policy is increasing access to PCSPs, we do not plan to make
significant changes for 2017. Specifically, we will not change the outlier thresholds for 2017 to
reflect the higher access levels achieved for 2016.
Therefore, CMS will continue its PCSP policy as announced in the 2016 Call Letter and
implemented for the 2016 plan year. Plans that provide PCSP pharmacy access within 2 miles of
less than 40% of beneficiaries’ residences in urban areas, within 5 miles of less than 87% of
beneficiaries’ residences in suburban areas, and within 15 miles of less than 70% of
beneficiaries’ residences in rural areas will be identified as outliers in 2017. Outlier plans will be
186
required to disclose in marketing materials, including websites, that their plans’ PCSP networks
offer lower access. Contract Year 2016 disclaimer language was announced in the June 24, 2015
HPMS memo “Marketing Disclaimer Language for Plans with Limited Access to Preferred Cost
Sharing Pharmacies,” and in the final “Medicare Marketing Guidelines” released on July 2,
2015. CMS continues to expect that plans will analyze their own 2016 and 2017 networks to
determine whether they are below outlier thresholds. CMS will analyze preferred cost sharing
pharmacy access on a quarterly basis and will remind plans of their outlier status periodically.
CMS will also continue to work with extreme outliers to address concerns about beneficiary
access and marketing representations related to preferred cost sharing. CMS will notify these
plans in or around April 2016 that we plan to address 2017 PCSP access issues with them during
bid negotiations. In 2016, most plans identified as extreme outliers opted to improve access
rather than develop marketing plans to better inform beneficiaries of low PCSP access. We
anticipate plans will take similar steps during 2017 negotiations.
Finally, although CMS will not post access information on the Medicare Plan Finder, we will
continue to publish information about PCSP access levels annually on the CMS website at:
https://www.cms.gov/Medicare/Prescription-Drug-Coverage/PrescriptionDrugCovContra/
index.html.
Sponsors that fail to include required marketing disclosure language and/or do not meet the terms
of bid negotiation agreements will be subject to compliance and/or enforcement actions.
Part D Benefit Parameters for Non-Defined Standard Plans
Each year, in order to implement certain regulations, we set forth certain benefit parameters,
which are based on updated data analysis, and therefore, are subject to change from year to year.
Specifically, pursuant to § 423.272(b)(3)(i), CMS will only approve a bid submitted by a Part D
sponsor if its plan benefit package (other than defined standard) or plan cost structure is
substantially different from those of other plan offerings by the sponsor in the service area with
respect to key characteristics such as premiums, cost sharing, formulary structure, or benefits
offered; and, pursuant to 42 CFR §423.104(d)(2)(iii), tiered cost sharing for non-defined standard
benefit designs may not exceed levels annually determined by CMS to be discriminatory. The
benefit parameters for CY 2017 are set forth in Table 9 below. Adjustments to the Minimum
Meaningful Difference and specialty tier thresholds are described below. The other cost sharing
thresholds are established consistent with previous years methodology based on the 95th
percentile of the CY 2016 Bid Data. For CY 2017, we will be maintaining the copayment cost
sharing thresholds without the inflation adjustment.
Tier Labeling and Composition
We again remind sponsors that we expect Drug Tier Labels to be representative of the drugs that
make up that tier. However, we have received a number of plan sponsors’ comments via the
2016 Call Letter and in response to the Request for Comments on Non-Defined Standard Plan
Tier Models for CY 2017, solicited through a HPMS memo in June 2015, recommending that

187
CMS provide a non-preferred drug tier option that will allow for a drug mix regardless of
generic/brand status. Based on the comments received and as part of our continued efforts to
provide tier label options that provide flexibility and transparency in benefit design, CMS
included additional tier models for CY 2017 with a non-preferred drug tier option. The details of
CY 2017 tier model options are included in the CY 2017 Plan Benefit Package Software and
Formulary Submission PRA information collection request, now pending approval at the Office
of Management and Budget, Office of Information and Regulatory Affairs. This information
collection request is available on the CMS website at: https://www.cms.gov/Regulations-and-
Guidance/Legislation/PaperworkReductionActof1995/PRA-Listing-Items/CMS-R-262.html?
DLPage=4&DLEntries=10&DLSort=1&DLSortDir=descending.
With the addition of a non-preferred drug tier, sponsors will have the option of selecting a non-
preferred drug tier or non-preferred brand tier but not both. If sponsors continue to use a non-
preferred brand tier, CMS will evaluate the brand/generic composition of that tier as part of the
bid review process. Non-preferred brand tier outliers will be communicated for any plans that do
not have a majority of brand drug products in that tier.
Table 41. 2015 Prescription Drug Event Data
2015 PDE Data Average of % Beneficiary Cost Share
Generic Drugs Brand Drugs All Drugs
Non-Preferred Brand Total 32.56% 20.77% 22.81%
Plan w/ Copay 35.75% 19.90% 22.48%
Plan w/ Coinsurance 26.02% 22.72% 23.54%
CMS review of preliminary 2015 prescription drug event data (PDE) (Table 41.) showed that
beneficiaries pay a lower cost share for generics in plans that have a coinsurance cost sharing
structure (26.02%) for their non-preferred brand tier than in plans that use a copay cost-sharing
structure (35.75%). Overall, on average for drugs on the non-preferred brand tier, there was no
substantial difference in beneficiary cost sharing between plans that use a copay cost sharing
structure and those that use coinsurance. However, based on industry comments received, it is
our expectation that the new non-preferred drug tier likely will contain a greater proportion of
generic drug products than the current non-preferred brand tier composition. While we
appreciate that generic drug price increases are changing the paradigm, we also acknowledge that
sponsors may include lower cost generics on the non-preferred drug tier in an effort to balance

188
the brand/generic drug composition of the tier and maintain actuarial equivalence. As cost trends
in the Part D program are increasingly driven by high cost drugs it is important that we consider
policy impacts on beneficiaries with lower overall drug costs. Although sponsors using a non-
preferred drug tier have the option of choosing either copay or coinsurance cost sharing with the
same thresholds as the non-preferred brand tier, CMS encourages Part D sponsors to consider
using a coinsurance for the non-preferred drug tier instead of a copay. While there are
advantages and disadvantages of copay/co-insurance cost-sharing structures, a coinsurance
(versus copay) structure will provide a more equivalent benefit to those beneficiaries who use
less expensive generic medications that are placed on a non-preferred drug tier. For example, if
the non-preferred drug tier has a $100 copay, beneficiaries could be responsible for the full price
of less expensive generic products that are placed on that tier. During the first year of
implementation and until further notice, CMS will conduct an outlier test for those Part D
sponsors who choose a copay for the non-preferred drug tier, to determine if beneficiaries will
receive a benefit for the majority of drugs on this tier at the proposed copay. Moving forward,
we will continue to evaluate the type and level of cost sharing that is most appropriate for this
tier and that balances the Part D sponsor’s ability to mix brand and generic drugs within a tier
while maintaining transparency and a meaningful benefit offering for the beneficiaries who
enroll in plans with non-preferred drug tiers.
For purposes of determining whether coverage gap cost-sharing thresholds specified in Table 43
have been met, we will continue to rely on the FDA marketing status to identify formulary drugs
as applicable or non-applicable. The maximum coinsurance of 60% applies to tiers that contain
only applicable drugs. If non-applicable (i.e., generic) drugs or a combination of both generic and
applicable drugs are on a tier, then the maximum coinsurance of 31% applies. We remind
sponsors that when cost-sharing reductions beyond the standard benefit are offered through a
supplemental Part D benefit, the plan liability is applied to applicable drugs for applicable
beneficiaries before the manufacturer discount.
Benefit Review
We will continue to scrutinize the expected cost-sharing amounts incurred by beneficiaries
under coinsurance tiers in order to more consistently compare copay and coinsurance cost
sharing impacts. If a sponsor submits coinsurance values (instead of copayment values) for its
non-specialty tiers that are greater than the standard benefit of 25%, we will compare the
average expected cost-sharing amounts submitted by sponsors in the PBP to the established
copay thresholds to determine whether the coinsurance values are discriminatory. (Please note
that we will conduct the same cost-sharing analysis for the Select Care/Diabetic Drug Tiers,
even though the maximum allowable coinsurance value is less than 25%. We will also continue
to disallow incentives such as $0 or very low cost-sharing for 30 day supplies at mail service,
unless offering the same cost sharing at the retail network.

189
Despite ACIP recommendations and Healthy People 2020 targets, adult immunization rates still
remain low. We encourage Part D sponsors to consider offering $0 or low cost sharing for
vaccines to promote this important benefit. While the inclusion of a dedicated vaccine tier or a
Select Care/Select Diabetes tier that contains vaccine products as part of a 5 or 6 tier formulary
structure is not a requirement, sponsors who choose to offer one of these formulary tiers must
set the cost sharing at $0 for that tier. This policy is unchanged from CY 2016.
Over the last three years, we have seen a continuing decrease in the 95th percentile meaningful
difference between basic and enhanced alternative (EA) plans which indicates there is a
decreasing differential between basic and EA plan drug benefits. In order to continue to drive
the participation of plans that provide distinct product offerings, CMS will use a meaningful
difference threshold based on the 50th percentile for CY 2017 instead of the 95th percentile. As a
result of the closing of the coverage gap, the change for CY 2017 to the 50th percentile is
necessary to maintain an OOPC differential within the range of the original meaningful
difference threshold. Specifically, the meaningful difference threshold will be based on the 50th
percentile of the October CY 2016 Bid Data run through the CY 2016 OOPC MPF model which
incorporates CY 2016 Formulary Data, 2010/11 MCBS Data, and FDA data for brand/generic
determinations related to coverage gap cost-sharing estimates. In contrast to the continuing
decrease in the 95th percentile meaningful difference between basic and EA plans, we have seen
a continuing increase in year over year meaningful difference between EA to EA plans. The
increase in meaningful difference between EA to EA plans makes it more challenging for plan
sponsors to offer second EA plans. For CY 2017, we will also use the 50th percentile, instead of
the 95th percentile, to establish the meaningful difference threshold between EA to EA plans to
lessen the impact of EA to EA differences year over year and help maintain stability in the
program.
Therefore, in 2017 the minimum monthly cost-sharing OOPC difference between basic and
enhanced PDP offerings will be $23 and the minimum monthly cost-sharing OOPC difference
between enhanced PDP offerings will be $34. As in the past, these meaningful difference
requirements apply to all stand-alone PDPs, including those belonging to sponsors under a
consolidation plan. We also continue to expect that the additional EA PDPs within a service
area will have a higher value than the first EA plan and will include additional gap cost-sharing
reductions for at least 10 percent of their formulary brand drugs.
In the CY 2012 Call Letter CMS explained that it does not believe that sponsors can demonstrate
meaningful differences based on expected OOPCs between two stand-alone basic Part D benefit
designs while maintaining both the statutory actuarial equivalence requirements and fulfilling the
requirement to maintain cost effective drug utilization review programs. As we approach CY
2020 and the coverage gap closes, CMS does not believe that Part D sponsors can continue to
maintain three plans (a basic and at most two EA plans) that will meet the meaningful difference
test between all plans when the coverage gap is closed. Therefore, CMS encourages plan
sponsors to consider the impact of the coverage gap closing on their current and future plan
offerings to minimize future beneficiary disruption.

190
The methodology for developing the CY 2017 out-of-pocket costs (OOPC) model is consistent
with last year’s methodology. For more information, please reference the HPMS memorandum
dated December 18, 2015 titled “Medicare Plan Finder (MPF) Plan Version (V1) of Out-of-
Pocket Cost (OOPC) Model for CY 2016 and Updated Total Beneficiary Costs (TBC) Data
Released on HPMS.” Customary updates for utilization data, as well as PBP and formulary data
used for CY 2017 bid submissions, are also included in the 2017 model.
In the 2016 Call Letter, we proposed instituting a Total Beneficiary Cost (TBC) measure for
PDPs, similar to what has been in place for MAOs. The proposed change was intended to meet
CMS’s goals of establishing a more transparent and predictable process that beneficiaries can use
to select plans that meet their health care needs, while also being protected from high or
unexpected cost sharing. After completing analysis and engaging in discussions with
stakeholders, CMS will not implement for CY 2017 an out-of-pocket cost (OOPC) or market
basket approach to set thresholds for increases in cost-sharing and premiums whereby we would
deny Part D plan bids with significant increases, pursuant to our authority in Section 3209 of the
Affordable Care Act. Instead CMS will calculate and publish the Part D TBC to support
transparency related to the out-of-pocket beneficiary costs year over year.

191
Table 42. Benefit Parameters
CY 2017 Threshold Values
Minimum Meaningful Differences (PDP Cost-Sharing OOPC)1
Enhanced Alternative Plan vs. Basic Plan $23
Enhanced Alternative Plan vs. Enhanced Alternative Plan $34
Maximum Copay: Pre-ICL and Additional Cost- Sharing Reductions in
the Gap (3 or more tiers) S2,3
Preferred Generic Tier <$204
Generic Tier $20
Preferred Brand/Brand Tier $47
Non-Preferred Drug Tier $100
Non-Preferred Brand Tier $100
Injectable Tier $100
Select Care/Diabetic Tiers5 $11
Maximum Coinsurance: Pre-ICL (3 or more tiers) S2,3
Preferred Generic Tier 25%
Generic Tier 25%
Preferred Brand/Brand Tier 25%
Non-Preferred Drug Tier 50%
Non-Preferred Brand Tier 50%
CY 2017 Threshold Values
Injectable tier 33%
Select Care/Diabetic Tiers5 15%
Maximum Coinsurance: Additional Cost-Sharing Reductions in
the Gap for Applicable Beneficiaries (all tier designs) 6
S3
Preferred Generic Tier 31%
Generic Tier 31%
Preferred Brand/Brand Tier 60%
Non-Preferred Drug Tier 60%
Non-Preferred Brand Tier 60%
Injectable Tier 60%
Select Care/Diabetic Tiers5 60%
Minimum Specialty Tier Eligibility
1-month supply at in-network retail pharmacy $670
1The Enhanced Alternative Plan to Basic Plan meaningful difference minimum threshold is based on the 50
th percentile of
the October CY 2016 Bid Data run through the CY 2016 OOPC MPF model which incorporates CY 2016 Formulary Data,
2010/11 MCBS Data, and FDA data for brand/generic determinations related to coverage gap cost-sharing estimates. For each
parent organization, any cost-sharing OOPC comparison between a basic plan and EA plan in the same region must meet the
minimum Enhanced Alternative Plan vs. Basic Plan threshold. For each parent organization, any cost-sharing OOPC
comparison between two EA plans in the same region must meet the threshold established annually by CMS.
2 These thresholds are based on the 95th percentile of the CY 2016 Bid Data. As in previous years, we will also set similar
thresholds for plans with atypical tiering structures, such as a two tier formulary.
192
3 “S” in the above chart refers to “standard retail cost-sharing” at a network pharmacy. Standard retail cost-sharing (S) is cost-
sharing other than preferred retail cost-sharing offered at a network pharmacy.
4Cost sharing for the Preferred Generic Tier need only be lower than that for the cost sharing of the Generic Tier. There is not
a separate maximum cost share threshold for the Preferred Generic Tier.
5The Select Care Drug and Select Diabetic Drug Tiers must provide a meaningful benefit offering with low or $0 beneficiary
cost-sharing for drugs targeting specific conditions (e.g., $0 tier for drugs related to diabetes and/or smoking cessation). The
coinsurance threshold for these tiers is derived from an average expected copayment amount using PDE data for drugs
submitted on preferred cost-sharing tiers. As noted earlier in this section, we continue to expect cost sharing for the Vaccine
tier, or Select Care/Select Diabetes tiers that contain vaccines, to be $0.
6Additional gap cost-sharing reductions for applicable beneficiaries are communicated in the PBP at the tier level and sponsors
may elect to provide this gap benefit for all drugs on a tier (full tier coverage) or a subset of drugs on a tier (partial tier
coverage). If the additional gap cost- sharing reduction benefit for a brand labeled tier applies to only non-applicable (i.e.,
generic) drugs or both generic and applicable drugs on that tier, then the generic drug beneficiary coinsurance maximum of 31%
applies. Injectable, Specialty, Select Care and Select Diabetic Drug labeled tiers for which additional gap coverage is offered, if
any, will be analyzed in the same manner as brand labeled tiers with respect to beneficiary coinsurance maximums. Note, the
beneficiary coinsurance maximums for the coverage gap reflect the plan liability, but exclude the 50% manufacturer discount
for applicable drugs.
Specialty Tiers
Per 42 CFR 423.578 (a)(7), if a Part D plan sponsor maintains a formulary tier (the specialty tier)
in which it places very high cost and unique items, such as genomic and biotech products, the
sponsor may design its exception process so that very high cost or unique drugs are not eligible
for a tiering exception. Only Part D drugs with sponsor-negotiated prices that exceed an
established dollar-per-month threshold are eligible for specialty tier placement. The current cost
threshold of $600 was established in CY 2008.
In order to make sure that a Part D sponsor does not substantially discourage enrollment by
specific patient populations reliant upon these medications, CMS will only approve specialty
tiers within formularies and benefit designs that meet the standards set forth in Section 30.2.4 of
Chapter 6 of the Prescription Drug Benefit Manual. Part D sponsors offering prescription drug
benefit plans with a specialty tier are limited to the defined standard cost-sharing of 25%, if the
plan requires the standard deductible, and up to 33% cost-sharing if no deductible is required, or
some percentage in-between dependent on a decreased deductible. In return Part D sponsors are
shielded from tier exceptions for the most expensive drugs, and need not increase their bids and
all Part D premiums to maintain actuarial equivalence for an estimate of increased plan liabilities
arising from approved tier exceptions.
As noted in the CY 2016 Call Letter, we continue to evaluate the specialty tier eligibility cost
threshold. The current $600 threshold repeatedly identified outlier prescription drug event (PDE)
data – less than one percent of 30 day equivalent fills exceeded $600. However, initial analyses
of 2015 PDE indicate that this percentage now slightly exceeds one percent. This, coupled with
the significant increase in the cost of Part D drugs since the last adjustment to the specialty tier

193
threshold, supports an increase in the specialty tier threshold for CY 2017. To adjust the
threshold, we propose applying the annual percentage increase used in the Part D benefit
parameter updates to the existing $600 threshold. Thus, for CY 2017, the specialty tier cost
threshold will be $670. We may or may not increase the threshold on an annual basis moving
forward. Annually, we will test the proposed increased threshold and continue to perform other
analyses to assess whether threshold adjustments are necessary.
To support CMS’s transparency initiatives, raise awareness, and educate beneficiaries on the cost
of prescription drugs and their impact on the Part D program; CMS intends to add a hyperlink on
the Medicare Plan Finder on Medicare.gov to the Medicare Drug Spending Dashboard, which is
published on CMS.gov, and estimates implementation for 2017 Open Enrollment in Fall 2016.
Generic Tier $0 Copay Plans
Since the program began in 2006, use of lower cost generic alternatives by Medicare Part D
enrollees has been high and steadily increasing as single source drugs lose patent exclusivity.
However, low-income subsidy (LIS) enrollees continue to have lower use of generics compared
to enrollees without income subsidies. Lower generic use is often attributed to the small
differential between generic and brand drug copays legislatively mandated for LIS enrollees.
Changes in copay to increase cost differential between brand and generic drugs for LIS
beneficiaries requires Congressional authority; however, lowering the generic copay does not
and in 2012, 685 or 21.1% of plans offered generic-tier $0-copay plans. Of those 685 plans, 265
were PDP plans and 420 were MA-PD plans. We, therefore, explored the impact of enrollment in
generic-tier $0 copay plans on generic substitution rates between both LIS and Non-LIS
enrollees compared to enrollment in generic-tier non-$0 copay plans.
Using 2012 prescription drug event data, our analysis found that generic substitution rates (GSR)
for generic-tier $0 copay plans were 1.2 to 3.0 percentage points higher than in non-$0 copay
plans. This finding held true for both Enhanced PDP and MA-PD plans, and PDP Basic plans
for both LIS and non-LIS Part D populations. Within MA-PD Basic plans, GSR was not
statistically different for LIS or non-LIS populations, but there were very few MA-PD generic-
tier $0 copay basic plans. The lack of basic MA-PD plans is attributed to policy that does not
require MA plans to offer a basic plan if they offer an EA plan without a monthly supplemental
Part D premium in the same service area. Overall, if Part D enrollment were shifted from
generic-tier non-$0 into $0 copay plans, generic use could potentially increase. Even small
increases in generic use could mean significant savings to beneficiaries and to the Medicare Part
D program. However, our analysis is not without limitations. A complete description of the
study is found here: https://www.cms.gov/Medicare/Prescription-Drug-Coverage/
PrescriptionDrugCovGenIn/ProgramReports.html. At this time, CMS is providing these results
as informational only and as an opportunity for further discussion on ways to increase generic
use in Part D and in particular, the LIS population.

194
CMS has seen an increase in the number of plans with deductibles in 2016 compared to 2015.
Some of these plans have a $0 cost share for generic drugs but require the beneficiary to meet a
deductible prior to receiving generic medications for free. One option available to Part D
sponsors is to provide first dollar generic coverage for medications on the $0 generic copay tier
by exempting the $0 cost sharing tier from the deductible. CMS encourages plan sponsors to
consider first dollar coverage for generic medications and other ways to increase generic use in
the Part D program.
Part D Employer Group Waiver Plans (EGWPs)
Since January 1, 2014, supplemental benefits provided by employer group waiver plans
(EGWPs) beyond the parameters of the defined standard benefit are always considered non-
Medicare other health insurance (OHI). (See 77 Federal Register 22072 (April 12, 2012); and 80
Federal Register 7912 (February 12, 2015).) As a result of this change, we have continued to
receive industry questions regarding the effect, if any, it had on other EGWP and Part D rules.
The purpose of this guidance is to clarify CMS requirements for EGWPs with respect to some
Part D rules involving plan design, formularies, and pharmacy networks that consistently have
been the focus of these and other inquiries.
Section 1860D-22(b) of the Social Security Act gives CMS the authority to waive or modify Part
D requirements that hinder the design of, offering of, or enrollment in EGWPs. All Medicare
Part D requirements apply unless explicitly waived or modified by CMS, and the waivers are
only available to those EGWPs that meet the circumstances and conditions imposed as part of
those waivers. See 42 CFR §423.458(c)(3) and (4). In general, Part D sponsors cannot offer
EGWPs with combined benefits (i.e., Part D plus employer OHI) with lesser value than the basic
Part D benefit nor establish benefit designs that substantially discourage enrollment by certain
Part D eligible beneficiaries. EGWPs must follow Part D rules in cases in which the provision of
employer OHI is inextricably intertwined with drugs offered under the Part D benefit such that
the two cannot be separated as a practical matter. (See also January 25, 2013 HPMS memo
including Insurance Standards Bulletin Series guidance: “Because the Affordable Care Act has
increased basic Part D benefits in the coverage gap, as of 2013 there will be very few claims that
do not contain some basic Part D benefits and would not ultimately be governed (as a practical
matter) by the Part D regulations.”)
As conditions of the waivers identified below, we remind Part D sponsors of EGWPs of the
following: (Please note that other conditions may attach to these waivers.)
Waiver: Part D sponsors offering EGWPs are not required to submit the same bid packages in
their entirety as are Part D sponsors of individual plans. Prescription Drug Benefit Manual
(PDBM), Ch. 12, EGWPs, §20.9. (For details, see 2016 HPMS Memo entitled “Release of the
2016 Plan Benefit Package and Bid Pricing Tool Software and Related Technical Bidding
Guidance for Part D Employer/Union-Only Group Waiver Plans” (April 10, 2015).

195
EGWP benefits (meaning, the Part D benefits, taking into consideration employer OHI)
must continue to meet the following applicable actuarial standards in 42 CFR
§423.104(e):
o Deductible is limited to no greater than defined standard deductible;
o Total Benefit is at least actuarially equivalent to the basic Part D benefit; and
o Catastrophic Benefit is at least actuarially equivalent to the basic Part D
catastrophic benefit.
See also PDBM, Ch. 12, EGWPs, §20.9.
Part D sponsors of EGWPs should take into consideration the annual established copay
and coinsurance tier maximum thresholds for Part D plans when designing their tiered
benefits to ensure they are not discriminating and discouraging certain beneficiaries from
enrolling in the EGWP. See 2012 Final Call Letter, page 146 (April 4, 2011).
Waiver: EGWPs do not need to submit a unique formulary variation for each individual
employer/union sponsored group health plan. PDBM, Ch. 12, EGWPs, §20.14.
EGWPs that provide benefits with formularies will continue to:
o Submit for CMS approval through the HPMS formulary module a base formulary,
utilization management criteria, and transition policy that represents the minimum
drug benefit upon which all other formulary variations in the same plan must be
built. See 2015 Final Call Letter, page 127 (April 7, 2014). In other words,
EGWPs cannot provide a formulary benefit that is less than what is included in
the base formulary.
Submit a base formulary which has the fewest drugs and the most
restrictive UM that any EGWP formulary variation will offer. For EGWPs
with multi-tiered formularies, submit the maximum number of tiers that
will be offered by any EGWP formulary variation in that same 800 series
plan and ensure each drug is placed on the tier where it has the highest
possible cost sharing of any formulary variation. See 2015 Final Call
Letter, page 127 (April 7, 2014).
Assign all EGWP 800 series Part D plans to a formulary through the
formulary crosswalk process. See Release of the Contract Year (CY) 2016
Bid Upload Functionality in HPMS (May 8, 2015 HPMS memo).
o Only make enhancements to approved formularies (i.e., enrich formularies) that
increase the value for any beneficiary who uses the drug(s). See 2015 Final Call

196
Letter, page 127 (April 7, 2014).
o Follow all applicable (that is, non-waived) CMS rules, including those found in
PDBM, Chapter 6, Part D Drugs and Formulary Requirements, when restricting
access (often referred to as making negative changes) to drugs covered under the
Part D benefit that appear in any EGWP formulary (whether base or enriched).
EGWPs restrict access when they, for instance, remove drugs; increase cost-
sharing; and impose or make more restrictive existing prior authorization or step
therapy requirements or quantity limits. See PDBM, Ch. 12, EGWPs, §§10.1,
20.14. To provide further clarification, please note:
When required by the circumstances of the negative change, we would
require EGWPs to, for instance, provide notice of the changes; exempt
affected enrollees from the proposed change for the plan year; update
formularies and other applicable beneficiary communications; and process
enrollee requests for exceptions.
EGWPs making negative changes to drugs on the base formulary must
request CMS approval through the HPMS negative change request (NCR)
module. In contrast, when an EGWP adds drugs to enhance the base
formulary, CMS does not require the sponsor to submit the additional
drugs in HPMS for CMS approval. See PDBM, Ch. 12, EGWPs, §20.14.
Subsequently, if an EGWP wanted to make a negative change to a drug
that was not included in the base formulary, as a matter of operations, it
would not be possible for the EGWP to submit a negative change request
for that drug through HPMS. Therefore, while we continue to expect
EGWPs to follow all other applicable rules regarding negative changes to
drugs included under the Part D benefit that appear on an enriched EGWP
formulary, we do not expect them to submit such changes to the HPMS
NCR module.
Improving Drug Utilization Review Controls in Medicare Part D
In the Final 2013 Call Letter and supplemental guidance, CMS described a medication safety
approach by which sponsors are expected to reduce beneficiary overutilization of opioids and
maintain access to needed medications.34 In July 2013, CMS launched the Overutilization
Monitoring System (OMS) to help oversee sponsors’ compliance with this CMS overutilization
guidance.
34 An excerpt from the Final 2013 Call Letter, the supplemental guidance and additional information about the OMS
are available on the CMS webpage, Improving Drug Utilization Controls in Part D (https://www.cms.gov/Medicare/
Prescription-Drug-Coverage/PrescriptionDrugCovContra/RxUtilization.html).
197
CMS continues to focus on and expect sponsors to further reduce opioid and acetaminophen
(APAP) overutilization in the Medicare Part D program. In this section, we describe the results
of Part D sponsors’ implementation of improved drug utilization controls to prevent
overutilization and improve medication use since January 2013. We also solicit comments and
suggestions about the new proposals described below to reduce the unsafe overutilization of
medications by Part D beneficiaries.
Timeliness of beneficiary-level opioid point of sale (POS) edit submissions to the
Medicare Advantage and Prescription Drug System;
Discontinuation of OMS APAP Reporting through the OMS;
Changes to the OMS opioid overutilization methodology;
Formulary-level cumulative morphine equivalent dose (MED) POS edits;
Soft formulary-level opioid POS edit following initiation of buprenorphine addiction
therapy;
Access to medication-assisted treatment for opioid addiction;
Elimination of utilization management processes that may lead to inappropriate use of
methadone in pain management.
In addition, the Enhancements to the 2017 Star Ratings and Beyond section of the draft 2017
Call Letter discusses proposed implementation of three new PQA-endorsed opioid
overutilization measures.
New Expectation for Entering Opioid Point of Sale Claims Edit Information in the
Medicare Advantage and Prescription Drug System (MARx)
CMS enhanced MARx in February 2014 to automate the process by which sponsors notify other
sponsors about their beneficiary-level opioid POS edit decisions. Sponsors enter information in
MARx when they have made a decision to implement a beneficiary-level opioid POS claim edit.
MARx then alerts a new sponsor when a beneficiary identified in this manner by the previous
sponsor enrolls in the new sponsor’s plan. The new sponsor then has the capability to contact the
prior sponsor using the Part D Sponsor Overutilization Contact List found on the CMS webpage,
Improving Drug Utilization Controls in Part D at https://www.cms.gov/Medicare/Prescription-
Drug-coverage/PrescriptionDrugCovContra/RxUtilization.html. To facilitate data sharing
between Part D sponsors, CMS has expected sponsors to submit POS edit notifications into
MARx in a timely manner which we are now specifying as within seven (7) days of the date on
the beneficiary’s written advance notice. CMS expects sponsors to submit implementations,
terminations, and modifications of such POS edits within seven (7) days of the event. As of

198
December 15, 2015, CMS has received 2,400 contract-beneficiary-level opioid POS edit
notifications through MARx for 2,233 unique beneficiaries.
Results of Overutilization Policy
Part D sponsors have had a significant impact on reducing overutilization of opioids and APAP.
From 2011 through 2015, there was a 47% decrease or 13,753 fewer Medicare Part D
beneficiaries identified as potential opioid overutilizers (i.e., beneficiaries with at least 90
consecutive days with greater than 120 mg MED daily with more than 3 prescribers and more
than 3 pharmacies contributing to their opioid claims). This represents a 57% decrease in the
share of beneficiaries using opioids who are identified as potential opioid overutilizers (see Table
43).
Table 43. OMS Part D Potential Opioid Overutilization Rates, 2011 – 2015*
Year Total Part
D Enrollees
Total Part
D Enrollees
Utilizing
Opioids
% Part D
Enrollees
Utilizing
Opioids
Total Beneficiaries with at Least
90 Consecutive Days >120 mg
MED Daily AND
> 3 Prescribers &
> 3 Pharmacies for Opioid Claims
Difference Year-
to-Year
Share of
Opioid
Utilizers
Flagged as
Outliers
Difference in
Share Year-to-
Year
2011 31,483,841 10,049,914 31.9% 29,404 0.29%
2013 37,842,632 11,794,908 31.2% 25,347 − 4,057 0.21% −0.08%
2014 39,982,962 12,308,735 30.8% 21,838 − 3,509 0.18% −0.04%
2015 41,835,016 12,510,448 29.9% 15,651 − 6,187 0.13% −0.05%
*Table 43 includes partial year inactive contracts, and hospice and cancer patients are excluded from utilizer and potential
overutilizer counts. For these opioid utilization comparisons, CMS used OMS methodology and prescription drug event (PDE)
TAP Data processed with cut-off dates in the early January of the following year.
The number of beneficiaries identified annually as potential APAP overutilizers from 2011 to
2015, based on the CMS definition in the OMS, decreased by 94%, from 76,681 to 4,539 (See
Table 44).
47%
decrease
57%
decrease

199
Table 44. OMS Part D Potential APAP Overutilization Rates, 2011-2015*
*For these APAP utilization comparisons, CMS used OMS methodology and PDE TAP Data. For 2011, PDE TAP Data were
processed through 13AUG2012; subsequent year analyses used PDE TAP data processed with cut-off dates in the early January
of the following year.
Updates to Overutilization Policy for Contract Year (CY) 2017
Discontinuation of APAP Reporting through the OMS
Since the annual number of APAP overutilizers has decreased dramatically since 2011, we
propose to discontinue the reporting of APAP overutilization tickets in the OMS beginning with
the April 2016 OMS reports.
However, we will continue to monitor APAP overuse. As stated in the 2016 Call Letter, we will
begin reporting the High APAP Daily Dose Rate for CY 2016 at the contract level for
informational purposes. The High APAP Daily Dose Rate will be defined as the number of
APAP days exceeding a 4 g daily dose (DD) per 1,000 APAP user days. Daily dose will be
rounded to the nearest tenth using standard rounding methodology. We will also identify outliers
at the contract level, and we propose new outlier response requirements beginning in 2017
similar to the process used for the Patient Safety measure reports. Therefore, we propose adding
this metric into Patient Safety reporting, not to the OMS, as originally described in the 2016 Call
Letter. Both the Patient Safety reporting and the OMS are available within the Patient Safety
website.
Opioids
Compliance Activities and Changes to the OMS Opioid Overutilization
Methodology
Since the OMS was launched in July 2013, CMS has used the following criteria to identify
potential opioid overutilizers:
Year Total Part
D Enrollees
Total Part
D Enrollees
Utilizing
APAP
% Part D
Enrollees
Utilizing
APAP
Total Beneficiaries with Daily
APAP Dose Exceeding 4 g for 30
or More Days Within Any Six-
month Period with at Least One
Day Exceeding 4 g Within the
Most Recent Calendar
Difference Year-
to-Year
Share of
APAP
Utilizers
Flagged as
Outliers
Difference in
Share Year-to-
Year
2011 31,483,841 9,449,693 30.0% 76,581 0.81%
2013 37,842,632 10,591,651 28.0% 26,122 −50,459 0.25% −0.56%
2014 39,982,962 10,845,499 27.1% 6,286 −19,836 0.06% −0.19%
2015 41,835,016 10,712,430 25.6% 4,539 −1,747 0.04% −0.02%

200
Use of opioids with cumulative daily MED exceeding 120 mg for at least 90 consecutive
days with more than 3 prescribers and more than 3 pharmacies contributing to their
opioid claims, during the most recent 12 months, excluding beneficiaries with cancer
diagnoses and beneficiaries in hospice.
In the 2015 Call Letter, we described our concern that some sponsors’ internal criteria or
processes to identify and address potential opioid overutilization may be insufficient. For the
January 2014 OMS reports, 67% of the potential opioid overutilization responses were that the
beneficiary did not meet the sponsor’s internal criteria (OMS response code BSC). CMS also
announced that beginning January 2015, sponsors’ internal opioid criteria for retrospective
identification of egregious patterns of opioid overutilization and subsequent case management
should be no less restrictive than 120 mg MED daily dose over at least 90 consecutive days.
Other criteria, such as the number of prescribers and pharmacies, could vary from CMS
specifications. Sponsors may also vary the measurement period, and most sponsors look back 90
to 120 days. Continued review of sponsors’ responses to the OMS in 2015 suggested potential
noncompliance with CMS guidance.
In light of this, we performed additional outreach to assess compliance with CMS guidance by
select Part D sponsors who were identified as outliers based on their APAP and opioid responses
to the OMS.
CMS contacted Part D sponsors at the parent organization level to obtain information about their
overutilization criteria and case management programs, and for the sponsors to explain their
responses to specific tickets received through the OMS. Overall, we found that sponsors were
generally compliant with CMS guidelines.
Based on our analysis of the information from this effort, we identified opportunities to
potentially modify the OMS opioid overutilization criteria in the future (as early as 2018) to
reduce the number of tickets for which sponsors repetitively submit response codes BSC (No
further review planned: Beneficiary did not meet the sponsor’s internal criteria) and BOR
(Beneficiary-level POS edit determined not necessary: Beneficiary’s overutilization resolved).
Ideas include to:
Shorten the measurement period from 12 months to 6 months; and
Use average MED rather than a count of 90 consecutive days of high MED.
The revised ‘Overutilization of Opioids’ criteria would be:
Use of opioids with an average daily MED exceeding 120 mg for an episode of at least 90
days with more than 3 prescribers and more than 3 pharmacies contributing to their opioid
claims, during the most recent 6 months, excluding beneficiaries with cancer diagnoses and
beneficiaries in hospice.

201
The average MED is calculated by summing each PDE’s MED and dividing this sum by the
duration of the opioid episode in days. An opioid episode consists of at least two opioid PDE
fills. The episode duration is the number of days between the first and last opioid PDE during
the measurement period plus the last PDE’s days supply plus 1 day (end-date). If the end-date is
beyond the last day of the measurement period, the quantity is multiplied by the percent of the
days supply that occurs during the measurement period, and the end-date becomes the last
calendar day of the measurement period.
By allowing gaps between prescription fills and days supply in the calculation, the average MED
per 90-day episode methodology may identify more beneficiaries who are chronic users of high
opioid doses than the consecutive days method. Shortening the measurement period from 12
months to the most recent 6 months may better identify current potential overutilization and
reduce the number of repeat cases reported by the OMS. We are analyzing the impact of these
potential revisions in identifying potential opioid overutilizers.
In addition, CMS is investigating how prescribers are counted in the OMS opioid overutilization
criteria. We are analyzing the feasibility of grouping NPIs (National Provider Identifiers) within
a clinical practice as reported in the Medicare Provider Enrollment, Chain, and Ownership
System (PECOS) rather than count unique NPIs, which would reduce false positives in the group
practice setting. Suggestions include grouping based upon Tax ID number (TIN), Employer ID
number (EIN), or primary location address. Identifying common clinical practice groups based
on prescribers whose NPIs are associated only with one primary location TIN or a single EIN
could prevent mis-matching of prescribers who participate in multiple clinical practices. This
conservative grouping methodology resulted in a 4.8% decrease in the number of potential
opioid overutilizers that would have been identified by the OMS in the October 2015 cycle.
These analyses are in the preliminary stage, and we welcome feedback from sponsors for our
analyses. We also solicit comments on the proposed revisions to the OMS opioid overutilization
criteria, on alternative ways to count prescribers, and considerations for implementation by
sponsors. We may consider changes to guidance and the opioid overutilization criteria
beginning in 2018 based on experience from compliance activities, additional analyses, and the
upcoming CDC guideline (as described further below).
Other findings and takeaways from our compliance activities include:
Sponsors should review repeat OMS response replies. For example, instead of resubmitting
the BSC response code repeatedly for the same case, sponsors may confirm medical
necessity with the prescribers. The DMN (Determined Medically Necessary) response code
triggers the OMS exception logic for one year.
Although several morphine equivalent conversion factors exist, CMS encourages

202
sponsors to use the CDC morphine milligram equivalent (MME35) conversion factors
within their opioid overutilization programs. The MME conversion table is available on
the CMS webpage, Improving Drug Utilization Controls in Part D
(https://www.cms.gov/Medicare/Prescription-Drug-Coverage/
PrescriptionDrugCovContra/RxUtilization.html) which contains information to help Part
D sponsors create or revise their programs to address the unsafe use of opioid pain
medications.
We thank the sponsors that participated in this outreach effort. We were not only able to assess
potential non-compliance, but we gained information on ways to improve our guidance and
overutilization methodology.
CMS’ Expectation for Formulary-Level Cumulative Opioid POS Edits in CY 2017
Although the overutilization of opioids has decreased in Part D as discussed above, CMS has
indicated on multiple occasions that we believe Part D sponsors should implement formulary-
level cumulative opioid edits at POS to prospectively prevent opioid overutilization. Industry
reaction has consistently been that such edits are premature due their complexity. As described
in the final CY 2016 Call Letter, we commenced a pilot project in 2015 to assess the feasibility
and impact of such POS edits.
Through the pilot project, we noted that Part D sponsors demonstrated that they can effectively
implement soft and hard formulary-level cumulative MED edits at POS while blocking the edit
for beneficiaries with known exceptions. The sponsors evaluated their own data when
developing edit specifications and exclusion criteria to identify potential opioid overutilization
while maintaining access to opioids when needed for their enrollees.
A soft edit was piloted by one sponsor to identify potential overutilization before
reaching the OMS threshold. The edit was designed to identify beneficiaries who were
receiving more than 100 mg MED per day for at least 60 days over a 6-month
measurement period with more than two prescribers and more than two pharmacies for
their opioid prescriptions. Exclusion criteria included cancer, hospice care, and prior
determinations of medical necessity. The results from this pilot showed that the edit was
not arduous from an operations perspective, was inexpensive to implement and was not
disruptive. Pharmacists submitted appropriate override codes when re-submitting
rejected claims. No complaints were received from providers or members. The soft edit
worked as expected to identify, delay or stop potential opioid overutilization before the
majority were identified by the OMS.
35 Note: CDC’s terminology, morphine milligram equivalents (MME), is equal to morphine
equivalent dose (MED) in milligrams as used by CMS. Often calculated as a daily dose.

203
Two sponsors applied a hard POS edit for opioid use that exceeds 200 mg MED daily.
The edit excluded quantities allowed during the refill grace period, beneficiaries enrolled
in hospice or with a cancer diagnosis, and prior coverage determinations of medical
necessity. Resolving the edit required a prior authorization or coverage determination at
the plan level. The edit did not include criteria for exceeding a certain number of opioid
prescribers, and one sponsor did report that a notable number of cases were approved
(i.e., overturned). However, the sponsor believed that the edit was worthwhile -
prescribers were engaged, and prescriptions were changed. Formal complaints have not
been noted from beneficiaries, pharmacies, or prescribers.
Therefore, CMS expects sponsors who adjudicate pharmacy claims at POS to implement
formulary-level cumulative MED POS edits effective January 1, 2017. PACE organizations who
do not adjudicate claims at POS are exempt from this expectation. In order to minimize claim
rejections on false positives, we propose that sponsors implement both soft and hard cumulative
MED POS edits.
For CY 2017, we expect sponsors’ Pharmacy and Therapeutics (P&T) committees to develop the
specifications for the soft and hard36 cumulative MED POS edits. At this time, CMS requests
comments from sponsors on our proposed parameters for formulary-level, cumulative MED POS
edits, including alternative thresholds, criteria to reduce false positives, and methods to assure
prompt access to prescribed opioids when determined medical necessary.
The proposed parameters are:
Soft edits that can be overridden at the pharmacy level when a prescription claim will result
in the beneficiary’s active or overlapping opioid prescriptions reaching or exceeding a certain
daily cumulative MED threshold. This threshold may be set at 90 mg to 120 mg MED. The
soft-edit rejection can be overridden by the pharmacist submitting appropriate NCPDP
Professional Pharmacy Service codes.
Hard edits for daily cumulative MED threshold at or above 200 mg MED.
For both soft and hard edits, sponsors should minimize false positives by accounting for known
exceptions, such as hospice care, certain cancer diagnoses, reasonable overlapping dispensing
dates for prescription refills (e.g., based on early refill allowances) or new prescription orders for
continuing fills, and high-dose opioid usage previously determined to be medically necessary
such as through coverage determinations, prior authorization, case management, or appeals
36More information about soft and hard rejects and edits is available from the National Council
for Prescription Drug Programs: “Telecommunication Version D and Above Questions, Answers
and Editorial Updates,” NCPDP, February 2014, http://www.ncpdp.org/NCPDP/media/pdf/
VersionD-Editorial.pdf (accessed 1/22/2015).

204
processes. If sponsors decide to include a provider count criterion in the soft or hard edit
specifications, we recommend two prescribers of the active opioid prescriptions as the threshold.
We do not recommend a consecutive high-MED days criterion because it would not prevent
beneficiaries from reaching high opioid doses.
Prior to implementing soft and hard cumulative formulary MED thresholds at POS, the sponsor’s
CY 2017 formulary submission must reflect these edits. In addition to the HPMS formulary
submission, plan sponsors must submit detailed operational information by the CY 2017
formulary submission deadline. The documentation must contain at a minimum the MED level
being utilized for each edit and a written description of the program’s mechanics, including the
mechanism by which the edits would be resolved. This information must be submitted via e-
mail to [email protected] with a subject line of “Cumulative MED – [applicable
FID number].”
Concurrent Use of Opioids and Buprenorphine
As described in the 2016 Call Letter, we investigated the concurrent use of buprenorphine and
opioids in Part D as a potential new measure for the OMS as informational only. Currently, the
formulations of buprenorphine sublingual (SL) and buprenorphine-naloxone SL film or tablets
are only approved by the Food and Drug Administration (FDA) for the treatment of opioid
addiction and not for the treatment of pain. Because buprenorphine effectively blocks the
analgesic properties of other opioids used to treat acute pain, it generally prevents the use of
other opioids as an adjunctive treatment for pain syndromes.
An analysis of PDE data from April 1, 2014 through March 31, 2015 identified over 24,500
Medicare Part D beneficiaries with concurrent buprenorphine buccal formulation and opioid use,
including over 20% with 30 or more concurrent opioid days. CMS believes there are additional
opportunities for improvements through drug utilization management. Therefore, we expect
sponsors to implement a soft formulary-level POS edit when an opioid prescription is presented
following the initiation of buprenorphine addiction therapy. At this time, we will not include a
measure of concurrent use of opioids and buprenorphine in the OMS, but we will continue to
monitor utilization trends. For additional guidance in the use of buprenorphine in the treatment
of addiction refer to http://buprenorphine.samhsa.gov/Bup_Guidelines.pdf.
Access to Medication-Assisted Treatment
Despite efforts such as those outlined above, opioid addiction continues to be a significant public
health concern. In October 2015, the President issued a Memorandum to Federal Departments
and Agencies to identify barriers to medication-assisted treatment (MAT) for opioid use
disorders and develop action plans to address these barriers. In response, CMS will use available
vehicles to inform physicians, MA organizations and Part D sponsors about MAT coverage,
including clarifying that MA plans have the same obligation to cover addiction treatment as is

205
available under Original Medicare and that Part D plans must ensure access to MAT that are
covered under Medicare Part D. Currently only buprenorphine, buprenorphine/naloxone, and
naltrexone are covered Part D drugs when used for medication-assisted treatment (MAT) of
opioid addiction. Under current methadone is not covered by Part D for substance abuse
treatment because it does not meet the Part D requirement that it “may be dispensed only upon a
prescription” since it cannot be dispensed upon a prescription at a pharmacy when used for this
purpose. The agency seeks comment on whether this statutory requirement is a barrier to
treatment. It is critical that Medicare beneficiaries who are in need of these therapies have
appropriate access to these drugs in Part D. Given the requirements imposed by the Drug
Addiction Treatment Act of 2000 and Risk Evaluation and Mitigation Strategy for
buprenorphine-containing products for MAT, Part D sponsors should not impose prior
authorization criteria that simply duplicate these requirements. When prior authorizations are
utilized, Part D sponsors must also carefully consider approval durations so as to not subject
beneficiaries who are in need of these therapies to unnecessary hurdles. Part D formulary and
plan benefit designs that hinder access, either through overly restrictive utilization management
strategies or high cost-sharing, will not be approved.
A Note about the Centers for Disease Control and Prevention (CDC) Guideline for
Prescribing Opioids for Chronic Pain
The CDC is preparing a guideline for opioid prescribing to assist primary care providers in
delivering safer, more effective chronic pain management for patients with pain outside of active
cancer treatment, palliative care, and end-of-life care. The guideline, which is expected to be
released in early 2016, is being developed through a rigorous scientific process using subject
matter experts, the most recent scientific evidence, and public comment. Topics include 1) when
to initiate or continue opioids for chronic pain; 2) opioid selection, dosage, duration, follow-up,
and discontinuation; and 3) assessing risk and addressing harms of opioid use, including the use
of opioids in patients age 65 and older. In the draft guideline, CDC identified 50 mg MME daily
dose as a threshold for increased risk of opioid overdose, and to generally avoid increasing
dosage to 90 MME per day. The draft guideline also presented tapering methodology for long-
term, high opioid dose users, which may be useful to reduce high opioid doses. We encourage
sponsors’ P&T committees to carefully review and consider CDC’s recommendations, and to
share the CDC guideline with opioid prescribers. The draft CDC Guideline for Prescribing
Opioids for Chronic Pain may be found on the CDC website at http://www.cdc.gov/
drugoverdose/prescribing/guideline.html.
During 2016, we will consider potential revisions to CMS overutilization guidance and the OMS
opioid overutilization methodology based on the CDC guideline, for presentation in the 2018
Call Letter. In addition, we will consider recommendations set forth in the guideline during the
CY 2017 formulary and benefits review. For example, CDC notes that methadone has been
associated with a disproportionately high number of overdose deaths relative to its prescribing

206
frequency for pain management. As a result, the draft guideline states that methadone should not
be used as a first line agent for pain management when an extended-release/long-acting opioid is
indicated, and that only providers who are familiar with the complexities of methadone’s
pharmacokinetic and pharmacodynamics properties should prescribe it for pain. Part D sponsors
should evaluate their utilization management strategies and eliminate processes that may lead to
inappropriate utilization of methadone in pain management. Submitted Part D benefit packages
and formularies will be reviewed to ensure that methadone is not the sole preferred opioid
analgesic within a plan design.

207
Point of Sale Pilot
In the final 2016 Call Letter, CMS committed to conducting a pilot to help identify options for
resolving certain point of sale (POS) claim rejections without the enrollee having to request a
coverage determination from the plan. We began this pilot in the summer of 2015. Participation
was limited to a small number of Part D plans and PBMs, and included both large and small
organizations, as well as stand-alone Part D and MA-PD plans, in an effort to ensure the pilot
would be representative of the entire Part D program.
Pilot participants were asked to develop a proactive process that is initiated without any action
on the enrollee’s part in response to a claim that rejects at the POS. Participants were also asked
to identify 5 to 10 target drugs for the pilot that are Part D drugs not on the plan’s formulary or
formulary drugs subject to approved step therapy or prior authorization requirements.
Participants met regularly with CMS throughout the testing period, first to share details of their
proactive process and list of target drugs, then to provide updates and narratives for individual
test cases. We recommended that each participant work on about 20 cases for the pilot and
provide the following:
A narrative for each test case and basic data reporting;
Burden and resources involved, including time commitments, need for clinical staff,
operational constraints and resource limitations;
Lessons learned—the pros and cons of proactively responding to rejected claims, what
worked and what didn’t as testing progressed;
How the pilot process compares with the coverage determination process (similarities and
differences);
Other ideas that may help address POS issues without the enrollee having to initiate the
coverage determination process; and
How the participant organization might operationalize a similar process in response to a
potential policy change and any challenges that may be encountered in implementing such a
process on a broader scale.
We indicated during the CMS Compliance Conference in June 2015 that we would provide
additional information in the CY 2017 Call Letter. CMS is analyzing the final reporting from
pilot participants to determine if there are any best practices or other operational changes plans
could make related to POS rejections for the 2017 plan year. Some of the areas CMS may
explore are based on the pilot experience could include:
How CMS and Part D plans could reduce the volume of rejected claims on the front end

208
by resolving certain issues before the prescription is sent to the pharmacy, such as:
o Encouraging electronic prescribing, particularly electronic prior authorization, or
other efficiencies in the PA process for a subset of drugs where the information
needed to satisfy the PA may be obtained in a streamlined manner;
o Making formularies more accessible to prescribers earlier in the process
How plans could employ proactive processes to resolve certain POS issues without the
enrollee having to request a coverage determination, such as:
o Identifying an appropriate subset of rejected claims to target proactive outreach
efforts;
o Designing outreach processes in a way that maximizes value while managing
plan, pharmacy and prescriber resources, and program costs.
We welcome feedback from Part D plans and other stakeholders on these issues, and expect to
provide additional information in the final Call Letter.
Extended Days’ Supply and First Fill Quantity Limits
Part D sponsors that offer an extended (2 or 3 month) days’ supply are not required to uniformly
apply this benefit across each tier. Sponsors must indicate in the plan benefit package (PBP) if an
extended days’ supply for a given tier applies across an entire tier, or applies only to a subset of
drugs on a tier. Currently there is no process for sponsors to indicate which specific drugs on a
partial extended days’ supply tier qualify for extended days’ supplies verses those drugs that do
not.
In an effort to increase transparency, beginning in CY 2017, sponsors that indicate a partial
extended days’ supply tier within their PBP will be required to submit the specific drugs not
available as extended days’ supply as an HPMS supplemental file. This file (“Non-Extended
Day Supply”) includes the RXCUIs that will not be available as an extended day’s supply during
initial formulary submission and as necessary during formulary update window submissions.
Detailed submission guidance will be provided during the formulary submission training at a
later date.
We understand many plans offer beneficiaries 2 or 3 month supplies of medications as a
convenient and potentially cost saving option. However, consistent with good medical practice, it
can often be appropriate for the prescriber to follow up sooner with a patient starting a new
therapy. This is especially true in the case of complex therapies or drugs with a narrow
therapeutic index or a high risk of side effects. With any multi-day fill there is the potential that a
patient’s dose may change or he or she discontinue therapy due to side effects, adverse reactions,
or lack of clinical response. In these cases, the remaining amount of medication is often wasted if

209
the beneficiary does not continue on the original drug. The potential for drug waste is especially
pronounced when starting on a new drug therapy, as the effectiveness and tolerability are
unknown for the patient. Dispensing a 2 or 3 month supply as a first fill to a patient who is naïve
to therapy may result in excessive waste, as well as unnecessary expense, if the patient ultimately
does not use the full amount dispensed.
Starting in 2017, plan sponsors will now also have the option to indicate in the PBP at the tier
level if any drugs are available for an extended days’ supply on all but the first fill. This change
allows sponsors to designate drugs where they will only cover up to a one month supply the first
time the drug is filled, providing an opportunity to limit drug waste when a new therapy is not
working for the patient or has adverse effects.. While some prescribers may choose to schedule
another visit with a patient beginning a complex therapy to determine the need for adjustments or
discontinuation of therapy, Part D sponsors may not require such a step or a new prescription for
the second fill to be covered for the extended days’ supply. After the first one month supply, the
change to extended days’ supply should be seamless for the beneficiary.
The specific drugs will not be included in an HPMS supplemental file for 2017. Therefore,
sponsors should make clear in beneficiary materials information about first fill quantity limits
and which drugs are affected.
Establishing Mail Order Protocols for Urgent Need Fills to Prevent Gaps in Therapy
Many Part D sponsors contract with mail order pharmacies to offer beneficiaries an alternative
way to fill prescriptions under the Part D benefit, often at much lower cost sharing than is
available at network retail pharmacies. While mail order pharmacies make up a relatively small
percentage of total prescriptions filled under the Part D program, we are committed to ensuring
consistent and reliable beneficiary access to medications, regardless of what type of pharmacy
fills the prescription.
One aspect of providing consistent access includes responding to urgent medication needs.
Various scenarios can result in a beneficiary running out or having only a small amount of a
medication remaining, such that a standard mail order fill may arrive too late to avoid a gap in
therapy. As stated in §423.120, a Part D sponsor’s contracted pharmacy network may be
supplemented by non-retail pharmacies, including pharmacies offering mail order, provided the
requirements assuring pharmacy access are met. In our experience, under such circumstances
some Part D sponsors direct their enrollees to retail pharmacies to obtain a needed medication.
Other sponsors provide rush orders (e.g., next day delivery) from mail order pharmacies to
supply the medication.
CMS has received beneficiary complaints about mail order pharmacies indicating that they will
rush ship an urgently needed order, but the order does not arrive when promised or at all,
potentially resulting in gaps in therapy. To protect beneficiaries from inconsistent or unreliable
practices that may jeopardize timely access to medications, CMS expects Part D sponsors to

210
work with their mail order pharmacies to develop and implement protocols for providing access
to urgently needed medications. Further, beneficiaries should be informed of their options when
requesting a rush order, with clear steps detailed in all applicable beneficiary materials. Having
established protocols and beneficiary information in place can streamline how sponsors respond
to such needs.
Coordination of Benefits (COB) User Fee
CMS is authorized to impose user fees on Part D sponsors for the transmittal of information
necessary for benefit coordination between sponsors and other entities providing prescription
drug coverage. We review and update this user fee annually to reflect the costs associated with
COB activities for the specific year. The 2017 COB user fee will be collected at a monthly rate
of $0.116 for the first 9 months of the coverage year (for an annual rate of $0.087 per enrollee
per month) for a total user fee of $1.05 per enrollee per year. Part D sponsors should account for
this COB user fee when developing their 2017 bids.
In contract year 2017, we will use the COB user fees for activities including:
Part D Transaction Facilitator operation and maintenance;
The Benefit Coordination and Recover Center (BCRC) operation and maintenance;
Drug data processing system management, which is used to collect prescription drug event
(PDE) data for Part D payment purposes and to produce invoices for the coverage gap
discount program;
Medicare Advantage and Prescription Drug System (MARx) management of COB data; and
Review of Workers’ Compensation settlement set-aside funds, which verify that medical
services are paid for by the appropriate party
Part D Low Enrollment
CMS has the authority under 42 CFR §423.507(b)(1)(iii) to non-renew Part D plans (at the
benefit package level) that do not have sufficient number of enrollees to establish that they are
viable plan options. While we are particularly concerned with plans that have fewer than 500
enrollees, we urge sponsors to voluntarily withdraw or consolidate any stand-alone plan with less
than 1,000 enrollees. Sponsors are strongly encouraged to view data on plan enrollment at:
https://www.cms.gov/Research-Statistics-Data-and-Systems/Statistics-Trends-and-Reports/
MCRAdvPartDEnrolData/index.html to determine if any of their plans meet this criterion. By
April 2016, we will notify plans with less than 1,000 enrollees of available options for
consolidation/withdrawal options. We reserve the right to require low enrollment plans to
consolidate/withdraw in the future based on the marketplace at that time to ensure that all Part D
plans offered in the marketplace are attractive to beneficiaries and do not add to their confusion
in selecting a plan best suited to their prescription drug coverage needs.

211
Section IV – Medicare-Medicaid Plans
Medicare-Medicaid Plan Annual Requirements and Timeline for CY 2017
This section provides an overview of the contract year (CY) 2017 Medicare requirements and
timeframes for Medicare-Medicaid Plans (MMPs). We will also provide guidance in the Final
CY 2017 Call Letter about which provisions in other sections apply to MMPs. Finally, we
remind MMPs of the policy regarding the use of past performance information for determining
eligibility for receipt of passive enrollment.
Annual submission timelines for MMPs are aligned with the standard Medicare Advantage (MA)
and Part D annual schedule, as detailed in this Call Letter. As is the case for other MA and Part
D plans, MMPs must submit a formulary, medication therapy management (MTM) program, and
plan benefit package (PBP).
In addition to the requirements for MA-PD plans and PDPs, MMPs must also submit:
On an annual basis, information to ensure the plan has a network adequate to provide
enrollees with timely and reliable access to providers and pharmacies for Medicare drug
and medical benefits based on requirements in the Medicare Parts C and D programs. In
addition, states will evaluate networks for Medicaid service providers, including long-
term supports and services.
If applicable based on the approval period given to the most recent model of care (MOC)
submission, a MOC that meets CMS’s requirements for SNPs, as well as any applicable
state requirements.
The Additional Demonstration Drug (ADD) file to supplement the Part D formulary
submission.
Table 45 below catalogues previously released guidance for MMPs or guidance that may be of
particular interest to MMPs. CMS will release updated or new guidance as necessary; where
more recent guidance exists or is released for topics that appear in previously released
documents, MMPs should use the most recent document.

212
Table 45: Previously Released Guidance
Topic Link to document
MMP Enrollment and
Disenrollment Guidance
https://cms.gov/Medicare-Medicaid-Coordination/Medicare-and-
Medicaid-Coordination/Medicare-Medicaid-Coordination-
Office/Downloads/MMPFinalEnrollGuidance.pdf
Additional State-specific
Enrollment Guidance
https://cms.gov/Medicare-Medicaid-Coordination/Medicare-and-
Medicaid-Coordination/Medicare-Medicaid-Coordination-
Office/FinancialAlignmentInitiative/InformationandGuidanceforPlans
.html
State-specific Marketing
Guidance
https://cms.gov/Medicare-Medicaid-Coordination/Medicare-and-
Medicaid-Coordination/Medicare-Medicaid-Coordination-
Office/FinancialAlignmentInitiative/InformationandGuidanceforPlans
.html
Waiver of Part D LIS
Cost-Sharing Amounts
https://cms.gov/Medicare-Medicaid-Coordination/Medicare-and-
Medicaid-Coordination/Medicare-Medicaid-Coordination-
Office/Downloads/Part_D_Cost_Sharing_Guidance.pdf
Past Performance Review
Methodology Updates for
CY 2017
https://www.cms.gov/Medicare/Prescription-Drug-
Coverage/PrescriptionDrugCovContra/index.html
Network Adequacy Determinations
MMPs will be required to resubmit their network information in September 2016 to ensure that
each MMP continues to maintain a network of providers that is sufficient in number, variety, and
geographic distribution to meet the needs of the enrollees in its service area. MMPs may assess
the Medicare portion of their networks at any time using the plan-only upload functionality in the
HPMS Network Management Module (NMM). The current reference file that provides the
MMP standards is available at: https://www.cms.gov/Medicare-Medicaid-Coordination/
Medicare-and-Medicaid-Coordination/Medicare-Medicaid-Coordination-Office/
FinancialAlignmentInitiative/InformationandGuidanceforPlans.html as well as on the reference
page within the NMM. CMS will release additional guidance on the submission process,
including how MMPs will be able to submit exception requests in the summer of 2016.
Model of Care (MOC)
As discussed in January 14, 2016 HPMS memorandum, “Changes to Special Needs Plans and
Medicare-Medicaid Plan Model of Care Submissions and Updates in the Health Plan

213
Management System for CY 2017,” we strongly encourage MMPs to avail themselves of the
new off-cycle update process, as MMPs’ MOC submissions preceded the development of three-
way contract requirements on care management and care coordination under each demonstration.
Submission of changes through this process, as outlined in that memorandum and other guidance
from CMS, will allow MMPs to align their current MOCs with all relevant demonstration
requirements.
Formulary and Supplemental Drug Files
Each contract year, MMPs must submit and be approved to offer a demonstration-specific,
integrated formulary that meets both Medicare Part D and Medicaid requirements. For CY 2017
formulary approval, MMPs must submit: (1) an updated base Part D formulary and supplemental
Part D formulary files, as applicable, consistent with CY 2016 Part D formulary application
guidance; and (2) an updated Additional Demonstration Drug (ADD) file containing non-Part D
drugs. MMPs must submit their base formularies no later than June 6, 2016. Supplemental
formulary files are due in HPMS on June 10, 2016 at 11:59 a.m. EST.
All MMPs must submit an ADD file which can only contain non-Part D drugs. Non-Part D drugs
include drugs in Medicare Part D excluded categories, over-the-counter drugs, and other
products required by the state to be included on the integrated formulary. CMS will work with
states to provide ADD file guidance to MMPs by May 2016. This guidance should include a list
of the drugs the MMPs are required to include on the ADD file (by NDC and/or UPC). It is at
the states’ discretion whether to require their plan applicants to include one proxy NDC or
multiple NDCs on the ADD file for each covered product.
State reviewers are solely responsible for reviewing and approving the ADD file. CMS will
approve all other submitted formulary files. Reviews will begin immediately after the
submission deadlines and will continue until all deficiencies have been resolved.
We clarify that mid-year ADD file change submissions – that is, changes to the ADD file after
the contract year has begun – are at the discretion of each state. CMS will work with states to
open HPMS gates for ad hoc and/or regular ADD file resubmissions as necessary.
CMS will release a CY 2017 formulary training video for plans in mid-to-late March 2016.
Plan Benefit Package (PBP)
MMPs’ plan benefit packages (PBPs) are reviewed annually to ensure that MMPs accurately
describe the coverage details and cost-sharing for all Medicare, Medicaid, and demonstration-
specific benefits. CMS will launch the HPMS PBP module on April 8, 2016, and we expect to
provide further guidance at that time on MMP-specific updates to the PBP software for CY 2017.
In addition, CMS will release an online training module on the CY 2017 PBP software for plans
on April 8, 2016.

214
MMPs must submit their integrated PBPs to CMS no later than June 6, 2016 (11:59 p.m. PST).
Non-timely submission of a PBP is considered a plan notice of non-renewal. In addition, to the
PBP, MMPs are required to submit the following as part of a complete bid submission:
Service Area Verification
Plan Crosswalk (NOTE: This is only for renewing contracts in CY2017)
Formulary Crosswalk
CMS will work with states to issue PBP guidance that clearly defines the state-required Medicaid
benefits and supplemental demonstration benefits by the time the PBP module is launched in
April 2016. The PBP review will be conducted jointly between CMS and states to ensure the
data entry is consistent with minimum coverage and cost sharing requirements under Medicaid,
Medicare Parts A, B, and D, and each state’s demonstration.
As part of our demonstration implementation activities, the Medicare-Medicaid Coordination
Office, in partnership with the Center for Medicare, has provided additional flexibility to MMPs
with respect to PBP corrections after the time of final PBP approval. This flexibility has been
necessary to accommodate mid-year legislative changes to Medicaid benefits, as well as the
timing of payment rate finalization.
The following policies apply to MMP changes to PBPs:
CMS will approve MMPs’ requests to make PBP revisions to add or remove plan-offered
supplemental benefits between the time of the release of the National Average Monthly
Bid Amount in early August and sign-off of PBPs in HPMS in late August 2016. This
will allow plans to accommodate any benefit changes in their required documents
(including the Annual Notice of Change, Evidence of Coverage/Member Handbook, and
Summary of Benefits) during the Annual Election Period.
Rate-related PBP corrections to supplemental benefits are permissible during the Center
for Medicare’s annual correction window in September 2016 (see the calendar in this
Call Letter for more information), but only for purposes of adding supplemental benefits
to PBPs. MMPs that elect to correct their PBPs must work with their contract
management team on an appropriate member communication strategy (e.g., addenda or
errata sheets for materials that have already been mailed to members; updates to other
materials for current and prospective members). In addition, there will be no compliance
penalty for a PBP correction provided an MMP meets these conditions.
Any PBP corrections after the Center for Medicare’s annual correction window in
September 2016 will be considered on a case-by-case basis. PBP corrections due to plan
error will be subject to compliance action, regardless of whether they are positive or
negative changes.

215
Past Performance Information and Eligibility for Passive and Opt-in Enrollment
Our policy regarding the use of past performance information is articulated in previous guidance
memoranda, including – most recently – in the February 23, 2015 HPMS memorandum,
“Medicare-Medicaid Plan Annual Requirements and Timeline for CY 2016.” MMPs should refer
to that guidance for additional information regarding the impact of sanctions, treatment of new
legal entities, and eligibility for passive enrollment after effectuation of the three-way contract.

216
Appendix 1 – Contract Year 2017 Guidance for Prescription Drug Plan (PDP) Renewals
and Non-Renewals (Updated)
Prescription Drug Plan (PDP) regions are defined by CMS and consist of one or more entire
states (refer to Appendix 3, Chapter 5, of the Prescription Drug Benefit Manual for a map of the
34 PDP regions). Each PDP sponsor’s Plan Benefit Packages (PBPs) must be offered in at least
one entire region and a PDP sponsor’s PBP cannot be offered in only part of a region. Please
note that PDP bidding rules require PDP sponsors to submit separate bids for each region to be
covered. HPMS only accepts a PDP sponsor’s PBPs to cover one region at a time for individual
market plans (e.g., a PDP sponsor offering a “national” PDP must submit 34 separate PBP bids
in order to cover all PDP regions).
A PDP sponsor may expand the service area of its offerings by submitting additional bids in the
PDP regions the sponsor expects to enter in the following contract year, provided the sponsor
submits a PDP Service Area Expansion (SAE) application and CMS approves that application
and then approves the sponsor’s submitted bids for the new region or regions. For more
information about the application process, refer to: http://www.cms.gov/Medicare/Prescription-
Drug-Coverage/PrescriptionDrugCovContra/RxContracting_ApplicationGuidance.html.
Conversely, a PDP sponsor may reduce its service area by electing not to submit bids for those
regions from which it expects to withdraw. A PDP sponsor must notify CMS in writing (by
sending an email to [email protected]) of its intent to non-renew one or more plans
under a contract by the first Monday in June (June 6, 2016). The same procedure applies to PDPs
converting contracts from offering both individual and employer products to employer-only
products because the individual plan is being non-renewed. However, even absent written
notification to CMS, a PDP sponsor’s failure to submit a timely bid to CMS constitutes a
voluntary non-renewal of the plan by the sponsor. (Note that PDP sponsors reducing their service
areas must provide notice of their action to affected beneficiaries consistent with regulatory
requirements, CMS’ PDP Eligibility, Enrollment, and Disenrollment Guidance, Chapter 3 of the
Prescription Drug Benefit Manual and annual summer CMS non-renewal and service area
reduction guidance.)
Each renewal/non-renewal option available to PDP sponsors for CY 2017 is summarized below
and defined in Appendix 2. These are the same options that existed in CY 2016. All but one of
these actions can be effectuated by PDP sponsors in the HPMS Plan Crosswalk.
Please note, Medicare Advantage Organizations should reference Chapter 4, Chapter 16a, and
Chapter 16b of the Medicare Managed Care Manual for Contract Year 2017 guidance on
renewals and non-renewals.

217
1. New Plan Added
A PDP sponsor may create a new PBP for the following contract year with no link to a PBP it
offers in the current contract year in the HPMS Plan Crosswalk. In this situation, beneficiaries
electing to enroll in the new PBP must complete enrollment requests, and the PDP sponsor
offering the PBP must submit enrollment transactions to MARx. No beneficiary notice is
required in this case beyond receipt of the Evidence of Coverage (EOC), and other documents as
required by current CMS guidance, following enrollment.
2. Renewal Plan
A PDP sponsor may continue to offer a current PBP that retains all of the same service area for
the following year. The renewing plan must retain the same PBP ID number and benefit design
(basic or enhanced alternative) as in the previous contract year in the HPMS Plan Crosswalk.
Current enrollees are not required to make an enrollment election to remain enrolled in the
renewal PBP, and the sponsor will not submit enrollment transactions to MARx for current
enrollees. New enrollees must complete enrollment requests, and the sponsor will submit
enrollment transactions to MARx for those new enrollees. Current enrollees of a renewed PBP
must receive a standard Annual Notice of Change (ANOC) notifying them of any changes to the
renewing plan.
3. Consolidated Renewal Plan
PDP sponsors are permitted to merge two or more entire PBPs offered in the current contract
year into a single renewal plan in the HPMS Plan Crosswalk. A PDP sponsor may not divide a
current PBP among more than one PBP for the following contract year. A PDP sponsor
consolidating two or more entire PBPs must make certain that the consolidated renewal PBP ID
is the same as one of the original consolidating PBP IDs. This is particularly important with
respect to minimizing beneficiary confusion when a plan consolidation affects a large number of
enrollees. When consolidating two existing PBPs into a single renewal PBP, it is permissible for
the single renewal PBP to result in a change from:
A basic benefit design (meaning either defined standard, actuarially equivalent standard, or
basic alternative benefit designs) to another basic benefit design;
An enhanced alternative benefit design to a basic benefit design; or
An enhanced alternative benefit design to another enhanced alternative benefit design.
Current enrollees of a plan or plans being consolidated into a single renewal plan will not be
required to take any enrollment action, and the sponsor will not submit enrollment transactions to
MARx for those current members, although it may need to submit updated 4Rx data to CMS for
the current enrollees affected by the consolidation. New enrollees must complete enrollment
requests, and the sponsor will submit enrollment transactions to MARx for those new enrollees.

218
Current enrollees of a consolidated renewal plan must receive a standard ANOC.
CMS will no longer approve bids that include a PBP that would change a basic plan to an EA
plan because of the potential for beneficiary confusion and disruption, as noted above, absent a
compelling reason in CMS’s determination, such as a sponsor that is under a consolidation plan.
4. Renewal Plan with a Service Area Expansion (“800 Series” EGWPs only).
A PDP sponsor offering an 800 series EGWP PBP in the current contract year may expand its
EGWP service area to include additional PDP regions for the following contract year through the
Part D application process. In order for currently enrolled beneficiaries to remain in the renewed
PBP, the sponsor must retain the same PBP ID number for the following contract year.
Current enrollees will not be required to take any enrollment action, and the sponsor will not
submit enrollment transactions to MARx for those current enrollees. New enrollees must
complete enrollment requests, and the sponsor will submit enrollment transactions to MARx for
those new enrollees. Current enrollees of a renewed PBP with a SAE must receive a standard
ANOC notifying them of any changes to the renewing plan.
5. Terminated Plan (Non-Renewal)
A PDP sponsor may elect to terminate a current PBP for the following contract year and must
notify CMS in writing (by sending an email to [email protected]) by June 6, 2016.
CMS expects the sponsor to crosswalk the affected enrollees into the most comparable plan,
which includes the sponsor’s basic plan if that is the only plan available. However, as stated in
the CY 2015 Call Letter, CMS reminds sponsors that we do not intend to approve bids under
which a PDP sponsor would propose to non-renew its current basic plan in a PDP region, thus
disenrolling all the plan’s current members at the end of the year, and offer a brand new basic
plan during the upcoming benefit year. In a situation where enrollees are crosswalked to a
comparable plan, the sponsor will not submit disenrollment transactions to MARx for affected
enrollees. When a sponsor terminates a PBP, plan enrollees must make a new election for their
Medicare coverage in the following contract year. To the extent that a current enrollee of a
terminated PBP elects to enroll in another plan offered by the current or another PDP sponsor –
or, alternatively, elects to enroll in an MA plan – he/she must complete an enrollment request,
and the enrolling organization or sponsor must submit enrollment transactions to MARx so that
those individuals are enrolled. Enrollees of terminated PBPs will be sent a model termination
notice that includes notification of a special election period, as well as information about
alternative options.
6. Consolidated Plans Under a Parent Organization
For purposes of ensuring compliance with transition requirements following an acquisition or
merger under our significant differences policy, or to make plan transitions following a novation,

219
CMS may elect to allow the merger of two or more entire PBPs offered under different contracts
(the contracts may be offered by the same legal entity or represent different legal entities). PDP
sponsors must complete this renewal option by submitting a crosswalk exception request through
HPMS. CMS will provide detailed technical instructions for completing a crosswalk exception
request through HPMS in forthcoming guidance. Requests will be reviewed and, if approved, the
action will be completed on behalf of the requesting PDP. Current enrollees of a plan or plans
being merged across contracts in this manner will not be required to take any enrollment action,
and the sponsor will not submit enrollment transactions to MARx for those current members,
although it may need to submit updated 4Rx data to CMS for the current enrollees affected by
the consolidation. New enrollees must complete enrollment requests, and the sponsor will
submit enrollment transactions to MARx for those new enrollees. Current enrollees of a
consolidated renewal plan must receive a special notice along with a standard ANOC.

220
Appendix 2 – Contract Year 2017 Guidance for Prescription Drug Plan (PDP) Renewals
and Non-Renewals Table
Activity Definitions HPMS Plan
Crosswalk
Systems
Enrollment
Activities
Enrollment
Procedures
Beneficiary
Notifications
1 New Plan
(PBP) Added
A PDP
sponsor
creates a
new PBP.
HPMS Plan
Crosswalk
Definition:
A new plan
added for
2017 that is
not linked to a
2016 plan.
HPMS Plan
Crosswalk
Designation:
New Plan
The PDP
sponsor must
submit
enrollment
transactions.
New
enrollees
must
complete an
enrollment
request.
None.
2 Renewal Plan A PDP
sponsor
continues to
offer a CY
2016 PBP in
CY
2017. The
same PBP
ID number
and benefit
design (basic
or enhanced
alternative)
must be
retained in
order for all
current
enrollees to
remain in the
same PBP in
CY 2016.
HPMS Plan
Crosswalk
Definition:
A 2017 plan
that links to a
2016 plan and
retains all of
its plan
service area
from 2016.
The 2017 plan
must retain the
same plan ID
as the 2016
plan.
HPMS Plan
Crosswalk
Designation:
Renewal Plan
The renewal
PBP ID must
remain the
same so that
current
enrollees will
remain in the
same PBP ID.
The PDP
sponsor does
not submit
enrollment
transactions for
current
enrollees.
No
enrollment
request for
current
enrollees to
remain
enrolled in
the renewal
PBP in
2017. New
enrollees
must
complete
enrollment
request.
Current
enrollees are
sent a
standard
ANOC.

221
Activity Definitions HPMS Plan
Crosswalk
Systems
Enrollment
Activities
Enrollment
Procedures
Beneficiary
Notifications
3 Consolidated
Renewal Plan
A PDP
sponsor
combines
two or more
PBPs
offered in
CY 2016
into a single
renewal PBP
for CY
2017. The
PDPsponsor
must
designate
which of the
renewal PBP
IDs will be
retained in
CY 2016
after
consolida-
tion.
HPMS
Plan
Crosswalk
Definition:
Two or
more 2016
plans that
merge into
one 2017
plan. The
2017 plan
ID must be
the same as
one of the
consolidatin
g 2016 plan
IDs.
HPMS Plan
Crosswalk
Designation:
Consolidated
Renewal Plan
The PDP
sponsor’s
designated
renewal PBP
ID must
remain the
same so that
CMS can
consolidate
current
enrollees into
the designated
renewal PBP
ID. The PDP
sponsor does
not submit
enrollment
transactions for
current
enrollees.
Sponsors may
need to submit
updated 4RX
data for
enrollees
affected by the
consolidation.
No
enrollment
request for
current
enrollees to
remain
enrolled in
the renewal
PBP in
2017.
Current
enrollees are
sent a
standard
ANOC.

222
Activity Definitions HPMS Plan
Crosswalk
Systems
Enrollment
Activities
Enrollment
Procedures
Beneficiary
Notifications
4 Renewal Plan
with an SAE
(applicable
only to
employer/
union group
waiver plans)
A PDP
sponsor
continues to
offer an 800
series CY
2016
prescription
drug PBP in
CY 2017
and expands
its EGWP
service area
to include
additional
regions. The
PDP sponsor
must retain
the same
PBP ID
number in
order for all
current
enrollees to
remain in the
same PBP in
CY 2017.
HPMS
Plan
Crosswalk
Definition:
A 2017
800-series
plan that
links to a
2016 800-
series plan
and retains
all of its
plan
service area
from 2016,
but also
adds one or
more new
regions.
The 2017
plan must
retain the
same plan
ID as the
2016 plan.
HPMS
Plan
Crosswalk
Designa-
tion:
Renewal Plan
with an SAE
The renewal
PBP ID must
remain the
same so that
current
enrollees in the
current service
area will
remain in the
same PBP ID.
The PDP
sponsor does
not submit
enrollment
transaction for
current
enrollees.
No
enrollment
request for
current
enrollees to
remain
enrolled in
the renewal
PBP in
2017. New
enrollees
must
complete
enrollment
request.
Current
enrollees are
sent a
standard
ANOC.

223
Activity Definitions HPMS Plan
Crosswalk
Systems
Enrollment
Activities
Enrollment
Procedures
Beneficiary
Notifications
5 Terminated
Plan (Non-
Renewal)
A PDP
sponsor
terminated
the offering
of a 2016
PBP.
HPMS
Plan
Crosswalk
Definition:
A 2016 plan
that is no
longer offered
in 2017.
HPMS Plan
Crosswalk
Designation:
Terminated
Plan
CMS
expects the
sponsor to
crosswalk
the affected
enrollees
into the
most
comparable
plan. The
PDP
sponsor
does not
submit
disenrollme
nt
transactions.
If the
terminated
enrollee elects
to enroll in
another PBP
with the same
or another PDP
sponsor or
MAO, the
enrolling PDP
sponsor or
organization
must submit
enrollment
transactions to
enroll the
terminated
enrollees.
Terminated
enrollees
must
complete an
enrollment
request if
they choose
to enroll in
another
PBP, even a
PBP
offered by
the same
PDP
sponsor.
Terminated
enrollees are
sent a CMS
model
termination
notice
including
SEP
information
and receive a
written
description
of options for
obtaining
prescription
drug
coverage in
the service
area.

224
6 Consolidated
Plans across
Contracts
under the
Same Parent
Organization
A parent
organization
merges two
or more
whole PBPs
under
different
contracts
(the
contracts
may be the
same legal
entity or
represent
different
legal
entities) as a
result of a
merger,
acquisition,
or novation.
A PDP
sponsor
cannot
complete
this renewal
option in the
HPMS Plan
Crosswalk.
Exceptions
Crosswalk
Request:
Sponsors
must submit
an
exceptions
request to
CMS, which
will
complete
the
crosswalk
on behalf of
the sponsor
HPMS
Plan
Crosswalk
Designa-
tion:
The plan
being
crosswalk-
ed must be
marked as a
terminated
plan in the
HPMS
crosswalk.
The remaining
2017 plan
must be active
and contain
the applicable
service area
from the
terminated
plan being
crosswalked.
PDP
sponsors
cannot
complete
this renewal
option in the
HPMS Plan
Crosswalk.
CMS will
effectuate
this renewal
option and
HPMS will
record the
merger of
two or more
whole PBPs.
The PDP
sponsor does
not submit
enrollment
transactions
for current
enrollees.
Sponsors
may need to
submit
updated
4RX data for
enrollees
affected by
the
consolidatio
n.
No
enrollment
election for
current
enrollees to
remain
enrolled in
the renewal
PBP in
2017. New
enrollees
must
complete
enrollment
request.
Current
enrollees are
sent a
standard
ANOC.

225

226
Appendix 3 – Improvement Measures (Part C & D)
Part
C or D Measure Measure Type Weight
Improvement
Measure
C Breast Cancer Screening Process Measure 1 Yes
C Colorectal Cancer Screening Process Measure 1 Yes
C Annual Flu Vaccine Process Measure 1 Yes
C Improving or Maintaining Physical
Health
Outcome Measure 3 No
C Improving or Maintaining Mental
Health
Outcome Measure 3 No
C Monitoring Physical Activity Process Measure 1 Yes
C Adult BMI Assessment Process Measure 1 Yes
C Special Needs Plan (SNP) Care
Management
Process Measure 1 Yes
C Care for Older Adults – Medication
Review
Process Measure 1 Yes
C Care for Older Adults – Functional
Status Assessment
Process Measure 1 Yes
C Care for Older Adults – Pain
Assessment
Process Measure 1 Yes
C Osteoporosis Management in
Women who had a Fracture
Process Measure 1 Yes
C Diabetes Care – Eye Exam Process Measure 1 Yes
C Diabetes Care – Kidney Disease
Monitoring
Process Measure 1 Yes
C Diabetes Care – Blood Sugar
Controlled
Intermediate Outcome
Measure
3 Yes
C Controlling Blood Pressure Intermediate Outcome
Measure
3 Yes
C Rheumatoid Arthritis Management Process Measure 1 Yes
C Reducing the Risk of Falling Process Measure 1 Yes
C Plan All-Cause Readmissions Outcome Measure 3 Yes
C Getting Needed Care Patients’ Experience and
Complaints Measure
1.5 Yes
C Getting Appointments and Care
Quickly
Patients’ Experience and
Complaints Measure
1.5 Yes

227
Part
C or D Measure Measure Type Weight
Improvement
Measure
C Customer Service Patients’ Experience and
Complaints Measure
1.5 Yes
C Rating of Health Care Quality Patients’ Experience and
Complaints Measure
1.5 Yes
C Rating of Health Plan Patients’ Experience and
Complaints Measure
1.5 Yes
C Care Coordination Patients’ Experience and
Complaints Measure
1.5 Yes
C Complaints about the Health Plan Patients’ Experience and
Complaints Measure
1.5 Yes
C Members Choosing to Leave the
Plan
Patients’ Experience and
Complaints Measure
1.5 Yes
C Beneficiary Access and
Performance Problems
Measures Capturing Access 1.5 No
C Health Plan Quality Improvement Improvement Measure 5 No
C Plan Makes Timely Decisions
about Appeals
Measures Capturing Access 1.5 Yes
C Reviewing Appeals Decisions Measures Capturing Access 1.5 Yes
C Call Center – Foreign Language
Interpreter and TTY Availability
Measures Capturing Access 1.5 Yes
D Call Center – Foreign Language
Interpreter and TTY Availability
Measures Capturing Access 1.5 Yes
D Appeals Auto–Forward Measures Capturing Access 1.5 Yes
D Appeals Upheld Measures Capturing Access 1.5 Yes
D Complaints about the Drug Plan Patients’ Experience and
Complaints Measure
1.5 Yes
D Members Choosing to Leave the
Plan
Patients’ Experience and
Complaints Measure
1.5 Yes
D Beneficiary Access and
Performance Problems
Measures Capturing Access 1.5 No
D Drug Plan Quality Improvement Improvement Measure 5 No
D Rating of Drug Plan Patients’ Experience and
Complaints Measure
1.5 Yes
D Getting Needed Prescription Drugs Patients’ Experience and
Complaints Measure
1.5 Yes

228
Part
C or D Measure Measure Type Weight
Improvement
Measure
D MPF Price Accuracy Process Measure 1 No
D Medication Adherence for Diabetes
Medications
Intermediate Outcome
Measure
3 Yes
D Medication Adherence for
Hypertension (RAS antagonists)
Intermediate Outcome
Measure
3 Yes
D Medication Adherence for
Cholesterol (Statins)
Intermediate Outcome
Measure
3 Yes
D MTM Program Completion Rate
for CMR
Process Measure 1 Yes