adults age 18 and older with s om ec l g , no d egr , 2014 · with s om ec l g , no d egr , 2014 m...
TRANSCRIPT

Whitley5,83023%
Adams4,70119.8%
Allen66,26625%
Bartholomew11,38219.2%
Benton1,25919.1% Blackford
1,80118.5%
Boone7,44517.3%
Brown2,62021.7%
Carroll3,24421.3%
Cass5,95720.5%
Clark21,90025.5%
Clay3,87418.9%
Clinton4,76219.5%
Crawford1,57719.4%
Daviess3,60915.8%
Dearborn8,88023.5%
Decatur3,61718.5%
DeKalb7,09322.5%
Delaware29,68631.4%
Dubois5,60317.7%
Elkhart29,69320.7%
Fayette3,81520.7%
Floyd14,27724.7%
Fountain2,83321.7%
Franklin3,21018.6%
Fulton3,24520.7%
Gibson6,10523.8%
Grant14,27626.1%
Greene5,55221.9%
Hamilton39,34519.2%
Hancock12,41723.4%
Harrison6,59721.9%
Hendricks25,62823.1%
Henry7,81720.1%
Howard15,98625.1%
Huntington6,54623%
Jackson6,17518.9%
Jasper5,50722%
Jay3,02819.3%
Jefferson6,23724.6%
Jennings4,18519.9%
Johnson23,36121.9%
Knox7,09623.7%
Kosciusko12,63621.7%
LaGrange3,83315.4%
Lake92,08524.9%
LaPorte20,01723.1%
Lawrence7,24120.4%
Madison23,79523.5%
Marion160,91223.3%
Marshall7,09220.4%
Martin1,50819.2%
Miami6,63423.4%
Monroe39,46733.4%
Montgomery6,73423%
Morgan11,73722.4%
Newton2,17920%
Noble7,79122.1%
Ohio839
17.5%
Orange3,06120.5%
Owen3,71722.4%
Parke2,98422.1%
Perry2,73817.9%
Pike1,90419.2%
Porter29,29323.1%
Posey4,85124.7%
Pulaski2,33023.2%
Putnam7,78925.8%
Randolph4,13721.1%
Ripley4,02418.8%
Rush2,39518.3%
St. Joseph49,60824.5%
Shelby7,01020.7%
Spencer3,40321.1%
Starke3,34918.9%
Steuben6,48424.3%
Sullivan3,51620.9%
Tippecanoe44,98431.8% Tipton
2,78222.8%
Union1,23421.9%
Vanderburgh38,22027.1%
Vermillion2,85423.2%
Vigo23,35827.3%
Wabash5,67622.5%
Warren1,23218.8%
Warrick10,99924.3%
Washington3,61417.1%
Wayne12,20323.1%
Wells4,70922.4%
White4,07621.8%
Scott3,80620.8%
Switzerland1,44918.5%
Adults Age 18 and Older with Some College, No Degree, 2014
Map produced by the Indiana Business Research Center, using the American Community Survey 2010-2014 five-year estimates that were released by the U.S. Census Bureau in December 2015.
Number of Adults839 - 3,000 (18)3,001 - 6,000 (30)6,001 - 10,000 (18)10,001 - 160,912 (26)Economic Growth Region
Labels also show the percent of adults in this age group with some college, but no degree.

Whitley4,92221.6%
Adams3,85418.5%
Allen53,16823%
Bartholomew9,86518.7%
Benton1,10918.7% Blackford
1,52017.3%
Boone6,22116%
Brown2,37821.4%
Carroll2,89721%
Cass5,23420.2%
Clark18,43324%
Clay3,24917.7%
Clinton3,90118.1%
Crawford1,28517.6%
Daviess2,96114.9%
Dearborn7,41921.9%
Decatur3,13817.9%
DeKalb6,16422%
Delaware15,44621.7%
Dubois4,61716.1%
Elkhart24,44319.5%
Fayette3,35820.1%
Floyd11,54622.6%
Fountain2,49121.3%
Franklin2,73417.6%
Fulton2,91820.7%
Gibson5,25823%
Grant9,07920.1%
Greene4,69620.6%
Hamilton33,70118.1%
Hancock10,83022.7%
Harrison5,91721.8%
Hendricks21,76921.9%
Henry6,64319.1%
Howard13,63524%
Huntington5,03820.3%
Jackson5,22317.9%
Jasper4,34219.8%
Jay2,46517.7%
Jefferson4,82922.1%
Jennings3,62319.4%
Johnson19,25720.4%
Knox4,81319.3%
Kosciusko10,30720.2%
LaGrange3,22815.1%
Lake76,42923.5%
LaPorte17,02322.1%
Lawrence6,16319.3%
Madison19,85522.2%
Marion126,57121.2%
Marshall5,97519.3%
Martin1,22817.2%
Miami5,86823.3%
Monroe13,99718%
Montgomery5,28120.8%
Morgan9,90221.1%
Newton1,90119.4%
Noble6,63021.3%
Ohio70216%
Orange2,53018.9%
Owen3,26421.9%
Parke2,53320.9%
Perry2,35917.2%
Pike1,64718.3%
Porter23,37621%
Posey4,01622.9%
Pulaski1,98922%
Putnam5,33221.6%
Randolph3,47819.7%
Ripley3,29017.1%
Rush2,04517.4%
St. Joseph36,85321.4%
Scott3,24220%
Shelby5,99119.8%
Spencer2,81019.3%
Starke2,99819%
Steuben4,97121.6%
Sullivan2,95419.7%
Tippecanoe19,93920.4% Tipton
2,35421.3%
Union1,06721.3%
Vanderburgh28,87423.9%
Vermillion2,36821.3%
Vigo15,46622.2%
Wabash4,34119.8%
Warren1,11318.8%
Warrick9,32422.8%
Washington3,04416.1%
Wayne9,47820.4%
Wells3,91320.9%
White3,50120.7%
Switzerland1,24517.7%
Adults Age 25 and Older with Some College, No Degree, 2014
Map produced by the Indiana Business Research Center, using the American Community Survey 2010-2014 five-year estimates that were released by the U.S. Census Bureau in December 2015.
Number of Adults702 - 3,000 (27)3,001 - 6,000 (33)6,001 - 10,000 (11)10,001 - 126,571 (21)Economic Growth Region
Labels also show the percent of adults in this age group with some college, but no degree.
Whitley90835%
Adams847
29.7%
Allen13,09838.5%
Bartholomew1,51723.9%
Benton150
22.8% Blackford281
29.5%
Boone1,22429.9%
Brown242
24.7%
Carroll347
23.4%
Cass723
22.7%
Clark3,46737.4%
Clay625
28.7%
Clinton861
30.4%
Crawford29236%
Daviess64822%
Dearborn1,46137.4%
Decatur479
23.5%
DeKalb929
26.4%
Delaware14,24060.7%
Dubois986
33.5%
Elkhart5,25029.6%
Fayette457
25.5%
Floyd2,73141.3%
Fountain342
25.1%
Franklin476
27.6%
Fulton327
21.3%
Gibson847
30.3%
Grant5,19755.5%
Greene856
34.1%
Hamilton5,64430.2%
Hancock1,58730.1%
Harrison680
22.1%
Hendricks3,85933%
Henry1,17428.8%
Howard2,35134.5%
Huntington1,50840.5%
Jackson952
27.5%
Jasper1,16537.4%
Jay563
31.9%
Jefferson1,40840.9%
Jennings562
23.1%
Johnson4,10433.6%
Knox2,28345.7%
Kosciusko2,32932.2%
LaGrange605
17.2%Lake
15,65635.5%
LaPorte2,99431.4%
Lawrence1,07831.3%
Madison3,94033.3%
Marion34,34137%
Marshall1,11728.7%
Martin280
37.9%
Miami766
24.2%
Monroe25,47063.1%
Montgomery1,45337.3%
Morgan1,83533.5%
Newton27825%
Noble1,16128.8%
Ohio137
31.8%
Orange531
34.1%
Owen453
26.8%
Parke45132%
Perry379
23.4%
Pike257
27.7%
Porter5,91738.1%
Posey835
39.7%
Pulaski341
33.1%
Putnam2,45744.9%
Randolph659
33.8%
Ripley734
33.5%
Rush350
25.5%
St. Joseph12,75542.3%
Shelby1,01929.1%
Spencer593
38.8%
Starke351
18.1%
Steuben1,51340.9%
Sullivan562
30.4%
Tippecanoe25,04557.5% Tipton
42837.4%
Union167
26.8%
Vanderburgh9,34646.3%
Vermillion486
40.5%
Vigo7,89249.4%
Wabash1,33540.6%
Warren119
19.5%
Warrick1,67538.5%
Washington570
25.5%
Wayne2,72543.3%
Wells796
35.5%White57533%
Scott564
27.8%Switzerland
20424.5%
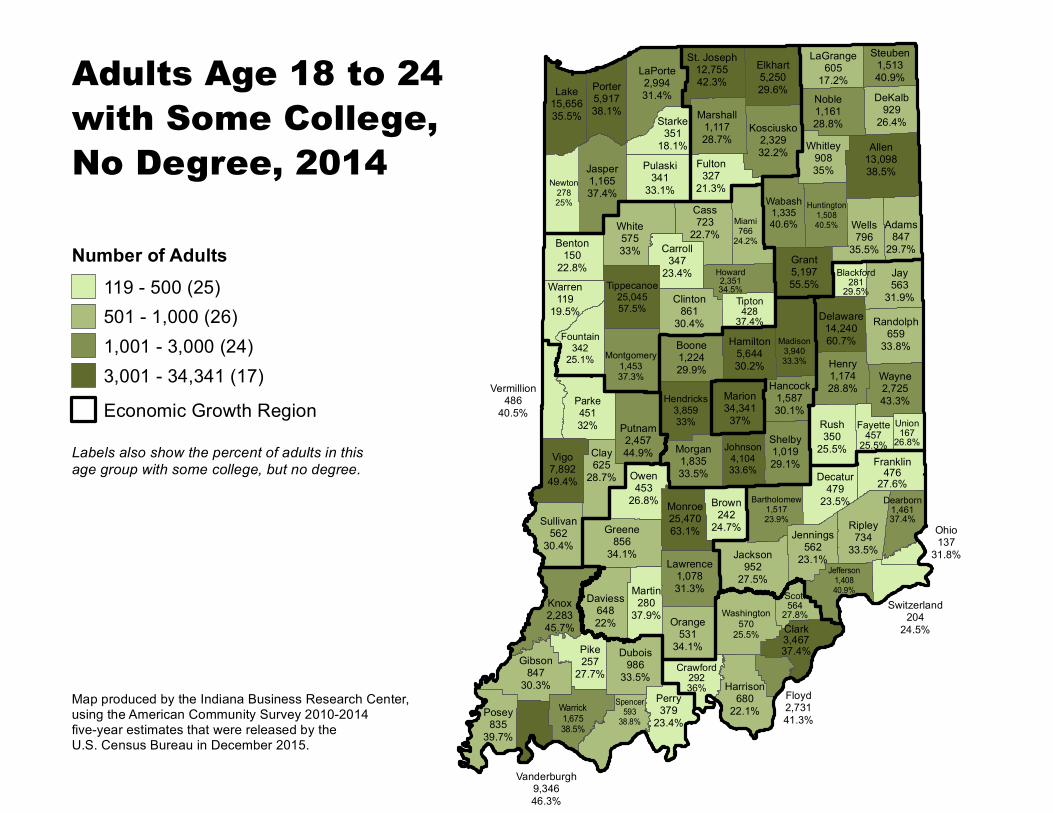
Adults Age 18 to 24 with Some College, No Degree, 2014
Map produced by the Indiana Business Research Center, using the American Community Survey 2010-2014 five-year estimates that were released by the U.S. Census Bureau in December 2015.
Number of Adults119 - 500 (25)501 - 1,000 (26)1,001 - 3,000 (24)3,001 - 34,341 (17)Economic Growth Region
Labels also show the percent of adults in this age group with some college, but no degree.

Whitley4,15923.4%
Adams3,21420.1%
Allen44,11523.7%
Bartholomew7,96619.2%
Benton90920% Blackford
1,23719.3%
Boone5,04415.9%
Brown1,84922.7%
Carroll2,37422.9%
Cass4,24221.3%
Clark15,80725.6%
Clay2,61818.6%
Clinton3,12618.8%
Crawford1,00817.9%
Daviess2,32115.1%
Dearborn6,02122.4%
Decatur2,58819%
DeKalb5,36824.3%
Delaware12,76424%
Dubois3,82417.2%
Elkhart20,37420.3%
Fayette2,76022.1%
Floyd9,52123.3%
Fountain2,09424.4%
Franklin2,27718.8%
Fulton2,22321%
Gibson4,48625.6%
Grant7,13721.3%
Greene3,93222.9%
Hamilton27,85817.6%
Hancock9,12524%
Harrison5,03523.7%
Hendricks18,05822.1%
Henry5,40720.5%
Howard11,00225.8%
Huntington4,11421.5%
Jackson4,41119.4%
Jasper3,64821.5%
Jay2,00119.1%
Jefferson3,87422.8%
Jennings3,09220.9%
Johnson16,08221.3%
Knox3,74019.9%
Kosciusko8,66421.6%
LaGrange2,48414.8%
Lake64,17524.9%
LaPorte14,36823.8%
Lawrence5,12521.2%
Madison16,16123.7%
Marion107,07721.6%
Marshall5,01421.2%
Martin1,05219.3%
Miami4,77824.3%
Monroe11,82918.8%
Montgomery4,12321.4%
Morgan8,32622.4%
Newton1,60821.7%
Noble5,41921.9%
Ohio55517%
Orange2,08120.6%
Owen2,74423.8%
Parke2,14223.1%
Perry1,88317.7%
Pike1,35720.2%
Porter19,79322.2%
Posey3,22223.6%
Pulaski1,58823.7%
Putnam4,47223.1%
Randolph2,91822.3%
Ripley2,63318%
Rush1,59718.1%
St. Joseph30,85922.8%
Shelby5,10521.5%
Spencer2,29020.6%
Starke2,49920.8%
Steuben3,97222.6%
Sullivan2,51021.4%
Tippecanoe17,05221.3% Tipton
1,96224.1%
Union869
22.6%
Vanderburgh23,76325.2%
Vermillion1,90323%
Vigo13,04723.9%
Wabash3,44721.7%
Warren895
20.3%
Warrick7,67724%
Washington2,49916.8%
Wayne7,99122.9%
Wells3,07721.8%
White2,78222.1%
Switzerland988
18.3%Scott2,69921.3%
Adults Age 25 to 64 with Some College, No Degree, 2014
Map produced by the Indiana Business Research Center, using the American Community Survey 2010-2014 five-year estimates that were released by the U.S. Census Bureau in December 2015.
Number of Adults555 - 3,000 (37)3,001 - 6,000 (28)6,001 - 10,000 (9)10,001 - 107,077 (18)Economic Growth Region
Labels also show the percent of adults in this age group with some college, but no degree.