adult social care in england: overview - nao.org.uk · pdf filethis report has been prepared...
TRANSCRIPT
Adult social care in England: overview
Department of Health Department for Communities and Local Government
Reportby the Comptroller and Auditor General
HC 1102 SESSION 2013-14 13 MARCH 2014

The National Audit Office scrutinises public spending for Parliament and is independent of government. The Comptroller and Auditor General (C&AG), Amyas Morse, is an Officer of the House of Commons and leads the NAO, which employs some 860 staff. The C&AG certifies the accounts of all government departments and many other public sector bodies. He has statutory authority to examine and report to Parliament on whether departments and the bodies they fund have used their resources efficiently, effectively, and with economy. Our studies evaluate the value for money of public spending, nationally and locally. Our recommendations and reports on good practice help government improve public services, and our work led to audited savings of almost £1.2 billion in 2012.
Our vision is to help the nation spend wisely.
Our public audit perspective helps Parliament hold government to account and improve public services.

Report by the Comptroller and Auditor General
Ordered by the House of Commons to be printed on 12 March 2014
This report has been prepared under Section 6 of the National Audit Act 1983 for presentation to the House of Commons in accordance with Section 9 of the Act
Amyas Morse Comptroller and Auditor General National Audit Office
11 March 2014
Department of HealthDepartment for Communities and Local Government
HC 1102 | £10.00
Adult social care in England: overview
Our study reviews the current state of adult social care in England locally and nationally, and outlines the remaining challenges.
© National Audit Office 2014
The text of this document may be reproduced free of charge in any format or medium providing that it is reproduced accurately and not in a misleading context.
The material must be acknowledged as National Audit Office copyright and the document title specified. Where third party material has been identified, permission from the respective copyright holder must be sought.
Links to external websites were valid at the time of publication of this report. The National Audit Office is not responsible for the future validity of the links.
10352 03/14 NAO

The National Audit Office study team consisted of: James Beveridge, Alex Burfitt, Akash Burrun, Sarah Drysdale, Lauren Harris, Lydia Lobo, Rose Martin, David Medina, Matt Moreau, Andy Serlin, Sarah Taylor and Andy Whittingham, under the direction of Angela Hands and Aileen Murphie.
This report can be found on the National Audit Office website at www.nao.org.uk
For further information about the National Audit Office please contact:
National Audit Office Press Office 157–197 Buckingham Palace Road Victoria London SW1W 9SP
Tel: 020 7798 7400
Enquiries: www.nao.org.uk/contact-us
Website: www.nao.org.uk
Twitter: @NAOorguk
Contents
Key facts 4
Summary 5
Part OneRising care needs and falling state spending 12
Part TwoPressures and system redesign 35
Appendix OneOur audit approach 51
Appendix TwoOur evidence base 53
Appendix ThreeGlossary 55

4 Key facts Adult social care in England: overview
Key facts
152 unitary and upper-tier local authorities in England responsible for adult social services
5.4 million unpaid informal carers, 2011
1.5 million people working in adult care, 2012
£10 billion estimated spending on care and support by self-funders, 2010-11
£55 billion estimated value of informal care and support, 2011
87 per cent of adults live in local authorities that set their eligibility threshold to meet substantial or critical needs only
£19bn 9% 64%spending on adult social care managed by local authorities, 2012-13 (includes £2.5 billion user contributions)
of adults in England limited ‘a lot’ in day-to-day activities by illness, disability or old age, 2011
of local authority adult social care service users very or extremely satisfied overall with their care and support, 2012-13

Adult social care in England: overview Summary 5
Summary
1 Social care (‘care’) comprises personal care and practical support for adults with physical disabilities, learning disabilities, or physical or mental illnesses, as well as support for their carers. The government’s objectives are to enhance adults’ quality of life, delay and reduce the need for care, ensure positive care experiences, and safeguard adults from harm.
2 Publicly funded care makes up only a minority of the total value of care, and this proportion is decreasing. Most care and support is provided unpaid by family, friends and neighbours (informal care), while many adults pay for some or all of their formal care services. Local authorities provide a range of universal and preventative services, many of which are available without assessment of need. Local authorities typically only pay for individual packages of care for adults assessed as having high needs and limited means. They commission most care from the private and voluntary sectors, with home care and care homes the most common services.
3 Legislative and other changes are increasing adults’ role in shaping their own care and support, diversifying the types of care available and changing how adults access it. In 2012, the Department of Health announced new legislation, the Care Bill. The Department designed the bill to rationalise local authorities’ obligations, to introduce new duties based on individual wellbeing and to mitigate pressures on self-funders and carers. From April 2015, the bill will change how local authorities assess and fund adults’ care needs. From April 2016, it will introduce a limit on an individual’s contributions to meeting their eligible care needs. The government wants to continue reducing public spending while maintaining spending on care and support, and improving outcomes for adults, as need for care rises.
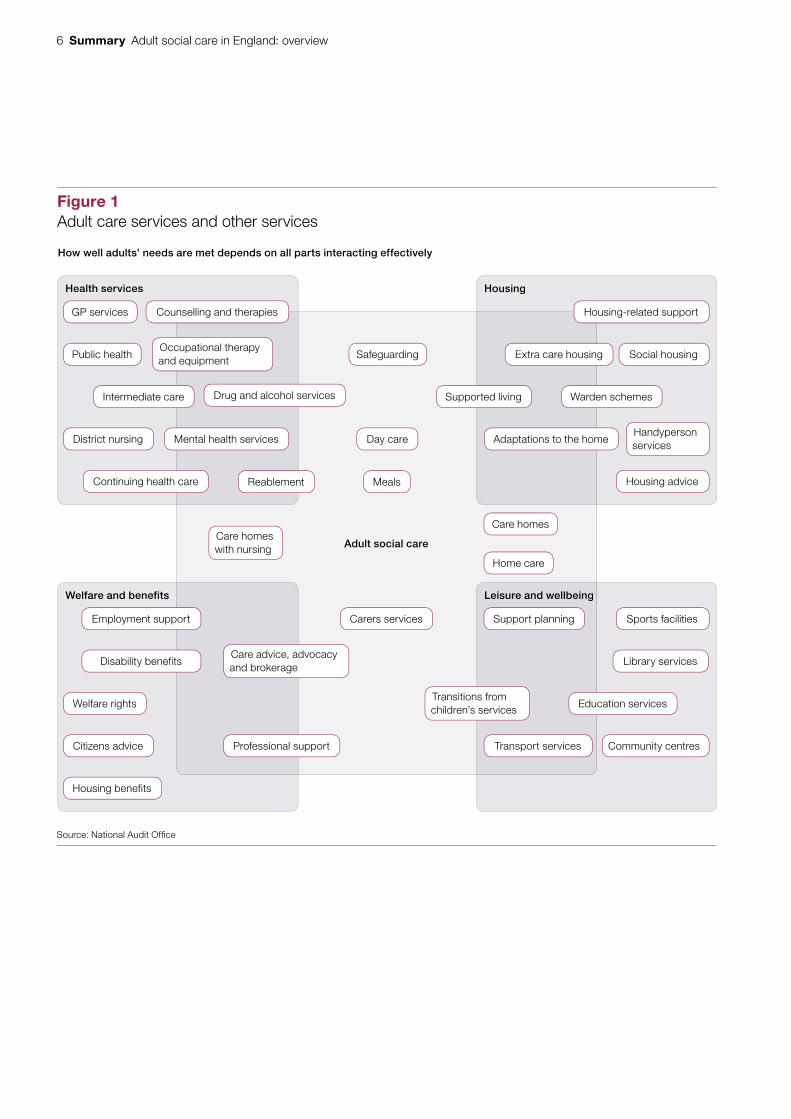
4 Adults’ care needs are often multiple and interrelated with other needs. Adult social care is therefore part of a complex system of related public services and forms of support (Figure 1 overleaf). How well services meet adults’ needs depends on all parts of the system working together. For example, good medical management of long-term conditions can prevent a person developing care needs, and welfare benefits can maintain independent living.
5 This report, the first in a series on adult care, describes the care system. It highlights the main risks and challenges as the system is changed radically, some of which will be covered in more detail in future years. We provide a glossary of care-related terms, used throughout this report, in Appendix Three.
6 Summary Adult social care in England: overview
Adult social care
Health services
Welfare and benefits Leisure and wellbeing
Housing
Figure 1Adult care services and other services
Counselling and therapies Housing-related support
Intermediate care
Welfare rights Education services
Supported living Warden schemes
Occupational therapy and equipment
Drug and alcohol services
Continuing health care
Housing benefits
Housing adviceReablement
District nursing
Citizens advice Professional support Transport services Community centres
Adaptations to the homeMental health services Day care
Meals
Source: National Audit Offi ce
How well adults’ needs are met depends on all parts interacting effectively
GP services
Employment support Carers services Sports facilitiesSupport planning
Public health
Disability benefits Library servicesCare advice, advocacy and brokerage
Extra care housing Social housingSafeguarding
Handyperson services
Transitions from children’s services
Care homesCare homes with nursing
Home care

Adult social care in England: overview Summary 7
Key findings
Rising care needs and falling state spending
6 Adults’ care needs are rising. Adults with long-term and multiple health conditions and disabilities are living longer. The number of adults aged 85 or over, the age group most likely to need care, is rising faster than the population as a whole (paragraphs 1.22 and 1.23).
7 Local social, economic and demographic factors lead to variation in the level of need in each local authority: some of these factors are outside a local authority’s control or can only be influenced long term. Our analysis showed that these factors explained most variation in how much local authorities spend on care for older adults and some of the variation for younger adults. Need for care is also linked to an adult’s health, the quality of their housing and the effectiveness of other support and services, in preventing needs developing. Local authorities’ spend on care depends on local need but also on local policies and priorities, as well as the local authority’s commissioning and financial management skills (paragraphs 1.24, 1.35 and 1.36).
8 Local authorities’ total spending on adult social care fell 8 per cent in real terms between 2010-11 and 2012-13 and is projected to continue falling. Older adults have experienced the greatest reduction, 12 per cent in real terms. Younger adults with learning disabilities have experienced the smallest reduction of 0.2 per cent in real terms. Our analysis shows that around three-quarters of the fall in spending since April 2010 has been achieved by reducing the amount of care provided, which could reflect the effective prevention of need for care, changes in eligibility criteria or reductions in service. The rest has been achieved through paying less to provide care, for example through reducing back-office costs, or through changes to and improvement in the commissioning of care. Central government’s intention in the 2010 spending review was to protect spending on adult social care but funding is not ring-fenced (paragraphs 1.28, 1.29, 1.37 to 1.39).
9 Local authorities have reduced the total amount of state-funded care provided through individual packages of care every year since 2008-09. They have developed service models that aim to prevent the need for long-term care. Local authorities report that they are relying on early action and prevention to reduce demand further. Over the last ten years, many local authorities have raised the eligibility level they set for individual packages of care. Eighty-five per cent of adults over 65 now live in local authorities which arrange services for adults with substantial or critical needs only. One per cent of adults live in authorities which provide for critical needs only. People who receive local authority arranged services may still pay in part or full for those services, depending on the outcome of a means test (paragraphs 1.10, 1.11, 2.3 and 2.4).

8 Summary Adult social care in England: overview
Increasing pressures on other parts of the care and health systems
10 Rising needs, reducing local authority spending, and reductions in benefits may be putting unsustainable pressure on informal carers and acute health services. Between 2001 and 2011, the number of informal carers (unpaid family, friends and neighbours) rose faster than population growth across all regions except London. Informal carers are doing more hours of care per week and are, on average, getting older. Delayed discharges into, and avoidable admissions from, social care settings place increased demand on acute services. Over the last three years delayed discharges due to social care have decreased but remain a significant problem for some hospital trusts. National and local government do not know whether the care and health systems can continue to absorb these cumulative pressures, and how long they can carry on doing so (paragraphs 1.6, 1.7, 2.22 and 2.24).
11 Local authorities are saving money by changing contractual agreements, paying lower fees, negotiating bulk purchase discounts and commissioning less care. Rates that local authorities pay for care home places for older people rose less than providers’ costs between 2009-10 and 2013-14. Some providers have reported problems meeting all but users’ basic needs and investing in staff skills and training. Others have been able to sustain their businesses at local authority rates. Around half of local authority directors of adult social care report that cost-saving is putting pressure on the financial sustainability of some private sector providers. Some providers charge self-funders higher fees than local authorities, sometimes for a premium service and sometimes to subsidise the lower fees that authorities pay. Since Southern Cross got into financial difficulties in 2011 there have been no significant business failures in social care. The Department of Health currently monitors the financial sustainability of the five largest providers. Subject to legislation the Care Quality Commission will, from April 2015, monitor the financial sustainability of the most difficult-to-replace providers (paragraphs 2.11 to 2.14).
Improvements to the care system are needed
12 Adults do not always transfer between health and social care services in a timely and efficient way. For example, one-fifth of emergency admissions to hospital are for existing conditions that primary, community or social care could manage. Research has shown that greater spending on social care is related to lower delayed hospital discharge rates and fewer emergency admissions. In previous reports we have shown there is scope to improve value for money by integrating services and programmes in end-of-life care and for adults with autism, dementia and rheumatoid arthritis (paragraph 2.22 and Figure 15).
13 All local authorities need to set the outcomes that care services aim to achieve. Contracts for services that local authorities commission from the private and voluntary sectors are frequently time or task based rather than outcomes based. They generally do not incentivise providers to rehabilitate or improve user independence. Moving to outcomes-based commissioning is not easy and some local authorities need to develop their commissioning skills and capacity (paragraphs 2.5, 2.9 and 2.29).

Adult social care in England: overview Summary 9
14 Safeguarding vulnerable adults from abuse and neglect remains a major risk throughout the sector. Between 2010-11 and 2012-13, safeguarding referrals recorded by local authorities rose by 13 per cent. Though this increase may reflect increased awareness of abuse, it may reflect overstretched resources and pressure within the system. In 2012-13, 36 per cent of safeguarding referrals were about alleged abuses by social care or health workers. In the same year, the Care Quality Commission reported that service providers were more aware of their safeguarding responsibilities and procedures. It is developing guidance to improve providers’ understanding of safeguarding (paragraphs 2.31, 2.35 and 2.36).
Changes intended to mitigate pressures and improve outcomes will be challenging to achieve
15 Local authorities and local health bodies are trialling and evaluating how to integrate health and social care, both to improve outcomes and save money. The Department of Health and the Department for Communities and Local Government recognise that there are significant challenges to integration and have established the £3.8 billion Better Care Fund, the Integrated Care Pioneers initiative and the Public Service Transformation Network. Currently, there is limited evidence for successful ways to integrate, and the timeframe for local areas to plan how to spend their fund allocations is tight (paragraphs 2.23 to 2.25).
16 The Department for Communities and Local Government is expecting local authorities to meet financial pressures through local efficiency initiatives and transforming services. As part of the spending round process, the Department modelled local government spending pressures and potential efficiency savings for 2015-16. The Department of Health and the Department for Communities and Local Government support local authorities to improve efficiency through part-funding sector-led improvement initiatives. Through the Better Care Fund, funding is being transferred from the health sector into pooled budgets managed jointly by local authorities and clinical commissioning groups, to enable integration and reduce pressures. The Department for Communities and Local Government acknowledges that local authorities have to make tough choices and anticipates that health and social care integration will contribute to meeting the pressures (paragraphs 1.32, 1.33, 2.24, 2.39 to 2.42, and Figure 18).
17 Local health commissioners are concerned about the impact of taking £2 billion from NHS acute care for the Better Care Fund. The Department of Health and the Department for Communities and Local Government do not know how quickly savings can be achieved across health and care through transforming services and greater integration. The Department of Health does not know how quickly the NHS can manage its funding reduction (paragraph 2.24).

10 Summary Adult social care in England: overview
18 The Care Bill is a significant change for local authorities, and difficult to plan for, because of short timescales, and a lack of information and evidence on what works in some areas. For example, the Care Bill is expected to increase local authorities’ responsibilities towards self-funders, about whom they currently have little information. There are gaps in data and a lack of evidence for what works in integration and reablement (intensive support after an injury or illness to help an adult regain skills, confidence and independence). This makes it difficult to plan care services or assess the impact of policy and spending decisions. Key stakeholders are satisfied with the amount of ongoing, regular engagement with the Department of Health as the care system changes (paragraphs 1.4, 1.7, 1.11, 2.5, 2.7, 2.10, 2.13, 2.15, 2.18, 2.23, 2.28, 2.29 and 2.36).
19 The cumulative impact of changes across the public sector could shift costs and demand between services without reducing overall public spending. The Department for Communities and Local Government and the Department of Health are working closely together to understand financial and service pressures in social care. However, not all other departments with local service policy responsibilities are fully contributing to understanding the cumulative implications of the changes to and reduced spending on health and social care, welfare and related local services. For example, changes to benefits for adults with disabilities and their carers will put further strain on care users’ ability to pay for their own care and for informal carers to provide support (paragraph 1.32).
Monitoring arrangements are changing
20 Central government is relying on new arrangements for monitoring, regulating and improving care services. These new arrangements are not fully established currently at pilot stage, or voluntary. Not all local authorities have enabled external scrutiny through publishing adult care performance information. The Care Quality Commission is moving to a risk-based inspection regime and is developing more ways to use available data to identify risks (paragraphs 2.29, 2.31 to 2.33, and 2.37 to 2.39).

Adult social care in England: overview Summary 11
Conclusion
21 Pressures on the care system are increasing. Providing adequate adult social care poses a significant public service challenge and there are no easy answers. People are living longer and some have long-term and complex health conditions that require managing through care. Need for care is rising while public spending is falling, and there is unmet need. Departments do not know if we are approaching the limits of the capacity of the system to continue to absorb these pressures.
22 The adult care sector is changing significantly and rapidly, and the Care Bill will introduce further major changes. Sector stakeholders support the Department of Health’s initiatives to improve outcomes for adults and reduce costs through efficiency measures and transforming services. The Better Care Fund is intended to enable local areas to begin integrating the care and health systems. However, compared with healthcare, evidence is weaker on which ways of commissioning and providing services are the most cost-effective. This hampers local authorities’ ability to improve care.
23 Current monitoring tells us that most eligible adults have satisfactory or better experiences of statutory social care services. However, new monitoring and improvement arrangements are not fully established. They rely on insufficient information across some user groups and providers. As the changes take effect, central and local government risk not knowing if: services are deteriorating to unacceptable levels; needs are not being met; care quality is improving; and public funding is achieving value for money.

12 Part One Adult social care in England: overview
Part One
Rising care needs and falling state spending
1.1 In this part, we describe adults’ care needs, how needs vary and why, projections of need, how care meets adults’ needs, and how care is paid for. We highlight the pressures resulting from rising need and falling state spending on care.
Nature of care needs
1.2 Adults with care needs cannot perform activities of daily living such as washing, taking medicine, paperwork, cooking and shopping without support. Care needs may be short-lived, long-term or permanent, and are difficult to plan for. Needs can arise from disability from birth; physical injury; mental health problems; health conditions such as dementia; discharge from hospital, perhaps after a fall or fracture; or ill-health of an informal carer. Social care and health care needs can overlap and be difficult to distinguish and define. For example, an individual may be in good health but have care needs.
Social care policy and legislation
1.3 Central government sets national policy, local authorities’ statutory duties and the amount of central funding for authorities, most of which is not ring-fenced. Local authorities set local policies and priorities and decide how to spend central government and locally raised funding across local services. They choose how to best meet local needs and commission adult social care services. Current policy aims to personalise care services, adapting them to a person’s particular needs and wishes. For example, arranging home care appointments at times that suit users.
1.4 In 2012, the Department of Health announced new legislation, the Care Bill, designed to simplify obligations on local authorities and to introduce new social care duties based on individual wellbeing. The bill builds on the Department’s 2010 policy objectives and is based on recommendations from reviews of the legal framework, and of the funding system for care and support. From 2015-16, the Care Bill will change how authorities assess and fund the needs of adults and their carers, including a limit on people’s contributions to the cost of meeting their assessed care needs.
Adult social care in England: overview Part One 13
Providing care
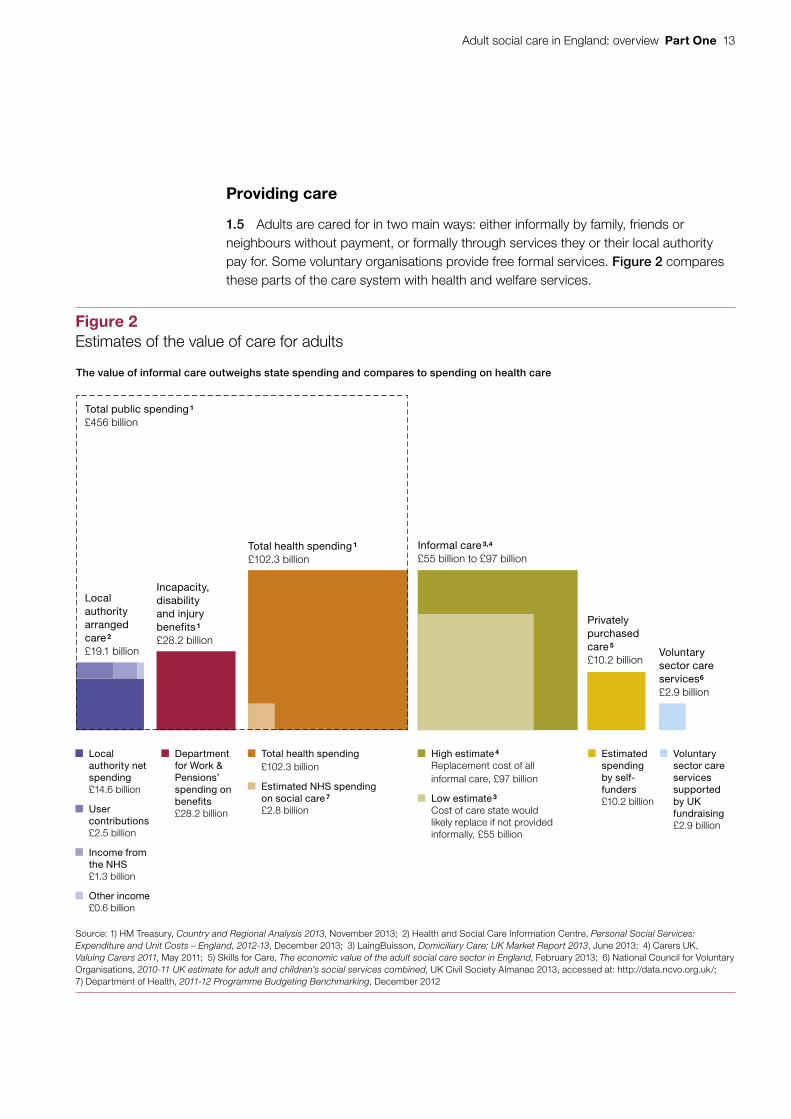
1.5 Adults are cared for in two main ways: either informally by family, friends or neighbours without payment, or formally through services they or their local authority pay for. Some voluntary organisations provide free formal services. Figure 2 compares these parts of the care system with health and welfare services.
Figure 2Estimates of the value of care for adults
The value of informal care outweighs state spending and compares to spending on health care
Total public spending 1
£456 billion
Privately purchased care 5
£10.2 billion
Informal care 3,4 £55 billion to £97 billion
Total health spending 1
£102.3 billion
Incapacity, disability and injury benefits 1
£28.2 billion
Local authority arranged care 2
£19.1 billion Voluntary sector care services6
£2.9 billion
Local authority net spending £14.6 billion
User contributions £2.5 billion
Income from the NHS £1.3 billion
Other income£0.6 billion
Department for Work & Pensions’ spending on benefits£28.2 billion
Total health spending£102.3 billion
Estimated NHS spending on social care 7
£2.8 billion
High estimate 4 Replacement cost of all informal care, £97 billion
Low estimate 3 Cost of care state would likely replace if not provided informally, £55 billion
Estimated spending by self-funders£10.2 billion
Voluntary sector care services supported by UK fundraising£2.9 billion
Source: 1) HM Treasury, Country and Regional Analysis 2013, November 2013; 2) Health and Social Care Information Centre, Personal Social Services: Expenditure and Unit Costs – England, 2012-13, December 2013; 3) LaingBuisson, Domiciliary Care: UK Market Report 2013, June 2013; 4) Carers UK, Valuing Carers 2011, May 2011; 5) Skills for Care, The economic value of the adult social care sector in England, February 2013; 6) National Council for Voluntary Organisations, 2010-11 UK estimate for adult and children’s social services combined, UK Civil Society Almanac 2013, accessed at: http://data.ncvo.org.uk/; 7) Department of Health, 2011-12 Programme Budgeting Benchmarking, December 2012

14 Part One Adult social care in England: overview
Informal care
1.6 Most care is provided informally by unpaid family, friends and neighbours who provide personal care, practical help, and coordinate formal services. Estimates of the value of informal care range up to nearly £100 billion per year. The number of informal carers is increasing: up 11 per cent between 2001 and 2011, from 4.9 million to 5.4 million, a faster rate of increase than population growth in all regions except London. Carers are also providing care more intensively: in 2011, 36 per cent of carers provided 20 hours of care or more per week, up from 31 per cent in 2001. Over one in five carers are now aged 65 or over and this proportion is increasing.
1.7 Local authorities support informal carers with advice and information. Authorities offer respite care to those who provide substantial hours of care regularly. They also offer payments for carers to buy services themselves such as counselling, leisure classes or help with housework. The number of informal carers receiving any of these local authority carer services, following an assessment, fell from 387,000 in 2009-10 to 354,000 in 2012-13, representing approximately one in fifteen carers. In May 2013, 545,000 carers (around 10 per cent of all carers) received Carer’s Allowance, which is paid to carers on low incomes who provide at least 35 hours of care per week. The Care Bill is expected to create a duty on local authorities to undertake a carer’s assessment and to compel local authorities to meet carers’ eligible needs for support.
Formal care
1.8 Formal care services are paid for by the local authority or by the user. We describe the full range of services in Appendix Three. The most common services are:
• Home care Helps with personal tasks in an adult’s own home, or with shopping and leisure activities.
• Day care Gives opportunities to socialise away from the home and respite for informal carers.
• Care homes Give 24-hour support in a residential setting, which may include nursing care from qualified nurses.
In this section, we describe the various ways that formal care services are arranged and paid for by self-funders, local authorities, the NHS and the voluntary sector.

Adult social care in England: overview Part One 15
Self-funded care
1.9 People who do not request or qualify for local authority funded care can buy care directly from care providers. In 2010-11, privately bought care without local authority involvement amounted to £10.2 billion. In 2010, an estimated 339,000 adults bought their own social care. Of these, 170,000 purchased a place in a care home, representing 45 per cent of care home places. The extent of self-funding varies considerably across England (Figure 3).
53%
55%
50%
37%
43%
40%
39%
38%
22%
Figure 3Proportion of care home residents who pay for their own care, 2012
There are more self-funded residents in care homes in the south than the north
Source: LaingBuisson, Care of Elderly People: UK Market Survey 2012-13, January 2013
20% to 30%
30% to 40%
40% to 50%
50% to 60%

16 Part One Adult social care in England: overview
Local authority arranged care services
1.10 In 2012-13, local authorities provided or commissioned £19 billion worth of individual packages of care and universal care services. Of this, local authorities paid for 77 per cent, service users contributed 13 per cent and 10 per cent came mainly from the NHS. Over the last four years, the number of adults receiving individual packages of state-funded services has fallen (Figure 4). However, data on preventative and universal services are poor, making it difficult to assess the scale of change in these services, and therefore the impact on informal carers and self-funders. Between 2001 and 2011 the level of informal caring increased. Market data suggest that the level of self-funding may have also increased in recent years. This may be increasing the need for local authority support for informal carers and self-funders.
Figure 4Adults receiving local authority social care services, 2005-06 to 2012-13
Number of users (million)
The number of adults receiving state-funded care fell from around 1.8 million in 2008-09 to around 1.3 million in 2012-13
Source: National Audit Office analysis of Health and Social Care Information Centre data, RAP 2005-06 to 2012-13
2005-06 2007-08 2009-10 2012-13
2.0
1.8
1.6
1.4
1.2
1.0
0.8
0.6
0.4
0.2
0.0
Number of adults aged:
65 and over 1.23 1.23 1.22 1.22 1.15 1.06 0.99 0.90
18 to 64 other 0.02 0.02 0.02 0.02 0.02 0.02 0.02 0.01
18 to 64 with a learning disability 0.12 0.12 0.13 0.13 0.13 0.13 0.13 0.13
18 to 64 with a mental health problem 0.17 0.19 0.19 0.20 0.20 0.17 0.15 0.13
18 to 64 with a physical or sensory disability 0.21 0.21 0.22 0.22 0.21 0.19 0.17 0.16
2011-122010-112008-092006-07

Adult social care in England: overview Part One 17
1.11 Local authorities use a common framework of four bands to determine eligibility for individual packages of services: critical, substantial, moderate or low needs. Local authorities currently can select which band they set. In the adult population 87 per cent, and 85 per cent of those aged 65 and over, live in local authorities that only provide care services to those with substantial needs or higher. Of all adults, 1 per cent (495,000) live in the three local authorities that restrict access to care services to those with critical needs. The Care Bill is expected to lead to a common threshold equivalent to the current ‘substantial’ across all authorities.
1.12 Over two-thirds of adults receiving care through local authorities are aged 65 and over (Figure 4). Similar numbers of younger users aged 18 to 64 have a physical disability, learning disability or mental health problem. The majority of users in each group receive non-residential care in their own home or community. However, the proportion supported in care homes is much higher for older adults and adults with learning disabilities.
Voluntary sector care
1.13 The voluntary sector provides a significant amount of care. In 2010-11, the voluntary sector spent £2.9 billion from its own fundraising on care and provided a further £6.2 billion of care commissioned mainly by local authorities. This represents nearly a quarter of voluntary sector activity.
NHS spending on social care
1.14 The NHS spends a small part of its £95.6 billion budget on social care services. Where someone who is not in hospital has been assessed as having a ‘primary health need’ for care, the NHS will arrange and fund their care, whether in a care home or their own home. The number of adults deemed eligible more than doubled to 59,000 between March 2006 and March 2013. The NHS may also fund care from a registered nurse in a care home, or may commission joint packages of care with a local authority. In 2007, the Department of Health introduced a national framework to clarify the circumstances under which the NHS, local authorities or users pay for care. However, the distinction is often not clear and can result in costly deliberation and sometimes legal disputes.
Care workforce
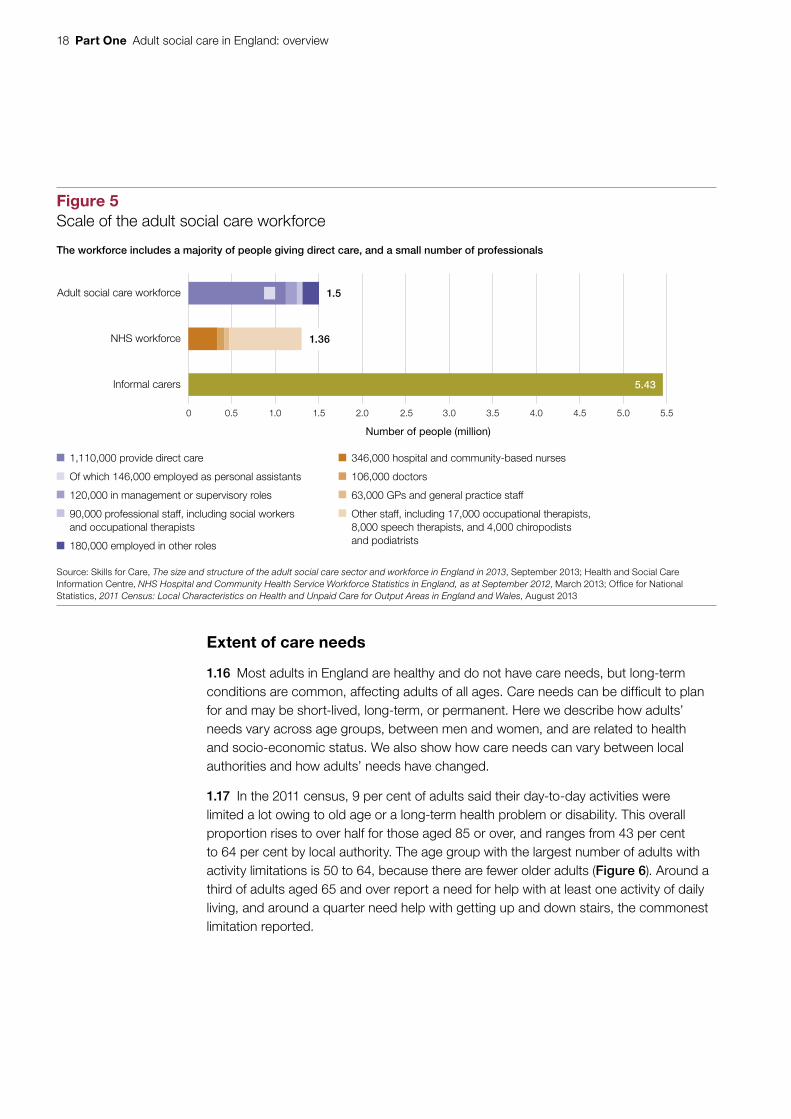
1.15 There are 1.5 million people working in the adult social care sector, of which 74 per cent provide care directly to service users (Figure 5 overleaf).
18 Part One Adult social care in England: overview
Extent of care needs
1.16 Most adults in England are healthy and do not have care needs, but long-term conditions are common, affecting adults of all ages. Care needs can be difficult to plan for and may be short-lived, long-term, or permanent. Here we describe how adults’ needs vary across age groups, between men and women, and are related to health and socio-economic status. We also show how care needs can vary between local authorities and how adults’ needs have changed.
1.17 In the 2011 census, 9 per cent of adults said their day-to-day activities were limited a lot owing to old age or a long-term health problem or disability. This overall proportion rises to over half for those aged 85 or over, and ranges from 43 per cent to 64 per cent by local authority. The age group with the largest number of adults with activity limitations is 50 to 64, because there are fewer older adults (Figure 6). Around a third of adults aged 65 and over report a need for help with at least one activity of daily living, and around a quarter need help with getting up and down stairs, the commonest limitation reported.
5.43
1,110,000 provide direct care
Of which 146,000 employed as personal assistants
120,000 in management or supervisory roles
90,000 professional staff, including social workers and occupational therapists
180,000 employed in other roles
Figure 5Scale of the adult social care workforce
The workforce includes a majority of people giving direct care, and a small number of professionals
Source: Skills for Care, The size and structure of the adult social care sector and workforce in England in 2013, September 2013; Health and Social Care Information Centre, NHS Hospital and Community Health Service Workforce Statistics in England, as at September 2012, March 2013; Office for National Statistics, 2011 Census: Local Characteristics on Health and Unpaid Care for Output Areas in England and Wales, August 2013
1.5Adult social care workforce
1.36NHS workforce
Informal carers
0 0.5 1.0 1.5 2.0 2.5 3.0 3.5 4.0 4.5 5.0 5.5
346,000 hospital and community-based nurses
106,000 doctors
63,000 GPs and general practice staff
Other staff, including 17,000 occupational therapists, 8,000 speech therapists, and 4,000 chiropodists and podiatrists
Number of people (million)

Adult social care in England: overview Part One 19
Figure 6Number and proportion of adults whose day-to-day activities are limited a lot by a health problem or disability by age
Number of people (million) Proportion of age group (%)
The proportion of adults with major activity limitations rises with age, but the number peaks in middle age
Source: National Audit Office analysis of Office for National Statistics 2011 census data
16 to 24 25 to 34 35 to 49 50 to 64 65 to 74 75 to 84 85 or over
0.2
0.4
0.6
0.8
1.0
1.2
0.0
10
20
30
40
50
60
0
Number
Proportion of age group
1.18 Older women have higher needs than older men of the same age, are more likely to have unmet care needs, and outnumber men among informal carers. Of women aged 65 and over, 36 per cent report a need for help with at least one activity of daily living, compared with 27 per cent of men. Women make up 67 per cent of local authority service users aged 65 or over, compared with 50 per cent of users aged 18 to 64.
1.19 For younger adults, care needs can lead to wider difficulties, for example maintaining employment. Over half of adults with a long-term condition say their health is a barrier to the type or amount of work they can do.

20 Part One Adult social care in England: overview
1.20 The prevalence of most long-term conditions and disabilities, including dementia, diabetes and cancer, rises with age, deprivation and social isolation. Mental health problems increase with decreasing socio-economic status. Compared to professionals, unskilled adults have a 60 per cent higher prevalence of long-term conditions. Social isolation is associated with the prevalence of long-term conditions. Those who live alone are less likely to seek medical attention for developing health concerns. Living alone is more common among older women than older men and rises with age. By 80 to 84 years, around half of people live alone.
1.21 Adults can have avoidable care needs due to inappropriate housing, but it can be difficult to ensure housing meets complex needs. Adults may have difficulty finding suitable accommodation near informal carers and adaptations can be costly. Local authorities we spoke to had considered the link between housing and care in their residential planning but also told us about shortages of appropriate local accommodation.
Trends and projections of care needs
1.22 Life expectancy has risen faster than disability-free life expectancy. The proportion and number of older adults who report that their daily activities are limited have increased since 1991 (Figure 7). The overall adult population grew 10 per cent between 2001 and 2011, and the number of adults aged over 65 grew 11 per cent, but the number aged 85 or over rose 24 per cent in the same period. More adults are living with multiple conditions, making needs more complex and difficult to meet.
1.23 Better healthcare means that more ill and disabled children reach adulthood and more ill and disabled young adults live longer. However, this means that need for social care for younger adults is rising. The number of adults with learning disabilities is difficult to project. Some factors will increase the incidence and complexity of learning disabilities in adults; for example, improved survival of children with severe learning disabilities and improved care for people with brain injuries. Other factors will reduce incidence; for example, improved prenatal screening for Down’s syndrome.

Adult social care in England: overview Part One 21
Figure 7Trend in activity limitation by age
More adults in the oldest age groups are limited in their daily activities
2011 (%) 5 6 12 23 39 61 83
2001 (%) 6 8 12 26 41 56 71
1991 (%) 3 4 07 20 32 46 62
Note
1 In 2011 this is the proportion of those limited both ‘a little’ and ‘a lot’. Exact question wording varies.
Source: National Audit Office analysis of Office for National Statistics 1991, 2001 and 2011 census data
90
80
70
60
50
40
30
20
10
0
16 to 24 25 to 34 35 to 49 50 to 64 65 to 74 75 to 84 85 or over
Percentage

22 Part One Adult social care in England: overview
Geographical variation in needs
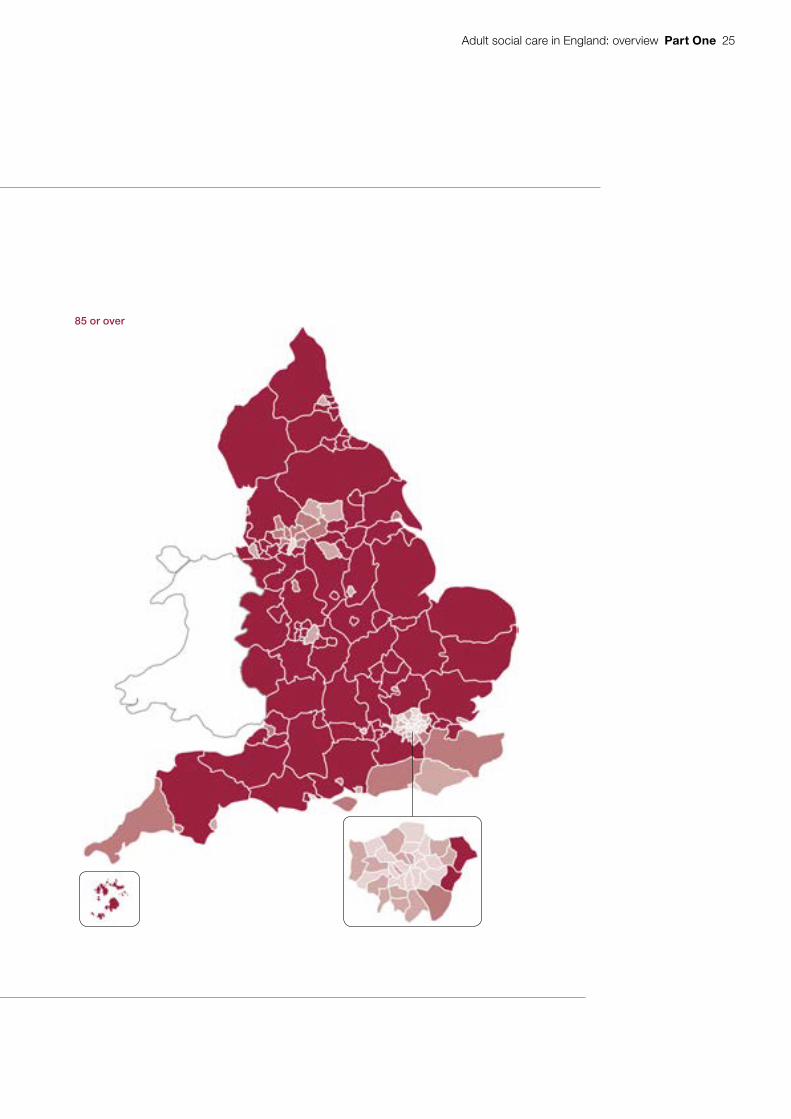
1.24 A number of factors combine to create a different level of need in each local authority (Figure 8). The proportion of adults aged 65 or over varies from 8 per cent in Tower Hamlets to 33 per cent in Dorset. The proportions of adults with a learning disability, long-term illness or physical disability are less varied geographically. The population overall is ageing. However, London boroughs have seen falls or only small rises in the proportions of their residents in older age groups, while these proportions have risen in most other local authorities (Figure 9 on pages 24 to 25).
Demand for local authority commissioned social care
1.25 Demand for formal care varies according to need, availability of informal care, quality of formal care services, voluntary provision, health, housing and other services, plus individuals’ wealth, choices and expectations. These factors combine to create different levels of demand in each local authority area. Social care needs may not translate into demand for care services, for example when people are reluctant to seek formal help. Local authorities, the NHS and voluntary sector partners combine data with user and community views to produce joint strategic needs assessments of local health and care needs. The assessments inform and guide the health, wellbeing and social care services they commission.
1.26 One measure of demand, the number of local authority contacts from new clients, has fallen from a high in 2010-11 (Figure 10 on page 26). However, the number of new clients subsequently assessed or receiving services has fallen faster. This could reflect authorities diverting approaches to the voluntary sector, providing preventative services or tightening eligibility.

Adult social care in England: overview Part One 23
Figure 8The proportion of adults with major limitations on their day-to-day activities varies by region
Need is highest in the North East and North West
Note
1 Adults aged 16 or over.
Source: National Audit Offi ce analysis of Offi ce for National Statistics 2011 census data
4.8% to 7.5%
7.6% to 8.6%
8.7% to 9.7%
9.8% to 11.2%
11.3% to 16.8%

24 Part One Adult social care in England: overview
Figure 9Change in proportion of adults aged 65 and 85 or over by local authority, 2001 to 2011
The proportion of adults aged 85 or over increased in most local authorities, but many local authorities have seen falls in the proportion of their populations aged 65 or over, owing to larger increases in the number of younger adults between censuses
Note
1 Proportions are of adults aged 18 and over.
Source: National Audit Office analysis of Office for National Statistics 2001 and 2011 census data
15% to 63.5% increase
5% to 15% increase
Between 5% decrease and 5% increase
5% to 34.8% decrease
65 or over
Adult social care in England: overview Part One 25
Figure 9Change in proportion of adults aged 65 and 85 or over by local authority, 2001 to 2011
The proportion of adults aged 85 or over increased in most local authorities, but many local authorities have seen falls in the proportion of their populations aged 65 or over, owing to larger increases in the number of younger adults between censuses
Note
1 Proportions are of adults aged 18 and over.
Source: National Audit Office analysis of Office for National Statistics 2001 and 2011 census data
85 or over

26 Part One Adult social care in England: overview
Local authority care funding and spending
Funding
1.27 Local authorities are accountable to their local electorates, while central government departments oversee centrally distributed funding. Funding of and accountability for adult social care spending and quality are complex (Figure 11). These arrangements have grown more complicated in response to changes in how care is provided and paid for; for example, the introduction of personal budgets. In addition to funding the Department for Communities and Local Government gives to local authorities, the Department of Health also partly funds care and related services such as housing adaptations, or gives money to other organisations for this. The Department for Work & Pensions provides funding for care and support through benefit payments.
-20
-15
-10
-5
0
5
10
15
20
2007-08 2008-09 2009-10 2010-11 2011-12 2012-13
Figure 10Local authority contacts, assessments and services for new users
Since 2008-09 a smaller proportion of contacts have led to assessments, and fewer assessments have led to services being introduced
Percentage change from 2007-08
Source: National Audit Office analysis of Health and Social Care Information Centre data, Community Care Statistics: Social Services Activity, England, 2007-08 to 2012-13
Number
Contacts 2,065,335 2,041,705 2,115,185 2,159,125 2,086,500 2,076,230
Assessments 660,050 692,645 699,195 660,530 606,790 603,250
New service users 476,830 494,595 491,055 451,080 410,145 403,995

Adult social care in England: overview Part One 27
Loca
l p
opul
atio
n
Fig
ure
11
Fund
ing
and
acco
unta
bilit
y fo
r sp
endi
ng a
nd s
ervi
ces
NH
S
Eng
land
Loca
l au
thor
ities
Acu
te h
ealth
care
pr
ovid
ers
Men
tal h
ealth
trus
ts
Com
mun
ity
heal
thca
re p
rovi
ders
Soc
ial c
are
prov
ider
s Unp
aid
care
Dep
artm
ent f
or
Com
mun
ities
and
Lo
cal G
over
nmen
t
Set
s lo
cal g
over
nmen
t fin
ance
pol
icy,
al
loca
tes
fund
ing
and
is a
ccou
ntab
le fo
r th
e sy
stem
that
pro
vide
s as
sura
nces
that
loca
l au
thor
ities
will
spen
d th
eir
reso
urce
s w
ith
regu
larit
y, p
ropr
iety
an
d va
lue
for
mon
ey
Dep
artm
ent
of H
ealth
Set
s so
cial
car
e po
licy,
sec
ures
fu
ndin
g an
d ac
coun
t to
Par
liam
ent a
nd
the
publ
ic fo
r th
e pe
rfor
man
ce o
f the
sy
stem
as
a w
hole
Par
liam
ent
Sou
rce:
Dep
artm
ent o
f Com
mun
ities
and
Loc
al G
over
nmen
t, Lo
cal a
utho
rity
reve
nue
exp
end
iture
and
fi na
ncin
g in
Eng
land
: 201
2 to
201
3, F
ebru
ary
2014
; HM
Tre
asur
y, C
ount
ry a
nd R
egio
nal A
naly
sis
2013
, N
ovem
ber
201
3; N
HS
Eng
land
, Put
ting
Pat
ient
s Fi
rst:
The
NH
S E
ngla
nd b
usin
ess
pla
n fo
r 20
13/1
4 –
2015
/16,
Ap
ril 2
013;
Hea
lth a
nd S
ocia
l Car
e In
form
atio
n C
entr
e, P
erso
nal S
ocia
l Ser
vice
s: E
xpen
ditu
re
and
Uni
t Cos
ts –
Eng
land
, 201
2-13
, Dec
emb
er 2
013;
Dep
artm
ent o
f Hea
lth, 2
011-
12 P
rogr
amm
e B
udge
ting
Ben
chm
arki
ng, D
ecem
ber
201
2; In
dep
end
ent L
ivin
g Fu
nd, A
nnua
l Rep
ort a
nd A
ccou
nts
2012
-13,
Ju
ne 2
013;
Ski
lls fo
r C
are,
The
eco
nom
ic v
alue
of t
he a
dul
t soc
ial c
are
sect
or in
Eng
land
, Feb
ruar
y 20
13; C
arer
s U
K, V
alui
ng C
arer
s 20
11, M
ay 2
011
So
cial
car
e fo
r ad
ult
s in
volv
es a
co
mp
lex
net
wo
rk o
f ac
cou
nta
bili
ty a
nd
fu
nd
ing
flo
ws
£96
bill
ion
NH
S s
pen
d
Car
e Q
ualit
y C
om
mis
sio
n
Reg
ulat
es a
nd
insp
ects
the
qual
ity o
f ca
re h
omes
and
hom
e ca
re a
genc
ies
Nat
iona
l Ins
titut
e fo
r H
ealth
and
Car
e E
xcel
lenc
e
Dev
elop
s qu
ality
st
anda
rds
and
guid
elin
es fo
r so
cial
ca
re in
Eng
land
£3 b
illio
n N
HS
sp
end
ing
on
soci
al c
are
£18
bill
ion
of c
are
pro
vid
ed in
-hou
se
or c
omm
issi
oned
dire
ct fr
om p
rovi
der
s
£97
bill
ion
cent
ral
gove
rnm
ent
inco
me
£0.3
bill
ion
Ind
epen
den
t Li
ving
Fun
d£2
8 b
illio
n in
cap
acity
, dis
abili
ty a
nd in
jury
ben
efits
£0.3
bill
ion
soci
al c
are
spec
ific
gran
ts
£1 b
illio
n N
HS
tr
ansf
er to
so
cial
car
e to
b
enef
it he
alth
£2.5
bill
ion
user
con
trib
utio
ns
£1.2
bill
ion
dire
ct p
aym
ents
to s
ocia
l car
e us
ers
£27
bill
ion
in c
ounc
il ta
x
£10
bill
ion
self-
fund
ed c
are
Up
to £
97 b
illio
n of
unp
aid
care
p
rovi
ded
Par
liam
ent/
elec
tora
te
G
over
nmen
t dep
artm
ents
Com
mis
sion
ers
Org
anis
atio
ns w
hich
reg
ulat
e an
d se
t sta
ndar
ds
P
rovi
ders
End
use
rs
Dire
ct fu
ndin
g fo
r ad
ult s
ocia
l car
e
I
ndire
ct fu
ndin
g w
ith a
pro
port
ion
bene
fitin
g so
cial
car
e us
ers
Dire
ct a
ccou
ntab
ility
for
deliv
erin
g so
cial
car
e
I
nter
vent
ion
in e
xcep
tiona
l circ
umst
ance
s
Dep
artm
ent
for
Wo
rk &
Pen
sio
ns
Clin
ical
co
mm
issi
onin
g gr
oups
Use
rs
and
care
rs

28 Part One Adult social care in England: overview
1.28 In 2012-13, local authorities received £135 billion in revenue income, primarily from central government (£97 billion), council tax (£27 billion) and service fees and charges (£11 billion). Individual local authorities receive varying proportions of their revenue from these sources. Of the total, £58 billion was allocated through local authorities to schools (£31 billion), benefit recipients (£25 billion), and other specific activities. Authorities decided how to spend the remaining £77 billion across statutory and discretionary services including children’s services, waste services and adult social care. In 2012-13, authorities together spent £17 billion of this income on adult social care, which represented between 12 and 28 per cent of their individual service expenditure.1
1.29 Since the 2010 spending review, local authorities have reduced spending on adult care by more than the Department of Health anticipated. The intention in the 2010 spending review was to protect spending on adult social care within the 26 per cent planned reduction in central government support to local authorities by 2014-15. While spending on adult social care has been protected more than other service areas, except children’s services, local authorities reduced their spending by 7.5 per cent in real terms, on average, between 2010-11 and 2013-14. The Audit Commission has reported that from 2012-13 to 2013-14, planned reductions in spending on adult social care services make up 52 per cent of spending reductions, compared with only 14 per cent of the total reduction from 2010-11 to 2011-12.2 The Commission noted that while average reductions in planned spending on adult social care services are smaller in 2013-14 than in either of the previous years, the aggregate savings from this service area make up an increasing proportion of total spending reductions.
1.30 Central government has since announced further reductions in central funding across all local authorities of 1 per cent in 2014-15 and 10 per cent in 2015-16. Overall, the Department for Communities and Local Government estimates that these reductions will reduce local authority spending power, on average, by 2.9 per cent in 2014-15 and 1.8 per cent in 2015-16, which includes an assumption that local authorities will spend some of their Better Care Fund allocations on social care.3 The impact on individual local authorities’ spending power varies. The Department estimates that authorities with social care responsibilities will see their spending power change by between -5.6 and 0.3 per cent in 2014-15 and between -6.1 and 3.0 per cent in 2015-16.
1 National Audit Office analysis of Department for Communities and Local Government, Revenue outturn service expenditure summary (RSX), 2012-13. Final 2012-13 revenue outturn figures. Total revenue income and spend on social care exclude income from NHS and joint arrangements for social care services but include income from sales, fees and charges (user contributions).
2 Audit Commission analysis of Department for Communities and Local Government local authority budget (RA) data for the financial years 2010-11 to 2013-14, Tough Times 2013, November 2013.
3 Spending power is the measure of overall revenue funding available for local authority services used by the Department for Communities and Local Government, including council tax, locally retained business rates and government grants.

Adult social care in England: overview Part One 29
1.31 The Department for Communities and Local Government negotiates the amount of central government funding for local authorities with HM Treasury and assesses the impact of funding decisions on local services. We have previously reported that the Department’s analysis of local government spending pressures and potential savings during the 2010 spending review was based on incomplete information from some departments with local service policy responsibilities.4 We recommended that the Department for Communities and Local Government work with other departments to evaluate the impact of decisions on local authority finances and services better.
1.32 We examined the Department for Communities and Local Government’s modelling for its 2013 spending round submission. We concluded it was unreliable because it was based on incomplete information from other departments. The Department of Health gave the Department for Communities and Local Government spending and savings information on its policy areas as part of this exercise. The Department for Work & Pensions estimated the extent of new burdens on local authorities resulting from changes to welfare benefits for those with disabilities. However, it did not provide this information to the Department for Communities and Local Government for the 2013 spending round because of uncertainty over the timetable for implementation. The Department for Work & Pensions did not estimate the wider impact of reductions in benefits on recipients’ need for local services, including social care. Instead, the Department of Health made their own estimate of the impact on social care for the purposes of the spending round.
1.33 The Department for Communities and Local Government acknowledges that local authorities will face tough choices to balance their budgets in 2014-15 and 2015-16. The Department expects various measures to help local authorities to meet the reduction in central government funding. The Department anticipates savings through health and social care integration, support for troubled families and reduced EU waste taxes through increased recycling, as well as other efficiency measures. However, performance of the government’s programmes for troubled families so far shows that there are challenges to making immediate savings. There is evidence that the benefits of integration take time to manifest.
4 Comptroller and Auditor General, Financial sustainability of local authorities, Session 2012-13, HC 888, National Audit Office, January 2013, available at: www.nao.org.uk/report/local-services-financial-sustainability-of-local-authorities/

30 Part One Adult social care in England: overview
Current spending
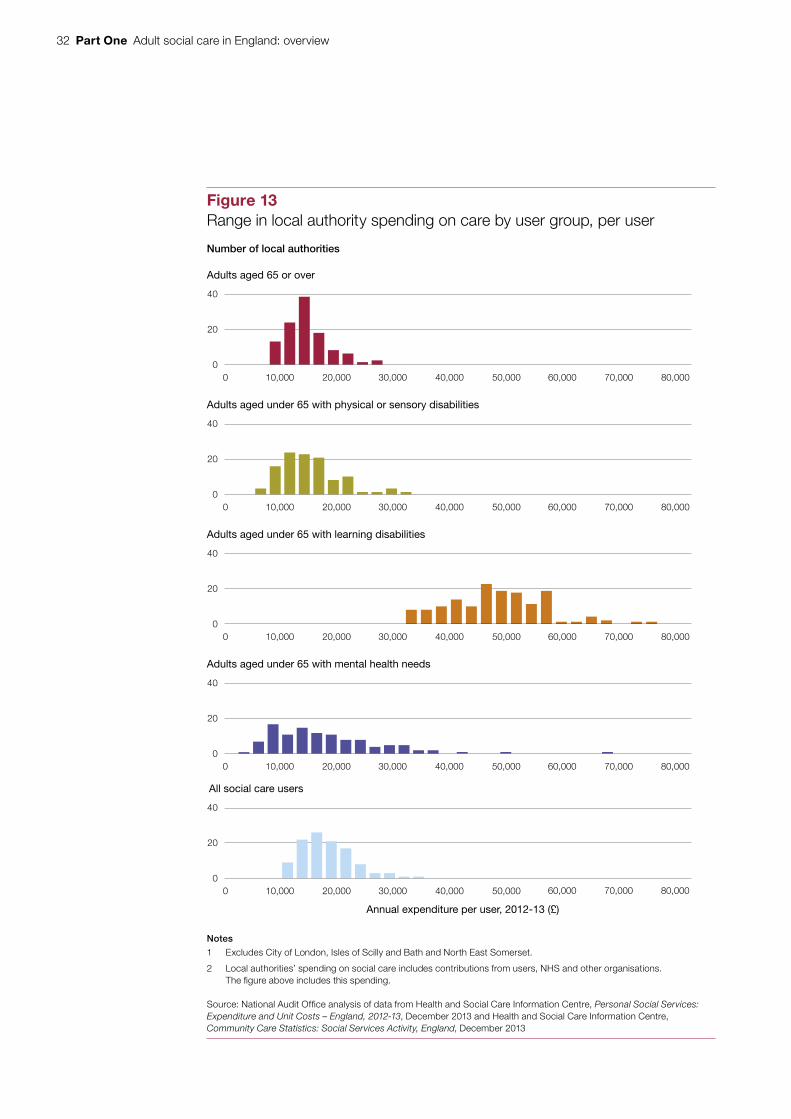
1.34 At 39 per cent, adult social care was the largest area of local authorities’ spending, excluding education, in 2012-13. They spent most on care homes for older adults and adults with learning disabilities (Figure 12). Typically, users with learning disabilities have the most expensive packages of care (Figure 13 on page 32). Seventy-two per cent of local authority care spending was on services commissioned from private sector and voluntary sector providers.
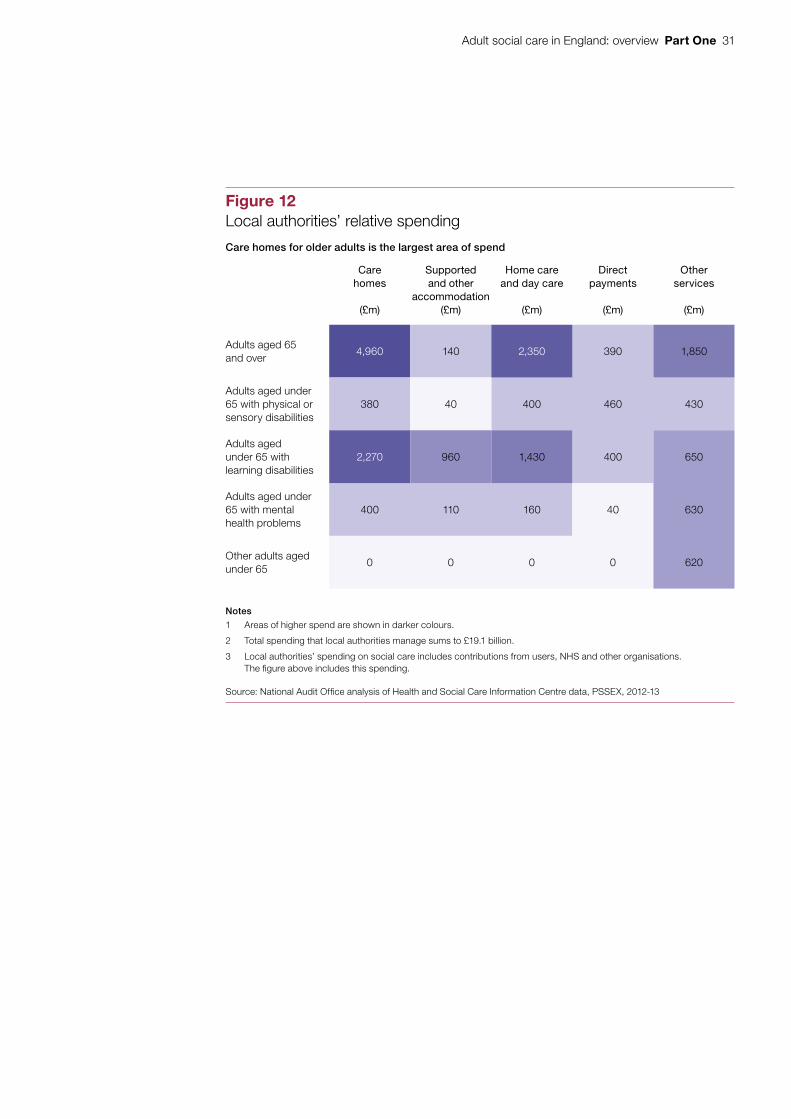
1.35 In 2012-13, local authorities spent between £350 and £640 per year on adult social care for each person in the local authority area. We analysed the factors that affect local authority spending on older adults aged 65 or over. In 2011-12, local area characteristics explained the large majority of differences between authorities, including the:
• cost of providing services;
• proportion of adults claiming Attendance Allowance;
• proportion claiming Pension Credit; and
• age profile of the local population.
1.36 Many of the factors that affect spending per head cannot be managed by local authorities, nor influenced in the timescales over which spending reductions must be made. For mental health services for younger adults aged under 65, we found that local characteristics explain just under half of variation in spending per person. Variations in spending per head on services for younger adults with physical disabilities and learning disabilities cannot be explained as fully. This is likely to reflect a lack of relevant data and the importance of random factors, such as differences in the numbers of very high need individuals, in determining each authority’s spending per younger adult. Such unexplained variation may be a result of local policy choices or different levels of efficiency.
Spending trends
1.37 Local authorities’ total spending on adult social care rose steadily up to 2005-06, when the rate of increase slowed markedly (Figure 14 on page 33). In the three years since the 2010 spending review, this spending fell by 8 per cent (£1.4 billion) in real terms. Spending on all user groups has decreased between 2010-11 and 2012-13. Older adults aged 65 and over have experienced the greatest reduction, 12 per cent in real terms. Younger adults with learning disabilities have experienced the smallest reduction of 0.2 per cent in real terms.
Adult social care in England: overview Part One 31
Figure 12Local authorities’ relative spending
Care homes for older adults is the largest area of spend
Care homes
(£m)
Supported and other
accommodation(£m)
Home care and day care
(£m)
Direct payments
(£m)
Other services
(£m)
Adults aged 65 and over
4,960 140 2,350 390 1,850
Adults aged under 65 with physical or sensory disabilities
380 40 400 460 430
Adults aged under 65 with learning disabilities
2,270 960 1,430 400 650
Adults aged under 65 with mental health problems
400 110 160 40 630
Other adults aged under 65
0 0 0 0 620
Notes
1 Areas of higher spend are shown in darker colours.
2 Total spending that local authorities manage sums to £19.1 billion.
3 Local authorities’ spending on social care includes contributions from users, NHS and other organisations. The fi gure above includes this spending.
Source: National Audit Offi ce analysis of Health and Social Care Information Centre data, PSSEX, 2012-13
32 Part One Adult social care in England: overview
Figure 13Range in local authority spending on care by user group, per user
Number of local authorities
Notes
1 Excludes City of London, Isles of Scilly and Bath and North East Somerset.
2 Local authorities’ spending on social care includes contributions from users, NHS and other organisations. The figure above includes this spending.
Source: National Audit Office analysis of data from Health and Social Care Information Centre, Personal Social Services: Expenditure and Unit Costs – England, 2012-13, December 2013 and Health and Social Care Information Centre, Community Care Statistics: Social Services Activity, England, December 2013
Adults aged 65 or over
0
20
40
60,000 70,000 80,0000 10,000 20,000 30,000 40,000 50,000
Adults aged under 65 with physical or sensory disabilities
0
20
40
60,000 70,000 80,0000 10,000 20,000 30,000 40,000 50,000
Adults aged under 65 with learning disabilities
0
20
40
60,000 70,000 80,0000 10,000 20,000 30,000 40,000 50,000
Adults aged under 65 with mental health needs
0
20
40
All social care users
Annual expenditure per user, 2012-13 (£)
0
20
40
0 10,000 20,000 30,000 40,000 50,000
60,000 70,000 80,000
60,000 70,000 80,000
0 10,000 20,000 30,000 40,000 50,000

Adult social care in England: overview Part One 33
Fig
ure
14
Loca
l aut
horit
y re
al te
rms
spen
ding
on
adul
t soc
ial c
are,
from
Apr
il 19
94
£ b
illio
n
Sp
end
ing
(£ b
illio
n) h
as f
alle
n si
nce
Ap
ril 2
011
acr o
ss t
he f
our
mai
n us
er g
roup
s, b
ut h
as r
isen
ove
r th
e lo
nger
ter
m
O
ther
adu
lt se
rvic
es
A
dults
und
er 6
5 w
ith m
enta
l hea
lth n
eeds
A
dults
und
er 6
5 w
ith p
hysi
cal o
r sen
sory
dis
abilit
ies
A
dults
und
er 6
5 w
ith le
arni
ng d
isab
ilitie
s
A
dults
age
d 65
and
ove
r
No
tes
1 Th
is g
raph
sho
ws
net c
urre
nt e
xpen
ditu
re fo
r th
e fo
ur m
ain
user
gro
ups
and
othe
r ad
ult s
ervi
ces
for
the
per
iod
1994
-199
5 to
201
2-13
.
2 S
pen
din
g on
ser
vice
str
ateg
y is
not
com
par
able
acr
oss
this
per
iod
so h
as b
een
excl
uded
.
3 A
djus
tmen
ts h
ave
bee
n m
ade
to m
ake
the
Valu
ing
Peo
ple
Now
gra
nt a
nd o
ther
NH
S tr
ansf
ers
of m
onie
s co
mp
arab
le o
ver
the
entir
e tim
e p
erio
d.
Sou
rce:
Nat
iona
l Aud
it O
ffice
ana
lysi
s of
dat
a fr
om H
ealth
and
Soc
ial C
are
Info
rmat
ion
Cen
tre
data
, Per
sona
l Soc
ial S
ervi
ces:
Exp
end
iture
and
Uni
t Cos
ts −
Eng
land
199
4-95
to
2012
-13
1994
-95
1995
-96
1996
-97
1997
-98
1998
-99
1999
-00
2000
-01
2001
-02
2002
-03
2003
-04
2004
-05
2005
-06
2006
-07
2007
-08
2008
-09
2009
-10
2010
-11
2011
-12
2012
-13
024681012141618
34 Part One Adult social care in England: overview
Local authorities have reduced spending
1.38 In the two years before the 2010 spending review, local authorities had a broadly steady level of spend. This was the net outcome of reducing the volume of services for people with lower needs, combined with increasing unit costs of most services. Reductions in service volumes can reflect effective demand management, changes in eligibility criteria or changes in service provision levels. Reductions in unit costs, for example the cost of an hour of home care, can indicate back-office efficiencies, changes in suppliers, better commissioning and contract management, or changing service quality or specification. Appendix A gives full details of our analysis.5
1.39 In the three years since April 2010, local authorities’ spending on individual packages of adult care services of home care, care homes with and without nursing, and day care has fallen significantly. Service volumes fell by a similar amount compared with the earlier period. However, these were accompanied by reduced unit costs, and this combination led to a large reduction in spending. Our analysis shows that around three-quarters of the reduction in local authority spending has been through reducing the amount of care provided. Volumes of care have fallen across all types of care service. The balance of savings (around a quarter) has been achieved by reducing costs. Unit costs have fallen across almost all user groups and all types of provision, with reductions particularly large in care homes with nursing.
5 Available at: www.nao.org.uk/report/adult-social-care-england-overview

Adult social care in England: overview Part Two 35
Part Two
Pressures and system redesign
2.1 Care is a process of understanding needs, providing care to meet those needs, and monitoring and accountability for outcomes and quality. There are pressures throughout the care system which the government intends to address through the Care Bill. The bill will expand and embed recent changes and introduce more change. In this part, we identify risks and challenges the changes may introduce.
Preventing and managing need (health and care)
2.2 We have previously concluded that a concerted shift away from reactive spending towards early action can result in better outcomes and greater value for money.6 Effective preventative services keep adults well and independent, intervene early when needs emerge, and assess and review adults’ needs so that services are appropriate. Different parts of the system not working well together, or appropriate support services not being accessible or in place, can increase needs and cost (Figure 15 overleaf).
2.3 Local authorities have implemented a range of preventative services to delay or reduce demand for care services and keep adults living independently in their own homes. However, limitations in current national data make it difficult to assess the impact of these preventative services. Commonly used preventative services include reablement, telecare, equipment and home adaptations, and better information and advice. In the 2010 spending review, central government calculated that reablement could contribute 16 per cent towards total efficiency savings and that telecare could contribute 5 per cent. However, a large-scale randomised controlled trial of telecare has so far found no evidence of service reductions for its recipients.7
6 Comptroller and Auditor General, Early action: landscape review, Session 2012-13, HC 683, National Audit Office, January 2013, available at: www.nao.org.uk/report/early-action-landscape-review
7 Steventon and colleagues in Age and ageing, ‘Effect of telecare on use of health and social care services: findings from the Whole Systems Demonstrator cluster randomised trial’, February 2013.

36 Part Two Adult social care in England: overview
Figure 15Interactions between users and care and support services
The whole system should work together to prevent or slow down the development of needs, and put in place appropriate support when required
But problems in one part of the system can lead to rising needs and increased costs for one or all parts of the system, for example:
Low needsAdult social care NHS Housing, benefits
and other services
Prevention
Universal services
Community and social groups can help prevent people feeling isolated
Public health and leisure services need to be coordinated to keep people well and active
Local authority grants to voluntary organisations to provide low-level support in the community make up just 1.6 per cent of spending 1
GPs are vital in referring issues early to other professionals
More referrals to local authority social care come from secondary health (24 per cent) than primary health (15 per cent)2
A range of support can help people live independently with long-term conditions, including advice and information, education, and signposting to support networks
Suitable housing can help keep people safe and living independently
58 per cent of over-60s say they are interested in moving but feel restricted by a lack of suitable alternative housing or fear of an unfamiliar environment 3
Early intervention
Rehabilitation and reablement can help people move quickly out of hospital and regain independence
In 2012-13 patients spent 833,000 days longer in hospital than necessary because of delayed transfers of care 4
Equipment and adaptations to the home, and technology to help monitor health and well-being, can help people live without formal support
Delays to adapting homes can cause problems, including falls. The average cost of a fractured hip is £29,000 5
Families and friends need to be supported as they take on caring roles so that they can maintain their health, employment and quality of life
19 per cent of carers known to authorities are not in paid work due to their caring responsibilities, and for 86 per cent caring has affected their health 6
Long-term care
Targeted services
Long-term care should be designed around people’s needs
Financial planning and support needs to be available if people are not eligible for state funding
Only 13 per cent of people paying for their own place in a care home receive appropriately qualified financial advice 7
People can choose care from a varied and quality marketplace
Health care is provided in people’s homes where appropriate
One-fifth of emergency hospital admissions are for existing conditions which could be managed effectively by primary, community or social care and could be avoided 8
People are supported to claim welfare benefits to which they are entitled
Up to an estimated 35 per cent of working age in-household carers may not be receiving Carer’s Allowance to which they may be entitled 9
High needsHealth, social care and all other parts of the system should work seamlessly together to ensure people get the best and most appropriate care
Sources: 1) Health and Social Care Information Centre, Personal Social Services: Expenditure and Unit Costs – England, 2012-13, December 2013; 2) Health and Social Care Information Centre, Community Care Statistics: Social Services Activity, England, December 2013; 3) Demos, Top of the Ladder, September 2013; 4) NHS England, Delayed Transfer of Care, NHS Organisations, England August 2010 – December 2013, January 2014; 5) Offi ce for Disability Issues, Better outcomes, lower costs, 2007; 6) Health and Social Care Information Centre, Personal Social Services Survey of Adult Carers in England 2009-10, June 2010 and 2012-13, November 2013; 7) Local Government Information Unit, Independent Ageing, 2011; 8) National Audit Offi ce, Emergency admissions: managing the demand, HC 739, Session 2013-14; 9) Department for Work and Pensions, The take-up of Carer’s Allowance: A feasibility study, October 2010

Adult social care in England: overview Part Two 37
2.4 Reablement services give adults short, intensive bursts of care to regain lost skills and build confidence and independence after an injury or illness. Most local authorities provide reablement, and evaluations have shown it reduces the need for ongoing care effectively.8 Current national data show that the number of older people discharged from hospital into reablement services increased 6 per cent over 2012. Over 80 per cent of these were living at home three months after discharge. However, work is needed to establish best practice in reablement for particular groups, such as adults with learning disabilities or dementia. Further evaluation will be required to establish which services are most effective and how they are best implemented.
2.5 Some local authorities commission services from the private and voluntary sectors based on tasks or hours of service provided. These providers are not incentivised to rehabilitate or increase user independence. The Care Bill’s ambition is for authorities to commission for adults’ wellbeing and intervene earlier. However, it is not easy for authorities to move to outcomes-based commissioning. The Department of Health plans to develop guidance to support authorities to do this.
Understanding need and demand for care
2.6 Health and wellbeing boards, formally established from 1 April 2013, comprise key representatives from the health and care sectors, including councillors and user representatives. Boards assess their local communities’ needs, agree priorities and encourage commissioners across health and social care to collaborate to improve the health and wellbeing of their local populations. Boards’ membership and remits vary. The King’s Fund has reported that boards have led to strong relationships between local authorities and local NHS bodies. Nearly all boards have developed joint strategic needs assessments and joint health and wellbeing strategies. However, some boards are uncertain about their role and powers and the King’s Fund has raised concerns about how much they can achieve and how quickly.9
Designing services
2.7 Nationally, the Department of Health works with key bodies that represent the local government adult social care sector, the Local Government Association and the Association of Directors of Adult Social Services, to develop and implement policy. These bodies are represented on a board overseeing the implementation of the Care Bill. They told us the Department engages effectively with the sector.
2.8 Local authorities may involve users and carers in designing services locally, focusing services on user needs and preferences. This is known as co-production. This involvement ranges from public consultations; user reference groups for service design; or jointly planning an individual package of care for a user.
8 Social Care Institute for Excellence, Reablement: a cost effective route to better outcomes, April 2011.9 The King’s Fund, Health and wellbeing boards: one year on, 2013, available at: www.kingsfund.org.uk/publications/
health-and-wellbeing-boards-one-year-on
38 Part Two Adult social care in England: overview
Providing services
2.9 Local authorities commission most care services from the private and voluntary sectors and provide little care themselves. Since the 1990s, local authorities have moved away from being the exclusive care service provider to commissioning from a range of independent providers. In 2012-13, local authorities commissioned 74 per cent (by value) of their services from independent providers, ranging from 54 per cent to over 99 per cent by local authority. Stakeholders raised concerns over whether all authorities were developing their commissioning skills and capacity to keep pace with changes to how they commission care.
Local care markets
2.10 In Deciding prices in public services markets: principles for value for money, we said that local authorities should understand their impact on local markets as service purchaser, and encourage the right market behaviour.10 Some local authorities said that they work with providers to understand what affects costs. The Care Bill is expected to require authorities to promote and shape an efficient and effective care market. They are encouraged to publish market position statements, describing their local markets and how they manage them, including information on self-funders and services bought using direct payments.
2.11 The social care market is challenging for independent providers. Care markets have a large number of small providers, with the ten largest providers typically having 15 to 20 per cent total market share in each part of the market. For example, in April 2013 there were nearly 8,000 registered home care agencies, varying by local authority from one per 3,700 people to one per 14,000 people. There is strong local competition on price in most areas. Prices that local authorities pay have not kept up with providers’ cost inflation. Between 2009-10 and 2013-14, rates that authorities pay for care homes for older people increased five percentage points less than reported costs. In a 2013 survey, nearly 50 per cent of local authority directors of adult social care said that providers in their areas are facing financial difficulties.11 Some providers have withdrawn from contracts they now find unprofitable. Authorities have moved away from commissioning services from providers on a ‘block’ basis to using framework contracts where providers are drawn from an approved list. This means less certainty for providers, but has helped authorities reduce inefficiency and spend caused by under-used contracts.
10 National Audit Office, Deciding prices in public services markets: principles for value for money, December 2013, available at: www.nao.org.uk/report/deciding-prices-public-services-markets-principles-value-money/
11 Association of Directors of Adult Social Services, Annual Budget Survey 2013, May 2013, available at: www.adass.org.uk/index.php?option=com_content&view=article&id=914:social-care-funding-bleak-outlook-bleaker&catid=160:press-releases-2013&Itemid=489
Adult social care in England: overview Part Two 39
2.12 Some providers have reported problems meeting all but users’ basic needs and investing in staff skills and training. However, others have been able to sustain their businesses at local authority rates. Different provider business models lead to different levels of financial risk, for example where a provider has high borrowing or cannot control its rental costs. Some turnover is expected and authorities and providers have protected users when providers have ceased operating, including after the collapse of Southern Cross in October 2011. Southern Cross ran 752 care homes (10 per cent of the national total) and was the largest failure the sector has experienced. Since then there have been no significant business failures in social care. Local authorities monitor the risk of providers failing financially. The Department of Health currently monitors the financial sustainability of the five largest providers. From April 2015, the Care Quality Commission will expand this to monitor the financial sustainability of all the most difficult-to-replace providers (those with many users, wide geographical reach, or specialised provision). This is intended to alert to difficulties so that the sector can ensure continuity.
2.13 In the care home market for older adults, local authorities pay less than the average rate that individuals are charged (Figure 16 overleaf). In some cases self-funders are buying a premium service compared to that of local authority users. In other cases, local authorities pay a lower rate for the same service, benefiting from bulk purchase discounts. Some providers told us that they cross-subsidise lower fees paid by local authorities through charging self-funders higher fees. The Care Bill aims to increase transparency about what local authorities pay for care, which may help self-funders understand service costs better.
2.14 Some local authorities consider providers’ costs when setting fees. But when authorities do not fully consider costs this can place financial pressure on providers. In a 2013 survey of local authority directors of adult social care, 48 per cent thought the cost savings they had made had caused financial difficulties for providers. The maximum fees that local authorities set for an older person to spend a week in a care home vary widely, from £331 to £1,082, for many reasons including differences in local wage costs and services being purchased.

40 Part Two Adult social care in England: overview
Weekly fees for care homes for older adults, 2012-13 (£)
Average (median) of the maximum fees paid by local authorities in this region for:
Mainstream care home places
Care home places with specialist dementia support
London
South East
East of England
South West
East Midlands
West Midlands
North East
North West
Yorkshire and the Humber
0 100 200 300 400 500 600 700
Figure 16Market prices and local authority fees for care homes for older adults, 2012-13
In the North East the price that local authorities pay is higher than in neighbouring regions
Notes
1 Average weekly price is the market price for care homes for older adults.
2 Maximum fee is the median of the maximum baseline fees for care homes for older adults set by local authorities in that region. Not reported for all local authorities. Local authorities typically have different rates for mainstream care home and dementia-specialist care home beds.
Source: National Audit Office analysis of data from LaingBuisson, Care of Elderly People: UK Market Survey 2012-13, January 2013 and LaingBuisson, CCMN Annual Survey of Local Authority Baseline Fee Rates, June 2013
Average (mean) market price for all care homes in the region

Adult social care in England: overview Part Two 41
Personal budgets
2.15 Personal budgets were introduced in 2007 and are money allocated to adults to meet their assessed needs. Personal budgets are either managed by the local authority, which commissions services for users, or given to users or their carers as a direct payment so they can buy their own services. In 2012-13, 56 per cent of users and carers receiving services in the community held a personal budget, up from 13 per cent in 2009-10, but short of the April 2013 objective of 70 per cent (Figure 17). We have previously concluded that implementing personal budgets has been slow and variable with good practice not widely shared.12 The Care Bill will introduce an entitlement to a personal budget for all local authority service users as part of a care and support plan.
12 Comptroller and Auditor General, Oversight of user choice and provider competition in care markets, Session 2010–2012, HC 1458, National Audit Office, September 2011, available at: www.nao.org.uk/oversight- of-user-choice-and-provider-competition-in-care-markets/
2.0
1.8
1.6
1.4
1.2
1.0
0.8
0.6
0.4
0.2
0.0
Figure 17The use of personal budgets and direct payments
User and carers (million)
More users and carers have personal budgets
Source: Health and Social Care Information Centre, Community Care Statistics: Social Services Activity, England, 2009-10 to 2012-13
2009-10 2010-11 2011-12 2012-13
Users and carers receiving services in the community
Users and carers with a personal budget
Users and carers with a direct payment

42 Part Two Adult social care in England: overview
2.16 A 2013 survey of 2,000 personal budget holders found that most reported that personal budgets improved outcomes across a range of measures, including physical health and mental wellbeing.13 The survey found that personal budgets generally lead to better outcomes for mental health, personal control and dignity when taken as direct payments. In 2012-13, 30 per cent of personal budgets were arranged in this way. Direct payments are not the best form of personalised budget for all adults and for some have not led to improved outcomes.
2.17 In 2012, an estimated 146,000 people were employed as personal assistants directly by people receiving direct payments. Personal assistants are not regulated, so there is no mechanism for ensuring safe, good-quality services. Employers of personal assistants have responsibilities as employers, for example for employers’ insurance. An estimated two and a half times more recipients of direct payments employed their own staff in 2012 than in 2008.
Self-funders
2.18 The Care Bill will require local authorities to assess any adult who appears to need care and support, including self-funders. A local authority may assess a self-funder as having eligible needs. The authority then has to calculate how much it would pay to meet their needs and this amount will count towards the limit on their care costs. These duties will increase the amount of authorities’ assessment and management.
2.19 Local authorities have had little involvement with self-funders. Few have known about, or used, their entitlement to free care assessments. Without appropriate guidance and financial advice, adults may make poor, expensive or unsustainable choices about their care and risk running out of funds or losing independence earlier, leading to greater impacts on local authorities or the NHS. The Local Government Information Unit estimated that authorities spent £425 million in 2011-12 on care home residents who had run out of private funds.14 The Department of Health is planning a campaign to raise public awareness of the Care Bill reforms.
Care workforce pay
2.20 Care workers’ median pay was £7.90 per hour in 2012. Some are not paid in full due to deductions for uniforms or due to travel time between visits. An estimated 160,000 to 220,000 direct care workers in the UK are paid below the national minimum wage. HM Revenue & Customs report that non-compliance with the national minimum wage in the adult social care sector was higher in 2011-12 and 2012-13 than in any year since 2008.
13 Think Local Act Personal, The Second POET Survey of Personal Budget Holders and Carers, 2013, available at: www.thinklocalactpersonal.org.uk/_library/POETNationalReportFINAL.pdf
14 Local Government Information Unit, Independent Ageing 2013, July 2013, available at: www.lgiu.org.uk/wp-content/uploads/2013/07/Independent-Ageing-2013.pdf

Adult social care in England: overview Part Two 43
2.21 An estimated three in ten care workers are on zero-hour contracts, rising to 61 per cent for home care workers.15 In a 2012 survey of 655 organisations providing home care in England, 78 per cent reported they were paid through a spot contract or framework agreement with a local authority.16 These contracts give providers no guarantee their services will be taken up, which may inhibit long-term planning and investment in staff. Over three-quarters (76 per cent) of providers felt authorities prioritise low price over service quality. Turnover among care workers is high at 22 per cent annually, which further reduces employers’ incentive to invest in staff skills.
Integrating social care and health
2.22 Social care services, and primary and secondary health services are interrelated. Poor-quality social care can lead to unnecessary emergency hospital admissions. One-fifth of emergency admissions to hospital are for existing conditions that primary, community or social care could manage. Research using 1998-99 and 1999-2000 data has shown that greater spending on social care is related to lower delayed hospital discharge rates and fewer emergency admissions.17 A lack of suitable care services can delay hospital discharge, putting pressure on acute services. Delays in hospital discharges where the local authority is responsible have decreased over the last three years. However, this remains a significant problem for some hospital trusts.18 A recent survey of 150 GPs found that 56 per cent rated the quality of their relationship with social care as poor or very poor.19 We have previously found little integration between health and social services in end-of-life care and for people with autism, dementia and rheumatoid arthritis.20 We concluded that there is scope to improve overall value for money across government by integrating services and programmes further.21
15 Skills for Care, The state of the adult social care sector and workforce in England, 2012, October 2012, available at: www.nmds-sc-online.org.uk/Get.aspx?id=829408
16 UK Homecare Association, Care is not a commodity, 2012, available at: www.ukhca.co.uk/pdfs/UKHCACommissioningSurvey2012.pdf
17 Fernandez and Forder in Applied Economics, ‘Consequences of local variations in social care on the performance of the acute health care sector’, issue 12, 2008.
18 Comptroller and Auditor General, Emergency admissions to hospital: managing the demand, Session 2012-13, HC 739, National Audit Office, October 2013, available at: www.nao.org.uk/report/emergency-admissions-hospitals-managing-demand/
19 Impower Consulting Ltd, Home Truths Programme: July 2013 Update, Working with GPs to reduce demand on health and social care, July 2013, available at: www.impower.co.uk/public/upload/fichiers/152/impowerhometruthsupdatejune2013.pdf
20 Comptroller and Auditor General reports, Improving dementia services in England – an interim report, Session 2009-10, HC 82, National Audit Office, January 2010, available at: www.nao.org.uk/report/improving-dementia-services-in-england-an-interim-report/; Services for people with rheumatoid arthritis, Session 2008-09, HC 823, National Audit Office, July 2009, available at: www.nao.org.uk/report/services-for-people-with-rheumatoid-arthritis/; Supporting people with autism through adulthood, Session 2008-09, HC 125, National Audit Office, June 2009, available at: www.nao.org.uk/report/supporting-people-with-autism-through-adulthood/; End of life care, Session 2007-08, HC 1043, National Audit Office, November 2008, available at: www.nao.org.uk/report/end-of-life-care/
21 Comptroller and Auditor General, Integration across government, Session 2012-13, HC 1041, National Audit Office, March 2013, available at: www.nao.org.uk/report/cabinet-office-and-hm-treasury-integration-across-government/

44 Part Two Adult social care in England: overview
2.23 The Care Bill is designed to compel public sector bodies to integrate social care provision with health and other services where this would promote wellbeing, improve service quality or prevent needs developing. Integration is the coordination of working arrangements where multiple public bodies are involved in delivering a service or programme. It can range from shared assessment of need and joint planning, to joint teams and shared management. We found almost universal support for integration but progress has been slow, with few successful examples. Integrated Care Pilots showed some promising early impact but did not lead to widespread improved outcomes.22 There are significant structural, cultural and financial barriers to integrating social care and health (Figure 18).
2.24 Central government has begun further programmes to encourage integration and service transformation. From 2015-16, local areas will access the £3.8 billion Better Care Fund. This is a pooled budget for health and social care services, a joint initiative between the Department of Health and the Department for Communities and Local Government. Around £2 billion will come from NHS allocations to clinical commissioning groups. Health and wellbeing boards approve local plans for spending Better Care Fund allocations. The King’s Fund has reported concerns about the consequences of removing £2 billion from acute care. In 2012, we reported that the NHS had made savings mainly through freezing pay, reducing the use of temporary staff and reducing back-office costs.23 More savings will need to be made by transforming services. This will be more difficult, will take time and may initially cost money. The Department of Health does not know what scale of savings it can expect nor how quickly the NHS can manage the funding reduction. The tight timescale for change set by the Better Care Fund increases the risk that new services or approaches will not be in place or embedded to meet the demand from reduced services elsewhere.
2.25 In November 2013, the Department of Health announced 14 local areas as Integrated Care Pioneers, to establish best practice and share evidence. The Department has commissioned work to identify baselines to monitor and evaluate pioneer areas with a report on each area’s progress due in June 2015. This evidence will not be available in February 2014 when local areas must submit five-year plans for spending their Better Care Fund allocations. A range of other initiatives support transformation, including the Public Service Transformation Network.
22 Integrated Care Pilots was a two-year Department of Health initiative that ran from 2009 to 2011 to explore different ways of providing integrated care.
23 Comptroller and Auditor General, Progress in making NHS efficiency savings, Session 2012-13, HC 686, December 2012, available at: www.nao.org.uk/report/progress-in-making-nhs-efficiency-savings/

Adult social care in England: overview Part Two 45
Figure 18Progress in addressing barriers to integration
Central government and local authorities are addressing many barriers to integration through initiatives that have only recently begun
Challenge Progress
Financial incentives and funding mechanisms are different across the sectors.
Whole-Place Community Budgets and the Better Care Fund are designed to align resources to improve services around user outcomes.
Structural divides block progress and decision-making.
Health and wellbeing boards have been set up to bring together decision-makers across health and social care.
Lack of evidence on what works and how changes should be implemented. The health sector has a culture of evidence-based interventions, unlike social care.
Fourteen Integrated Care Pioneers aim to collect evidence and share this with the wider sector. District nurses and occupational therapists are long-established professions that work across health and social care, but their knowledge and experience are not being harnessed.
The sectors have separate information systems and data sharing is poor due to legal and IT barriers.
Plans under the Better Care Fund must assist better data sharing between health and social care, based on individuals’ NHS numbers.
Different regulation of the health and social care workforces, with social care workers having no national standards to work towards.
The Health and Care Professions Council is considering regulating the adult social care workforce.
Health services are predominantly provided by the NHS, whereas care is mostly commissioned by 152 local authorities from tens of thousands of private and voluntary providers.
Health and wellbeing boards are intended to improve joint commissioning between health and social care, but are in their infancy.
Health services are free and universally available, whereas care services are means-tested and generally available only to those with substantial needs.
The health workforce is mostly professionalised and has high status, whereas the paid care workforce is only partly professionalised, lower paid, and has lower status, with high staff turnover.
Where boundaries differ, local health bodies need to work with several local authorities, and vice versa.
Source: National Audit Offi ce

46 Part Two Adult social care in England: overview
Monitoring services
National information on care services
2.26 The Department of Health defines the information that local authorities provide on care outcomes, which describe the changes and benefits resulting from their activities. In social care, outcomes are difficult to define and measure. With exceptions such as reablement, most care aims to manage ongoing conditions, rather than improve or cure them. Most measures relate to the proportion of users or carers with a specific outcome, for example the proportion of users who live independently or are employed. Some measure service-related outcomes, for example the proportion of older people offered reablement after hospital discharge.
2.27 The Health and Social Care Information Centre publishes annual national and local authority level social care outcomes data, using the Adult Social Care Outcomes Framework (Appendix C).24 The framework, launched in 2011, sets out how data collected annually are combined to measure users’ quality of life, independence, and experience of care. The outcomes are designed for the public and authorities to compare performance between authorities.
2.28 There are gaps in data across the adult care sector with insufficient information on how and why people move between different care and health services. Local authorities have little information on the numbers, needs, spending and outcomes of self-funders in their areas. Similarly, there are limited data on how people spend direct payments, and the quality of care bought. This makes it difficult for authorities to manage their local care markets. Data on home care are difficult to collect. There are limited data on preventative services and providers’ activities carried out through block contracts. Current and planned changes to the data local authorities collect shift the focus from activities and processes to the outcomes of care and support, and will include information on self-funders whose care is arranged by the local authority.
Local authority monitoring
2.29 Local authorities hold providers to account for care quality and user outcomes. They monitor outcomes and challenge providers if planned outcomes are not met. However, as described in paragraph 2.26, measurement is challenging, and local authority monitoring focuses on identifying unacceptable standards of care. Authorities have practical difficulties in monitoring outcomes, for example for users placed outside the local area, or with cognitive impairments. They may therefore commission tasks or hours of care, rather than by outcomes. Some local authorities need to develop their commissioning skills and capacity to support outcomes-based commissioning.
24 Available at: www.nao.org.uk/report/adult-social-care-england-overview
Adult social care in England: overview Part Two 47
2.30 Most users (90 per cent) of local authority arranged care express satisfaction with the care and support they receive. Among these, 64 per cent are very or extremely satisfied with the care and support they receive. This proportion does not vary substantially between most authorities. Adults with learning disabilities are the most satisfied with their care and support overall. Carers report less satisfaction than users when asked about local authority care services, with 36 per cent very or extremely satisfied with the services or support they and the person they care for received. No equivalent data are available for those receiving services not arranged by a local authority.
Care quality
2.31 The Care Quality Commission regulates and inspects care providers against minimum standards of quality and safety. It found that, of the adult social care providers inspected between October 2010 and 31 March 2012, 72 per cent met all essential standards of care. However, 27 per cent (3,241 locations) required an action plan for improvement. The Commission had serious concerns in 1 per cent of cases (116 locations) and used its powers to safeguard users from harm or hold the provider to account. It publishes an annual summary of care services in its ‘state of care’ report. However, it does not make a single assessment of quality across all providers in a local area or of the performance of local authority social care departments.
2.32 The Care Quality Commission is moving away from an annual inspection regime to a risk-based one, where services rated as requiring improvement or inadequate are inspected more frequently than those with a good or outstanding rating. The Commission is developing tools to help it use available data, including information from users and staff, to identify risk and respond with immediate inspections where necessary. The Commission is piloting this approach and will roll it out in October 2014, with every adult social care service rated by March 2016.
2.33 Some providers and representative bodies we met complained of the burden of inspection by different oversight bodies collecting similar information. Inspection bodies do not generally inspect jointly or share information. Stakeholders said that such duplication is partly caused by lack of trust in Care Quality Commission inspections. The Commission aims to address these concerns through its new regulatory approach, to be implemented from October 2014.25
2.34 The NHS Choices website has, since April 2013, published profiles on all care providers, combining the Commission’s inspection results with user reviews. Our review of a sample of 15,400 profiles found that less than 1 per cent of providers had been rated by users by October 2013. Other websites listed in Appendix D also enable user ratings.26
25 Care Quality Commission, A fresh start, October 2013, available at: www.cqc.org.uk/sites/default/files/media/documents/20131013_cqc_afreshstart_2013_final.pdf
26 Available at: www.nao.org.uk/report/adult-social-care-england-overview

48 Part Two Adult social care in England: overview
2.35 Local authorities have a duty to work with the police, local NHS bodies and other partners to safeguard vulnerable adults from abuse and neglect. In 2012-13, 109,000 safeguarding referrals were recorded by authorities, 13 per cent more than in 2010-11. This increase may reflect increased awareness of abuse or may reflect overstretched resources and pressure within the system. In 2012-13, 29 per cent of referrals of alleged abuse were carried out by family members, friends or neighbours, and 36 per cent were carried out by social care or health workers.
2.36 Safeguarding adults boards exist in many local areas to coordinate safeguarding between local authorities and their partners, and the Care Bill is likely to make them compulsory. The Commission believes that roles and responsibilities for safeguarding across the system are not clear but reported that in 2012-13 providers showed a better awareness of their safeguarding responsibilities and procedures. With the Local Government Association, the Association of Directors of Adult Social Services, NHS England and the Association of Chief Police Officers, it plans to publish guidance on this topic later in 2014.
Local information on care services
2.37 Since November 2013, the Local Government Association has published adult care performance data for all local authorities through its LG Inform website, enabling the public to compare local performance against the national picture.27 Since 2011-12, most local authorities have voluntarily published annual ‘local accounts’ describing progress in achieving their social care goals. This followed a recommendation by the Association of Directors of Adult Social Services and the Local Government Association. The government encourages authorities to use these for transparent communication with communities.
2.38 Local accounts are not yet providing full accountability to the public across local authorities. We found 131 local accounts on websites of the 152 authorities with adult social care responsibilities. We assessed them against some of the criteria the Towards Excellence in Adult Social Care programme recommended local accounts follow (Figure 19). Overall, we found that the majority of authorities were not following the criteria. Some local accounts do not present a local authority’s shortcomings as well as achievements.
27 Available at: http://lginform.local.gov.uk/

Adult social care in England: overview Part Two 49
Figure 19Assessment of local accountsTowards Excellence in Adult Social Care recommendations
National Audit Office findings
152 local authorities have adult social care responsibilities
131 (86%) have published a local account
Use an outcomes framework which makes sense locally
92 (61%) use their local account to report on the Adult Social Care Outcomes Framework
Use a balanced approach to benchmarking data
84 (55%) benchmark their local account in some way. Of these, 16 benchmark cost data
Publish information on complaints
73 (48%) publish complaints figures. Of these, 40 (26% of the total) compared complaints figures with previous years
Indicate the response to the public’s views
36 (24%) explained what action they had taken to address complaints
0 50 100
Percentage
Source: National Audit Offi ce

50 Part Two Adult social care in England: overview
Sector-led improvement
2.39 A range of sector-led improvement programmes support local authorities to monitor and improve their performance. These are supported and coordinated by the Local Government Association and the Association of Directors of Adult Social Services. The Department of Health and the Department for Communities and Local Government support local authorities to improve efficiency through part-funding sector-led improvement initiatives and through other support. These programmes include peer challenge visits by other authorities which may address corporate or service-specific issues. Other sector-led improvement programmes include peer mentoring and support, leadership training for councillors and officers, and bespoke support such as putting in place an improvement board.
2.40 The Towards Excellence in Adult Social Care programme also provides regular and more informal support to local authorities through regional networks supported by the Association of Directors of Adult Social Services, including social care peer challenges. The Department of Health provided £0.5 million in 2012-13 and £0.8 million in 2013-14 towards this programme. Peer challenges rely on contributions of time from senior councillors and local authority officers.
2.41 Peer challenges are voluntary, and by the end of March 2014, 63 local authorities with adult social care responsibilities will have received a corporate peer challenge or an adult social care peer challenge. Not all authorities publish the results. In addition, 53 local authorities are participating in a separate Local Government Association Adult Social Care Efficiency Programme.
2.42 The government has confidence in sector-led improvement and appreciates that some local authorities have benefited from it, but recognises that it is not fully established. Both the Department of Health and the Department for Communities and Local Government retain statutory powers to intervene in exceptional circumstances. If an authority is failing in its statutory duties, the Secretary of State for Communities and Local Government has powers to intervene, but these have never been used in adult social care. The Department of Health can issue legally-binding directions to local authorities as a last resort but has not done so since 2010 after criticism from the Law Commission.

Adult social care in England: overview Appendix One 51
Appendix One
Our audit approach
1 Our study examined public, private, voluntary and informal social care for adults in England. We examined need, policy, funding, provision, outcomes and accountability, to identify key risks and pressures facing those in the changing system. We reviewed:
• the need and demand for care, and how this varies geographically and over time;
• funding for adult social care and what care is provided; and
• the accountability structures and systems for adult social care.
2 We reviewed the state of social care by analysing local and national information and data.
3 We analysed data to understand the relationship between local characteristics and spending per head on adult social care services.
4 We estimated the value of informal care, and the possible changes to and challenges for adult social care.
5 Our evidence base is described in Appendix Two.

52 Appendix One Adult social care in England: overview
Figure 20Our audit approach
Department of Health objectives are to enhance adults’ quality of life, delay and reduce their need for care, ensure positive experiences of care, and safeguard adults and protect them from harm. Local authorities have their own policy objectives.
The government’s objectives
Central government provides most funding to local authorities, which commission and provide social care to meet the needs of local populations. Most social care is provided informally by unpaid family, friends and neighbours. Forthcoming changes are embodied in the Care Bill.
How this will be achieved
Our study is a review of the current state of adult social care in England locally and nationally, and outlines the remaining challenges.
Our review
What are the care needs of adults?
How is adult social care funded, commissioned and provided?
What accountability structures and systems are in place?
Our key questions
We analysed census data to understand care needs and trends.
We analysed local authority data from the Health and Social Care Information Centre.
We interviewed local authorities and national charities.
We conducted a literature review.
We reviewed market data from LaingBuisson.
We interviewed charities and other stakeholders.
We drew on information from the Department for Work & Pensions and NHS England about their roles in supporting adults with care needs.
We drew on our previous work.
We reviewed the Association of Directors of Adult Social Services budget survey.
We analysed adult social care local accounts.
We analysed care provider ratings on the NHS Choices website.
We interviewed the key organisations involved in ensuring accountability.
Our evidence
(see Appendix Two for details)

Adult social care in England: overview Appendix Two 53
Appendix Two
Our evidence base
1 We reached our independent conclusion on the risks to value for money in social care for adults in England after analysing evidence collected between July and November 2013. Our audit approach is outlined in Appendix One.
2 We analysed census and national survey data on care needs and how they vary geographically and over time. We also analysed how many people provide unpaid care, their age, and how much care these informal carers provide.
3 We analysed local authority activity and spending data from the Health and Social Care Information Centre, to see which groups are more likely to receive local authority care, and identified trends.
4 We interviewed officers and councillors at five local authorities to understand the specific challenges in meeting care needs. We gained information on what local authorities consider to be the key challenges, and how they plan to tackle these.
5 We conducted a literature review to understand the factors influencing care needs, expectations, and user experiences of care services.
6 We drew on information from the Department for Communities and Local Government, the Department of Health, the Department for Work & Pensions and NHS England. This information helped us to understand support provided to those with care needs and carers, which different departments and groups are involved in supporting the social care system, and how they provide this support. This also provided some specific information regarding the cost of care.
7 We reviewed information the Department for Communities and Local Government asked for from the Department of Health as part of the 2010 spending review and 2013 spending round. We examined the Department for Communities and Local Government’s analysis of other departments’ estimates of spending pressures and potential efficiency savings.
8 We analysed local authority documents, including adult social care ‘local accounts’, to learn what information local authorities make available to their residents. This showed us how local authorities use information to enable the public hold them to account for the services they provide.

54 Appendix Two Adult social care in England: overview
9 We analysed data from LaingBuisson on the following:
• The prices that local authorities pay for residential care and the market price for care in each local authority.
• The support local authorities receive from formal sources, such as NHS England, and informal carers. These data included estimates of the monetary value of informal care were this care to be replaced with local authority funded care services.
• The number of adults who fund their own care and where they live, and the extent of the care market’s segmentation by provider.
10 We interviewed charities, providers and other stakeholders. Among other things, these stakeholders explained levels and trends in need and outcomes, the changing nature of care provision, and the extent and value of informal care to the care system. We also learned the conditions and terms under which care workers work, and the typical form a care contract takes.
11 We drew on our previous work on integration, emergency hospital admissions, oversight of care markets, and price setting in public markets. We also reviewed past work on specific conditions to understand interactions between social care and health, and how well health trusts and local authorities work together to provide care.
12 We reviewed survey responses, which showed how much care is provided by care workers, and their levels of pay. This also provided information on how satisfied adults are with their care, broken down by group receiving care and region.
13 We analysed care provider ratings on the NHS Choices website which provided data on how much information the public can access when making a choice of care provider.

Adult social care in England: overview Appendix Three 55
Appendix Three
Glossary
adult social care Care and support services to help with personal care and practical tasks to adults who need it due to physical disabilities, learning disabilities, physical or mental ill-health, or old age.
social services Local authority social services departments commission and provide social care services to adults.
People involved in care
carer An informal carer is an unpaid family member, friend or neighbour who directly helps a person with care needs or helps coordinate agencies and arrange support services.
care worker A person paid by a care provider to carry out personal care and practical tasks.
occupational therapist A professional with specialist training in the needs of people with disabilities or mental or physical illnesses. They help people to learn or regain skills, and can arrange aids and adaptations to the home. Occupational therapists may be employed by local authorities or the NHS.
personal assistant A care worker that typically works with one care user only, and will likely be employed directly by the user. The user may use direct payments from the local authority to pay for this care.
self-funder An adult who pays for their own care rather than the local authority or NHS funding this care. A self-funder may also receive informal care. As well as self-funders, many adults who receive local authority funded care pay fees or charges and/or ‘top up’ their care with additional privately bought care.
social worker A professional who works with individuals and families to assess and put in place the care and support they need. Social workers play a role in safeguarding and in managing the packages of care individuals receive. They may be employed by local authorities or work in the NHS or other organisations.
zero-hours contract A worker on a zero-hours contract is not guaranteed any particular hours of work by their employer.

56 Appendix Three Adult social care in England: overview
Care services for users and carers
advice and brokerage Information and advice services covering care options, community support and financial benefits, and assistance in setting up packages of care or employing personal assistants.
care homes 24-hour support in residential accommodation rather than care in an adult’s own home. Includes meals and personal care, such as help with washing and dressing, permanently or short term.
carers’ services Support to help informal carers in their role, including information, advice and training, respite care provided at home or in a care home, and direct payments to carers.
day care Centres open during the day providing opportunities to socialise and take part in activities, as well as providing respite for informal carers.
direct payments Payments either via a bank account or prepaid cards, for adults to buy their own care and support, often by employing personal assistants.
equipment and adaptations
Modifications to the home, including wheelchair ramps, handrails, stair-lifts, walk-in showers, adapted toilet seats, and telecare (see below).
extra-care housing Community of self-contained properties for older adults, with on-site 24-hour support staff, care when required, maintenance and communal facilities.
home care Support provided at home to help with personal care tasks, or getting out of the house for shopping and leisure activities.
meals Hot or frozen meals delivered to adults who cannot prepare meals themselves.
nursing care A care home with 24-hour access to a qualified nurse.
prevention and early intervention
Services aimed towards preventing more serious needs developing, including reablement, telecare, befriending schemes and falls prevention services.
professional support Active, ongoing therapy, support or professional input such as counselling from a social worker or other professional.
reablement Short, intensive period of support aimed at regaining skills, confidence and independence lost as a result of illness, injury or disability, normally provided in someone’s own home.
supported living Schemes that support younger adults to live independently in their own homes. Support can include domestic and personal care, and help with tasks such as searching for jobs and claiming benefits.
telecare Technology used to help care users remain independent and safe. Examples include pendant alarms, bed and door sensors, and key safes.
Adult social care in England: overview Appendix Three 57
Other key services and benefits
Attendance Allowance A benefit that is not means-tested, for adults aged 65 or over who need help with personal care because of physical or mental disabilities.
continuing healthcare Care arranged and funded by the NHS for someone who has been assessed as having a primary health need for care.
Pension Credit An income-related benefit for adults of pensionable age.
Personal Independence Payments
A benefit for working age adults with a long-term health problem or disability.
Assessment and coordination of care
assessment of need Local authorities assess users’ and carers’ needs using a common framework of four eligibility levels:
• Critical Life is in danger, or serious abuse or neglect has occurred or might occur.
• Substantial Abuse or neglect has occurred or might occur, or the individual cannot carry out the majority of personal care or domestic routines and there is no one available to assist.
• Moderate The person cannot carry out several personal care or domestic routines, or engage in routine family or social activities.
• Low The person cannot carry out one or two personal care or domestic tasks, or engage in one or two routine family or social activities.
Local authorities have discretion over which eligibility threshold they set. Individuals assessed as having needs below this may not be eligible for care arranged or funded by their local authority. From April 2015, it is expected that all local authorities will be required to provide care to users assessed as having substantial or critical needs.
integration The coordination of working arrangements where multiple departments or public sector organisations are involved in providing a public service or programme.
personal budget Sum of money that a local authority allocates to a user to meet their assessed needs. Personal budgets can either be managed by the local authority, which commissions services for the user, or given to the user or their carer as a direct payment so they can buy their own care services.
58 Appendix Three Adult social care in England: overview
personalisation Social care policy aims to personalise services to individuals, adapting care to individuals’ particular needs and wishes. Personal budgets and direct payments are considered aspects of personalisation.
safeguarding Preventing the abuse, neglect and exploitation of vulnerable people, and responding when it has occurred, by investigating and putting in place protection plans. Local authorities work with other organisations to safeguard adults through local safeguarding boards.
Accountability arrangements
accountability system statement
Sets out central government accountability arrangements and mechanisms for each department at a high level.
joint strategic needs assessment
Analyses the health needs of local populations to inform and guide the commissioning of health, wellbeing and social care services in local authorities. Unitary and upper-tier local authorities and the NHS have had a statutory duty to produce annual assessments since 2007, and also produce joint health and wellbeing strategies.
local account A voluntary document published by a local authority that describes their progress in achieving their goals for adult social care.
market position statement A voluntary document published by a local authority that sets out their aims for working with independent providers to encourage a diverse market, as well as describing a local authority’s commissioning policies and practices.
peer challenge A voluntary process aimed to improve local authority services and processes. Involves a team visiting a local authority for several days to speak to staff and review documents, assessing achievements and shortcomings.
sector-led improvement Local authorities are managing and carrying out a range of programmes and projects under the banner of sector-led improvement, to share and learn from good practice and strengthen local accountability.

This report has been printed on Evolution Digital Satin and contains material sourced from responsibly managed and sustainable forests certified in accordance with the FSC (Forest Stewardship Council).
The wood pulp is totally recyclable and acid-free. Our printers also have full ISO 14001 environmental accreditation, which ensures that they have effective procedures in place to manage waste and practices that may affect the environment.

£10.00
9 781904 219095
ISBN 978-1-904219-09-5
Design and Production by NAO Communications DP Ref: 10352-001