adult learner recruitment and retention best practices is an adult learner? • several definitions...
TRANSCRIPT

Adult Learner Recruitment and Retention Best
Practices
Julio Vargas-Essex
Director of Undergraduate Admissions

Agenda
• What is an Adult Learner?
• Where do we start?
• What next?
• The Plan
• “Case Study” – A Non-Traditional Institution
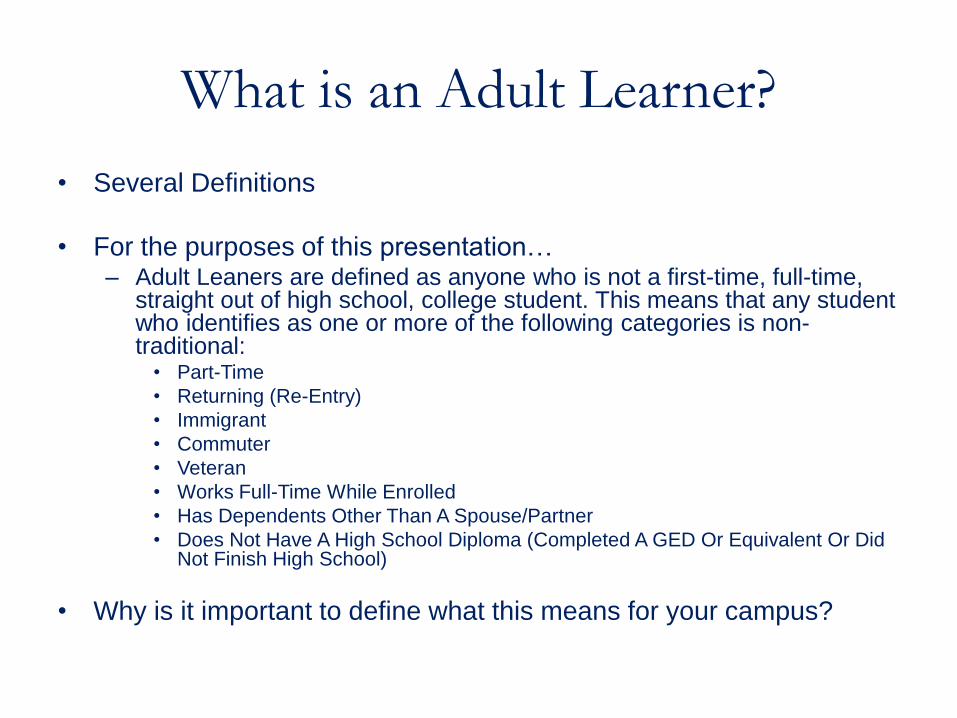
What is an Adult Learner?
• Several Definitions
• For the purposes of this presentation… – Adult Leaners are defined as anyone who is not a first-time, full-time,
straight out of high school, college student. This means that any student who identifies as one or more of the following categories is non-traditional:
• Part-Time
• Returning (Re-Entry)
• Immigrant
• Commuter
• Veteran
• Works Full-Time While Enrolled
• Has Dependents Other Than A Spouse/Partner
• Does Not Have A High School Diploma (Completed A GED Or Equivalent Or Did Not Finish High School)
• Why is it important to define what this means for your campus?

• What are the needs and motivations of an adult learner who comes to your college?
• What is the greatest anxiety of an adult learner who comes to your college?
• What is the greatest need of an adult learner to help them succeed and graduate from your college?

Where do we start?
• Is your campus read? – Evaluate your campus
– Situational • Job
• Health Problems
• Financial Problems
• Legal Problems
• Personal or Family Problems
– Dispositional • Expectations
• Self-esteem
• Level of Family Support
• Past Educational Experience
– Institutional • “Red Tape”
• Program or Application Fees
• Scheduling
• Policy or Procedures
• Enrollment Process

Where do we start?
• Adult participation is shaped by access to program information; recruitment should be viewed as multi-functional process of drawing people into programs.
• An institution must market programs effectively providing relevant and detailed information about programs. – Web-based
– Printed
– “Word-of Mouth”

What next?
• Identify realistic measurable goals
• How you will measure success and accountability
• Develop a committee/leadership team
• Identify partners and key stakeholders

“Case Study”
A Non-Traditional university
• 97% Transfer Students & Adult Learners
• More than 2/3 transfer directly from Metro Area Community Colleges

Metropolitan State:
a Unique Student Profile

Metropolitan State Transfer Students Persisted at Higher
Rates than Other MnSCU State Universities
40%
50%
60%
70%
80%
2nd Fall 3rd Fall 4th Fall 5th Fall
Pers
iste
nce R
ate
s –
Fall 2
005
Co
ho
rts
Metro State Full-Time/Transfers Other MnSCU State U's FT/Tsf
Metro State Part-Time/Transfers Other MnSCU State U's PT/Tsf
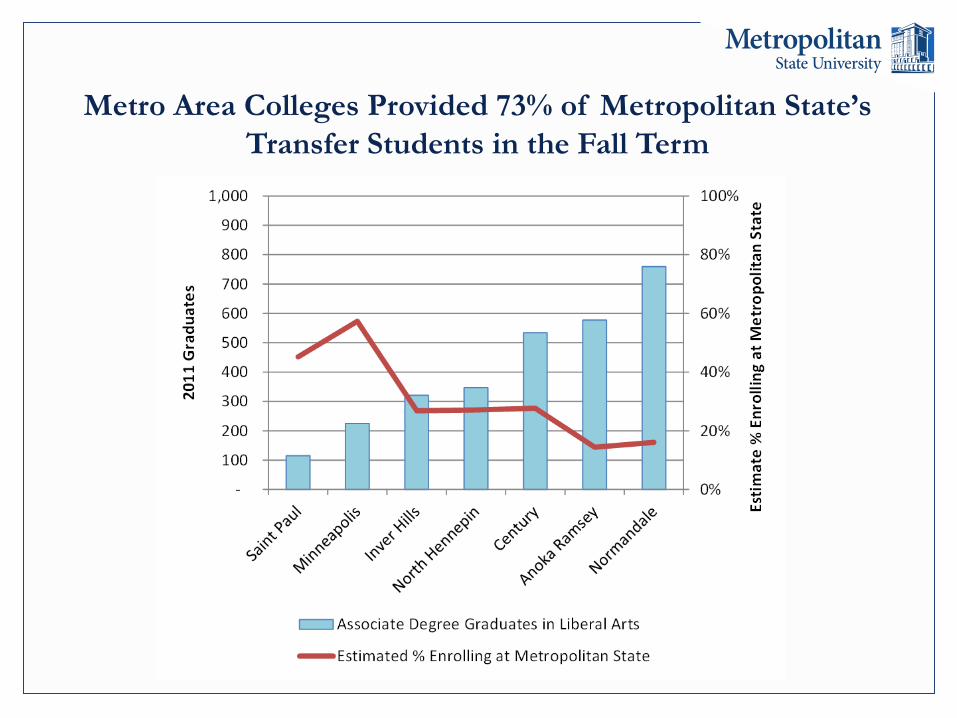
Metro Area Colleges Provided 73% of Metropolitan State’s
Transfer Students in the Fall Term

Why is Degree Completion Important
for Adults?
• Close the skills gap and meet the workforce needs
of the US
• State allocation funding continues to shift toward
outcomes

Twin Cities has a Substantial Market of Potential
Bachelor’s Degree Completers
66%
56%
50%
41% 41%
30%
0%
10%
20%
30%
40%
50%
60%
70%
-
20,000
40,000
60,000
80,000
100,000
120,000
140,000
160,000
18-24 25-34 35-44 45-54 55-64 65+
% H
old
ing
Bac
he
lor'
s D
egr
ee
or
In S
cho
ol
Nu
mb
er
of
MSP
Re
sid
en
ts
Age Groups
MSP Residents Not In School, Earned Some College, But No Degree
% of Peer Age Group Holding Bachelor's Degree or In School

Recruitment
Process begins with program information…
• Promotional Information and communication that prompt participants contact
• Must be followed by prompt response, one study has shown that the most common reason for adults not to enroll was because of poor follow up (24 Hours)
• Items should be inexpensive and eye-catching, basic information that speaks to potential clients for example “It’s fun, it’s free, it’s local and there’s assistance with child care”
• Should stress the non-school nature of programs
• Develop and leverage partnership with organizations and groups that serve adult learners
• Choose.metrostate.edu…

Marketing
• Rooted in mission statement
• Develop measurable program objectives
• Identify discrete market segments
• Develop integrated marketing plans that mix numerous media outlets and specific programs for specific market segments
• Conduct promotional activities such as “Open Houses or Information Sessions” not only on your campus but at other locations as well, targeting specific demographics. Partner activities with larger events to attract a captive audience.
• Separate marketing strategies for segments, including differential marketing channels and offers.
• Never make assumptions about your audience always be informed.
• Help cultivate career and educational goals from the beginning. In-depth interactive goal-setting activities will help students gain confidence, motivation, and will help students identify what areas that want to pursue.

What Mattered for Student Retention at
Metropolitan State?
1 - Prior College Credits
2 - Initial Credit Load
3 - First Term Academic Progress

Prior College Credits & First Term Credit Load were
Early Indicators of Persistence Rates
Transferring Over 20 Credits
+
Full-Time Enrollment
=
Higher Persistence and Lower Time-to-Degree

Number of Prior College Credits & First Term
Credit Load Made a Big Difference
0%
20%
40%
60%
80%
100%
None 1-19 20-39 40-59 60+
Pers
iste
nce R
ate
to
6th
Sp
rin
g
Number of Prior College Credits
Six-Year Persistence Rates - Fall 2003/05 Cohorts
Full-Time Enrollment 1st Term
Part-Time Enrollment 1st Term
0
1
2
3
4
5
6
7
None 1-19 20-39 40-59 60+
Mean
Years
to
Gra
du
ati
on
Number of Prior College Credits
Mean Time-To-Completion - Graduates from Fall 2003/05 Cohorts
Full-Time Enrollment 1st Term
Part-Time Enrollment 1st Term

First Term Academic Performance
& Next Term Enrollment Status
Subsequently Indicate Persistence Odds
1 First Term Grade Point Average Mattered
2 Changes in Enrollment Status Mattered

Enrollment Status from 1st Term to 2nd Term
• 67% of the Students Kept
the Same Enrollment
Status from the First Term
• 15% of the Students
Switched Enrollment
Status
• 18% Did Not Attend the
2nd Term
Stayed Part-Time,
35%
Changed PT to FT,
8% PT to Drop,
13%
Stayed Full-Time, 32%
Changed FT to PT,
7%
FT to Drop, 5%
Enrollment Status from 1st Term to 2nd Term
Fall 2003/07 Cohorts

Changes in Enrollment Status Mattered
for Persistence Rates
0%
20%
40%
60%
80%
100%
Under 2.0 2.0 to 2.99 3.0 to 3.49 3.50+
4th
Fall P
ers
iste
nce R
ate
First Term Grade Point Average
Students Who Maintained Enrollment Status
Persistence Rates: Fall 2003/07 Cohorts
Stayed Full-Time Stayed Part-Time
0%
20%
40%
60%
80%
100%
Under 2.0 2.0 to 2.99 3.0 to 3.49 3.50+
4th
Fall P
ers
iste
nce R
ate
First Term Grade Point Average
Students Who Changed Enrollment Status Persistence Rates: Fall 2003/07 Cohorts
Changed Part-Time to Full-Time
Changed Full-Time to Part-Time

First Term Academic Performance
Affected Subsequent Enrollments
24%
30%
38%
41%
0%
10%
20%
30%
40%
50%
<2.0 2-2.99 3-3.49 3.5+
% o
f S
tud
en
ts N
ot
En
roll
ing
2n
d T
erm
Students NOT Enrolling 2nd Term: Fall 2003/07 Cohorts
Full-Time 1st Term Part-Time 1st Term % Stop-outs

Stop-out Activity was Frequent
25% of the Students had 1 or More Stop-Out Terms
Distinguishing Stop-outs from Drop-outs is Important

Retention
• Retention is not separate from recruitment!!
• Academic Affairs
– Faculty Training
– Curriculum and Pedagogy adjustments (Competency and Adult Learner Theory)
– Class Offerings • When do you offer classes?
• How do you offer classes?
– Intrusive Advising
– Student Tracking and Communication - CRM
– Partnership Programs
– Career Exploration (Experiential Learning)

Retention
• Initial educational planning and life
assessment
• Written two/four year degree plan with
individualized degree option
• Credit for Prior learning assessments
• Accelerated courses with one class
meeting per week

Retention
• Student Support – Support Services
• Diverse Offerings
• When do you close?
– Communication Campaigns
– Intrusive Advising
– Orientation • Online Orientation/GAR
– Student Ambassador Program
– Student Senate
– Child Care
– Case Manager

Retention
• Shared Services
• Application Process
• First Term Programming (Metro 101,
Student Success Day)
• Financial Aid (Aid for Part-time Students,
Scholarships)
• Designate Admissions Counselors

What Seemed to Matter for Retention,
But Really Didn’t
1 Race/Ethnicity
2 Age
3 Family Income

Apparent Achievement Gap Based on
Race/Ethnicity Disappears
Gap Existed for First Term Academic Performance
But Had No Effect on Persistence Rates When Other Factors
Were Considered

First Term Academic Progress Gap
Based on Race/Ethnicity
0%
20%
40%
60%
80%
100%
Fall 2003 Fall 2004 Fall 2005 Fall 2006 Fall 2007 Fall 2008 Fall 2009 Fall 2010 Fall 2011
% w
ith
Sa
tis
fac
tory
Ac
ad
em
ic P
rog
res
s
First Term Academic Progress
White Students Students-of-Color

Gap Narrows Considerably for 2nd Fall Persistence
0%
20%
40%
60%
80%
100%
Fall 2003 Fall 2004 Fall 2005 Fall 2006 Fall 2007 Fall 2008 Fall 2009 Fall 2010
% P
ers
itin
g 2
nd
Fa
ll
2nd Fall Persistence Rates
White Students Students-of-Color

Students-of-Color Narrowed the Gap Because They Persisted at
Higher Rates Regardless of 1st Term Academic Progress

The Remaining Achievement Gap in 2nd Fall Term May Be
Explained by the Complex Effects of Family Income

An Apparent Achievement Gap in Graduation Rates Was
Largely Due to Differences in Prior College Credits

Persistence Rates Based on Age Groups
• Related to Differences in Prior College Credits, Not Age
• Few Students Under Age of 20 Enrolled at Metropolitan
State. From 2003/05 Cohorts:
• Only 6% of the Students were 20 or Younger
• Only 23% of Them Transferred 20+ Credits, Compared to 90%
of Older Students
• Only 35% of Them Persisted to 6th Spring, compared to 63% of
20-25 Age Group
• More of Them Transferred to Other Universities than Older
Students (38% of Students Under 20 Transferred Out Compared
to Less than 20% of Older Students)

Family Income Mattered in Earlier Years,
But Not in Recent Years
0%
20%
40%
60%
80%
100%
Fall 2003 Fall 2004 Fall 2005 Fall 2006 Fall 2007 Fall 2008 Fall 2009 Fall 2010
2n
d F
all
Pe
rsis
ten
ce
Ra
te
2nd Fall Persistence Rates by Income Level
Higher Income Low Income (Pell Recipient)

What Did Not Matter for Student
Retention at Metropolitan State?
Two Characteristics that Showed No Relationship to
Retention (Despite National Trends):
Gender
Parental Education

Metropolitan State Misrepresented by
its Official Graduation Rate
Although Few Students Enroll as First-Time
Students, they are used for the official graduation
rate measurement.

Persistence Rates for Students Included in “Official”
Measure of Graduation Rates

Things to think about:
Why the “Official” Graduation Rate is Problematic
• Widely Publicized Metric
– Included in President’s College Scorecard
• Accounts for Less than 5% of Metropolitan State’s students
– Accounts for Majority of Students Attending Traditional
Universities
• Fails to Ask About Student’s Prior College Experience
– Although First-Time Students may not be a Good Fit at
Metropolitan State, Transfer Students are a Good Fit. Yet, no
Success Rates for Transfer Students are Published.

What Mattered for Student Retention
at Metropolitan State University
• What Mattered the Most
– Prior College Experience
– Initial Credit Load & Subsequent Changes
– First Term Grade Point Average
• What Seemed to Matter, But Didn’t Matter Much
– Race/Ethnicity
– Age
– Family Income
• What Clearly Did Not Matter
– Gender
– Parental Education

?
