adsorption of nitrogen on carbon adsorbents at low ... · pdf filef rcuncl lich equation. the...
TRANSCRIPT

Journal of Research of the Nationa l Bureau of Standards Vol. 55, No. !, July 1955 Research Paper 2600
Adsorption of Nitrogen on Carbon Adsorbents at Low Pressures between 690 and 900 K
Juan de Dios Lopez-Gonzalez,! Frank G . Carpenter,! and Victor R. Deitz
X i t rogen adsorp tion i,otherm s \\'ere dete rmin ed on t hree carbon adso rben ts (two bone chars and an act ivated coco nut shell charcoal) at t hree tem peratures between 69° and 90° K and at relat i ve pre:isurcs from 10- 7 t o 0.9. A cr.vost at was uscd to ob tain tcm perat u res below t he normal bo iling point of l iq uid ni t rogen . The a t tainmen t of steady pressure r eadi ngs at v cry low p ressures required consider ab ly more t im e t han a t higher pressur es. Con ect ions for t her momolecul ar diffusion \\'ere found to be app reciabl e at pressures bel o\\' one m illimeter of mercury .
A t relative pressures below 10- ' , t he amoun t of ni t rogen adso rbed depended upon t he co nd i t io n of t he surface in regard to prev ious adsorptio n of ni trogen. A techniq ue in vo lv ing a series of co nsecut i \'e adsorp t ions at lo w temperatures and o u t~ass i n gs a t r oom temperat ure led to a rep rod ucib le iso t herm a t low p ressures. T hese data co uld be rep resen ted by a F rcu ncl li ch equation. The Bruna uer , Emmett, T ell er su r face areas of t he carbon acl so rbc nt s wer e also dct'er minecl .
1. Introduction
During the las t decade the ma in emph asis of l'esea reh in gas adsorpLion has been on the evaluaLion of surface area. T he success aLla in ed has been d ue la rgely to Lile development of t ile Brun auer, E mm ett , T eller (B.E.T .) t\teor.\' of muHimoleeular adsorption and to the cons t rucLive er itieal work tha t followed . 'I' ll(' fac t LhaL Lltc H.E. T . equat ion was inappli cable to data aL rel at ive press ures 2
below 0.05 was oj' Ii Ltlc conscq uence because adsorpLion meaSLlrcmcnts in this rcgion werc noL needcd in the smfaee-al'ea dete rmin a tions. Expcrimental d ifficul ties havc b ec n an add it ional causc for t lte scarciLy of da ta on phy sical adsorption at low relative pressures.
Adsorp tion dat a at vcr.v low prcssures arc necessary for t he calculation of thC1'mocl ,vnamie fu nctions of the adsorbed phase . Th ese fun ctions are of spccial in terest in t he range of very low su d ace-coverage [1].3 The in Lerest in such adsorption isot herms ha" been further st imulated by t he possibili ty of obtain ing detailed inform ation concerning t he heterogeneity of a surface. Th e recen t p apers of Hill [2], H alse,\' [3 ], Rh odin [4], Halsey and T aylor [5], Sips [6], and Cook, P ack, and Oblad [7] indicate some promising a pproaches. I t is believed that surface heterogeneit ies and im pur it ies are t he more common cause of t he varia ble proper ties of commercial carbon adsorbents.
N i trogen-adsor pLion m easurements at relative pressures above 10- 2 were r epor ted by D eit z and Gleysteen [8] for a number of carbon adsorben ts. As t hese samples were still available, the oppor tuni ty was taken t o exte nd t he data to relativc pressures of about 10- 7• T his cOl'l'esponds to absolute pressurcs of abou t on e-ten th micron of H g.
I Research Associate of the Natio na l B ureau of Sta ndards representing the Bone Char Research Project, Inc.
, R ela ti ve p ressure is the rat io of t he act ual pressufe of nitrogen to its eq uilibrium vapor pressur C' .
s ~" igurC's in brackets ind icnlc t he li tera t ure references at the end of Lhis paper .
II
2 . Experimental Procedure
A [our-s tagc McL eod gagc ,4 shown in fi gure I , was added to a conventiona l ad orp tio ll apparatus. The calibrat ion was made gravimet rically withmercll ry a ll d b.\' pressu re-voLume data, using hel ium . Pressurcs dow n to a bou t 0.1 mm H g co uld be mcas urcd wi th an acc uracy of about 1 pCl'cent . An accuracy of
t Acknowledgment is made to \ V . V. Loebcnf' t r in of t he Surface Chemistry Section for t he deSign and fabri cation of this gage.
HIGH VACUU M
X 1000
X 100
I ..-- TO MERCURY LEVE LI NG BULBS
REFR IGERANT OR
CRYO STAT
F[(l U RE 1. Diagrammatic sketch of the gas adsorption system.
2 percent was attained for pl'essures down to 10-2 mm Hg, 3 percen t for pressures to 10- 3 mm, and 5 percent or more for pressures as low as 1O-~ mm, the lowest pressure attempted. The accuracy of the high-pressure (above 10 mm) readings was about O.05mmHg.
Nitrogen from a cylinder of compressed gas (waterpumped) was purified by passage over copper at 350° C for the removal of residual oxygen and then through Ascarite and phosphorous pentoxide on glass cotton to remove carbon dioxide and water vapor.
The temperature of the bath surrounding the adsorption chamber was determined with either a nitrogen or oxygen vapOf-pressure thermometer. The temperatures 90.0° and 77.7° K were obtained with liquid oxygen and liquid nitrogen, respectively, boiling at at,mospheric pressurc. The temperatures 72.2° and 69.5° K were obtained with a special cryostat described in the following paragraph. In all cases the temperat ure of the adsorption chamber was constant to within about 0.05° K.
2.1. Cryostat
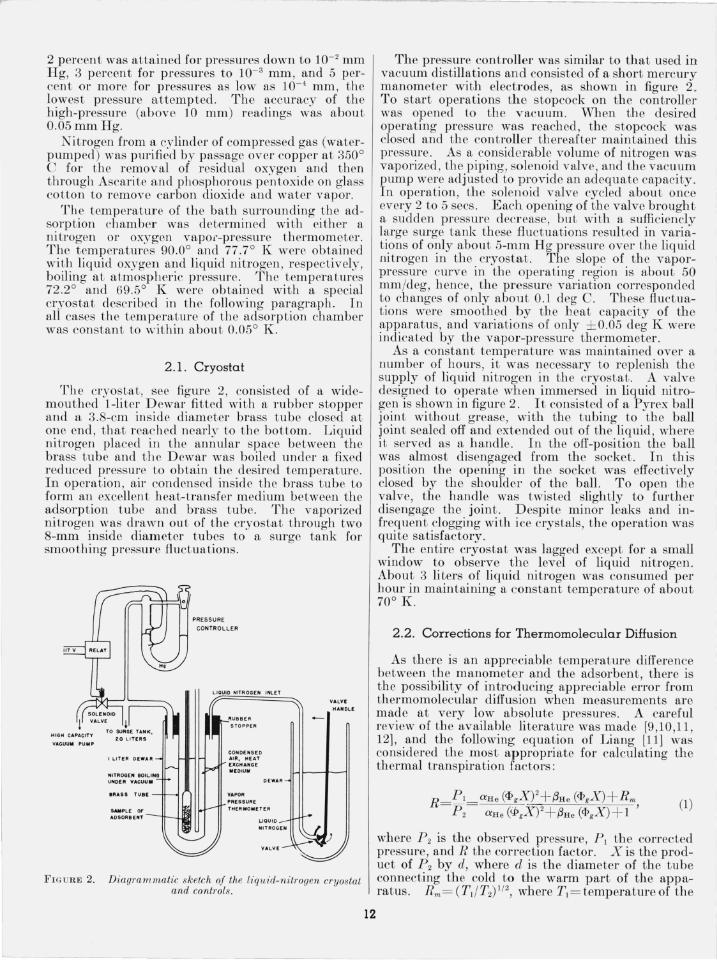
The cryostat, see figure 2, consisted of a widemouthed I-liter Dewar fitted with a rubber stopper and a 3.8-cm inside diameter brass tube closed at one end, that reached nearly to the bottom. Liquid nitrogen placed in the annular space between t he brass tube and the Dewar was boiled und er a fixed reduced pressure to obtain the desired temperature. In operation, air condensed inside the brass tube to form all excellen t heat-transfer medium between the adsorption t ube and brass tube. The vaporized nitrogen was drawn out of the cryostat through two 8-mm inside diameter tubes to a surge tank for smoothing pressure fluctuations.
HtGH CAPACITY
VACUUM PUMP
f I.ITER OE .... 1t
NITltOGEN lOlLING UNOE" VACUUM
.... us TUllE
SAMPLE OF ADSORBENT -;_w;JI
PRESSURE
CONTROLLER
III:U88ER
STOPPE"
CONDENSED AIR, HEAT (XCHANGE MED IUM
VAPOI't PRESSUrtE
DEWAR
THERMOMfTffl
"'''LV'! HANDLE.
FIG U RE 2. Diagrammatic sketch of the liquid-nitrogen cryostat and controls.
'---.-~--
12
The pm",ure controller was ,imil.r to that u"d iJ vacuum distillations and consisted of a short mercury manometer with electrodes, as shown in figure 2. To start operations th e stopcock on the controller was opened to the vacuum. When the desired operating pressure was reached, the stopcock was closed and the controller thereafter maintained this pressure. As a considerable volume of ni trogen was vaporized, the piping, solenoid valve, and the vacuum pump were adjusted to provide an adequate capacity. In operation, the solenoid valve cycled about once every 2 to 5 sees. Each opening of the valve brought a sudden pressure decrease, but with a sufficiencly large surge tank these fluctuations resulted in variations of only about 5-mm Hg pressure over the liquid nitrogen in the cryostat. The slope of the vaporpressure curve in the operating region is about 50 mm/deg, hence, the pressure variation corresponded to changes of only about 0.1 deg C. These fluctuations were smoothed by the heat capacity of the apparatus, and variations of only ± 0.05 cleg K were indicated by the vapor-pressure thermometer.
As a constant temperature was maintained over a number of hours, it was necessary to replenish the supply of liquid nitrogen in the cryostat. A valve designed to operate when immersed in liquid nitrogen is shown in figure 2. It consisted of a Pyrex ball joint without grease, with the tub ing to the ball joint sealed off and extended out of the liquid, where it served as a handle. In the off-position the ball was almost disengaged from the socket. In this position the opening in the socket was effectively closed by the sho ulder of the ball. To open the valve, the handle was twisted slightly to further disengage the joint. Despite minor leaks and infrequent clogging with ice crystals, the operation was quite satisfactory.
The entire cryostat was lagged except for a small window to observe the level of liquid nitrogen. About 3 liters of liquid nitrogen was consumed per hour in maintaining a constant temperature of about 70° Ie.
2.2 . Corrections for Thermomolecular Diffusion
As there is an appreciable temperature difference between the manometer and the adsorb en t, there is the possibility of introducing appreciable error from thermomolecular diffusion when measurements are made at very low absolute pressures. A careful review of the available literature was made [9,10,11, 12], and the following equation of Liang [11] was considered the most appropriate for calculating the thermal transpiration factors:
aHe (<I>gX?+f3He (<I>gX) + R", aHe (lPgX)2+ f3He (<I>gX) +1 ' (1)
where P2 is the observed pressure, PI the corrected pressure, and R the correction factor. X is the product of P 2 by d, where d is the diameter of the tube connecting the cold to the warm part of the apparatus. Rm= (TdT2)1 /2, where TI=temperatureof the
('o ld end of the co nnective tube (adsorbent temperature) and T2= temperature of th e warm end of the co n neetive tu be (room temperature). The terms a H e and /3He arc empirical constants: (1) ll!He= 2.52 independent of temperature and (2) /3He = 7.68 (J - Rm), the press ure being m easured in millimeters of mercury and the tube diameter in millimeters. The factor <Pg is the empirical relative "pressureshifting factOl"" and is dependent upon the gas bu t not the temperature. It is related to the collision diameter of the gas molecules. With the above listed values of ll! and /3, <PHe= 1 and <PN2 = 3 .28 .
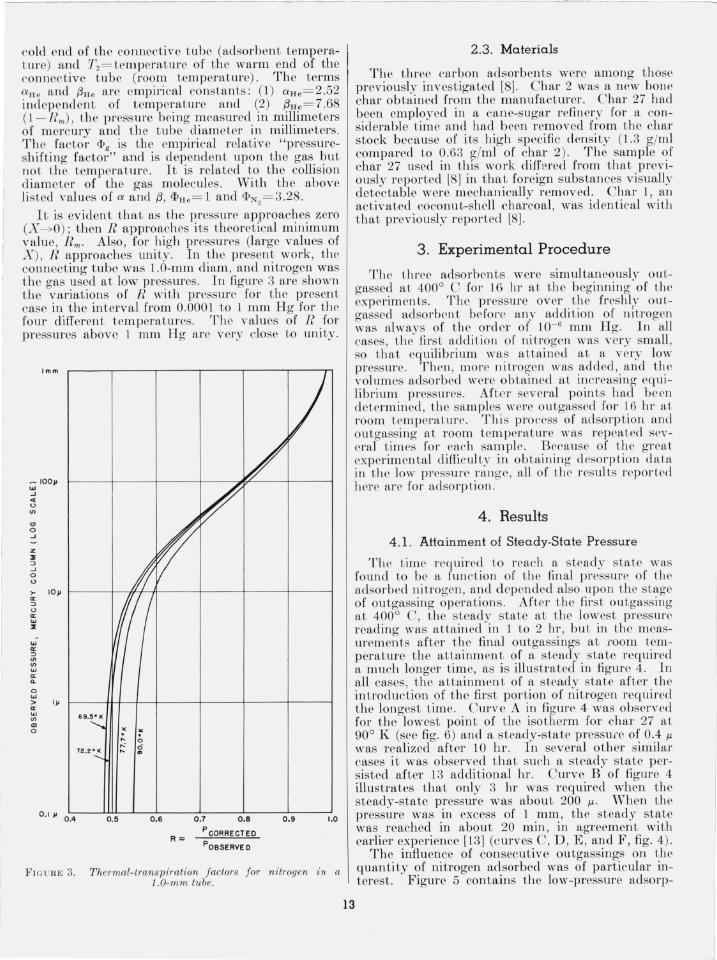
It is evident that as the pressure approaches zero (X--?O); then R approaches its theoretical minimum value, Rm- Also, for high pressures (large values of X ), R ~pproaches unity. In t he present work, the connectmg tube was l.O-mm diam, and nitrogen was the gas used at low pressures. In figure 3 are SbO'VJl the variations of B with pressure for th e present case in. t.he in terval from 0.0001 to 1 mm Hg for t he four dIfferent temperatures. The values of R for pressures above 1 mm Hg are very close to unity.
I mm
_lOOp .., ...J .. o <n
C> o ...J
z :E ::> ...J o o ~ lOp r-----T-.¥7-ft------r----~-----+----~ ::> o a: '" :E
'" ex: ::> <n <n
'" ex: a.. o ... > Ip ex: ... <n CD o
69.,-1(
" " .... 0 ,..: ci .... '"
0.1 P 0''-;.4:----~~..I....-__:_l:__------'L,-----L..----..L-----.J 0.5 0.6 0.7 0.8 0.9 1.0
FIGU RE 3.
R= P CORRECTED
POBSERVE 0
Thermal-transpiration factors for nitrogen in a 1.0-mm t1.be.
13
2.3. Materials
The t hree carbon adsorbents were among those previously investigated [8J. C har 2 was a n ew bone char obtained from the manufacturer. Char 27 had b.een empl?yed in a cane-sugar refinery for a co nSIderable tIme and had been removed from the cbar stock because of its high specific density (1.3 gjml compared to 0.63 gjml of char 2). The sample of char 27 used in this work differed from that previously reported [8] in tha.t foreign substances visually detectable were mechamcally removed. Char 1 an activated coconut-shell charcoal, was identical ,~ith that previously reported [8J .
3 . Experimental Procedure
The three adsorb en ts were simultaneously outgassed at 400 0 C for 16 hI' at the b eginnin g of the experimen ts . Th e pressure over the freshly outgassed adsorbent before any addition of nitrogen was always of t he order of 10- 6 mm Hg. In all cases, t he first addition of nitrogen was very small so that equilibrium was attained at a very lo,~ pressure. fhen , more mtrogen was added, and the ~olumes adsorbed wer~ obtained at increasing equilIbrium pressures. After several points had been determined, t be samples were outgassed for J 6 h1' at room temperature. This proccss of adsorption and outga~sing at room temperature was repeated several tImes for each sample. B ecause of the areat experimcntal diffi cul ty in obtaining desorption bdata in the low pressure range, all of the resul ts reported here arc for adsorption .
4 . Results
4 .1. Attainment of Steady-State Pressure
The time required to reach a steady state was found to b e a function of tbe final pressure of the adsorbed nitrogen , and d epend ed also UpOl1 the stage of outgassing operations. After t be first outaassina
. 0C J d b b at 490 , t 1e s.tea . 1. state at t he lowest pressure readmg was attamed 111 1 to 2 hI' , but in the measm'ements after the final outgassings at room temperature the attainm ent of a steady state required a much longer time, as is illustrated in figure 4. In all cases , t he attainment of a steady state after the introduction of the first portion of nitrogen required th e longest time. Curve A in figure 4 was observed for the lowest point of the isotherm for char 27 at 90 0 K (see fig. 6) and a steady-state pressure of 0.4 J.L was realized after 10 hr. In several other similar cases it was observed that such a steady state persisted after 13 additional hr. Curve B' of fiaure 4 illustrates that only 3 hI' was required wh~n the steady-state pressure was about 200 J.L. When the pressure was in excess of 1 mm, the steady state was reached in about 20 min, in agreement with earlier experience [13J (curves C, D , E, and F, fig. 4).
The. influen.ce of consecutive outgassings on the quantlty of mtrogen adsorbed was of particular interest. Figure 5 con tains the low-pressure adsorp-
-------- --

700mm
I I
\xx, ,..!
IOOmm I
I I [<>00 E
I 0 I
c
I
I I I
!
~ I I
,~ 1 I
I
B I
I \ I I
\ I I I I
I I
I j
.~ I
I I
I I A I I I I .-j ~ I
IOmm
" '" ::> -"
° <.)
>-a: ::> Imm <.) a: UJ
"'. UJ a: ::> <f>
~ 100 ~ Ii: 8 > a: UJ <f> CD 0
10 ~
I ~
0.1 ~ I I I I I I o 10 12 13
TIME , HOURS
FIGU RE 4. Attainment of steady state at various final pressW"es .
~ ... $ 'E
Curyes A and B: char 27 at 900 K ; C , D , E, and F: char 27 at 72.20 K .
1 6 ,-------,--------,--------~~=---~------__,
12 r---~~~T_----_i--------+_------_+------__4
! 8~--f_--~------_i--------+_------_+------__4 ~
! :-
4·H ---+----+----+-----:l,.L=----__4
O ~ _ _ _ ~~ __ ~~~ __ _L_~-~-~-~ I XIO-:3 2XIO-3 3 XIO-3 4 XIO- 3 5XIO-3
RELATIVE PRESSURE, p/ po
FIG URE 5. Low-pressure isotherms of nitrogen on char 2 at 90° K.
T he infiu cnce of consecuti ve outgassings with the adsorbent at room tern perat.ure is shown; in i t ial outgassin g a t 4000 C .
tion data for char 2 at 90° K , and it m ay be seen from this example tha t t he amoun t adsorbed increased with consecutive outgassings. By in terpolatin g each curve to an equilibrium relative pressure of 2 X 10- " the volume of nitrogen (milliliter STP) adsorbed was 0.004 ml aftcr the initial outgassing at 400 0 C and 0.65, 1.6, 4.3, 9.1, 9.1, and 9.1 ml , respectively , after each of six consecutive olltgassings
L __ _
14
TARLE 1. Adsorption,.,f nitrogen on char 2
90.00 K n,7° K 69.50 K
pl I'o I
F plI'o V plI'o 11 ------------ ---
rnl rnl ml 1. 63 X lO- 7 3. ()() I. 28 X 10- 7 3. 60 6. 72X lO--6 9. 05 I. 23X JO-6 4. 25 2, 2I X I0- 6 6. 23 5. 33XIO-' II. 76 5. 63 X JO--6 5.50 2.05 X IO-' 8. 69 3. 27 X 10-' 14.80 6. 33 X 10-' 7.44 2. 67XlO- ' ll, 16 5. 26X lO-' 21. 48 6, 22X lO- ' II. 76 3.09 X Io-' 12. 60 I. 87X lO-2 24 . 63
3. 25 X IO-' 15. n 6. 97 X IO- ' 14 . 71 4, 18XIO-2 27. ()() 0. 0157 20.33 8. 30X 10-' 15.10 5. 72 X IO-' 27.96
, 0519 24.15 2. 54X 10-' 17. 96 9. 63 X IO-2 30.22 . 0937 26.53 6. 72X 10-' 20. 39 0. 1215 31. 69 . 1319 28. 24 1. 43 X 10- 2 22. 41 . 1634 33.40
. 1984 30.83 3. 63 X 10- 2 24. 92 . 2197 35.95
. 2811 34.02 5. 09 X Io- ' 26. II ,2725 38. 36
. 3131 35. 15 6. 93 X 10- 2 27.30 .3493 42. 15 --- -- ------. - ---- 9. 14X l0-2 29. 10 . 4401 47.50 ------------ -- .- - 0.1323 30. 41 .5209 53. 54
------------ ----- . 1785 32.38 . 6847 73. 90 ---------- ----- . 3942 41. 70 ---- - ----- - -----
--- ---.---- ----- .5822 53. 68 --- ------- - -----
1' ,,,= 25.54 ' ·,,= 27.33 VI'/I= 28.65
1'0=2,698 mm R g 1'0= 796.5 mIll H g 1'0= 270.3 mm Hg
11 expressed at 273.16° K and 1 atm
TARLE 2. Adsorpti on of nitl'ogen on cha?O 27
90.0 0 K 7i.io K i2.2° K:
1'11'0 IT pi p o F 1'11'0 V
ml ml m l 8. 05 X 10- 8 0. 553 1. 68X IO-7 0. 90 3. 83 X lO .... 1. 76 4. 66 X 10-' 1. 28 8. 31 X IO- 7 1. 28 5,53X IO-' 2, 47 1. 81 X 10-' 1. 48 3. 36X IO-6 1. 60 5. 3I X lO- ' 3. 42 2. 54X 10-' 1. 59 2. 90XIO-' 2. 00 8. 39 X 10- 3 5, 00 1. ll X IO- ' 1. 91 3. 19X 1O- ' 2.88 0.0272 5. 81
3. 20 X Io-' 2. 19 4.67 X Io- ' 3. 01 , 0707 6. 69 6. 73 X lO-' 2.65 1. 46X Io-' 3. 68 , 0920 7.03 9. 87 X Io-' 2. 95 4, 23XIo-' 4, 31 , 1396 7.63 3. 34 X 10-' 3.68 0. 0153 5, 16 . 1904 8. 27 7. 51X lo-' 4.23 , 0362 5,80 .3496 10, 21
0.0116 4. 54 . 0748 6.48 . 3982 10.82 . 0170 4. 83 . 1481 7.40 , 553 1 13.23 . 0232 5.08 . 2205 7.80 . 6162 14.47 .0283 5.25 . 2945 8.57 .6780 16.25 . 033 1 5.38 . ;:1515 9.20 . 7774 20. 39
, 0383 5.51 .4 194 9. 96 , 8474 26.63 . 0445 5.65 . 5654 II. 88 , 9212 39.53 . 0597 5.94 . 7934 17. 69 , 9574 53.54 , 0923 6. 43 .8724 22.52 , 1147 6. 69
. 1482 7.07
. 1979 7.60
. 2072 8. 57
. 3075 8. 79
- ----- - -----
" ,,= 6. 28 ' ·,,= 6.6D V ",= 6.95
Po= 2,698 mm H g 1'0= 796,5 mIll Hg Po= 397,3 mm H g
at room temperature. Th e isotherms becom e coinciden t above a r elative pressure of about 10- 2, in which region this effect was not eviden t.
In the first adsorption experimen ts with chars 2 and 27 after the first outgassing at 400 0 C, it small increase in pressure was observed i.n the system when t he first por tion of nitrogen at very low pressure was introduced in to t he adsorption chamber. This increase was observed only during the first few minutes
, 1
TABLE 3. Adsorption oj nitrogen on char 1
90.0° K
pip, pip, I '
-------- --------------------1
7.23X I0- ' I 1. 5XIO-'
5.7X I0-' 1.74XI0- · 3.5I X I0- ·
5.33X 10- ' u.8X IO- ' 2.7 X I0-' 5.2X IO-' 7.9X 10-'
0.0126 .0155 . 0235 . 0361 . 0543
. 06S7
. 0976 · 11 29 . 1253 . 1389
· 1525 · 1823 . 2092 . 2338 . 2493
. 2571
. 2592
. 2627
.3387
.3699
_.-----------. ----------------------------------- - -----------------.---------------. -----------------------------.-.-------------.-.---.----
-----.----_._-
rnl 3 1. 37 56.48
101. 60 135.59 161. 07
174.41 18 1. 64 220.81 242.34 252.34
26 1. 15 268.06 279.05 292.5 1 306. 76
316.79 327.62 333.46 :33(j.94 340.08
:]4:1.00 348.52 :352.56 :)54.87 :],\6.0:3
356.5 1 356.87 357.29 :364 . 20 :173. 16
3.46X I0- ' 2.95X 10-' 9.26X 10-' 2.30X I0- ' 4.J9 X 10- '
8.67X 10- ' 1.50X 10-' 2.40X 10-' 2.79X 10-' 7.12 X I0- '
0.0 173 .0254 .04 12 .0482 . 0585
.0744
. 0835
. 1:1:32 · Iii:] .243 1
.32 19
.3552
.4097
. 465 1
.5084
.53 16 · (i317 . 6897 .7136 . 7662
rnl 3 1. 37
JOG 36 141. 88 178.05 201. 22
223.06 235.86 246.65 251. 05 270.59
293. 73 304.91 320.04 325. J6 33 1. 40
339. 06 342. 73 354.35 360.39 364. 88
370. 68 372. 24 374.98 376.95 378. 78
379.58 383. 84 386.50 387. 20 387.44
· 7672 390. 61 · 8241 393. 46 · 8290 394. 59 · 8377 395. 58 .87,13 399. 78
.9282 402. M · 9328 405. 47 . 9687 410.45 .98 10 420.9 1 .9880 43 1. 76
· 9996 471. 56
I------·-·--~--·--·- ---------------\ ' .. =378
Po= 2,698 mm fI g
1' .. =397
Po= i96.5 mm H I-'!
of contact, and then the pressure decreascd in a normal way toward equilibrium. When t his effect was observed, the final values of the relative pressures were notably high. A possible explanation is presented in a later paragraph.
The Limes required to realize a steady state for char 27 were only about half those required for chars 2 and 1. at the sam e final pressure. Periods of abou t 50 hl' were necessary t o attain equilibrium in chars 1 and 2 at t he lowes t pressures obtained.
The volumes of nitrogen adsorbed for char 2 (69.5° 77 .7°, 90.0° K ), char 27 (72.2°, 77.7°, 90.0° K ) , a~d char 1 (77.7°, 90.0° K ) are given in tables ] , 2, and 3, r espectively. The data recorded are th~ final steady-state values observed after a number of consecutive outgassings at room tempera Lures suffic ien t to yield reprodu cible values for t he volumes of nitrogen adsorbed.
4.2. Calculation of Isotherm Equation
An isotherm equation was sough t, valid for t he region of the lowest measurable pres ures, which could then be used with some confidence to extrapolate to the volume adsorbed at pressures too low to meaSUl'e. Such an extrapolation is necessary in t he calculation of thermodynamic fun ctions of adsorbed molecules [14].
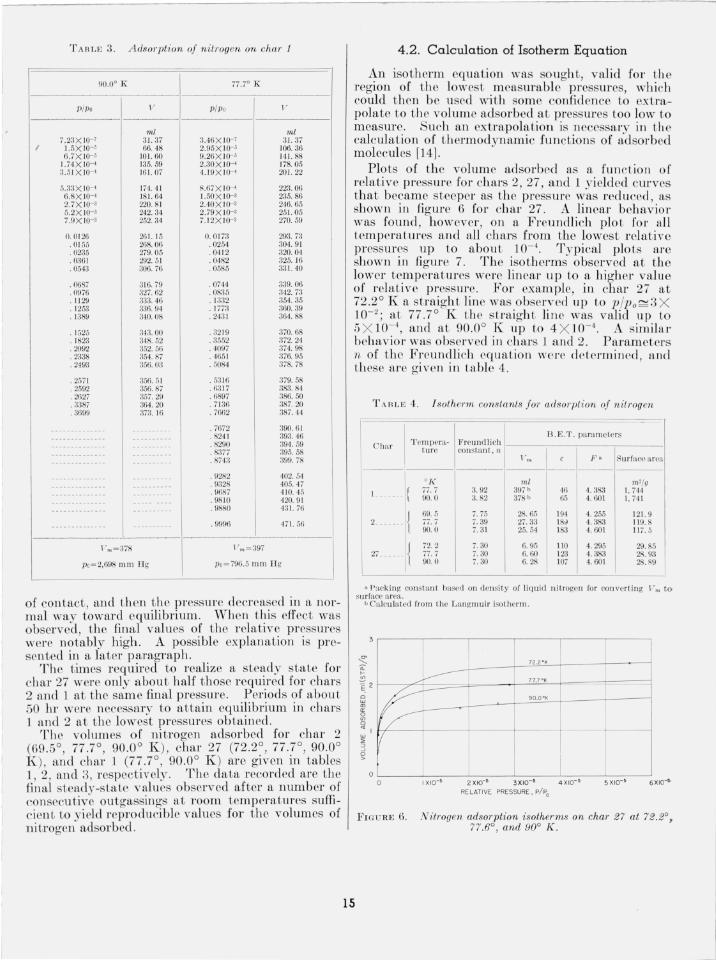
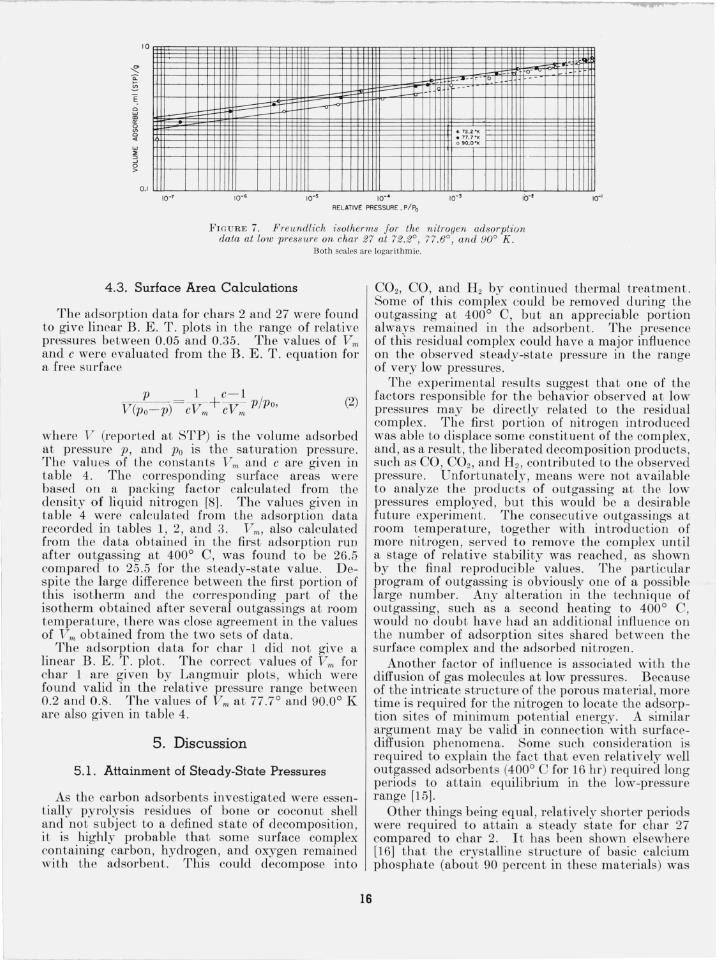
Plots of the volume adsorbed as a function of relative pressure for chars 2, 27, and 1 yielded curves that became sLeeper as the pressure was reduced , as shown in figure 6 for char 27 . A linear behavior was found, however , on a Freundlich p lot for all temperatures and all chars from the lowest relative pressUl'es up to about 10- 4• Typical plots are shown in figure 7. The isotherms observed at the lower temperatures were linear up to a higher value of relative press ure. For example, in char 27 at 72.2 ° K a straight line was observed up to p/Po~3 X 10- 2 ; at 77.7 ° K the s tra ight line was valid up Lo 5 X lO- \ and at 90.0° K up to 4 X IO- 4 • A similar behavior was observed in chars 1 a nd 2. Parameters n of Lhe Freundli ch equation w('re determin ed, and these are given in Lablc 4.
15
T AH LB 4. I sotherm constants Jor adsorption oj nil?'ogen
I B .E.T . parameters
C har
I 'T'C'lll penl- Freundlich
ture constan t , fl \ ' .. c / ,' II. Surface area
--- ------- -
I{ 0 / ( ml m'l(f L . 77.7 3.92 097 b 4() 4.3S3 1.744
90.0 0.82 378 b 65 4. 601 1. 741
{ ()9.5 7. i 5 28.65 194 4.255 121. 9 2 __ • __ 77.7 7.39 27.33 18,) 4.380 \19.8
90. 0 7.31 25.54 183 4. 601 117.5
{ 72.2 7.30 6.95 110 4.295 29.85 27 _ .. 77.7 7. 30 6.60 123 4. 383 28.93
90. 0 7.30 6. 28 107 4.601 28. R9
110 Packing constant based on density of liquid nitrogen for converti ng V", to surface area.
b Calculated from t he Lang muir isotherm.
8 co gj <f) o "', w
" :l o >
o
I
c; 'I
o . I XIQ 5
I 1 I
72.2·K
77.7·K
90.0·K 1
I - -2XK)~ 3XIO ~ 4 XIO ~
RELATIVE PRESSURE, p/Po
1 I
l
i ~
5XIO ~
Fw URE 6. Nitrogen adsorption isotherms on char 27 at 72.2°, 77.6°, and 90° K .
~ 0:: f-!!!-E 0
"' '" '" 0 Ul 0 «
"' :> :> ..J 0 >
10
-
0.1
= -
(I 72.Z 0 1(
. 77.7 °1( 090.0 "1(
.... ';
10-1 10-5 10-4
RELATIVE PRESSURE . p/Po
FIG URE 7. Freundlich isotherms for the nitrogen adsorption data at low pressure on char 27 at 72.2°, 77.6°, and 90° K .
Both scales arc logarithmic.
4.3. Surface Area Calculations
The adsorption data for chars 2 and 27 were found to give lineal' B. E. T . plots in the range of relative pressures between 0.05 and 0.35. The values of Vm and c were evaluated from the B . E . T . equation for a free surface
(2)
where V (reported at STP) is the volume adsorbed at pressure p , and Po is the saturation pressure. The values of the constants V rn and c are given in table 4. The corresponding surface areas were based on a packing factor calculated from the density of liquid nitrogen [8]. The values given in table 4 were calculated from the adsorption data recorded in tables 1, 2, and 3. V rn , also calculated from the data obtained in the first adsorption run after outgassing at 400° C, was found to be 26.5 compared to 25.5 for the steady-state value. Despi te the large difference between the first portion of this isotherm and the corresponding part of the isotherm obtained after several outgassings at room temperature, there was close agreement in the values of V m obtained from the two sets of data.
The adsorption data for char 1 did not give a linear B. E. T . plot. The correct values of Vm for char 1 are given by Langmuir plots, which were found valid in the relative pressure range between 0.2 and 0_8. The values of Vm at 77.7° and 90.0° K are also given in table 4 .
5. Discussion
5 .1. Attainment of Steady-State Pressures
As the carbon adsorbents investigated were essentially pyrolysis residues of bone or coconut shell and not subj ect to a defined state of decomposition, it is highly probable that some surface complex containing carbon, hydrogen, and oxygen remained with the adsorbent. This could decompose into
'---- ---
16
CO2, CO, and Hz by continued thermal treatment . Some of this complex could be removed during the outgassing at 400° C, but an appreciable portion always remained in the adsorbent. The presence of this residual complex could have a major influence on the observed steady-state pressure in the range of very low pressures.
The experimental results suggest that one of the factors responsible for the behavior observed at low pressures may be directly related to the residual complex. The first portion of nitrogen introduced was able to displace some constituent of the complex, and, as a result , the liberated decomposition products, such as CO, CO2 , and H 2 , contributed to the observed pressure. Unfortunately, means were not available to analyze the products of outgassing at the low pressures employed, but this would be a desirable future experiment. The consecutive outgassings at room temperature, together with introduction of more nitrogen, served to remove the complex until a stage of relative stability was reached , as shown by the final reproducible values. The particular program of outgassing is obviously one of a possible large number. Any alteration in the technique of outgassing, such as a second heating to 400° C, would no doubt have had an additional influence on the number of adsorption sites shared between the surface complex and the adsorbed nitrog-en.
Another factor of influence is associated with the diffusion of gas molecules at low pressures. Because of the intricate structure of the porous material, more time is required for the nitrogen to locate the adsorption sites of minimum potential energy. A similar argument may be valid in connection with surfacediffusion phenomena. Some such consideration is required to explain the fact that even relatively well outgassed adsorbents (400° C for 16 hI') required long periods to attain equilibrium in the low-pressure range [15].
Other things being equal , relatively shorter periods were required to attain a steady state for char 27 compared to char 2. It has been shown elsewhere [16] that the crystalline structure of basic calcium phosphate (about 90 percent in these materials) was

;,·"w,
more highly developed in char 27. In this case the contribution of the voids in t he porous structure to the total adsorbing surface was less. In addition , the carbonaceous residue in char 27 bad a greater stability as a resul t of many heatings to which it had been subj ected in t he commercial r evivification process.
5 .2. Validity of Isotherm at Very Low Pressures
Th e experimental data show that a Freundlich isot herm is valid in the measurable range at very low pressures. When a Langmuir isotherm is valid at low pressures, H enry's law, V = ax, is automatically obtain ed as the limiting case. Hill [17] has shown from statistical mechanical-tbermodynamic considerations t hat all adsorp tion isotherms must approach H enry 's law. Hence, in t he present case where Freundlich isotherms a re observed at the lowest pressures, it is necessary to postulate a transi. tion range below which one must r ealize t he lineal' depend ence of adsorbed volume on pressure. It is not known wh ere t his range exists for the adsOl'bents investigated.
For H enry's law to be obeyed, the slope of the plots in figure 7 must be unity. I t may be seen from these graphs that the first observed points at t he lowest pressure for the isotherms at 90.0 0 and 77.7 0 K are displaced in the correct direction. However , it will be necessary to obtain additional data at even lower pressure to be sure of t his behavior.
0 .5 r ----,----,----,----,------,
0 .4 G90C.""~~ 2
0 .3
E > 90oC.",,~ft \ '->
0.2
0 . 1 lIf------+---+----j----+------j
F rCU RE 8. Low-pressure adsorpti on data for char 27 at 72.2° , 77.7°, and 90° K.
rl1he ra tio, (l1I, is shown a.s a fun ction of .I t where x= rclativc pressure, and V= volum e of nitrogen adsorbed (S'rp).
17
5 .3. Surface Area
When th e ratio V/V m was plotted (see fig. 8) as a fun ction of p/Po from 10- 7 to 10- \ i t, was found that the curves for chars 2 and 27 were in coincidence at 900 K . In this region no more t han 40 pet'cen t of the surface was covered . This agreed with previous work in th e range 0.1 to 0. 3 [8], where t he entire surface was covered. However, at the lower temperatures, the curves for differen t adsorben ts were separated to a sign ificant exten t, which implies a different interaction of t he nitrogen molecules with t he surface. For the case of a given adsorbent at 2 or 3 temperatures, t he curves were separated to greater extents than indicated by the corresponding changes in t he densit ies of liquid nitrogen . The values of V/V m are largest at the lowest temperature for a given value of p/Po'
The surface areas given in t able 4 ind icate an in crease with decrease in the temperature. It is not known wheth er or not this is within t he experimental error of t he Vm determinat ion . It may also be related either with unknown changes in density of the adsorbed nitrogen p hase or with the possibili ty t hat t he effective van del' Waal's diametcr of the adsorbed nitrogen molecule at t he different temperatu res is cri t ical with the dimensions of the vo id . Thereforc, t he surface a vailable t o a ni trogen molecule , especially in porous materi a ls, might be co tTespond i n gl~' greater.
5.4. Conclusions
The attainment of equilibrium at very low pressures is a complica ted process, in whieh the nat ure of the surface and the impurit ies associa ted with the solid surface play an imporLan t role. Variations in the outgassing techniques can change this par t of the isotherm to a notable ex tent.
As the nature of the predo min ant forces responsible for adsorption cba nges significantly with surface coverage, no known iso therm equation ean be expected to be valid from x= O to x= 1. The Freu ndlich equation appears to be valid at very low pressures in a grea t many cases, but it is not valid when the surface coverage approaches a monolayer where x is approximately 0.1. The B .E.T. equation appears to be frequently valid betwee n the poin t wh ere the Freundlich relationship fails and relative pressures of about 0.35. In this region (0.05 to 0.35) the factors that arc not taken into account in the B .E.T. model would not con tribute appreciably to the volume adsorbed. The behavior above 0.35 in relative press ure has at present no adequate theoretical basis. In general, one can say that the nature of the predominant forces involved in any adsorption process is a func t ion no t only of the nature of the adsorbate, adsorbent, a nd temperature, but also of the pressure range, which determines the fraction of the surface covered .

I
6. References {I] T . L. Hill, P . H . Emmett, and L . G. Joyn er , J. Am. Chem
Soc. 73, 5102 (1951). [2] T . L . Hill , J . Ch ern. Phys. 17, 762 (1949) . [3] G . D . Halsey, J . Am. Chem . Soc. 73, 2693 (1951 ) . [4] T. N . Rhodin, J. Am. Chem . Soc. 72, 5692 (1950). [5] G. D . Halsey and H. S. Taylor, J . Chern. Phys. 15, 624
(1947) . [6] R. Sips, J . Chern. Phys. 16, 490 (1948); 18, 1024 (1950) . [7] M. H . Cook, E . H . Pack, a nd A. G. Oblad, J . Chem. Phys.
19, 267 (1951 ) . [8] V. R. Deitz and L . F . GJeysteen, J . R esearch N BS 29,
191 (1942) RP1496 . [9] F . C. Thompkins and D . E. Wh eeler, Trans. Faraday Soc.
29, 1248 (1933).
~----
[10] S. Weber , W . H . I<eesom, and G. Schmidt, R ep . VI Congres Int. Froid 2, 45, 61 , 74 (1936).
[11] S. Chu Liang, J . App!. Phys. 22, 148 (1951); J . Phys. Chem . 56, 660 (1952); 57, 910 (1953).
[12] W . V. Lobenst ein a nd V. R. D eitz, J. R esearch NBS <i6 , 51 (1951) RP2174.
[13] V. R. Deitz and L. F . GJ eyst een, J . R esearch N BS 35 285 (1945) RP1674 . '
18
[14] T. L . Hill , J . Chem . Phys . 17, 520 (1 949) . [15] S. Chu Liang, J . Phys. Chem . 57, 84 (1953). [16] R eport for the Five Y ear P eriod 1939-44 of the Bone
Char R esearch Project . Inc. [17] T. L. Hill , J . Ch em. Phys. 18, 246 (1950).
'VASHING'l'ON, D ecember 30, 1954.