adsorption of methane on activated carbon by … · 2017-02-01 · adsorption of methane on...
TRANSCRIPT

ADSORPTION OF METHANE ON ACTIVATED CARBON BY
VOLUMETRIC METHOD
A Project submitted to the
National Institute of Technology, Rourkela
In partial fulfillment of the requirements
Of
Master of Technology (Chemical Engineering)
By
Mr. Abhishankar Kumar
Roll No:209CH1057
UNDER THE GUIDANCE
OF
Dr. SUSMITA MISHRA
DEPARTMENT OF CHEMICAL ENGINEERING
NATIONAL INSTITUTE OF TECHNOLOGY, ROURKELA
MAY- 2011

i
CANDIDATE’S DECLARATION
I hereby declare that the work, which is being presented in the dissertation entitled
"Adsorption of methane on activated carbon by volumetric method” in the fulfilment of the
requirements of the award of the degree of Master of Technology in Chemical Engineering,
submitted in the Department of Chemical Engineering, National Institute of Technology,
Rourkela, Orissa, is an authentic record of my own work carried out during the period of July
2010 to April 2011 under the supervision of Dr. S.Mishra, Associate Professor, Department of
Chemical Engineering, National Institute of Technology, Rourkela, Orissa.
I have not submitted the matter, embodied in this dissertation for the award of any other
degree.
Date: May 2011 (ABHISHANKAR KUMAR)
Place: Rourkela
CERTIFICATE
This is to certify that the above statement made by the candidate is correct to the best of
my knowledge and belief.
Date: (Dr. Susmita Mishra)
Associate professor
Department of Chemical Engineering
National Institute of Technology,
Rourkela, Orissa-769008 (India)
ii
ACKNOWLEDGEMENT
I would like to express my sincere gratitude to Prof. (Dr) S.Mishra for her guidance and
assistance in this project. The technical discussions with Prof S .Mishra. were always been very
insightful, and I will always be indebted to her for all the knowledge she shared with me. Her
prompt responses and availability despite his constantly busy schedule were truly appreciated.
The reality is that S.Mishra was much more than an advisor for me. She always helped me in all
the technical and non-technical issues during the production of this work. Her encouragement
and efforts led this project to successful completion in a timely fashion.
I would also like to thanks Prof (Dr) B.Munshi and Prof (Dr) M.Kundu for their insightful
suggestions, which have been greatly helpful for the advance of my research and further study.
I would also like to thank Prof. (Dr) A.Sahoo. for being a uniformly excellent advisor. She was
always open minded, helpful and provided us with a strong broad idea. I would also like to thank
Prof. (Dr). K C Biswal our head of department to provide a good research environment.
In addition, I would like to express my heartfelt gratitude to my best friend Mrs.Debalxmi
Pradhan ,Prateek Khare,Gaurav Chandrakar and Vamsi Krisnan for his constant encouragement
and help throughout my whole study journey.
Last but not least, I take this opportunity to extend my deepest gratitude to my Parents and my
brothers and sisters for their unfailingly love, unconditional sacrifice and moral support, which
are far more than I could express in words.
ABHISHANKAR KUMAR

iii
ABSTRACT:
The adsorption characteristics of methane on granular activated carbon were measured over the
temperature range of (293 to 323) K and at pressures up to 900 psi using a volumetric
measurement system. The surface of activated carbon has been modified with copper oxides and
sliver in order to improve the adsorption capacity of methane. The results indicate that the
adsorption capacity can be marginally improved by doping small amount of metal oxides The
adsorption data were fitted to different isotherm models and the result shows that DA are able
to predict data correctly at all temperature . The isosteric heat of adsorption, which is
concentration- and temperature-dependent, is extracted from the data.
Key word: Adsorption, Isotherms, Volumetric method, Isosteric heat of adsorption.
iv
CONTENTS PAGE NO
Certificate i
Acknowledgment ii
Abstract iii
List of figure vii
List of Tables viii
Nomenclature ix
1. INTRODUCTION
1.1. Transportation and storage methods of natural gas 2
1.1.1 Compressed natural gas 2
1.1.2 Liquefied natural gas 3
1.1.3 Adsorbed natural gas 3
1.2. Objective of Project 5
2. LITERATURE REVIEW 6
2.1. Adsorption Equilibrium 7
2.1.1 Type I isotherm 7
2.1.2 Type II isotherm 8
2.1.3 Type III and Type V isotherms 8
2.1.4 Type IV isotherms 9
2.2. Theoretical modeling of adsorption isotherms 9
2.2.1 Langmuir isotherm 9

v
2.2.1 Freundlich isotherm 10
2.2.3 Polanyi’s potential theory of adsorption isotherms 10
2.3. Isosteric heat of adsorption 12
2.4. Adsorption Measurement Technique 12
2.4.1 Gas Flow Technique 13
2.4.2 Gas Adsorption Volumetric Technique 13
2.4.3 Gravimetric method 14
2.5. Adsorption characteristic of gas 14
3. MATERIALS AND METHODS 18
3.1. Activated carbon 19
3.2. High purity helium and methane 19
3.3. Surface characterization of activated carbon 20
3.3.1 Thermo gravimetric analysis 20
3.3.2 Fourier Transform Infrared spectroscopy (FTIR) of activated 20
Carbon
3.3.3 Surface topography 20
3.4. Experimental set up of volumetric equipment 20
3.5. Volumetric method for methane sorption measurement on activated 21
Carbon
3.6. Gas Compressibility Factors 23
3.7. Experimental procedure for surface modification of activate 24
vi
carbon by metel oxide or metel ( impregmnation method) .
4. RESULT AND DISCUSSION 26
4.1 Characterization of raw and modified activated carbon 26
4.1.1 Study of Proximate and ultimate analysis of raw and 26
modified activated carbon .
4.1.2 Surface topography of raw and modified activated carbon 28
4.1.3 Thermogravemetric analysis (TGA) of activated carbon 31
4.2 Study the effect of adsorption capacity of methane on activated 32
carbon above critical temperature.
4.3 Study of adsorption desorption of methane on activated carbon 33
at above critical temperature
4.4. Study the effect of pressure step size on the adsorption capacity 35
4.5 Theoretical modeling of gas adsorption at different temperature. 36
4.6 Study the effect of adsorption capacity on surface modified 40
activated carbon
4.7 Study the isosteric heat of adsorption at different temperature. 41
4.8 Absolute residual error of different theoretical adsorption isotherm. 42
5. CONCLUSION 43
6. REFERENCES 45

vii
LIST OF FIGURE PAGENO
Figure 1: Growth of natural gas operated vehicle worldwide. 4
Figure 2: The IUPAC classification of isotherms 8
Figure 3: Experimental setup for (static) volumetric 13
measurement of pure gas adsorption equilibria
Figure 4: Schematic diagram of gravimetric apparatus. 14
Figure 5: Granular activated carbon 19
Figure 6: Schematic diagram of experimental set up for methane adsorption 21
on activated carbon by volumetric method
Figure 7:Photograph of fabiricated volumetric setup (Top view) 22
Figure 8: (a): SEM image of silver modified activated carbon 28
(b): SEM image of cupper modified activated carbon 29
(c): SEM image of raw activated carbon 29
Figure 9: (a): EDX of silver modified activated carbon 30
(b): EDX of raw activated carbon 30
Figure 10: Thermogravimetric analysis of activated carbon 31
Figure 11: Effect of adsorption capacity of methane at different 32
temperature and equilibrium pressure
Figure 12: (a) Adsorption desorption study of methane on activated carbon at 293K 33
(b) Adsorption desorption study of methane on activated carbon at 303K 34
(c) Adsorption desorption study of methane on activated carbon at 313K 34
(d)Adsorption desorption study of methane on activated carbon at 323K 35
Figure 14: (a) Theoretical modeling of gas adsorption at temperature 293K 36
(b): Theoretical modeling of gas adsorption at temperature 303K 37
(c): Theoretical modeling of gas adsorption at temperature 313K 37
(d)Theoretical modeling of gas adsorption at temperature 323K 38
Figure 15: Study of adsorption capacity of methane on surface modified activated carbon 40
Figure 16: Study of isosteric heat of adsorption at different temperature 41

viii
LIST OF TABLE: PAGE NO
Table 4.1 Proximate and ultimate analysis of raw and modified activated carbon. 27
Table 4.3 Isotherm parameter of different model. 39
Table 4.3 Calculation of percentage of absolute residual error. 42

ix
ABBREVIATION
SC Sample cell
FV Reference cell
V1 Valve 1
V2 Valve 2
oC Degree Celsius
Vo Void volume
Initial pressure of reference cell
Equilibrium pressure of reference cell
Initial pressure of sample cell
Equilibrium pressure of sample cell
Z Compressibility factor
VR Volume of reference cell
T Temperature
He Helium
nads mole adsorbed
g Volume per unit mole
Po Vapor pressure
Pc Critical pressure
Tc Critical temperature
Cµ Amount adsorbed
Cmax Maximum amount adsorbed
n Structural heterogeneity parameter
E Characteristic energy
A Adsorption potential

x
AC Activated carbon
ACR Raw activated carbon
ACC Activated carbon surface modified with copper oxide
ACA Activated carbon surface modified with silver
R Gas constant
b Langmuir constant

Adsorption of methane on activated carbon by volumetric method 2011
National Institute of Technology Rourkela Page 1
Chapter1
Introduction
Adsorption of methane on activated carbon by volumetric method 2011
National Institute of Technology Rourkela Page 2
1. INTRODUCTION
Increased in environmental pollution by fossil fuel and instability in oil market has attracted
great attention around the globe; consequently, kinds of alternate source of energies are put
forward now. Natural gas is a promising one due to its abundance it creates less pollution,
especially as transportation fuel allowing such less exhaustion than commercial gasoline or
diesel. It is mostly composed of methane (87-96 mole percent) and has the highest heating value
per unit mass (50.1 MJ.kg -1
) of the hydrocarbon fuels (e.g., diesel fuel, butane, gasoline, etc.).
Russia and Persian Gulf is the major producer of conventional natural gas and it produces nearly
50 % of the world production.
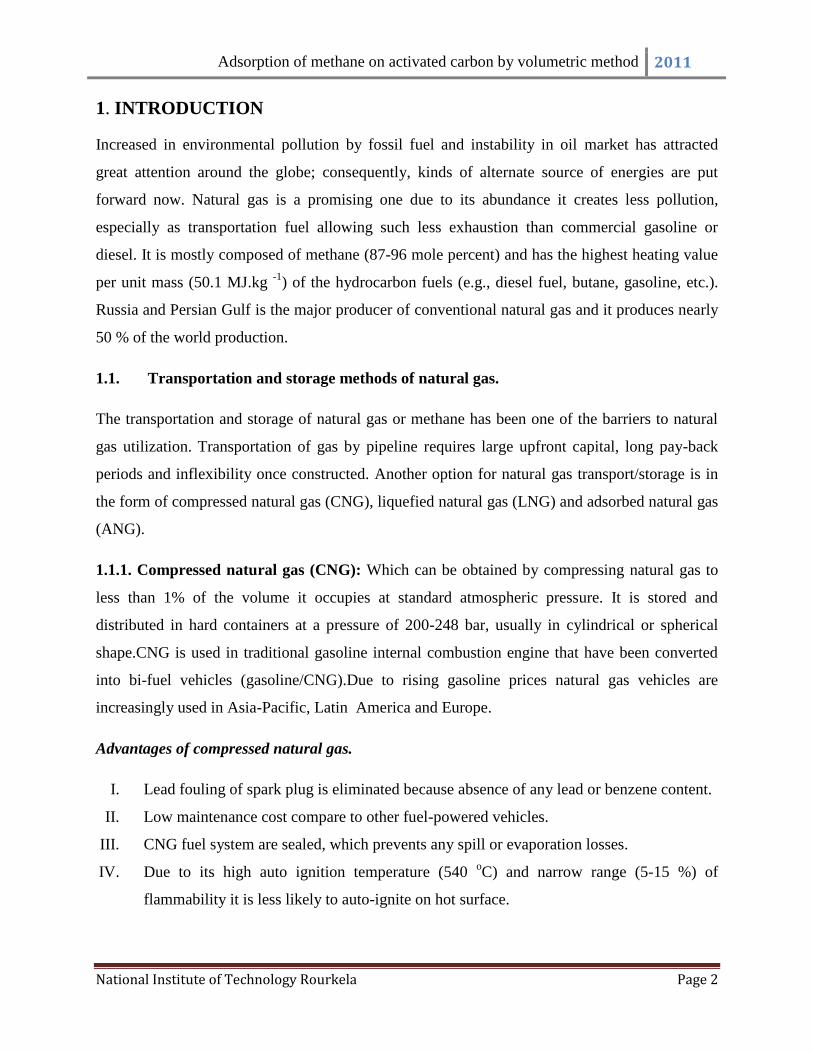
1.1. Transportation and storage methods of natural gas.
The transportation and storage of natural gas or methane has been one of the barriers to natural
gas utilization. Transportation of gas by pipeline requires large upfront capital, long pay-back
periods and inflexibility once constructed. Another option for natural gas transport/storage is in
the form of compressed natural gas (CNG), liquefied natural gas (LNG) and adsorbed natural gas
(ANG).
1.1.1. Compressed natural gas (CNG): Which can be obtained by compressing natural gas to
less than 1% of the volume it occupies at standard atmospheric pressure. It is stored and
distributed in hard containers at a pressure of 200-248 bar, usually in cylindrical or spherical
shape.CNG is used in traditional gasoline internal combustion engine that have been converted
into bi-fuel vehicles (gasoline/CNG).Due to rising gasoline prices natural gas vehicles are
increasingly used in Asia-Pacific, Latin America and Europe.
Advantages of compressed natural gas.
I. Lead fouling of spark plug is eliminated because absence of any lead or benzene content.
II. Low maintenance cost compare to other fuel-powered vehicles.
III. CNG fuel system are sealed, which prevents any spill or evaporation losses.
IV. Due to its high auto ignition temperature (540 oC) and narrow range (5-15 %) of
flammability it is less likely to auto-ignite on hot surface.

Adsorption of methane on activated carbon by volumetric method 2011
National Institute of Technology Rourkela Page 3
V. Compare to other commercial fuel like gasoline, diesel it emits significantly less pollutant
such as carbon dioxide (CO2), hydrocarbon, carbon monoxide (CO), nitrogen oxide
(NOx), sulfur oxide and particulate matter.
Drawbacks of compressed natural gas.
I. Compare to conventional gasoline powered vehicles compressed natural gas vehicles
require greater amount of space.
1.1.2 Liquefied natural gas (LNG)
In this method natural gas is liquefied under pressure of 10-20 bar at minus 161.5 oC. LNG
requires the use of complex and expensive liquefactions equipment, thermos- like tanks and
significant energy consumption (25-35 percent of original energy gas content) for the
liquefaction and degasification.LNG storage tanks should have cylindrical or spherical shape.
Due to a very distinctive advantage of scale it is applied mainly in marine transportation of very
big quantity of gas. This technology is not yet mature for massive use in vehicles.
1.1.3 Adsorbed natural gas (ANG)
Alternative to the CNG for energy storage a new technology have been developed which give
revolution for the storage of natural gas known as ANG technology.ANG is a technology in
which natural gas is adsorbed by a porous adsorbent such as activated carbon at relatively low
pressure (7-40 bar) and room temperature.
Applications of ANG technology.
The application of adsorbed natural gas (ANG) can be divided into three main categories.
a) On –board fuel storage for natural gas vehicles ranging from motorbikes, cars, buses,
trains to ships.
b) Mobile tanker supply. Mobile ANG tankers supply natural gas by road, to transport
natural gas from a pipeline or standard gas source for downstream utilization. It could
also be used for the development of satellite natural gas city before it is connected to a
pipeline network.
Adsorption of methane on activated carbon by volumetric method 2011
National Institute of Technology Rourkela Page 4
c) Large-scale natural gas storage. This statics strategic network storage can be used for
diurnal peak shaving and tariff management. It could be implemented as a new
installation as an alternative to linepack ,or retrofitted at the sites of existing gas holder
and pressurized storage vessels by filling the vessels with activated carbon to gain from
the enhanced storage capacity.
Advantage of adsorbed natural gas (ANG).
I. Storage distributed close to point of use, removing dependence on transmission system.
II. Lower safety hazards than CNG (7-40 bar).
III. No extensive inlet and outlet compression (like CNG) is required.
IV. High volumetric capacity.
V. Potential for removable fuel tanks for filling outside the vehicles.
Disadvantage of adsorbed natural gas (ANG)
I. Poor specific mass (ratio of useful gas stored to total parasitic mass of activated carbon
and the container).
Yet, it can be construed as an alternative for the transport sector and remote area gas storage
provided that higher than 160 (v/v) in volumetric storage capacity can be realized. The most
promising adsorbents for ANG storage are the highly micro porous activated carbons with
relatively high packing densities and higher specific surface areas.
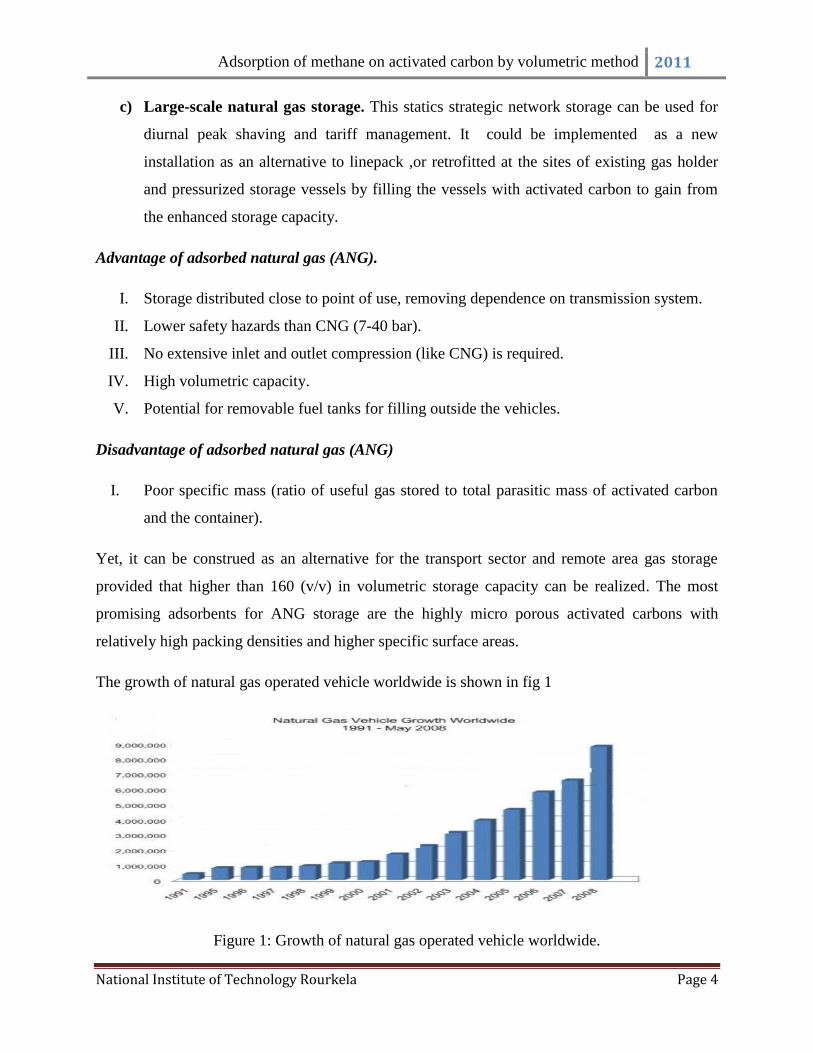
The growth of natural gas operated vehicle worldwide is shown in fig 1
Figure 1: Growth of natural gas operated vehicle worldwide.

Adsorption of methane on activated carbon by volumetric method 2011
National Institute of Technology Rourkela Page 5
1.2 OBJECTIVE OF PROJECT:
a. Study the surface characterization of raw and modified activated carbon.
b. To Study the adsorption and desorption of methane on activated carbon above the critical
temperature of gas and at high pressure.
c. To study the effect of increase in pressure step size on adsorption capacities.
d. To verify the theoretical models for methane adsorption on activated carbon.
e. To study the adsorption capacity of methane on the surface modified activated carbon.
f. To study the isosteric heat of adsorption at different temperature.

Adsorption of methane on activated carbon by volumetric method 2011
National Institute of Technology Rourkela Page 6
Chapter 2
Literature Review

Adsorption of methane on activated carbon by volumetric method 2011
National Institute of Technology Rourkela Page 7
2. LITERATURE REVIEW
This chapter firstly reviews fundamental of adsorption, adsorption methodology and
measurement including isosteric heat of adsorption. In later section of the chapter a brief review
of work by the different researcher is presented.
2.1 Adsorption Equilibrium.
When an adsorbent comes in contact with adsorbate (surrounding fluid) adsorption takes place.
After a long time, the adsorbent and adsorbate reaches at equilibrium i.e. W = f (P, T) where T is
the temperature, P is the pressure and W is the equilibrium uptake of adsorbed adsorbate in unit
of g/g or mole/gm. If the temperature is kept constant, the change in equilibrium uptake against
the pressure is called the adsorption isotherm, W = f (P). When the gas pressure is kept constant
and the adsorbent temperature varies, the change in amount of adsorbate against the temperature
is called the adsorption isobar, i.e. W = f (T). Moreover, if the amount of adsorbate is kept
constant, the change of pressure against the temperature is called the adsorption isosteric, i.e.
P = f (T).
In an adsorption study, the adsorption isotherm is more likely to be used to express the result of
adsorption rather than adsorption isobar or isostere. For the designing of any adsorption process
equilibrium isotherm is one of the more important parameter. The amount of adsorbent needed in
the absorber is determined by the equilibrium data, which in turn determines the key dimension
and operation time for the process.
The adsorption isotherm can have different shape which is based on the adsorbent, adsorbate and
the adsorbent adsorbate interaction. According to IUPAC adsorption isotherm is classified into
six types. The adsorption types are shown in figure 2.
2.1.1 Type I isotherm
When an adsorbent contain very fine micropores which pore dimension is only few molecular
diameters, the potential field of force from the neighboring walls of the pores will overlap
causing an increase in the interaction energy between the adsorbent surface and gas molecules.

Adsorption of methane on activated carbon by volumetric method 2011
National Institute of Technology Rourkela Page 8
This will result in an increase in adsorption and may cause complete filling of pores at low
pressure.
2.1.2 Type II isotherms
These isotherms correspond to multilayer physical adsorption. It is concave at low relative
pressure, and then linear for a small pressure range where monolayer coverage is complete, and
subsequently become convex to the relative pressure axis, indicating formation of multilayer
whose thickness increases progressively with increase in relative pressure.
Figure 2: The IUPAC classification of isotherms
2.1.3 Type III and Type V isotherms.
Type III and Type V isotherms are characterized by being convex to the relative pressure axis.
In type III isotherms the convexity continues throughout the isotherm but in type V the isotherm
reaches a plateau at high relative pressure. The convexity of the isotherm is the indication of
cooperative adsorption, which means that the already adsorbed molecules tend to enhance the
adsorption of other molecules. In other words we can say that it support the adsorbate-adsorbate
interaction.

Adsorption of methane on activated carbon by volumetric method 2011
National Institute of Technology Rourkela Page 9
Type III isotherms are generally observed in the case of nonporous or highly miacroporous
adsorbents, and type V on mesoporous or microporous adsorbents for the adsorption of both
polar and non polar adsorbent.
2.1.4 Type IV isotherms.
Type IV isotherms are obtained for adsorbent containing pores in the mesopore range. The shape
of the type IV isotherm follows the same path as type II at lower relative pressure and the slope
start decreasing at higher pressure. At saturation vapor pressure the isotherm levels off to
constant value of adsorption. The portion of isotherm which is parallel to the pressure axis is
attributed to pore filling by the capillary condensation.
2.1.5 Type VI isotherms.
Type VI isotherms shows discrete steps which may be caused by multilayer formation in
different ranges of micropores.
2.2 Theoretical modeling of adsorption isotherms.
Theoretical modeling refers to fit the experimental data with the model which is based on the
theoretical concept (equation of state, empirical).
2.2.1 Langmuir isotherm
However, the most commonly used model is Langmuir model that describes Type I isotherm and
has been extensively used for adsorption of methane and CO2 on coal. Langmuir model is based
on the assumption that there exists a fixed adsorption sites on the surface of the solid and only
one gas molecule is adsorbed at a single adsorption site. Moreover the adsorbent surface is
energetically homogeneous and that the energy of adsorption is constant for all sites with no
interaction between the adjacent adsorbate molecules.
The equation for the Langmuir isotherm is given as:
(1)
Adsorption of methane on activated carbon by volumetric method 2011
National Institute of Technology Rourkela Page 10
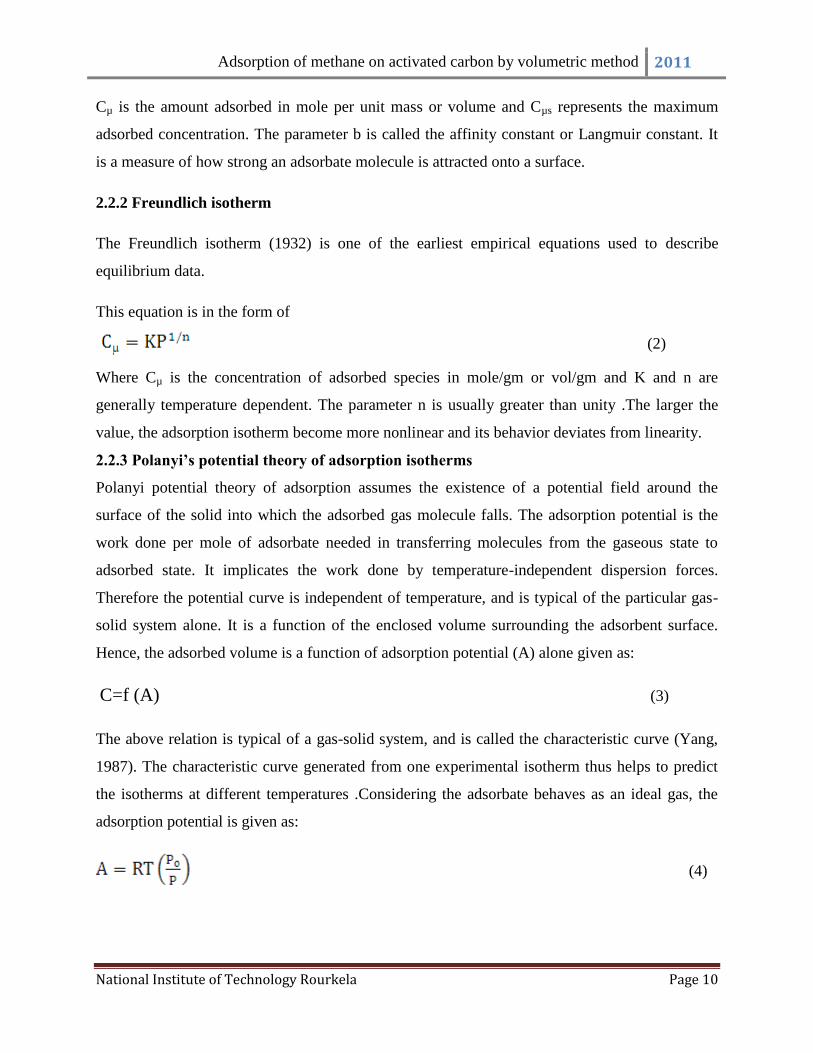
Cµ is the amount adsorbed in mole per unit mass or volume and Cµs represents the maximum
adsorbed concentration. The parameter b is called the affinity constant or Langmuir constant. It
is a measure of how strong an adsorbate molecule is attracted onto a surface.
2.2.2 Freundlich isotherm
The Freundlich isotherm (1932) is one of the earliest empirical equations used to describe
equilibrium data.
This equation is in the form of
(2)
Where Cµ is the concentration of adsorbed species in mole/gm or vol/gm and K and n are
generally temperature dependent. The parameter n is usually greater than unity .The larger the
value, the adsorption isotherm become more nonlinear and its behavior deviates from linearity.
2.2.3 Polanyi’s potential theory of adsorption isotherms
Polanyi potential theory of adsorption assumes the existence of a potential field around the
surface of the solid into which the adsorbed gas molecule falls. The adsorption potential is the
work done per mole of adsorbate needed in transferring molecules from the gaseous state to
adsorbed state. It implicates the work done by temperature-independent dispersion forces.
Therefore the potential curve is independent of temperature, and is typical of the particular gas-
solid system alone. It is a function of the enclosed volume surrounding the adsorbent surface.
Hence, the adsorbed volume is a function of adsorption potential (A) alone given as:
C=f (A) (3)
The above relation is typical of a gas-solid system, and is called the characteristic curve (Yang,
1987). The characteristic curve generated from one experimental isotherm thus helps to predict
the isotherms at different temperatures .Considering the adsorbate behaves as an ideal gas, the
adsorption potential is given as:
(4)

Adsorption of methane on activated carbon by volumetric method 2011
National Institute of Technology Rourkela Page 11
where, R is the Universal Gas Constant, A is the adsorption potential, T is the adsorption
temperature in absolute units, P is the adsorption pressure and Po is the saturated vapor pressure
of the adsorbate at definite temperature T.
In 1967, Dubinin described adsorption on microporous adsorbents and proposed a new theory
known as the theory of volume filling of micropore (TVFM). Theory of Volume Filling of
Micropore postulates that, in micropores, the adsorbate occupies the pore volume by the
mechanism of volume filling, and does not form discrete layers in the pores. In 1995, Dubinin
and Astakhov proposed an equation based on this theory that represented the isotherms that
obeyed the TVFM. The Dubinin- Astakhov (D-A) equation, it is expressed as follows:
(5)
where, Cµ is the amount adsorbed, Cmax is the micropore volume, n is the structural heterogeneity
parameter ,E is the characteristic energy of the adsorption system, Po is the saturation vapor
pressure of the adsorbate at temperature T, and P is the equilibrium free gas pressure. Dubinin
and Radushkevich restricted n = 2 for some cases, and modified the equation to Dubbin and
Radushkevich equation (D-R) as below.
(6)
The vapor pressure at any temperature above Tc (critical temperature) is determined by using the
following Dubinin equation:
(7)
This approach not renders some experimental data to fall onto one characteristics curve. A
generalized equation is given by Amankwah and Schwarz (1995) which is shown in equation 8
(8)
Where k is a parameter specific to the adsorbate -adsorbent system.
Adsorption of methane on activated carbon by volumetric method 2011
National Institute of Technology Rourkela Page 12
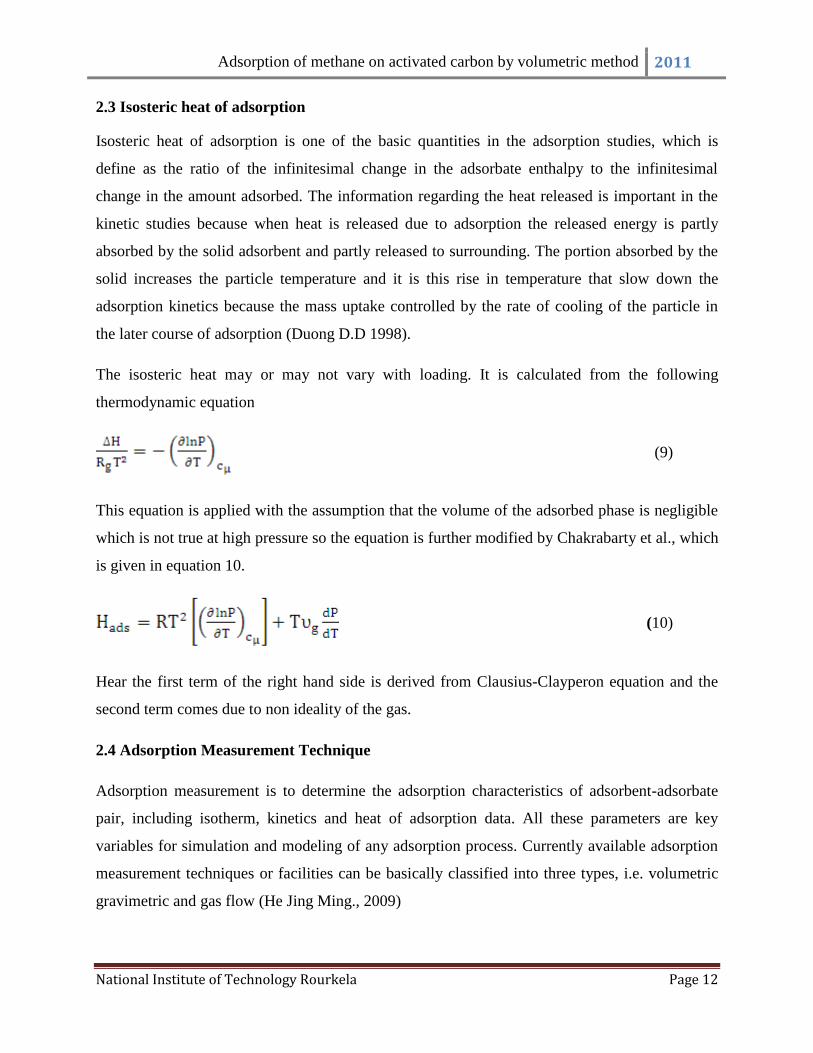
2.3 Isosteric heat of adsorption
Isosteric heat of adsorption is one of the basic quantities in the adsorption studies, which is
define as the ratio of the infinitesimal change in the adsorbate enthalpy to the infinitesimal
change in the amount adsorbed. The information regarding the heat released is important in the
kinetic studies because when heat is released due to adsorption the released energy is partly
absorbed by the solid adsorbent and partly released to surrounding. The portion absorbed by the
solid increases the particle temperature and it is this rise in temperature that slow down the
adsorption kinetics because the mass uptake controlled by the rate of cooling of the particle in
the later course of adsorption (Duong D.D 1998).
The isosteric heat may or may not vary with loading. It is calculated from the following
thermodynamic equation
(9)
This equation is applied with the assumption that the volume of the adsorbed phase is negligible
which is not true at high pressure so the equation is further modified by Chakrabarty et al., which
is given in equation 10.
(10)
Hear the first term of the right hand side is derived from Clausius-Clayperon equation and the
second term comes due to non ideality of the gas.
2.4 Adsorption Measurement Technique
Adsorption measurement is to determine the adsorption characteristics of adsorbent-adsorbate
pair, including isotherm, kinetics and heat of adsorption data. All these parameters are key
variables for simulation and modeling of any adsorption process. Currently available adsorption
measurement techniques or facilities can be basically classified into three types, i.e. volumetric
gravimetric and gas flow (He Jing Ming., 2009)

Adsorption of methane on activated carbon by volumetric method 2011
National Institute of Technology Rourkela Page 13
2.4.1 Gas Flow Technique
This approach, firstly proposed by Nelsen and Eggertsen, and it was an alternative of gas
chromatography. It used helium as carrier gas and partial pressure of adsorbate is determined by
the gas flow meter. The volume adsorbed by the adsorbent was determined from the peak area in
the adsorption/desorption chart recorded by a potentiometer over a period. This apparatus is
simple, inexpensive and straightforward to handle, and no vacuum is required, and available gas
chromatographers can be also modified for this approach. However, the measurement of the
adsorbed amount is indirect and the method does not claim high precision. The method is usually
applied for fast single point determinations of the specific surface area. Multipoint measurements
of isotherms become complicated.
2.4.2 Gas Adsorption Volumetric Technique: In this technique a given amount of sorptive gas
is expanded into a vessel which includes a sorbent sample and which initially has been evacuated
Upon expansion the sorptive gas is partly adsorbed on the (external and internal) surface of the
sorbent material, partly remaining as gas phase around the sorbent. By a mass balance, the
amount of gas being adsorbed can be calculated if the void volume of the sorbent, i.e. the volume
which cannot be penetrated by the sorptive gas molecules is known at least approximately. The
line diagram of volumetric setup is shown in figure 3
Figure 3: Experimental setup for (static) volumetric measurement of pure gas adsorption
equilibria.

Adsorption of methane on activated carbon by volumetric method 2011
National Institute of Technology Rourkela Page 14
2.4.3 Gravimetric method: In gravimetric method, the weight change of the adsorbent sample
in the gravity field due to adsorption from the gas phase is recorded. Various types of sensitive
microbalance have been developed for this purpose. A continuous-flow gravimetric technique
coupled with wavelet rectification allows for higher precision, especially in the near-critical
region.
Figure 4: Schematic diagram of gravimetric apparatus.
2.5 Adsorption characteristic of gas
For the designing of any storage vessel or any absorption column for methane adsorption the
adsorption characteristic of methane on the activated carbon such as isotherms, and heat of
adsorption are fundamentally design parameter. However, even through the absorbed natural gas
(ANG) technology is using from last 10 year for storage of natural on suitable adsorbent but yet
it is in developing stage.
Several researchers have studied and changes different parameter to improve the adsorption
capacity. Kazi Afzalur Rahman et al.(2010) have measured the adsorption isotherm of methane
onto the pitch-based activated carbon type Maxorbe III for temperature ranging from 120 to 220
k and pressure up to 1.4MPa, for the application of adsorbed natural gas (ANG) storage systems
when the low temperature natural gas regasified from the liquid phase is considered to charge in
the storage chamber. Toth and Dubinin-Astakhov models are used to determine the adsorption

Adsorption of methane on activated carbon by volumetric method 2011
National Institute of Technology Rourkela Page 15
parameter and the isosteric heat of adsorption is extracted from these data. E. Salehi et al. (2007)
has studied adsorption and desorption of methane on different granular activated carbon by
volumetric method, up to pressure 500psi and at constant temperature 25 oC. The result reveal
that BET surface area, micro pore volume, packing density and pore size distribution play an
important role in the amount of methane to be adsorbed or desorbed. Xiaolin Wang et al. (2010)
studied the adsorption characteristics of methane on a Maxsorbe II specimen of activated carbon
were measured over the range of (281 to 343 )K and at pressure up to 1.2 MPa using new
volumetric measurement system.BET surface area, pore size distribution and skeletal density are
used to characterized the adsorbent. The adsorption parameter is obtained by the equation
proposed by Toth and Dubinin-Astakhov. The present data could complement efforts in
designing adsorbed natural gas storage systems. Bidyut B. Saha et al. (2009) study the adsorption
isotherms of R-134a (HFC134a) on highly porous pitch based activated carbon in the
temperature range of 5-70 oC and pressure up to 12 bar using desorption method.Dubinin-
Astakhov (D-A) isotherm model is used to fit the experimental data. The isosteric heat of
adsorption of assorted adsorbent-refrigerant pair has also obtained from the preset experimental
data.
S. Farzad et al. (2008) studied the adsorption and desorption of methane by activated carbon at
constant temperature and various pressure .They also studied the effect of moisture on adsorption
capacity and found that the moisture fill the pores which cause decrease in adsorption and
desorption capacity.
Afsaneh Somy et al. (2009) have studied the effect of impregnation of activated carbon with
Cr2O and Fe2O3 and promotion by Zn+2
on its adsorptive properties of carbon dioxide by
volumetric adsorption. To compare CO2 capture capacity of the impregnated activated carbon
promoted by Zinc slurry and solution impregnation methods were used. The result showed that
amount of CO2 adsorbed on the samples impregnated by Cr2O was increased about 20% in
compare to raw activated carbon and Fe2O3 was not an effective impregnating species for
activated carbon modification Moreover slurry impregnation method showed higher CO2
adsorption capacity in comparison with solution impregnation method. Co-impregnation of two
metal species showed more adsorption capacity than samples impregnated by just one metal
species individually. The result also shows 15% increase in CO2 adsorption capacities when

Adsorption of methane on activated carbon by volumetric method 2011
National Institute of Technology Rourkela Page 16
washing the impregnated samples by metal oxide. Decreasing impregnation temperature from 95
to 25 oC in solution method showed a significant increase in CO2 adsorption capacity. Sips
equation was used to fit the adsorption data in this range. Jinghong Ma et al. (2010) have
prepared Cu-based adsorbents for CO adsorption by impregnation activated carbon (AC) with
aqueous solution of copper (II) chloride and copper (II) carboxalate. The characterization of
adsorbent by N2 adsorption at 77 k and XRD showed that cupric salts were completely converted
to highly dispersed CuCl on activated carbon after pre-activation, resulting in the stochiometric
adsorption by the coordination of CO with Cu (I).The result shows that adsorbent have high
selectivity and good adsorption -desorption reversibility for CO with small heat of adsorption.
Chen-Chia Huang et al. (2010) has investigated hydrogen adsorption on prepared super activated
carbon using litchi trunk as precursor .Litchi trunk was activated by potassium hydroxide under
N2 or CO2 atmosphere. Nanoparticles of palladium were impregnated to investigate the
adsorption change. The result revel that the hydrogen adsorption capacity at 303 K and 6 MPa on
10 wt. % Pd-AC was obtained as 0.53 wt. %. This amount is higher than that on the pristine AC
(0.41 wt. %) under the same condition.
Anutosh Chakraborty et al. (2009) has derived and developed thermodynamic properties surfaces
for a single adsorbent +adsorbate system from the viewpoint of classical thermodynamics. They
derive the enthalpy of the adsorbed phase, the isosteric heat of adsorption, specific heat capacity,
and the adsorbed phase volume thoroughly. For calculating the energetic performance of any
adsorption system use of this equation are very easy to handle. The result is able to fill up the
information gap with respect to the state of an adsorbed phase to dispel the confusion as to what
is the actual state of adsorbed phase. They also discussed and established the temperature-
entropy diagram of (1) CaCl2- in silica gel+water system for cooling application and (ii)
activated carbon (Maxsorb III) +methane system for gas storage. D.D. Do et al. (2009) has tried
to find Henry constant and the isosteric heat of adsorption at zero loading which are commonly
used as indicators of the strength of the affinity of an adsorbate for a solid adsorbent with the
assumption that (i) they are observable in practice (ii) the Van Hoff’s plot of the logarithm of the
Henry constant versus the inverse of temperature is always linear and the slope is equal to the
heat of adsorption, and (iii) the isosteric heat of adsorption at zero loading is either constant or
weakly dependent on temperature. They observed that these variable might not be observable
since they are outside the range of measurability; second that the linearity of the Van Hoff plot
Adsorption of methane on activated carbon by volumetric method 2011
National Institute of Technology Rourkela Page 17
break down at very high temperature, and third that isosteric heat of adsorption verses loading is
a strong function of temperature. They demonstrate these points using Monte Carlo simulation of
adsorption of various gases on graphite surface.

Adsorption of methane on activated carbon by volumetric method 2011
National Institute of Technology Rourkela Page 18
Chapter 3
Material and methods

Adsorption of methane on activated carbon by volumetric method 2011
National Institute of Technology Rourkela Page 19
3. MATERIALS AND METHODS.
3.1 Activated carbon.
Granular activated carbon is used for the studies of methane adsorption which are obtained from
Silicon P associate Mumbai. The moisture content of the samples was estimated using the
standard test method for equilibrium [ASTM D 1424 – 93]. Then the activated carbon samples
ACR (Raw activated carbon), ACC (activated carbon modified with copper) and ACA (activated
carbon modified with silver) were evaluated for the proximate analysis using laboratory furnace
as per the standard method [ASTM D 3172 – 07a] and ultimate analysis of AC samples were
estimated using CHNS Analyzer [Perkin-Elmer], as per the standard methods [ASTM D 3176 –
09].
Figure 5: Granular activated carbon.
3.2 High purity helium and methane.
The high purity helium and methane of 99.999% is used in this study and were purchased from
S.K.P Rourkela and Gujarat respectively.

Adsorption of methane on activated carbon by volumetric method 2011
National Institute of Technology Rourkela Page 20
3.3 Surface characterization of activated carbon
The surface characterization of raw activated carbon (ACR) and surface modified activated
carbon is done by thermo gravimetric analysis (TGA), Fourier Transform Infrared spectroscopy
(FTIR) and scanning electron microscope (SAM) images.
3.3.1 Thermo gravimetric analysis (TGA)
Thermogravimetric analysis (TGA) of raw (ACR) and surface modified activated carbon
activated (ACC & ACA) was carried out using TGA/DTG (DTG-60/60H of SHIMADZU) at a
rate of heating 20 oC/min in the nitrogen atmosphere from room temperature to up to 600
oC to
know the decomposition temperature or to find out the range of maximum degradation
temperature.
3.3.2 Fourier Transform Infrared spectroscopy (FTIR) of activated carbon:
Fourier Transform Infrared spectroscopy is an important analysis technique which detects
various characteristic functional groups presents on surface of activated carbon. On interaction of
an infrared light with activated carbon surface, chemical bond will stretch, contract or bend, and
as a result each functional group tends to absorb infrared radiation in a specific wave length
range regardless of the structure of the rest of the molecules. The FTIR spectra were collected in
the range of 400-4000 cm-1
region with 8cm-1
resolution. The FTIR imaging is carried out using
Perkin Elmer RX.
3.3.3 Surface topography
A JEOL JESM -6480LV scanning electron microscope (SEM) was used in the study. The
structural feature of the raw and surface modified activated carbons was observed at the
accelerated voltage of 15 kV. Before observation, the samples were coated with platinum in Ion
sputter.
3.4 Experimental set up of volumetric equipment.
A schematic diagram of the self fabricated experimental setup consisting of cylindrical stainless
steel sample cell (SC), reference cell (FV), a set of valves and a high precision pressure
transducer (10MPa, with a precision of 0.05%) shown in Fig.6. The volume between valve V1

Adsorption of methane on activated carbon by volumetric method 2011
National Institute of Technology Rourkela Page 21
and V2 including the dead volume of the pressure transducer, is used as reference volume and
determined by helium expansion procedure. The granular activated carbon sample is placed into
the sample cell. A micro filter (not visible in figure) was placed just above the sample chamber
to prevent sample particles from entering the valve. The reference cell and the sample cell are
kept in a water bath to maintain constant temperature with + 0.2oC accuracy of the set point.
Figure 6: Schematic diagram of experimental set up for methane adsorption on activated carbon
by volumetric method.
3.5 Volumetric method for methane sorption measurement on activated carbon.
The experimental method used for adsorption is based on mass balance principle,which employs
precise measurment of pressure, volume and temperature. The entire apparatus is maintained in a
constant tepperature water bath. The sample cell (SC) is filled with the adsorbent to be studied,
and placed under vacuum prior to gas injection. The void volume (VO) of the cell at equilibrium

Adsorption of methane on activated carbon by volumetric method 2011
National Institute of Technology Rourkela Page 22
was determined from measured values of temperature, pressure and amount of helium injected
into the cell using the following equation 11.
11
where Z is the compressibility factor of helium, T is the temperature, P is the pressure, subscripts
1 and 2 refer to the initial and equlibrium conditions and R and S represent reference and sample
cells, respectively. VR represents the volume of the reference cell.A picture of fabricated
vollumetric set up is shown in fig 7.
Figure 7 :Photograph of fabiricated volumetric setup (Top view)
Adsorption of methane on activated carbon by volumetric method 2011
National Institute of Technology Rourkela Page 23
Several injections made into the cell at different pressures show consistancy in the calculated
void volume. The helium void volume includes all of the volume of the cell section exclusive of
the adsorbent volume that is impenetrable to helium gas.
The amount of adsorbed methane was calculated from the mass balance in the form of
measurable quantities according to Ozdemir et al. (2002)
12
Where w is the weight of the sample ,VR is the reference volume ,and VO is the void volume of
the sample cell .
The above procedure was repeated for incrementally increasing pressure of methane .Finally the
estimate of the total amount of gas adsorbed ,nads at the ith step was determined from
nads = ∆nads1 + ∆nads2 + …….. + ∆nadsi 13
3.6. Gas Compressibility Factors
The accurate compressibility factors are required for pure methane and helium for proper
adsorption data analysis.National institute of standards and Technology (NIST) version 9.09 is
used for find out the compressiblity factor of methane.
The compressibility factor of helium is determine by the equation Sudibandriyo et al. (2003)
PTTZHe /)20000000049.0000004779.000147.0(1 2 14
where T is the operating temperature
Adsorption of methane on activated carbon by volumetric method 2011
National Institute of Technology Rourkela Page 24
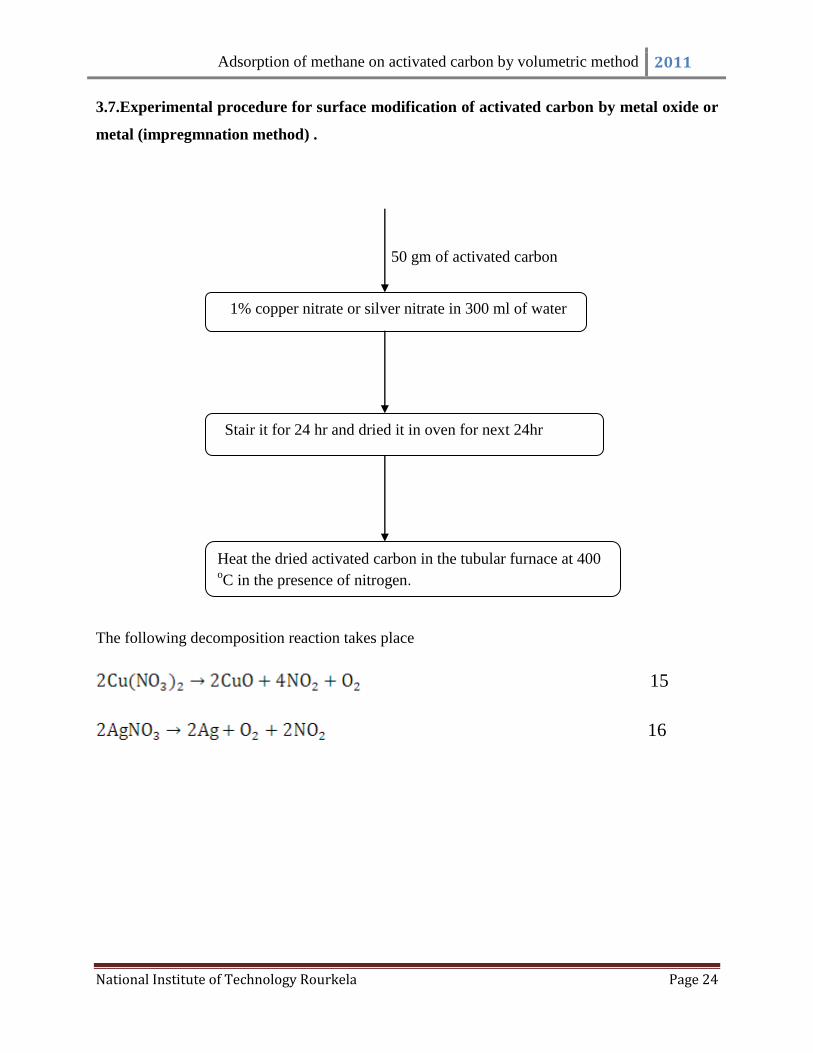
3.7.Experimental procedure for surface modification of activated carbon by metal oxide or
metal (impregmnation method) .
50 gm of activated carbon
The following decomposition reaction takes place
15
16
1% copper nitrate or silver nitrate in 300 ml of water
Stair it for 24 hr and dried it in oven for next 24hr
Heat the dried activated carbon in the tubular furnace at 400 oC in the presence of nitrogen.

Adsorption of methane on activated carbon by volumetric method 2011
National Institute of Technology Rourkela Page 25
Chapter 4
Result and discussion

Adsorption of methane on activated carbon by volumetric method 2011
National Institute of Technology Rourkela Page 26
4. RESULT AND DISCUSSION
4.1 Characterization of raw and modified activated carbon
4.1.1 Study of Proximate and ultimate analysis of raw and modified activated carbon
The proximate and ultimate analysis of the raw and modified activated carbon have been
performed which are shown in table 1.The result reveal that the percentage of fixed carbon is
increased after modification and it is maximum 89.2 percent in the case of silver modified
activated carbon followed by copper modified activated carbon(86.44 percent).The moisture
content of the modified activated carbon is less compare to the raw activated carbon which may
be the cause of blockage of the pore by the metal during impregnation.
The percentage of carbon hydrogen nitrogen sulphur and oxygen present in raw and surface
modified activated carbon is shown by the ultimate analysis .The result shows that silver
modified activated carbon content maximum percentage of carbon(89.08563 percent ) followed
by copper modified activated carbon (78.125 percent) .

Adsorption of methane on activated carbon by volumetric method 2011
National Institute of Technology Rourkela Page 27
Table 4.1: Proximate and ultimate analysis of raw and modified activated carbon
Proximate analysis
Specification
Silver modified
activated carbon
Copper modified
activated carbon
Raw activated carbon
Moisture content 3.1
2.9 3.2
Fixed carbon
89.2 86.44 79.7
Volatile content
8.7 10.96 17.6
Ash content
2.1 2.6 2.7
Ultimate analysis
Elements Silver modified
activated carbon
Copper modified
activated carbon
Raw activated carbon
Carbon 89.0856 78.1250 78.014
Hydrogen 0.0771 0.06510 0.0442
Nitrogen .69954 0.5873 0.4871
sulphur 0.08091 0.0701 0.0451
Oxygen 10.0568 21.1523 21.411

Adsorption of methane on activated carbon by volumetric method 2011
National Institute of Technology Rourkela Page 28
4.1.2 Surface topography of raw and modified activated carbon
The scanning electron microscope images of the raw and surface modified activated carbon is
taken to see the pores developed on the surface before and after the modification which are
shown in the figure 8.
The Elemental diffraction x-ray (EDX) of the raw and surface modified activated carbon by
silver is also performed to see the presence of the metal on the surfaces which are shown in
figure 9.The fig 9(a) shows the presence of silver metal on the surface of the activated carbon.
Figure 8(a): SEM image of silver modified activated carbon

Adsorption of methane on activated carbon by volumetric method 2011
National Institute of Technology Rourkela Page 29
Figure 8(b): SEM image of cupper modified activated carbon
Figure 8(c): SEM image of raw activated carbon

Adsorption of methane on activated carbon by volumetric method 2011
National Institute of Technology Rourkela Page 30
Fig 9(a): EDX of silver modified activated carbon
Fig 9(b): EDX of raw activated carbon
Adsorption of methane on activated carbon by volumetric method 2011
National Institute of Technology Rourkela Page 31
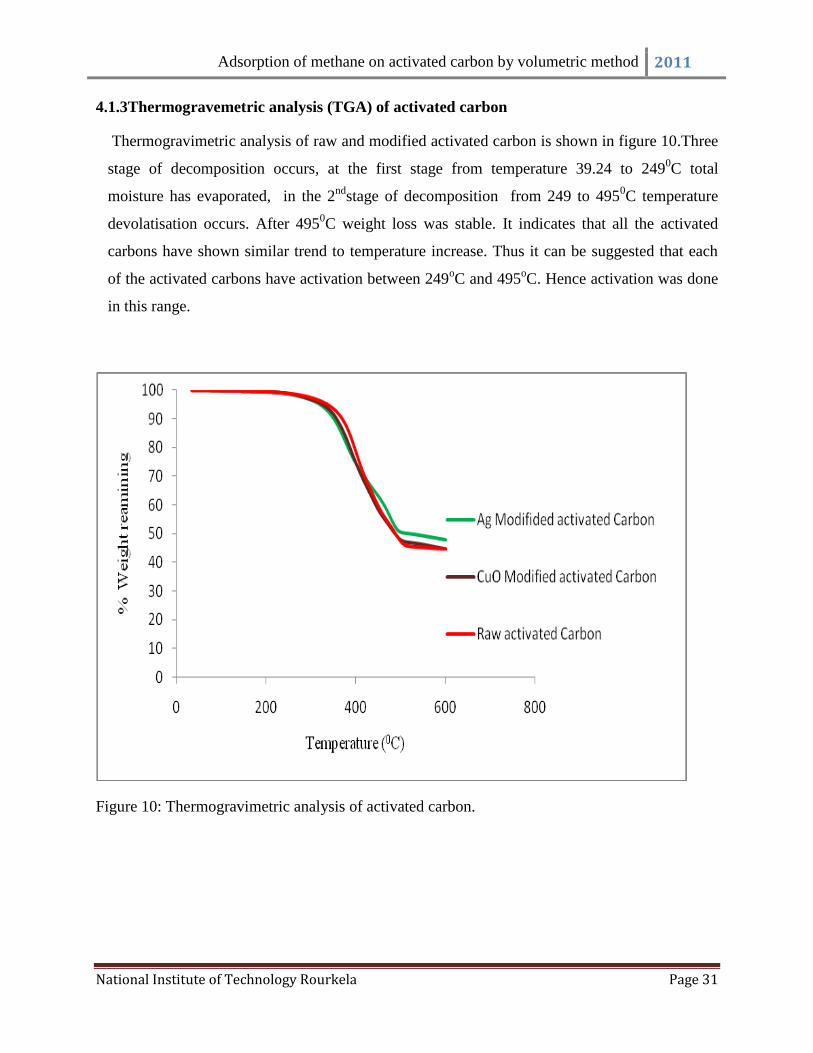
4.1.3Thermogravemetric analysis (TGA) of activated carbon
Thermogravimetric analysis of raw and modified activated carbon is shown in figure 10.Three
stage of decomposition occurs, at the first stage from temperature 39.24 to 2490C total
moisture has evaporated, in the 2nd
stage of decomposition from 249 to 4950C temperature
devolatisation occurs. After 4950C weight loss was stable. It indicates that all the activated
carbons have shown similar trend to temperature increase. Thus it can be suggested that each
of the activated carbons have activation between 249oC and 495
oC. Hence activation was done
in this range.
Figure 10: Thermogravimetric analysis of activated carbon.

Adsorption of methane on activated carbon by volumetric method 2011
National Institute of Technology Rourkela Page 32
4.2 Study the effect of adsorption capacity of methane on activated carbon above critical
temperature.
The adsorption of methane on granular activated carbon have been studied at different
temperature (293 k, 303k, 313k and 323k) and equilibrium pressure up to 7 Mpa which is shown
in fig 11.The result shows that the increase in pressure increase the adsorption capacity of
methane at a particular temperature but at the same time the adsorption capacity decrease with
increase in temperature because the high temperature more heat is released due to adsorption the
released energy is partly absorbed by the solid adsorbent and partly released to surrounding. The
portion absorbed by the solid increases the particle temperature and it is this rise in temperature
that slow down the adsorption kinetics and capacity because the mass uptake controlled by the
rate of cooling of the particle in the later course of adsorption. The isotherm also shows the
characteristic of type1 isotherms, indicating that the activated carbon is mainly microporous
materials
Figure 11: Effect of adsorption capacity of methane at different temperature and equilibrium
pressure.

Adsorption of methane on activated carbon by volumetric method 2011
National Institute of Technology Rourkela Page 33
4.3 Study of adsorption desorption of methane on activated carbon at above critical
temperature.
The adsorption and desorption capacity of methane have been studied at different temperature
(293k,303k,313k and 323k) which are shown in figure 12.The fig 12 (a) shows the formation of
hysteresis because at high pressure it desorbed less amount of gas compare to adsorption at the
same pressure at particular temperature . The formation of the hysteresis may be the cause of gas
condensation at low temperature. The figure 12 (a) to (c) shows no formation of hysteresis
because at high temperature the gas evaporate from the pores of the activated carbon.
Figure 12(a): Adsorption desorption study of methane on activated carbon at 293K

Adsorption of methane on activated carbon by volumetric method 2011
National Institute of Technology Rourkela Page 34
Figure 12(b): Adsorption desorption study of methane on activated carbon at 303K
Figure 12(c): Adsorption desorption study of methane on activated carbon at 313K

Adsorption of methane on activated carbon by volumetric method 2011
National Institute of Technology Rourkela Page 35
Figure 12(d): Adsorption desorption study of methane on activated carbon at 323K
4.4. Study the effect of pressure step size on the adsorption capacity.
Figure 13: Effect of pressure step size on adsorption capacity.
Adsorption of methane on activated carbon by volumetric method 2011
National Institute of Technology Rourkela Page 36
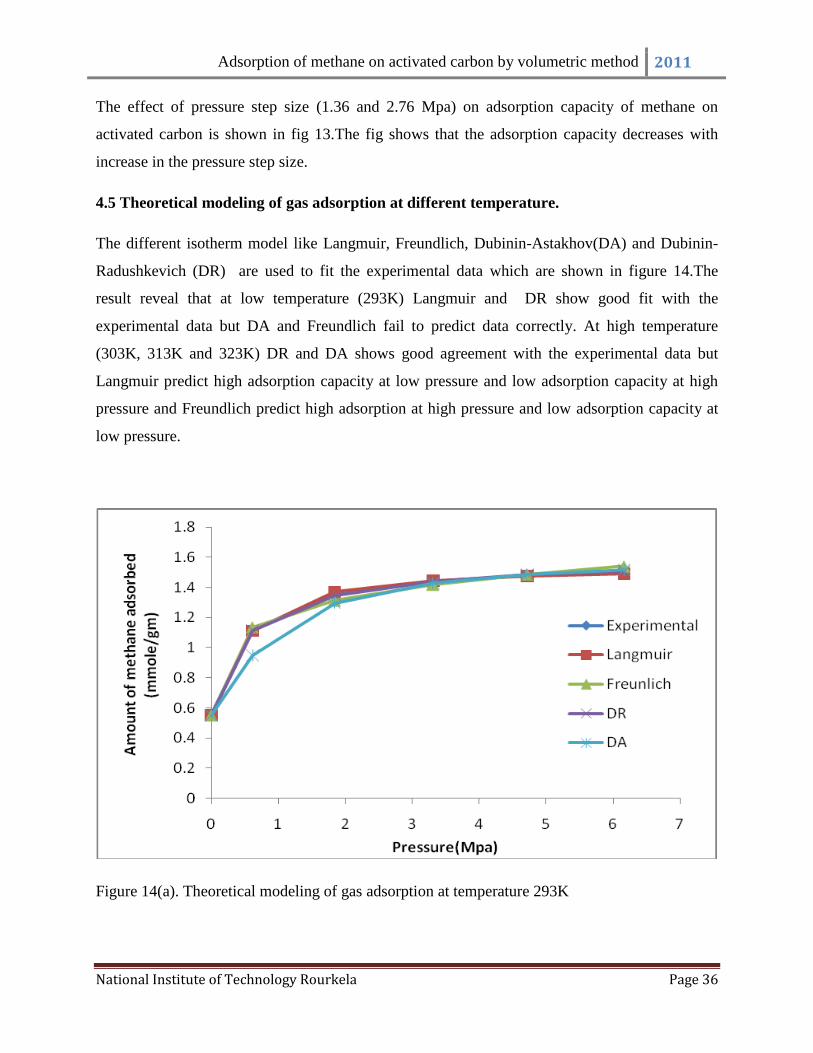
The effect of pressure step size (1.36 and 2.76 Mpa) on adsorption capacity of methane on
activated carbon is shown in fig 13.The fig shows that the adsorption capacity decreases with
increase in the pressure step size.
4.5 Theoretical modeling of gas adsorption at different temperature.
The different isotherm model like Langmuir, Freundlich, Dubinin-Astakhov(DA) and Dubinin-
Radushkevich (DR) are used to fit the experimental data which are shown in figure 14.The
result reveal that at low temperature (293K) Langmuir and DR show good fit with the
experimental data but DA and Freundlich fail to predict data correctly. At high temperature
(303K, 313K and 323K) DR and DA shows good agreement with the experimental data but
Langmuir predict high adsorption capacity at low pressure and low adsorption capacity at high
pressure and Freundlich predict high adsorption at high pressure and low adsorption capacity at
low pressure.
Figure 14(a). Theoretical modeling of gas adsorption at temperature 293K

Adsorption of methane on activated carbon by volumetric method 2011
National Institute of Technology Rourkela Page 37
Figure 14(b): Theoretical modeling of gas adsorption at temperature 303K
Figure 14(c): Theoretical modeling of gas adsorption at temperature 313K

Adsorption of methane on activated carbon by volumetric method 2011
National Institute of Technology Rourkela Page 38
Figure 14(d): Theoretical modeling of gas adsorption at temperature 323K

Adsorption of methane on activated carbon by volumetric method 2011
National Institute of Technology Rourkela Page 39
Table 4.2: Isotherm parameter of different model
Temperature
(K)
Isotherm Parameter
Langmuir Freundlich DR DA
293
Cmax=1.5509
b=4.1229
k=1.2111
n=7.564
E=13091.182
Cmax=1.535
k=2.373
E=10310
Cmax=1.579
n=1.948
k=2.534
303
Cmax=1.3329
b=21.746
k=1.1258
n=6.81198
E=10046.093
C max=1.404
k=0.719
E=10300.722
C max=1.411
n=2.474
k=1.515
313
Cmax=1.2921
b=9.2146
k=1.01136
n=5.6433
E=11829.525
C max=1.344
k=1.426
E=12204.055
C max=1.352
n=2.267
k=2.031
323
Cmax=1.2394
b=5.405
k=0.8836
n=4.5372
E=6653.563
C max=1.252
k=0.472
E=7522.885
C max=1.275
n=3.871
k=2.384
E is in joule/mole , Cmax is in mmoles/gm of activated carbon

Adsorption of methane on activated carbon by volumetric method 2011
National Institute of Technology Rourkela Page 40
4.6 Study the effect of adsorption capacity on surface modified activated carbon.
The adsorption capacity of methane on unmodified and surface modified activated carbon with
copper oxide and silver are shown in figure 15.The result shows that the presence of metal on the
surface increases the adsorption capacity of methane due to formation of complex with the metal.
The adsorption capacity increases 54 percent in the case of copper oxide and 74 percent in the
case of silver with increasing trend i.e. further increase in adsorption with the increase in
pressure.
Figure 15: Study of adsorption capacity of methane on surface modified activated carbon.

Adsorption of methane on activated carbon by volumetric method 2011
National Institute of Technology Rourkela Page 41
4.7 Study the isosteric heat of adsorption at different temperature.
The study of isosteric heat of adsorption at different temperature is shown in figure 16.The result
shows that heat of adsorption is more at high temperature for a fixed loading. The result also
reveals that the heat of adsorption is high at low loading and start decreasing with the increase in
loading.
Figure 16: Isosteric heat of adsorption at different temperature.

Adsorption of methane on activated carbon by volumetric method 2011
National Institute of Technology Rourkela Page 42
4.8 Absolute residual error of different theoretical adsorption isotherm.
The percentage of Absolute Residual Error (ARE) was used to calculate the percentage deviation
of the experimental results from the theoretical models discussed above. The percentage error
was calculated using the following equation.
j
rabs
%ARE
j
1i
i
Where ri is the residual error calculated with the experimental value as the basis and j is the
number of data points available for every sample. The percentage ARE values are shown in
Table 2. From the ARE results it can be observed that the Langmuir model has highest residual
error and D-A has lowest possible error. This justifies the fact that has been presented above as
graphical comparison between experimental data and theoretical models.
Table 4.3: Calculation of percentage of absolute residual error
Temperature is
in K
Percentage of Absolute Residual Error(ARE)
Langmuir Freundlich DR DA
293 0.76748 1.6690 0.0722 0.023
303 5.8785 1.9426 0.22701 0.01885
313 4.45179 3.29431 0.2427 0.2327
323 4.8854 3.6544 0.97393 0.1684

Adsorption of methane on activated carbon by volumetric method 2011
National Institute of Technology Rourkela Page 43
Chapter 5
Conclusion
Adsorption of methane on activated carbon by volumetric method 2011
National Institute of Technology Rourkela Page 44
5. CONCLUSION
The adsorption characteristics of methane on granular activated carbon were measured up
to 7 Mpa and at fixed temperature using a volumetric measurement technique
The isotherm at different temperature shows the characteristic of type 1 isotherms,
indicating that the activated carbon is mainly microporous materials.
Effect of pressure steps indicated that increasing pressure steps reduced adsorption
capacity of activated carbon.
Desorption isotherm illustrated the hysteresis at low pressures.
Experimental data verified using different adsorption models showed best fit for DA
model which are also supported by ARE calculation.
Surface modification of activated carbon was accomplished using Copper oxide and
Silver oxide.
Adsorption capacity of activated carbon increased by 54% and 74% using CuO and Ag
modified activated carbon respectively.
The heat of adsorption is high at high temperature and decreased when the loading
increased.
Adsorption of methane on activated carbon by volumetric method 2011
National Institute of Technology Rourkela Page 45
Chapter 6
References
Adsorption of methane on activated carbon by volumetric method 2011
National Institute of Technology Rourkela Page 46
6. REFERENCES
1. Amankwah.K.A.G,Schwarz.J.K., “A modified approach for estimating pseudo-vapor
pressure in the application of the Dubinin-Astakhov equation” Carbon .,33 (1995) :pp
1313-1319
2. Chakraborty.A, Saha.B.B, Ng.K.C, Koyama.S, Srinivasan .K “Theoretical Insight of
Physical Adsorption for a Single Component Adsorbent +Adsorbate System: I.
Thermodynamic Property Surfaces” Langmuir., 25 (2009) :pp.2204-2211.
3. D.D. Do, Nicholson. D, Do. H.D “On the Henry constant and isosteric heat at zero
loading in gas phase adsorption” Journal of Colloid and Interface Science.,324 (2008):pp
15-24
4. Dai.X.D, Liu.X.M,Xing.W “Natural gas storage on activated carbon modified by metal
oxides “Journal of Porous Mater.,16 (2009): pp 27-32
5. Do.D.D., Adsorption analysis equilibria and Kinetics. London, Imperial College Press,
1998.
6. Dubinin M.M “Adsorption in micropores” Journal of colloid and interface
science.,23(1967) :pp 487-499
7. Farzad.S, Taghikhan.V, Ghotbi.C, Aminshahidi.B , Nemati.N.L “Experimental and
theoretical study of the effect of moisture on methane adsorption and desorptionby
activated carbon at 273.3K”Journal of Natural Gas Chemistry .,16 (2007):pp 22-30
8. Huang.C.C, Chen.H.M, Chen.C.H “Hydrogen adsorption on modified activated carbon”
International Journal of Hydrogen Energy.,35(2010): pp 2770-2780
9. Keller .J.U ,Staudt.R,Siegen.U ., “Gas adsorption equilibria experimental method and
adsorptive isotherms”. Germany, Springer, 2005
10. Ma.J, Li.L, Ren.J, Li.R “CO adsorption on activated carbon-supported Cu-based
adsorbent prepared by a facile route”Separation and Purification Technology.,76
(2010):pp 89-93

Adsorption of methane on activated carbon by volumetric method 2011
National Institute of Technology Rourkela Page 47
11. Ming .H.J., “Adsorption evaporative emission control system for vehicles”. National
university of Singapore, PH.D Thesis, 2009
12. Ozdemir.E, Schroeder.K, Morsi.B.I “Effect of swelling on the adsorption isotherm of
carbon dioxide on coal”. Fuel Chemistry Division Preprints., 47(1), (2002):pp 12-13
13. Rahman K.A , Loh W.S, Yanagi.H, Chakraborty.A Saha.B.B, Chun.W.G.Ng.K.C
“Experimental adsorption isotherm of methane onto activated carbon at sub and
supercritical temperatures”Journal of Chemical Engg Data (in press)
14. Ruthven.D.M. “Principle of Adsorption and Adsorption Processes”New York ,John
Willy and Sons 1984.
15. Saha.B.B, Habib.K , Ibrahim.I, Sharkawy.El, Koyama.S “Adsorption characteristics and
heat of adsorption measurements of R-134a on activated carbon” International journal of
refrigeration .,32 (2009) :pp1563-1569.
16. Saheli.E ,Taghikhani .V ,Ghotbi .C ,Lay .E.N ,Shojaei.A “Theoretical and experimental
study on the adsorption and desorption of methane by granular activated carbon at 25 oC
.Journal of Natural Gas Chemistry .,16 (2007):pp 415-422.
17. Somy.A , Mehrnia.M.R, Amrei.H.D, Ghanizadeh.A, Safari.M “Adsorption of carbon
dioxide using impregnated activated carbon promoted by zinc” International Journal of
Green House Gas Control.,3(2009):pp 49-54
18. Sudibandriyo, M., Pan, Z., Fitzgerald, J.E., Robinson Jr, R.L., Gasem K.A.M.:
“Adsorption of methane, nitrogen, carbon dioxide, and their binary mixtures on dry
activated carbon at 318.2 K and pressures up to 13.6 MPa”. Langmuir., 19((2003):pp
5323-5331
19. Wang.X, French.J, Kandadai.S, Chua.H.T, “Adsorption measurements of methane on
Activated carbon in the temperature range (281-343) K and pressure to 1.2 MPa”
Journal of Chemical Engg Data .,55(2010) :pp 2700-2706
20. Yang, R.T.,Gas separation by adsorption. Boston, Butterworth Publishers, 1987