adsorption kinetics and modeling of h2s by treated waste
TRANSCRIPT

TECHNICAL PAPER
Adsorption kinetics and modeling of H2S by treated waste oil fly ashZaheer Aslama, Ibnelwaleed A. Hussein b, Reyad A. Shawabkeh c, Mohammad Anwar Parvezd,Waqar Ahmade, and Ihsanullahf
aDepartment of Chemical Engineering, University of Engineering and Technology, Lahore, Pakistan; bGas Processing Center, Qatar University,Doha, Qatar; cDepartment of Chemical Engineering, The University of Jordan, Amman, Jordan; dDepartment of Chemical Engineering,University of Hafr Al Batin, Hafr Al Batin, Saudi Arabia; eDepartment of Chemical Engineering, Monash University, Clayton, Australia; fCenterfor Environment & Water, Research Institute, King Fahd University of Petroleum and Minerals, Dhahran, Saudi Arabia
ABSTRACTWaste oil fly ash (OFA) collected from disposal of power generation plants was treated byphysicochemical activation technique to improve the surface properties of OFA. This synthesizedmaterial was further used for potential hydrogen sulfide (H2S) adsorption from synthetic naturalgas. The raw OFA was basically modified with a mixture of acids (20% nitric acid [HNO3] and 80%phosphoric acid [H3PO4]), and it was further treated with 2 M potassium hydroxide (KOH) toenhance the surface affinity as well as surface area of synthesized activated carbon.Correspondingly, it enhanced the adsorption of H2S. Crystallinity, surface morphology, and porevolume distribution of prepared activated carbon were investigated using X-ray diffraction (XRD),scanning electron microscopy (SEM), and Brunauer-Emmett-Teller (BET) analyses. Fourier trans-form infrared (FTIR) study was also performed to identify the functional groups during differentsynthesis stages of modified activated carbon. The Langmuir, Freundlich, Sips, and dual-siteLangmuir (DSL) models were used to study the kinetic and breakthrough behavior of H2S adsorption over alkali-modified activated carbon. Modeling results of isotherms indicated thatOFA has dual sites with high and low affinity for H2S adsorption. The Clark model, Thomas model,and Yoon-Nelson model were used to examine the effects of flow rate and inlet concentration onthe adsorption of H2S. Maximum uptake capacity of 8.5 mg/g was achieved at 100 ppm inletconcentration and flow rate of 0.2 L/min.
Implications: Utilization of worthless oil fly ash from power plant is important not only forcleaning the environment but also for solid waste minimization. This research scope is toeradicate one pollutant by using another pollutant (waste ash) as a raw material. Chemicalfunctionalization of synthesized activated carbon from oil fly ash would lead to attachment offunctional groups of basic nature to attract the acidic H2S. Such type of treatment can enhancethe uptake capacity of sorbent several times.
PAPER HISTORYReceived March 27, 2018Revised September 3, 2018Accepted October 9, 2018
Introduction
Hydrogen sulfide (H2S) is an airborne pollutant causingboth acute and chronic health problems depending onexposure time and toxicant concentration (Feng et al.2005; Wang 2010). It causes eye irritation at low concen-trations (10–20 ppm) while engenders respiratory paraly-sis above the 300 ppm level. Five-minute exposure tohigher concentrations (500–1000 ppm) may lead todeath (Elsayed et al. 2009; Xiao et al. 2008). Apart fromits toxicity to human, hydrogen sulfide can also deactivateindustrial catalysts even at concentration as low as 1 ppmin the gas stream (Ashori, Nazari, and Illas 2014; Forzattiand Lietti 1999). Therefore, controlling the emission ofH2
S is beneficial for both human lives and industries.
Various remediation technologies have been prac-ticed industrially to meet the strict environment reg-ulations of H2S emission. These methods includeabsorption using alkanolamine solutions (Godiniand Mowla 2008; Su et al. 2010), oxidation of H2
S to sulfur by the Claus process (Ledoux et al. 2000;Mora 2000), biological oxidation to sulfuric acid(Soroushian et al. 2006), and adsorption using carbo-naceous and/or aluminosilicate adsorbents (Wiheebet al. 2013). All these methods have their own bene-fits and limitations that make them suitable for spe-cific applications. Among these techniques,adsorption on a suitable surface of solid is preferred
CONTACT Reyad A. Shawabkeh [email protected] Department of Chemical Engineering, The University of Jordan, Amman, Jordan.Color versions of one or more of the figures in the paper can be found online at www.tandfonline.com/uawm.
Supplemental data for this paper can be accessed on the publisher’s website.
JOURNAL OF THE AIR & WASTE MANAGEMENT ASSOCIATION2019, VOL. 69, NO. 2, 246–257https://doi.org/10.1080/10962247.2018.1536004
© 2019 A&WMA

for treating sour gas streams that have lower concen-tration of H2S (Choo, Lau, and Mohamed 2013;Meeyoo, Trimm, and Cant 1997). Activated carbonis widely used as an adsorbent due to its high surfacearea and porosity. Different types of inexpensivematerials can be used as precursors for the synthesisof activated carbon (Hernandez-Ramirez and Holmes2008; Mohamad Nor et al. 2013). Oil fly ash, a by-product from power plants, represents a promisingoption to be converted to activated carbon and usedfor H2S capture from gas stream. The yearly worldproduction of fly ash is more than 700 million tons,with only 30% being used and the rest is dumped inlandfill (Wee 2013). The main composition of oil flyash includes unburned carbon, aluminum oxide,traces of heavy metals, and silicon dioxide.However, the ash obtained from coal combustioncomprises mainly iron, aluminum (Al), and silicon(Si), with minor concentration of alkali and alkalinemetals. Iron-aluminum-silicates and/or calcium-iron-aluminum-silicates account for 60–90% of most ofthe coal-fired fly ashes. Depending on the composi-tion of raw fly ash, versatile materials such as zeo-lites, catalysts, and activated carbon may be derivedfrom fly ash, which is advantageous due to the lowcost and abundant availability fly ash, besides solvingsolid waste issue (Salehin, Aburizaiza, and Barakat2016; Musyoka et al. 2012; Manique et al. 2017;Adamczyk and Białecka 2005; Aslam et al. 2015).
Several studies have been reported on the utilizationof fly ash for the adsorption of individual toxicants inan aqueous solution or from flue gas. Salvatro Andidiet al. used oil fly ash to adsorbed 2-chlorophenol (CP),2-chloroaniline (CA), and methylene blue (MB) fromaqueous solutions. They reported that the adsorptioncapacity was highest for 2-chlorophenol (CP); how-ever, the other two organics showed less affinity forfly ash adsorbent (Andini et al. 2008). Bada andPotgieter-Vermaak investigated the adsorption capabil-ities of fly ash–based adsorbents for organic pollutantsoriginated from petrochemical waste. They comparedacid-activated ash adsorbent with heat-treated fly ashadsorbent and found that the chemically treated ashwas superior for liquid-phase adsorption of organicpollutants (Bada and Potgieter-Vermaak 2008). AzharUddin et al. prepared activated carbon for adsorptionapplications by the pyrolysis of mixture of fly ash withroad paving asphalt dissolved in kerosene at 650 °C innitrogen (N2) atmosphere. They showed that macro-pore diameter of the sample increased with asphaltratio (Azhar Uddin et al. 2007). Bagreeve et al. studiedthe sodium hydroxide (NaOH)-modified activated car-bon for the adsorption of H2S and concluded that
pollutant-binding capacity was increased with loadingof NaOH and the adsorption capacity was insensitiveto pore structure and surface area of carbon (Bagreevand Bandosz 2002). Prezeprioski et al. also reporteda significant improvement in adsorption capacity of H2
S by treating activated carbon with potassium carbo-nate (K2CO3) (Przepiorski, Yoshida, and Oya 1999). Itcan be concluded that the presence of alkali metals onthe surface of activated carbon helps to dissociate theH2S molecule and hence increases the uptake capacity.However, the porosity of a solid sorbent is also impor-tant for enhancing its pollutant uptake capacity. Thus,high surface area and fine microporous adsorbent sur-face help to build strong interactions between adsor-bate gas molecules and the carbon structure. Thisinteraction may lead to physical adsorption of H2
S pollutant onto adsorbent surface. On the otherhand, anchoring oxygen-containing functionalities onthe adsorbent surface may led to the oxidation of H2S,or strong bonding to these surface functionalities, andhence promotes chemisorption (Feng et al. 2005).
The present work aimed at equilibrium and columnbreakthrough study of H2S adsorption in a packed columnwith alkaline-treated activated carbon derived from oil flyash. The effects of operating variables such as temperature,influent concentration of H2S, flow rate, and inlet pressureof gas stream have also been investigated. Meanwhile,different isotherm models such as the Freundlich,Langmuir, Sips, and dual-site Langmuir (DSL) modelswere tested to fit the experimental adsorption data.Subsequently, the Clarkmodel, Thomasmodel, and Yoon-Nelson model were also fitted with experimental data.
Experimental methods and materials
Materials
Rabigh (RB) Power Plant, Saudi Arabia, provided theraw fly ash sample, which was further dried overnightin an oven at 110 °C for removal of any entrainedmoisture in the sample. In addition, 45 µm mesh sizesample was extracted from the dry raw fly ash throughsieve tray and stored in the closed sample containerfor synthesis of activated carbon. Table 1 shows thecomposition of raw oil fly ash where high carboncontent can be observed in the raw material. Nitric(69% pure) and orthophosphoric (85% pure) acidswere of analytical grades, supplied by PanreacQuimica, Spain.Potassium hydroxide was receivedfrom Merck Chemical Company, Germany. A 2 Msolution of KOH was further prepared by dissolvingit in the deionized water. Synthetic natural gas con-taining 50 and 100 ppm H2S in methane was provided
JOURNAL OF THE AIR & WASTE MANAGEMENT ASSOCIATION 247

by Saudi Gas Company. All the volumetric glasswarewas rinsed with distilled water and dehydrated in anoven at 105 °C.
Preparation of activated OFA and surfacemodification with aqueous KOH
Initially, 10 g oil fly ash (OFA) was added intoround-bottom flask that already contained 200 mLof acid mixture (composed of 20% HNO3 and 80%H3PO4 by volume). The contents of the flask wereheated and boiled under total reflux conditions for 4hr. Then activated sample was filtered, and theobtained solid residue was washed repeatedly withdistilled water. The washing of residue was continueduntil pH of spent acid in the filtrate reached 5.Finally, the solid residue was dried in an oven at110 °C for 5 hr. The alkali functionalization of theproduced carbon was performed by mixing of 5 g ofsolid residue in 50 mL of 2 M KOH solution andheating the mixture for 4 hr at 100 °C in a round-bottom flask at total reflux. The resultant mixture wascooled, followed by filtration, and then the filter cakewas washed with 500 mL distilled water. Filter cakewas dried in an oven at 110 °C for 5 hr and stored ina closed-cap bottle for further characterization andadsorption tests. In the following description, thethree samples are abbreviated as “raw OFA” for rawoil fly ash, “FA-AC” for acid-activated raw oil fly ash,and “FA-ACKOH” for KOH-functionalized acid-activated fly ash.
Characterization of produced carbon
Surface area and pore characteristics were measuredusing Micromeritics ASAP 2020 analyzer (xx, xx) bymeasuring the Brunauer-Emmett-Teller (BET)adsorption-desorption capacity of N2 at 77.35 K.Initially, the sample was degassed under vacuum at200 °C for 6 hr; after that nitrogen gas was adsorbed/desorbed on a sample at different relative pressures toobtain equilibrium isotherm. PerkinElmer fiber probecoupler (FPC) Fourier transform infrared (FTIR)spectrophotometer was used to measure the func-tional groups on the surface of activated OFA.A mixture of adsorbent samples and KBr powder
was hydraulically pressed at 10 ton/m2 to preparea thin uniform disk. Then the disk was dried inoven at 110 °C to inhibit any interference due tomoisture. Transmission mode was set in themachine’s software to record the entire FITRspectrum.
The X-ray diffraction (XRD) of the OFA sample wasdetermined using a Phillips PW 1830 diffractometer (xx,xx) operating at 40 kV and 40 mA. The scan rate rangedfrom 2θ = 0° to 2θ = 80°, and sample phases wereidentified by using the HighScore Plus software. Energy-dispersive X-ray (EDX) spectrophotometer was used toanalyze the elemental composition of OFA samples.
The samples used for EDX analysis were coated witha thin layer of gold. Spot analysis was used to generatethe characteristic X-ray spectra, from which the com-positions of the samples were obtained.
Adsorption of H2S
Adsorption capacity of the synthesized adsorbent, i.e.,FA-ACKOH, was evaluated by H2S adsorption tests ina packed column as shown in Figure S1. Jacketedadsorption column (8 cm in length and 1.0 cm dia-meter) was made up of quartz glass. Isothermal con-ditions were maintained inside the column bycontinuous circulation of glycol in a glass jacket ofthe column. The column was packed with 1 g adsor-bent and small amounts of cotton were put at the topand bottom to facilitate the distribution of adsorbatestream. First of all, the packed column was flushedwith nitrogen. Then, the adsorbate gas stream having100 ppm H2S (remaining was methane [CH4]) wasintroduced into the column from the bottom at0.4 L/min and 1 atm pressure at different tempera-tures (i.e., 1, 10, 20, 30, 40, 50 °C). The temperaturewas changed by circulating ethylene glycol (Cole-Parmer Polystat cooling/heating circulating bath) inan adsorption column jacket to maintain the requiredtemperature. The exit concentration of toxic H2S wasmeasured at different time intervals by digitalMultiRAE IR sensorinstalled at the outlet pipe. Theexperiments were repeated by varying the adsorbateflow rate and inlet concentration of the toxicant.Desorption experiments were performed in a similarmanner by sweeping the nitrogen into the column,
Table 1. Elemental compositions of raw OFA and FA-AC.Elements (%)
Material C S O Al Mg Ca V Ni Cu Zn Si Fe
Raw OFA 77.40 7.10 9.32 0.25 1.41 0.23 1.29 0.68 1.70 0.40 0.08 0.14FA-AC 88.05 1.39 10.56 Negligible
248 Z. ASLAM ET AL.

and outlet H2S concentration was also measured asa function of time. Figure S1 showed the experimentalsetup used for H2S adsorption and desorption tests.Adsorption capacity was calculated using eq 1:
q ¼ Co � FM
ð1� C
Co
� �dt (1)
where q is the adsorption capacity (mg/g); Co and C arethe initial and instantaneous concentrations at time t,respectively; and M, F, and t are adsorbent mass (g),flow rate of adsorbate (mL/min), and time (min),respectively.
Results and discussion
Characterization of OFA absorbents
Energy dispersive X-ray (EDX) spectroscopy was con-ducted to obtain the elemental compositions of rawOFA and FA-AC. Initially, raw OFA containedunburned carbon as the main constituent and othermineral oxides, with trace amounts of heavy metals.During the activation process, several nitrification andphosphate reactions occurred due to the interaction ofash with the acid mixture. As a result, all the inorganicoxides leached out completely from the ash, but orga-nically bounded sulfur still remained in the carbonstructure, as can be seen from Table 1. This showsthat the mixture of acids used was more effective inattacking the organic form of sulfur as compared withpyrite and sulfate-type sulfur in the fly ash (Izquierdoand Querol 2012; Kandah, Shawabkeh, and Ar’ef Al-Zboon 2006; Mustafa Arslan 1993; Shawabkeh et al.2011). Table 1 shows the complete elemental composi-tions of raw OFA and FA-AC.
The porosimetric features of raw OFA and itsderived substances are shown in Table 2. The precursormaterial has small BET surface area and negligiblemicropore volume. Acid treatment induces porosity toash by removing inorganic matter from the surface andproduces a porous carbon. The BET surface area has
also increased from 2.75 to 61.54 m2/g. However, thesurface area and pore volume are reduced after thefunctionalization of FA-AC with aqueous KOH. Infact, the reductions are believed to occur because ofdestructive action of KOH on the inner pores ofcarbon.
The Barrett-Joyner-Halenda (BJH) pore size distri-bution (Figure S2) of FA-ACKOH shows that 91% of thepore area belongs to mesopores, whereas microporesmake up only 4.7% of the total area and macropores theremaining area. Meanwhile, in FA-AC, mesoporesaccount for almost same percentage (i.e., 90.4%) ofthe pore area and the remaining 8% and 1.5% arecontributed by micro- and macropores, respectively.The pore area distribution as shown in Figure S2depicts the heterogeneity of the adsorbent surface, andit can be characterized as mesoporous adsorbent. Thehysteresis in the isotherms of FA-AC and FA-ACKOH isapproximately the same, as shown in Figure 1, whichconfirms that the mesoporous area in FA-ACKOH isalmost the same as its precursor. Although FA-AC ismore porous than FA-ACKOH, the surface modificationwith alkali treatment has increased its adsorption capa-city several times, as discussed in the subsequentsections.
FTIR spectra of different ash samples are shown inFigure S3. A broad band appears in the range3100–3550 cm−1 for raw oil fly ash, with minimumintensity at 3400 cm−1.This stretching vibration isattributed to free hydroxyl groups (–OH) in raw oilfly ash sample (Hontoria-Lucas et al. 1995). Similarly, itcan also be related to both adsorbed water (3400 cm−1)and silanol groups (Si–OH) on the surface. Two peakscan be observed in raw OFA at 2924 and 2854 cm−1
that correspond to C–H sp3 stretching in aliphatic acidsand O–H vibration in the molecule (Bakr and Gabre2013; Kumar, Prasad, and Mishra 2010). Three peaks(1625, 1394, and 1115 cm−1) between 1100 and1650 cm−1 are indicative of C=C stretching/bendingvibrations of O–H groups and stretching vibrations ofC–O groups, respectively. Compared with raw OFA,acid treatment of fly ash (i.e., FA-AC) introduces oxy-genated acidic surface functional groups that mainlyconsist of phenolic hydroxyls, carboxylics, and lactones(Shafeeyan et al. 2010). After KOH treatment, the FA-AC surface is functionalized and the hydroxyl group isattached to the surface, as indicated by intense peak at3435 cm−1. The peak at 1630 cm−1 is due to C=Odouble-bond stretching vibrations of aromatic carbons(Buasri et al. 2013; Shawabkeh 2004). The adsorption ofH2S onto FA-ACKOH surface produces a strong bandwith minimum at 3435 cm−1, and this peak can beascribed to dissociative adsorption of H2S. This
Table 2. Porosity characteristics of raw and activated ashsamples.Porosity characteristic Raw OFA FA-AC FA-ACKOHBET area (m2/g) 2.75 61.54 35.24Langmuir surfacearea (m2/g)
4.4 105.79 58.35
t-plot microporevolume (cm3/g)
~0 0.0031 0.0022
Average BJHadsorption poresize (4V/A), A°
280 70 115
Average BJHdesorption poresize (4V/A), A°
190 53 72
JOURNAL OF THE AIR & WASTE MANAGEMENT ASSOCIATION 249

increase in intensity is due to contribution of –OHstretching of –SO–OH functional group. –SH groupcan be assigned to the peak that appears at 1620 cm−1
(Travert et al. 2002; Wang et al. 1998; Lee et al. 2002).Comparison of FTIR spectra shows that the H2
S adsorption became more effective due to the presenceof hydroxyl groups.
XRD was performed to investigate the changesincorporated into the ash at various stages of its use,as shown in Figure 2. Generally, the crystal structure ofheavy oil fly ash consists of carbon in amorphous stateand crystallites of metallic oxides. The presence of
amorphous carbon can be indicated by a broad peakat 2θ = 25° (Yaumi, Hussien, and Shawabkeh 2013).The crystallites of metallic oxides in raw OFA includemullite (aluminosilicate), zeolite, quartz, faujasite, andcancrinite. Small peaks at 2θ = 11°, 16°, and 18° can beassigned to zeolite. A distinct peak at 2θ = 22° is relatedto the presence of quartz in the fly ash. Three smallpeaks between 2θ = 27° and 2θ = 38° reveal the pre-sence of faujasite, cancrinite, and mullite phases.Furthermore, a wide peak at 2θ = 43° revealsa sodalite phase, followed by a small peak of quartz at2θ = 76° (Katara et al. 2013; Musyoka et al. 2011;
Figure 1. BET isotherm plots of activated oil fly ash carbon at different stages of synthesis.
Figure 2. XRD patterns of Raw and synthesized adsorbents.
250 Z. ASLAM ET AL.

Shawabkeh et al. 2011). Treatment of raw OFA withmixture of acids washed out almost all the minerals, asmost of the tiny peaks do not exist further, as shown inFigure 2 for FA-AC. The carbon peak intensity at 2θ =25° has increased up to 185% in comparison with rawoil fly ash. The broadening of the carbon peak after acidactivation of raw ash reflects the predominance ofamorphous and porous nature of activated carbon(Tangjuank et al. 2009). The XRD pattern remains thesame after functionalization of FA-AC with KOH,except around 50% decrease in peak intensities afterKOH treatment. It shows surface coverage of porouscarbon with alkali; hence, decrease in surface area hasbeen observed, as indicated in BET analysis (Ilango2008). Comparing the individual peaks of X-ray dif-fractograms of FA-ACKOH before and after H2
S adsorption tests reveals no major difference betweenthem except the appearance of a clear, sharp peak at 2θ= 21.5° after H2S adsorption onto FA-ACKOH.Therefore, it indicates the possibility of formation ofa new substance, i.e., K2SO4, as a result of chemicalreaction of acidic H2S in the gas stream with carbon inthe adsorbent (Lee et al. 2002; Shawabkeh 2004).
Adsorption thermodynamics
Thermodynamic parameters were evaluated throughthe adsorption equilibrium data. For that purpose, thefollowing equations were used for the calculation ofthermodynamic parameters:
lnK ¼ lnqtCt
� �¼ ΔS�ads
R� ΔH�
ads
RT(2)
ΔG� ¼ ΔH� � TΔS� (3)
where ΔH*, ΔS*, and ΔG* are the change in enthalpy,entropy, and Gibbs free energy of the adsorption pro-cess, respectively. ΔG* is the fundamental criterion ofthe process spontaneity. The specific values of all thepertinent parameters for H2S adsorption over FA-ACKOH were calculated using eqs 2 and 3, and theresults are presented in Table S1.
The enthalpy, ΔH* (−3.51 KJ/mol), of adsorption isnegative, which indicates that the sorption of H2S ontoFA-ACKOH is exothermic in nature. The Gibbs freeenergy, ΔG*, was found to be negative, which confirmsthat the adsorption of H2S is a spontaneous process andthe degree of spontaneity increases with rise in tem-perature. The positive entropy change (ΔS*) indicatesthe affinity of the FA-ACKOH for adsorption of H2S. Italso suggests the increase in randomness of the adsorp-tion process.
Adsorption isotherms
The Freundlich, Langmuir, Sips, and dual-site Langmuir(DSL) models were utilized for isothermal analysis of H2
S adsorption onto FA-ACKOH. The mathematical expres-sion of each isotherm with associated parameters is pre-sented in Table 3. The experimental data were analyzed bynonlinear least squares method, as nonlinear regression issuperior to linear regression for analysis of the data. Inorder to evaluate the applicability of each isothermmodel,statistical parameters were used, such as coefficient ofdetermination (R2) and residual sum of squares (RSS).Microsoft Excel (Redmond, WA) “Solver” function was
Table 3. Isotherm models and their pertinent parameters for runs at different temperatures at flow rate 0.4 L/minand 100 ppm initial concentration.Isotherm model Equation Isotherm parameters 1 °C 10 °C 20 °C 30 °C
Freundlichqe ¼ KFC
1=ne
KF 5.91 5.61 5.45 5.37
1/n 0.099 0.095 0.100 0.108R2 0.881 0.891 0.884 0.899RSS 4.312 3.491 3.542 2.962
Langmuir qe ¼ qmKCe1þKCeð Þ qm 4.56 4.36 4.18 4.05
K 3893 4399 3876 3364R2 0.957 0.956 0.952 0.952RSS 1.541 1.421 1.469 1.405
Sips qe ¼ KSCβSe
1þaSCβSe
� � Ks 79,180 79,026 78,848 78,697
βS 1.180 1.169 1.190 1.213as 17,422 18,188. 18,928 19,556R2 0.961 0.959 0.956 0.955RSS 1.398 1.323 1.351 1.337
DSL qe ¼ qm1K1Ce1þK1Ceð Þ þ qm2K2Ce
1þK2Ceð Þ qm1 4.310 4.089 3.913 3.716
K1 4454 5137 4540 4103qm2 3.00 2.50 2.45 2.25K2 1.214 1.647 1.654 2.312R2 0.969 0.970 0.967 0.974RSS 1.115 0.920 0.979 0.728
JOURNAL OF THE AIR & WASTE MANAGEMENT ASSOCIATION 251

used to carry out the regression and optimization ofstatistical parameters such as RSS by using the followingequation:
RSS ¼ nXn1
ðqi;exp � qi;modelÞ2 (4)
where n is the number of data points, qi,exp and qi,model arethe experimental and theoretical values of adsorbedamount of H2S on FA-ACKOH, respectively. The correla-tion coefficient (R2) is a measure of variance in the experi-mental and model predicted values, and the standarderror (RSS) provides an indication of the precision ofthe results. The model that provides high R2 and lowRSS can be ranked as the best isotherm model for theobserved results. Figure 3a shows the typical isothermplots, and the calculated capacities along with othermodel parameters are summarized in Table 3. The resultsindicate that the adsorption isotherms were best fitted bythe dual-site Langmuir (DSL) model, which can be seenthrough the RSS and regression coefficient values. TheFreundlich model underestimated the experimentalvalues at lower concentrations and overestimated themat higher concentrations, whereas the Langmuir and Sipsmodels are the opposite (overestimated at lower concen-trations and underestimated at higher concentrations).The parameter n of the Freundlich isotherm signifies thedegree of favorability of adsorption. It is clear thatincrease in temperature decreases the value of n, whichis unfavorable for the adsorption of H2S. Adsorption athigher temperatures raises the vapor pressure of adsor-bate and hence increases the energy level of pollutant gasto overcome the van der Waals force of attraction andmigrates it back to bulk gas phase. As a result, uptake ofH2S decreases, which is also reflected in the decline ofvalue of n. The better correlation coefficient (R2) of theSips isotherm indicates that the adsorbent surface is not
completely homogeneous. The factor βS reflects the sur-face heterogeneity, and the smaller the value of this factor,the higher the surface heterogeneity of adsorbent.
After concluding the DSL model as the best-fit model,the experimental adsorption data at different tempera-tures (from 1 to 30 °C) were analyzed and regressionresults are depicted in Figure 3b. The results show thatthe amount adsorbed on solid phase increased sharplyup to a value close to 3.5–4.25 mg/g when the bedtemperature was in the range of 1–30 °C. The fitting ofisotherms with the DSL model suggests that the interac-tion between H2S and FA-ACKOH has dual-site charac-teristics. It means that adsorbent has two energeticallydifferent sites with high and low affinity. The exit con-centration of the column outlet remained zero until thehigh-affinity first type of sites was fully exhausted bygaseous adsorbate. The coverage of pores with alkaliduring KOH functionalization (as supported by surfacearea characterization in earlier discussion) tends to che-misorb the influent H2S onto FA-ACKOH; hence, K2SO4
was formed, as evident from the X-ray diffractogram.These high-affinity sites contributed more toward theoverall adsorption capacity. After the steep rise in qedue to utilization of higher-affinity sites, adsorptionbecame slower, as shown in Figure 3b. This flat portionof isotherm may be related to the filling of lower-affinitysites by the diffusion of adsorbate into the pores until thecolumn became saturated. Both the saturation capacities(qm1, qm2) and affinities (K1, K2) decreased with increasein bed temperature, as also supported by thermody-namic study discussed in the previous section.
Column dynamics and effects of operatingconditions
The breakthrough behavior and adsorption capacitywere predicted through different dynamic adsorption
Figure 3. Fitting adsorption isotherm data for H2S at 100 ppm inlet concentration and 0.4 L/min flow rate: (a) Different adsorptionmodels at 1 °C. (b) Dual-site Langmuir (DSL) model for all temperatures.
252 Z. ASLAM ET AL.
models. The Yoon-Nelson model, Thomas model, andClark model were used for analyzing the experimentaldata of H2S adsorption.
Yoon-Nelson modelYoon-Nelson model, a very simple model, can be usedto predict the breakthrough behavior of vapor or gasadsorption over an adsorbent surface. In this model, itis assumed that the rate of decrease of adsorbate gasadsorption is directly proportional to the probability ofadsorbate breakthrough on the adsorbent and adsorp-tion potential of adsorbate. The mathematical expres-sion of the Yoon-Nelson model can be represented asfollows. It is usually used for breakthrough behavior ofa single component.
lnC
Co � C
� �¼ kYN t � τð Þ (5)
Here, kYN (min−1) is the rate constant of the Yoon-Nelson model. This rate constant is a function of con-taminant concentration (C), volumetric flow rate (F),and weight of the adsorbent, W (i.e., kYN ¼ C�F
M ). τ(min) is the time required to reach at 50% adsorbatebreakthrough time.
Thomas modelThe Thomas model assumes that diffusion constraints(both external and internal) are absent in the adsorp-tion process. It indicates that the rate of driving forcefollows second-order reversible reaction kinetics andthe Langmuir adsorption isotherm. The Thomasmodel computes the maximum concentration of solute
gas on the adsorbent surface and adsorption rate con-stant for an adsorption process. The linearized form ofthe Thomas model is represented by eq 6:
lnC0
C� 1
� �¼ KThq0X
Q� KThC0t (6)
where qo (mg/g) is the maximum uptake of the solid-phase adsorbent, KTh is the constant (mL/min·mg) ofthe Thomas model, Q is the flow rate (mL/min), andX (g) is the amount of adsorbent packed in the column.The specific constants can be determined by analyzingthe data through either linear or nonlinear regression.
Clark modelThe Clark model is based on the concept of masstransfer in combination with the Freundlich isotherm.The model equation can be expressed as follows:
CCo
¼ 11þ Ae�rt
� �1=n�1
(7)
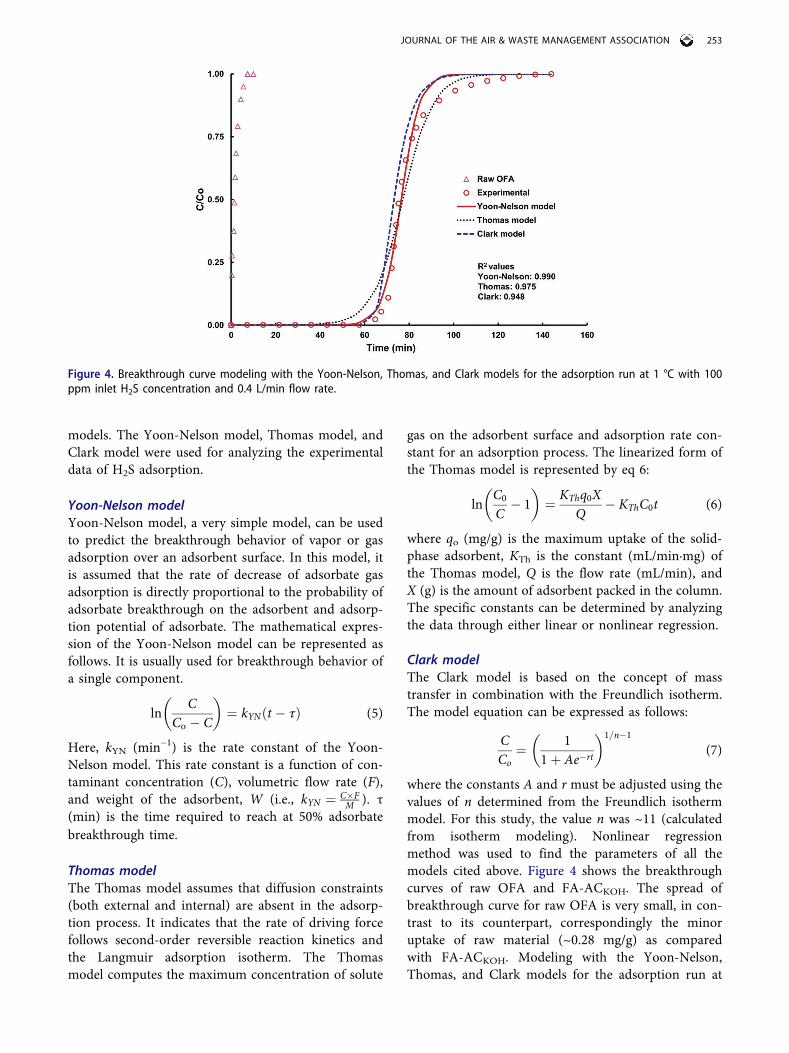
where the constants A and r must be adjusted using thevalues of n determined from the Freundlich isothermmodel. For this study, the value n was ~11 (calculatedfrom isotherm modeling). Nonlinear regressionmethod was used to find the parameters of all themodels cited above. Figure 4 shows the breakthroughcurves of raw OFA and FA-ACKOH. The spread ofbreakthrough curve for raw OFA is very small, in con-trast to its counterpart, correspondingly the minoruptake of raw material (~0.28 mg/g) as comparedwith FA-ACKOH. Modeling with the Yoon-Nelson,Thomas, and Clark models for the adsorption run at
Figure 4. Breakthrough curve modeling with the Yoon-Nelson, Thomas, and Clark models for the adsorption run at 1 °C with 100ppm inlet H2S concentration and 0.4 L/min flow rate.
JOURNAL OF THE AIR & WASTE MANAGEMENT ASSOCIATION 253

1 °C and 100 ppm inlet H2S concentration and 0.4 L/min flow rate was carried out. The regression correla-tion coefficient (R2) value for each dynamic model isshown in Figure 4. It can be seen that the Yoon-Nelsonmodel better fitted the adsorption of H2S on FA-ACKOH than any other model. The Thomas model atlower exit concentrations is not as appropriate as it is athigher exit concentrations, whereas the Clark modelshows the reverse behavior as compared with theThomas model. Having a higher correlation coefficientvalue, the Yoon-Nelson model was further used toexplain the effects of operating conditions on thebreakthrough curves.
Effects of flow rate, concentration, and inletpressure
The Yoon-Nelson model was applied to experimentalbreakthrough data that were collected at various flowrates and two different initial concentrations, as pre-sented in Figure 5. The correlation coefficients are sum-marized and compared with experimental findings inTable S2. The values of regression constants and percen-tage errors in comparing predicted versus experimentalτ values are negligible. Raising the volumetric flow rateshifts the breakthrough time curve to the left and affectsthe adsorption capacity. Decreasing the flow rate from0.8 to 0.2 L/min increases the column breakthrough timemany folds, as shown in Figure 5a. As the rate of intro-duction of adsorbate increases, the active sites are filledquicker and adsorbent achieves saturation at fasterspeed. The value of the Yoon-Nelson model constant(i.e., kYN ¼ C�F
M ) increases with flow rate, hence higheruptake rate of pollutant molecules at constant concen-tration and mass of an adsorbent. On the other hand, thelower inlet concentration of pollutant gas (at constanttemperature, flow rate, and adsorbent mass) gives slowerbreakthrough, since lower concentration gradient causesslower transport. The breakthrough curves are presented
in Figure 5b. The Yoon-Nelson model parameters arepresented in Table S2 for two different initial concentra-tions. Because of direct relation with concentration, thetransport rate, kYN, shows a higher (~0.188 min−1) valueat higher concentration as compared with its lower valuecorresponding to lower concentration. On the otherhand, lower pollutant concentration in the influentstream increases the treated volume that can be pro-cessed and shifts the breakthrough curve to the right.
Adsorption experiments were also conducted at dif-ferent gauge pressures (20–50 psi) to examine the effectof inlet pressure on the column breakthrough curve.The column breakthrough data were fitted to the Yoon-Nelson model, and it shows good agreement withexperimental data. The Yoon-Nelson model parametersare listed in Table S3. Pressure drop in columnremained below 6%, and the 50% breakthrough timewas increased from 76 to 89 min by increasing thepressure level from 20 to 50 psi. In Table 4,a comparison of adsorption capacities between synthe-sized fly ash–based adsorbent and other similar types ofactivated carbon reported illustrates that the studiedadsorbent has almost similar or higher capability toadsorb the pollutant acidic gas (H2S) from gas stream.
Conclusion
This study suggests that a waste oil fly ash can beutilized as a low-cost adsorbent for removal of H2
S from natural gas. Chemical treatment with acid solu-tion removed the undesired minerals from raw OFAand increased the surface area, which is required forincreased adsorption capacity. Activation of raw OFAwith the described approach has converted it intoa valuable adsorbent, and this can also aid waste dis-posal related to oil fly ash. H2S uptake capacity wasincreased to 8.5 mg/g from just 0.28 mg/g. H2
S adsorption process was exothermic in nature andwas spontaneous, as shown by the ΔG* value. The
Figure 5. Comparison of experimental versus predicted (Yoon-Nelson) breakthrough curves: (a) Different flow rates (temperature = 30°C; inlet concentration = 100 ppm). (b) Different inlet concentrations (temperature = 30 °C; flow rate = 0.4 L/min).
254 Z. ASLAM ET AL.

DSL isotherm better explained the isotherm break-through experimental data with dual-site adsorptioncharacteristics of produced adsorbent. The Yoon-Nelson dynamic model was considered to be mostappropriate among all the dynamic models to repro-duce the experimental breakthrough curves.
Acknowledgment
The authors would like to acknowledge the help of theScience and Technology Unit at King Fahd University ofPetroleum and Minerals (KFUPM), Saudi Arabia.
Funding
This work was supported by the King Abdul Aziz City forScience and Technology (KACST) (11-ENV1645-04).
About the authors
Zaheer Aslam is working as assistant professor atDepartment of Chemical Engineering, UET, Lahore 54000,Pakistan.
Ibnelwaleed A. Hussein is working as assistant professor atDepartment of Chemical Engineering, UET, Lahore 54000,Pakistan.
Reyad A. Shawabkeh is a professor at Department ofChemical engineering, University of Jordan, Amman, Jordan.
Mohammad Anwar Parvez is an assistant professor atDepartment of Chemical Engineering, University of Hafr alBatin, Kingdom of Saudi Arabia.
Waqar Ahmad is a PhD scholar at Department of ChemicalEngineering, Monash University, Clayton Campus, Australia.
Ihsanullah is Research Engineer-III/Assistant Professor atCentre for Water and Environment (CEW), ResearchInstitute, King Fahd University of Petroleum & Minerals,Dhahran, Kingdom of Saudi Arabia.
ORCID
Ibnelwaleed A. Hussein http://orcid.org/0000-0002-6672-8649Reyad A. Shawabkeh http://orcid.org/0000-0001-7463-3415
References
Adamczyk, Z., and B. Białecka. 2005. Hydrothermal synthesisof zeolites from polish coal fly ash. Polish J. Environ. Stud.14 (6):713–719. doi:10.1179/1743676115Y.0000000063.
Andini, S., R. Cioffi, F. Colangelo, F. Montagnaro, andL. Santoro. 2008. Adsorption of chlorophenol, chloroani-line and methylene blue on fuel oil fly ash. J. Hazard.Mater. 157 (2–3):599–604. doi:10.1016/j.jhazmat.2008.01.025.
Ashori, E., F. Nazari, and F. Illas. 2014. Adsorption of H2S oncarbonaceous materials of different dimensionality. Int.J. Hydrogen Energy 39 (12):6610–6619. doi:10.1016/j.ijhydene.2014.02.004.
Aslam, Z., R. A. Shawabkeh, I. A. Hussein, N. Al-Baghli, andM. Eic. 2015. Synthesis of activated carbon from oil fly ashfor removal of H2S from gas stream. Appl. Surf. Sci.327:107–115. Elsevier B.V. doi:10.1016/j.apsusc.2014.11.152.
Azhar Uddin, M., Y. Shinozaki, N. Furusawa, T. Yamada,Y. Yamaji, and E. Sasaoka. 2007. Preparation of activatedcarbon from asphalt and heavy oil fly ash and coal fly ashby pyrolysis. J. Anal. Appl. Pyrolysis 78 (2):337–342.doi:10.1016/j.jaap.2006.09.004.
Bada, S. O., and S. Potgieter-Vermaak. 2008. Evaluation andtreatment of coal fly ash for adsorption application.Leonardo El. J. Pract. Technol. 12 (January–June):37–48.
Bagreev, A., and T. J. Bandosz. 2002. A role of sodiumhydroxide in the process of hydrogen sulfide adsorption/oxidation on caustic-impregnated activated carbons. Ind.Eng. Chem. Res. 41 (4):672–679. doi:10.1021/ie010599r.
Bakr, M. H. M., and A. M. E. Gabre. 2013. Reduction of CODin resin production wastewater using three types of acti-vated carbon. J. Environ. Treat. Tech. 1 (3):126–136.
Buasri, A., N. Chaiyut, V. Loryuenyong, E. Phakdeepataraphan,S. Watpathomsub, V. Kunakemakorn, A. Materials, andP. Samples. 2013. Synthesis of activated carbon using agri-cultural wastes from biodiesel production. Int. J. Mater.Metallurgical Eng. 7 (1):98–102.
Choo, H., L. C. Lau, and A. R. Mohamed. 2013. Hydrogensulfied adsorption by alkaline impregnated coconut shellactivated carbon. J. Eng. Sci. Technol. 8 (6):741–753.
Elsayed, Y., M. Seredych, A. Dallas, and T. J. Bandosz. 2009.Desulfurization of air at high and low H2S concentrations.Chem. Eng. J. 155 (3):594–602. doi:10.1016/j.cej.2009.08.010.
Table 4. Comparison of breakthrough capacities of synthesizedadsorbents reported in the literature.
AdsorbentBreakthrough capacity (mg H2
S/g sorbent) Reference
FA-ACKOH 8.5 Present studyActivated carbon fiber Feng et al. 2005ACF10 1.96ACF20 3.62ACF30 4.57
Granular activatedcarbon (AC)
2.1 Xiao et al. 2008
Na2CO3-impregnatedAC (IAC)
7.7
Alkaline-impregnatedAC
Sethupathiet al. 2017
A 1.67A_100-NaOH 0.4A_100-KOH 1.58
Biochar-based carbon Shang et al.2016Camphore 15.4
Rice hull 2.04Bamboo 1.78
Biochar-based carbon Sethupathiet al. 2017Perilla 7.1
Korean oak 0.76Japanese oak 0.62Soybean stover 2.5
JOURNAL OF THE AIR & WASTE MANAGEMENT ASSOCIATION 255

Feng, W., S. Kwon, E. Borguet, and R. Vidic. 2005.Adsorption of hydrogen sulfide onto activated carbonfibers: Effect of pore structure and surface chemistry.Environ. Sci. Technol. 39 (24):9744–9749. doi:10.1021/es0507158.
Forzatti, P., and L. Lietti. 1999. Catalyst deactivation.Catal. Today 52:165–181. doi:10.1016/S0920-5861(99)00074-7.
Godini, H. R., and D. Mowla. 2008. Selectivity study of H2
S and CO2 absorption from gaseous mixtures by MEA inpacked beds. Chem. Eng. Res. Des. 86 (4):401–409.doi:10.1016/j.cherd.2007.11.012.
Hernandez-Ramirez, O., and S. M. Holmes. 2008. Noveland modified materials for wastewater treatmentapplications. J. Mater. Chem. 18 (24):2751. doi:10.1039/b716941h.
Hontoria-Lucas, C., A. J. López-Peinado, J. D. D. López-González, M. L. Rojas-Cervantes, and R. M. Martín-Aranda.1995. Study of oxygen-containing groups in a series ofgraphite oxides: Physical and chemical characterization.Carbon 33 (11):1585–1592. doi:10.1016/0008-6223(95)00120-3.
Ilango, S. 2008. Equilibrium sorption studies of Fe, Cu andCo ions in aqueous medium using activated carbon pre-pared from recinius communis linn. J. Appl. Sci. Environ.Manag. 12 (2): 81–87.
Izquierdo, M., and X. Querol. 2012. Leaching behaviour ofelements from coal combustion fly ash: An overview. Int.J. Coal Geol. 94 (May):54–66. Elsevier B.V. doi:10.1016/j.coal.2011.10.006.
Kandah, M. I., R. Shawabkeh, and M. Ar’ef Al-Zboon. 2006.Synthesis and characterization of activated carbon fromasphalt. Appl. Surf. Sci. 253 (2):821–826. doi:10.1016/j.apsusc.2006.01.015.
Katara, S., S. Kabra, A. Sharma, R. Hada, and A. Rani. 2013.Surface modification of fly ash by thermal activation.International Research Journal of Pure & AppliedChemistry : A DR/FTIR study. 3 (4):299–307.
Kumar, A., B. Prasad, and I. M. Mishra. 2010. Isotherm andkinetics study for acrylic acid removal using powderedactivated carbon. J. Hazard. Mater. 176 (1–3):774–783.doi:10.1016/j.jhazmat.2009.11.102.
Ledoux, M. J., C. Pham-Huu, N. Keller, J.-B. Nougayrède,S. Savin-Poncet, and J. Bousquet. 2000. Selective oxidationof H2S in claus tail-gas over SiC supported NiS2 catalyst.Catalysis Today61:157–163.
Lee, Y.-W., J.-W. Park, J.-H. Choung, and D.-K. Choi. 2002.Adsorption characteristics of SO2 on activated carbon pre-pared from coconut shell with potassium hydroxideactivation. Environ. Sci. Technol. 36 (5):1086–1092.doi:10.1021/es010916l.
Manique, M. C., L. V. Lacerda, A. K. Alves, andC. P. Bergmann. 2017. Biodiesel production using coal flyash-derived sodalite as a heterogeneous catalyst. Fuel190:268–273. doi:10.1016/j.fuel.2016.11.016.
Meeyoo, V., D. L. Trimm, and N. W. Cant. 1997. Adsorption-reaction processes for the removal of hydrogen sulphide fromgas streams. J. Chem. Technol. Biotechnol. 68 (4):411–416.doi:10.1002/(SICI)1097-4660(199704)68:4<411::AID-JCTB644>3.0.CO;2-9.
Mohamad Nor, N., L. C. Lau, K. T. Lee, andA. R. Mohamed. 2013. Synthesis of activated carbon
from lignocellulosic biomass and its applications in airpollution control—A review. J. Environ. Chem. Eng. 1(4):658–666. Elsevier B.V. doi:10.1016/j.jece.2013.09.017.
Mora, R. L. 2000. Sulphur condensation influence in clauscatalyst performance. J. Hazard. Mater. 79 (1–2):103–115.doi:10.1016/S0304-3894(00)00193-X.
Mustafa Arslan, M. B. 1993. The interaction of orthopho-sphoric acid and fly ash. Resour. Conserv. Recycl.9:295–310. doi:10.1016/0921-3449(93)90010-D.
Musyoka, N. M., L. F. Petrik, G. Balfour, W. M. Gitari, andE. Hums. 2011. Synthesis of hydroxy sodalite from coal flyash using waste industrial brine solution. J. Environ. Sci.Health A Tox. Hazard. Subst. Environ. Eng. 46(14):1699–1707. doi:10.1080/10934529.2011.623961.
Musyoka, N. M., L. F. Petrik, G. Balfour, P. Ndungu,W. M. Gitari, and E. Hums. 2012. Synthesis of zeolitesfrom coal fly ash: Application of a statistical experimentaldesign. Res. Chem. Intermediates 38 (2):471–486.doi:10.1007/s11164-011-0364-1.
Przepiorski, J., S. Yoshida, and A. Oya. 1999. Structure ofK2Co3 -loaded activated carbon fiber and its deodor-ization ability against H2S gas. Carbon 37:1881–1890.
Salehin, S., A. S. Aburizaiza, and M. A. Barakat. 2016.Activated carbon from residual oil fly ash for heavy metalsremoval from aqueous solution. Desalin. Water Treat. 57(1):278–287. doi:10.1080/19443994.2015.1006824.
Sethupathi, S., M. Zhang, A. U. Rajapaksha, S. R. Lee,N. M. Nor, A. R. Mohamed, M. Al-Wabel, S. S. Lee, andY. S. Ok. 2017. Biochars as potential adsorbers of CH4,CO2 and H2S. Sustainability 9 (1):1–10. doi:10.3390/su9010121.
Shafeeyan, M. S., W. M. A. W. Daud, A. Houshmand, andA. Shamiri. 2010. A review on surface modification of acti-vated carbon for carbon dioxide adsorption. J. Anal. Appl.Pyrolysis 89 (2):143–151. Elsevier B.V. doi:10.1016/j.jaap.2010.07.006.
Shang, G., Q. Li, L. Liu, P. Chen, and X. Huang. 2016.Adsorption of hydrogen sulfide by biochars derived frompyrolysis of different agricultural/forestry wastes. J. AirWaste Manag. Assoc. 66 (1):8–16. doi:10.1080/10962247.2015.1094429.
Shawabkeh, R., M. J. Khan, A. A. Al-Juhani, H. I. Al-AbdulWahhab, and I. A. Hussein. 2011. Enhancement of surfaceproperties of oil fly ash by chemical treatment. Appl. Surf.Sci. 258 (5):1643–1650. doi:10.1016/j.apsusc.2011.07.136.
Shawabkeh, R. A. 2004. Synthesis and characterization ofactivated carbo-aluminosilicate material from oil shale.Micropor. Mesopor. Mat. 75 (1–2):107–114. doi:10.1016/j.micromeso.2004.07.020.
Soroushian, F., Y. Shang, E. J. Whitman, G. Garza, andZ. Zhang. 2006. Development and application of biologicalH2S scrubbers for treatment of digester gas. WaterEnviron. Found.Proceedings of the Water EnvironmentFederation, WEFTEC 2006: Session 41 through Session 50,pp. 3541–3547.
Su, H., S. Wang, H. Niu, L. Pan, A. Wang, and Y. Hu. 2010.Mass transfer characteristics of H2S absorption from gaseousmixture into methyldiethanolamine solution in a T-JunctionMicrochannel. Separation Purif. Technol. 72 (3):326–334.Elsevier B.V. doi:10.1016/j.seppur.2010.02.024.
Tangjuank, S., N. Insuk, V. Udeye, and J. Tontrakoon.2009. Chromium (III) sorption from aqueous solutions
256 Z. ASLAM ET AL.

using activated carbon prepared from cashew nutshells. Int. J. Phys. Sci. 4 (8):412–417.
Travert, A., O. V. Manoilova, A. A. Tsyganenko, and F. Mauge.2002. Effect of hydrogen sulfide andmethanethiol adsorptionon acidic properties of metal oxides : An infrared study.J. Phys. Chem. B 106 (6):1350–1362. doi:10.1021/jp0126762.
Wang, N. 2010. An investigation of H2S adsorptionmechanisms on tire derived rubber particles.,(TDRPTM)". Graduate Theses andDissertations. 11550. Iowa State University,USA.https://lib.dr.iastate.edu/etd/11550
Wang, Y., A. B. Mohammed Saad, O. Saur, J. C. Lavalley, andB. A. Morrow. 1998. FTIR study of adsorption and reac-tion of SO2 and H2S on Na/SiO2. Appl. Catal. B16:279–290. doi:10.1016/S0926-3373(97)00084-2.
Wee, J.-H. 2013. A review on carbon dioxide capture andstorage technology using coal fly ash. Appl. Energy 106(June):143–151. doi:10.1016/j.apenergy.2013.01.062.
Wiheeb, A. D., I. K. Shamsudin, M. A. Ahmad, M. N. Murat,J. Kim, and M. R. Othman. 2013. Present technologies forhydrogen sulfide removal from gaseous mixtures. Rev.Chem. Eng. 29 (6):449–470. doi:10.1515/revce-2013-0017.
Xiao, Y., S. Wang, D. Wu, and Q. Yuan. 2008. Experimental andsimulation study of hydrogen sulfide adsorption on impreg-nated activated carbon under anaerobic conditions. J. Hazard.Mater. 153 (3):1193–1200. doi:10.1016/j.jhazmat.2007.09.081.
Yaumi, A. L., I. A. Hussien, and R. A. Shawabkeh. 2013.Surface modification of oil fly ash and its application inselective capturing of carbon dioxide. Appl. Surf. Sci. 266(February):118–125. doi:10.1016/j.apsusc.2012.11.109.
JOURNAL OF THE AIR & WASTE MANAGEMENT ASSOCIATION 257