adsorption capacity: a molecular modeling approach
TRANSCRIPT

molecules
Article
Effect of Kerogen Thermal Maturity on MethaneAdsorption Capacity: A MolecularModeling Approach
Saad Alafnan *, Theis Solling * and Mohamed Mahmoud
KFUMP King Fahad University of Petroleum and Minerals, Dhahran 31261, Saudi Arabia;[email protected]* Correspondence: [email protected] (S.A.); [email protected] (T.S.)
Received: 29 June 2020; Accepted: 17 August 2020; Published: 18 August 2020�����������������
Abstract: The presence of kerogen in source rocks gives rise to a plethora of potential gas storagemechanisms. Proper estimation of the gas reserve requires knowledge of the quantities of free andadsorbed gas in rock pores and kerogen. Traditional methods of reserve estimation such as thevolumetric and material balance approaches are insufficient because they do not consider both thefree and adsorbed gas compartments present in kerogens. Modified versions of these equations arebased on adding terms to account for hydrocarbons stored in kerogen. None of the existing modelsconsidered the effect of kerogen maturing on methane gas adsorption. In this work, a molecularmodeling was employed to explore how thermal maturity impacts gas adsorption in kerogen. Fourdifferent macromolecules of kerogen were included to mimic kerogens of different maturity levels;these were folded to more closely resemble the nanoporous kerogen structures of source rocks. Thesestructures form the basis of the modeling necessary to assess the adsorption capacity as a function ofthe structure. The number of double bonds plus the number and type of heteroatoms (O, S, and N)were found to influence the final configuration of the kerogen structures, and hence their capacityto host methane molecules. The degree of aromaticity increased with the maturity level within thesame kerogen type. The fraction of aromaticity gives rise to the polarity. We present an empiricalmathematical relationship that makes possible the estimation of the adsorption capacity of kerogenbased on the degree of polarity. Variations in kerogen adsorption capacity have significant implicationson the reservoir scale. The general trend obtained from the molecular modeling was found to beconsistent with experimental measurements done on actual kerogen samples. Shale samples withdifferent kerogen content and with different maturity showed that shales with immature kerogen havesmall methane adsorption capacity compared to shales with mature kerogen. In this study, it is shownfor the first time that the key factor to control natural gas adsorption is the kerogen maturity not thekerogen content.
Keywords: kerogen; thermal maturity; adsorption capacity; source rocks
1. Introduction
Source rocks have become an important resource for satisfying worldwide energy demands. Theyare sedimentary formations produced through massive stimulation operations. A combination ofinnovative drilling and completion technologies has unlocked the tremendous potential of hydrocarbonresources that for a long time were believed to be inaccessible. However, there is still a gap betweenour ability to produce those resources and our actual understanding of their petrophysical properties.
Source rock lithologies include but are not limited to shale, mudstone, and coalbed methane.What characterizes them is their mineralogical composition, depositional environment, and, very
Molecules 2020, 25, 3764; doi:10.3390/molecules25163764 www.mdpi.com/journal/molecules

Molecules 2020, 25, 3764 2 of 14
importantly, the type and amount of kerogen. The word “kerogen” is a common descriptor for complexnetworks of aromatic and aliphatic hydrocarbon structures with the odd occurrence of heteroatomssubstituted into the hydrocarbon framework. Such hydrophobic macrostructures have the capacity tostore hydrocarbons both adsorbed on graphite-like carbon frameworks and free compartments; therelative importance of these two storage mediums varies depending on the structure and amount ofthe kerogen. In a storage capacity context, natural and hydraulic fractures are relatively large. Theyserve as means of transporting and storing compressed gas. In kerogen, the voids are made up oforganic nanopores with the capacity to store significant quantities of gas in the sorbed form becausetheir nanometer size is associated with a significant surface area [1–9]. As source rocks are exposedto various types of stimulation procedures, the natural gas is subject to continuous expansion in thelarger pores. Desorption in the smaller pores becomes augmented by the induced pressure gradient.During their transition from the rock matrix to the wellbore, natural gas molecules are subjected totransport and storage mechanisms that deviate from those applicable to classical reservoirs. Theseintricacies have implications for the methods used for reserve assessments. Conventional volumetricand material balance equations MBE have been found insufficient for organic-rich rocks, and mucheffort has been put into updating them to accommodate the multi-physical nature of natural gas innanoporous networks [2,10–18].
Ambrose et al. [2] derived a volumetric equation that can be used to estimate the initial gas in place.Their approach was based on quantifying sorbed gas with a Langmuir isotherm and free gas with atypical volumetric equation, with the porosity corrected for the volume that constitutes the adsorbedgas. King [10] derived a material balance equation with a form similar to the conventional equation,with some additional terms employed to describe the adsorption. Other researchers have presentedsimilar equations with various degrees of complexity [11–18]. In general, reserve estimation methodsfor source rocks were conceptualized on dividing reservoir units into inorganic and organic constituents.The former is modelled similar to the classical hydrocarbons traps while the latter is described withsome adsorption parameters that are approximated empirically. Reserve estimation methods havevarious forms based on their underlying assumptions such as the extent of adsorption behavior, thepresence of water derive, and the specific type of source rocks. Some equations that are listed in Table 1have wider range of applicability over the others, e.g., Clarkson and McGovern [12] have terms thatmodel free and adsorbed hydrocarbons, which makes it applicable for shale and coalbed methanereservoirs. On the other hand, Jensen and Smith [11] considered adsorption as the dominant mechanismthat limits its applicability to only coalbed methane reservoir. Therefore, understanding the adsorptionbehavior is of vital importance to properly select and use a given reserve estimation method.
Table 1. Volumetric and Material Balance Equations MBE Models for Nanopores of Source Rocks.
Model Equation
Ambrose et al. [2]Gst = G f + Ga
G f =32.0368
Bg
[φ(1−Sw)
ρb−
1.318×10⁻⁶M̂ρs
(GsL
pp+pL
)]Ga = GsL
pp+pL
King [10]Gp =
Vb2φizscTscpscT
(piz∗i−
pz∗
)z∗ = z(
[1−cφ(pi−p)](1−Sw)+zRTCMEφip
)Jensen & Smith [11]
ppL+p = −1
1.3597VLAhρcGP +
ppL+pi
Clarkson & McGovern [12] ppL+p +
32,037φ(1−Sw)VLBgρc
= −0.7355VLAhρc
GP +[
pipL+pi
+32,037φ(1−Swi)
VLBgiρc
]Kinniburgh [13] q =
Qmkbp(ps−p)
[1+(kb−1) p
ps
]Mahmoud [14] G = VB
[(ϕSgBgi
)+
Qmkbpi
(ps−pi)[1+(kb−1)
pips
] (1−ϕ) ρmaρgas
]
Molecules 2020, 25, 3764 3 of 14
Table 1. Cont.
Model Equation
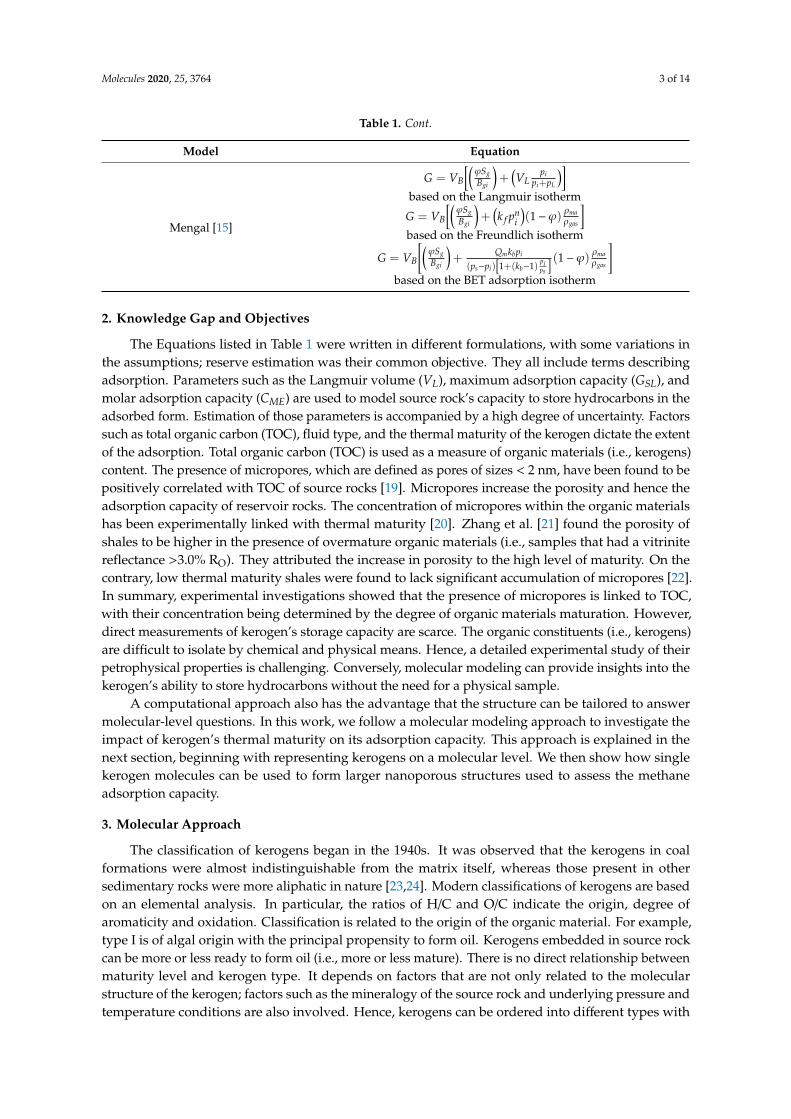
Mengal [15]
G = VB
[(ϕSgBgi
)+
(VL
pipi+pL
)]based on the Langmuir isotherm
G = VB
[(ϕSgBgi
)+
(k f pn
i
)(1−ϕ) ρma
ρgas
]based on the Freundlich isotherm
G = VB
[(ϕSgBgi
)+
Qmkbpi
(ps−pi)[1+(kb−1)
pips
] (1−ϕ) ρmaρgas
]based on the BET adsorption isotherm
2. Knowledge Gap and Objectives
The Equations listed in Table 1 were written in different formulations, with some variations inthe assumptions; reserve estimation was their common objective. They all include terms describingadsorption. Parameters such as the Langmuir volume (VL), maximum adsorption capacity (GSL), andmolar adsorption capacity (CME) are used to model source rock’s capacity to store hydrocarbons in theadsorbed form. Estimation of those parameters is accompanied by a high degree of uncertainty. Factorssuch as total organic carbon (TOC), fluid type, and the thermal maturity of the kerogen dictate the extentof the adsorption. Total organic carbon (TOC) is used as a measure of organic materials (i.e., kerogens)content. The presence of micropores, which are defined as pores of sizes < 2 nm, have been found to bepositively correlated with TOC of source rocks [19]. Micropores increase the porosity and hence theadsorption capacity of reservoir rocks. The concentration of micropores within the organic materialshas been experimentally linked with thermal maturity [20]. Zhang et al. [21] found the porosity ofshales to be higher in the presence of overmature organic materials (i.e., samples that had a vitrinitereflectance >3.0% RO). They attributed the increase in porosity to the high level of maturity. On thecontrary, low thermal maturity shales were found to lack significant accumulation of micropores [22].In summary, experimental investigations showed that the presence of micropores is linked to TOC,with their concentration being determined by the degree of organic materials maturation. However,direct measurements of kerogen’s storage capacity are scarce. The organic constituents (i.e., kerogens)are difficult to isolate by chemical and physical means. Hence, a detailed experimental study of theirpetrophysical properties is challenging. Conversely, molecular modeling can provide insights into thekerogen’s ability to store hydrocarbons without the need for a physical sample.
A computational approach also has the advantage that the structure can be tailored to answermolecular-level questions. In this work, we follow a molecular modeling approach to investigate theimpact of kerogen’s thermal maturity on its adsorption capacity. This approach is explained in thenext section, beginning with representing kerogens on a molecular level. We then show how singlekerogen molecules can be used to form larger nanoporous structures used to assess the methaneadsorption capacity.
3. Molecular Approach
The classification of kerogens began in the 1940s. It was observed that the kerogens in coalformations were almost indistinguishable from the matrix itself, whereas those present in othersedimentary rocks were more aliphatic in nature [23,24]. Modern classifications of kerogens are basedon an elemental analysis. In particular, the ratios of H/C and O/C indicate the origin, degree ofaromaticity and oxidation. Classification is related to the origin of the organic material. For example,type I is of algal origin with the principal propensity to form oil. Kerogens embedded in source rockcan be more or less ready to form oil (i.e., more or less mature). There is no direct relationship betweenmaturity level and kerogen type. It depends on factors that are not only related to the molecularstructure of the kerogen; factors such as the mineralogy of the source rock and underlying pressure andtemperature conditions are also involved. Hence, kerogens can be ordered into different types with

Molecules 2020, 25, 3764 4 of 14
some range of maturity level within each type [25,26]. In general, kerogens are classified as types I, II,III, and IV in ascending order of aromaticity [27,28]. Types III and VI are sometimes combined into oneclass [29]. Type I kerogen is primarily aliphatic (i.e., saturated), with a hydrogen-to-carbon ratio greaterthan 1.5 and oxygen-to-carbon ratio below 0.1 [30]. Type II, in contrast, contains a larger fraction ofcyclic aliphatic and aromatic units, which is reflected on the decreasing ratio of H/C [31]. Type III,which arises from a shallow marine environment, is vulnerable to further oxidation and hence has anincreased oxygen content, appearing either as a functional group or part of a cyclic moiety [28,30].
The modeling of kerogens’ molecular structures was first accomplished by Forsman [32] throughfunctional group characterization. He recognized two distinct groups of kerogens, the first comprisedof aliphatic chains and the second having condensed aromatic blocks fused by functional groups(either ether or alkoxy). Some hypothetical macromolecular models matching the elemental ratioswere approximated based on arbitrary building blocks [33–35]. However, the models failed to matchthe measured density of the kerogen, indicating a lack of representative 3D spatial configurations [36].Advancements in representing kerogen structures at different maturity levels have been achieved,beginning with the model presented by Vandenbroucke [37] for type I kerogen. That was followedby three structures of type II kerogen at diagenesis, the beginning of catagenesis, and end ofcatagenesis by Behar and Vandenbroucke [38]. With improvements in computer-assisted techniques,more representative porotypes of kerogen structures have been generated, such as the six differentmodels produced by Ungerer et al. [39]. In general, the aforementioned studies were conducted togenerate synthetic models that could reproduce some of the macroscopic properties of kerogen. Thesestudies should not be regarded as exclusive representations of naturally occurring kerogen.
The six prototypes of kerogen (see Figure 1) represent three types. Kerogen type I-A representsan immature macromolecule with mostly plain aliphatic bonding and minimal contributions fromcyclic aliphatic and aromatic units. Types II-A, II-B, II-C, and II-D are at a range of maturity levelswith increasing degrees of non-aliphatic bonding and polarity to act as anchor points. Type III-A isimmature kerogen with a substantial number of aromatic units and high oxygen content. These fourtype II molecule representations are excellent models for exploring the relationship between kerogenmaturity and adsorption capacity. Ungerer et al. [39] proposed that the structures are constructed insuch a way that each has a direct relationship to ease, by which they break carbon-carbon bonds andthereby decompose to form hydrocarbons. The macroscopic physical properties of these structureswere found to be in a reasonable agreement with their experimental analyses. The principal steeringtool is the driving force induced by insertion of heteroatoms to introduce polarity and the introductionof unsaturated units. Variations in the carbon, hydrogen, and oxygen ratios along the bonding typescontrol several chemical and physical properties. In this research, the methane adsorption capacity inparticular was investigated. The objective was to further explore the relationship between kerogen’sthermal maturity and its adsorption capacity. The four structures of type II kerogen were utilized inthe present research.
Kerogen II-A is immature organic matter with 252 carbon atoms, and its chemical composition isC252H294O24N6S3. It has two polycyclic saturated structures. The oxygen atoms are associated withether, carbonyl, hydroxyl, and carboxylic groups in ratios of 9:7:4:2 respectively. Three of the nitrogenatoms are present in thiophenic rings and one in a pyridinic ring. The sulfur is present in two thiophenicrings and one sulfide bridge. The fraction of carbon atoms in aromatic sub-structures is 41%.
Kerogen II-B has a composition of C234H263O14N5S2 with 45% of its carbon atoms being part of anaromatic system. More oxygen atoms form single bonds with carbon than double bonds compared totype II-A. Nitrogen and sulfur are associated with thiophenic and pyridinic rings.
Kerogen II-C is taken to represent a more mature unit. Its composition is C242H219O13N5S2. It isvery similar to type II-B, but with less alkyl chains to achieve higher maturity level. That is reflected bythe percentage of aromatic carbon, which is 58%. Similarly, kerogen II-D is the most mature kerogentype with a composition of C175H102O9N4S2, and 79% as the percentage of aromatic carbon.

Molecules 2020, 25, 3764 5 of 14
Molecules 2020, 25, x FOR PEER REVIEW 5 of 15
introduction of unsaturated units. Variations in the carbon, hydrogen, and oxygen ratios along the bonding types control several chemical and physical properties. In this research, the methane adsorption capacity in particular was investigated. The objective was to further explore the relationship between kerogen’s thermal maturity and its adsorption capacity. The four structures of type II kerogen were utilized in the present research.
Figure 1. Six prototype kerogen macromolecules [39].
Kerogen II-A is immature organic matter with 252 carbon atoms, and its chemical composition is C252H294O24N6S3. It has two polycyclic saturated structures. The oxygen atoms are associated with ether, carbonyl, hydroxyl, and carboxylic groups in ratios of 9:7:4:2 respectively. Three of the nitrogen atoms are present in thiophenic rings and one in a pyridinic ring. The sulfur is present in two thiophenic rings and one sulfide bridge. The fraction of carbon atoms in aromatic sub-structures is 41%.
Kerogen II-B has a composition of C234H263O14N5S2 with 45% of its carbon atoms being part of an aromatic system. More oxygen atoms form single bonds with carbon than double bonds compared to type II-A. Nitrogen and sulfur are associated with thiophenic and pyridinic rings.
Kerogen II-C is taken to represent a more mature unit. Its composition is C242H219O13N5S2. It is very similar to type II-B, but with less alkyl chains to achieve higher maturity level. That is reflected by the percentage of aromatic carbon, which is 58%. Similarly, kerogen II-D is the most mature kerogen type with a composition of C175H102O9N4S2, and 79% as the percentage of aromatic carbon.
Figure 1. Six prototype kerogen macromolecules [39].
4. Building the Kerogen Model Using MD Simulation
Kerogens are present in nature as nanoporous structures rather than separated macromolecules.The transformation of the macromolecules in Figure 1 to nanoporous constituents was achieved throughmolecular modeling. A polymer-compatible forcefield PCFF+ was used to define the atomic force typesand charges. Five to seven kerogen macromolecules of each type were placed in a low-density cell (i.e.,a density value of ~0.1 g/cm3 was used as constrained to create the initial cell). The initial configurationof the system at low density was followed to avoid any instability issues. Temperature and pressurevariables were assigned at 350 K and 20 MPa, respectively (i.e., typical reservoir conditions). Then,successive molecular dynamics stages of initialization using three-dimensional periodic boundary,9.5 cutoff distance and 2.0 skin (isochoric-isothermal NVT and isobaric-isothermal NPT) were performedon the initial cell using LAMMPS, following a systematic temperature reduction to the assigned level(i.e., NVT for 250 ps, two NPT stages for 200 ps followed by two other NPT stages for 400 ps). Thisannealing approach ensured system stability during convergence [40,41]. The protocol followed in thecreation of the nanostructures is given in Figure 2. Four different nanoporous structures correspondingto types II-A, II-B, II-C, and II-D were generated with densities ranging from 1.05 to 1.25 g/cm3.An example of the building process is given in Figure 3.

Molecules 2020, 25, 3764 6 of 14
Molecules 2020, 25, x FOR PEER REVIEW 6 of 15
4. Building the Kerogen Model Using MD Simulation
Kerogens are present in nature as nanoporous structures rather than separated macromolecules. The transformation of the macromolecules in Figure 1 to nanoporous constituents was achieved through molecular modeling. A polymer-compatible forcefield PCFF+ was used to define the atomic force types and charges. Five to seven kerogen macromolecules of each type were placed in a low-density cell (i.e., a density value of ~0.1 g/cm3 was used as constrained to create the initial cell). The initial configuration of the system at low density was followed to avoid any instability issues. Temperature and pressure variables were assigned at 350 K and 20 MPa, respectively (i.e., typical reservoir conditions). Then, successive molecular dynamics stages of initialization using three-dimensional periodic boundary, 9.5 cutoff distance and 2.0 skin (isochoric-isothermal NVT and isobaric-isothermal NPT) were performed on the initial cell using LAMMPS, following a systematic temperature reduction to the assigned level (i.e., NVT for 250 ps, two NPT stages for 200 ps followed by two other NPT stages for 400 ps). This annealing approach ensured system stability during convergence [40,41]. The protocol followed in the creation of the nanostructures is given in Figure 2. Four different nanoporous structures corresponding to types II-A, II-B, II-C, and II-D were generated with densities ranging from 1.05 to 1.25 g/cm3. An example of the building process is given in Figure 3.
Figure 2. Formation of nanoporous kerogen structures. Figure 2. Formation of nanoporous kerogen structures.
Molecules 2020, 25, x FOR PEER REVIEW 7 of 15
Figure 3. Creation of a nanoporous type II-A kerogen structure from a single macromolecule. The same steps were followed to create the nanoporous structures of the other kerogens.
5. Adsorption Calculations
The nanoporous structures developed were examined for their ability to host natural gas (i.e., methane). The temperature was set to at 350 K and a Gibbs ensemble Monte Carlo simulation of the methane-kerogen pair was initiated for pressure stages ranging from 12,000 psi to 300 psi (i.e., 82.68 MPa to 2.067 MPa); these were deemed representative of profiles encountered in the field. At each stage, methane fugacity was determined as a function of pressure and temperature by means of the Peng-Robinson equation of state. The Gibbs ensemble Monte Carlo calculations allowed for tracking of the number of gas molecules trapped in the kerogen bodies. Fugacity data were reported as given in Table 2. The adsorption profiles were then plotted as a function of pressure for kerogens II-A, II-B, II-C, and II-D (see Figure 4). The adsorption calculations were performed using Gibbs Monte Carlo module of MedeA Environment [42].
Table 2. Fugacity data used in the adsorption calculations.
P (MPa) Fugacity (MPa) 2.067 2.028 3.445 3.340 6.890 6.494 10.335 9.503 20.670 18.056 41.340 35.842 82.680 86.428
Generally, the adsorption capacity is controlled by a number of factors including the pressure, temperature, adsorbate and adsorbent (host). The latter, in our case, is the kerogen structure at some predefined maturity levels (i.e., types II-A, II-B, II-C, and II-D). Two properties of kerogen play a major role in determining the adsorption capacity. The first one is the ability of kerogen macromolecules to form a well-defined porous structure. The second factor would be the inter-chemical interactions between adsorbate (methane) and heteroatoms of kerogen structure. As detailed in section 3, the degree of aromaticity of types II-A, II-B, II-C, and II-D increases with increasing the maturity level. Aromatic rings are present in the form of sheet-like structures. Upon the condensation process described in section 4, these sheets have higher tendency to resist folding. Hence, they leave some spaces in between that could be occupied with the adsorbate molecules. The adsorption capacity of methane was found to correlate with the fraction of aromatic carbons. Kerogen II-D has the highest adsorption capacity followed by II-C. However, kerogen II-A exhibited slightly larger capacity than II-B despite its lower degree of aromaticity (i.e., Kerogen II-B has 45% while II-A has 41%). That could be explained by the higher percentage II-B has of non-bridging heteroatoms such as aliphatic sulfur, pyrrolic and pyridinic groups. Additionally, oxygen atoms present in kerogen II-B are more aliphatic compared to II-A, which allows them to move more freely, reducing the ability of kerogen to host more methane molecules.
Figure 3. Creation of a nanoporous type II-A kerogen structure from a single macromolecule. The samesteps were followed to create the nanoporous structures of the other kerogens.
5. Adsorption Calculations
The nanoporous structures developed were examined for their ability to host natural gas(i.e., methane). The temperature was set to at 350 K and a Gibbs ensemble Monte Carlo simulationof the methane-kerogen pair was initiated for pressure stages ranging from 12,000 psi to 300 psi(i.e., 82.68 MPa to 2.067 MPa); these were deemed representative of profiles encountered in the field.At each stage, methane fugacity was determined as a function of pressure and temperature by meansof the Peng-Robinson equation of state. The Gibbs ensemble Monte Carlo calculations allowed fortracking of the number of gas molecules trapped in the kerogen bodies. Fugacity data were reportedas given in Table 2. The adsorption profiles were then plotted as a function of pressure for kerogensII-A, II-B, II-C, and II-D (see Figure 4). The adsorption calculations were performed using Gibbs MonteCarlo module of MedeA Environment [42].

Molecules 2020, 25, 3764 7 of 14
Table 2. Fugacity data used in the adsorption calculations.
P (MPa) Fugacity (MPa)
2.067 2.0283.445 3.3406.890 6.49410.335 9.50320.670 18.05641.340 35.84282.680 86.428
Molecules 2020, 25, x FOR PEER REVIEW 8 of 15
Figure 4. Adsorption profiles of methane for different types of kerogens.
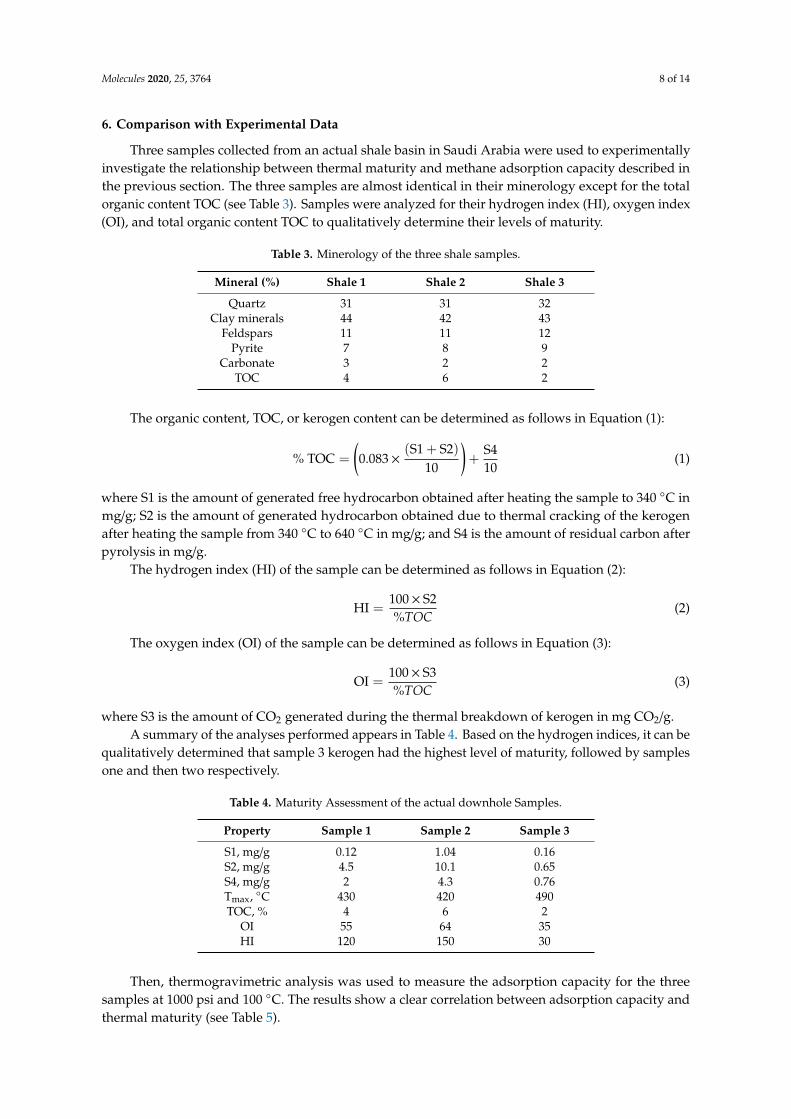
6. Comparison with Experimental Data
Three samples collected from an actual shale basin in Saudi Arabia were used to experimentally investigate the relationship between thermal maturity and methane adsorption capacity described in the previous section. The three samples are almost identical in their minerology except for the total organic content TOC (see Table 3). Samples were analyzed for their hydrogen index (HI), oxygen index (OI), and total organic content TOC to qualitatively determine their levels of maturity.
Table 3. Minerology of the three shale samples.
Mineral (%) Shale 1 Shale 2 Shale 3 Quartz 31 31 32
Clay minerals 44 42 43 Feldspars 11 11 12
Pyrite 7 8 9 Carbonate 3 2 2
TOC 4 6 2
The organic content, TOC, or kerogen content can be determined as follows in Equation (1): % TOC = 0.083 × S1 + S210 + 𝑆410 (1)
where S1 is the amount of generated free hydrocarbon obtained after heating the sample to 340 °C in mg/g; S2 is the amount of generated hydrocarbon obtained due to thermal cracking of the kerogen after heating the sample from 340 °C to 640 °C in mg/g; and S4 is the amount of residual carbon after pyrolysis in mg/g.
0
0.2
0.4
0.6
0.8
1
1.2
0 2000 4000 6000 8000 10000 12000
Ads C
H 4m
olec
ules
/ nm
3 of
ker
ogen
Pressure (psi)
II-A II-B II-C II-D
Figure 4. Adsorption profiles of methane for different types of kerogens.
Generally, the adsorption capacity is controlled by a number of factors including the pressure,temperature, adsorbate and adsorbent (host). The latter, in our case, is the kerogen structure at somepredefined maturity levels (i.e., types II-A, II-B, II-C, and II-D). Two properties of kerogen play a majorrole in determining the adsorption capacity. The first one is the ability of kerogen macromoleculesto form a well-defined porous structure. The second factor would be the inter-chemical interactionsbetween adsorbate (methane) and heteroatoms of kerogen structure. As detailed in Section 3, the degreeof aromaticity of types II-A, II-B, II-C, and II-D increases with increasing the maturity level. Aromaticrings are present in the form of sheet-like structures. Upon the condensation process described inSection 4, these sheets have higher tendency to resist folding. Hence, they leave some spaces in betweenthat could be occupied with the adsorbate molecules. The adsorption capacity of methane was foundto correlate with the fraction of aromatic carbons. Kerogen II-D has the highest adsorption capacityfollowed by II-C. However, kerogen II-A exhibited slightly larger capacity than II-B despite its lowerdegree of aromaticity (i.e., Kerogen II-B has 45% while II-A has 41%). That could be explained by thehigher percentage II-B has of non-bridging heteroatoms such as aliphatic sulfur, pyrrolic and pyridinicgroups. Additionally, oxygen atoms present in kerogen II-B are more aliphatic compared to II-A, whichallows them to move more freely, reducing the ability of kerogen to host more methane molecules.
Molecules 2020, 25, 3764 8 of 14
6. Comparison with Experimental Data
Three samples collected from an actual shale basin in Saudi Arabia were used to experimentallyinvestigate the relationship between thermal maturity and methane adsorption capacity described inthe previous section. The three samples are almost identical in their minerology except for the totalorganic content TOC (see Table 3). Samples were analyzed for their hydrogen index (HI), oxygen index(OI), and total organic content TOC to qualitatively determine their levels of maturity.
Table 3. Minerology of the three shale samples.
Mineral (%) Shale 1 Shale 2 Shale 3
Quartz 31 31 32Clay minerals 44 42 43
Feldspars 11 11 12Pyrite 7 8 9
Carbonate 3 2 2TOC 4 6 2
The organic content, TOC, or kerogen content can be determined as follows in Equation (1):
% TOC =
(0.083×
(S1 + S2)10
)+
S410
(1)
where S1 is the amount of generated free hydrocarbon obtained after heating the sample to 340 ◦C inmg/g; S2 is the amount of generated hydrocarbon obtained due to thermal cracking of the kerogenafter heating the sample from 340 ◦C to 640 ◦C in mg/g; and S4 is the amount of residual carbon afterpyrolysis in mg/g.
The hydrogen index (HI) of the sample can be determined as follows in Equation (2):
HI =100× S2%TOC
(2)
The oxygen index (OI) of the sample can be determined as follows in Equation (3):
OI =100× S3%TOC
(3)
where S3 is the amount of CO2 generated during the thermal breakdown of kerogen in mg CO2/g.A summary of the analyses performed appears in Table 4. Based on the hydrogen indices, it can be
qualitatively determined that sample 3 kerogen had the highest level of maturity, followed by samplesone and then two respectively.
Table 4. Maturity Assessment of the actual downhole Samples.
Property Sample 1 Sample 2 Sample 3
S1, mg/g 0.12 1.04 0.16S2, mg/g 4.5 10.1 0.65S4, mg/g 2 4.3 0.76Tmax, ◦C 430 420 490TOC, % 4 6 2
OI 55 64 35HI 120 150 30
Then, thermogravimetric analysis was used to measure the adsorption capacity for the threesamples at 1000 psi and 100 ◦C. The results show a clear correlation between adsorption capacity andthermal maturity (see Table 5).

Molecules 2020, 25, 3764 9 of 14
Table 5. Adsorption Capacity of the Actual Downhole Samples.
Kerogen Maturity Max Methane Adsorption at 1000 psi and 100 ◦C(mg CH4/g Shale Rock)
Mature Kerogen (Sample 3) 200Medium Maturity (Sample 1) 100Immature Kerogen (Sample 2) 40
The trend in adsorption capacity is consistent with what was observed through the molecularapproach. The adsorption capacity is proportional to the level of maturity.
Sample 3 has the highest adsorption capacity with a total organic carbon TOC content of 2%; this iscompared to sample 1 in which TOC content is 4%, but has medium maturity. The result matches thesimulation in which the mature kerogen adsorption capacity could be 2.5 times that of the immaturekerogen. Sample 3 has the lowest TOC content but the highest methane adsorption capacity, and sample2 has the highest TOC content but the lowest adsorption capacity because it is immature. This confirmedthe conclusion obtained from the molecular simulation study that maturity is the most important factor.
7. Numeric Scale for Maturity Level
Decomposition of the four kerogens resulted in different hydrocarbon mixtures. This was verifiedwhen they were plotted in a van Krevelen diagram. Such diagrams help to identify different typesat different levels of maturity; however, a numeric scale is needed upon which the different kerogenstructures can be placed. Kerogens have some degree of polarity determined by their origin (i.e., type)and maturity level.
Kerogen’s degree of polarity is strongly correlated with its thermal maturity. As kerogens undergothermal cooking, the composition of carbon-hydrogen-oxygen and type of bonding shift to increasethe level of polarity. The strategy for obtaining a numeric scale was based on the degree of polarity.In our molecular modeling approach, the four kerogen structures were brought into contact with anequimolar mixture of steam and helium (at 650 K and 20 MPa). While helium is inert, steam is polar.Gibbs Monte-Carlo calculations were performed, and the number of molecules hosted was obtainedfor each structure (see Figure 5). The fugacities were imposed for water and helium (since they weregas mixtures with relatively high pressures), which was the equivalent of using the chemical potential,as follows in Equation (4):
µi = µio + RT ln(
fifio
)(4)
where µi, µio, R, T, fi, and fio are the chemical potential for component I; ideal chemical potential forcomponent I; gas constant, temperature, and fugacity of component I; and ideal fugacity of componenti, respectively.
Molecules 2020, 25, x FOR PEER REVIEW 10 of 15
Kerogen’s degree of polarity is strongly correlated with its thermal maturity. As kerogens undergo thermal cooking, the composition of carbon-hydrogen-oxygen and type of bonding shift to increase the level of polarity. The strategy for obtaining a numeric scale was based on the degree of polarity. In our molecular modeling approach, the four kerogen structures were brought into contact with an equimolar mixture of steam and helium (at 650 K and 20 MPa). While helium is inert, steam is polar. Gibbs Monte-Carlo calculations were performed, and the number of molecules hosted was obtained for each structure (see Figure 5). The fugacities were imposed for water and helium (since they were gas mixtures with relatively high pressures), which was the equivalent of using the chemical potential, as follows in Equation (4): 𝜇 = 𝜇 + 𝑅𝑇𝑙𝑛 𝑓𝑓 (4)
where μi, μio, R, T, fi, and fio are the chemical potential for component I; ideal chemical potential for component I; gas constant, temperature, and fugacity of component I; and ideal fugacity of component i, respectively.
Figure 5. Sample realization of methane molecules adsorbed in II-D kerogen structure.
The kerogen structures clearly impacted the composition of the molecules hosted. Type II-D, which is the most polar type, had the highest mole fraction of steam, while the other types showed a systematic decrease in the steam mole fraction (see Table 6). This is explained by the increasing affinity of kerogens for steam over helium, the reason for which is most likely the formation of hydrogen bonds between the oxygen atoms of the molecular framework and water molecules of the steam. Types II-A and II-B are from the same type and at very comparable levels of maturity. They share almost the same hydrogen-to-carbon ratios. Both structures were capable of hosting almost the same fraction of helium, with a slightly larger value for type II-A, which is explained by the presence of heteroatoms and their type of bonding. The larger degree of type II-A polarity over type II-B is interestingly matching the adsorption behavior discussed in the previous section. The numeric scale for kerogen maturity level is used in the subsequent section (see Figure 6).
Figure 6. Protocol developed to create the numeric scale of thermal maturity.
Figure 5. Sample realization of methane molecules adsorbed in II-D kerogen structure.

Molecules 2020, 25, 3764 10 of 14
The kerogen structures clearly impacted the composition of the molecules hosted. Type II-D,which is the most polar type, had the highest mole fraction of steam, while the other types showed asystematic decrease in the steam mole fraction (see Table 6). This is explained by the increasing affinityof kerogens for steam over helium, the reason for which is most likely the formation of hydrogen bondsbetween the oxygen atoms of the molecular framework and water molecules of the steam. Types II-Aand II-B are from the same type and at very comparable levels of maturity. They share almost the samehydrogen-to-carbon ratios. Both structures were capable of hosting almost the same fraction of helium,with a slightly larger value for type II-A, which is explained by the presence of heteroatoms and theirtype of bonding. The larger degree of type II-A polarity over type II-B is interestingly matching theadsorption behavior discussed in the previous section. The numeric scale for kerogen maturity level isused in the subsequent section (see Figure 6).
Table 6. Numeric Scale of Thermal Maturity.
Kerogen Type H/C O/C Mole Fraction of He
II-A 1.1600 0.0950 0.7970II-B 1.1200 0.0590 0.8111II-C 0.9050 0.0537 0.7549II-D 0.5820 0.0514 0.6701
Molecules 2020, 25, x FOR PEER REVIEW 10 of 15
Kerogen’s degree of polarity is strongly correlated with its thermal maturity. As kerogens undergo thermal cooking, the composition of carbon-hydrogen-oxygen and type of bonding shift to increase the level of polarity. The strategy for obtaining a numeric scale was based on the degree of polarity. In our molecular modeling approach, the four kerogen structures were brought into contact with an equimolar mixture of steam and helium (at 650 K and 20 MPa). While helium is inert, steam is polar. Gibbs Monte-Carlo calculations were performed, and the number of molecules hosted was obtained for each structure (see Figure 5). The fugacities were imposed for water and helium (since they were gas mixtures with relatively high pressures), which was the equivalent of using the chemical potential, as follows in Equation (4): 𝜇 = 𝜇 + 𝑅𝑇𝑙𝑛 𝑓𝑓 (4)
where μi, μio, R, T, fi, and fio are the chemical potential for component I; ideal chemical potential for component I; gas constant, temperature, and fugacity of component I; and ideal fugacity of component i, respectively.
Figure 5. Sample realization of methane molecules adsorbed in II-D kerogen structure.
The kerogen structures clearly impacted the composition of the molecules hosted. Type II-D, which is the most polar type, had the highest mole fraction of steam, while the other types showed a systematic decrease in the steam mole fraction (see Table 6). This is explained by the increasing affinity of kerogens for steam over helium, the reason for which is most likely the formation of hydrogen bonds between the oxygen atoms of the molecular framework and water molecules of the steam. Types II-A and II-B are from the same type and at very comparable levels of maturity. They share almost the same hydrogen-to-carbon ratios. Both structures were capable of hosting almost the same fraction of helium, with a slightly larger value for type II-A, which is explained by the presence of heteroatoms and their type of bonding. The larger degree of type II-A polarity over type II-B is interestingly matching the adsorption behavior discussed in the previous section. The numeric scale for kerogen maturity level is used in the subsequent section (see Figure 6).
Figure 6. Protocol developed to create the numeric scale of thermal maturity. Figure 6. Protocol developed to create the numeric scale of thermal maturity.
8. Modeling of Storage Capacity
As the kerogens decomposed, smaller chains of aliphatic hydrocarbons were generated, resultingin the formation of voids (i.e., pores on the nano and angstrom scales). In this study, we observeda correlation between methane adsorption capacity and maturity level (see Figure 4). For instance,kerogen type II-D was found to host around two and half times as much methane as type II-A.The storage capacity appeared to follow a systematic trend with the level of aromaticity, the presenceof heteroatoms, and their bonding type. The aforementioned factors give rise to the degree of polarity.The numeric scale of maturity level, which is based on the polarity (described in Section 6), is used toassess the adsorption capacity of kerogens as a function of thermal maturity. Each kerogen type had aunique value along the scale. We plotted those values against the maximum adsorption capacity, asshown in Figure 7.
The empirical mathematical relationship can be given as (Equation (5)):
CCH4 = −4.27 YHe (He−H2O) + 4.04 (5)
where CCH4 is the maximum adsorption capacity of the methane. The unit of molecules of methaneis per nm3 of kerogens. The YHe(He–H2O) variable is the numeric scale of maturity level introduced inSection 6.

Molecules 2020, 25, 3764 11 of 14
Molecules 2020, 25, x FOR PEER REVIEW 11 of 15
Table 6. Numeric Scale of Thermal Maturity.
Kerogen Type H/C O/C Mole Fraction of He II-A 1.1600 0.0950 0.7970 II-B 1.1200 0.0590 0.8111 II-C 0.9050 0.0537 0.7549 II-D 0.5820 0.0514 0.6701
8. Modeling of Storage Capacity
As the kerogens decomposed, smaller chains of aliphatic hydrocarbons were generated, resulting in the formation of voids (i.e., pores on the nano and angstrom scales). In this study, we observed a correlation between methane adsorption capacity and maturity level (see Figure 4). For instance, kerogen type II-D was found to host around two and half times as much methane as type II-A. The storage capacity appeared to follow a systematic trend with the level of aromaticity, the presence of heteroatoms, and their bonding type. The aforementioned factors give rise to the degree of polarity. The numeric scale of maturity level, which is based on the polarity (described in section 6), is used to assess the adsorption capacity of kerogens as a function of thermal maturity. Each kerogen type had a unique value along the scale. We plotted those values against the maximum adsorption capacity, as shown in Figure 7.
Figure 7. Maximum adsorption capacity and numeric scale of maturity. A linear correlation appears between the He capacity (taken to reflect maturity) and CH4 storage capacity.
The empirical mathematical relationship can be given as (Equation (5)): 𝐶 = 4.27 𝑌 + 4.04 (5)
where CCH4 is the maximum adsorption capacity of the methane. The unit of molecules of methane is per nm3 of kerogens. The YHe (He – H2O) variable is the numeric scale of maturity level introduced in Section 6.
Figure 7. Maximum adsorption capacity and numeric scale of maturity. A linear correlation appearsbetween the He capacity (taken to reflect maturity) and CH4 storage capacity.
9. Conclusions
In this article, a molecular modeling study of the relationship between the thermal maturityand storage capacity of kerogens was presented. Four prototypes of kerogen molecules covering awide range of maturity levels were used to build nanoporous structures mimicking those naturallyoccurring in source rocks. A numeric scale based on the concept of polarity assessment was createdand Gibbs Monte Carlo adsorption calculations performed, considering typical pressure profilesencountered during reservoir depletion. It was found that the adsorption capacity correlated withthe degree of maturity. A mathematical relationship between the maximum adsorption capacity andthermal maturity was obtained that could help with reserve estimations. The correlation observedbetween the thermal maturity and adsorption capacity of kerogens was found to be consistent withexperimental adsorption calculations performed on shale samples collected from the actual shale gasbasin. Experimental and simulation results showed that methane gas adsorption capacity is stronglycorrelated to the kerogen maturity not the kerogen content.
Author Contributions: Conceptualization, S.A. and T.S. methodology, S.A. and M.M.; software, S.A.; validation,S.A., M.M.; formal analysis S.A.; investigation, S.A.; resources, S.A.; writing—original draft preparation, S.A. andT.S.; writing—review and editing, S.A. All authors have read and agreed to the published version of the manuscript.
Funding: This research was funded by the College of Petroleum Engineering and Geoscience at King FahdUniversity of Petroleum and Minerals.
Conflicts of Interest: The authors declare no conflict of interest.
Nomenclature
Gf Free gas (SCF/ton)Ga Adsorbed gas (SCF/ton)GSL Maximum adsorbed gas (SCF/ton)Gm Maximum adsorbed gas (SCF/ton)Gp Produced gas (SCF)Sw Water saturationSg Gas saturation

Molecules 2020, 25, 3764 12 of 14
µ Gas viscosity (cP)M Molecular weight (g/mol)R Gas constant (8.314 J/mol·K)T Temperature (R or K)P Pressure (psi or Pa)PL Langmuir pressure (psi or Pa)PS Saturation pressure (psi or Pa)kb BET adsorption constantkf Freundlich adsorption constantρc Density of coalbed methane (g/cm3)Z* Modified compressibility factorCME Molar adsorption capacity (lbm.mol/ft3)Cg Gas compressibility coefficient (1/psi)VSL Maximum sorption capacity (ft3 or cm3)ρs Sorbed phase density (g/cm3)ρb Bulk density (g/cm3)ρma Matrix density (g/cm3)ρgas Gas density (g/cm3)Bg Formation volume factor (ft3/SCF)Vb Bulk volume (ft3)
References
1. Kang, S.M.; Fathi, E.; Ambrose, R.J.; Akkutlu, I.Y.; Sigal, R.F. Carbon Dioxide Storage Capacity of Organic-RichShales. SPE J. 2011, 16, 842–855. [CrossRef]
2. Ambrose, R.J.; Hartman, R.C.; Campos, M.D.; Akkutlu, I.Y.; Sondergeld, C.H. Shale Gas-in-Place CalculationsPart I: New Pore-Scale Considerations. SPE J. 2012, 17, 219–229. [CrossRef]
3. Santos, J.M.; Akkutlu, I.Y. Laboratory Measurement of Sorption Isotherm under Confining Stress withPore-Volume Effects. SPE J. 2013, 18, 924–931. [CrossRef]
4. Hou, Y.; Wang, J.; Harris, N.B.; Pedersen, P.; He, S.; Cheng, C.; Li, Y. Preliminary study on the porecharacterization of lacustrine shale reservoirs using low pressure nitrogen adsorption and field emissionscanning electron microscopy methods: A case study of the Upper Jurassic Emuerhe Formation, Mohe basin,northeastern China. Can. J. Earth Sci. 2015, 52, 294–306. [CrossRef]
5. Zhou, S.; Yan, G.; Xue, H.; Guo, W.; Li, X. 2D and 3D nanopore characterization of gas shale in Longmaxiformation based on FIB-SEM. Mar. Pet. Geol. 2016, 73, 174–180. [CrossRef]
6. Klaver, J.; Desbois, G.; Littke, R.; Urai, J.L. BIB-SEM pore characterization of mature and post maturePosidonia Shale samples from the Hils area, Germany. Int. J. Coal Geol. 2016, 158, 78–89. [CrossRef]
7. Chen, S.; Han, Y.; Fu, C.; Zhang, H.; Zhu, Y.; Zuo, Z.; Shangbin, C.; Yufu, H.; Changqin, F.; Han, Z.; et al.Micro and nano-size pores of clay minerals in shale reservoirs: Implication for the accumulation of shale gas.Sediment. Geol. 2016, 342, 180–190. [CrossRef]
8. Jiao, K.; Yao, S.; Liu, C.; Gao, Y.; Wu, H.; Li, M.; Tang, Z. The characterization and quantitative analysis ofnanopores in unconventional gas reservoirs utilizing FESEM–FIB and image processing: An example fromthe lower Silurian Longmaxi Shale, upper Yangtze region, China. Int. J. Coal Geol. 2014, 128, 1–11. [CrossRef]
9. Yang, C.; Zhang, J.; Han, S.; Xue, B.; Zhao, Q. Classification and the developmental regularity oforganic-associated pores (OAP) through a comparative study of marine, transitional, and terrestrial shales inChina. J. Nat. Gas Sci. Eng. 2016, 36, 358–368. [CrossRef]
10. King, G. Material-Balance Techniques for Coal-Seam and Devonian Shale Gas Reservoirs with Limited WaterInflux. SPE Reserv. Eng. 1993, 8, 67–72. [CrossRef]
11. Jensen, D.; Smith, L.K. A Practical Approach to Coalbed Methane Reserve Prediction using a ModifiedMaterial Balance Technique. In Proceedings of the International Coalbed Methane Symposium, Tuscaloosa,AL, USA, 12–17 May 1997.
12. Clarkson, C.R.; Bustin, M. Coalbed Methane: Current Field-Based Evaluation Methods. SPE Reserv. Eval. Eng.2011, 14, 60–75. [CrossRef]
13. Kinniburgh, D.G. General purpose adsorption isotherms. Environ. Sci. Technol. 1986, 20, 895–904. [CrossRef]

Molecules 2020, 25, 3764 13 of 14
14. Mahmoud, M. Effect of Gas Adsorption on the Estimation of Gas in Place (GIP) in Conventional andUnconventional Reservoirs. Arab. J. Sci. Eng. 2019, 44, 6205–6214. [CrossRef]
15. Mengal, S.A. Accounting for adsorbed gas and its effect on production behavior of shale gas reservoirs.Master’s Thesis, Texas A&M University, College Station, TX, USA, 2010.
16. Seidle, J.P. A Modified p/Z Method for Coal Wells. In Proceedings of the SPE Rocky Mountain RegionalMeeting, Gillette, Wyoming, 15–18 May 1999.
17. Zhang, M.; Zhang, Y.; Yang, L.; Mei, H.; Shen, P.; Ge, J. A New Method to Calculate the Recoverable Reservesand Recovery Ratio of Shale Gas Reservoir. Open J. Yangtze Oil Gas 2017, 2, 201–213. [CrossRef]
18. Hu, S.; Hu, X.; He, L.; Chen, W. A New Material Balance Equation for Dual-Porosity Media Shale GasReservoir. Energy Procedia 2019, 158, 5994–6002. [CrossRef]
19. Liu, K.; Ostadhassan, M.; Zhou, J.; Gentzis, T.; Rezaee, R. Nanoscale pore structure characterization of theBakken shale in the USA. Fuel 2017, 209, 567–578. [CrossRef]
20. Tang, X.; Jiang, Z.; Jiang, S.; Wang, P.; Xiang, C. Effect of Organic Matter and Maturity on Pore Size Distributionand Gas Storage Capacity in High-Mature to Post-Mature Shales. Energy Fuels 2016, 30, 8985–8996. [CrossRef]
21. Zhang, Y.; He, Z.; Jiang, S.; Lu, S.; Xiao, D.; Chen, G.; Zhao, J. Factors Affecting Shale Gas Accumulationin Overmature Shales Case Study from Lower Cambrian Shale in Western Sichuan Basin, South China.Energy Fuels 2018, 32, 3003–3012. [CrossRef]
22. Guo, X.; Huang, Z.; Ding, X.; Chen, J.; Chen, X.; Wang, R. Characterization of Continental Coal-Bearing Shaleand Shale Gas Potential in Taibei Sag of the Turpan-Hami Basin, NW China. Energy Fuels 2018, 32, 9055–9069.[CrossRef]
23. Down, A.L.; Himus, G.W. A Preliminary Study of the Chemical Constitu tion of Kerogen. J. Inst. Pet. 1941,27, 426–445.
24. Forsman, J.; Hunt, J. Insoluble organic matter (kerogen) in sedimentary rocks. Geochim. Cosmochim. Acta1958, 15, 170–182. [CrossRef]
25. Van Krevelen, D.W. Coal: Typology, Chemistry, Physics, Constitution, 1st ed.; Elsevier Scientific Pub. Co.:Amsterdam, The Netherlands, 1961.
26. Durand, B.; Espitalie, J. Evolution de la matie’re organique au cours de l’enfouissement des se’diments. C. R.L’Acad. Sci. 1973, 276, 2253–2256.
27. Tissot, B.D.B. Influence of Nature and Diagenesis of Organic Matter in Formation of Petroleum. AAPG Bull.1974, 58, 499–506. [CrossRef]
28. Durand, B.; Nicaise, G.; Roucache´, J.; Vandenbroucke, M.; Hagemann, H.W. Geochemical study of a seriesof coals. In Advances in Organic Geochemistry; ENADIMSA: Madrid, Spain, 1975; pp. 601–631.
29. Tissot, B.; DeRoo, G.; Hood, A. Geochemical study of the Uinta Basin: Formation of petroleum from theGreen River formation. Geochim. Cosmochim. Acta 1978, 42, 1469–1485. [CrossRef]
30. Tissot, B.P.; Vandenbroucke, M. Geochemistry and Pyrolysis of Oil Shales. In Proceedings of the PedagogicRoles of Animations and Simulations in Chemistry Courses; American Chemical Society (ACS): Washington, DC,USA, 1983; Volume 230, pp. 1–11.
31. Albrecht, P.; Vandenbroucke, M.; Mandengué, M. Geochemical studies on the organic matter from the DoualaBasin (Cameroon)—I. Evolution of the extractable organic matter and the formation of petroleum. Geochim.Cosmochim. Acta 1976, 40, 791–799. [CrossRef]
32. Forsman, J.P. Geochemistry of kerogen. In Organic Geochemistry, Earth Series Monograph; Breger, I.A., Ed.;Pergamon Press: Oxford, UK, 1963; Volume 16, pp. 148–182.
33. Burlingame, A.L.; Haug, P.A.; Schnoes, H.K.; Simoneit, B.R. Fatty acids derived from the Green RiverFormation oil shale by extractions and oxidations—A review. In Advances in Organic Geochemistry 1968,Proceedings of the 4th International Meeting on Organic Geochemistry, Amsterdam, Netherlands, 16–18 September1968; Schenck, P.A., Havenaar, I., Eds.; Pergamon Press: Oxford, UK, 1969; pp. 85–129.
34. Djuricic, M.; Murphy, R.; Vitorovic, D.; Biemann, K. Organic acids obtained by alkaline permanganateoxidation of kerogen from the Green River (Colorado) shale. Geochim. Cosmochim. Acta 1971, 35, 1201–1207.[CrossRef]
35. Yen, T. Chapter 7 Structural Aspects of Organic Components in Oil Shales. In Pressure Transient Formation andWell Testing: Convolution, Deconvolution and Nonlinear Estimation; Elsevier BV: Amsterdam, The Netherlands,1976; Volume 5, pp. 129–148.

Molecules 2020, 25, 3764 14 of 14
36. Vandenbroucke, M.; Largeau, C. Kerogen origin, evolution and structure. Org. Geochem. 2007, 38, 719–833.[CrossRef]
37. Vandenbroucke, M. Kerogen, Insoluble Organic Matter from Sedimentary Rocks; Editions Technip: Bayeux,France, 1980; Chapter 13; pp. 415–443.
38. Behar, F.; Vandenbroucke, M. Chemical modelling of kerogens. Org. Geochem. 1987, 11, 15–24. [CrossRef]39. Ungerer, P.; Collell, J.; Yiannourakou, M. Molecular Modeling of the Volumetric and Thermodynamic
Properties of Kerogen: Influence of Organic Type and Maturity. Energy Fuels 2014, 29, 91–105. [CrossRef]40. AlAfnan, S.; Sultan, A.S.; Aljaberi, J. Molecular Fractionation in the Organic Materials of Source Rocks.
ACS Omega 2020. [CrossRef]41. Al-Afnan, S.; Al Jawad, M.; Glatz, G.; Sultan, A.S.; Windiks, R. Sustainable Production from Shale Gas
Resources through Heat-Assisted Depletion. Sustainability 2020, 12, 2145. [CrossRef]42. Yiannourakou, M.; Ungerer, P.; Leblanc, B.; Ferrando, N.; Teuler, J.-M. Overview of MedeA®-GIBBS
capabilities for thermodynamic property calculation and VLE behaviour description of pure compoundsand mixtures: Application to polar compounds generated from ligno-cellulosic biomass. Mol. Simul. 2013,39, 1165–1211. [CrossRef]
Sample Availability: Samples of the molecular simulation runsare available from the authors.
© 2020 by the authors. Licensee MDPI, Basel, Switzerland. This article is an open accessarticle distributed under the terms and conditions of the Creative Commons Attribution(CC BY) license (http://creativecommons.org/licenses/by/4.0/).