adoption of reverse logistics in information and
TRANSCRIPT

i
ADOPTION OF REVERSE LOGISTICS IN INFORMATION AND COMMUNICATIONS TECHNOLOGY FIRMS IN KENYA
BY
ODHIAMBO JECTON KIBERENGE
A RESEARCH PROJECT REPORT SUBMITTED IN PARTIAL FULFILMENT OF THE REQUIREMENTS FOR THE AWARD OF THE
DEGREE OF MASTER OF BUSINESS ADMINISTRATION, SCHOOL OF BUSINESS, UNIVERSITY OF NAIROBI
OCTOBER, 2014

i
DECLARATION
This project is my original work and has not been submitted to any other university for
examination.
Signed………………………………….. Date……………………………………
ODHIAMBO JECTON KIBERENGE
D61/73321/2012
This management research project has been submitted for examination with my approval as the
University Supervisor.
Signed………………………………….. Date……………………………………
DR. JAMES NJIHIA
Department of Management Science,
University of Nairobi
Signed………………………………….. Date……………………………………
MR. JOB MWANYOTA
Department of Management Science, University of Nairobi
ii
ACKNOWLEDGEMENTS
Research project work follows a path that is indeed winding and in the course of its execution
you inevitably cross many people’s ways. Special mention will however be made only to a few
key persons whose contributions were critical to the transformation.
First and foremost I owe much of the success in this project first to my supervisors Dr. James
Njihia and Job Mwanyota who through their unceasing positive and objective critique, guidance
and encouragement contributed hugely to realization of the project.
I cannot forget the contribution from my class mates, colleagues’ friends and many others who
helped me in one way or the other, especially during class work, data mining, data collection
synthesis and analysis.
Special thanks are directed at my family who tolerated me during the difficult period of MBA
class work followed by the project work and its report writing.
Special considerations also go to the many company executives who left their busy schedules to
give me audience during data collection.
May all whose paths I crossed - be blessed by our Creator one day.
Thank you all

iii
DEDICATION
To my loving wife Phoebe.
Daughters Judy and Brenda.
Sons Denis and Nicolas.
Grandson Christian.

iv
ABREVIATIONS
CAK Communications Authority of Kenya
CRM Customer Relationship Management
EoL End of Life
EoU End of Use
EPR Extended Producer Responsibility
GDP Gross Domestic Product
GOK Government of Kenya
GSCM Green Supply Chain Management
IAER International Association of Electronic Recyclers
ICT Information and Communication Technology
ISPs Internet Service Providers
IT Information Technology
RL Reverse Logistics
RLEC Reverse Logistics Executive Council
3PL Third Party Logistics Service Provider
RBV Resource Based View
SC Supply Chain
SPSS Statistical Product for Social Sciences
TCE Transaction Cost Economics
KMO Kaiser-Meyer-Olkin

v
ABSTRACT Moving goods from their point of origin towards their final destination represents forward logistics while reverse logistics is the movement of products or materials in the opposite direction. The purpose of reverse logistics is to recapture the product residual value at the point of dismissal and ensure safe disposal of toxic and hazardous contents at their end of life. When discarded into the landfill, these hazardous contents are also damaging to the ecosystem. The purpose of this study was therefore to establish the extent to which reverse logistics has been adopted in the ICT sector in Kenya. The study also aimed at establishing the barriers or driving forces that determine adoption of reverse logistics in this sector in Kenya. A census survey of 40 ICT firms registered with the Communications Authority of Kenya (CAK) was designed to provide insight on extent of adoption of and barriers to reverse logistics by the ICT firms. Primary data was collected using structured questionnaires designed by the researcher. Descriptive statistics including frequency, percentages, mean and standard deviation as well as principle component analysis were used to analyse data obtained to put forward recommendations. Results showed that operators in the ICT sector have adopted reverse logistics to appreciable levels.It was therefore recommended that stakeholders put in place measures to spur adoption and implementation of reverse logistics. Such efforts could for instance begin with massive awareness creation on the relevance of reverse logistics. The Government through National Environmental Management Authority (NEMA) should enhance support for reverse logistics. This could be done through provision of attractive incentives schemes like favourable taxation systems. Another approach is for government to set up a collaborative entity or strategic alliance to run reverse logistics for a number of firms in the same industry. This collaborative approach is more effective and efficient as it reduces the investment of individual firms and enables economies of scale through centralization. Key words: Reverse Logistics, ICT, Communication Authority of Kenya.
vi
TABLE OF CONTENTS DECLARATION............................................................................................................................ i
ACKNOWLEDGEMENTS ......................................................................................................... ii
DEDICATION.............................................................................................................................. iii
ABREVIATIONS ......................................................................................................................... iv
ABSTRACT ................................................................................................................................... v
TABLE OF CONTENTS ............................................................................................................ vi
LIST OF TABLES ..................................................................................................................... viii
LIST OF FIGURES ..................................................................................................................... ix
CHAPTER ONE: INTRODUCTION ......................................................................................... 1
1.1 Background of the study ....................................................................................................... 1
1.1.1 Reverse Logistics ............................................................................................................ 2
1.1.2 ICT Sector in Kenya ....................................................................................................... 3
1.2 Research Problem .................................................................................................................. 4
1.3 Research Objectives .............................................................................................................. 6
1.4 Value of the Study ................................................................................................................. 6
CHAPTER TWO: LITERATURE REVIEW ............................................................................ 8
2.1 Introduction ........................................................................................................................... 8
2.2 Theoretical Foundation of Reverse Logistics........................................................................ 8
2.2.1 Resource Based View Theory ........................................................................................ 8
2.2.2 Transactional Cost Economics Theory ........................................................................... 9
2.2.3 Institutional Theory ...................................................................................................... 10
2.3 Reverse Logistics in Organizations ..................................................................................... 12
2.4 Importance of Reverse Logistics ....................................................................................... 13
2.5 Drivers and Barriers to Reverse Logistics........................................................................... 16

vii
2.6 Summary ............................................................................................................................. 18
CHAPTER THREE: RESEARCH METHODOLOGY ............... .......................................... 21
3.1 Introduction ......................................................................................................................... 21
3.2 Research Design .................................................................................................................. 21
3.3 Population of the Study ....................................................................................................... 21
3.4 Data Collection .................................................................................................................... 21
3.5 Data Analysis ...................................................................................................................... 22
CHAPTER FOUR: RESULTS, DATA ANALYSIS AND DISCUSSION ............................ 23
4.1 Introduction ......................................................................................................................... 23
4.2 Demographic Characteristics of the Respondents ............................................................... 23
4.3 Extent of Adoption of Reverse Logistics System ............................................................... 25
4.4 Barriers and Drivers to Reverse Logistics Adoption .......................................................... 27
CHAPTER FIVE: SUMMARY, CONCLUSION AND RECOMMENDATIO N ................ 31
5.1 Introduction ......................................................................................................................... 31
5.2 Summary of Findings .......................................................................................................... 31
5.3 Conclusion of the study ....................................................................................................... 33
5.4 Recommendations ............................................................................................................... 34
5.5 Suggestions for Further Research ....................................................................................... 36
RERERENCES ........................................................................................................................... 37
APPENDICES ............................................................................................................................. 44
APPENDIX 1 : Questionnaire................................................................................................... 44
APPENDIX II: List of ICT firms . ............................................................................................ 47
APPENDIX III: Letter of Introduction. .................................................................................... 48

viii
LIST OF TABLES Table Page
Table 4.1: Respondents Demographic Characteristics-------------------------------------------- 24
Table 4.2: Extent of Adoption of Drivers of Reverse Logistics Systems ---------------------- 26
Table 4.3: KMO and Bartlett's Test ----------------------------------------------------------------- 27
Table 4.4: Component Matrix ------------------------------------------------------------------------ 29

ix
LIST OF FIGURES
Figure Page
Figure 4.1 Scree Plot----------------------------------------------------------------------------------- 28

1
CHAPTER ONE: INTRODUCTION
1.1 Background of the study
Moving goods from their point of origin towards their final destination represents forward
logistics while reverse logistics is the movement of products or materials in the opposite
direction. Producers manufacture goods then distribute them towards targeted user segments.
The users take these goods and consume them until the time they are deemed no longer useful.
This is End of Life state (EoL) or End of Use (EoU) state. At this stage most products still have
value that can be reclaimed to add competitive advantage. For example the market for reverse
logistics in the United States (US) was approximately $58 billion in 2004, comprising 0.5
percent of the US GDP (RLEC, 2007), and the reverse flow is increasing (de Brito et al., 2004).
Resident within most electronic products are toxic and hazardous components that require
careful handling.
Main activities of RL include product returns, remanufacturing, source reduction, material
substitution, and waste management (Rogers & Tibben-Lembke , 1999, 2001). The purpose of
reverse logistics is to recapture the product residual value at the point of dismissal and ensure
safe disposal of toxic and hazardous contents at their EoL. The need to process the rapidly
growing amount of EoL electronic products or e-waste has resulted in focusing increasing
attention on reverse logistics. Improper handling of these e-wastes may trigger damage to human
health from respiratory problems to cancer. When discarded into the landfill, these hazardous
contents are also damaging to the ecosystem (Lee et al., 2000).
2
Balancing economic and environmental performance has become increasingly important for
organizations facing competitive, regulatory, and community pressures (Shultz et al., 1999).
With increased pressures for environmental sustainability, it is expected that enterprises will
need to implement strategies to reduce the environmental impacts of their products and services
(Lewis et al., 2001; Sarkis, 1995). Reverse Logistics, by “closing the loop” Zhu et al., (2004)
improves firm’s environmental sustainability.
The Information and Communications Technology (ICT) sector of Kenya currently handles
millions of electrical and electronic equipment in the form of mobile phones, computers and
television sets in the forward supply chain. The reverse chain handling and eventual disposal of
the residual toxic and hazardous components of these electrical and electronic products is the
object of this study.
1.1.1 Reverse Logistics
A reverse logistics system is a supply chain that has been redesigned to manage the back flow of
products or parts destined for remanufacturing, recycling or disposal in order to effectively use
resources (Dowlatshahi, 2000). Reverses logistics systems are complicated in terms of the scope
involved (Fulconis et al., 2007). In order to gain benefits from reverse logistics systems, there is
a need to investigate the planning, implementation, and controlling the systems properly (Tan et
al., 2003).
Reverse logistics is a relatively new research direction in the area of supply chain management
(Dowlatshahi, 2005). However, reverse logistics are generally poorly managed due to the fact

3
that more than one company may get involved in the reverse logistics process, and thus a holistic
approach is required (Chapman et al., 2005). In this connection, redesign of the existing forward
and reverse logistics processes post a challenge to many companies.
Reverse logistics covers a wide range of industries. For instance, the automobile companies are
quite busy dealing with the recovery of EoL and EoU –use auto parts and many vehicle recalls.
Millions of ICT products that contain various hazardous materials (e.g. lead and mercury) are
scrapped in US every year, and industry leaders (for example, Apple, Dell, and Sony) have
voluntary take-back programs (IAER, 2006).
1.1.2 ICT Sector in Kenya
The information and communication technology (ICT) sector in Kenya is vibrant. Kenya has
witnessed significant growth in the ICT sector as demonstrated by rapid rise in the number of
telephone lines, Internet Service Providers (ISPs), number of internet users and, broadcasting
stations. Available statistics, (CAK,2013) indicates that there were; 31.4million mobile telephone
subscribers as of October 2013 representing 77% penetration. Safaricom is the dominant player
with 73.2% share of the subscribers. Airtel, Telkom Kenya and Essar Yu Mobile had a market
share of 14.9%, 6.9%, and 4.6% respectively. There were 21.2 million internet users in the same
period with population having access to internet standing at 52.3%.
The Kenya Government recognizes the role of ICTs in the social and economic development of
the nation and has promulgated a national ICT Policy based on the Economic Recovery Strategy
for Wealth and Employment Creation (2003-2007) (GOK, 2002).The Communications Authority

4
of Kenya (CAK) is responsible for ensuring fair play in the ICT sector as defined by the Kenya
Communications Act No-2 of 1998. It is the independent regulatory authority for the
communications industry in Kenya to license and regulate telecommunications, radio-
communication and postal/courier services in Kenya.
The ICT sector is to undergo rapid change occasioned by the envisaged provision of laptop to
each and every primary school going pupil. With the current enrolment in primary school
running into millions the effect of this policy is to accelerate rate of entry into the sector of
computers. The disposal of this equipment within the economy will be an additional pressure for
adoption of reverse logistics programs to ensure environmental sustainability.
1.2 Research Problem
ICT equipments have a relatively short product life cycle and combined with rapid technological
changes and rapidly changing customer tastes and preferences the rate of ICT equipment
obsolescence is very high. The overall effect of these is a rapid accumulation of equipment with
toxic and hazardous substances in the environment. To what extent have the primary suppliers
and retailers of ICT equipment in Kenya implemented reverse logistics? How aware is the
Kenyan public on the environmental issues that come with handling of these types of goods?
Chan and Chan, (2008) study on the mobile phone industry in Hong Kong established that proper
implementation of reverse logistics systems can result in better customer loyalty and reduction in
operational costs due to reuse or remanufacturing of some parts. Although the findings of the
paper were limited to Hong Kong mobile phone industry, it is expected that similar situation
5
could be identified in other industries and in other countries. Chan and Chan recommend further
research to verifying whether the same findings exist in other industries or other countries.
Ismael et al.,(2010) exploratory study of reverse logistics initiatives in several Turkish
electronics and furniture firms shows that the reverse logistics initiatives were still in a very early
stage. Companies’ involvement in product returns is mostly due to the legislative liabilities, and
system inadequacies are emphasized as the most important reason for not being able to
implement an efficient reverse logistics.
A survey of reverse logistics literature locally shows a dearth of studies on reverse logistics
within the Kenyan business environment. A case study on Kenya Medical Supplies Association
by Waithaka, (2012) found that reverse logistics pratices adoption was mainly as a result of need
to comply with the legal directives.Further reasearch on reverse logistics adoption in
manufacturing firms in Nairobi Serut, (2013) established that reverse logistics practices within
manufacturing firms are still in the infancy stage. From the above there has been some research
done in the electronics industry though so far none has been done within the Kenyan context to
explore reverse logistics adoption within the vibrant Kenyan ICT industry.This current research
aimed at establishing the state of reverse logistics adoption in ICT sector firms within Kenya.
In trying to map the reverse logistics adoption in the Kenyan ICT study focus was on two
specific research questions, first to what extent have the firms in the ICT sector adopted reverse
logistics and secondly what are the driving forces that determine the adoption and of reverse
logistics within the ICT sector in Kenya.

6
1.3 Research Objectives
The purpose of this study was to:
i. Establish the extent to which reverse logistics has been adopted in the ICT sector in
Kenya.
ii. Establish the driving forces that determine adoption of reverse logistics in the ICT sector
in Kenya.
1.4 Value of the Study
The findings of the study are useful to the managers of firms in ICT sector as it would improve
their comprehension of the opportunities that are inherent in fully embracing reverse logistics in
their operations. This knowledge may form a basis for formulation of strategies that take
advantage of the opportunities while greening the firm’s image. The findings impacts on the
decision making role of managers.
In the academia the findings of this study provides a basis for further research in reverse logistics
within ICT sector in the environment of a young and non industrial economy. This will not only
deepen the concept of reverse logistics as a subject but also add to the growing literature.
Further, the findings are of value to policy makers within the government circles, particularly
National Environmental Management Authority (NEMA), as the report exposes the empirical
situation on the ground in regard to reverse logistics within Kenya’s ICT sector and consequently

7
be able to evaluate the threats posed by the current practices and develop a policy frame work for
minimizing exposure.

8
CHAPTER TWO: LITERATURE REVIEW
2.1 Introduction
This chapter undertakes a review of available literature on the field of reverse logistics starting
with the concept of reverse logistics through the theories that underpin reverse logistics. A
section that discusses the importance of reverse logistics is also included before ending with
forces that drive or bar implementation of reverse logistics. The chapter then concludes with a
summary.
2.2 Theoretical Foundation of Reverse Logistics
Reverse logistics can be explained by the three prevailing theories namely the Resource Based
View (RBV) theory of the firm, Halldo'rsson, (2007); Pandza, (2003); Rungtusanatham,et al
(2003), the Transaction Cost Economics (TCE) theory, Maltz, (1993); Skjott-Larsen, (2000) and
the Institutional theory of the firm (DiMaggio & Powell ,1983).
2.2.1 Resource Based View Theory
Resources are fundamental drivers of firm performance (Conner, 1991). Resources include all
assets, capabilities, organizational processes, firm attributes, information, and knowledge
controlled by a firm that enable the firm to conceive of and implement strategies (for example,
reverse flow programs) that improve the firm’s efficiency and effectiveness (Barney, 1991).
According to Barney, (1986) a firm is said to have competitive advantage when it is
implementing a value-creating strategy not simultaneously being implemented by any current or
potential competitor.This competitive advantage is sustainable if the advantage resists erosion by

9
competitor behavior (Bharadwaj et al., 1998).The RBV explains competitive advantage using
internal reasons for superior firm performance. The RBV contention is that the possession of
such key resources and their effective development and deployment provide unique synthesis of
elements that allows the firm to achieve and sustain competitive advantage. Closs et al., (2000)
identified differences in firms’ logistics competency because of differences in resource
allocation. Daugherty et al., (2001) directly addressed resource commitment in a reverse logistics
context and found resource commitment significantly influence achievement of reverse logistics
program goals.
2.2.2 Transactional Cost Economics Theory
Transactional Cost Economics (TCE) theory specifies the conditions under which a firm should
manage an economic exchange internally within its boundary or externally through inter-
organizational arrangement or in other words through a supply chain. It focuses on minimizing
the total transaction costs of producing and distributing a particular good or service. These costs
are determined by limited rationality, opportunistic behavior, frequency, uncertainty, and asset
specificity involved in the transactions (Williamson, 1975,1985,1996). The first two elements are
assumptions that underpin the choice of a firm between in-sourcing and out-sourcing. The last
three elements are factors or variables that characterize any transaction and affect the transaction
cost. The theory helps determine a firm’s boundary and accounts for the efficiency seeking
behavior of the firm through inter-organizational arrangements governed by contracts (Baiman et
al., 2002; Maltz, 1993).

10
From a theoretical perspective, TCE explains why small firms with limited resources usually rely
on outsourcing to 3PLs to implement reverse logistics in the initial stage. In this regard, the
selection of reverse logistics providers is similar to that of forward logistic providers. The
emphasis is on the service provider’s capability of taking up the organizational role to handle
EoL returns for recycling and reuse (Lau et al., 2008; Meade et al., 2002). RBV, on the other
hand, accounts for the incorporation of reverse logistics as part of long-term company business
strategies by some large corporations in order to attain sustainable competitive advantage
(Clendenin, 1997; Wells et al., 2005).
2.2.3 Institutional Theory
According to the Institutional theory, organizations implement business practices because doing
so enhances their legitimacy (DiMaggio & Powell, 1983). According to DiMaggio & Powell
(1983), once a set of organizations emerges as a field, rational actors tend to make their
organizations increasingly similar. Forces within the firm and the environment encourage
convergent business practices (Zsidisin et al., 2005). This is isomorphism; factors leading
organizations to adopt similar structures, strategies, and processes (Deephouse, 1996). It is
important to recognize variants of the institutional theory exist (Scott, 1987). There are two main
variants to the Institutional theory Ketokivi & Schroeder, (2004), the economic variant drawing
from the work of, Haunschild & Miner (1997), and the sociological argument drawing from
DiMaggio & Powell (1983). Under the sociological argument, mimickers are primarily
motivated by attempts at legitimacy whereas under the economic one mimickers are
economically motivated, seeking efficiency (Ketokivi & Schroeder, 2004).

11
A key tenet in the sociological variant of institutional theory is that organizational isomorphism
increases organizational legitimacy (Deephouse, 1996). The motivation for managerial decision
making is separated from the decision outcomes by the focus on legitimacy (Gopal & Gao,
2009).Legitimacy in this context, is defined as a generalized perception or assumption that the
actions of an entity are desirable, proper or appropriate within some socially constructed system
of norms, values, beliefs and definitions (Suchman,1995). Legitimacy is viewed as a necessary
condition to compete, driving organizations to adopt processes that lead to isomorphism (Gopal
et al., 2009). Three types of mechanisms towards institutional isomorphism have been identified
DiMaggio & Powell, (1983): coercive, mimetic and normative.
Coercive isomorphism is due to both formal and informal pressures exerted on organizations by
other organizations upon which they are dependent and by expectations from the society
(DiMaggio & Powell, 1983). A powerful firm can exercise a coercion to serve its own interest by
demanding that partners adopt its favorable operational practices (Liu et al., 2010). Companies
are under pressure from stakeholders, such as customers and the government, to incorporate
social, environmental and economic responsibility considerations into their operations Zhu &
Sarkis, (2007); Tate et al., (2010); Sarkis et al., (2011), which cause them to conform to be
perceived as more legitimate (Zhu & Sarkis, 2007). Coercive pressures can lead to adaptation of
practices, but institutional theorists also show this does not always lead to efficiencies
(Miemczyk, 2008).
Mimetic isomorphism occurs due to uncertainty that encourages imitation (Zsidisin et al., 2005).
The more uncertain the relationship between means and ends the greater the extent to which an

12
organization will model itself after organizations perceived as successful (DiMaggio et al.,
1983). Selznick (1996) suggests mimesis is more deeply rooted in anxiety than in rational efforts
to avoid reinventing the wheel. Mimetic isomorphism occurs within industry groups to maintain
legitimacy by imitating successful strategies and to minimize the risk of being a first mover in a
new market (Miemczyk, 2008). Benchmarking is a typical approach related to mimetic pressures
(Liu et al., 2010).However, best practices do not work in all organizations due to contextual
mismatches Sousa & Voss, (2008), and imitation can lead to suboptimal results.
The third form of pressure is normative isomorphism (DiMaggio et al., 1983).Normative forces
come from professionalization, defined as a move by members of an occupation to define the
conditions and methods of their work to establish greater legitimacy for their occupation (Gopal
et al., 2009). If many employees have similar educational backgrounds and industry experiences,
they tend to define problems and filter information similarly (DiMaggio et al., 1983), creating
homogeneity over time (St John et al., 2001).
2.3 Reverse Logistics in Organizations
In the general business environment, the flow of forward logistics is the sending of the semi-final
or final products from the point of origin to the point of consumption, with the participation of
several key supply chain partners, namely the supplier, manufacturer, distributor, wholesaler, and
retailer or forwarder (Zelbst et al., 2009). Reverse logistics has been defined as the process of
planning, implementing, and controlling the efficient, cost effective flow of raw materials, in-
process inventory, finished goods and related information from the point of consumption to the
point of origin for the purpose of recapturing value or proper disposal (Rogers et al., 1999).
13
Reverse Logistics is a green supply chain management practice (Rogers & Tibben-Lembke
2001).
Business organizations have begun to implement green supply chain management (GSCM)
practices in response to customer demand for products and services that are environmentally
sustainable and that are created through environmentally sustainable processes and in response to
governmental environmental regulations (Murray, 2000; Green et al., 2008). These practices
require that manufacturers work in concert with suppliers and customers to enhance
environmental sustainability. The implementation of GSCM practices is expected to result in
improved environmental performance as measured by reductions in air emissions, effluent waste,
solid waste, and the consumption of toxic materials (Closs et al., 2011).
Depending on size, internal constraints, and other considerations, different companies may adopt
different attitudes towards reverse logistics. For firms taking a reactive approach, reverse
logistics is implemented mainly to comply with legislations. The activity is considered as a cost
function and the objective is to run it at the lowest cost. For firms taking a proactive approach,
reverse logistics forms part of the company’s long-term strategy to gain competitive advantage
over its competitors. The activity is seen as a unique capability that adds value to the product.
2.4 Importance of Reverse Logistics
End-of-life (EoL) products, especially Waste of Electrical and Electronic Equipments (WEEEs),
contain pollutants which are toxic and hazardous to human health. Improper handling of these e-
wastes may trigger damage to human health. This issue has raised awareness in the society about

14
the environment. This awareness became vivid by the enactment of various environmental laws
around the world, such as the WEEE Directive by the European Union (2003), the Household
Appliances Recycling Law by the Japanese Ministry of Environment (2000) and Extended
Producer’s Responsibility Act by New South Wales government in Australia (2001).These facts
triggered focus on reverse logistics.
Within the reserve logistics domain, the product returns process has emerged as a key element
that can influence the customers’ purchase decisions and thus, an effective product returns
process is viewed as a competitive advantage (Stock et al., 2006).Today’s cash strapped
customer is extremely risk averse and in response to this reality, some retailers view relatively
liberal returns policies as critical to retaining consumers. Furthermore, with the increase of
online purchases, many customers are concerned with how an online purchase will translate into
a store return, if necessary. The results of a survey by Harris Interactive (2008) reported that:“
92% of customers are somewhat or very likely to shop again if the returns process is convenient
on the other hand, 82% are not likely or not very likely at all to shop again if the returns process
is inconvenient” (Mermelstein, 2006)
Perhaps one of the oldest concepts in the management of reverse logistics is the product life
cycle. Determining the forms and phases of the product life cycle will enable companies to
prepare better their market strategy for their products. Not only does the product life cycle break
down the cycle of the product, but also it determines the necessary steps that need to be
addressed once an item is returned. These concepts and their operational management are

15
essential components in defining customer service through customer relationship management
(CRM) principles (Anton et al., 2002).
Many decisions are made during the development phase of a product that will have lasting
effects on the product’s life through its implications of reverse logistics. During the development
phase, designing a product so that the customer can easily and intuitively figure out how to use it
will help reduce the number of non-defective items (Smith, A.D., 2002; Tibben-Lembke, 2002).
Reverse logistics programs can aid a company in finding problem areas and patterns of defects,
thus creating a way to minimize the amount of returns a company receives.
Reverse logistics has great potential to improve the financial performance of organizations
(Doherty, 1996). Reverse flows can be very costly if not managed well (de Brito, 2003). The
benefits a company can gain from reverse flows are twofold – direct and indirect (de Brito &
Dekker, 2002). The direct (financial) benefits consist of income from re-sold products, money
saved on spare parts or source reduction when they are substituted for by de-manufactured
modules and re-use of recycled materials. The in-direct benefit comes from improved corporate
image due to recycling of wastes.
Balancing economic and environmental performance has become increasingly important for
organizations facing competitive, regulatory, and community pressures (Shultz et al., 1999).
With increased pressures for environmental sustainability, it is expected that enterprises will
need to implement strategies to reduce the environmental impacts of their products and services
(Lewis et al., 2001; Sarkis, 1995). To establish their environmental image, enterprises have to re-

16
examine the purpose of their business (Hick, 2000). Success in addressing environmental items
may provide new opportunities for competition, and new ways to add value to core business
programs (Hansmann et al, 2001). Reverse logistics ensure environmental sustainability through
green supply chain practices.
2.5 Drivers and Barriers to Reverse Logistics
Reverse logistics is driven by factors such as environmental legislations Nnorom & Osibanjo,
(2008), extended producer responsibility (EPR) (Khetriwal et al., (2009); Lee et al., (2000),
economics Li , et al., (2008), and improved customer service requirements (Wu & Cheng, 2006).
Owing to increased public concern about the environment, most developed countries have made
legislations mandating manufacturers and importers to take back used ICT products at the end of
their useful lives. The returned products may then be refurbished or remanufactured to extend
their periods of usage or recycled to recapture value (de Brito & Dekker, 2002; Chen, 2001;
Srivastava & Srivastava, 2006; Tang & Naim, 2004).
In green supply chain management, a good strategy enables business to rescue and recover many
parts and components from used products through reverse logistics activities of remanufacturing
and reuse (Beamon, 1999; Kaebernick et al., 2005). Closed-loop supply chains comprising
forward and reverse logistics can be combined to achieve more sustainable production and
consumption (Wells & Seitz, 2005). An efficient and effective reverse logistics management
strategy has become a crucial weapon for a firm to defeat its rivals in the same industry
(Deshmukh et al., 2006). Logistics performance, forward and reverse alike, is positively
impacted by a firm’s supply chain management strategy. The two together positively affect

17
marketing performance which, in turn, positively impacts financial performance of a firm (Green
et al., 2008). There are also many barriers to reverse logistics.
Rogers et al., (1999) in their research indentified a number of barriers that make practicing
reverse logistics difficult. The presence or absence of these factors can become drivers or
barriers to reverse logistics adoption and implementation in a particular industry. These factors
range from external ones such as public awareness, legislations, and support of supply chain
partners to internal considerations such as importance of reverse logistics relative to other issues,
company policies, strategic planning, top management commitment, resistance to change,
information and technological systems, financial resources, personnel resources, performance
metrics, and quality of returned products.
Misconception, lack of management attention and company policies, absence of standardized
processes an inadequate information flow infrastructure and technologies, shortage of personnel
and financial resources, and concerns about competitive and legal issues, are among the common
obstacles (Rogers et al., 1999). Further, reverse logistics are poorly managed in general because
more than one company is usually involved in the process. A holistic approach is therefore
required which demands close collaboration among parties and perhaps a redesign of the existing
forward logistics processes to form a closed-loop (Chapman & Corso, 2005).
In their review of quantitative models for reverse logistics, Fleischmann et al., (1997) list out the
differences between forward and reverse logistics networks which also constitute some of the
barriers to reverse logistics particularly in network planning. These include requirement of a

18
convergent structure of network from many sources to a few demand points, high degree of
uncertainty in supply both in terms of quantity and quality of used products returned by
customers, and uncertain end markets for recovered products. The uncertain timing and quality
of returns, the need to balance returns with demands, and the uncertainty in materials recovered
from returned items are also some of the complicating characteristics impacting production
planning and control for remanufacturing (Guide, 2000; Guide et al., 2003).Depending on the
ability to overcome these barriers, some firms are able to implement reverse logistics using
internal self support system, e.g. Hewlett-Packard, whereas others resort to outsourcing to third-
party logistics (3PL) providers to handle consumer or EoL returns and recycling, e.g. 3M (He &
Wang, 2005).
The outsourcing approach permits a firm to focus on its core activities as well as to achieve more
flexible reverse logistics operations and to transfer risk to third party. However, selection and
management of 3PL providers can be difficult. Another approach, which is usually initiated by
industry association or government, is to set up a collaborative entity or strategic alliance to run
reverse logistics for a number of firms in the same industry (He & Ji, 2006). This collaborative
approach is more effective and efficient as it reduces the investment of individual firms and
enables economies of scale through centralization.
2.6 Summary
The growing concern for the environment, coupled with rapid increase in the introduction and
use of new technology in the marketplace, has led to increased interest and focus in reverse
logistics (Blumberg, 2005). Andel, (1997) suggested that “reverse”, if strategically managed,

19
can provide a competitive advantage by consolidating the market position with the overall
benefit of improving company image. Because of all the uncertainties involved, the process of
reverse logistics program development and implementation is very complex (Kearney, 2004).
Chan and Chan, (2008) study on the mobile phone industry in Hong Kong established that proper
implementation of reverse logistics systems can result in better customer loyalty and reduction in
operational costs due to reuse or remanufacturing of some parts. Although the findings of the
paper were limited to Hong Kong mobile phone industry, it is expected that similar situation
could be identified in other industries and in other countries .Chan and Chan recommends further
research to verifying whether the same findings exist in other industries or other countries.
Ismael et al.,(2010) exploratory study of reverse logistics initiatives in several Turkish
electronics and furniture firms shows that the reverse logistics initiatives were still in a very early
stage. Companies’ involvement in product returns is mostly due to the legislative liabilities, and
system inadequacies are emphasized as the most important reason for not being able to
implement an efficient reverse logistics.
Locally, a case study on Kenya Medical Supplies Association by Waithaka, (2012) found that
reverse logistics adoption was mainly as a result of need to comply with the legislative
directives.Further reasearch on reverse logistics adoption in manufacturing firms in Nairobi
Serut, (2013) established that reverse logistics practices within manufacturing firms are still in
the infancy stage. From the above there has been research done in the electronics industry
however so far none has been done and published within the Kenyan context to explore reverse

20
logistics adoption within the vibrant Kenyan ICT industry. Therefore, this paper aims to fill this
gap and to disseminate the information gathered on adoption to industrial companies, academia
and decision makers in general.

21
CHAPTER THREE: RESEARCH METHODOLOGY
3.1 Introduction
This chapter outlines the research plan or methodology. This is followed by an explanation of the
study population and sampling design to capture information as set out in the research objectives.
Then a description of research instruments to be applied is outlined followed by,,data collection
procedures and the method of data analysis.
3.2 Research Design
This was a cross sectional survey research regarding reverse logistics adoption within ICT firms
in Kenya. According to Cooper & Schindler (2006) in a cross sectional design, either the entire
population or a subset thereof is selected, and from these individuals, data are collected to help
answer research questions of interest. The information about the variables that is gathered
represents what is going on at only one point in time.
3.3 Population of the Study
The study population consisted of 40 registered ICT firms as per the list provided by the
Communications Authority of Kenya (CAK, 2013). This study was a census. The bulk of these
companies are located within the city of Nairobi.
3.4 Data Collection
The responses of the members of this population were captured through the research instrument
for data collection designed by the researcher. The instrument was administered by the

22
researcher and his assistant. In this current study primary data was captured that relates to the
adoption of reverse logistics and the drivers and barriers to the adoption in ICT firms in Kenya.
The questionnaires were designed or structured to meet the objectives of the current study.
A five point likert scale was adopted in the scale questionnaire. The instrument sought response
on the questions that were grouped into three (3) sections. Section (i) sought demographic and
general information, section (ii), sought to isolate the extent of adoption and the drivers of
reverse logistics of the company, section (iii) sought responses relating to barriers to the adoption
of reverse logistics.
3.5 Data Analysis
Once the data was received from the respondents it was checked for completeness and
correctness then coded in preparation for processing with the statistical quantitative analysis
methods. Descriptive statistics, the discipline of quantitatively describing the main features of a
collection of data was applied in the analysis to calculate the mean and standard deviation for
each element or likert item.
The coded data was then analyzed using Statistical Product and Service Solution (SPSS) to
generate, frequency, percentage, mean and standard deviation for, discussion and interpretation.
Principle component analysis was used to isolate barriers from drivers of reverse logistics
adoption in the ICT industry.

23
CHAPTER FOUR
RESULTS, DATA ANALYSIS AND DISCUSSION
4.1 Introduction
This chapter presents an analysis of data collected and discusses the study findings. Data
analysis and report of findings was done using descriptive statistics in the form of frequencies
tables, percentages, mean and standard deviation. Principal component analysis was used for
separating barriers from drivers of reverse logistics.
4.2 Demographic Characteristics of the Respondents
The study population comprised 40 respondents out of which 35 responded giving a response
rate of 87.5%. The respondents were senior managers in charge of logistics or supply chain
within the ICT companies. The findings on their demographics is summarised in Table 4.1.
24
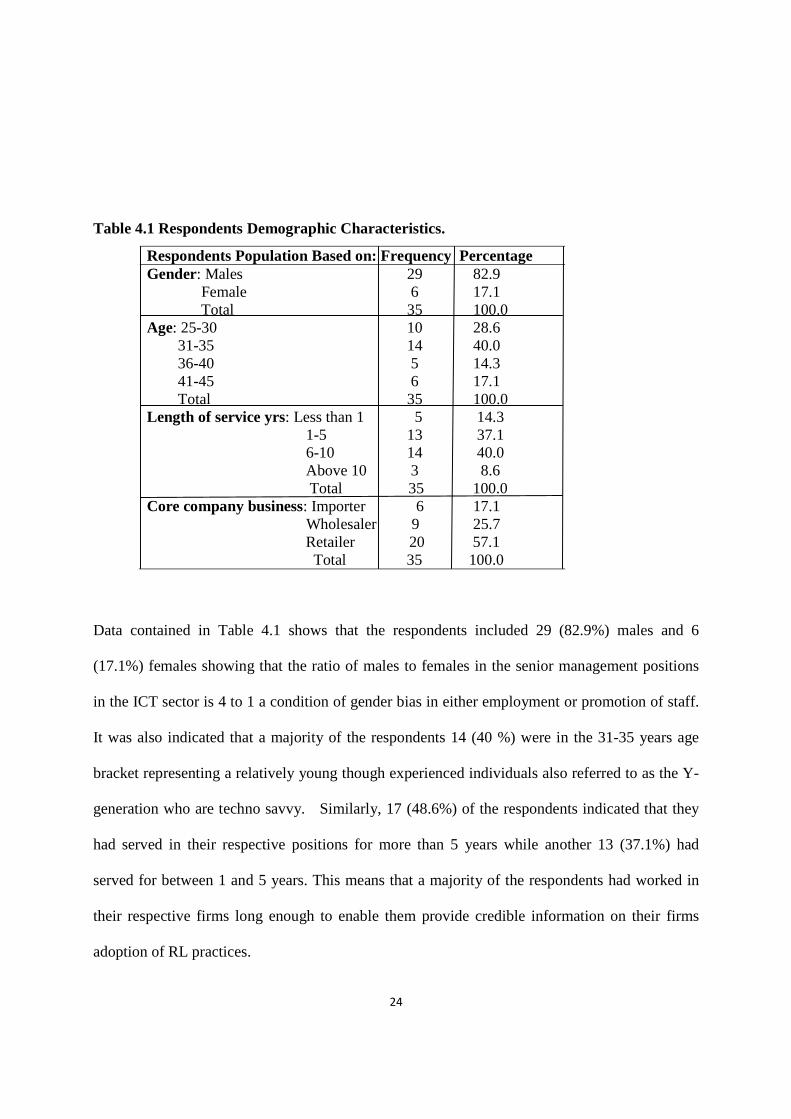
Table 4.1 Respondents Demographic Characteristics.
Respondents Population Based on: Frequency Percentage Gender: Males 29 82.9 Female 6 17.1 Total 35 100.0 Age: 25-30 10 28.6 31-35 14 40.0 36-40 5 14.3 41-45 6 17.1 Total 35 100.0 Length of service yrs: Less than 1 5 14.3 1-5 13 37.1 6-10 14 40.0 Above 10 3 8.6
Total 35 100.0 Core company business: Importer 6 17.1 Wholesaler 9 25.7
Retailer 20 57.1 Total 35 100.0
Data contained in Table 4.1 shows that the respondents included 29 (82.9%) males and 6
(17.1%) females showing that the ratio of males to females in the senior management positions
in the ICT sector is 4 to 1 a condition of gender bias in either employment or promotion of staff.
It was also indicated that a majority of the respondents 14 (40 %) were in the 31-35 years age
bracket representing a relatively young though experienced individuals also referred to as the Y-
generation who are techno savvy. Similarly, 17 (48.6%) of the respondents indicated that they
had served in their respective positions for more than 5 years while another 13 (37.1%) had
served for between 1 and 5 years. This means that a majority of the respondents had worked in
their respective firms long enough to enable them provide credible information on their firms
adoption of RL practices.

25
Relative to the ICT companies’ profile, 6 (17.1%) indicated that their core business was import
of ICT product and services, 9 (25.7%) said they were mainly wholesalers while the remaining
20 (57.1%) indicated to be mainly retailers.
Similarly, with regard to length of operation, 19 (54.3%) of the ICT firms were said to have
commenced operation before 2000, 7 (20.0%) between 2000 and 2005 and the remaining 9
(25.7%) between 2006 and 2008. This means that almost all the firms involved in ICT operations
project survey have been in the business more than 5 years a period considered long enough to
have adopted and tested various ICT business practices including reverse logistics practices.
However, only 16 (45.7%) of the practitioners acknowledged measuring reverse logistics cost
within their firms. On the one hand, a majority of the operators who acknowledged not
measuring the reverse logistics costs gave as their reason the prospect of saving money in the
process, that the practice is negative and the fact that the cost could be estimated.
On the other hand, those who insisted that they measured reverse logistics costs gave the most
measured cost element as transport cost, and wages of particular workers. Other measured
elements included materials used in repair operations and external failure/customer
compensation costs.
4.3 Extent of Adoption of Reverse Logistics System
Fourteen items were used to measure the respondent’s perception of the extent of adoption of
drivers of reverse logistics system. Their responses were as is shown in Table 4.2.
26
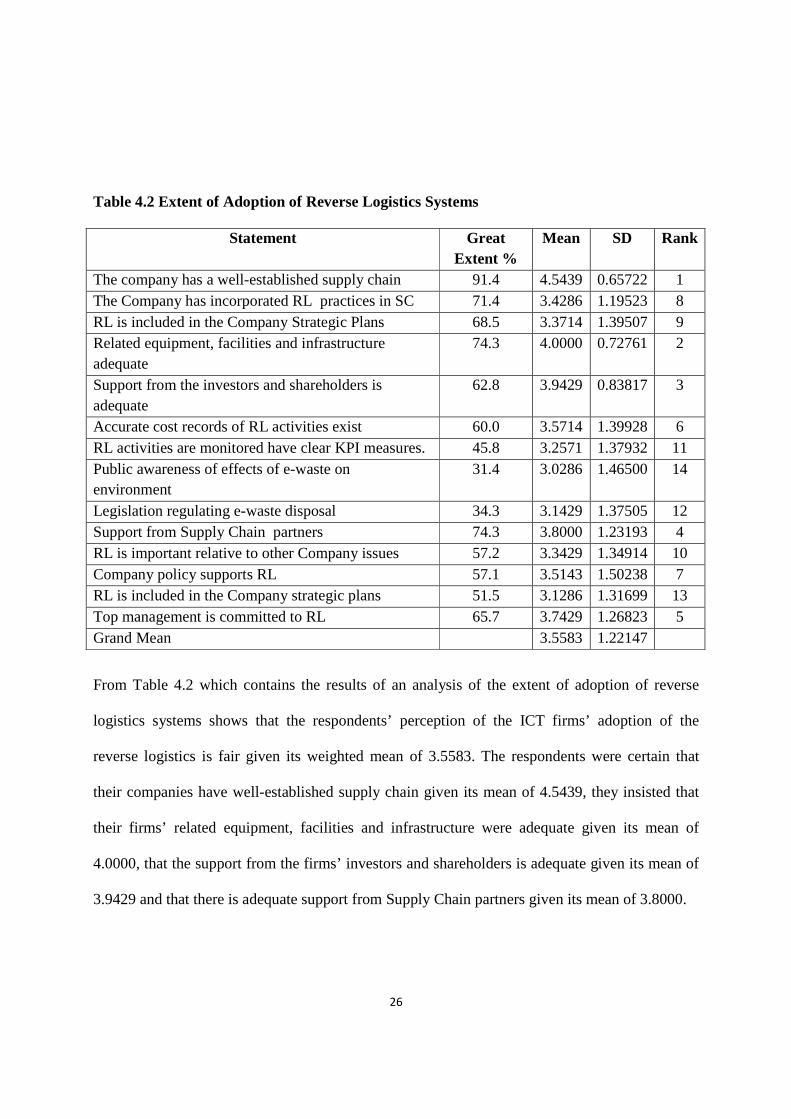
Table 4.2 Extent of Adoption of Reverse Logistics Systems
From Table 4.2 which contains the results of an analysis of the extent of adoption of reverse
logistics systems shows that the respondents’ perception of the ICT firms’ adoption of the
reverse logistics is fair given its weighted mean of 3.5583. The respondents were certain that
their companies have well-established supply chain given its mean of 4.5439, they insisted that
their firms’ related equipment, facilities and infrastructure were adequate given its mean of
4.0000, that the support from the firms’ investors and shareholders is adequate given its mean of
3.9429 and that there is adequate support from Supply Chain partners given its mean of 3.8000.
Statement Great Extent %
Mean SD Rank
The company has a well-established supply chain 91.4 4.5439 0.65722 1 The Company has incorporated RL practices in SC 71.4 3.4286 1.19523 8 RL is included in the Company Strategic Plans 68.5 3.3714 1.39507 9 Related equipment, facilities and infrastructure adequate
74.3 4.0000 0.72761 2
Support from the investors and shareholders is adequate
62.8 3.9429 0.83817 3
Accurate cost records of RL activities exist 60.0 3.5714 1.39928 6 RL activities are monitored have clear KPI measures. 45.8 3.2571 1.37932 11 Public awareness of effects of e-waste on environment
31.4 3.0286 1.46500 14
Legislation regulating e-waste disposal 34.3 3.1429 1.37505 12 Support from Supply Chain partners 74.3 3.8000 1.23193 4 RL is important relative to other Company issues 57.2 3.3429 1.34914 10 Company policy supports RL 57.1 3.5143 1.50238 7 RL is included in the Company strategic plans 51.5 3.1286 1.31699 13 Top management is committed to RL 65.7 3.7429 1.26823 5 Grand Mean 3.5583 1.22147

27
Likewise, respondents asserted that the firms’ top management are committed to reverse logistics
(mean of 3.7429), that accurate cost records of reverse logistics activities exist (mean of 3.5714),
that their companies’ policy supports reverse logistics (mean of 3.5413) and that their company
had incorporated reverse logistics activities in SC (mean of 3.4286). Additionally, the
respondents were sure that reverse logistics is included in the Company Strategic Plans given its
mean of 3.3714, that reverse logistics is important relative to other Company issues (mean of
3.3429), that reverse logistics activities are monitored have clear KPI measures (mean 3.2571)
and that legislation regulating e-waste disposal (mean of 3.1429). Lastly, respondents confirmed
that reverse logistics is included in their Companies’ strategic plans (3.1286) and that there is
Public awareness of effects of e-waste on environment (mean of 3.0286).
4.4 Barriers and Drivers to Reverse Logistics Adoption
The second objective of the study was to identify significant barriers and drivers of reverse
logistics adoption among investors in the ICT industry in Kenya. An inquiry on reverse logistics
adoption was made using 14 likert scaled statements. Principal component analysis was then
used to isolate the most significant reverse logistics factors considered as barrier from those
considered as drivers. The results were as is contained in Tables 4.3 and 4.4.
Table 4.3: KMO and Bartlett's Test
Kaiser-Meyer-Olkin Measure of Sampling Adequacy. .689
Bartlett's Test of Sphericity
Approx. Chi-Square 1085.970
df 35
Sig. .000
Table 4.3 which contain the results of KMO and Bartlett’s test on the elements show that the
correlation (0.689) for the elements was barely adequate for factor analysis. Nonetheless,

28
principal component analysis was carried out on the elements and the table on the results of their
communalities showed that none of the elements had particularly very low extraction
communalities to warrant removal. Thus further process of analysis was carried out and five
components with eigenvalues of 1 or more accounting for about 72% of the total variance were
extracted and rotated as is illustrated by the scree plot Figure 4.1.
Figure 4.1 Scree Plot.
The process of isolation of barriers from drivers of reverse logistics adoption practices among
investors in ICT industry in Kenya was determined based on values of correlations between
variables and their components in the unrotated component matrix summarized in Table 4.4.
29
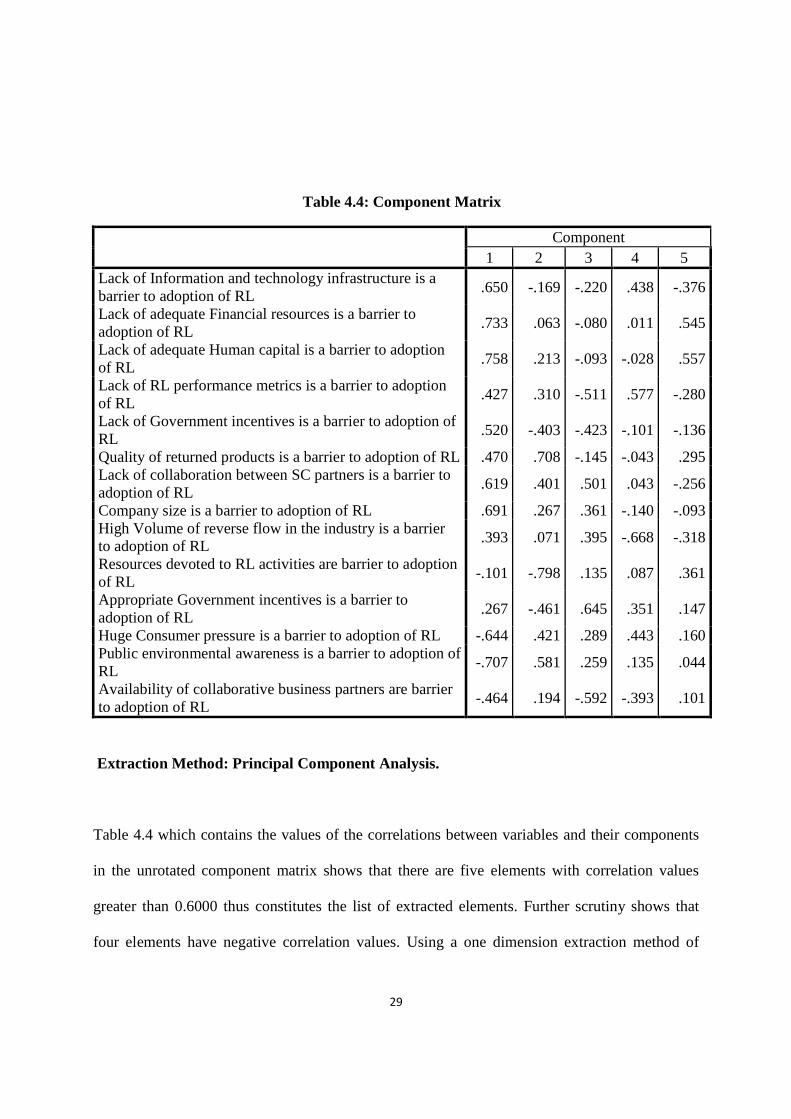
Table 4.4: Component Matrix
Component 1 2 3 4 5
Lack of Information and technology infrastructure is a barrier to adoption of RL
.650 -.169 -.220 .438 -.376
Lack of adequate Financial resources is a barrier to adoption of RL
.733 .063 -.080 .011 .545
Lack of adequate Human capital is a barrier to adoption of RL
.758 .213 -.093 -.028 .557
Lack of RL performance metrics is a barrier to adoption of RL
.427 .310 -.511 .577 -.280
Lack of Government incentives is a barrier to adoption of RL
.520 -.403 -.423 -.101 -.136
Quality of returned products is a barrier to adoption of RL .470 .708 -.145 -.043 .295 Lack of collaboration between SC partners is a barrier to adoption of RL
.619 .401 .501 .043 -.256
Company size is a barrier to adoption of RL .691 .267 .361 -.140 -.093 High Volume of reverse flow in the industry is a barrier to adoption of RL
.393 .071 .395 -.668 -.318
Resources devoted to RL activities are barrier to adoption of RL
-.101 -.798 .135 .087 .361
Appropriate Government incentives is a barrier to adoption of RL
.267 -.461 .645 .351 .147
Huge Consumer pressure is a barrier to adoption of RL -.644 .421 .289 .443 .160 Public environmental awareness is a barrier to adoption of RL
-.707 .581 .259 .135 .044
Availability of collaborative business partners are barrier to adoption of RL
-.464 .194 -.592 -.393 .101
Extraction Method: Principal Component Analysis.
Table 4.4 which contains the values of the correlations between variables and their components
in the unrotated component matrix shows that there are five elements with correlation values
greater than 0.6000 thus constitutes the list of extracted elements. Further scrutiny shows that
four elements have negative correlation values. Using a one dimension extraction method of
30
principal component analysis, elements with positive correlation values which were found to be
ten in number which were correlated were retained while those with negative correlation values
were excluded.
Thus the table shows that there exist barriers and drivers of reverse logistics adoption among
players in ICT industry in Kenya. The principal indicators of reverse logistics factors isolated
include lack of adequate Human capital for adoption of reverse logistics, lack of adequate
financial resources and company size in adoption of reverse logistics. Other notable ones include
lack of Information and Technology infrastructure and lack of collaboration between SC partners
in adoption of reverse logistics practices in decreasing order of effect. These predominant factors
were notably selected by the respondents as barriers to adoption of reverse logistics among
players in the ICT sector in Kenya.
The remaining set of elements including appropriate Government incentives, quality of returned
products, reverse logistics performance metrics, volume of reverse flow in the industry and
resources devoted to reverse logistics activities were suggested to be drivers to reverse logistics
adoption.

31
CHAPTER FIVE: SUMMARY, CONCLUSION AND RECOMMENDATION
5.1 Introduction
This chapter is a summary of the research findings, conclusions, recommendation and suggestion
for further research. The main purpose of this study was to determine the extent of adoption of
reverse logistics by firms involved in information technology related businesses. Data for
analysis was obtained by use of questionnaires designed by the researcher for the ICT firms’
managers in charge of their company’s logistical issues. Information obtained was analyzed
quantitatively with the aid of statistical package for social sciences (SPSS) version 20 computer
software.
5.2 Summary of Findings
In pursuance of the purpose of the study to establish to which extent RL has been adopted in ICT
sector and what driving forces influence the adoption in this sector in Kenya, questionnaires
based on these objectives were designed then administered to the respondents and information
analysed to establish the findings below.
The study comprised 35 senior managers in charge of Supply Chain or Logistics within various
ICT companies, majority of who were males in the 31-35 years age bracket. The ICT companies’
profile, indicated that the investors in the ICT value chain consisted of importers, wholesalers
and retailers in increasing magnitude with almost all the companies having been in operation
prior to 2008 thus showing that a majority of them have been in the business long enough to have

32
mastered reverse logistics systems. However, only a minority of the practitioners acknowledged
measuring reverse logistics cost within their firms.
Fourteen items were used to establish the respondent’s perception of the extent of adoption of
reverse logistics systems. Respondents’ perception of the ICT firms’ adoption of the reverse
logistics is fair given its weighted mean of 3.5583 with companies having well-established
supply chain scoring the highest mean rating as an indicator of extent of adoption of reverse
logistics systems while public awareness of effects of e-waste on environment with the lowest
mean rating seemed to be the least prominent indicator of extent of adoption of reverse logistics
systems.
Principal component analysis was used to isolate the most significant reverse logistics factors
considered as barrier from those considered as drivers. Out of the initial fourteen statements
analysed using principle component analysis, four were found to be inadequately correlated with
the other factors and thus were deleted. From the remaining ten elements, a set of five each were
found to be averagely or relatively strongly correlated as factor of adoption of reverse logistics
practices thus were adopted as either barriers or drivers of adoption of reverse logistics
practices.
The barriers of adoption of reverse logistics practices identified include lack of adequate Human
capital, lack of adequate financial resources, company size, lack of Information and Technology
infrastructure and lack of collaboration between SC partners. Similarly, the drivers of the process
of adoption of reverse logistics practices identified include appropriate Government incentives,
33
quality of returned products, reverse logistics performance metrics, volume of reverse flow in the
industry and resources devoted to reverse logistics activities.
5.3 Conclusion of the study
The results of the analysis of the extent of adoption of reverse logistics systems established that
the ICT firms’ adoption of the reverse logistics is fair given its weighted mean of 3.5583.This is
consistent with the firm’s attempt at enhancing resource utilization to improve efficiency and
effectiveness through implementation of reverse logistics (Barney, 1991).
From the foregoing summary, it can be concluded that many of operators in the ICT sector have
adopted reverse logistics to appreciable levels due to its significance for their operations given its
fairly above average rating by the respondents. This is consistent with the earlier findings that
reverse logistics has become a managerial priority because of the assets/value involved and the
potential impact on customer relations (Daugherty et al., 2005).Customers expect their vendors
to be willing and able to handle returns (Daugherty et al., 2003) When worn out or obsolete
products are remanufactured, “it’s not uncommon for companies to realize higher margins on
these remanufactured products than they do on new items” (Stock et al., 2002, p. 16).
The findings established several factors which the respondents categorized either as barriers or
drivers. This is confirmed by the study by Rogers et al., (1999) which indentified a number of
barriers that make practicing reverse logistics difficult. The presence or absence of these factors
can become drivers or barriers to reverse logistics adoption and implementation in a particular
industry. These factors range from external ones such as public awareness, legislations, and

34
support of supply chain partners to internal considerations such as importance of reverse logistics
relative to other issues, company policies, strategic planning, top management commitment,
resistance to change, information and technological systems, financial resources, personnel
resources, performance metrics, and quality of returned products.
It was established that, only a slight minority of the practitioners acknowledged measuring
reverse logistics cost within their firms. This finding is consistent with reverse logistics
initiatives in developing countries. Ismael et al.,(2010) exploratory study of reverse logistics
initiatives in several Turkish electronics and furniture firms shows that the reverse logistics
initiatives were still in a very early stage. Companies’ involvement in product returns is mostly
due to the legislative liabilities, and system inadequacies are emphasized as the most important
reason for not being able to implement an efficient reverse logistics.
5.4 Recommendations
The findings showed that the adoption of reverse logistics by ICT firms were still in nascent
stage. Stakeholders should therefore put in place measures meant to spur its adoption. Such
efforts could for instance begin with massive awareness creation on the relevance of reverse
logistics systems through sensitization of all stakeholders. This would not only encourage
adoption of reverse logistics but even ensure that all stakeholders measure the costs factors for
adoption of reverse logistics ,a fact that is currently ignored by a majority of the operators.
The Government through NEMA should enhance support for reverse logistics. Government
financial support and policies are important to companies in implementing reverse logistics.

35
Lack of enforceable environmental legislations established by the Government may lower the
motivation for the organization to consider implementing reverse logistics (Nnorom & Osibanjo,
2008). Besides, tax policies and economic support from the government are also essential..
Rogers and Tibben-Lembke (1999) listed some of the legislations and regulations done by
Europe and the US that paved the way for reverse logistics implementation. This could be done
through provision of attractive incentives in terms of favorable taxation system and development
and enactment of favorable reverse logistics adoption policies.
Lastly, the investors in ICT sector should, own their part form a lobby to enable them have a
stronger negotiating ground with other stakeholders. This is coercive isomorphism. It will bring
both formal and informal pressures to be exerted on organizations by other organizations upon
which they are dependent and by expectations from the society (DiMaggio et al., 1983).
Companies are under pressure from stakeholders, such as customers and the government, to
incorporate social, environmental and economic responsibility considerations into their
operations Zhu & Sarkis, (2007); Tate et al., (2010); Sarkis et al., (2011), which cause them to
conform to be perceived as more legitimate (Zhu et al., 2007). Coercive pressures can lead to
adaptation of reverse logistics.
Another approach, which is can be initiated by industry association or government, is to set up a
collaborative entity or strategic alliance to run reverse logistics for a number of firms in the same
industry (He & Ji, 2006). This collaborative approach is more effective and efficient as it reduces
the investment of individual firms and enables economies of scale through centralization.
36
5.5 Suggestions for Further Research
The current study covered 40 ICT firms in a cross section survey. Due to complexity involved in
RL issues it is suggested that a case study would be appropriate. This could be done on some of
the well established financially stable ICT firms in order to really come up with practical
dynamics in this sector for the purpose of bench marking.

37
RERERENCES Halldo'rsson, A. (2007). Complementary theories to supply chain management. Supply chain
management:An international Journal , 12 (4), 284-96.
Andel, T. (1997). “Reverse logistics: a second chance to profit". Transportation & Distribution Vol. 38 No. 7,.
Anton, J. and Petouhoff, N.L. (2002). Customer Relationship Management: The Bottom Line to optimizing your ROI. Pearson Education, Upper Saddle River, NJ.
Baiman, S. and Rajan, M.V. (2002). Incentive issues in interfirm relationship. Accounting Organizations and Society , 27 (3), 213-38.
Barney ,J.B. (1991). Firm resources and sustained competitive advantage. Journal of Management , 99-120.
Barney. (1986). Organizational culture:Can it be a source of sustained competitive advantage. Academy of management review , 656-65.
Beamon, B. (1999). Designing the green supply chain. Logistics Information Management,.
Bharadwaj,S.C.,Varadarajan,P.R.,and Fahy,J. (1998). Sustainable competitive advantage in service industries: Aconceptual model and research propositions. Journal of marketing , 83-89.
Blumberg, D. (2005). Introduction to Management of Reverse Logistics and Closed Loop Supply Chain Processes. CRC Press, Boca Raton, IL.
Chan T.S and H.K Chan. (2008). Survey on reverse logistics system of mobile phone Industry in Hong Kong.
Chapman, R. A. (2005). From continuous improvement to collaborative innovation: the next challenge in supply chain management. Production Planning & Control.
Chen, K. (2001). Development of integrated design for disassembly and recycling in concurrent engineering. Integrated Manufacturing Systems.
Clendenin, J.A. (1997). Closing the supply chain loop : Reengineering the return process. International Journal of Logistics Management , 8 (1), 75-86.
Closs, D.J., Speier, C. and Meacham, N. (2011). “Sustainability to support end-to-end value chains the role of supply chain management. Journal of the Academy of Marketing Science,Vol. 39 No. 1.
38
Communications Authority Of Kenya. (2014). Sector Statistics report 2013/2014. Communications Commission of Kenya.
Conner, K. (1996). A resource-Based Theory of the Firm:Knowledge versus opportunism. Organizational Science , 7 (5), 477-501.
Conner, K. (1991). A historical comparison of resource-based theory and five schools of thought within industrialorganization economics: do we have a new theory of the. Journal of Management.
Closs, D. A. (2000). Logistics information technology practice in manufacturing and mechandising firms. International Journal of Physical Distribution & Logistics Management.
Closs, D.J., Speier, C. and Meacham, N. (2011). “Sustainability to support end-to-end value chains the role of supply chain management. Journal of the Academy of Marketing Science,Vol. 39 No. 1.
Daugherty, P.J., Autry, C.W. and Ellinger, A.E. (2001). Reverse logistics: the relationship between resource commitment and program performance. Journal of Business Logistics.
Daugherty, P.J., Richey, G.R., Genchev, S.E. and Chen, H. (2005). “Reverse logistics: superiorperformance through focused resource commitments to information technology”,. Transportation Research: Part E, Vol. 41 No. 2,.
Daugherty, P.J., Richey, R.G., Hudgens, B.J. and Autry, C.W. (2003). “Reverse logistics in the automobile aftermarket industry”,. International Journal of Logistics Management, Vol. 14,No. 1.
de Brito, M. (2003). Managing reverse logistics or reversing logistics management ERM PhD Series Research in management. Erasmus University Rotterdam, Rotterdam.
de Brito, M.P. and Dekker, R. (2002). Reverse logistics – a framework. Econometric Institute Report.
de Brito ,M.P and Dekker,R. (2004). Aframework for Reverse Logistics.
Deephouse, D. (1996). "Does isomorphism legitimate". Academy of Management Journal, Vol. 39,No. 4,.
DiMaggio, P.J. and Powell, W.W. (1983). The iron cage revisited: institutional isomorphism and collective rationality in organizational fields. American Sociological Review Vol 48,No.2.
39
Doherty, K. (1996). What goes around, comes back. US Distribution Journal.
Dowlatshahi, S. (2000). Developing a theory of reverse logistics -interfaces. 30 (3), 143-54.
Fulconis,F.,Saglietto,L.Pache',G. (2007). Strategy dynamics in the Logistics industry:Atransactional centre perspective. Management Decision , 45 (1), 104-17.
Fleischmann, M., Bloemhof-Ruwaard, J.M., Dekker, R., van der Lann,E,Van Nunen,J.A.E.E and Van Wassenhove,LN. (n.d.). Quantitative models for reverse logistics:a review. European Journal of Operational Research.
Gopal, A. and Gao, G. (2009). “Certification in the Indian offshore IT services industry”. Manufacturing & Service Operations Management, Vol. 11 No. 3,.
Grawe, S. (2009). “Logistics innovation: a literature-based conceptual framework. International Journal of Logistics Management Vol. 20 No. 3,.
Green, K., Morton, B. and New, S. (1998). Green purchasing and supply policies: do they improve companies’ environmental performance?”,. Supply Chain Management: An International Journal.
Guide, V.D.R. Jr. and Jayaraman, V. (2000). Product acquisition management current industry practice and a proposed framework. International Journal of Production of production research.
Guide, V. J. (2003). Business Aspects of Closed-Loop Supply Chains. Pittsburgh, PA.: Carnegie Mellon Universisity Press,.
Hansmann, K. A. (2001). Environmental management policies,Green Manufacturing and Operations: from Design to Delivery and Back. Green leaf publishing,Sheffield.
Harvard Business Review, V. 8.-6. (n.d.). Logistics innovation: a literature-based conceptual framework. International Journal of Logistics Management.
Haunschild, P. and Miner, A. (1997). “Modes of interorganizational imitation: the effects of outcome salience and uncertainty”. Administrative Science Quarterly, Vol. 42 No. 3.
He, X. and Wang, J.X. (2005). “An overview of reverse logistics. International Journal of Plant Engineering and Management.
He, Y. and Ji, G.J. (2006). Reverse logistics analysis of electronics industry. Special Zone Economy.
Hick, S.(2000) Morals make the money. Austrian.
40
International Association of Electronic Recyclers. (2006). Industry overview. White paper .
Ismael E,Funda S.,Gulcin ,B.Necati A.,Nigar D,Aybek K. (2010). Exploring reverse supply chain management practices in Turkey. Supply Chain Management:International Journal , 43-54.
Kaebernick, H., Kara, S. and Pornprasitpol, P. (2005). A selective disassembly methodology for end-of-life products. Assembly Automation.
Kearney, A. (2000). Executive Agenda, Vol. 7, No. 3,. A. T. Kearney, Chicago, IL.
Kenya Government. (2002). National ICT Policy.
Ketokivi, M.A. and Schroeder, R.G. (2004). “Strategic, structural contingency and institutional explanations in the adoption of innovative manufacturing practices. Journal of Operations Management, Vol. 22 No. 1.
Khetriwal, D.S., Kraeuchi, P. and Widmer, R. (2009). Producer responsibility for e-waste management: key issues for consideration – learning from the Swiss experience. Journal of Environmental Management, in press.
Lau, K.H. and Ma, W.L. (2008). A supplementary framework for evaluation of integrated logistics service provider. International Journal of Information Systems and Supply Chain Management , 1 (3), 49-69.
Lee, C.H., Chang, S.L., Wang, K.M. and Wen, L.C. (2000). Management of scrap computer recycling in Taiwan. Journal of Hazardous Materials.
Lewis and Gretskis. (2001). Design+Environment :Aglobal guide to designing greener goods.
Li, X. A. (2008). An exploration of reverse logistics practices in three companies. Supply Chain Management: An International Journal.
Liu, H., Ke, W., Wei, K., Gu, J. and Chen, H. (2010). “The role of institutional pressures and organizational culture in the firm’s intention to adopt internet-enabled supply chain management systems”,. Journal of Operations Management, Vol. 28 No. 5,.
Lubin, D. A and Esty(2010). The sustainability imperative: lessons for leaders from previous game-changing megatrends. Harvard Business Review.Vol88,No 5,pp 42-50.
Maltz, A. (1993). Private fleet use:Atransaction cost model. Transportation Journal , 46-53.
Meade, L. and Sarkis, J. (2002). A conceptual model for selecting and evaluating third-party reverse logistics providers. Supply Chain Management: An International Journal , 7 (5), 283-95.

41
Mermelstein, E. (2006). Many happy returns. Marketing Management Journal , 15 (1), 15.
Miemczyk, J. (2008). “An exploration of institutional constraints on developing end-of-life product recovery capabilities”,. International Journal of Production Economics, Vol. 115,No.2.
Nidumolu, R., Prahalad, C.K. and Rangaswami, M.R. (2009). Why sustainability is now the key driver of innovation. Harvard Business Review, Vol. 87 No. 9, pp. 56-64.
Nnorom, I. and Osibanjo. (2008). Overview of electronic waste (e-waste) management practices and legislations and their poor applications in developing countries. Resources, Conversation and Recycling.
Murray, G. (2000). Effects of a green purchasing strategy:the case of Belfast city council. Supply
Pandza. (2003). Evolutionary perspectives in the capability accumulation process. International Journal of Operations & Production Management , 23 (8), 822-49.
Rogers,D.S,and Tibben-Lembke ,R.S. (1999). Going backwards:Reverse Logistics Trends and Practices. Reverse Logistics Executive Council,Reno,NV .
Rogers, D.S. and Tibben-Lembke, R. (2001). An examination of reverse logistics practices. Journal of Business Logistics, Vol. 22 No. 2,.
Rogers, D.S., Lambert, D.M., Croxton, K.L. and Garcia-Dastugue, S.J. (2002). The returns management process. International Journal of LogisticsManagement.
Rungtusanatham,M.,Salvador,F.,C. and Choi,T.Y. (2003). Supply-Chain linkages and operational performance:A resource-based perspective. International Journal odf operations &Production Management , 23 (9), 1084-99.
Sarkis, J. (1995). Manufacturing strategy and environmental consciousness. Technovation.
Sarkis, J., Zhu, Q. and Lai, K. (2011). “An organizational theoretic review of green supply chain management literature”,. International Journal of Production Economics, Vol. 130 No. 1.
Scott, W. (1987). “The adolescence of institutional theory”. Administrative Science Quarterly Vol. 32 No. 4.
Selznick, P. (1996). “Institutionalism ‘old’ and ‘new’”,. Administrative Science Quarterly, Vol. 41,No.2.
Serut, C. (2013). Reverse Logistics adoption in Manufacturing firms in Nairobi. Unpublished.

42
Shultz C.J.II and Holbrooks,M.B. (1999). Marketing and tragedy of the commons:Asynthesis,commentary and analysis for action. A journal of Public Policy and Marketing , 18 (2), 218-29.
Skinner, L.R., Bryant, P.T. and Richey, R.G. (2008). Examining the impact of reverse logistics disposition strategies. International Journal of Physical Distribution & Logistics Management.
Skjott-Larsen T. (2000). Third party logistics- from an interorganizational point of view. International Journal of Physical Distribution & Logistics Management , 30 (2), 112-27.
Srivastava, S. A. (2006). ‘‘Managing product returns for reverse logistics. International Journal of Physical Distribution & Logistics Management.
Smith, A.D. (2002). Loyalty and e-marketing issues: customer retention on the web. Quarterly Journal of E-Commerce , 3 (2), 149-61
Sousa, R. and Voss, C. (2008). “Contingency research in operations management practices”,. Journal of Operations Management, Vol. 26 No. 6,.
St John, C., Cannon, A. and Pouder, R. (2001). “Change drivers in the new millennium:implications for manufacturing strategy research”,. Journal of Operations Management,Vol. 19 No. 2,.
Stock, J. A. (2001). Strategic Logistics Management. McGraw-Hill, New York, NY.
Stock, J., Speh, T. and Shear, H. (2006). “Managing product returns for competitive advantage".
Suchman, M. (1995). “Managing legitimacy: strategic and institutional approaches”. Academy of Management Review, Vol. 20 No. 3,.
Tang, O. and Naim, M.M. (2004). The impact of information transparency on the dynamic behaviour of ahybrid manufacturing/remanufacturing system. International Journal of Production Research.
Tan,A.W.,Yu,W.S. and Arun,K. (2003). Improving the performance of a computer company in supporting its reverse logistics operations in Asia-Pacific region. An International Journal of Physical Distribution &Logistics Management , 33 (1), 59-74.
Tate, W.L., Ellram, L.M. and Kirchoff, J.O.N.F. (2010). “Corporate social responsibility reports: a thematic analysis related to supply chain management”,. Journal of Supply Chain Management, Vol. 46 No. 1,.

43
Waithaka, I. (2012). Reverse Logistics Practices at Kenya Medical Supplies Agency. Unpublished.
Wells, P. and Seitz, M. (2005). Business models and closed-loop supply chains: a typology. Supply Chain Management management International Journal , 10 (4), 249-51.
Williamson, O.E. (1975). Markets and Hierarchies: Analysis and Antitrust Implications.
Williamson, O.E. (1985). The Economic Institutions of capitalism:Firms,markets,relational contracting.
Williamson, O.E. (1996). The Mechanisms of Governance.
Zelbst, P.J., Green, K.W. Jr, Sower, V.C. and Rekes, P. (2009). Impact of supply chain linkages on supply chain performance. Industrial Management & Data Systems.
Zhu, Q., Sarkis, J. and Lai, K. (2007). Initiatives and outcomes of green supply chain management implementation by Chinese manufacturers. Journal of Environmental Management, Vol. 85 No. 1.
Zhu, Q. and Sarkis, J. (2007). “The moderating effects of institutional pressures on emergent green supply chain practices and performance”,. International Journal of Production Research, Vol. 45 No. 18.
Zsidisin, G., Melnyk, S. and Ragatz, G. (2005). An institutional theory perspective of business continuity planning for purchasing and supply management. International Journal of Production Research, Vol. 43 No. 16,.

44
APPENDICES
APPENDIX 1 : Questionnaire
Section I : Demographic and General Information
1. Please indicate your gender
i) Male [ ] ii )Female [ ]
2. Please indicate your age category
Below 25years [ ] 26-30years [ ] 31-35 years [ ]
36- 40years [ ] 41-45 years [ ] 46years and above [ ]
3. Which Company do you work for ------------------------------------------------------
4. What position do you hold in this Company -----------------------------------------
5. How long have you been with the company------------------------------------------
6. When did your Company commence operations------------------------------------
7. What is the core business of your company. Please tick mark the appropriate box
i) Importer [ ] ii) Distributor [ ] iii) Wholesaler [ ] iv) Retailer [ ]
Do you measure Reverse Logistics costs
i) Yes [ ] ii) No [ ]
8. If the answer to the above is NO kindly tick in the appropriate box the closest answer
i) To save money. [ ]
ii) Do not see any benefit measuring. [ ]
iii) It is a negative item... [ ]
iv) Costs are estimated. [ ]
9. If the answer to question 8 above is Yes, please indicate the most measured cost element
i) Transportation Costs. [ ]
ii) Wages of particular workers. [ ]
iii) Costs of wastes [ ]

45
Materials used in repair operations [ ]
Costs of remanufacturing and repair. [ ]
Costs of packaging. [ ]
External failure/customer compensation costs. [ ]
Costs of warehousing of warranty products. [ ]
Section II: Extent of adoption of Reverse Logistics System
Please tick mark the appropriate box that best corresponds to your feeling for each statement.
Use the key 1-5 for all sections as outlined in the questionnaire where:
1) Strongly disagree 3) Neutral
2) Moderately disagree 4) moderately agree 5) strongly agree
S/NO VARIABLES 1 2 3 4 5
1 The company has a well established supply chain
2 The Company has incorporated RL practices in SC
3 RL is included in the Company Strategic Plans
4 Related equipment, facilities and infrastructure adequate
5 Support from the investors and shareholders is adequate
6 Accurate cost records of RL activities exist
7 RL activities are monitored have clear KPI measures.
8 Public awareness of effects of e-waste on environment
9 Legislation regulating e-waste disposal
10 Support from Supply Chain partners
11 RL is important relative to other Company issues
12 Company policy supports RL
13 RL is included in the Company strategic plans
14 Top management is committed to RL

46
Section III: Barriers and Drivers of Reverse Logistics adoption
Please tick mark the appropriate box that best corresponds to your feeling for each statement.
Use the key 1-5 for all sections as outlined in the questionnaire below where:
1) Is strongly disagree 3) Neutral
2) Moderately disagree 4) Moderately agree 5) Strongly agree
S/NO VARIABLES 1 2 3 4 5
1 Lack of Information and technology infrastructure is a barrier to adoption of RL
2 Lack of adequate Financial resources is a barrier to adoption of RL
3 Lack of adequate Human capital is a barrier to adoption of RL
4 Lack of RL performance metrics is a barrier to adoption of RL
5 Lack of Government incentives is a barrier to adoption of RL
6 Quality of returned products is a barrier to adoption of RL
7 Lack of collaboration between SC partners is a barrier to adoption of RL
8 Company size important is a barrier to adoption of RL
9 High Volume of reverse flow in the industry is a barrier to adoption of RL
10 Resources devoted to RL activities are barriers to adoption of RL
11 Appropriate Government incentives is a barrier to adoption of RL
12 Huge Consumer pressure is a barrier to adoption of RL
13 Public environmental awareness is a barrier to adoption of RL
14 Availability of collaborative business partners are barriers to adoption of RL

47
APPENDIX II: List of ICT firms .
1. Software Technologies 2. A to Z Technology Solutions 3. Micro skills Information Technologies Ltd 4. Peak and Dale Solutions 5. Insync Solutions Ltd 6. Oniv Computer Services Ltd 7. LanTech (Africa) Ltd 8. NCR (Kenya ) Ltd 9. Callkey ( EA) Ltd 10. Mitsumi Computer Garage Ltd 11. Datachip Ltd 12. Technology today. 13. The Copycat Ltd 14. C Hear (Kenya) Ltd 15. Office Mart 16. Microsoft Kenya 17. Skyweb Tech Ltd 18. IBM Kenya 19. Software Dynamics Ltd 20. Isat Africa Ltd 21. Crimpson Techniques 22. Nokia Solutions and Networks 23. Total Office Solutions 24. Jamii Telecommunications Ltd 25. MTN Business 26. Acess Kenya Ltd 27. Flex Communications Ltd 28. Webrunner Ltd 29. Nairobi Net (K) Ltd 30. Iway Africa 31. Pwani Telecoms Ltd 32. Softlink Otions 33. Technology Associates 34. Novel Technologies Ltd 35. My ISP 36. Smartlink Link Technologies 37. Symphony 38. IFIKA Systems Ltd 39. Virtualsat Ltd 40. YOU IT Source : CAK (2013)
48
APPENDIX III: Letter of Introduction.
ODHIAMBO JECTON KIBERENGE
Tel 0724-631-651
P.O BOX 88669-80100 MOMBASA
UNIVERSITY OF NAIROBI
SCHOOL OF BUSINESS
MOMBASA CAMPUS
THE CHIEF EXECUTIVE OFFICER
SUBJECT: REQUEST TO UNDERTAKE RESEARCH AT YOUR FIRM
I am writing to request permission to conduct a research study at your institution. I am currently enrolled in the School of Business at the University of Nairobi, and am in the process of writing my Master of Business Administration (MBA) Research Project. The study is titled “ADOPTION OF REVERSE LOGISTICS IN ICT FIRMS IN KENYA”. With your permission, I hope to undertake the project in the course of the month of September. Data will be collected through questionnaires and interviews with your senior supply chain managers. The research is aiming at examining the extent of adoption of Reverse Logistics within ICT firms in Kenya. Its objective is to establish to what extent reverse logistics has been adopted within this sector, to identify the drivers and barriers that firms face in the adoption of Reverse Logistics in this sector and establish any challenges thereof. The information that you will give in the course of this survey will be kept confidential, and shall be strictly used for academic purposes only. We thank you in advance for your permission.
Yours Obediently
O J KIBERENGE (STUDENT)
MR. JOB MWANYOTA (PROJECT SUPERVISOR)