adoption of maize production technologies in central tanzania · adoption of maize production...
TRANSCRIPT

Adoption of
Maize Production
Technologies in
Central TanzaniaAloyce R.M. Kaliba,
Hugo Verkuijl,
Wilfred Mwangi,
Angello J.T. Mwilawa,
Ponniah Anandajayasekeram,
and Alfred J. Moshi
October 1998
CIMMYTSustainable
Maize and WheatSystems for the Poor

31
Adoption of Maize
Production Technologies in
Central Tanzania
By
Aloyce R.M. Kaliba,
Hugo Verkuijl,
Wilfred Mwangi,
Angello J.T. Mwilawa,
Ponniah Anandajayasekeram,
and Alfred J. Moshi *
October 1998
* Aloyce Kaliba and Angello Mwilawa are with the Livestock Production Research Institute, Mpapwa, Tanzania.Hugo Verkuijl and Wilfred Mwangi are with the Economics Program of the International Maize and WheatImprovement Center (CIMMYT) and are based in Addis Ababa, Ethiopia. Ponniah Anandajayasekeram is with theSouthern Africa Centre for Coordination of Agricultural and Natural Resources Research and Training, Gaborone,Botswana. Alfred J. Moshi is with the Ministry of Agriculture Research and Training Institute, Ilonga, Tanzania.The views presented in this paper are those of the authors and do not necessarily reflect policies of theirrespective institutions.

CIMMYT is an internationally funded, nonprofit scientific research and training organization. Headquartered inMexico, the Center works with agricultural research institutions worldwide to improve the productivity andsustainability of maize and wheat systems for poor farmers in developing countries. It is one of 16 similar centerssupported by the Consultative Group on International Agricultural Research (CGIAR). The CGIAR comprises over50 partner countries, international and regional organizations, and private foundations. It is co-sponsored by theFood and Agriculture Organization (FAO) of the United Nations, the International Bank for Reconstruction andDevelopment (World Bank), the United Nations Development Programme (UNDP), and the United NationsEnvironment Programme (UNEP).
Financial support for CIMMYT’s research agenda currently comes from many sources, including governments andagencies of Australia, Austria, Bangladesh, Belgium, Bolivia, Brazil, Canada, China, Colombia, Denmark, France,Germany, India, Iran, Italy, Japan, the Republic of Korea, Mexico, the Netherlands, Norway, Pakistan, thePhilippines, Portugal, South Africa, Spain, Sweden, Switzerland, Thailand, the United Kingdom, Uruguay, andthe USA, along with (among others) Cornell University, the European Union, the Ford Foundation, GrainsResearch and Development Corporation, the Inter-American Development Bank, the International DevelopmentResearch Centre, International Fund for Agricultural Development, Kellogg Foundation, Leverhulme Trust,Nippon Foundation, OPEC Fund for International Development, Rockefeller Foundation, Sasakawa AfricaAssociation, Stanford University, Tropical Agriculture Research Center (Japan), UNDP, University of Wisconsin,and the World Bank.
International Maize and Wheat Improvement Center (CIMMYT) 1998.
Printed in Mexico.
Correct citation: Kaliba, A.R.M., H. Verkuijl, W. Mwangi, A.J.T. Mwilawa, P. Anandajayasekeram, and A.J.Moshi. 1998. Adoption of Maize Production Technologies in Central Tanzania. Mexico, D.F.: InternationalMaize and Wheat Improvement Center (CIMMYT), the United Republic of Tanzania, and the Southern AfricaCentre for Cooperation in Agricultural Research (SACCAR).
Abstract: This study of the adoption of maize production technologies in Central Tanzania forms part of a largerstudy to evaluate the impact of maize research and extension throughout Tanzania over the past 20 years. Usinga structured questionnaire, researchers and extension officers interviewed farmers in June–November 1995.Survey data were grouped by agroecological zone: the lowlands, intermediate zone, and highlands. A two-stageleast squares procedure was used to analyze factors affecting farmers’ allocation of land to improved maizevarieties and use of inorganic fertilizer across zones. Germplasm characteristics, production potential of the area,and extension were the most important factors affecting the amount of land allocated to improved maize and useof inorganic fertilizer. Later maturity in a variety increased the probability that a farmer would plant improvedmaize by about 22%. Extension increased the probability of allocating land to improved maize by about 14% andincreased the probability of using fertilizer by 115%. Several issues require closer attention from research,extension, and policy makers. Research and extension efforts need to be linked and strengthened to increase theflow of information to farmers. In developing improved maize varieties, researchers must consider yield as well asother important traits: drought resistance/tolerance, resistance to storage pests, shelling quality, and taste. Forthis to occur, farmers must participate in the research process. The formal credit system needs to be altered toaddress the credit problems faced by small-scale farmers. A more efficient marketing system for inputs andoutputs would benefit farmers by providing higher maize prices and reducing fertilizer costs. Such a system wouldrequire supporting policies from the government. Studies of the economics of seed and fertilizer use should beundertaken, especially now that input and output markets have been liberalized.
ISBN: 970-648-012-9AGROVOC descriptors: Tanzania; Maize; Zea mays; Varieties; Plant production; Seed production; Seed
industry; Production factors; Production economics; Input output analysis; Socioeconomic environment;Development policies; Marketing policies; Credit policies; Demography; Land resources; Land use;Cultivation; Cropping patterns; Cropping systems; Crop management; Mechanization; Plant breeding;Shelling; Drought resistance; Pest resistance; Inorganic fertilizers; Fertilizer application; Prices; Diffusion ofresearch; Extension activities; Economic analysis; Economic viability; Technology transfer; Innovationadoption; Small farms; Environments; Lowland; Highlands; Research projects
Additional keywords: Central Tanzania; Agroecological zones; CIMMYT; SACCAR; Ministry of Agriculture,Research and Training Institute; Tobit analysis; Probit analysis
AGRIS Category Codes: E16 Production Economics, E14 Development Economics and PoliciesDewey decimal classification: 338.16

Contents
Tables ............................................................................................................................ ivFigures ............................................................................................................................ vAbbreviations and Acronyms............................................................................................ viAcknowledgments .......................................................................................................... viiExecutive Summary ....................................................................................................... viii
1.0 Introduction ............................................................................................................ 11.1 Motivation and Objectives for This Study ............................................................................. 11.2 The Study Area ................................................................................................................ 21.3 Methodology .................................................................................................................... 3
2.0 Maize Research and Development in Tanzania and the Study Area .............................. 72.1 Maize Research in Tanzania ............................................................................................... 72.2 The Maize Seed Industry in Tanzania .................................................................................. 82.3 Maize Production Technology Recommendations ................................................................. 9
3.0 Demographic and Socioeconomic Characteristics in the Study Area .......................... 113.1 Demographic Characteristics ............................................................................................ 113.2 Land Resources and Allocation ........................................................................................ 113.3 Livestock Ownership ....................................................................................................... 133.4 Farm Mechanization........................................................................................................ 13
4.0 Maize Production, Crop Management, and Marketing in the Study Area .................... 144.1 Crops and Cropping System ............................................................................................ 144.2 Maize Crop Management Practices ................................................................................... 144.3 Harvesting, Transportation, and Storage of Maize .............................................................. 184.4 Seed Selection and Recycling ........................................................................................... 184.5 Maize Cropping Calendar for the Central Zone.................................................................. 19
5.0 Farmers’ Adoption/Disadoption of Improved Maize .................................................. 205.1 Current Varieties Grown .................................................................................................. 205.2 Preferred Improved Maize Varieties and Reasons for Farmers’ Preferences .......................... 205.3 Disadoption of Improved Maize ........................................................................................ 21
6.0 Credit and Extension Services ................................................................................ 226.1 Credit Availability ............................................................................................................ 226.2 Extension Services .......................................................................................................... 22
7.0 Factors Affecting Adoption of Agricultural Technologies in the Study Area ................ 247.1 Definitions ...................................................................................................................... 247.2 Rate of Adoption of Improved Maize Varieties in Central Tanzania ...................................... 247.3 Tobit Analysis of Land Allocated to Improved Maize Varieties ............................................. 257.4 Probit Analysis of the Use of Fertilizer ............................................................................... 26
8.0 Conclusions and Recommendations ........................................................................ 278.1 Conclusions .................................................................................................................... 278.2 Recommendations .......................................................................................................... 28
References ................................................................................................................... 29
iii

iv
Tables
Table 1. Commercial maize varieties and their yield potential, Central Tanzania .................................. 9
Table 2. Fertilizer recommendations for maize by altitude, Central Tanzania ...................................... 10
Table 3. Demographic characteristics of sample households, Central Tanzania .................................. 11
Table 4. Numbers of livestock and farm tools owned by sample households in Central Tanzania ......... 13
Table 5. Maize cropping systems in the three major agroecological zones of Central Tanzania ............ 14
Table 6. Timing and method of land preparation for maize, Central Tanzania ................................... 15
Table 7. Farmers’ major agronomic practices for maize, Central Tanzania ........................................ 15
Table 8. Use of fertilizer by sample households, Central Tanzania .................................................... 16
Table 9. Fallowing and crop rotation by sample households, Central Tanzania .................................. 16
Table 10. Management of crop residue by sample households, Central Tanzania ................................. 17
Table 11. Major maize pests and diseases and their control, Central Tanzania ..................................... 17
Table 12. Maize harvesting, transport, and storage, Central Tanzania ................................................. 18
Table 13. Farmers’ seed selection criteria, Central Tanzania .............................................................. 19
Table 14. Maize cropping calendar by agroecological zone, Central Tanzania ...................................... 19
Table 15. Maize varieties and hybrids planted in 1994/95, Central Tanzania ...................................... 20
Table 16. Maize varieties/hybrids preferred by farmers, Central Tanzania ........................................... 20
Table 17. Reasons for farmers’ preferences for certain maize varieties/hybrids .................................... 21
Table 18. Maize varieties/hybrids no longer grown by farmers, Central Tanzania ................................ 21
Table 19. Sources and use of credit, Central Tanzania ....................................................................... 22
Table 20. Farmers’ sources of information about maize production technologies, Central Tanzania ....... 23
Table 21. Tobit model estimates for land allocated to improved maize varieties, Central Tanzania ......... 25
Table 22. Probit model estimates for use of fertilizer, Central Tanzania ............................................... 26
v
Figures
Figure 1. Central Tanzania ............................................................................................................... 3
Figure 2. Trends in farm size and maize area, lowlands, Central Tanzania .......................................... 12
Figure 3. Trends in farm size and maize area, intermediate zone, Central Tanzania ............................. 12
Figure 4. Trends in farm size and maize area, highlands, Central Tanzania ......................................... 12
Figure 5. Rate of adoption of improved maize, Central Tanzania ....................................................... 25
vi
Abbreviations and Acronyms
AEZ Agroecological zoneCAN Calcium ammonium nitrateCIMMYT Centro Internacional de Mejoramiento de Maíz y Trigo
(International Maize and Wheat Improvement Center)DRT Department of Research and TrainingFSD Food Security DepartmentFSR Farming systems researchICW Ilonga Composite WhiteMasl Meters above sea levelMOA Ministry of AgricultureMSV Maize streak virusNGO Non-governmental organizationNMRP National Maize Research ProgrammeNPK Nitrogen, phosphorus, and potassiumP-values Standard normal probabilitySA Sulfate of ammoniaSACCAR Southern Africa Centre for Coordination of Agricultural ResearchSG-2000 Sasakawa-Global 2000St Streak resistantSTD Standard deviationTANSEED Tanzania Seed CompanyTMV Tanzania Maize VarietyTsh Tanzanian shillingsTSP Triple super phosphateUCA Ukiriguru Composite A

vii
Acknowledgments
We gratefully acknowledge support from the many individuals and institutions that enabled this study
to be conducted. The financial, institutional, and logistical support provided by the Ministry of
Agriculture and Cooperatives (MAC), SACCAR, and CIMMYT are greatly appreciated.
We thank F.M. Shao (former Commissioner for Research and Training, MAC), T.N. Kirway
(Assistant-Commissioner, FSR, MAC), and J.K. Ransom (CIMMYT, Nairobi) for technical and
logistical support. We recognize the assistance with the research and data analysis rendered by
J.K.K. Musechu and M.L. Kusekwa, Director and Zonal Research Coordinator, respectively, in the
Central Zone. Thanks are also due to the Central Zone Farming Systems Research team and
extension staff in Mpwapwa, Kondoa, and Singida Districts for conducting the survey. Great
appreciation goes to the farmers, who responded to the questions willingly and tirelessly and spared
their precious time for the interviews. We would like to thank Kelly Cassaday for editing this report.
Finally, we extend special thanks to B. Hango, C. Mbeho, and Aklilewerk Bekele for typing drafts of
this report and to Miguel Mellado and the design staff of CIMMYT for layout and production.

Executive Summary
Maize provides 60% of dietary calories and more than 50% of utilizable protein to the Tanzanian population. The
crop is cultivated on an average of two million hectares, which is about 45% of the cultivated area in Tanzania.
Recognizing the importance of the maize crop to the lives of Tanzanians, the government has committed human
and financial resources to developing the industry. A National Maize Research Programme (NMRP) was started in
1974 with the broad objective of developing cultivars suitable for major maize-producing areas. The NMRP and
maize extension services have made a considerable impact in increasing food production.
This report forms part of a larger study to evaluate the impact of maize research and extension in Tanzania over
the past 20 years. The Department of Research and Training (DRT) conducted the study in collaboration with the
Southern Africa Coordination Centre for Agricultural Research (SACCAR) and the International Maize and Wheat
Improvement Center (CIMMYT). To increase data validity and reliability, researchers and experienced extension
officers used a structured questionnaire for interviewing farmers. Interviews were conducted in all seven
agroecological zones of the country between June and November 1995. This report covers survey findings in the
Central Zone. Survey data were grouped into three agroecological zones: the lowlands, intermediate zone, and
highlands, representing Kondoa, Singida, and Mpwapwa, respectively. These are the most important maize
production zones and therefore the most important categories for the analysis. A two-stage least squares
procedure was used to analyze factors affecting farmers’ allocation of land to improved maize varieties and use of
inorganic fertilizer.
Most maize research in the Central Zone is undertaken at Ilonga Research Institute. The zone usually receives
verification and on-farm demonstration trials supervised by extension agents. The major varieties found in the
area were open pollinated materials, such as Staha, UCA, TMV1, Kilima, ICW, and Tuxpeño. Few farmers grew
hybrids such as H622, CG4141, and CG4142.
The mean age of the household head was 43 years, with an average farming experience of about 19 years.
Farmers’ levels of formal education were low, averaging about five years. Households averaged about ten persons,
with at least three permanent workers. Most farmers kept livestock, generally cattle, sheep, and goats. The hand
hoe was the major farm tool used in the study area. Animal power was used by about 30% of the farmers,
concentrated in the intermediate zone and highlands. Hiring of tractors was relatively common in the lowlands,
where extensive maize production was practiced. Land was not a limiting factor in the farming system.
Farmers in the lowlands and intermediate zone recycled maize seed for five to eight years; those in the highlands
recycled seed for eight to ten years. Seed was selected during the harvest or when maize was shelled for storage,
and selection was based on the size of the cob. Most of the selected cobs were shelled, and the seed was treated
with chemicals and/or ash and stored in gunny bags. Maize was shelled and stored in a local container called a
kihenge. The majority of farmers in the three zones treated their maize before storage.
The few farmers who obtained credit from the informal sector used it to purchase farm inputs such as fertilizer.
No farmers obtained credit from the formal sector because they lacked knowledge (information) about formal
credit and found the procedures long, cumbersome, and bureaucratic.
viii
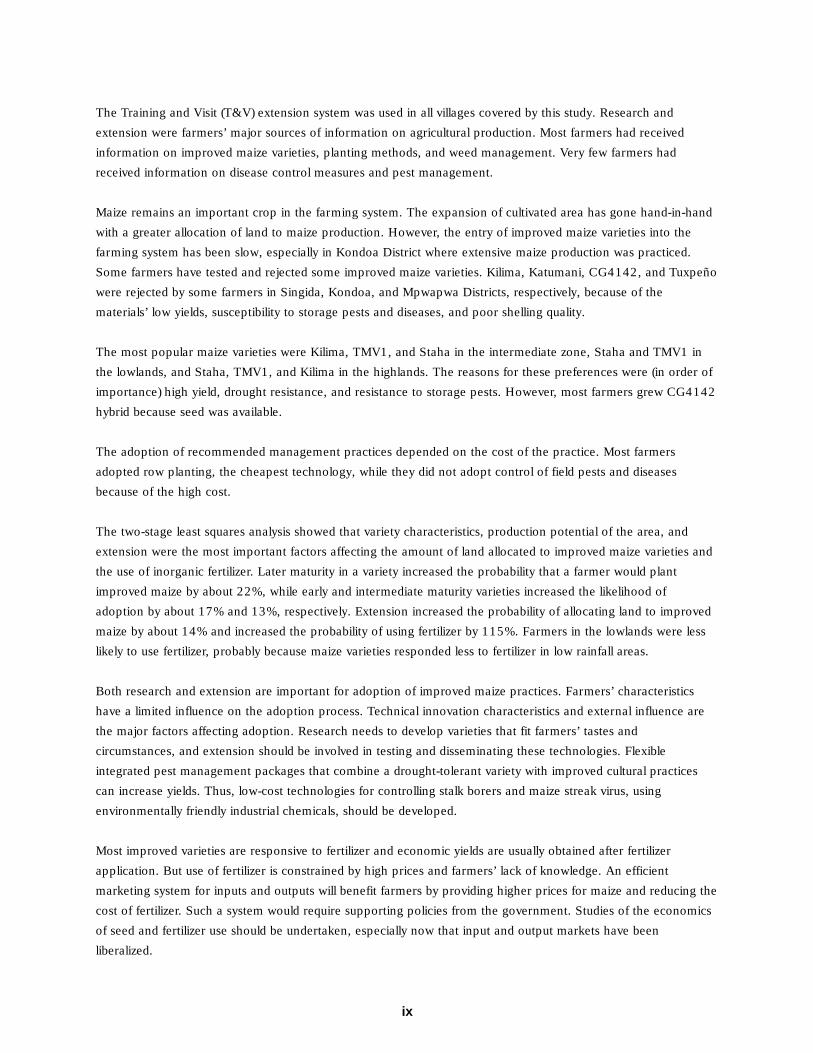
The Training and Visit (T&V) extension system was used in all villages covered by this study. Research and
extension were farmers’ major sources of information on agricultural production. Most farmers had received
information on improved maize varieties, planting methods, and weed management. Very few farmers had
received information on disease control measures and pest management.
Maize remains an important crop in the farming system. The expansion of cultivated area has gone hand-in-hand
with a greater allocation of land to maize production. However, the entry of improved maize varieties into the
farming system has been slow, especially in Kondoa District where extensive maize production was practiced.
Some farmers have tested and rejected some improved maize varieties. Kilima, Katumani, CG4142, and Tuxpeño
were rejected by some farmers in Singida, Kondoa, and Mpwapwa Districts, respectively, because of the
materials’ low yields, susceptibility to storage pests and diseases, and poor shelling quality.
The most popular maize varieties were Kilima, TMV1, and Staha in the intermediate zone, Staha and TMV1 in
the lowlands, and Staha, TMV1, and Kilima in the highlands. The reasons for these preferences were (in order of
importance) high yield, drought resistance, and resistance to storage pests. However, most farmers grew CG4142
hybrid because seed was available.
The adoption of recommended management practices depended on the cost of the practice. Most farmers
adopted row planting, the cheapest technology, while they did not adopt control of field pests and diseases
because of the high cost.
The two-stage least squares analysis showed that variety characteristics, production potential of the area, and
extension were the most important factors affecting the amount of land allocated to improved maize varieties and
the use of inorganic fertilizer. Later maturity in a variety increased the probability that a farmer would plant
improved maize by about 22%, while early and intermediate maturity varieties increased the likelihood of
adoption by about 17% and 13%, respectively. Extension increased the probability of allocating land to improved
maize by about 14% and increased the probability of using fertilizer by 115%. Farmers in the lowlands were less
likely to use fertilizer, probably because maize varieties responded less to fertilizer in low rainfall areas.
Both research and extension are important for adoption of improved maize practices. Farmers’ characteristics
have a limited influence on the adoption process. Technical innovation characteristics and external influence are
the major factors affecting adoption. Research needs to develop varieties that fit farmers’ tastes and
circumstances, and extension should be involved in testing and disseminating these technologies. Flexible
integrated pest management packages that combine a drought-tolerant variety with improved cultural practices
can increase yields. Thus, low-cost technologies for controlling stalk borers and maize streak virus, using
environmentally friendly industrial chemicals, should be developed.
Most improved varieties are responsive to fertilizer and economic yields are usually obtained after fertilizer
application. But use of fertilizer is constrained by high prices and farmers’ lack of knowledge. An efficient
marketing system for inputs and outputs will benefit farmers by providing higher prices for maize and reducing the
cost of fertilizer. Such a system would require supporting policies from the government. Studies of the economics
of seed and fertilizer use should be undertaken, especially now that input and output markets have been
liberalized.
ix

In developing improved maize varieties, apart from increasing yields, other factors should be taken into
consideration. These factors include drought resistance/tolerance, resistance to storage pests, shelling quality, and
taste. For this to occur, farmers must participate in the research process. Research and extension efforts need to
be linked and strengthened to increase the flow of information to farmers. In collaboration with the government
and other stakeholders, the formal credit system needs to address the credit problems faced by small-scale
farmers, especially their lack of knowledge (information) of formal credit systems. Cumbersome bureaucratic
procedures for obtaining credit should be amended. The formation of farmer credit groups should be encouraged,
because lending to groups tends to reduce transactions costs and improve the rate of loan recovery.
x

1
Adoption of Maize ProductionTechnologies in Central Tanzania
Aloyce R.M. Kaliba, Hugo Verkuijl, Wilfred Mwangi, Angello J.T. Mwilawa,Ponniah Anandajayasekeram, and Alfred J. Moshi
1.0 Introduction
1.1 Motivation and Objectives for This Study
Maize is the major cereal consumed in Tanzania. It is estimated that the annual per capitaconsumption of maize in Tanzania is 112.5 kg; national maize consumption is estimated to be threemillion tons per year. Maize contributes 60% of dietary calories to Tanzanian consumers (FSD 1992,1996). The cereal also contributes more than 50% of utilizable protein, while beans contribute only38% (Due 1986). Maize is grown in all 20 regions of Tanzania. The crop is grown on an average oftwo million hectares or about 45% of the cultivated area in Tanzania. However, most of the maize isproduced in the Southern Highlands (46%), the Lake zone, and the Northern zone. Dar es Salaam,Lindi, Singida, Coast, and Kigoma are maize-deficit regions. Dodoma is a surplus region during goodgrowing years, and in years following a plentiful rainfall the region is the number one supplier ofmaize to Dar es Salaam (FSD 1992; Mdadila 1995).
Maize is not only a staple crop in surplus regions but a cash crop as well. For instance, in the Lakezone, maize competes aggressively with cotton for land, labor, and farmers’ cash. Realizing theimportance of the maize crop to lives of Tanzanians, the government has been committing humanand financial resources to develop the industry. Research and extension efforts in maize started in1960. Breeding efforts in the 1960s resulted in the release of Ukiriguru Composite A (UCA) andIlonga Composite White (ICW). Between 1973 and 1975 Tanzania experienced a severe foodshortage because of drought and the “villagization” campaign, which displaced farmers. The foodcrisis prompted the nation to launch several campaigns with the objective of food self-sufficiency,including “agriculture for survival” (kilimo cha kufa na kupona). The country also initiated a maizeproject in 1974 with assistance of the U.S. Agency for International Development (USAID). Theproject’s objective was to promote maize production in pursuit of food self-sufficiency. The NationalMaize Research Programme (NMRP) was launched, with the broad objective of developing cultivarssuitable for major maize-producing areas.
The NMRP and maize extension have made a considerable impact in increasing food production. Thisstudy was conducted to evaluate that impact during the past 20 years. Conducted by the Departmentof Research and Training (DRT) in collaboration with the Southern Africa Coordination Centre forAgricultural Research (SACCAR) and the International Maize and Wheat Improvement Center(CIMMYT), the study included the nation’s seven agroecological zones. The study was conductedbetween June and November 1995. This report covers the survey findings from the Central Zone.The objectives of the study were to describe the maize farming systems of the zone, evaluate theadoption of improved maize production technologies, and identify future issues for research.

2�����
�������������������
����
�������
�
����
1.2 The Study Area
Figure 1 shows the location of the Central zone in Tanzania. The Central Zone comprises Dodomaand Singida administrative regions, which are part of the semi-arid zone. Rainfall in the area iserratic. About 85% of the rain falls between January and March. Rains generally fall in short intervalsand average 600 mm per annum.
The vegetation of the Central Zone can be categorized into four groups: bushland, woodland,wooded grassland, and grassland. Topographically, the zone is characterized by plains with scatteredinselbergs, ridges, or rows of hills. The region’s economy depends entirely on crop production andlivestock. Agriculture is still characterized by low productivity. Although livestock production is stilllargely a subsistence enterprise, the Central Zone is one of the principal livestock-producing areas inthe country.
It is difficult to classify the zone into distinct, contiguous agroecological areas using altitude andrainfall as criteria because of the undulating topography and varying rainfall. However, four majorfarming systems can be identified: the maize and groundnut system; the sorghum, pearl millet, andgroundnut system; the rice farming system; and the peri-urban livestock production system.
Figure 1. Central Tanzania.
Central zoneWestern zone
Eastern zone
LAKE NYASA
LAKE VICTORIA
LAKE TANGANYIKA
LAKE
RUKWA
Bukoba
Shinyanga
Musoma
Mwanza
MoshiArusha
TangaTabora
Dodoma
Morogoro Dar esSalaam
Lindi
Mtwara
TunduruSongea
Mbeya
Iringa
Kigoma

3
Maize and groundnut farming is found in the northern and northwestern part of the zone andcovers most of Iramba District, the Kondoa lowlands, and northeastern Mpwapwa District. Annualrainfall surpasses 750 mm. Major crops, in order of importance, are sorghum, pearl millet, maize,and natural pastures and forages. Minor crops, in order of importance, include oilseeds (sunflowerand simsim), cassava, sweet potatoes, finger millet, and horticultural crops (mainly onions andtomatoes).
The sorghum, pearl millet, and groundnut farming system covers most of the central andwestern part of the Central Zone. Elevation ranges from 500 masl to 1,000 masl, and annual rainfallis between 400 mm and 600 mm. Major crops, in order of importance, are maize, grain legumes,tubers (cassava and sweet potatoes), finger millet, and natural pastures and forages.
Irrigated rice production is found inside the west lift valley, in some valley bottoms with blackcotton soils, and along permanent rivers. Rainfall is between 500 mm and 800 mm per year. Themajor crops, in order of importance, are sorghum and pearl millet. Minor crops, in order ofimportance, are maize, grain legumes, roots, tubers (cassava and sweet potatoes), and horticulturalcrops (onion).
Peri-urban livestock production systems are found in all peri-urban areas (around Dodoma,Singida, Kondoa, Mpwapwa, and Manyoni townships). Major crops, in order of importance, areimproved pastures and forages for zero-grazing, maize, and grapes (specialty crops for Dodoma).Minor crops, in order of importance, include grain legumes, watermelons, and sunflowers.
1.3 Methodology
1.3.1 Sampling ProcedureThe number of farmers interviewed in the nationwide survey was determined by the importance ofmaize production in a given zone. About 1,000 maize farmers were interviewed nationwide. CentralZone was allocated 54 farmers, approximately 5% of the national sample.
Central Zone farmers were sampled from districts that are important for maize production.Production figures from the statistical unit of the Ministry of Agriculture (MOA) were used to establishthe relative importance of each district for maize production. Three districts were purposivelyselected for the Central Zone survey, and three villages were randomly selected from these districts.The selected sites were:♦ Ihanda Village, located in Mpwapwa District, which is characterized by relatively high rainfall
and elevation, and has high potential for maize production♦ Mudida Village, located in Singida Rural District, which is characterized by medium rainfall and
medium elevation and has a medium potential for maize production♦ Mwailanje Village, located in Kondoa District, which is characterized by low rainfall and low
elevation and has low potential for maize production
From each village, 18 farmers were randomly sampled from the register of households.

4
To increase data validity and reliability, farmers were interviewed by researchers and experiencedextension officers using a structural questionnaire developed by a panel of the zonal farming systemsresearch economists, CIMMYT and SACCAR economists, and national maize breeders andagronomists. The interviews were conducted between June and November 1995. To maintainuniformity, data from all zones were compiled at Selian Agricultural Research Institute (SARI) and thensent back to the respective zones for analysis and completion of the reports.
1.3.2 Analytical FrameworkFactors influencing the adoption of new agricultural technologies can be divided into three majorcategories: farm and farmers’ associated attributes; attributes associated with the technology (Adesinaet al. 1992; Misra et al. 1993); and the farming objective (CIMMYT 1988). Factors in the firstcategory include a farmer’s education, age, or family and farm size. The second category depends onthe type of technology (e.g., the kind of characteristics a farmer likes in an improved maize variety).The third category assesses how different strategies used by the farmer, such as commercial versussubsistence farming, influence the adoption of technologies. In this study a two-stage least squaresanalysis is used to test factors affecting the allocation of land to improved maize varieties (intensity ofadoption) and adoption of inorganic fertilizer (incidence of adoption). The basic assumption is that afarmer first tests and adopts improved seed by planting it on part of his or her land designated formaize production, and then decides to use fertilizer. The tobit (Tobin 1958) and probit (McFadden1981) models, which test the factors affecting intensity and incidence of adoption, can be specified as:
Yij = βij Xij + εii > 1 if farmer grows improved maize variety; j = 0 otherwise
Yij = βij Xij + αii = 1 if farmer uses fertilizer; j = 0 otherwise
where:Y = the proportion of maize area allocated to improved maize varieties or adoption of
inorganic fertilizer;β = the parameters to be estimated; andεi and αi = error terms.
The models were further specified as:
PLAND = A+EXP+EDVC+WID+EXI+LAB+VA1+VA2+VA3+AEZ1+AEZ2+AEZ3+εiFERT = A+EXP+EDVC+WID+EXI+LAB+IMR+VA1+VA2+VA3+AEZ1+AEZ2+AEZ3+αi
where:
PLAND = proportion of maize area allocated to improved maize varieties (average for 1992-94).FERT = use fertilizer (FERT=1 if used fertilizer; 0 otherwise) for the same period.
5
A = constant.EXP = household head experience of farming (years).EDVC = education level of household head (years).WID = wealth index.EXI = intensity of extension index.LAB = number of adults in the household (15 and above years).IMR = Inverse Mills ratio of equation PLAND.VA1-3 = group of improved maize varieties (VA1=1 if farmer grows the variety in group 1, VA1 =
0 otherwise). The varieties were grouped according to months to maturity. Group one(VA1) consists of Katumani and Kito (3 months); group two (VA2), of TMV1, Staha,Tuxpeño, and ICW (3.5-4 months); group three (VA3), of UCA and Kilima (4.5-5months).
AEZ1-3 = lowland, intermediate, and highland zones (AEZ1=1 if the farmer is in the lowlands,AEZ1=0 otherwise). The highland zone (AEZ3) was not included in the models to avoidmulticollinearity (Griffiths et al. 1993; Greene 1993).
εi and αi = error terms.
Formation of the model was influenced by a number of working hypotheses. It was hypothesized thata farmer’s decision to adopt or reject a new technology at any time is influenced by the combined(simultaneous) effects of a number of factors related to the farmer’s objectives and constraints. Thefollowing variables were hypothesized to influence the adoption of improved maize technologies:
Farmer’s experience: An experienced farmer is hypothesized to be more likely to adopt animproved maize technology package.
Household head received education: Exposure to education will increase a farmer’s ability toobtain, process, and use information relevant to the adoption of an improved maize variety. Henceeducation will increase the probability that a farmer will adopt an improved maize technologypackage.
Labor: Large households will be able to provide the labor that might be required by improved maizetechnologies. Thus, household size would be expected to increase the probability that a farmer willadopt an improved maize technology package.
Wealth index: Wealthier farmers may have the means of buying improved maize technology, sowealth is expected to be positively associated with the decision to adopt an improved maizetechnology package.
Extension intensity: Agricultural extension services provided by the Ministry were the major sourceof agricultural information in the study area. Hence, it is hypothesized that contact with extensionworkers will increase the likelihood that a farmer will adopt improved maize technologies.
Inverse Mills ratio: Adoption of improved seed enhances the use of inorganic fertilizer.

6
Agroecology: The agroecological zones can influence a farmer’s decision to adopt improved maizetechnology package both positively and negatively.
Hotland (1993) has suggested establishing a wealth index by aggregating the major wealth indicatorsin a study area. Numbers of livestock and farm implements owned, as well as the average amount ofcultivated land, are major wealth indicators in the Central Zone. These indicators were aggregated bycalculating the wealth index (WID) as follows:
nYiWID = Σ —— (i=1,…,5; j=1,2,…,N)
i=1 Yij
where:Yi = the average number of livestock units, farm implements (hand hoes, axes, cutting
equipment) and cultivated land for the past three years;Yij = the sample mean for each item; andN = the sample size.
Extension services were the major source of information in the study area for improved agriculturalpractices. The number of recommendations with which a farmer is familiar can be used as an indexof the transfer of information from extensionists to farmers. The extension index (EXT) wascalculated as follows:
nEXT = ——
6
where:n = the number of recommendations that a farmer knows from the improved technology
package (i.e., improved seed, row planting, fertilizer application, ox-plowing, field pest anddisease control).
The PLAND equation was estimated using the tobit model (Tobin 1958). The inverse Mills ratio forequation PLAND was calculated and included as a regressor in equation FERT to correct forcorrelation between PLAND and FERT equation errors. Quasi-maximum likelihood was not usedbecause of the problem of convergence (Saha and Love 1992). Both models were estimated usingTSP, Version 4.3.

7
2.0 Maize Research and Development in Tanzania and the Study Area
2.1 Maize Research in Tanzania
About 85% of the maize produced in Tanzania is grown by peasants whose farms are less than 10ha. Ten percent of maize production occurs on medium-scale commercial farms (10-100 ha), and theremaining 5% occurs on large-scale commercial farms (>100 ha). Between 1961-65 and 1985-95,national maize production is estimated to have grown by 4.6%, of which 2.4% can be attributed togrowth in area and 2.2% to growth in yield. Despite this yield growth, average yields are less than1.5 t/ha, although grain yields tend to be higher in high-potential areas such as the SouthernHighlands (Moshi et al. 1990).
Maize breeding and agronomy trials have been conducted in Tanzania for more than 20 years. Theimproved open pollinated varieties (OPVs) ICW and UCA were developed, tested, and released in the1960s and are still widely used. During the same period, a few research stations undertookagronomy research, which later formed the basis for recommendations that were applied to theentire country.
In 1974, the NMRP was launched to coordinate maize research and encourage the better utilizationof some resources. The program is responsible for coordinating all phases of maize research, fromvarietal development and maize management research on station to verification on farmers’ fields.The NMRP has divided the country into three major agroecological zones for varietalrecommendations:♦ The highlands (elevations above 1,500 masl), with a growing period of 6-8 months.♦ The intermediate (or midalatitude) zone (900-1,500 masl), which is further subdivided into “wet”
(>1,100 mm rainfall, with a 4-5 month growing period) and “dry” subzones (<1,100 mmrainfall, with a 3-4 month growing period).
♦ The lowlands (0-900 masl), with a 3-4 month growing period.
To date, several breeding populations have been developed and are being improved throughrecurrent selection for specific traits. Since 1974, two hybrids and six OPVs have been released. In1976, Tuxpeño was released for the lowland areas. Hybrids H6302 and H614, suitable for thehighlands, were released in 1977 and 1978, respectively. In November 1983, three OPVs werereleased: Kito, Kilima, and Staha. Staha is characterized by its tolerance to maize streak virus (MSV)disease, whereas Kilima was recommended for the midaltitude zone. Kito is an early maturing varietyadapted to both lowland and midaltitude zones. In 1987 two OPVs, TMV1 and TMV2, werereleased. TMV1 has white, flinty grain, is streak resistant, and has intermediate maturity. It isrecommended for the lowland and midaltitude zones. TMV2 is also a white flint maize and isrecommended for the high-altitude and high-potential maize-producing areas.
In 1994, the NMRP released versions of Kilima, UCA, Kito, and Katumani that are resistant to MSV:Kilima-St, UCA-St, Kito-St, and Katumani-St. Around the same time, two foreign seed companies,Cargill and Pannar, introduced or released seven hybrids for commercial use. For improvement of

8
husbandry practices, the NMRP conducted off-station agronomy trials that in 1980 resulted in maizeproduction recommendations specific to 11 regions. The recommendations related to choice ofvariety, plant spacing, plant density, fertilizer rate, weeding regime, and pesticide use.
2.2 The Maize Seed Industry in Tanzania
The hybrids CG4141 and CG4142 are multiplied and distributed by Cargill Hybrid Seed Ltd., whichis based in Arusha. About 72% of the farmers in the lowland and intermediate zones grew CG4142,whereas only 22% of the farmers in the highlands grew CG4142. The locally bred hybrids H622 andH632 are not grown by farmers in Central Tanzania, even though they have flint grain and goodpounding and storage qualities, and yield as well as CG4141 and CG4142. Locally bred hybrids aremarketed mainly by the Tanzania Seed Company (TANSEED), which has not done well in the newlycompetitive seed industry. This has contributed to the lack of adoption of locally bred hybrids inCentral Tanzania. Before input markets were liberalized in 1990, locally bred varieties were almostthe only improved maize seed planted in Tanzania.
After market liberalization, private companies not only engaged in seed multiplication but conductedtrials to evaluate the adaptability of imported varieties to the local environment. The varieties deemedsuitable are subsequently released to farmers. CG4141 is competing aggressively with the locallybred cultivars multiplied and sold by TANSEED. Pannar started producing and marketing maize seedin 1995. The new companies have recruited chains of stockists who sell their seed in villages andtowns, and TANSEED has followed suit. Farmers have reported that seed sold by private companiesis purer, more uniform, and higher yielding than seed from TANSEED, which has reduced demandfor TANSEED products.
The drawbacks of the new varieties sold by Cargill and Pannar are their high price, poor storability,poor pounding quality, and unsatisfactory taste. Pounded maize is used to make a local dish preparedfrom grain from which the seed coat has been removed (kande). Some farmers also pound theirmaize before milling to make a whiter and softer dough (ugali). When pounded, maize seed with asoft seed coat breaks, and flour losses before milling are greater. This underscores the importance ofthe flint trait in farmers’ varietal preferences.
The latest development in the maize seed industry is the resumed importation of a once-famoushybrid, H511, from Kenya, by the Tanganyika Farmers’ Association (TFA). H511 yields as well andmatures as early as CG4141; its advantage over CG4141 is its flinty grain. The 1994/95 price forCargill maize seed (CG4141) and Pannar seed (PAN 6481) was Tanzanian shillings (Tsh) 650/kg,while Kilima, a composite, sold at Tsh 450/kg. The high prices of maize seed have forced manyfarmers to recycle hybrid seed.
Before market liberalization, quasi-governmental institutions and cooperative unions monopolizedinput marketing. These institutions were inefficient in delivering inputs to farmers. They sufferedfrom chronic liquidity problems, because they depended on borrowing money for buying inputs. This

9
led to delayed input supply and chronic shortages that served as a disincentive to farmers (Mbiha1993; Nkonya 1994). Market liberalization has led to a rapid increase in the number of privatebusinesses that engage in input marketing. Farmers could obtain inputs from village stockists who arelocated much closer to them than prior to 1990. Inputs have also become readily available on timein villages. As expected, the price of inputs has increased sharply, wiping out the shortages thatexisted before.
2.3 Maize Production Technology Recommendations
2.3.1 VarietiesMaize production recommendations were developed to fit the three agroecological zones describedearlier. Several OPVs developed in Tanzania and Kenya have been introduced in the midaltitude andlow altitude zones of central Tanzania: Staha, UCA, Katumani, TMV I, Kito, Kilima, ICW, andTuxpeño. Three hybrids have been introduced for these zones: H522, CG4141, and CG4142.Table 1 shows the yield potential and attributes of some of the materials recommended for theCentral Zone.
2.3.2 Planting time, planting method, and spacingThe recommended planting time in Central Zone is after the rains begin, which usually occurs inNovember and December. It is recommended that maize flowering should occur when there is lessmoisture. Row planting is recommended to achieve the desirable plant population. Spacing dependson the maturity of the variety. Medium maturity and full-season varieties should have a spacing of 90cm x 50 cm and two plants per hill, or 75 cm x 60 cm and two plants per hill, for a population of44,444 plants/ha. Spacing also depends on the time to maturity of the variety grown. Earlymaturing varieties, such as Katumani, should be spaced like the medium maturity varieties, butfarmers should have three plants per hill for a population of 66,666 plants/ha.
2.3.3 Fertilizer type, timing, and method of applicationTo provide nitrogen (N) one can either use urea, calcium ammonium nitrate (CAN), or sulfate ofammonia (SA). Nitrogen may be split into two applications, with 30-50% of the total amount beingapplied at planting and the remainder when maize is about one meter high.
Table 1. Commercial maize varieties and their yield potential, Central Tanzania
Variety Major attributes Target zone Potential yield (t/ha)
TMV-1 Streak resistant, medium maturity, yield Low, medium 4.25Staha Streak tolerant, yield Lowlands 4.00Tuxpeno Good standability Lowlands 3.75Kito Early maturity Lowlands 2.50Kilima Good standability, yield Medium 4.5–6.25CG4141 High yielding, resistant to leaf and cob disease Low, medium 4.5–6.25H614 High yielding, takes 120–180 days to mature High, intermediate 5.0–7.0H6302 High yielding takes 180 days to mature Low, intermediate 6.0–8.0

10
Table 2 summarizes the fertilizer recommendations for maize by agroecological zone. For low altitudeareas, 40 kg N/ha is recommended. For areas receiving more than 800 mm of rainfall per annum, arate of 80-112 kg N/ha is recommended. Phosphorus (P) is deficient throughout the zone, and triplesuper phosphate (TSP) is recommended as basal fertilizer. The amount recommended is up to 40 kgP2O5/ha. Fertilizer is normally placed 5 cm below the depth of the seed and about 5 cm to the side.This is accomplished by digging a single hole beside each seed and placing fertilizer in the hole andcovering it with soil. Alternatively, a continuous furrow is made along the length of the planting row.Fertilizer is then placed in the furrow and covered with soil. The seed is then planted on top of thissoil and covered properly.
2.3.4 Weed controlIn all agroecological areas of the Central Zone,two weedings are recommended. The firstweeding should be done two weeks aftergermination and the second weeding at three tofour weeks after the first weeding. Weeding isusually done with a hand hoe.
2.3.5 Pest and disease controlImportant maize pests in the Central Zone include armyworms and stalk borers. Armyworms areserious when an outbreak occurs, but stalk borers are a serious problem for off-season maizeproduction. Thiodan can be applied against all pests.
The breeding programs have been releasing varieties that are resistant or tolerant to the mostimportant maize diseases, so there is no recommendation for chemical control against maizediseases. Maize streak virus is not yet important in the Central Zone.
2.3.6 Harvesting and storageMaize is harvested by hand immediately after it is mature and dry. Most maize is stored in gunny bagsas well as the traditional storage structure (vilindo). The important storage pests are maize weevils,and Actellic Super is the recommended for controlling them.
Table 2. Fertilizer recommendations for maize byaltitude, Central Tanzania
Optimum fertilizerrate (kg/ha)
Altitude (masl) Rainfall N P2O5
0–900 Low 0–20 0–20900–1,500 Medium 20–100 20–40>1,500 High 20–50 20–40

11
3.0 Demographic and SocioeconomicCharacteristics in the Study Area
3.1 Demographic Characteristics
Table 3 summarizes the household characteristics of sample farmers in the Central Zone. The meanage of household heads in the study area was 43 years. Farmers in the lowlands tended to beyounger than those in the other two zones, although the age difference was not significant (p =0.05). On average farmers have lived in the sampled villages for about 23 years, and their farmingexperience was about 19 years. The level of education for household heads was about five years andno significant difference was found among the agroecological zones.
The average size of the households was about 10 members, including three male adults, two femaleadults, and five children. The number of female adults in the lowlands was significantly lower (p =0.05) than in the other two zones. At least three male adults and two female adults worked on thefarm permanently, although a few respondents indicated that some household members worked offof the farm. Those who worked off of the farm were temporarily or permanently employed by thegovernment or non-governmental organizations (NGOs). The minimal number of part-time workersand off-farm activities is an indication of the limited off-farm opportunities in the study area.
Farmers who did have some off-farm income used the money to purchase farm inputs and capitalgoods such as hand hoes and plows (75%) and to meet other family needs (25%).
3.2 Land Resources and Allocation
The average farm size in the lowlands was about 62 acres, while the intermediate zone and highlandshad an average farm size of about 20 and 25 acres, respectively. Shifting cultivation was widelypracticed in the lowlands, since the population density was still low. There was a significantdifference (p = 0.05) between the lowland zone and the intermediate and highland zones,respectively. Cultivated area was about 41 acres in the lowlands, 18.9 acres in the intermediate zone,
Table 3. Demographic characteristics of sample households, Central Tanzania
Lowlands Intermediate zone Highlands P-values
Mean of Mean STD Mean STD Mean STD L/M L/H M/H
Age of household head (yr) 41.8 12.7 44.8 14.4 43.7 13.0 NS NS NSNumber of male adults 2.2 1.4 3.2 1.3 3.3 2.8 NS NS NSNumber of female adults 1.5 0.8 2.9 1.9 3.3 1.7 0.05 0.05 NSNumber of children 2.7 1.6 5.4 3.5 4.2 4.6 NS NS NSEducation of household head (yr) 4.7 3.2 5.3 2.4 5.1 3.1 NS NS NSFarming experience (yr) 17.3 6.2 19.2 12.6 22.6 11.6 NS NS NS
Note: NS = not significant; L/M = lowlands/intermediate zone; L/H = lowlands/highlands; M/H = intermediate zone/highlands;STD = standard deviation.

12
and 21.2 acres in the highlands. Farmers had 2.0 plots in the lowlands, 3.4 in the intermediatezone, and 3.3 in the highlands. A significant difference (p = 0.05) was found between the number ofplots in the lowlands and in the intermediate and highland zones, respectively. Across all three zones,only small portions of land were rented in (2 acres) and rented out (0.8 acres). Rented land was foundin valley bottoms that were wetter and suitable for growing vegetables.
In all zones, more than 60% of cultivated landwas allocated to maize production. Figures 2–4show trends in total farm size and maize areaover the past 20 years. In all zones, theimportance of maize in the farming system hasremained stable. Maize area increases have beenproportional to increases in total farm size.Because of changes in tastes and preferences,maize replaced the traditional sorghum and milletcrops as a major food and cash crop. In theintermediate zone, sample farmers startedgrowing improved maize varieties in the mid-1980s. Lowland and highland zone farmersstarted doing so earlier, in the mid-1970s.
Area (acres)25
20
15
10
5
01974 1984 1994
Figure 3. Trends in farm size and maize area,intermediate zone, Central Tanzania.
Farm size
Maize area
Area (acres)30
25
20
15
10
5
01974 1984 1994
Figure 4. Trends in farm size and maize area, highlands,Central Tanzania.
Farm size
Maize area
Area (acres)70
60
50
40
30
20
10
01974 1984 1994
Figure 2. Trends in farm size and maize area, lowlands,Central Tanzania.
Farm size
Maize area

13
Drought has affected maize production trends, prices, and incentives to produce the crop. Thedrought that occurred in the late 1970s caused maize prices to increase sharply, and more land wasallocated to maize production. Farmers reduced the land allocated to maize during the mid- and late1980s, mainly because of low maize prices and the inability of the Dodoma Region CooperationUnion to buy maize from the farmers. In the early 1990s, maize production increased sharply,perhaps as a result of trade liberalization, which occurred at that time, and as a result of the increasein the price of maize.
3.3 Livestock Ownership
Farmers in the intermediate zone had the highest livestock population in the Central Zone. Themean number of livestock for the sample households was 13 head of cattle, two sheep, and sevengoats. Table 4 shows numbers of livestock by zone. The farmers in the intermediate zone had asignificantly higher number of sheep (p = 0.05) than farmers in the lowland zone.
3.4 Farm Mechanization
Table 4 shows the number of farm tools owned by farmers. The number of hand hoes was highest inthe highland zone. Other farm equipment, such as machetes, axes, and knives, averaged at least oneper household. In all zones, few respondents owned tractors or carts, but tractor hire was reported by5.6% of respondents in the intermediate zone and 22.2% in the lowlands. Eleven percent of therespondents in the lowlands and highlands reported hiring plows. Animal traction was more commonin the intermediate zone than in the lowlands and highlands. Tractors and plows were hired mainlyfor land cultivation.
Table 4. Numbers of livestock and farm tools owned by sample households in Central Tanzania
Lowlands Intermediate Highlands P-values
Mean STD Mean STD Mean STD L/M L/H M/H
AnimalsGoats 7.5 7.1 10.6 9.4 7.0 9.8 NS NS NSSheep 0.3 0.8 4.7 5.1 1.4 2.9 0.05 NS NSCattle 10.6 13.6 16.9 11.8 17.7 22.6 NS NS NS
Farm toolsHand hoe 3.9 1.8 4.8 3.4 8.5 7.6 NS NS NSOx-plow 1.7 0.6 2.0 0.8 2.0 1.1 NS NS NSCutting equipment 1.0 0.0 1.7 0.6 2.25 0.5 NS 0.05 NSCart 1.0 1.4 1.1 0.3 1.0 0.0 NS NS NSTractor 1.0 1.0 1.0 — 1.0 0.7 NS NS NS
Note: NS = not significant; STD = standard deviation.
14
4.0 Maize Production, Crop Management, andMarketing in the Study Area
4.1 Crops and Cropping System
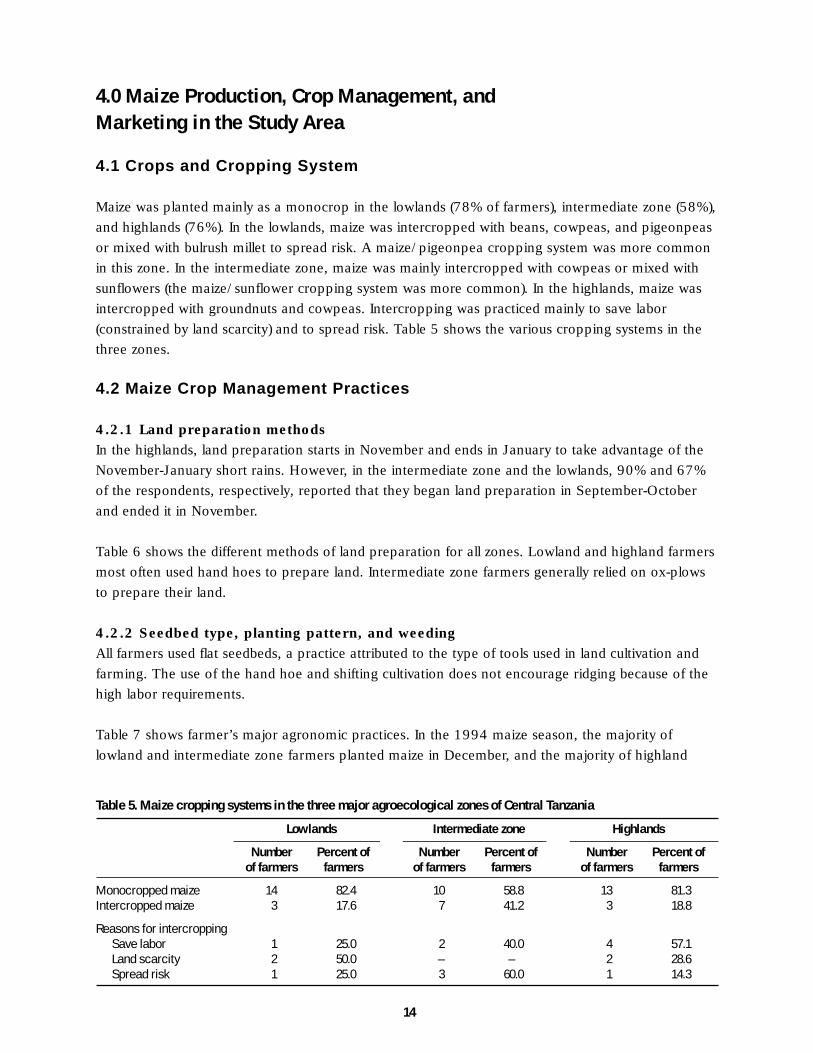
Maize was planted mainly as a monocrop in the lowlands (78% of farmers), intermediate zone (58%),and highlands (76%). In the lowlands, maize was intercropped with beans, cowpeas, and pigeonpeasor mixed with bulrush millet to spread risk. A maize/pigeonpea cropping system was more commonin this zone. In the intermediate zone, maize was mainly intercropped with cowpeas or mixed withsunflowers (the maize/sunflower cropping system was more common). In the highlands, maize wasintercropped with groundnuts and cowpeas. Intercropping was practiced mainly to save labor(constrained by land scarcity) and to spread risk. Table 5 shows the various cropping systems in thethree zones.
4.2 Maize Crop Management Practices
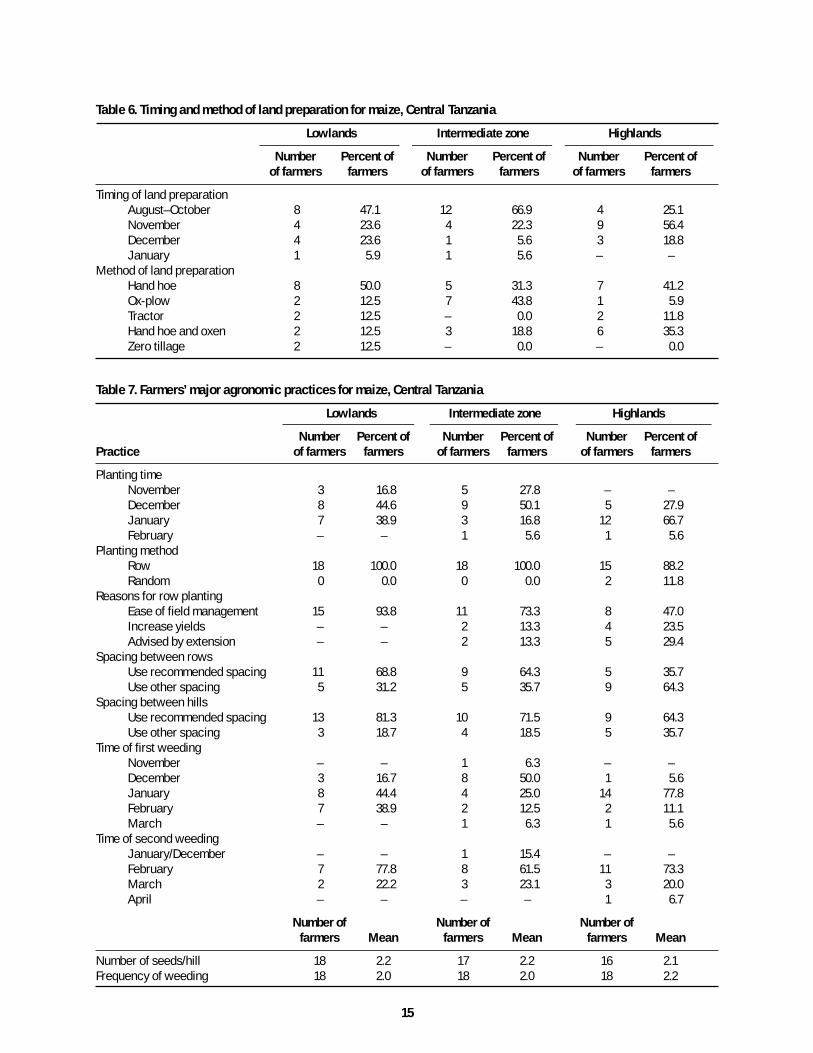
4.2.1 Land preparation methodsIn the highlands, land preparation starts in November and ends in January to take advantage of theNovember-January short rains. However, in the intermediate zone and the lowlands, 90% and 67%of the respondents, respectively, reported that they began land preparation in September-Octoberand ended it in November.
Table 6 shows the different methods of land preparation for all zones. Lowland and highland farmersmost often used hand hoes to prepare land. Intermediate zone farmers generally relied on ox-plowsto prepare their land.
4.2.2 Seedbed type, planting pattern, and weedingAll farmers used flat seedbeds, a practice attributed to the type of tools used in land cultivation andfarming. The use of the hand hoe and shifting cultivation does not encourage ridging because of thehigh labor requirements.
Table 7 shows farmer’s major agronomic practices. In the 1994 maize season, the majority oflowland and intermediate zone farmers planted maize in December, and the majority of highland
Table 5. Maize cropping systems in the three major agroecological zones of Central Tanzania
Lowlands Intermediate zone Highlands
Number Percent of Number Percent of Number Percent ofof farmers farmers of farmers farmers of farmers farmers
Monocropped maize 14 82.4 10 58.8 13 81.3Intercropped maize 3 17.6 7 41.2 3 18.8
Reasons for intercroppingSave labor 1 25.0 2 40.0 4 57.1Land scarcity 2 50.0 – – 2 28.6Spread risk 1 25.0 3 60.0 1 14.3
15
Table 6. Timing and method of land preparation for maize, Central Tanzania
Lowlands Intermediate zone Highlands
Number Percent of Number Percent of Number Percent ofof farmers farmers of farmers farmers of farmers farmers
Timing of land preparationAugust–October 8 47.1 12 66.9 4 25.1November 4 23.6 4 22.3 9 56.4December 4 23.6 1 5.6 3 18.8January 1 5.9 1 5.6 – –
Method of land preparationHand hoe 8 50.0 5 31.3 7 41.2Ox-plow 2 12.5 7 43.8 1 5.9Tractor 2 12.5 – 0.0 2 11.8Hand hoe and oxen 2 12.5 3 18.8 6 35.3Zero tillage 2 12.5 – 0.0 – 0.0
Table 7. Farmers’ major agronomic practices for maize, Central Tanzania
Lowlands Intermediate zone Highlands
Number Percent of Number Percent of Number Percent ofPractice of farmers farmers of farmers farmers of farmers farmers
Planting timeNovember 3 16.8 5 27.8 – –December 8 44.6 9 50.1 5 27.9January 7 38.9 3 16.8 12 66.7February – – 1 5.6 1 5.6
Planting methodRow 18 100.0 18 100.0 15 88.2Random 0 0.0 0 0.0 2 11.8
Reasons for row plantingEase of field management 15 93.8 11 73.3 8 47.0Increase yields – – 2 13.3 4 23.5Advised by extension – – 2 13.3 5 29.4
Spacing between rowsUse recommended spacing 11 68.8 9 64.3 5 35.7Use other spacing 5 31.2 5 35.7 9 64.3
Spacing between hillsUse recommended spacing 13 81.3 10 71.5 9 64.3Use other spacing 3 18.7 4 18.5 5 35.7
Time of first weedingNovember – – 1 6.3 – –December 3 16.7 8 50.0 1 5.6January 8 44.4 4 25.0 14 77.8February 7 38.9 2 12.5 2 11.1March – – 1 6.3 1 5.6
Time of second weedingJanuary/December – – 1 15.4 – –February 7 77.8 8 61.5 11 73.3March 2 22.2 3 23.1 3 20.0April – – – – 1 6.7
Number of Number of Number offarmers Mean farmers Mean farmers Mean
Number of seeds/hill 18 2.2 17 2.2 16 2.1Frequency of weeding 18 2.0 18 2.0 18 2.2

16
Table 8. Use of fertilizer by sample households, Central Tanzania
Lowlands Intermediate zone Highlands
Number Percent of Number Percent of Number Percent ofPractice of farmers farmers of farmers farmers of farmers farmers
Use inorganic fertilizer (IF) 3 16.7 13 76.5 3 16.7Use organic fertilizer 3 16.7 13 72.2 4 22.2Reason for not using IF
Expensive 2 10.0 7 35.0 1 5.0Destroys soil 0 0.0 1 5.0 1 5.0Lack of knowledge 1 5.0 2 10.0 2 10.0Soil fertile enough 1 5.0 0 0.0 2 10.0
Table 9. Fallowing and crop rotation by sample households, Central Tanzania
Lowlands Intermediate zone Highlands
Number Percent of Number Percent of Number Percent ofPractice of farmers farmers of farmers farmers of farmers farmers
Fallow 7 38.9 3 18.8 1 5.9Crop rotation 10 58.8 14 82.4 6 33.3
farmers planted later, in January. Most farmers planted maize in rows, although 12% of the farmersin the highlands did not. The major reason for row planting was to ease the management of maizefields.
Most farmers in the intermediate zone and lowlands used the recommended spacing between rowsand hills, although only 36% of farmers in the highlands did so. On average, all households plantedthe recommended number of two seeds per hill. Most farmers in all zones weeded twice, asrecommended. The time of weeding depended on the onset of the rains and the presence of weedsin the field. The first weeding was mostly done between January and February, while the secondweeding was done between February and March.
4.2.3 Type of fertilizer, method of application, and quantityInorganic fertilizer was used by 16.7% of lowland farmers, 76.5% of intermediate zone farmers, and16.7% of highland farmers. Most farmers used urea or CAN. The use of inorganic fertilizer wasconstrained by cost and lack of knowledge. No farmer used fertilizers regularly, and fertilizer wasapplied only to parts of the field where maize had symptoms of N deficiency (Table 8).
4.2.4 Fallowing and crop rotationIn the lowlands about 39% of farmers fallowed their land, while only 18.9% of intermediate zonefarmers and 5.9% of highland farmers practiced fallowing (Table 9). This result is not surprising,given that farmers in the lowlands have larger farms. The major reason for leaving land fallow was toreplenish soil fertility, and land shortages were the major constraint on fallowing. Maize and wheatwere grown immediately after the fallow cycle because farmers felt that those crops needed morefertile soils and generated higher returns.
17
About 59% of the farmers in the lowlands, 82.4% in the intermediate zone, and 33.3% in thehighlands rotated crops to add fertility to the soil and break disease and pest cycles (Table 9). Themajor reason for not practicing crop rotations was farmers’ lack of awareness of the potentialbenefits.
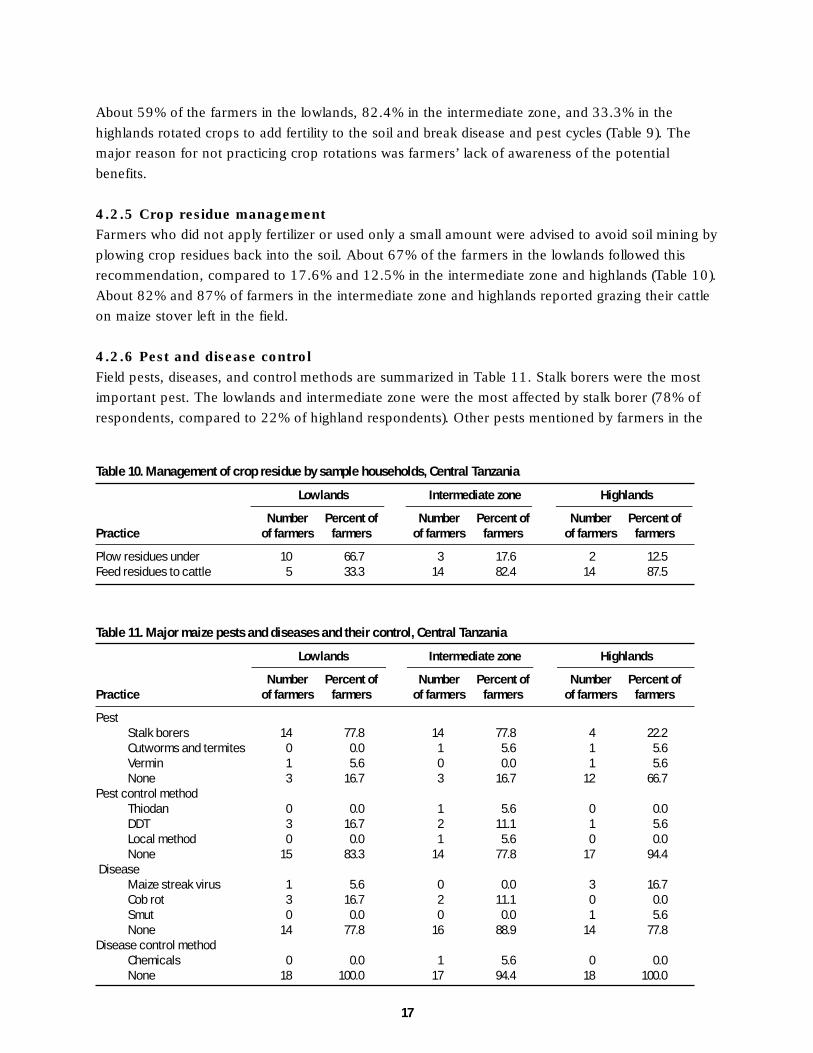
4.2.5 Crop residue managementFarmers who did not apply fertilizer or used only a small amount were advised to avoid soil mining byplowing crop residues back into the soil. About 67% of the farmers in the lowlands followed thisrecommendation, compared to 17.6% and 12.5% in the intermediate zone and highlands (Table 10).About 82% and 87% of farmers in the intermediate zone and highlands reported grazing their cattleon maize stover left in the field.
4.2.6 Pest and disease controlField pests, diseases, and control methods are summarized in Table 11. Stalk borers were the mostimportant pest. The lowlands and intermediate zone were the most affected by stalk borer (78% ofrespondents, compared to 22% of highland respondents). Other pests mentioned by farmers in the
Table 10. Management of crop residue by sample households, Central Tanzania
Lowlands Intermediate zone Highlands
Number Percent of Number Percent of Number Percent ofPractice of farmers farmers of farmers farmers of farmers farmers
Plow residues under 10 66.7 3 17.6 2 12.5Feed residues to cattle 5 33.3 14 82.4 14 87.5
Table 11. Major maize pests and diseases and their control, Central Tanzania
Lowlands Intermediate zone Highlands
Number Percent of Number Percent of Number Percent ofPractice of farmers farmers of farmers farmers of farmers farmers
PestStalk borers 14 77.8 14 77.8 4 22.2Cutworms and termites 0 0.0 1 5.6 1 5.6Vermin 1 5.6 0 0.0 1 5.6None 3 16.7 3 16.7 12 66.7
Pest control methodThiodan 0 0.0 1 5.6 0 0.0DDT 3 16.7 2 11.1 1 5.6Local method 0 0.0 1 5.6 0 0.0None 15 83.3 14 77.8 17 94.4
DiseaseMaize streak virus 1 5.6 0 0.0 3 16.7Cob rot 3 16.7 2 11.1 0 0.0Smut 0 0.0 0 0.0 1 5.6None 14 77.8 16 88.9 14 77.8
Disease control methodChemicals 0 0.0 1 5.6 0 0.0None 18 100.0 17 94.4 18 100.0

18
highlands were vermin, cutworms, and termites. DDT was used to control field pests in all districts ofthe lowlands and highlands. Thiodan and local control methods were used by only a few respondentsfrom the intermediate zone.
Maize streak virus was reported in the lowlands and highlands by 5.6% and 16.7% of respondents,respectively. Cob rot was reported by about 17% and 11% of the respondents from the lowlands andintermediate zones, respectively. Only one farmer in the intermediate zone used chemicals to controldiseases.
4.3 Harvesting, Transportation, and Storage of Maize
The maize harvest depends on the time of sowing and the end of the rainy season, but most maizecrops were harvested in June and July (Table 12). Most farmers used ox-carts to transport maize tothe homestead (other methods included bicycles and pick-up trucks). About 94% of the farmers in thelowlands stored their maize in gunny bags, while the majority of farmers in the other zones (66.7% inthe intermediate zone, 91.7% in the highlands) shelled the maize and stored the grain in a localcontainer (kihenge). The majority of farmers in the three zones treated their maize before storing it.Storage losses without treatment could be substantial. Treatment with Actellic Super was the mostcommon method of controlling storage pests (94% of lowland farmers and 88% of highland farmers).The most common control method in the intermediate zone was the use of ash or other localmaterials (56% of farmers).
4.4 Seed Selection and Recycling
About 90% of farmers in the intermediate zone and highlands selected seed at home, while 44.4% oflowland farmers selected seed in the field (Table 13). The most important criterion for selecting seedfor the next season was the size of the maize cob. Most selected seed was shelled, treated, and stored
Table 12. Maize harvesting, transport, and storage, Central Tanzania
Lowlands Intermediate zone Highlands
Number Percent of Number Percent of Number Percent ofPractice of farmers farmers of farmers farmers of farmers farmers
Harvesting timeMay 1 5.6 0 0.0 0 0.0June 9 50.0 5 27.8 4 22.2July 8 44.4 12 66.7 12 66.7August 0 0.0 1 5.6 1 11.1
Transportation methodBicycle 0 0.0 1 5.6 0 0.0Ox-cart 15 93.8 17 94.4 18 100.0Pick-up truck 1 6.3 0 0.0 0 0.0
Maize storageShell and store in kihenge 1 6.3 8 66.7 11 91.7Cribs 0 0.0 1 8.3 0 0.0Gunny bags 15 93.8 3 25.0 1 8.3

19
in gunny bags. Farmers said that commercial seed was also readily available, and they bought it fromwither stockists or other farmers.
Varying numbers of farmers in each zone said they purchased improved maize seed regularly (23% inthe lowlands, 14% in the intermediate zone, and 57% in the highlands). Farmers in the lowlandsreported that they recycled seed for five to eight years; intermediate zone and highland farmers saidthey recycled seed for eight to ten years.
4.5 Maize Cropping Calendar for the Central Zone
Table 14 presents the maize cropping calendar for the Central Zone. Labor demand peaks twiceduring the year, first between January and March and then between June and August. Planting andweeding were the major activities in the first period, and harvesting and postharvest processing werethe major activities in the second period.
Table 13. Farmers’ seed selection criteria, Central Tanzania
Lowlands Intermediate zone Highlands
Number Percent of Number Percent of Number Percent ofPractice of farmers farmers of farmers farmers of farmers farmers
Big cob 18 52.9 18 50.0 14 58.3Mature grain 12 35.3 11 30.6 7 19.2Other 4 11.1 7 19.4 3 12.5
Table 14. Maize cropping calendar by agroecological zone, Central Tanzania
Zone JAN FEB MAR APR MAY JUN JUL AUG SEPT OCT NOV DEC
Lowlands Land preparationSowing Sowing1st weeding
2nd weedingHarvesting
Inter- Land preparationmediate Sowing Sowingzone 1st weeding
2nd weedingHarvesting
Highlands Land preparationSowing Sowing1st weeding
2nd weedingHarvesting

20
5.0 Farmers’ Adoption/Disadoption of Improved Maize
5.1 Current Varieties Grown
Table 15 shows maize varieties grown by the sample farmers in the 1994/95 farming season. Mostfarmers in the lowlands and intermediate zone grew CG4142, released in 1992 by Cargill. This levelof adoption could be attributed to efficient marketing strategies by Cargill, which is well established innorthern Tanzania and facilitated dissemination of Cargill seed from Arusha into the lowland andintermediate zones of the Central Zone. In the highlands, other maize materials were popular (e.g.,Staha, UCA, and Tuxpeño).
5.2 Preferred Improved Maize Varieties andReasons for Farmers’ Preferences
Farmers’ varying preferences for improved maize across zones may be attributed to zonal differencesin pest populations, disease incidence, soil fertility, and climate. The most preferred maize in thelowland and intermediate zones was CG4142, whereas it was Staha in the highlands (Table 16). Themain reason for these preferences was drought resistance (Table 17).
Table 15. Maize varieties and hybrids planted in 1994/95, Central Tanzania
Lowlands Intermediate zone Highlands
Number Percent of Number Percent of Number Percent ofPractice of farmers farmers of farmers farmers of farmers farmers
Local 5 27.8 2 11.1 11 61.1CG4142* 13 72.2 13 72.2 4 22.3UCA 0 0.0 0 0.0 1 5.6Staha 0 0.0 0 0.0 1 5.6Kilima 0 0.0 3 16.7 — 0.0Tuxpeño 0 0.0 0 0.0 1 5.6
Note: * = or other improved maize variety.
Table 16. Maize varieties/hybrids preferred by farmers, Central Tanzania
Lowlands Intermediate zone Highlands
Number Percent of Number Percent of Number Percent ofPractice of farmers farmers of farmers farmers of farmers farmers
Kilima 0 0.0 3 30.0 0 0.0Staha 0 0.0 0 0.0 8 66.7TMV-1 1 12.5 0 0.0 0 —Tuxpeño 0 0.0 0 0.0 2 16.7CG4142 6 75.0 6 60.0 1 8.3Other* 1 12.5 1 10.0 1 8.3
Note: * = or other improved maize variety.

21
5.3 Disadoption of Improved Maize
About 17% of farmers had discontinued growing improved maize materials, including ICW, H6302,H614, Tuxpeño, and CG4142, largely because of low yields and susceptibility to pests and diseases(Table 18).
Table 17. Reasons for farmers’ preferences for certain maize varieties/hybrids
Lowlands Intermediate zone Highlands
Number Percent of Number Percent of Number Percent ofZone Variety of farmers farmers of farmers farmers of farmers farmers
Lowlands TMV 1 0 0.0 1 100.0 0 0.0CG4142 0 0.0 4 100.0 0 0.0
Intermediate Kilima 1 33.3 1 33.3 1 33.3CG4142 1 33.3 5 83.3 0 0.0
Highlands Staha 1 0.0 5 100.0 0 0.0
Table 18. Maize varieties/hybrids no longer grown by farmers, Central Tanzania
Lowlands Intermediate zone Highlands
Number Percent of Number Percent of Number Percent ofVariety of farmers farmers of farmers farmers of farmers farmers
ICW 0 0.0 0 0.0 1 50.0H6302/H614 2 100.0 1 20.0 0 0.0Tuxpeño 0 0.0 0 0.0 1 50.0CG4141 0 0.0 4 80.0 0 0.0

22
6.0 Credit and Extension Services
6.1 Credit Availability
About 12% of highland respondents and 7% of lowland respondents reported that they had access tocredit. All farmers who used credit received it from the informal sector. The average loan was for1,452.32 Tanzanian shillings (Tsh); the maximum amounts were Tsh 35,000.00 in the highlands andTsh 13,340.00 in the lowlands. This credit was used mainly to purchase fertilizer. More than half ofthe respondents in the lowlands and intermediate zone said that credit was difficult to obtain from theformal sector because of the bureaucratic application process, but the main constraint to formalcredit for highland farmers was their lack of knowledge of how the credit system worked (Table 19).
6.2 Extension Services
Farmers’ sources of information on improved maize technology are shown in Table 20. The threemost important sources information were extension agents, other farmers, and NGOs. In all zones,extension led in disseminating knowledge to farmers for all technologies. The Training and Visit(T&V) extension system is used the study area, and most components of the technology package hadbeen introduced to participating farmers. NGOs were the second most important source ofknowledge about new technology. Most farmers received information on improved varieties, plantingmethod, fertilizer, weeding, ox-drawn implements, and pesticide use. Information on herbicide useand disease control measures was low, however. Also, farmers in the lowlands received lessinformation than other farmers about ox-drawn implements.
Table 19. Sources and use of credit, Central Tanzania
Lowlands Intermediate zone Highlands
Number Percent of Number Percent of Number Percent ofof farmers farmers of farmers farmers of farmers farmers
Access to creditYes 1 6.7 0 0.0 2 12.5No 14 93.3 15 100.0 14 87.5
Sources of creditInformal sector 1 100.0 — — 2 100.0
Availability of creditDifficult to obtain 12.2 85.7 11 84.6 12 100.0Not difficult to obtain 2 14.3 2 15.4 0 0.0
Constraint to obtaining creditLack of knowledge 0 0.0 0 0.0 2 25.0Bureaucracy 7 58.3 5 62.5 2 25.0No collateral 2 16.7 0 0.0 1 12.5Other 3 25.0 3 37.5 3 37.5

23
Table 20. Farmers’ sources of information about maize production technologies, Central Tanzania
Lowlands Intermediate zone Highlands
Number Percent of Number Percent of Number Percent ofTechnology of farmers farmers of farmers farmers of farmers farmers
Improved maizeReceived information 16 100.0 10 90.9 17 100.0
Source of informationResearch/extension 8 61.5 5 83.3 8 66.7Other farmers 0 0.0 0 0.0 3 25.0NGOs 4 30.8 1 16.7 1 8.3Traders 1 7.7 0 0.0 0 0.0
Planting methodReceived information 14 87.5 10 90.9 16 100.0
Source of informationResearch/extension 8 72.7 8 100.0 12 92.3Other farmers 0 0.0 0 0.0 1 7.7NGOs 3 27.3 0 0.0 0 0.0
FertilizerReceived information 9 64.3 6 60.0 15 93.8
Source of informationResearch/extension 10 83.3 3 75.0 11 91.7NGOs 2 16.7 1 25.0 1 8.3
Weed managementReceived information 8 53.3 8 72.7 13 76.5
Source of informationResearch/extension 6 66.7 6 100.0 7 77.8Other farmers 0 0.0 0 0.0 2 22.2NGOs 3 33.3 0 0.0 0 0.0
HerbicideReceived information 1 9.1 2 22.2 2 16.7
Source of informationResearch/extension 1 100.0 2 100.0 2 100.0
Ox-drawn toolReceived information 5 33.3 8 72.7 13 76.5
Source of informationResearch/extension 2 66.7 3 42.9 5 50.0Other farmers 0 0.0 1 14.3 2 20.0NGOs 1 33.3 3 42.9 3 30.0
Pest managementReceived information 6 46.2 7 63.6 7 53.8
Source of informationResearch/extension 5 83.3 6 100.0 5 83.3Other farmers 1 16.7 0 0.0 0 0.0NGOs 0 0.0 0 0.0 1 16.7
Disease control measuresReceived information 3 23.1 2 28.6 5 41.7
Source of informationResearch/extension 2 100.0 2 100.0 6 100.0
Storage practiceReceived information 12 80.0 8 88.9 14 82.4
Source of informationResearch/extension 8 80.0 5 100.0 8 80.0Other farmers 0 0.0 0 0.0 1 10.0NGOs 2 20.0 0 0.0 1 10.0

24
7.0 Factors Affecting Adoption of AgriculturalTechnologies in the Study Area
7.1 Definitions
Feder et al. (1985) defined adoption as the degree of use of a new technology in a long runequilibrium when a farmer has full information about the new technology and its potential. Therefore,adoption at the farm level describes the realization of farmers’ decision to apply a new technology inthe production process. On the other hand, aggregate adoption is the process of spread or diffusionof a new technology within a region. Therefore a distinction exists between adoption at the individualfarm level and aggregate adoption within a targeted region. If an innovation is modified periodically,however, the equilibrium level of adoption will not be achieved. This situation requires the use ofeconometric procedures that can capture both the rate and the process of adoption. The rate ofadoption is defined as the proportion of farmers who have adopted a new technology over time. Theincidence of adoption is defined as the percentage of farmers using a technology at a specific point intime (for example, the percentage of farmers using fertilizer). The intensity of adoption is defined asthe level of adoption of a given technology (for instance, the number of hectares planted withimproved seed or the amount of fertilizer applied per hectare).
7.2 Rate of Adoption of Improved Maize Varieties in Central Tanzania
The common procedure for assessing the rate of adoption is the use of a logistic curve, whichcaptures the historical trend of adoption over a given time and can be used to assess the effectivenessof agricultural institutions that have served the farming system over time. The logistic curve isconstructed using data on the proportion of farmers who have adopted an improved technicalinnovation over a given period. The basic assumption is that adoption increases slowly at first butthen increases rapidly to approach a maximum level (CIMMYT 1993). Mathematically, the logisticcurve is given by the following formula:
KYt = ____________
1 = e-a-bt
where:Yt = the cumulative percentage of adopters at a time t;K = the upper bound of adoption;b = a constant, related to the rate of adoption; anda = a constant, related to the time when adoption begins.
Figure 5 shows the rate of adoption of improved maize varieties for the Central Zone. In 1994 about78% of farmers were planting improved maize varieties, but the rate of adoption for improved maizeover 1974-94 was 0.13, which is rather low. In recent years, the adoption rate has increaseddramatically, probably because of improvements in input delivery under liberalized markets andbecause of increased extension efforts, such as those of Sasakawa-Global 2000.

25
7.3 Tobit Analysis of Land Allocated to Improved Maize Varieties
Results of the tobit model for the proportion of land allocated to improved maize are presented inTable 21. The tobit model was used because the proportion of land allocated to improved maize is acontinuous variable but truncated between zero and one. The use of ordinary least squares will resultin biased estimates (McDonald 1980). In Table 21, δEY/δxi shows the marginal effect of anexplanatory variable on the expected value (mean proportion) of the dependent variable, δEY*/δxishows changes in the intensity of adoption with respect to a unit change of an independent variableamong adopters, and δF(Z)/δxi is the probability of change among nonadopters (e.g., the probabilityof adopting improved maize varieties) with a unitchange of independent variable xi. The log-likelihood ratio test was significant at the 1%level. The socioeconomic householdcharacteristics were not significant. Thesignificant variables included the type of varietygrown by the farmer, agroecological zone, andextension.
A variety’s characteristics had a positive andsignificant influence on the proportion of landallocated to improve maize. Farmers growing thelong-maturing varieties UCA and Kilima weremore likely to allocate more land to maize than
Table 21. Tobit model estimates for land allocated to improved maize varieties, Central Tanzania
Parameter Coefficient t-statistic δEY/δxi δEY*/δxi δF(Z)/ δxi
Constant 0.0854 0.3584 0.0016 0.05801 0.03564EXPF -0.0038 -0.7604 0 -0.0026 -0.0016LAB -0.01197 -0.7351 0 -0.0081 -0.005EDVC -0.0118 -0.6847 0 -0.008 -0.0049WID 0.0074 0.8916 0 0.00503 0.00309EXI 0.3379 1.5828*** 0.025002 0.2295252 0.1410177VA1 0.4072 3.2111* 0.03631 0.2765986 0.169939VA2 0.3058 3.3113* 0.020478 0.2077206 0.1276212VA3 0.5238 3.8682* 0.060081 0.3558014 0.2186004AEZ1 -0.8211 -4.0217* -0.1476379 -0.557748 -0.342674AEZ2 -0.1417 -1.0394 -0.0044 -0.09625 -0.05914SIGMA 0.2972 7.5782 0.019342 0.2018789 0.1240321
Sample size 54Number of positive observations 31Proportion of positive observations 57.4Z-score 0.19f(z) 0.39181Log of likelihood function -13.1798*Log of restricted likelihood function 66.98
Note: *** = significant at 10%level; ** = significant at 5% level; * = significant at 1% level.
Adopters (%)100
80
60
40
20
01971 75 79 83 87 91 93
Figure 5. Rate of adoption of improved maize, CentralTanzania.
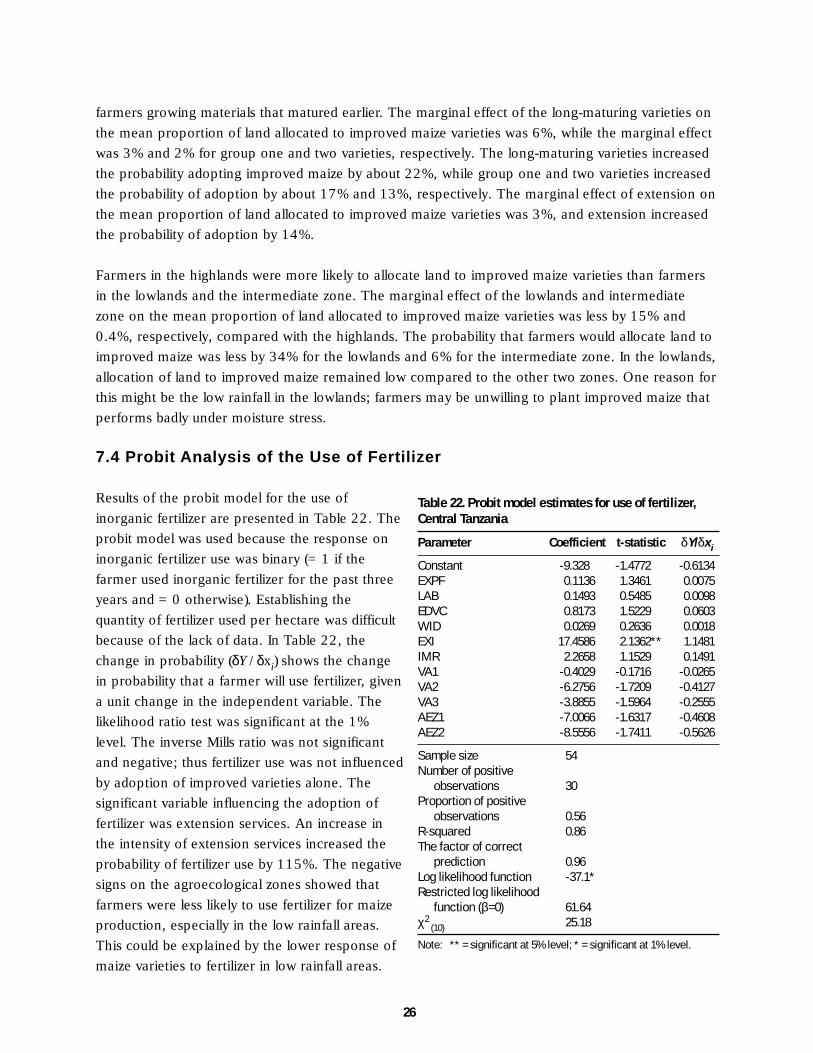
26
farmers growing materials that matured earlier. The marginal effect of the long-maturing varieties onthe mean proportion of land allocated to improved maize varieties was 6%, while the marginal effectwas 3% and 2% for group one and two varieties, respectively. The long-maturing varieties increasedthe probability adopting improved maize by about 22%, while group one and two varieties increasedthe probability of adoption by about 17% and 13%, respectively. The marginal effect of extension onthe mean proportion of land allocated to improved maize varieties was 3%, and extension increasedthe probability of adoption by 14%.
Farmers in the highlands were more likely to allocate land to improved maize varieties than farmersin the lowlands and the intermediate zone. The marginal effect of the lowlands and intermediatezone on the mean proportion of land allocated to improved maize varieties was less by 15% and0.4%, respectively, compared with the highlands. The probability that farmers would allocate land toimproved maize was less by 34% for the lowlands and 6% for the intermediate zone. In the lowlands,allocation of land to improved maize remained low compared to the other two zones. One reason forthis might be the low rainfall in the lowlands; farmers may be unwilling to plant improved maize thatperforms badly under moisture stress.
7.4 Probit Analysis of the Use of Fertilizer
Results of the probit model for the use ofinorganic fertilizer are presented in Table 22. Theprobit model was used because the response oninorganic fertilizer use was binary (= 1 if thefarmer used inorganic fertilizer for the past threeyears and = 0 otherwise). Establishing thequantity of fertilizer used per hectare was difficultbecause of the lack of data. In Table 22, thechange in probability (δY/δxi) shows the changein probability that a farmer will use fertilizer, givena unit change in the independent variable. Thelikelihood ratio test was significant at the 1%level. The inverse Mills ratio was not significantand negative; thus fertilizer use was not influencedby adoption of improved varieties alone. Thesignificant variable influencing the adoption offertilizer was extension services. An increase inthe intensity of extension services increased theprobability of fertilizer use by 115%. The negativesigns on the agroecological zones showed thatfarmers were less likely to use fertilizer for maizeproduction, especially in the low rainfall areas.This could be explained by the lower response ofmaize varieties to fertilizer in low rainfall areas.
Table 22. Probit model estimates for use of fertilizer,Central Tanzania
Parameter Coefficient t-statistic δY/δxi
Constant -9.328 -1.4772 -0.6134EXPF 0.1136 1.3461 0.0075LAB 0.1493 0.5485 0.0098EDVC 0.8173 1.5229 0.0603WID 0.0269 0.2636 0.0018EXI 17.4586 2.1362** 1.1481IMR 2.2658 1.1529 0.1491VA1 -0.4029 -0.1716 -0.0265VA2 -6.2756 -1.7209 -0.4127VA3 -3.8855 -1.5964 -0.2555AEZ1 -7.0066 -1.6317 -0.4608AEZ2 -8.5556 -1.7411 -0.5626
Sample size 54Number of positive
observations 30Proportion of positive
observations 0.56R-squared 0.86The factor of correct
prediction 0.96Log likelihood function -37.1*Restricted log likelihood
function (β=0) 61.64χ2
(10) 25.18
Note: ** = significant at 5% level; * = significant at 1% level.

27
8.0 Conclusions and Recommendations
8.1 Conclusions
Among the farmers sampled for the survey, the mean age of the household head was 43 years, with19 years of farming experience. Farmers’ level of education was low, averaging about four years offormal schooling. Households averaged about ten persons, with at least three permanent workers.Most farmers kept livestock and the hand hoe was their major farm tool. Animal power was used byabout 30% of farmers, mainly in the intermediate zone and highlands. Hiring of tractors wasrelatively common in the lowlands, where farmers practiced extensive maize production. Land wasnot a limiting factor in the farming system.
Farmers in the lowlands and intermediate zone recycled maize seed for five to eight years, whilehighland farmers recycled seed for a longer period (eight to ten years). Seed was selected duringharvest and shelling for storage, based on the size of the cob. Most selected seed was shelled, treatedagainst insects, and stored in gunny bags. Maize for food was shelled and stored in the kihenge. Themajority of farmers in the three zones treated their maize before storage.
The few farmers who obtained credit did so through the informal sector and used the money mainlyto purchase farm inputs such as fertilizer. Farmers’ inability to obtain credit from the formal sectorwas attributed to lack of knowledge about the formal credit system and the bureaucratic process forobtaining loans.
Farmers’ chief source of information on agriculture was the research and extension system; the T&V(Training and Visit) extension system was used throughout the study area. Most farmers had receivedinformation on improved maize varieties, planting methods, and weed management, but few knewabout disease control measures and pest management.
The most popular maize varieties were Kilima, TMV1, and Staha in the intermediate zone; Stahaand TMV1 in the lowlands; and Staha, TMV1, and Kilima in the highlands. The reasons for farmers’preference of these varieties were, in order of importance, their high yield, drought resistance, andresistance to storage pests. Despite these stated preferences, most farmers actually planted thehybrid CG4142 because it was available.
Farmers’ adoption of maize crop management practices depended on their cost. Most farmersplanted maize in rows (the cheapest technology), but fewer farmers used chemical pest and diseasecontrol methods because of their high cost.
The two-stage least squares analysis showed that variety characteristics, production potential of thearea, and extension were the most important factors affecting the amount of land allocated toimproved maize and use of inorganic fertilizer. Farmers who grew long-maturing maize were about22% more likely to allocate land to improved maize, while the use of group one and two varietiesincreased the likelihood of adoption by about 17% and 13%, respectively. Extension increased the
28
probability of allocating land to improved maize at the means by about 14%, and it increased theprobability of using fertilizer by 115%. Lowland farmers were less likely to use fertilizer, probablybecause of the lower response of maize to fertilizer in low rainfall areas.
8.2 Recommendations
Technical innovation characteristics and external influences are the major factors affecting theadoption of improved maize practices. Research needs to develop varieties that fit farmers’ tastes andcircumstances, and extension should be involved in testing and disseminating these technologies.Flexible integrated pest management packages, which combine a drought tolerant variety withimproved cultural practices, can increase yields. Low-cost technologies for controlling stalk borer andmaize streak virus using cultural practices or environmentally friendly industrial chemicals should bedeveloped.
Most improved varieties are responsive to fertilizer, and farmers usually obtain economic yields withfertilizer. But use of fertilizer is constrained by high price and lack of knowledge. An efficientmarketing system for inputs and outputs will benefit farmers by paying higher prices for maize andreducing the cost of fertilizer. Such a system cannot be established without policy support from thegovernment, however. Studies on the economics of seed and fertilizer use should also be undertaken,especially now that input and output markets have been liberalized.
In developing improved maize varieties, factors other than yield should be taken into consideration,including drought resistance/tolerance, resistance to storage pests, shelling quality, and taste. Thisrequires farmer participation in the research process. Research and extension efforts need to belinked and strengthened to increase the flow of information to farmers. In collaboration with thegovernment and other stakeholders, the formal credit system needs to address the credit problemsfaced by small-scale farmers, especially their lack of knowledge (information) about formal credit andthe bureaucratic procedures for obtaining credit. The formation of farmer groups should beencouraged, because lending to groups tends to reduce transactions costs and improve the rate ofloan recovery.
29
References
Adesina, A., and M. Zinnah. 1992. Adoption, diffusion, and economic impacts of modern mangrove ricevarieties in western Africa: Further results from Guinea and Sierra Leone. In Towards a New Paradigm forFarming System Research/Extension, Working Paper for the 12th Annual Farming System Symposium.East Lansing: Michigan State University. Pp. 443-466.
CIMMYT. 1988. From Agronomic Data to Farmer Recommendations: An Economics Training Manual.Mexico, D.F.: CIMMYT.
CIMMYT. 1993. The Adoption of Agricultural Technology: A Guide for Survey Design. Mexico, D.F.:CIMMYT.
Due, J.M. 1986. Summary of farming systems bean research in Tanzania, 1982-85. In: A.N. Minjas and M.P.Salema (eds.), Bean Research. Proceedings of the 4th Bean Research Workshop held at SokoineUniversity of Agriculture. Interpress of Tanzania Ltd. Pp. 146-151.
Feder, G., R.E. Just, and D. Zilberman. 1985. Adoption of agricultural Innovations in developing countries: Asurvey. Economic Development and Cultural Change 33(2):255-297.
FSD (Food Security Department). 1992. Comprehensive Food Security. Dar-Es-Salaam, Tanzania: Governmentof the United Republic of Tanzania and The United Nations Food and Agriculture Organisation (FAO).
FSD (Food Security Department). 1996. Tanzania Food Security Bulletin No. 2, April/May 1996. Dar-Es-Salaam, Tanzania: Ministry of Agriculture. Pp. 6-7.
Greene, W.H. 1993. Econometric Analysis. 2nd Edition. New York: MacMillan.Griffiths, W.E., R. Carter-Hill, and G. Judge. 1993. Learning and Practicing Econometrics. New York: John
Wiley.Hotland, G. 1993. Ecological sustainability and economic viability of smallholder zero-grazing system in de-
stocked (mvumi) semi-arid Tanzania. Paper presented at the Workshop on Sustainable Livestock BasedSystems in Semi-Arid Areas, 27-28 September 1993, Arusha, Tanzania.
Mbiha, E.R. 1993. Effects of government intervention in maize production and marketing: Implications foragricultural marketing and price liberalization in Tanzania. Agricultural Economics Analysis and RuralDevelopment 3(2).
McDonald, J.F, and R.A. Moffit. 1980. The uses of tobit analysis. The Review Of Economics and Statistics62:318-321.
McFadden, D. 1981. Econometric models of probabilistic choice. In C.F. Manski and D. McFadden (eds.),Structural Analysis of Discrete Data with Econometric Applications. Cambridge, Massachusetts: MITPress. Pp. 198-272.
Mdadila, J.M. 1995. Industry Review of Maize, Rice and Wheat, 1993/94. Dar Es Salaam: MarketingDevelopment Bureau (MDB), Ministry of Agriculture, Tanzania. Pp. 23-32.
Misra, S.K., D.H. Carley and S.M. Fletcher. 1993. Factors influencing southern dairy farmers’ choice of milkhandlers. Journal of Agricultural and Applied Economics, July 1993:197-207.
Moshi, A.J., Z.O. Mduruma, N.G. Lyimo, W.F. Marandu, and H.B. Akonnay. 1990. Maize breeding for targetenvironments in Tanzania. In A.J. Moshi and J.K. Ransom (eds.), Maize Research in Tanzania:Proceedings of the First Tanzania National Maize Research Workshop. Dar-Es-Salaam, Tanzania:TARO. Pp. 11-16.
Nkonya, E.M. 1994. Adoption of the Sasakawa-Global 2000 Maize Production Package in the Marginal Areasof Northern Tanzania. MSc thesis, Kansas State University, College of Agriculture, Department ofAgricultural Economics, Manhattan, Kansas.
Saha, A., H.A. Love, and R. Schwart. 1994. Adoption of emerging technologies under output uncertainty.American Journal of Agricultural Economics, November 1994:836-846.
Tobin, J. 1958. Estimation of relationships for limited dependent variables. Econometrica 31: 24-36.

30