adoption of concept of balance scorecard in nsw health
TRANSCRIPT

5/16/2018 Adoption of Concept of Balance Scorecard in Nsw Health - slidepdf.com
http://slidepdf.com/reader/full/adoption-of-concept-of-balance-scorecard-in-nsw-health 1/27
Financial Accountability & Management, 27(3), August 2011, 0267-4424
ADOPTION OF THE CONCEPT OF A BALANCEDSCORECARD WITHIN NSW HEALTH: AN EXPLORATION
OF STAFF ATTITUDES
M ARIA C ADIZ D YBALL, LORNE CUMMINGS AND HUA YU∗
INTRODUCTION
The implementation of the Balanced Scorecard (BSC) as a strategic manage-
ment tool is an area which has had limited research coverage (Tuomela, 2005;
and Malmi, 2001). Whilst the concept of the BSC has had broad application by
the health sector internationally (e.g., Villalbi et al., 2007; ten Asbroek et al.,2004; Wyatt, 2004; Zelman et al., 2003; Le Grand et al., 1998; and Macdonald,
1998), moving from concept to practice has often proved difficult (Ukko et al.,
2007; and Chow et al., 1998). Some argue that its founders Kaplan and Norton
are not forthcoming with their guidance on how to implement the BSC (Ahn,
2001; and Butler et al., 1997). The practical reality of a successful design and
implementation of the BSC appears to be much more challenging and dependent
upon access to time, resources and staff commitment (Woods and Grubnig,
2008; and Wisniewski and Olafsson, 2004). Kaplan and Norton (2001) concede
that major management and staff commitment and effort are required for itsimplementation. Indeed the potential of employees to impact the development
and implementation phases of all performance measurement systems is an area
where more research could be done (Ukko et al., 2007). This paper reports
on staff attitudes towards the adoption of a BSC concept in New South Wales
Department of Health (NSW Health) in Australia, at its head office in Sydney
and one of its area health services in the Hunter New England Area (HNEH).
The interest on staff attitudes is predicated on a view that attitudes influence
staff’s intentions to use a system (Jarrar et al., 2007; Pierce and O’Dea, 2003;
and Agarwal and Prasad, 1998).
∗The authors are from the Department of Accounting and Finance, Macquarie University,Sydney. They appreciate the support of the executive directors, management and staff atNSW Health, in particular Dr. Robert McDonald and Ms Jennifer Jennings. The authorsare also thankful for feedback of the 2008 seminar and conference attendees at theCentre for Accounting and Auditing Research, Nanyang Technological University, Singapore;Department of Accounting and Finance, Macquarie University, Sydney; Global Management
Accounting Research Symposium and Accounting and Finance Association of Australia and
New Zealand Conference. This project was funded by the Department of Accounting andFinance at Macquarie University.
Address for correspondence: Maria Cadiz Dyball, Department of Accounting and Finance,Macquarie University, Sydney, NSW 2109, Australia.e-mail: [email protected]
C 2011 Blackwell Publishing Ltd, 9600 Garsington Road,
Oxford OX4 2DQ, UK and 350 Main Street, Malden, MA, MA 02148, USA. 335

5/16/2018 Adoption of Concept of Balance Scorecard in Nsw Health - slidepdf.com
http://slidepdf.com/reader/full/adoption-of-concept-of-balance-scorecard-in-nsw-health 2/27
336 DYBALL, CUMMINGS AND YU
Both the management accounting and information technology (IT) literatures
acknowledge that the expected benefits of a system application cannot be
realised if staff do not accept the system for task performance (Woods and
Grubnig, 2008; Wisniewski and Olafsson, 2004; Scapens and Roberts, 1993;
and also see Bhattacherjee and Sanford, 2006). The IT literature embracesthe view that the implementation of systems must be addressed at different
levels including the semantic and psychological impact of the system on users
(DeLone and MacLean, 1998 and 2003).1 The semantic level focuses on the
precision of conveying to the user the meaning and purpose of the information
generated by the system whereas the psychological level concentrates on the
influence of the system on user behaviour. In this paper we draw inspiration from
Davis et al.’s (1989) Technology Acceptance Model (TAM), which was originally
conceived to better understand attitudes and intention of employees to use
computer technologies. The model has applications in management accounting(Islam and Kellermanns, 2006; and Kellermanns and Islam, 2004) and in other
disciplines (Phillips et al., 1994). The model is able to accommodate normative
and empirical claims of the usefulness and ease of use of the BSC. TAM predicts
that employee perception of ease of use and usefulness of a system impacts on
employee attitudes and intention to use a system.
The study therefore answers two research questions on perceptions of staff in
NSW Health at its Sydney head office and HNEH of the BSC: (1) how perceived
usefulness and perceived ease of use of the BSC are related to attitudes toward,
and consequent intention to use the BSC; and (2) how job level, functionalspeciality and degree of participation predict the perceived usefulness and
perceived ease of use of the BSC.
The remainder of the paper comprises five sections. The first section reviews
academic literature on the implementation of the BSC with particular emphasis
on the health sector. The second section provides background information on
NSW Health and HNEH and describes the basis for a BSC adoption. The third
section presents the research methodology and the fourth section contains the
results, validity tests and analyses of findings. The final section concludes and
identifies limitations and areas for further research.
LITERATURE REVIEW
Since its inception by Kaplan and Norton in 1992, the BSC has evolved into
a holistic methodology that converts organisational vision and strategy into an
inclusive set of performance measures (Voelker et al., 2001). It is considered
to be one of the major theoretical innovations in performance measurement
(Otley, 1999 and 2003; and Ittner and Larcker, 1998) and more importantly,
has the ability to link performance measures with business strategy, thereby assisting managers in strategy implementation (Otley, 1999). However, there
is a view that rhetoric is not convincingly supported by empirical evidence,
in particular, that the BSC is able to improve organisational performance
C 2011 Blackwell Publishing Ltd

5/16/2018 Adoption of Concept of Balance Scorecard in Nsw Health - slidepdf.com
http://slidepdf.com/reader/full/adoption-of-concept-of-balance-scorecard-in-nsw-health 3/27
ADOPTION OF THE CONCEPT OF A BALANCED SCORECARD 337
and if so, how it is able to do so (Davis and Albright, 2004; Norreklit, 2003;
and Speckbacher et al., 2003).2 Nonetheless, the application of the BSC now
extends beyond the profit sector, and is even purported to be equally useful in
public management (Johnsen, 2001; also see Inamdar and Kaplan, 2002; and
Kaplan and Norton, 2001). In a review of research on the BSC in healthcareorganisations, Aidemark and Funck (2009) observe that recent areas of interest
are on demonstrating financial gains and improved feedback for clinicians on
patient care, and benchmarking performance.
To redress the little guidance from its founders on how to implement
the BSC (Ahn, 2001; and Butler et al., 1997), researchers have identified
enablers and barriers to its successful implementation (e.g., Assiri et al., 2006;
Radnor and Lovell, 2003; and Kasurinen, 2002). Assiri et al. and Kasurinen
focus on private sector implementations whilst Radnor and Lovell investigate
the application of the BSC within the health sector. Interestingly, normativeliterature on the implementation of the BSC in the private sector tends to
emphasise design issues, management commitment and external or internal
exigencies necessitating change, whilst relevant literature in the health sector
focuses on individual staff acceptance. Perhaps this focus reflects the ‘new public
management’ mantra in the public sector and provides credence to Kim (2002,
p. 231) who states that ‘one of the leading challenges in public management has
been implementing effective human capital strategies to enhance government
performance and accountability’. It also highlights staff acceptance as a key
element in a successful BSC implementation which in turn provides legitimacy to the new system (Woods and Grubnig, 2008; Wisniewski and Olafsson, 2004;
and Scapens and Roberts, 1993).
Radnor and Lovell (2003) in their evaluation of the BSC within the Bradford
health sector in the United Kingdom (UK) identify factors that could facilitate
its successful adoption. Top on their list is demonstrating to individuals ‘how’ the
BSC system could add value over existing performance management systems.
Second, is developing the BSC at a strategic level to allow accurate evaluation
of the scale of compromises that practical deployment of the BSC at lower
strategic/tactical levels will require. Third, is implementation of the BSC at various levels within the organisation resulting in a chain of linked BSCs. This
factor extends to the identification of key performance indicators (KPIs) to
be included in the BSC, as it could be difficult for employees to make an
unbiased decision regarding which KPIs to use (Chan, 2006). This difficulty
is not rare in the few studies on BSC implementation across sectors (see
Banker et al., 2004; and Youngblood and Collins, 2003) although Pineno (2002),
using an incremental approach to test the cause and effect relationships of
BSC measures in hospitals in Ontario Canada, found that measures can reflect
hospital objectives. Voelker et al. (2001) studying issues in developing a BSC in the US health
sector, anticipated a significant level of resistance from employees at the initial
stage. Inamdar and Kaplan (2002) confirm that fear was a challenge in BSC
C 2011 Blackwell Publishing Ltd

5/16/2018 Adoption of Concept of Balance Scorecard in Nsw Health - slidepdf.com
http://slidepdf.com/reader/full/adoption-of-concept-of-balance-scorecard-in-nsw-health 4/27
338 DYBALL, CUMMINGS AND YU
development and implementation, which required time to mitigate. A related
problem is identified in a review of the US health sector by Zelman et al.
(2003), who found that senior and front-line managers opposed the BSC when
it was imposed by external parties suggesting that employee involvement in
the conceptualisation and development of the BSC is a contributing factor toits successful adoption. The impact of external imposition is reflected in the
introduction of the BSC in New Zealand (NZ) hospitals, which was mandated.
Northcott and France (2005, p. 44) thus caution that ‘it cannot be assumed that
NZ hospitals BSC will permeate practice and decision-making to the point of
having any substantive impact on hospital management.’
The brief literature review on the BSC in the health sector reveals
that individual staff acceptance is an essential element in its successful
implementation (Aidemark and Funck, 2009; Northcott and France, 2005;
Radnor and Lovell, 2003; Zelman et al., 2003; Inamdar and Kaplan, 2002; Voelker et al., 2001; and also see Kaplan and Norton, 2001). Individuals must
be shown ‘how’ the BSC system could add value over existing performance
management systems. This process is known as addressing the semantic level of
system application, where the meaning and purpose of the system is conveyed
to the user (DeLone and MacLean, 1998 and 2003). The resistance and fear
from healthcare staff highlights the psychological aspect of a system application
where staff behaviour toward a system is addressed. This study focuses on the
semantic and psychological levels of BSC implementation and investigates the
impact of factors including perceived usefulness and ease of use of the BSC onindividual staff attitudes toward the BSC in a healthcare setting in Australia.
Thus the paper is able to provide suggestions on how employee resistance and
fear of the BSC could be overcome.
IMPLEMENTATION OF THE BSC IN NSW HEALTH
The New South Wales Hunter New England Health Service (HNEH) is one
of eight Area Health Services of the New South Wales Department of Health
(NSW Health). The Area Health Services are responsible for providing healthservices across a wide range of settings, from primary care posts in the remote
outback to metropolitan tertiary health centres. HNEH provides rural services
and was created on January 1, 2005. HNEH provides care for approximately
840,000 people, covers a geographical area of over 130,000 square kilometres,
and has approximately 14,500 staff, 1,500 medical officers and 1,600 volunteers.
It provides health services to 12% of NSW’s population, and 20% of the State’s
Aboriginal population. It spans 32 local government areas and spends A$1.3
billion (approximately US$1.2billion)3 per annum (approximately 12% of the
2006-07 NSW Department of Health budget) (NSW HNEH, 2008a).HNEH has priorities and goals that are underpinned by both the State Plan
and the seven strategic directions for NSW Health. NSW Health’s goals are: to
keep people healthy, to provide the health care that people need, to deliver high
C 2011 Blackwell Publishing Ltd
5/16/2018 Adoption of Concept of Balance Scorecard in Nsw Health - slidepdf.com
http://slidepdf.com/reader/full/adoption-of-concept-of-balance-scorecard-in-nsw-health 5/27
ADOPTION OF THE CONCEPT OF A BALANCED SCORECARD 339
quality services and to manage health services well. HNEH sets out to achieve
the seven strategic directions in the State Health Plan. It has its Area Strategic
Plan, which identifies strategies and initiatives for attaining these directions and
measures to assess their degree of attainment. The seven strategic directions
are to:
1. Make prevention everybody’s business,
2. Create better experiences for people using health services,
3. Strengthen primary health and continuing care in the community,
4. Build regional and other partnerships for health,
5. Make smart choices about the costs and benefits of health services,
6. Build a sustainable health workforce,7. Be ready for new risks and opportunities (NSW HNEH, 2008b).
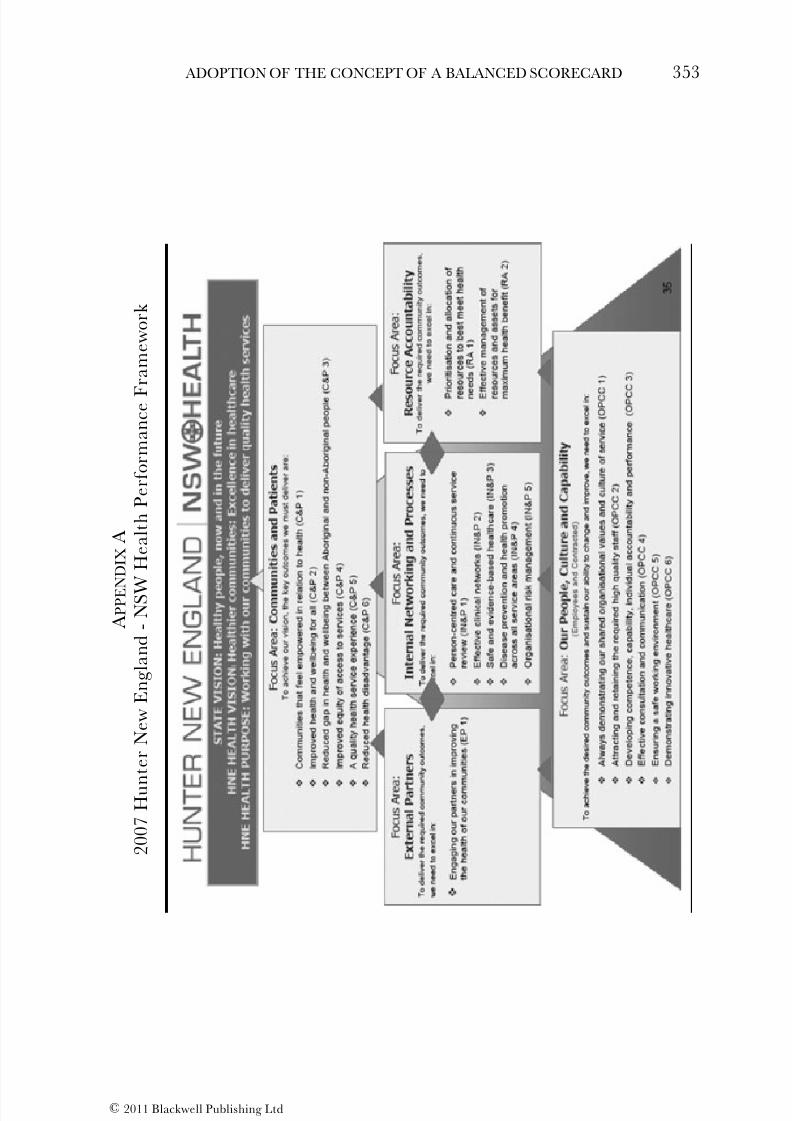
In 2003, prior to a merger in 2005 with adjacent local government areas, the
Hunter Area Health Service (AHS) pioneered a BSC performance framework
(see Appendix A for 2007 version) that identified ‘areas of responsibility’
(IPART, 2003 as cited by Northcott and France, 2005). The aim was to use
multi-dimensional information to translate HNEH’s vision and purpose into
specific goals and actionable items, to ensure that the health system fulfils
public expectations. In 2003 it was reported that:the balanced scorecard model has been accepted very well within Hunter AHS. Staff feel that it provides them with clear directions, encourages organisational alignment,focuses on what is important, and is comprehensive and credible (Northcott andFrance, pp.40-1, citing IPART, 2003).
HNEH has continued with the BSC framework since the 2005 merger with
Hunter AHS staff gaining considerable hands-on experience.
The BSC concept adopted by the Head Office in Sydney is different from that
of HNEH, the former being developed by a NSW Health System Performance
Indicator Committee in 2003. The committee drew a minimum set of indicatorsthat would be relevant at all levels within health. The final indicator set
has created a health dashboard that allows monitoring of strategic directions
while providing an early warning system for any necessary remedial action.
The dashboard contains 20 high-level indicators designed to provide better
accountability for government; better information for strategic management
at the Departmental and Board/Health Service level, and better alignment of
effort at the clinical/operational level (NSW Health, 2008b).
This project is therefore timely in seeking to elicit and analyse staff attitudes
toward the BSC concept to enable an appreciation of staff’s behaviour, that is, asense as to whether staff will use the BSC in performing their tasks. Until 2007
when this study was conducted there had been only a partial roll-out of the BSC
at HNEH.
C 2011 Blackwell Publishing Ltd

5/16/2018 Adoption of Concept of Balance Scorecard in Nsw Health - slidepdf.com
http://slidepdf.com/reader/full/adoption-of-concept-of-balance-scorecard-in-nsw-health 6/27
340 DYBALL, CUMMINGS AND YU
RESEARCH METHODOLOGY
Theoretical Framework
Attitudes toward the BSC of NSW Health staff in the Sydney Head Office and
HNEH are investigated using a theoretical framework which incorporates key concepts from Davis et al.’s (1989) Technology Acceptance Model (TAM). The
model is adapted to incorporate a number of variables identified in the academic
literature as critical for staff acceptance and use of a system (see the second
section previously; and also see Davis et al., 1989). The TAM was conceived to
explain user acceptance of computer technology, and various studies in the IT
literature found the model to have good predictive power (e.g., Karahanna et
al., 2006; Bhattacherjee and Sanford, 2006; Calantone et al., 2006; Venkatesh
et al., 2003; and Venkatesh and Davis, 2000). TAM proposes that individual
perceptions of usefulness and ease of use of a system influences their generalattitudes and intention to use it. Perception of an object is an important
factor affecting individual’s attitudes and behaviour toward it (Jarrar et al.,
2007; Warren, 2006; Pierce and O’Dea, 2003; and Agarwal and Prasad, 1998).
Perception is an outcome of a process where individuals represent objects in
the world around them. In the management accounting literature the TAM has
already been applied to assess user perceptions of the ease of use and usefulness
of the BSC and activity-based costing system (Islam and Kellermanns, 2006; and
Kellermanns and Islam, 2004). We continue this area of research using the case
of NSW Health to anticipate whether staff will reject or accept the BSC. Thetheoretical framework is presented in Figure 1.
The key concepts in the TAM are Perceived Usefulness (PU), Perceived Ease
of Use (PEU), General Attitudes and Intention to Use. PU is defined as ‘the
degree to which a person believes that using a particular system would enhance
Figure 1
Theoretical Framework
PerceivedUsefulness
Perceived Easeof Use
GeneralAttitudes
Intention to UseDegree of
Participation
Job Level(Director/managervs Non-director/
manager)
Functionalspeciality
(Clinician vs Non-clinician)
Original TAM Model
C 2011 Blackwell Publishing Ltd
5/16/2018 Adoption of Concept of Balance Scorecard in Nsw Health - slidepdf.com
http://slidepdf.com/reader/full/adoption-of-concept-of-balance-scorecard-in-nsw-health 7/27
ADOPTION OF THE CONCEPT OF A BALANCED SCORECARD 341
his or her job performance’ (Davis, 1989, p. 320). PEU, on the other hand, is
‘the degree to which a person believes that using a particular system would be
free of effort’ (Davis, 1989, p. 320). For this study, the concepts of PU, PEU,
general attitudes and intention to use were operationalised to accommodate
previous research and normative statements on usefulness of the BSC at bothorganisational and individual level. Additional related variables identified in
the psychology and accounting literatures were also incorporated to propose a
theoretical framework.
A concept incorporated in the theoretical framework is participation, defined
here as user behaviours and activities with respect to a given system. Barki
and Hartwick (1994) find that employees who participate in the development
process of a technology or system will tend to develop a positive attitude toward
it because of their better understanding of the merits of the innovation and
its benefits to individual employees (also see Kloot and Martin, 2000; Argyrisand Kaplan, 1994; Hartwick and Barki, 1994; and Milani, 1975). Research by
Northcott and France (2005) on the adoption of the BSC concept in NZ hospitals
suggests that the long-term acceptance of the BSC could be built up by employee
participation including, for example, staff engagement to ensure that the choice
and design of KPIs truly reflect the strategies and goals of the organisation.
Participation therefore also provides employees an opportunity to develop their
skills in BSC design. This leads us to the following hypotheses:
H1a: Participation is positively related to perceived usefulness (PU) of theBSC.
H1b: Participation is positively related to perceived ease of use (PEU) of the
BSC.
Job level and functional specialty are the second and third variables explored
in this paper as influencing PEU and PU. Job level is operationalised at two
levels: (1) A Director at the Head Office or manager at HNEH, and (2) A
Non-director of NSW Health or non-manager at HNEH. Functional specialty
is identified through the nature of the departments and for our purposes wesegregated clinicians from non-clinicians. The view that these variables influence
PEU and PU is based on research findings that employees at different levels of
the hierarchy and in different functional groups experience different demands,
requirements, job expectations and attitudes (Adams et al., 1977). Adams et al.
also found that the interaction of job level and functional speciality had a
significant effect on job attitudes. That is, even at the same job level, people from
different functional specialities have different job attitudes. Furthermore, they
predicted that members in similar organisational functions would have a greater
tendency to share common attitudes than members from different functions.Strebel (1996) claims that the differing views of managers and employees on
change is a common cause of difficulties in the introduction of new systems.
Top-level managers often perceive change as an opportunity whereas for many
C 2011 Blackwell Publishing Ltd

5/16/2018 Adoption of Concept of Balance Scorecard in Nsw Health - slidepdf.com
http://slidepdf.com/reader/full/adoption-of-concept-of-balance-scorecard-in-nsw-health 8/27
342 DYBALL, CUMMINGS AND YU
employees change is neither sought after nor welcomed (Kasurinen, 2002). A
common feature of health sector reform in many countries has been a managerial
approach to health sector management which has resulted in the emergence of
a clinico-managerial grouping within the medical professions in Germany, Italy
and the UK, that assumes financial and managerial responsibilities (Jacobs,2005). Bradley and Parker (2006) find that Australian public sector managers
have an external focus and are more interested in the strategic direction
of the organisation compared to lower level employees. They also observe
that many managers have participated in numerous seminars and training
activities promoting the ‘new’ management framework, and would be expected
to have embraced the prescriptions of managerialism. Given that the BSC is
an innovation in NSW Health and HNEH, has a strategic focus, and reflects
managerialism in the public sector (see Hood, 1995), we propose the following
hypothesis:
H2: Directors and managers will have a higher PU and PEU compared to
non-directors and non-managers.
Early research on teams in a general hospital in the US (Hrebiniak, 1974)
found that different job functions have a significant impact on interpersonal
trust and commitment by task unit members. Findings of a comparative study
of 850 staff located in four English and two Australian hospitals highlighted
marked differences between the values and beliefs of respondents from medicaland nursing backgrounds (Degeling et al., 1998).
Nursing staff had collective orientations compared with the individualism of medicineand of the centrality to the professional/personal identity of medical respondents of their claimed right to self define, self describe and self validate their work (Degeling,2000, p. 12).
Generally doctors have also been seen as antagonistic to accounting practices
which are considered a threat to the fundamental values of the medical
profession (Jacobs, 2005; and Jones and Dewing, 1997). Particularly on the
BSC, Aidemark (2001) found that not all medical professionals welcomed its
adoption. Hospital managers were interested in the BSC, but some doctors
thought ‘why measure at all?’ believing that BSC measurements were useless.
In contrast, research by Bilkhu-Thompson (2003) on the implementation of the
BSC in an emergency medicine service system in the US, indicated that medical
professionals had more understanding of the BSC than employees within support
departments. This leads us to the following hypothesis:
H3: Non-health staff will have a higher PU and PEU compared to health
staff.
Following Davis et al.’s (1989) TAM, the following relationships between the
remaining variables are expected:
C 2011 Blackwell Publishing Ltd

5/16/2018 Adoption of Concept of Balance Scorecard in Nsw Health - slidepdf.com
http://slidepdf.com/reader/full/adoption-of-concept-of-balance-scorecard-in-nsw-health 9/27
ADOPTION OF THE CONCEPT OF A BALANCED SCORECARD 343
H4: PU is positively related to general attitudes.
H5: PEU is positively related to general attitudes.
H6: PEU is positively related to PU.
H7: PU is positively related to intention to use.
H8: General attitudes are positively related to intention to use.
Across the many empirical tests of TAM in the IT literature, PU has consistently
been correlated with usage intentions, with standard regression coefficients
typically around 0.6 (Vankatesh and Davis, 2000, p. 187). PEU, on the other
hand, has exhibited a less consistent relationship on intention across many
studies.
Method
Employee perceptions of the BSC in the NSW Health Service were obtained
using targeted mail-out questionnaires. The questionnaire consisted of a total
of sixty-two (62) multiple-choice questions covering six sections: background,
perceived usefulness, perceived ease of use, participation, general attitudes and
intention to use4. The questions were adapted from previous research that
operationalised the constructs, usefulness (Kaplan and Norton, 1996; and Davis,
1989); perceived ease of use (Davis, 1989); participation (Kaplan and Norton,
1996; Barki and Hartwick, 1994; Milani, 1975; and White and Ruh, 1973);general attitudes (Venkatesh and Davis, 2000; Ferguson, 1997; Taylor and Todd,
1995, and Milani, 1975), and employees’ intention to use (Bhattacherjee and
Sanford, 2006; and Calantone et al., 2006). A five point Likert scale (‘Strongly
Disagree,’ ‘Disagree,’ ‘Indifferent,’ ‘Agree,’ and ‘Strongly Agree’) was used for
the last five sections.
The Operational Director at HNEH assisted the authors in identifying one
hundred and seventy six (176) potential respondents, who were registered
attendees of BSC workshops held at HNEH in 2007. The workshops cover
general information on BSCs, how the BSC is used in HNEH, what the attendees’roles are, the benefits of using a BSC, as well as the development of BSCs for
represented subunits using the HNEH framework. Attendees are also provided
assistance with procedures for data collection, reporting and use. The Director
of Demand and Performance Evaluation of the Health System Performance
Division at the Sydney Head Office identified a further seven respondents; a
total of 183 target respondents. The survey was targeted to individuals familiar
with the BSC approach, who would have felt that they possessed sufficient
knowledge to respond to the questionnaire. Familiarity with the concept was
needed, in order to avoid the return of questionnaires with invalid data. Thefindings will resonate with the management of NSW Health in predicting if
staff would apply the BSC in their task performance and indeed caution must
be applied in extrapolating results from this study to other settings.5
C 2011 Blackwell Publishing Ltd
5/16/2018 Adoption of Concept of Balance Scorecard in Nsw Health - slidepdf.com
http://slidepdf.com/reader/full/adoption-of-concept-of-balance-scorecard-in-nsw-health 10/27
344 DYBALL, CUMMINGS AND YU
The Partial least squares (PLS) approach was used to analyse survey results
because of its minimal demands on measurement scales, residual distributions
and sample size (Chin, 1999 and 2007). PLS allows sample sizes to be much
smaller (n < 100) (Smith and Langfield-Smith, 2004). The PLS approach is also
suitable in studies where there is low theoretical information and the goal isprediction (Joreskog and Wold, 1982). Based on a system of interdependent re-
gressions, the PLS path analysis makes several types of predictions, one for each
regression in the system. In this project, the authors adapted Davis et al.’s (1989)
TAM to incorporate normative claims and insights from the accounting and
psychology literatures. Thus, this study is exploratory rather than a confirmatory
investigation of a robust theoretical model in the accounting literature. The PLS
path analysis approach, however, has its followers in the accounting discipline
(e.g., Abernethy et al., 2007; Moulang 2006; Chenhall, 2005; Anderson et al.,
2002; Vandenbosch, 1999; and Ittner et al., 1997). Indeed Smith and Langfield-Smith (2004, pp. 78-9) encourage researchers in management accounting to use
the PLS path analysis to promote theory development.
FINDINGS AND ANALYSIS
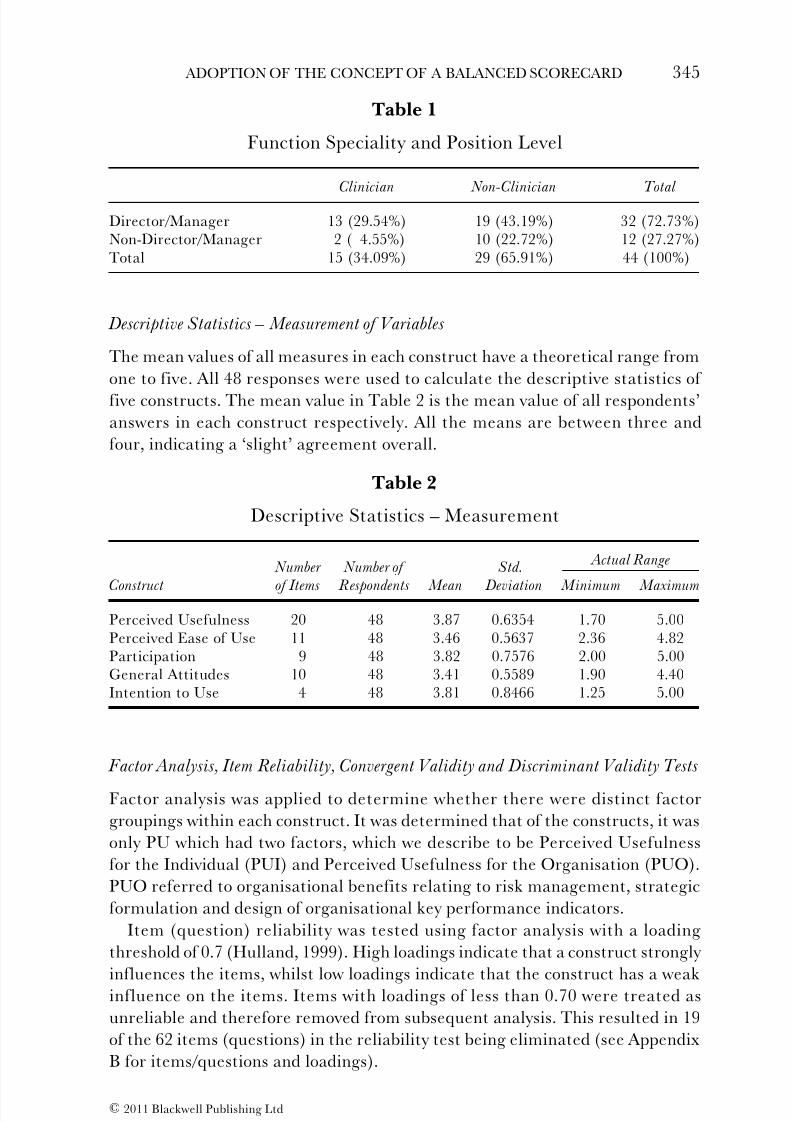
Response Rate and Demographics
A total of 48 questionnaires were returned from the 183 targeted participants; an
overall response rate of 26.23%.6 Six of these questionnaires were received from
the Sydney Head Office; a response rate of 85.71%. The other 42 questionnaires were received from the 176 targeted respondents from the HNEH; a response
rate of 23.86%.
Forty-seven individuals out of the 48 returned questionnaires had complete
demographic information. Of the 47, 30 were female (63.83%) and 17 were male
(36.17%). Many (n = 23) of the respondents were in the age range of 45-54 years
old (1 = 25-34 years old; 13 = 35-44 years old; 10 = 55+ years old). Of the 42
respondents from HNEH, the two most represented divisions were Population
Health, Planning and Performance (38.10%) and Clinical Operations (33.33%).
A majority of the respondents were also working in non-clinical related positions(61.71%). A further category of key respondents included directors/managers in
clinical health. Respondents (n = 3) who chose ‘other’ as their functional area,
and did not specify their position, were treated as missing data. As it is impossible
to identify whether the people who identified Allied Health as their functional
area were managers or not (there is no option given for them to choose), they
were also treated as missing data when analysing the manager/non-manager
distribution. Table 1 illustrates the function speciality and position/job level of
the 44 remaining respondents.
A majority of respondents (63.83%) held a postgraduate degree, and all ‘healthcategory of employment’ respondents possessed either an undergraduate or a
postgraduate qualification. By comparison, people in the non-health category of
employment had education ranging from secondary school to postgraduate.
C 2011 Blackwell Publishing Ltd
5/16/2018 Adoption of Concept of Balance Scorecard in Nsw Health - slidepdf.com
http://slidepdf.com/reader/full/adoption-of-concept-of-balance-scorecard-in-nsw-health 11/27
ADOPTION OF THE CONCEPT OF A BALANCED SCORECARD 345
Table 1
Function Speciality and Position Level
Clinician Non-Clinician Total
Director/Manager 13 (29.54%) 19 (43.19%) 32 (72.73%)Non-Director/Manager 2 ( 4.55%) 10 (22.72%) 12 (27.27%)Total 15 (34.09%) 29 (65.91%) 44 (100%)
Descriptive Statistics – Measurement of Variables
The mean values of all measures in each construct have a theoretical range from
one to five. All 48 responses were used to calculate the descriptive statistics of
five constructs. The mean value in Table 2 is the mean value of all respondents’
answers in each construct respectively. All the means are between three and
four, indicating a ‘slight’ agreement overall.
Table 2
Descriptive Statistics – Measurement
Actual Range Number Number of Std.
Construct of Items Respondents Mean Deviation Minimum Maximum
Perceived Usefulness 20 48 3.87 0.6354 1.70 5.00Perceived Ease of Use 11 48 3.46 0.5637 2.36 4.82Participation 9 48 3.82 0.7576 2.00 5.00General Attitudes 10 48 3.41 0.5589 1.90 4.40Intention to Use 4 48 3.81 0.8466 1.25 5.00
Factor Analysis, Item Reliability, Convergent Validity and Discriminant Validity Tests
Factor analysis was applied to determine whether there were distinct factor
groupings within each construct. It was determined that of the constructs, it was
only PU which had two factors, which we describe to be Perceived Usefulness
for the Individual (PUI) and Perceived Usefulness for the Organisation (PUO).
PUO referred to organisational benefits relating to risk management, strategic
formulation and design of organisational key performance indicators.
Item (question) reliability was tested using factor analysis with a loading
threshold of 0.7 (Hulland, 1999). High loadings indicate that a construct strongly
influences the items, whilst low loadings indicate that the construct has a weakinfluence on the items. Items with loadings of less than 0.70 were treated as
unreliable and therefore removed from subsequent analysis. This resulted in 19
of the 62 items (questions) in the reliability test being eliminated (see Appendix
B for items/questions and loadings).
C 2011 Blackwell Publishing Ltd

5/16/2018 Adoption of Concept of Balance Scorecard in Nsw Health - slidepdf.com
http://slidepdf.com/reader/full/adoption-of-concept-of-balance-scorecard-in-nsw-health 12/27
346 DYBALL, CUMMINGS AND YU
Table 3
Composite Reliability Statistics
Perceived Usefulness for Individual:
Composite Reliability 0.945 AVE 0.712 Perceived Usefulness for Organisation:
Composite Reliability 0.925 AVE 0.638 Perceived Ease of Use:
Composite Reliability 0.915 AVE 0.684 Participation:
Composite Reliability 0.941 AVE 0.665General Attitudes:
Composite Reliability 0.918 AVE 0.691 Intention to Use:
Composite Reliability 0.927 AVE 0.810
Convergent validity tests to determine the extent to which multiple measures
of a construct agree with one another (Campbell and Fiske, 1959, as cited by
Barki and Hartwick, 1994) were also undertaken using composite reliability
tests and Average Variance Extracted (AVE) (Hulland, 1999). Thresholds of 0.7
and 0.5 for composite reliability tests and the AVE, respectively, were applied
to measure the convergent validity of the five constructs in the model (see
Table 3).Discriminant validity ensures that the measures of each construct are
different from the measures of other constructs and that each construct
measures different concepts. The square root of AVE should be larger than the
correlations of each of the constructs, so that discriminant validity is maintained.
In Table 4, figures at the first cell of each column are the square roots of AVE;
whilst below diagonal figures are the correlations between the constructs. It
illustrates that all AVE values were larger than the correlations, suggesting that
there is discriminant validity between items of each construct.
Analysis
The summarised results (Figure 2) were produced by the PLS-Graph 3.0 using
the data from the questionnaires. We performed bootstrapping7 as a necessary
step to obtain the significance level of the path coefficient (Chin, 2007). The
resample size for bootstrapping was 6,000, determined by a principle that the
greater the resample size the more stable the t-statistics will be. Because the
relationships between the constructs are directional, the t-statistics were treated
as a one-tailed test and were compared with the critical values 1.645 ( p < 0.05),
2.326 ( p < 0.01) and 3.091 ( p < 0.001) following similar research (Moulang,
2006).
C 2011 Blackwell Publishing Ltd

5/16/2018 Adoption of Concept of Balance Scorecard in Nsw Health - slidepdf.com
http://slidepdf.com/reader/full/adoption-of-concept-of-balance-scorecard-in-nsw-health 13/27
ADOPTION OF THE CONCEPT OF A BALANCED SCORECARD 347
T a b
l e 4
S q u a r e R o o t o f A v e r a g e V a r i a
n c e E x t r a c t e d v s . C o r r e l a t i o n s
P e r c e i v e d
P e r c e i v e d
U s e f u l n e s s
U s e f u l n e s s
P e r c e i v e d
f o r
f o r
E a s e o f
G e n e r a l
I n t e n t i o n
I n d i v i d u a l
O r g a n i s a t i o n
U s e
P a r t i c i p a t i o n
A t t i t u d e s
t o U s e
P e r c e i v e d U
s e f u l n e s s f o r I n d i v i d u a l
0 . 8
4 4
P e r c e i v e d U
s e f u l n e s s f o r O r g a n i s a t i o n
0 . 8 1 9
0 . 7 9
9
P e r c e i v e d E a s e o f U s e
0 . 6 0 9
0 . 3 7 3
0 . 8
2 7
P a r t i c i p a t i o n
0 . 4 8 3
0 . 3 9 8
0 . 3 8 2
0 . 8
1 5
G e n e r a l A t t
i t u d e s
0 . 6 9 9
0 . 5 1 9
0 . 7 6 9
0 . 4 2 1
0 . 8
3 1
I n t e n t i o n t o
U s e
0 . 7 0 2
0 . 6 8 9
0 . 6 2 1
0 . 4 1 4
0 . 7 6 4
0 . 9
0 0
C 2011 Blackwell Publishing Ltd

5/16/2018 Adoption of Concept of Balance Scorecard in Nsw Health - slidepdf.com
http://slidepdf.com/reader/full/adoption-of-concept-of-balance-scorecard-in-nsw-health 14/27
348 DYBALL, CUMMINGS AND YU
F i g u
r e 2
R e s
u l t s
P e r c e i v e d
U s e f u l n e s s f o r
I n d i v i d u a l
R 2 = 5 4 . 7 % P
e r c e i v e d E a s e o f
U s e
R 2 = 1 7 . 8 %
G e n e r a l A t t i t u d e s
R 2 = 6 7 . 7 %
I n t e n t i o n t o U s e
R 2 = 7 0 . 2 %
D e g r e e o f
P a r t i c i p a t i o n
J o b L e v e l
( D i r e c t o r / m a n a g e r v s
N o n - d i r e c t o r /
m a n a g e r )
F u n c t i o n a l s p e c i a l i t y
( C l i n i c i a n v s N o n -
c l i n i c i a n )
P e
r c e i v e d
U s e f
u l n e s s f o r
O r g a n i s a t i o n
R 2
= 3 6 . 0 %
0 . 2 6 8 *
N S
N S
- 0 . 2 8 4 *
- 0 . 3 7 9 * *
N S
N S
0 . 4 4 3 * *
0 . 2 6 8 *
0 . 5 2 * * *
0 . 5 5 8 * * *
N S
N S
0 . 5 8 1 * * *
0 . 4
4 4 * *
0 . 3 1 8 *
0 . 4 4 4 * *
N S
N S
N o t e s :
N S : N o t S i g n i f
i c a n t .
∗
: p <
0 . 0 5 l e v e l o f s i g n i f i c a n c e .
∗ ∗
: p <
0 . 0 1 l e v e l o f s i g n i f i c a n c e .
∗ ∗ ∗
: p <
0 . 0 0 1 l e v e l o f s i g n i f i c a n c e .
C 2011 Blackwell Publishing Ltd
5/16/2018 Adoption of Concept of Balance Scorecard in Nsw Health - slidepdf.com
http://slidepdf.com/reader/full/adoption-of-concept-of-balance-scorecard-in-nsw-health 15/27
ADOPTION OF THE CONCEPT OF A BALANCED SCORECARD 349
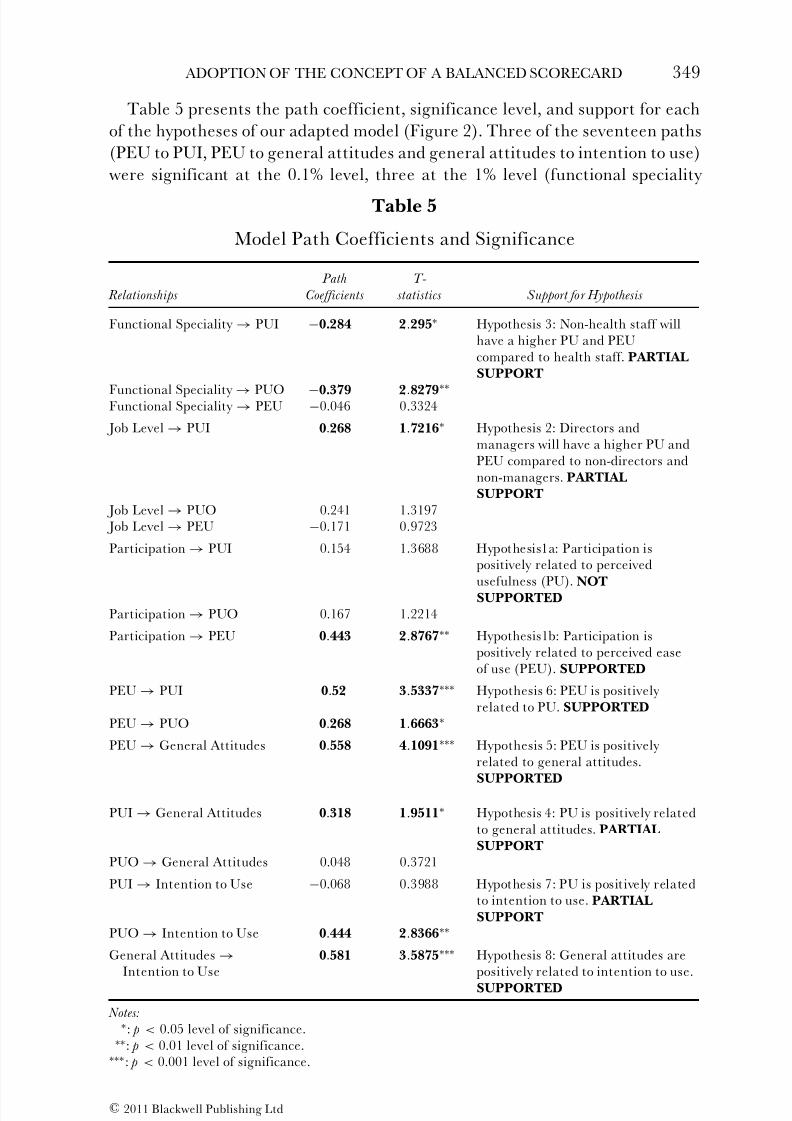
Table 5 presents the path coefficient, significance level, and support for each
of the hypotheses of our adapted model (Figure 2). Three of the seventeen paths
(PEU to PUI, PEU to general attitudes and general attitudes to intention to use)
were significant at the 0.1% level, three at the 1% level (functional speciality
Table 5
Model Path Coefficients and Significance
Path T-
Relationships Coefficients statistics Support for Hypothesis
Functional Speciality → PUI −0.284 2.295∗ Hypothesis 3: Non-health staff willhave a higher PU and PEUcompared to health staff. PARTIALSUPPORT
Functional Speciality → PUO −0.379 2.8279∗∗
Functional Speciality → PEU −0.046 0.3324
Job Level → PUI 0.268 1.7216∗ Hypothesis 2: Directors andmanagers will have a higher PU andPEU compared to non-directors andnon-managers. PARTIALSUPPORT
Job Level → PUO 0.241 1.3197 Job Level → PEU −0.171 0.9723
Participation → PUI 0.154 1.3688 Hypothesis1a: Participation ispositively related to perceived
usefulness (PU). NOTSUPPORTEDParticipation → PUO 0.167 1.2214
Participation → PEU 0.443 2.8767∗∗ Hypothesis1b: Participation ispositively related to perceived easeof use (PEU). SUPPORTED
PEU → PUI 0.52 3.5337∗∗∗ Hypothesis 6: PEU is positively related to PU. SUPPORTED
PEU → PUO 0.268 1.6663∗
PEU → General Attitudes 0.558 4.1091∗∗∗ Hypothesis 5: PEU is positively related to general attitudes.
SUPPORTED
PUI → General Attitudes 0.318 1.9511∗ Hypothesis 4: PU is positively relatedto general attitudes. PARTIALSUPPORT
PUO → General Attitudes 0.048 0.3721
PUI → Intention to Use −0.068 0.3988 Hypothesis 7: PU is positively relatedto intention to use. PARTIALSUPPORT
PUO → Intention to Use 0.444 2.8366∗∗
General Attitudes →Intention to Use
0.581 3.5875∗∗∗ Hypothesis 8: General attitudes arepositively related to intention to use.SUPPORTED
Notes:∗: p < 0.05 level of significance.∗∗: p < 0.01 level of significance.∗∗∗: p < 0.001 level of significance.
C 2011 Blackwell Publishing Ltd

5/16/2018 Adoption of Concept of Balance Scorecard in Nsw Health - slidepdf.com
http://slidepdf.com/reader/full/adoption-of-concept-of-balance-scorecard-in-nsw-health 16/27
350 DYBALL, CUMMINGS AND YU
to PUO, participation to PEU and PUO to intention to use), with another four
(functional speciality to PUI, job level to PUI, PEU to PUO and PUI to general
attitudes) significant at the 5% level.
The analysis demonstrates that the strongest positive relationships are along
the path starting from participation to PEU ( p < 0.01), PEU to general attitudes( p < 0.001), and finally general attitudes to intention to use ( p < 0.001).
These results suggest that in NSW Health’s Sydney Head Office and HNEH,
participation in the process of designing and implementing the BSC is useful in
predicting employee perceptions on the BSC’s ease of use, which in turn allows
prediction of attitudes toward and intention to use the BSC concept. In addition,
PEU could significantly predict PUI ( p < 0.001), which then anticipates staff’s
general attitudes ( p < 0.05). PUO ( p < 0.05) is also significantly related to staff’s
intention to use ( p < 0.01).
The expectation that different variables impact upon PU and PEU was alsopartially supported at the 1% and 5% levels. Job level appears to affect PUI ( p <
0.05), which suggests that directors and managers embrace the attitude that the
BSC is more useful personally, compared to employees who are neither directors
nor managers. Functional speciality appears to be related to both PUI ( p < 0.05)
and PUO ( p < 0.01), with clinicians seemingly of the view that the BSC was not as
useful personally or for the organisation, compared with non-clinicians. However,
both job level and functional specialty did not appear to have any relationships
with PEU, which was predominantly influenced by participation. Interestingly,
the results suggest that participation was not related to employee opinion onBSC usefulness. Another interesting finding is that PUI can significantly affect
general attitudes ( p < 0.05), but not intention to use, whilst PUO has significant
influence on intention to use ( p < 0.01), but not general attitudes.8
Two-sample t-tests were also conducted to identify which group of respondents
had a greater opportunity to participate in the design and implementation of
the BSC. The results indicate that job level has a significant relationship ( p
< 0.01) with participation. This suggests that directors/managers participated
more often compared to non-director/manager employees.
Another two-sample t-test was used to compare the mean results of Sydney Head Office and HNEH respondents. The results demonstrated that there
were significant differences between these two groups with respect to perceived
usefulness ( p < 0.05) and general attitudes ( p < 0.05). Respondents from the
Sydney Head Office, perceived the BSC to be more useful and had a more
positive attitude to the BSC compared to respondents from the HNEH who are
physically located within a hospital campus.9
CONCLUSION, LIMITATIONS AND AREAS FOR FURTHER RESEARCH
This study of staff attitudes toward the adoption of the BSC concept at NSW
Health and HNEH sought to answer: (1) how perceived usefulness and perceived
ease of use of the BSC are related to attitudes toward, and consequent intention
C 2011 Blackwell Publishing Ltd

5/16/2018 Adoption of Concept of Balance Scorecard in Nsw Health - slidepdf.com
http://slidepdf.com/reader/full/adoption-of-concept-of-balance-scorecard-in-nsw-health 17/27
ADOPTION OF THE CONCEPT OF A BALANCED SCORECARD 351
to use the BSC; and (2) how job level, functional speciality and degree of
participation predict the perceived usefulness and perceived ease of use of the
BSC. The findings demonstrated that in the context of BSC adoption in a public
health sector setting, participation and perceived ease of use (PEU) are key
variables that predicted employee attitudes and ultimately intention to use theBSC. Participation positively influences staff PEU of the BSC. PEU, in turn,
is positively correlated with staff perceived usefulness (both at individual and
organisational level: PUI and PUO) of the BSC and general attitudes. This
finding implies that staff perceived the BSC to be useful if it was easy to use.
With increasing pressures from the public and other government agencies for
greater service and accountability from NSW Health, one could appreciate that
any performance management system that is difficult to use will not be seen as
useful. Results also indicate that job level and functional specialty could affect
respondents’ (management and employee) perceptions regarding the strategicusefulness of the BSC. Directors and managers embrace the BSC as more useful,
compared with employees who are neither directors nor managers. Clinicians
also seem to view the BSC as less useful when compared with non-clinicians,
which partly confirms prior findings by Aidemark (2001) and is consistent
with Jacobs’ (2005) assessment of a seemingly antagonistic view of the medical
profession toward accounting practices.
Further analyses revealed also that managers participated more often than
non-managerial staff across different functional specialities in the design and
implementation of the BSC concept. This finding follows normative advice from Assiri et al. (2006) who, in their road map to successful BSC implementation,
identify as a dominant factor executives’ and senior managers’ commitment.
They recommend that senior management be actively responsible for and
involved in BSC implementation at the ground level. This study’s findings,
however, suggest that there is a point where senior management needs to
allow non-managerial staff to participate if they want to engender positive
general staff attitudes toward the BSC. Respondents from NSW Health, who
operate within a strategic managerial/office based environment also appear to
perceive the BSC to be more useful and had a more positive attitude toward itcompared to respondents from HNEH, who are closer to the interface between
hospital systems, patient care and community needs, and who are responsible
for the primary collation of much of the data. Consequently, the benefits of
a BSC need to be clearly articulated to clinicians, who are physically tasked
with providing these health services. Instead of being perceived as a purely
burdensome managerial tool, the BSC process must be seen as beneficial
and relevant to those professionals involved in gathering and achieving BSC
indicators, for this process to be effective.
The application of a modified TAM in a different context, viz, the healthsector and the BSC system, reveal findings that deviate from previous empirical
studies examining the application of technology. In particular, PEU was found
to be a fundamental predictor of usage intentions in our context instead of PU,
C 2011 Blackwell Publishing Ltd

5/16/2018 Adoption of Concept of Balance Scorecard in Nsw Health - slidepdf.com
http://slidepdf.com/reader/full/adoption-of-concept-of-balance-scorecard-in-nsw-health 18/27
352 DYBALL, CUMMINGS AND YU
which was more relevant in applications of technology. The implications are
that in complex public organisations like NSW Health and HNEH which are
subject to competing stakeholder interests, needs, and expectations; eliciting
individual staff acceptance and uptake of any system requires a PEU of systems
instead of PU.The findings of this study, however, are subject to at least three limitations.
First is the intrinsic limitation of the survey method, which others refer to as
defects in the process of designing and conducting the survey. Technically, self-
administered questionnaires can be subject to measurement errors which are
the result of social desirability bias (Singleton and Straits, 2005). The second
limitation is the small sample size of the study, which limits the generalisability
of the results beyond NSW Health. Future research examining results from
other area health services, which have, or may consider the adoption and
implementation of a BSC at a future date might reveal different results.The third limitation is with the PLS path analysis approach to analysing the
survey results. The nature of the PLS approach is rather exploratory and data-
driven than confirmatory. It is usually referred to as a ‘soft’ modelling approach
because no normality hypothesis is claimed to be required, there seems to be no
needed constraint on the measurement scale of the manifest indicators and the
number of observations may be limited with respect to the number of variables
(Vinzi, 2007). Thus the small and targeted sample respondents of BSC workshop
attendees at the NSW Health combined with the PLS path analysis approach
limit the generalisability of results outside of the NSW Health.However, we encourage other management accounting researchers to con-
tinue to use the PLS path analysis approach to develop theories (see also Smith
and Langfield-Smith, 2004). There are also other areas of research arising
out of this exploratory study. In this project, job level was simply categorised
into director/manager and non-director/manager. Functional speciality was cat-
egorised into clinician and non-clinician. In future research, other employment
categories could be explored. More importantly, the attitudes of stakeholders
other than employees (including members of the local community and patients)
could be solicited in order to provide a ‘balanced’ assessment of the relevanceof the BSC to the health sector from a recipient perspective. Finally, this study
only considered the relationship between three factors (participation, job level
and functional specialty) and PU, PEU and general attitudes that consequently
affected the intention to use the BSC. Future research could test other factors
affecting PU and PEU, from alternate models, including organisational culture
and structure, the relationship between attitudes and executive commitment
and project ownership. Alternatively the proposed theoretical framework could
be applied in a longitudinal study. With the health sector facing ever increasing
expectations by the public for better performance and service, new systemsof performance measurement should enable health agencies to become more
efficient and effective. This paper highlighted and explored a key element in
successful implementation of the BSC as a PMS, that of staff acceptance.
C 2011 Blackwell Publishing Ltd
5/16/2018 Adoption of Concept of Balance Scorecard in Nsw Health - slidepdf.com
http://slidepdf.com/reader/full/adoption-of-concept-of-balance-scorecard-in-nsw-health 19/27
ADOPTION OF THE CONCEPT OF A BALANCED SCORECARD 353
A P P E N
D I X A
2 0 0 7 H u n
t e r N e w E n g l a n d - N S W
H e a l t h P e r f o r m a n c e F r a m e w o r k
C 2011 Blackwell Publishing Ltd

5/16/2018 Adoption of Concept of Balance Scorecard in Nsw Health - slidepdf.com
http://slidepdf.com/reader/full/adoption-of-concept-of-balance-scorecard-in-nsw-health 20/27
354 DYBALL, CUMMINGS AND YU
A P P E N
D I X B
I t e m R e l i a b i l i t y L o a d i n g s
I t e m s
L o a d i n g s
D e s c
r i p t i o n
P e r c e i v e d U s e f u l n e s s f o r I n d i v i d u a l
A t m y o r g
a n i s a t i o n , u s i n g a B S C w o u
l d :
P U 1
0 . 8 6 7 2
i m p r o v e
m y j o b p e r f o r m a n c e
P U 2
0 . 9 1 3 9
i n c r e a s e
m y j o b p r o d u c t i v i t y
P U 3
0 . 7 9 6 3
m a k e i t
e a s i e r f o r m e t o p e r f o r m m y
t a s k s
P U 1 1
0 . 7 2 8 5
e n a b l e m y o r g a n i s a t i o n t o a l i g n o r g a n i s a t i o n a l a n d p e r s o n a l g o a l s
P U 1 7
0 . 8 4 4 4
e n a b l e m y o r g a n i s a t i o n ’ s ‘ s t a k e h o l d e r s ’ t o b e t t e r a s s e s s f i r m p e r f o r m a n c e
P U 1 9
0 . 9 3 8 8
O v e r a l l
t h e B S C w o u l d b e u s e f u l t o m
e
P U 2 0
0 . 7 9 8 5
O v e r a l l
t h e B S C w o u l d b e u s e f u l t o t h e o r g a n i s a t i o n a s a w h o l e
P e r c e i v e d U s e f u l n e s s f o r O r g a n i s a t i o n
A t m y o r g
a n i s a t i o n , u s i n g a B S C w o u
l d :
P U 4
0 . 7 8 4 1
e n h a n c e o r g a n i s a t i o n a l e f f i c i e n c y
P U 5
0 . 8 5 1 4
e n h a n c e o r g a n i s a t i o n a l e f f e c t i v e n e s s
P U 6
0 . 8 0 3 2
h e l p i d e
n t i f y t h e o r g a n i s a t i o n s m a i n p e r f o r m a n c e d r i v e r s
P U 7
0 . 6 7 2 8
h e l p i d e
n t i f y a n d m a n a g e o r g a n i s a t i o
n a l r i s k s
P U 8
0 . 6 1 2 9
e n a b l e m y o r g a n i s a t i o n t o c l a r i f y a n d
g a i n c o n s e n s u s a b o u t s t r a t e g
y
P U 9
0 . 7 7 5 5
e n a b l e m y o r g a n i s a t i o n t o i d e n t i f y a n
d a l i g n s t r a t e g i c i n i t i a t i v e s
P U 1 0
0 . 7 8 2 9
e n a b l e m y o r g a n i s a t i o n t o c o m m u n i c a t e i t s s t r a t e g y
P U 1 2
0 . 7 3 2 0
e n a b l e m y o r g a n i s a t i o n t o p e r f o r m p e r i o d i c a n d s y s t e m a t i c s t r a t e g i c r e v i e w s
P U 1 3
0 . 6 9 1 1
e n a b l e m y o r g a n i s a t i o n t o r e c e i v e f e e
d b a c k o n a r e a s f o r i m p r o v e m e n t
P U 1 4
0 . 7 5 7 7
e n a b l e m y o r g a n i s a t i o n t o b a l a n c e s h o r t - a n d l o n g - t e r m o b j e c t i v e s
P U 1 5
0 . 6 5 8 8
e n a b l e m y o r g a n i s a t i o n t o b a l a n c e f i n
a n c i a l a n d n o n - f i n a n c i a l t a r g e t s
P U 1 6
0 . 4 7 0 2
e n a b l e m y o r g a n i s a t i o n t o b a l a n c e e x
t e r n a l a n d i n t e r n a l t a r g e t s
P U 1 8
0 . 5 6 8 1
b e p r o b l e m a t i c f o r m e a s I a m s t i l l c o
n f u s e d a s t o w h a t t h e p u r p o s e o f t h e B S C
i s a c t u a l l y f o r
C 2011 Blackwell Publishing Ltd

5/16/2018 Adoption of Concept of Balance Scorecard in Nsw Health - slidepdf.com
http://slidepdf.com/reader/full/adoption-of-concept-of-balance-scorecard-in-nsw-health 21/27
ADOPTION OF THE CONCEPT OF A BALANCED SCORECARD 355
A P P E N D I X B
( C o n t i n u e d )
I t e m s
L o a d i n g s
D e s c
r i p t i o n
P e r c e i v e d E a s e o f U s e
A t m y o r g
a n i s a t i o n , I w o u l d f i n d t h a t
t h e B S C :
P E U 1
0 . 6 4 2 0
w o u l d b
e e a s y t o l e a r n
P E U 2
0 . 6 8 5 0
w o u l d n
o t t a k e u p t o o m u c h o f m y t i m
e
P E U 3
0 . 8 2 0 1
w o u l d b
e c l e a r a n d u n d e r s t a n d a b l e
P E U 4
0 . 8 0 2 7
w o u l d b
e f l e x i b l e i n t e r m s o f i n t e r a c t i o n
P E U 5
0 . 6 5 2 4
w o u l d a l l o w m e t o b e c o m e s k i l f u l i n u
s i n g i t
P E U 6
0 . 5 7 0 8
w o u l d m
a k e i t e a s i e r t o c o - o r d i n a t e w
i t h o t h e r d e p a r t m e n t s
P E U 7
0 . 8 1 6 4
w o u l d m
a k e i t e a s i e r t o a l i g n d e p a r t m
e n t a l g o a l s w i t h o r g a n i s a t i o n
a l g o a l s
c o m p a r e d t o o t h e r p e r f o r m a n c e m e a s u r e m e n t s y s t e m s
P E U 8
0 . 6 8 1 7
w o u l d m
a k e i t e a s i e r t o u n d e r s t a n d h o w w e l l w e a r e a l i g n i n g o u r o b j e c t i v e s w i t h
p e r f o r m a n c e i n d i c a t o r s
P E U 9
0 . 4
3 7 5
w o u l d b
e e a s y t o u n d e r s t a n d a s p l e n t y o f g u i d a n c e h a s b e e n p r o v i d e d a b o u t
w h a t t h e B S C i s a l l a b o u t
P E U 1 0
0 . 7 2 6 4
w o u l d b
e e a s y t o u s e b e c a u s e w e a l r e a d y c o l l e c t d a t a a n d r e p o r t o n
t h e a r e a
P E U 1 1
0 . 8 6 1 8
O v e r a l l , I w o u l d f i n d t h e B S C e a s y t o
u s e
D e g r e e o f P
a r t i c i p a t i o n
A t m y o r g
a n i s a t i o n :
P A R 1
0 . 8 7 5 1
m y o p i n
i o n s a n d / o r s u g g e s t i o n s a r e s o u g h t w h e n s e t t i n g B S C K e y P e r f o r m a n c e
I n d i c a t o r s ( K P I s )
P A R 2
0 . 8 2 2 7
I w i l l b e
i n v o l v e d i n d e s i g n i n g a n d s e t t i n g s o m e B S C K P I s
P A R 3
0 . 8 0 4 3
I h a v e a
s i g n i f i c a n t d e g r e e o f i n f l u e n c e i n s e t t i n g B S C K P I s
P A R 4
0 . 6 8 0 3
I w i l l b e
a b l e t o d e c i d e w h a t B S C K P I s a r e u s e d
P A R 5
0 . 7 3 0 4
I w i l l b e
i n v o l v e d i n c o m m u n i c a t i n g t h e B S C t o o t h e r e m p l o y e e s
P A R 6
0 . 8 5 8 8
I w i l l b e
i n v o l v e d i n c o n d u c t i n g r e v i e w s o f t h e B S C
P A R 7
0 . 7 8 1 8
I w i l l b e
i n v o l v e d i n m e e t i n g s o n t h e B S C
P A R 8
0 . 7 8 8 5
I w i l l b e
i n v o l v e d i n d e v e l o p i n g a n i m
p l e m e n t a t i o n p l a n f o r t h e B S C
P A R 9
0 . 8 3 8 4
O v e r a l l , I h a v e a s i g n i f i c a n t a m o u n t o f p a r t i c i p a t i o n a n d i n v o l v e m e n t i n t h e
B S C p r o j e c t
C 2011 Blackwell Publishing Ltd

5/16/2018 Adoption of Concept of Balance Scorecard in Nsw Health - slidepdf.com
http://slidepdf.com/reader/full/adoption-of-concept-of-balance-scorecard-in-nsw-health 22/27
356 DYBALL, CUMMINGS AND YU
A P P E N D I X B
( C o n t i n u e d )
I t e m s
L o a d i n
g s
D e s c r
i p t i o n
G e n e r a l A t t i t u d e s
I n m y o r g a n i s a t i o n :
A T T 1
0 . 8 3 3 4
I l i k e t h e i d e a o f u s i n g a B S C
A T T 2
0 . 6 9 2 4
t h e r e a s o n s p r o v i d e d f o r u s i n g e a c h o f
t h e B S C m e a s u r e m e n t s a r e s
o u n d a n d / o r
l o g i c a l
A T T 3
0 . 8 0 5 4
u s i n g t h e B S C w o u l d b e a p l e a s a n t e x p e r i e n c e
A T T 4
0 . 5 7 0 9
e v e n i f a
B S C s a v e s t i m e , I w o u l d p r e f
e r a n o t h e r p r e v i o u s o r n e w p e
r f o r m a n c e
m a n a g e
m e n t s y s t e m
A T T 5
0 . 4 8 3 9
I f e e l I n
e e d m o r e s u p p o r t i n m a n a g i n
g p e r f o r m a n c e a g a i n s t t a r g e t s
A T T 6
0 . 1 0 1
3
i f m o r e t
r a i n i n g c o u r s e s f o r B S C a r e a
v a i l a b l e , I a m i n t e r e s t e d i n t a
k i n g t h e m
A T T 7
0 . 4 9 8 2
u s i n g t h e B S C l e a d s t o u p p e r m a n a g e m e n t w a n t i n g m o r e a n d m o r e
r e p o r t s ,
s o m e o f w h i c h m a y b e u n n e c e s s a r y
A T T 8
0 . 7 1 4 0
t h e B S C
w i l l m a k e w o r k m o r e i n t e r e s t i n g
A T T 9
0 . 8 1 0 0
t h e B S C
s h o u l d h a v e b e e n i m p l e m e n t e d a l o n g t i m e a g o
A T T 1 0
0 . 8 5 6 0
O v e r a l l ,
I h a v e a p o s i t i v e a t t i t u d e a b o u t t h e B S C
I n t e n t i o n t o U s e
I n m y o r g a n i s a t i o n :
I N T E N 1
0 . 8 8 0 0
I i n t e n d
t o s u p p o r t t h e a d o p t i o n o f t h e B S C
I N T E N 2
0 . 9 1 5 5
i f I w e r e
a s k e d t o e x p r e s s m y o p i n i o n r e g a r d i n g t h e a d o p t i o n o f t h e
B S C , I
i n t e n d t o s a y s o m e t h i n g f a v o u r a b l e
I N T E N 3
0 . 8 4 1 9
i f I c o u l d
m a k e t h e d e c i s i o n t o a d o p t t
h e B S C , I i n t e n d t o
I N T E N 4
0 . 6 9 9 5
I i n t e n d
t o u s e B S C f o r o t h e r a r e a s o f
m y d a i l y e m p l o y m e n t r e s p o n s i b i l i t i e s
C 2011 Blackwell Publishing Ltd

5/16/2018 Adoption of Concept of Balance Scorecard in Nsw Health - slidepdf.com
http://slidepdf.com/reader/full/adoption-of-concept-of-balance-scorecard-in-nsw-health 23/27
ADOPTION OF THE CONCEPT OF A BALANCED SCORECARD 357
NOTES
1 According to the authors cited, there are three levels of a successful system implementationincluding but not limited to the technical level, where the focus is on the accuracy and efficiency of a system.
2 A recent study that provides empirical evidence on the BSC’s effect on performance is DeGeuser et al. (2009).
3 Exchange rate is US$1:A$.9252 as at 23 October, 2009.4 The survey instrument is available on request from the corresponding author.5 The authors thank one of the anonymous referees for this comment.6 A two-sample T -test was used to compare the means of survey responses of early and late
respondent groups. The results indicated that there were no statistically significant differencesin all the constructs at the 5% level of significance.
7 A method for estimating population parameters by repeatedly ‘resampling’ the same sample,computing test statistics on each aspect of the sample and then examining the distribution of the test statistic across the entire sample.
8 As there is no proper overall goodness-of-fit measures in the PLS approach, Hulland (1999)suggests that the r-squared ( R2) for all dependent constructs should be reported. Unfortunately,as far as we know, there is no similar research in the BSC area to this project, so it is difficultto compare the current study’s R2s with previous research. Hulland (1999), however, statedthat the spread of R2s in previous studies that used PLS had ranged from 12% to 64%. So, ingeneral, the R2s for General Attitudes (67.7%) and Intention to Use (70.2%) are more thansatisfactory and the R2s for PUI (54.7%), PUO (36%) and PEU (17.8%) are at a reasonablelevel.
9 Tests of multicollinearity among Functional Speciality, Job Level and Participation (not shown)indicated that there are no multicollinearity problems with tolerances above 0.20 and the
variation inflation factor (VIF) less than 5.
REFERENCES
Abernethy, M.A., A.K.-D. Schulz and S. Bell (2007), ‘Translating Organizational LearningOrientation into Performance: The Role of Management Control System’, Working Paper(The University of Melbourne).
Adams, E.F., D.R. Laker and C.L. Hulin (1977), ‘An Investigation of the Influence of Job Leveland Functional Specialty on Job Attitudes and Perceptions’, Journal of Applied Psychology, Vol.62, No. 3, pp. 334–43.
Agarwal, R. and J. Prasad (1998), ‘The Antecedents and Consequents of User Perceptions inInformation Technology Adoption’, Decision Support Systems, Vol. 22, No. 1, pp. 15–29.
Ahn, H. (2001), ‘Applying the Balanced Scorecard Concept: An Experience Report’, Long Range Planning,Vol. 34, pp. 441–61.
Aidemark, L.-G. (2001), ‘The Meaning of Balanced Scorecards in the Health Care Organisation’, Financial Accountability & Management, Vol. 17 No. 1, pp. 23–40.——— and E.K. Funck (2009), ‘Measurement and Health Care Management’, Financial
Accountability & Management, Vol. 52, No. 2, pp. 253–76. Anderson, S.W., J.W. Hesford and S.M. Young (2002), ‘Factors Influencing the Performance of
Activity Based Costing Teams: A Field Study of ABC Model Development Time in the Automobile Industry’, Accounting, Organizations and Society, Vol. 27, No. 3, pp. 195–211.
Andon, P., J. Baxter and H. Mahama (2005), ‘The Balanced Scorecard: Slogans, Seduction andState of Play’, Australian Accounting Review, Vol. 15, No. 1, pp. 29–38.
Assiri, A., M. Zairi and E. Riyad (2006), ‘How to Profit from the Balanced Scorecard: AnImplementation Roadmap’, Industrial Management and Data Systems, Vol. 106, No. 7, pp.937–52.
Atkinson, A.A. and J.Q. McCrindell (1997), ‘Strategic Performance Measurement’, CMA Magazine(April), pp. 20–23.Banker, R.D., H. Chang, S.N. Janakiraman and C. Konstans (2004), ‘A Balanced Scorecard Analysis
of Performance Metrics’, European Journal of Operations Research, Vol. 154, pp. 423–36.
C 2011 Blackwell Publishing Ltd
5/16/2018 Adoption of Concept of Balance Scorecard in Nsw Health - slidepdf.com
http://slidepdf.com/reader/full/adoption-of-concept-of-balance-scorecard-in-nsw-health 24/27
358 DYBALL, CUMMINGS AND YU
Barki, H. and J. Hartwick (1994), ‘Measuring User Participation, User Involvement, and User Attitude’, MIS Quarterly, Vol.18, No. 1, pp. 59–82.
Bhattacherjee, A. and C. Sanford (2006), ‘Influence Processes for Information Technology Acceptance: An Elaboration Likelihood Model’, MIS Quarterly, Vol. 30, No. 4, pp. 805–25.
Bilkhu-Thompson, M.K. (2003), ‘A Process Evaluation of a Health Care Balanced Scorecard’,
Journal of Health Care Finance, Vol. 30, No. 2, pp. 37–64.Bradley, L. and R. Parker (2006), ‘Do Australian Public Sector Employees Have the Type of CultureThey Want in the Era of New Public Management?’, Australian Journal of Public Administration,
Vol. 65, No. 1, pp. 89–99.Butler, A., S.R. Letza and B. Neale (1997), ‘Linking the Balanced Scorecard to Strategy’, Long
Range Planning, Vol. 30, No. 2, pp. 242–53.Calantone, R.J., D.A. Griffith and G. Yalcinkaya (2006), ‘An Empirical Examination of a
Technology Adoption Model for the Context of China’, Journal of International Marketing, Vol.14, No. 4, pp. 1–27.
Campbell, D.T. and D.W. Fiske (1959), ‘Convergent and Discriminant Validation by the Multitrait-Multimethod Matrix’, Psychological Bulletin, Vo. 56, pp. 81–105.
Chan, Y.-C.L. (2006), ‘An Analytic Hierarchy Framework for Evaluating Balanced Scorecards of
Healthcare Organizations’, Canadian Journal of Administrative Sciences Vol. 23, No. 2, pp. 85–104.Chenhall, R.H. (2005), ‘Integrative Strategic Performance Measurement Systems, Strategic Alignment of Manufacturing, Learning and Strategic Outcomes: An Exploratory Study’, Accounting, Organizations and Society, Vol. 30, No.5, pp. 395–422.
Chin, W.W. (1999), ‘Structural Equation Modelling Analysis with Small Samples Using PartialLeast Squares’, in R.H. Hoyle (ed.), Statistical Strategies for Small Sample Research (SagePublications, Thousand Oaks, California).
——— (2007), Overview of the PLS Method (1997) (Available from http://disc-nt.cba.uh.edu/chin/PLSINTRO.HTM, accessed 2/9/07).
Chow, C.W., D. Ganulin, O. Teknika, K. Haddad and J. Williamson (1998), ‘The Balanced Score-card: A Potent Tool for Energizing and Focusing Healthcare Organization Management’,
Journal of Healthcare Management, Vol. 43, No. 3, pp. 263–80.
Davis, F.D. (1989), ‘Perceived Usefulness, Perceived Ease of Use, and User Acceptance of Information Technology’, MIS Quarterly, Vol. 13, No. 3, pp. 318–40.———, R.P. Bagozzi and P.R. Warshaw (1989), ‘User Acceptance of Computer Technology: A
Comparison of Two Theoretical Models’, Management Science, Vol. 35, No. 8, pp. 982–1003.Davis, S. and T. Albright (2004), ‘An Investigation of the Effect of Balanced Scorecard
Implementation on Financial Performance’, Management Accounting Research, Vol. 15, No. 2,pp. 135–53.
De Geuser, F., S. Mooraj and D. Oyon (2009), ‘Does the Balanced Scorecard Add Value? EmpiricalEvidence on its Effect on Performance’, European Accounting Review, Vol. 18, No. 1, pp. 93–122.
Degeling, P. (2000), ‘Reconsidering Clinical Accountability: An Examination of Some DilemmasInherent in Efforts to Bolster Clinician Accountability’, International Journal of Health Planning and Management, Vol.15, No. 3, pp. 3–16.
———, J. Kennedy, M. Hill, M. Carnegie and J. Holt (1998), Professional Sub-cultures and Hospital Reform (The Centre for Hospital Management and Information Systems Research, University of New South Wales, Sydney).
DeLone, W.H. and E.R. McLean (1992), ‘Information Systems Success: The Quest for theDependent Variable’, Information Systems Research, Vol. 3, No. 1, pp. 60–95.
——— ——— (2003), ‘The DeLone and McLean Model of Information Systems Success: A Ten- Year Update’, Journal of Management Information Systems, Vol. 19, No. 4, pp. 9–30.
Ferguson, C. (1997), ‘The Effects of Microcomputers on the Work of Professional Accountants’, Accounting and Finance, Vol.37, No. 1, pp. 41–67.
Fishbein, M. and I. Ajzen (1975), Belief, Attitude, Intention, and Behavior: An Introduction to Theory and Research (Addison-Wesley Pub. Co, Reading, Massachusetts).
Fornell, C. and F.L. Bookstein (1982), ‘Two Structural Equation Models: LISREL and PLS Applied
to Consumer Exit-Voice Theory’, Journal of Marketing Research, Vol.19, No.4, pp. 440–52.———, P. Lorange and J. Roos (1990), ‘The Cooperative Venture Formation Process: A Latent
Variable’, Management Science, Vol. 36, No. 10, p. 1246.Hartwick, J. and H. Barki (1994), ‘Explaining the Role of User Participation in Information System
Use’, Management Science, Vol. 40, No. 4, pp. 440–65.
C 2011 Blackwell Publishing Ltd
5/16/2018 Adoption of Concept of Balance Scorecard in Nsw Health - slidepdf.com
http://slidepdf.com/reader/full/adoption-of-concept-of-balance-scorecard-in-nsw-health 25/27
ADOPTION OF THE CONCEPT OF A BALANCED SCORECARD 359
Hood, C. (1995), ‘The “New Public Management” in the 1980’s: Variations on a Theme’, Accounting,Organizations and Society, Vol. 20, No. 2/3, pp. 93–190.
Hrebiniak, L.G. (1974), ‘Effects of Job Level and Participation on Employee Attitudes andPerceptions of Influence’, Academy of Management Journal, Vol. 17, No. 4, pp. 649–62.
Hulland, J. (1999), ‘Use of Partial Least Squares (PLS) in Strategic Management Research: A
Review of Four Recent Studies’, Strategic Management Journal, Vol. 20, No. 2, pp. 195–204.Inamdar, N. and R.S. Kaplan (2002), ‘Applying the Balanced Scorecard in Healthcare ProviderOrganizations’, Journal of Healthcare Management, Vol. 47, No. 3, pp. 179–95.
Ittner, C.D. and D. Larcker (1998), ‘Innovations in Performance Measurement: Trends andResearch Implications’, Journal of Management Accounting Research, Vo. 10, pp. 205–38.
——— ——— and M.V. Rajan (1997), ‘The Choice of Performance Measures in Annual BonusContracts’, Accounting Review, Vol. 72, No. 2, p. 231.
Islam, M and F.W. Kellermanns (2006), ‘Firm- and Individual-Level Determinants of BalancedScorecard Usage’, Canadian Accounting Perspectives, Vol. 5, No. 2, pp. 181–207.
Jacobs, K. (2005), ‘Hybridisation or Polarisation: Doctors and Accounting in the UK, Germany and Italy’, Financial Accountability & Management, Vol. 21, No. 2, pp. 135–61.
Jarrar, N.S., M. Smith and C. Dolley (2007), ‘Perceptions of Preparers and Users of Accounting
Change: A Case Study in an Australian University’, Managerial Auditing Journal, Vol. 22, No.1,pp. 80–94. Johnsen, A. (2001), ‘Balanced Scorecard: Theoretical Perspectives and Public Management
Implications’, Managerial Auditing Journal, Vol. 16, No. 6, pp. 319–30. Jones, C.S. and I.P. Dewing (1997), ‘The Attitudes of NHS Clinicians and Medical Managers
Towards Changes in Accounting Controls’, Financial Accountability & Management, Vol. 13, No.3, pp. 261–79.
Joreskog K.G. and H. Wold (1982), ‘The ML and PLS Techniques for Modelling with Latent Variables: Historical and Comparative Aspects’, in H. Wold and K.G. Joreskog (eds.), SystemsUnder Indirect Observation: Causality, Structure, Prediction, Part1 (Amsterdam, North Holland).
Kaplan, R.S. and D.P. Norton (1992), ‘The Balanced Scorecard – Measures That DrivePerformance’, Harvard Business Review, Vol. 70, No. 1, pp. 71–79.
——— ——— (1996), The Balanced Scorecard: Translating Strategy intoAction (Harvard Business SchoolPress, Boston, Massachusetts).——— ——— (2001), The Strategy-Focused Organization: How Balanced Scorecard Companies Thrive in
the New Business Environment (Harvard Business School Press, Boston, Massachusetts).Karahanna, E., R. Agarwal and C.M. Angst (2006), ‘Reconceptualizing Compatibility Beliefs in
Technology Acceptance Research’, MIS Quarterly, Vol. 30, No. 4, pp. 781–804.Kasurinen, T. (2002), ‘Exploring Management Accounting Change: The Case of Balanced
Scorecard Implementation’, Management Accounting Research, Vol. 13, pp. 323–43.Kellermanns, F.W. and M. Islam (2004), ‘US and German-Based Activity Costing: A Critical
Comparison and System Acceptability Propositions’, Benchmarking: An International Journal, Vol. 11, No. 1, pp. 31–51.
Kim, S. (2002), ‘Participative Management and Job Satisfaction: Lessons for Management
Leadership’, Public Administration Review, Vol. 62, No. 2, pp. 231–41.Kloot, L. and J. Martin. (2000), ‘Strategic Performance Management: A Balanced Approach toPerformance Management Issues in Local Government’, Management Accounting Research, Vol.11, No. 2, pp. 231–51.
Le Grand, J., N. Mays and J. Dixon (1998), ‘The Reforms: Success or Failure or Neither?’ in J. LeGrand, N. Mays and J. Mulligan (eds.), Learning from the NHS Internal Market (King’s Fund,London).
Macdonald, M. (1998), ‘Using the Balanced Scorecard to Align Strategy and Performance inLong-Term Care’, Healthcare Management Forum, Vol. 11, No. 3, pp. 33–38.
Malmi, T. (2001), ‘Balanced Scorecard in Finnish Companies: A Research Note’, Management Accounting Research, Vol. 12, pp. 207–20.
Milani, K.W. (1975), ‘The Relationship of Participation in Budget-Setting to Industrial Supervisor
Performance and Attitudes’, The Accounting Review, Vol. 50, No. 2, pp. 278–84.Moulang, C. (2006), ‘Does “Style of Use” of Performance Measurements Systems Impact on
Individual Creativity? An Empirical Analysis’, Working Paper (Department of Accountingand Finance, Monash University, Melbourne).
C 2011 Blackwell Publishing Ltd

5/16/2018 Adoption of Concept of Balance Scorecard in Nsw Health - slidepdf.com
http://slidepdf.com/reader/full/adoption-of-concept-of-balance-scorecard-in-nsw-health 26/27
360 DYBALL, CUMMINGS AND YU
New South Wales Department of Health (2008a) (Available at http://www.health.nsw.gov.au/aboutus/index.asp, Accessed 29/1/08).
——— (2008b), NSW Health System Performance Indicators August 2003 (Available athttp://www.health.nsw.gov.au/search.asp?qText=dashboardandGo=Goandcollection=wwwsiteandQueryMode=kword, Accessed 29/1/08).
New South Wales Hunter New England Health (2008a) (Available at http://www.HNEHhealth.nsw.gov.au/about_us/facts_and_figures, Accessed 29/1/08).——— (2008b), Health Service Strategic Plan towards 2010 (Available at http://www.health.
nsw.gov.au/pubs/2007/state_health_plan.html, Accessed 29/1/08).NSW Treasury (2007), Appropriation Bill 2007 (Available at http://www.treasury.nsw.gov.au/__
data/assets/pdf_file/0018/6363/bp5_general.pdf, Accessed 30/1/08).Norreklit, H. (2003), ‘The Balanced Scorecard: What is the Score? A Rhetorical Analysis of the
Balanced Scorecard’, Accounting Organisations and Society, Vol. 28, No. 6, pp. 591–619.Northcott, D. and N. France (2005), ‘The Balanced Scorecard in New Zealand Health Sector
Performance Management: Dissemination to Diffusion’, Australian Accounting Review, Vol. 15,No. 3, pp. 34–46.
Otley, D. (1999), ‘Performance Management: A Framework for Management Control Systems
Research’, Management Accounting Research, Vol. 10, No. 4, p. 363–82.——— (2003), ‘Management Control and Performance Management: Whence and Whither?’ The British Accounting Review, Vol. 35, pp. 309–26.
Pierce, B. and T. O’Dea (2003), ‘Management Accounting Information and the Needs of Managers:Perceptions of Managers and Accountants Compared’, The British Accounting Review, Vol. 35,No. 3, pp. 257–90.
Pineno, C.J. (2002), ‘The Balanced Scorecard: An Incremental Approach Model to Health CareManagement’, Journal of Health Care Finance, Vol.28, No. 4, pp. 69–80.
Phillips, L.A., R. Caltone and M.T. Lee (1994), ‘International Technology Adoption. BehaviourStructure, Demand Certainty and Culture’, Journal of Business and Industrial Marketing, Vol.9,No. 2, pp. 16–28.
Radnor, Z. and B. Lovell (2003), ‘Success Factors for Implementation of the Balanced Scorecard
in a NHS Multi-Agency Setting’, International Journal of Health Care Quality Assurance, Vol. 16,No. 2, pp. 99–108.Scapens, R.W. and J. Roberts (1993), ‘Accounting and Control: A Case Study of Resistance to
Accounting Change’, Management Accounting Research, Vol. 4, pp. 1–32.Singleton, R. and B.C. Straits (2005), Approaches to Social Research (4th ed., Oxford University Press,
New York).Speckbacher, G., J. Bischof and T. Pfeiffer (2003), Management Accounting Research, Vol. 14. No. 4,
pp. 361–88.Strebel, P. (1996), ‘Why do Employees Resist Change?’, Harvard Business Review (May-June),
pp. 86–92.Taylor, S. and P.A. Todd (1995), ‘Understanding Information Technology Usage: A Test of
Competing Models’, Information Systems Research, Vol. 6, No. 2, pp. 144–76.
ten Asbroek, A.H.A., O.A. Arah, J. Geelhoed, T. Custers, D.M. Delnoij and N.S. Klazinga (2004),‘Developing a National Performance Indicator Framework for the Dutch Health System’, International Journal for Quality in Health Care, Supplement, pp. 65–71.
Tuomela, T.-S. (2005), ‘The Interplay of Different Levers of Control: A Case Study of Introducinga New Performance Measurement System’, Management Accounting Research, Vol. 16, No. 3, pp.293–320.
Ukko, J., J. Tenhunen and H. Rantanen (2007), ‘Performance Measurement Impacts onManagement and Leadership: Perspectives of Management and Employees’, International
Journal of Production Economics, Vol. 110, Nos. 1 and 2, pp. 39–51. Vandenbosch, B. (1999), ‘An Empirical Analysis of the Association between the Use of Executive
Support Systems and Perceived Organizational Competitiveness’, Accounting, Organizations and Society, Vol. 24, No. 1, pp. 77–92.
Venkatesh, V. and F.D. Davis (2000), ‘A Theoretical Extension of the Technology AcceptanceModel: Four Longitudinal Field Studies’, Management Science, Vol. 46, No. 2, pp. 186–204.
———, M.G. Morris, G.B. Davis and F.D. Davis (2003), ‘User Acceptance of InformationTechnology: Toward A Unified View’, MIS Quarterly, Vol. 27, No. 3, pp. 425–78.
C 2011 Blackwell Publishing Ltd

5/16/2018 Adoption of Concept of Balance Scorecard in Nsw Health - slidepdf.com
http://slidepdf.com/reader/full/adoption-of-concept-of-balance-scorecard-in-nsw-health 27/27
ADOPTION OF THE CONCEPT OF A BALANCED SCORECARD 361
Villalbi, J.R., C. Casas, C. Borrell, J. Duran, L. Artazcoz, E. Camprubi, P. Rodriguez-Montuquinand J.M. Armengol (2007), ‘The Balanced Scorecard as a Management Tool in a PublicHealth Organization’, Gac Sanit,. Vol. 21, No. 1, pp. 60–65.
Vinz, V.E. (2007), ‘PLS Path Modeling Methodology and Software: Foundations and Re-cent Advances’ (Available at http://web.upmf-grenoble.fr/labsad/pages/ecas2007/pages/
Abstracts/abs11.pdf, Accessed 23/10/09). Voelker, K.E., J.S. Rakich and G.R. French (2001), ‘The Balanced Scorecard in HealthcareOrganizations: A Performance Measurement and Strategic Planning Methodology’, HospitalTopics, Vol. 79, No. 3, pp. 13–24.
Warren, W.H. (2006), ‘The Dynamics of Perception and Action’, Psychological Review, Vol. 113, No.2, pp. 358–89.
White, J.K. and R.A. Ruh (1973), ‘Effects of Personal Values on the Relationship BetweenParticipation and Job Attitudes’, Administrative Science Quarterly, Vol. 18, No. 4, pp. 506–14.
Wisniewski, M. and S. Olafsson (2004), ‘Developing Balaced Scorecards in Local Authorities: AComparison of Experience’, International Journal of Productivity and Performance Management, Vol.53, No. 7, pp. 603–10.
Woods, M. and S. Grubnig (2008), ‘Linking Comprehensive Performance Assessment to the
Balanced Scorecard: Evidence from Hertfordshire County Council’, Financial Accountability& Management, Vol. 24, No. 3, pp. 343–61.Wyatt, J. (2004), ‘Scorecards, Dashboards, and KPIs Keys to Integrated Performance Measure-
ment’, Healthcare Finance Management, Vol. 58, No. 2, pp. 76–80. Youngblood, A.D. and T.R. Collins (2003), ‘Addressing Balanced Scorecard Trade-off Issues
Between Performance Metrics Using Multi-Attribute Utility Theory’, Engineering Management Journal, Vol. 15, pp. 11–17.
Zelman, W.N., G.H. Pink and C.B. Matthias (2003), ‘Use of the Balanced Scorecard in HealthCare’, Journal of Healthcare Finance, Vol. 29, No. 4, pp. 1–16.
C 2011 Blackwell Publishing Ltd