adoption of animal traction technology in the builsa
TRANSCRIPT
ADOPTION OF ANIMAL TRACTION TECHNOLOGY IN THE BUILSA DISTRICT OF
UPPER EAST REGION OF GHANA
BY
CHARLES AKANGOA AKPEINTUIK
THIS THESIS IS SUBMITTED TO THE UNIVERSITY OF GHANA,
LEGON IN PARTIAL FULFILMENT OF THE REQUIREMENT FOR
THE AWARD OF M.PHIL AGRICULTURAL EXTENSION DEGREE
UNIVERSITY OF GHANA
LEGON
DECEMBER 2003
University of Ghana http://ugspace.ug.edu.gh

£374159S f i 20
University of Ghana http://ugspace.ug.edu.gh

DECLARATION
•i, CHARLES -AKANGOA AKPEINTUIK, do hereby declare that the materials covered in
this thesis are the results of my own investigations, which was supervised by Dr. P. B.
Atengdem. None of the materials contained herein, has been presented either in whole or in
part for a degree of this University or elsewhere. Work by other authors, which served as
sourcesy&f information have duly been acknowledged by references to them.
]
(SUPERVISOR)
University of Ghana http://ugspace.ug.edu.gh

DEDICATION
Behind every successful man is a woman. This work is dedicated to my beloved wife, Mrs.
Amankai Akangoa, my children, Agollie, Abayamibanoapo, Asupagsalie and
Aninakanmwailewai.
University of Ghana http://ugspace.ug.edu.gh

ACKNOW LEDGEM ENT
I first of all give thanks to the Almighty God for giving me the strength and ability to
achieve this objective.
I wish to express my sincerest gratitude to my dedicated Supervisor, Dr. P. B. Atengdem
whose critical and constructive advice has made this thesis a success. To him, I have to say
"Kobiik aem kalejik akaro allege mabiik (Fi) aen ma mwegsi. Nkaliya. Ma nye fi gyeam.
Bob dila atanla. Fe zuk ale peinte agaam mway".
I also wish to express my gratitude and thanks to Dr. F. Y. M. Fiadjoe, Dr. O. Sakyi-Dawson
and Mr. J. N. Anaglo, all lecturers at the Department of Agricultural Extension for their
guidance and encouragement during the study.
Initially, Mr. Dankyi Boateng was my supervisor but had to leave for further studies. I am
grateful to him. May God bless him in his studies.
I thank Mr. James Madakena, Madam Beatrice Manko and all the supporting staff of the
Department of Agric Extension for their cordiality and support.
My course mates, Francis Oyeh, Ababu Afelibiik and Victoria L. Tsekpo deserve special
gratitude for the friendly manner we shared experiences and supported each other. Especially,
Ababu Afelibiik who has instilled in me the culture of confidence and endurance.
University of Ghana http://ugspace.ug.edu.gh
I am highly indebted to Mr. Thomas Anaam of the Ministry of Ports, Harbours and
Railways, Accra, for his diverse assistance without which this thesis would not have been
successful. "Tom! Ma nye gyeam. Won le maafo".
My sincerest thanks are also due Mr. & Mrs. Aputiik of Ghana Education Service, Sandema
for accommodating me during my data collection.
I am also grateful to Dr. Quist, district director of Agriculture, Sandema, and his staff
especially Messrs. Francis Alando, Martin Akanko, Edward Achumbey and Cletus Amodiok,
for their co-operation and support. The farmers of Builsa Traditional Area are also
acknowledged for their patience and understanding during the data collection.
The chief of Sandema, Nab Ayieta Azantilow and Messrs. Johnson Atekinla of Sandema
Youth Centre and Cliff Trowell, Program Manager - Partners in Rural Development, Ottawa,
Canada also deserve acknowledgement for providing me with some information on the
history of animal traction in the Builsa District.
Special gratitude goes to Messrs. Stephen Agalic of MoFA, Tamale and Thomas Anisapo of
Animal research, SARI, Tamale, for their moral support.
Finally, I wish to express my sincerest gratitude and thanks to my lovely, dedicated and
dutiful wife and children for their prayers and patience during my study at the University of
Ghana, Legon. To them I say "Mi gyeanta nga meena ka nama ale soa".
v
University of Ghana http://ugspace.ug.edu.gh

ABSTRACT
The Builsa district is a peasant farming community. It had a problem of recurrent food
shortage. The use of animal traction was one of the suggested solutions to this problem,
hence its introduction in 1937. Reports suggested its low adoption. The study was to verify
the veracity and the causes of the low adoption. A conceptual framework was developed. The
concepts include: the farmers' sieve system, characteristics of animal traction technology and
environmental influences.
Adoption was found to be high (91%). At 5% significant level, the Fisher exact two-tailed
test showed no significant difference by ages, family size, ownership of donkeys, credit
received, use of lecture method of training, demonstration/lectures and demonstration/group
discussion categories and adoption. Those variables that showed significant difference
include ownership of cattle, farm size, those who received training in AT, those who received
training through demonstration alone and those who received training through group
discussion alone.
It is recommended that when introducing a new technology into a peasant farming
community like the Builsa District beneficiaries should express the need for the technology.
Traditional leaders should be involved. Financial institutions should get to the doorsteps of
farmers and educate them, on how to access credit facilities.
Further research should look into the effects of the use of AT on the environment and
schooling in the study area.
University of Ghana http://ugspace.ug.edu.gh

TABLE OF CONTENTS
Title page i
Declaration ii
Dedication iii
Acknowledgement iv
Abstract vi
Table of Contents viiList of Tables xiii
List of Figures xv
Abbreviations xvi
CHAPTER ONE: INTRODUCTION1.0 Introduction 1
1.1 Background Information 1
1.2 Problem Statement 3
1.3 Research Questions 5
1.4 Hypothesis 5
1.5 Main Objective 5
1.6 Specific Objectives 6
1.7 Key Concepts of the Research Study 6
1.7.1 Technology 6
1.7.2 Animal traction technology 7
1.7.3 Adoption o f technology 7
1.7.4 Communication of information o f a technology
for adoption. 8
1.7.5 Extension 8
1.7.6 Extension methods 9
1.8 Conceptual framework 10
1.9 Significance of the study in the Builsa District 12
CHAPTER TWO: BACKGROUND OF STUDY AREA2.0 Introduction 142.1 Location 14
2.2 Population 14
vii
University of Ghana http://ugspace.ug.edu.gh

2.3 Age Distribution
2.4 Distribution of Households by size
2.5 Topography
2.6 Climate2.7 Soils2.8 Vegetation
2.9 Economic Activities
2.10 Farming System
2.11 Agricultural Extension
14
15
15
15
16
16
17
17
18
CHAPTER THREE: THE HISTORY OF ANIMAL TRACTION IN GHANA
3.0 Introduction 19
3.1 Origin of Animal Traction 19
3.2 The Genesis of AT in Ghana 193.3 Current state of AT in Ghana 213.4 A historical development of AT in the Builsa District 21
3.4.1 Pre-Independence 213.4.2 Post Independence 25
CHAPTER FOUR: LITERATURE REVIEW4.0 Introduction 274.1 Meaning of Animal Traction 274.2 Contribution of AT to Agricultural Development 28
4.2.1 Animal Traction and Crop Yields 284.2.2 Animal Traction and Farming Systems o f Farmers 284.2.3 Animal Traction and Farmer Preferences for animals
4.2.4 Animal Traction and Different Ages and29
Gender o f Farmers 294.2.5 Animal Traction and Ownership o f Draft Animals 304.2.6 Animal Traction and Quality o f life o f Farmers 314.2.7 Animal Traction and Animal Population 31
4.3 Meaning of Communication 314.4 Adoption and the adoption process 34
viii
University of Ghana http://ugspace.ug.edu.gh

4.5 Meaning of Extension 364.6 Extension Agent and Technology Transfer 404.7 Extension Teaching Methods and Adoption 41
4.8 Technology Characteristics and Adoption 434.8.1 Relative Advantage o f the Technology 44
4.8.2 Compatibility o f Technology 44
4.8.3 Complexity o f the Technology 45
4.8.4 Trialability o f the Technology 45
4.8.5 Observability o f the Technology 45
4.9 Socio-economic Factors and Adoption 45
4.10 Socio-cultural Factors and Adoption 464.11 Constraints to the Adoption of AT Technology 46
CHAPTER FIVE: METHODOLOGY5.0 Introduction 49
5.1 Research design 50
5.2 Population of the study 50
5.3 Procedure and selection of sample 50
5.4 Agricultural Extension Agents (AEAs) 52
5.5 Instrument development 52
5.6 Data gathering process 545.6.1 Initial Arrangements 54
5.6.2 Interview Schedule 54
5.6.3 Group Discussion 55
5.7 Data Management 55
5.8 Storage and Handling of Data 56
5.9 Data Analysis 56
CHATPER SIX : CHARACTERISTICS OF THE STUDY POPULATION6.0 Introduction 58
6.1 Characteristics of Farmers 58
6.1.1 Personal Characteristics 58
6.1.2 Socio-economic characteristics 62
6.1.3 Socio-cultural characteristics 70
University of Ghana http://ugspace.ug.edu.gh
6.1.4 Summary: Characteristics o f Farmers 74
6.2 Characteristics of Extension Agents 75
6.2.1 Number o f In-service Trainings 76
6.2.2 Duration o f In-service Training 76
6.2.3 Source o f In-service Training 77
6.2.4 Methods used in Training AEAs 77
6.2.5 Reasons for inability o f AEAs to make visits
to Farmers 78
6.2.6 Problems farmers face in adoption of
animal traction 78
6.2.7 Summary: Characteristics o f Extension Agents 79
CHAPTER SEVEN : EXTENSION METHODS USED IN PROMOTING ANIMAL TRACTION
7.0 Introduction 817.1 Awareness of Animal Traction (AT) 82
7.2 Source of Awareness 82
7.3 Source of Training 83
7.4 Methods Used in Training 84
7.5 Duration of training 85
7.6 Adequacy of training 867.7 Whether respondents were trained in groups 87
7.8 Level of respondent’s participation in bullock
handling during the training 87
7.9 Level of respondent’s participation in yoking and
Nose ringing 87
7.10 Follow-up visits by trainers 88
7.11 Frequency of visits by AEAs 88
7.12 Effectiveness of Extension Methods 88
7.13 Factors hindering the adoption of animal traction 907.14 Summary: Extension methods used in promoting AT 92
University of Ghana http://ugspace.ug.edu.gh

CHAPTER EIGHT : USES, PERCEPTIONS AND EFFECTS OF ADOPTION OF ANIMAL TRACTION ON SELECTED ASPECTS OF THE FARMING SYSTEMS
8.0 Introduction 94
8.1 Awareness of the Usefulness of AT 94
8.1.1 Haulage activities that bullocks are usedfor 948.1.2 Traction activities that bullocks are used for 95
8.1.3 Haulage activities that donkeys are used for 95
8.1.4 Traction activities that donkeys are used for 95
8.2 Perceptions about animal traction technology characteristics 96
8.2.1 Relative Economic Advantage 96
8.2.2 Compatibility o f animal traction technology 96
8.2.3 Ease with which technology was understood and used 97
8.2.4 Ease with which technology can be experimented 98
8.2.5 Whether results o f technology are visible for others
to observe 98
8.3 Effects of Adoption of AT on selected aspects of the farming
systems 98
8.3.1 Type o f Crops grown 100
8.3.2 Land Preparation 100
8.3.3 Selection o f farm sites 101
8.3.4. Mixture o f crops 101
8.3.5 Planting Pattern 102
8.3.6 Size o f farms 102
8.3.7 Crop yields 103
8.3.8 Cost o f production 104
8.4 Summary: Uses, perceptions and effects of adoption
of AT on selected aspects of the farming systems 104
CHAPTER NINE : ADOPTION OF ANIMAL TRACTION TECHNOLOGY 9.0
Introduction 107
9.1 Categories of adoption 107
9.2 Personal characteristics on adoption 108
9.3 Socio-economic factors on adoption 110
University of Ghana http://ugspace.ug.edu.gh

9. 4 Extension methods used in promoting animal traction on adoption 112
CHAPTER TEN : SUMMARY, CONCLUSIONS AND RECOMMENDATIONS
10.0 Introduction 118
10.1 Summary 11810.2 Conclusion and Implications 122
10.3 Recommendations 127
List of References 130
LIST OF APPENDICESAppendix 1 - Questionnaires for farmers of villages where animal traction
technology has been introduced in the Builsa Districts. 137
Appendix 2 - Questionnaires for agricultural extension agents working
in the Builsa District 145
Appendix 3 - Some important events used in estimating the ages of
some of the respondents. 150
Appendix 4 - Enstoolment of some chiefs within the study area 151
Appendix 5 - A map of Ghana showing the location of Builsa District 152 Appendix 6 - A map of Builsa District 153
xii
University of Ghana http://ugspace.ug.edu.gh
LIST OF TABLESTable 2.1: Level of credit acquisition in the Builsa district 17Table 2.2: Number of households who have contacts with AEAs 18Table 3.1: Livestock owned by six (6) compounds in Wiagah 22Table 3.2: Areas farmed (in acres), number of men faming and
number of dependants 23Table 3.3: Camparison of AT input sales for 1974 ad 1975 26Table 6.1: Distribution of respondents by age 59Table 6.2: Distribution of respondents by family size 60Table 6.3: Distribution of respondents by educational level 61Table 6.4: Distribution of respondents by type of Ownership of Cattle 63Table 6.5: Distribution of respondents by ownership of donkeys 64Table 6.6: Distribution of respondents by size of farms 69Table 6.7: Distribution of respondents by their perception of the
level of respect given to cattle (bullock) owners 71Table 6:8: Distribution of respondents by their perception of
Level of respect given to donkey owners 72Table 6:9: Distribution of respondents by the category of people
Who manage work animals 73Table 6:10 Distribution of respondents by number of in-service
Training received by AEAs 76Table 6:11 Distribution of respondents by source of in-service training 77Table 6:12 Distribution of respondents by the methods used in
Training them 78Table 6:13 Distribution of respondents by reasons for their inability
To make visits to farmers 79Table 6:14 Distribution of respondents by problems farmers face
In adoption of animal traction 79Table 7:1 Distribution of respondents by their source of
Awareness about AT. 82Table 7:2 Distribution of respondents by their source of training
in AT 83Table 7:3 Distribution of respondents by the methods used in
training them 85
University of Ghana http://ugspace.ug.edu.gh

86
89
100
108
109
109
110
111
111
112
113
113
114
115
115
116
Distribution of respondents by adequacy of training
Distribution of respondents by factors hindering the
Adoption of animal tractionDistribution of respondents by the effects of adoption of
AT on selected aspects of farming system
Distribution of respondents on adoption by age
Distribution of respondents on adoption by family size
Distribution of respondents on adoption by
educational level
Distribution of respondents on adoption by ownership
Of cattle
Distribution of respondents on adoption by ownership
Of donkeys
Distribution of respondents on adoption by size of farms
Distribution of respondents on adoption by those who
Received credit
Distribution of respondents on adoption by those who
Received trainingDistribution of respondents on adoption by Demonstration method
Distribution of respondents who received lecture method
Distribution of respondents on adoption by
group discussion
Distribution of respondents on adoption by those who
Received training in demonstration /lecture methods
Distribution of respondents on adoption by demonstration
and group discussion method
xiv
University of Ghana http://ugspace.ug.edu.gh
LIST OF FIGURES
Figure 1.1 A diagram showing the conceptual framework of animal
Traction Technology
XV
University of Ghana http://ugspace.ug.edu.gh

ABBREVIATION
AEA - Agricultural Extension Agent
AIAEE - Association for International Agricultural and
Extension Education
AT - Animal Traction
ATT - Animal Traction Technology
BDA - Builsa District Assembly
DCE - District Chief Executive
DDA - District Director of Agriculture
DDO - District Development Office
EA - Extension Agent
FASCOM - Farmers Services Company
FFS - Farmer Field School
FLS - Front Line staff
GDP - Gross Domestic Product
GGADP - Ghanaian German Agricultural Development Project
ILCA - International Livestock Centre for Africa
MoFA - Ministry of Food and Agriculture
MTADP - Medium Term Agricultural Development Programme
NA - Native Administration/Authority
NAEP - National Agricultural Extension Project
NGO - Non-Governmental Organisation
NOC - National Onchocerciasis Committee
NOCR - National Onchocerciasis Committee Report
NR - Northern Region
xvi
University of Ghana http://ugspace.ug.edu.gh

OA - Operational Area
PRA - Participatory Rural Appraisal
RAAKS - Rapid Appraisal of Agricultural Knowledge Systems
RAOA - Regional Administration Office Archives
SPSS - Statistical Package for the Social Sciences
TIF - Tamale Implement Factory
UER - Upper East Region
URADEP - Upper Regional Agricultural Development Programme
University of Ghana http://ugspace.ug.edu.gh

CHAPTER ONE
INTRODUCTION TO THE RESEARCH STUDY
1.0 Introduction
Chapter one presents background information of the research study. It also presents the
problem statement, research questions, hypothesis, main objective of the study, specific
objectives, key concepts, conceptual framework and the significance of the study.
1.1 Background Information
Agriculture remains the principal occupation of the majority of the people in Africa. An
average of 32% of GDP is produced by agriculture and the sector constitutes the largest
productive sector in Africa (Kevin, 1993). Kevin pointed out that economic growth of at least
4% per annum in each African country will require agricultural growth at the same level in
most countries.
Without agricultural growth at 4% per annum the generally most competitive industrial sector
(agro-industry) will not be supplied with the raw materials to permit it to grow by its target
rate of 5-7% per annum. According to the report, agricultural growth is the most important
contributor to the growth of manufacturing and services in Sub-Saharan Africa. However,
most agricultural operations in Sub-Saharan Africa are done by hand, and seasonal labour
shortage is one of the main factors contributing to low agricultural productivity in the region.
This is because smallholders have too little capital to invest in tractors (International
Livestock Centre for Africa, {ILCA}, 1994). Hence, the low level of growth in agricultural
production is primarily due to the low level of investment and technological improvement in
the sector. The Government's Medium Term Agricultural Development Plan (MTADP) has
1
University of Ghana http://ugspace.ug.edu.gh

set a target of 4% annual growth in agricultural production (MTADP: An agenda for
Sustained Growth and Development, (MOFA 1991).
A strengthened national agricultural extension system is one key factor in achieving this
growth through dissemination of agricultural technology, especially among the small-scale
farmers (Kevin, 1993). However, Ghana's agriculture has relied on the small-scale farming
sector to produce the bulk of the nation's food requirements. The investments being made
lead to problems of logistics and lack of farm power. The use of human power in agriculture
still predominates over other sources of farm power such as draft animal power and tractors
(Bobobee, 2003 www.fao.org/waicent/faoinfo/agricult/ags/agse/3ero/namibia/c7.htm'): Dibbits and
Bobobee (1997) noted that one important way in which agricultural output can be increased is
by providing more efficient means of production that saves labour and reduce drudgery. With
the government's unattained tractorisation programme in 1957 (Korang-Amoako, Donkor and
Amoah, 1994; Munzinger, 1982), fresh approaches to the promotion of sustainable and
appropriate agricultural technologies are required to reduce the drudgery of the smallholder
farmers and increase productivity. Hence, the need to intensify the use of animal traction that
can release farm labour for activities other than cultivation and provide opportunities for
raising farm income. However, according to ILCA's programme (1994), if the use of animal
traction is to persist, once introduced, a number of conditions must be met. These include:
♦ Investment costs for both animals and implements must be low.
♦ There must be opportunities for intensifying and diversifying the applications of animal
traction
♦ Farmers will have to learn animal management skills in addition to cultivation techniques.
♦ Extension staff will have to be trained in the use of animal traction if they are to provide
useful advice.
2
University of Ghana http://ugspace.ug.edu.gh
♦ Problem of animal nutrition will have to be addressed through low-eost inputs to increase
the efficiency of animal traction and
♦ Appropriate animal health package will be needed to protect them against diseases.
Starkey (1988) also observed that constraints to animal traction may include
♦ Lack of appropriate implements.
♦ Limited credit
♦ Insufficient animals
♦ Animal health problems
♦ Inadequate animal nutrition
♦ Uncleared fields
♦ Farmer traditions
♦ Lack of technical knowledge
♦ Poor infrastructure and
♦ Limited marketing possibilities.
Therefore, the identification of a district specific farmer's needs is necessary to be able to
propose policies and measures to the situation.
1.2 Problem Statement
In 1934, the Ministry of Agriculture of the colonial government of the Gold Coast conducted
a survey in the then North Mamprusi District to investigate the causes of recurrent food
shortages in the area, to suggest and implement better measures to arrest the situation. A mong
other suggestions, they recommended that the introduction of animal traction was an obvious
answer (Lynn, 1937). Hence, in 1937, animal traction was introduced into the Builsa District
(Lynn, 1937). The farmers embraced the technology since they would increase their
3
University of Ghana http://ugspace.ug.edu.gh
cultivated areas considerably by the use of bullock power; and at the same time improve the
yields of their crops. The chiefs of Sandema and Nakon were among the first 19 influential
converts (Department of Agriculture, Gold Coast, 1938 - 1939).
There were also interventions by the Catholic and Presbyterian churches in 1969 and 1974
respectively (Cliff Trowell, Personal communication, January 20, 2003) and Upper Region
Agricultural Development Programme (URADEP) in 1976 (Korang-Amoakoh, Donkor and
Amoah, 1994) to boost the technology.
The Ministry of Agriculture report of 1934 had indicated that five out of every six
compounds in the Builsa district had cattle and that land was also in abundance (Lynn, 1937).
A report on the socio-economic survey of the Builsa District indicated that the district has a
total of 38,101 cattle with a total of 7,830 households (National Onchocerciasis Committee
Report, 1992). This implied that each household had an average of five cattle. However, after
several years of implementing animal traction technology with the district's high potential in
it, there are suggestions of low adoption. What could be the cause?
Munzinger (1982) said the economic situation of the individual farmer was a decisive factor
determining whether he wanted to use draught oxen or not. Bah (1988) said farmers attach
great importance to the social division of labour, cultural identity and compatibility with
traditional patterns of life, de Graaf (1992, pp 117) citing Ellis (1988) said farmers' decisions
on adopting or enhancing the use of animals on their farms are not necessarily based on
financial profitability. Those tangible social and cultural benefits also play a significant role
in the adoption process.
4
University of Ghana http://ugspace.ug.edu.gh

The National Agricultural Extension Project (NAEP) Annual report (MOFA, 1997) had it
that most of the Frontline Staff (FLS) have inadequate skills and confidence in training
farmers and animals. Besides, animal traction extension materials are in limited supply.
Which of these factors mentioned may be the causes of a low adoption, if any, of animal
traction in the Builsa District? The research questions and objectives are based on these.
1.3 Research Questions
The study therefore intends answering the following questions:
1. Have the socio-economic factors of farmers affected their adoption of animal traction?
2. Have socio-cultural factors of farmers affected their adoption of animal traction?
3. Have the extension methods used so far affected the adoption of animal traction?
4. What influence do the characteristics of animal traction technology have on farmers'
adoption of the technology?
1.4 Hypothesis
1. Socio-economic factors of farmers have not affected their adoption of animal traction
2. Socio-cultural factors of farmers have not affected their adoption of animal tractionJPV\
3. Extension methods used so far have not affected the adoption of animal traction
4. The characteristics of animal traction technology do not have influence on farmer's
adoption of the technology.
1.5 Main Objective
To verify and substantiate the speculation of low adoption of animal traction in the Builsa
District.
5
University of Ghana http://ugspace.ug.edu.gh

1.6 Specific Objectives
1. To find out the historical development of animal traction in the Builsa District.
2. To find out farmers' personal characteristics and their effects on the adoption of animal
traction
3. To determine the socio-economic factors of farmers which influence the adoption of
animal traction.
4. To examine how socio-cultural factors of farmers affect adoption of animal traction
5. To find out farmers opinions on the importance/usefulness of animal traction
6. To determine the compatibility of animal traction within the fanning system of the Builsa
District
7. To find out the various levels of adoption of animal traction.
8. To find out the effectiveness of the extension methods used in promoting animal traction.
1.7 Key Concepts of the Research Study
The key concepts, which determine the scope of the research study, include: technology,
animal traction technology, adoption of technology, communication of information on a
technology for adoption, extension and extension methods.
1.7.1 Technology
Technology is the combination of knowledge, inputs and management practices which are
deployed together with productive resources to produce a desired output (Reijntjes, Haverkort
and Waters-Bayer, 1992). A technology usually has two components:
1. Hardware: consisting of the tool that embodies the technology as material or physical
objects
University of Ghana http://ugspace.ug.edu.gh
2. Software: consisting of the information base for the tool (Conroy, Gordon and Marter,
1995, Rogers, 1995).
1.7.2 Animal traction technology
Animal traction is the use of draught animals for tillage, seeding and other activities (Barret,
Lassiter, Wilcock, Baker and Crawford, 1982). Munzinger (1982) also described animal
traction as the employment of animals for draught activities. However, the first definition will
suit the context of the study.
1.7.3 Adoption o f Technology
Adoption is the decision to apply an innovation and continue to use it. Early studies in
adoption found that in the process of adoption an individual goes through five stages. These
are; awareness, interest, evaluation, trial and adoption (Maunder, 1972). Later studies re
stated that these stages correspond to knowledge, persuasion, decision, implementation and
confirmation (Rogers, 1995). He argued that the latter stages are less inspired by normative
decision-making theory, and supposedly reflect better what happens in actual practice.
Animal traction technology adoption has two main meanings:
1. Transfer of ideas, techniques or implements from an area, where they have worked
effectively, to another.
2. The dissemination of knowledge or skills - transferring or communicating ideas and
techniques to the intended clientele.
7
University of Ghana http://ugspace.ug.edu.gh

1.7.4 Communication o f information o f a technology for adoption
There are various definitions of communication. For example, Nnadi (1997) defined it as the
process of establishing a commonness or oneness of thought between a sender and a receiver.
Rolings and Leeuwis (2002) defined it as the process through which people exchange
meanings.
For the purpose of this study, communication of information of a technology for adoption
may be described as the process of transmitting or exchanging information through a medium
between a sender and a receiver to reach a mutual understanding with the intent of receiving a
response through a feedback, either rejecting or adopting the technology.
Communication can be in the form of written, oral or non-verbal. Communication has five
elements:
Communication can be in the form of written, oral or non-verbal. Communication has five
elements:
1. The sender/source
2. The message - the message may be oral, written, or non-verbal.
3. The medium - mechanism through which the message is transmitted to the intended
audience
4. The receiver - this is the intended audience of the message.
5. Feedback - this indicates the two-way nature of effective communication (Nnadi, 1997;
Rogers and Kincaid, 1981 and Swanson, 1984).
1.7.5 Extension
There is no simple definition of extension, which is universally accepted. It is a dynamic
concept and its interpretation is always changing. Rolings and Leeuwis (2002) criticised
University of Ghana http://ugspace.ug.edu.gh

earlier definitions of extension as normative in that they prescribe what the authors would
like extension to look like ideally. For this reason, they have defined extension as "a series of
professional communicative interactions that is meant amongst others, to develop and/or
induce novel patterns of co-ordination and adjustment between people, technical devices and
natural phenomena, in a direction that supposedly helps to resolve problematic situations,
which may be defined differently by different actors involved".
1.7.6 Extension methods- #■$ #
This refers to methods of communication, which can be used in extension for influencing the
target groups (Maunder, 1972, Oakley and Garforth, 1985; van den Ban and Hawkins, 1996).
Extension methods can be seen as a particular mode of using media and media combinations
(Leeuwis and van den Ban, 2002)
9
University of Ghana http://ugspace.ug.edu.gh

1.8 Conceptual framework
Figure 1.1 A diagram showing the conceptual framework of animal traction
technology adoption
A. CHARACTERISTICS OF ANIMAL TRACTION TECHNOLOGY
•Importance of technology •Need for technology •Cost of technology •Cultural appropriateness •Profitability •Respect for tradition
B. ENVIRONMENTAL INFLUENCES ON THE FARMER
•Extension Agents Teaching method/communication skills,e.g. What is taught, how, when and where and who does it. —availability of resources/logistics •Extension Agents’ knowledge in Animal Traction (AT)
•Government policies
C. SIEVE SYSTEM OF THE FARMER
Personal Characteristics e.g. age, education,Family size•Socio-economic factors e.g. ownership of cattle/ Donkeys, farm size, labour, credit etc.•Socio-cultural factors e.g norms, values, taboos, attitudes •Farming systems e.g. mixed cropping, row planting, mix farming, compound faming bush farming
FA
NA
Source: Adapted from Rogers, 1983, p 233 KeyFA = Full Animal Traction Adoption AA= Average Animal Traction Adoption NA= No Animal Traction Adoption
10
University of Ghana http://ugspace.ug.edu.gh

In this section, the conceptual framework of the study, the basis on which the study has been
developed is discussed. The study is developed on the following concepts as shown in Figure
1.1. These are:
1. Characteristics of animal traction technology
2. Environmental influences
3. The sieve system of the farmer and
4. Adoption
Literature has various factors that influence farmers' adoption or rejection of technologies.
Rogers (1995) has identified some of these factors as characteristics of the technology, age,
education, socio-economic and social system of farmers and the Extension Agent.
From the diagram it can be seen that the decision of the farmer to adopt or not to adopt the
technology is conditioned by the characteristics of the animal traction technology and the
environmental influence acting on the farmer under his prevailing situation (age, education,
socio-economic, socio-cultural and farming system). For example, if animal traction
technology is costly, difficult to understand, has little or no respect for tradition and not
appropriate to the farming system, no farmer is likely to adopt it. Even if adopted then it is
likely to be the young, wealthy or educated farmers, van den Ban and Hawkins (1996) noted
that innovators tend to be relatively young, better educated and "better o ff . Urasa (1994) also
found that any new technology to be introduced into rural areas must be as simple and cheap
as possible if it is to be widely adopted. He went further to say that a new technology will not
be accepted to the target group if it is not compatible with existing farming principles and
cultivation practices.
11
University of Ghana http://ugspace.ug.edu.gh

The Extension agents' knowledge in animal traction, his communication skills thus his
behaviour, and attitude towards farmers, his respect for farmers norms, values and taboos can
influence the farmers' decisions. When the farmer is convinced by the extension agent and
combining this with his prevailing situation (age, education, family size, socio-economic
status, socio-cultural an fanning system) he/she can decide to adopt animal traction. Gibbons
and Schroeder (1983) noted that the types of innovation-decisions made by farmers are all
dependent on the extension agent's ability to influence them.
Government policies can also act on the farmers' system to result in adoption or rejection. For
example, prices of implements, resource allocations for extension staff training in AT and
government's attitudes towards AT itself. Bwalya (1988) noted that for animal draft power
technology transfer programme to be effective, management and organisation of agricultural
credit schemes, training of extension system, economic and political factors need serious
consideration.
Omoding (1994) observed that chiefs and rulers sometimes use coercion to implement
programmes in order to please their master, which probably accounted for unsustainable
adoption of ox cultivation in some areas in Uganda. Hence, from the various literature cited
and on Roger’s (1983) attributes of innovation and their rate of adoption model, the adoption
of animal traction technology (A) can be seen as a variable which is a function of:
1. The characteristics of animal traction technology itself (Cf) as perceived by the farmer
under his prevailing conditions
2. The environmental influences (Ef) as perceived by the farmer under his prevailing
conditions
3. The farmer sieve system (Sf).
Thus A=f (Cff Eft- Sf)
12
University of Ghana http://ugspace.ug.edu.gh

1.9 Significance of the study
The Government of Ghana has over the years invested money and human resources towards
promoting AT. However, evidence of low adoption still exists. There is very little
understanding of why the low adoption. The government of Ghana and NGOs are still
undertaking AT promotion without full understanding of why the low adoption of earlier
efforts.
Therefore this study will provide:
1. Government and NGOs who provide extension services to farmers a feedback on the
impact of the method of technology transfer they use.
2. It will also provide more in-depth understanding of rural circumstances so that any future
interventions would be more effective.
13
University of Ghana http://ugspace.ug.edu.gh

CHAPTER TWO
BACKGROUND OF THE STUDY AREA
2.0 Introduction
This chapter gives an overview of the study area. These are: location, population, age
distribution, distribution of household size, education and literacy levels. The others are
topography, climate, soils and vegetation. The rest are economic activities, farming systems
and agricultural extension in the Builsa District.
2.1 Location
The Builsa District is one of the six districts in the Upper East Region (UER) of Ghana. It
falls between longitudes 10°.05'N and 10°.30'N and latitudes 10°.15'N and 10°.30'N. It is
bounded on the north and east by the Kassena-Nankana district, on the west by the Sissala
district and on the south by the West Mamprusi district. The district has an area of 2,220 sq.
km. which is 25.1% of the total area of the UER (Builsa District Assembly, 2000).
2.2 Population
The Builsa district has a population of 75,375 which is 8.2% of the total population of the
UER in 2000 as against 66,357 in 1984. This is an increase of 13.6% over 1984 which
represents a growth rate of about 0.73% over the 16-year inter-censal period. It presently has
a population density of about 34.0 persons per sq. km. (Ghana Statistical Service, 2002).
2.3 Age Distribution
The 0-14 age group constitutes 43.4 of the total population while those aged 65 and above
make up only 6.4. The economically active population of 15-64 age cohort is about 50.2
(Ghana Statistical Service, 2002).
14
University of Ghana http://ugspace.ug.edu.gh

2.4 Distribution of Households by size.
According to the 2000 Ghana population census the Builisa District has about 4,700
households. With a population of 75,375, the average household size stands as 16.0 persons.
On the whole V3 of the population of the district live in household with more than 6 persons,
while 2/3 live in households with not more than 6 persons. (Ghana Statistical Service, 2002).
2.5 Topography
The topography is undulating. Slopes ranging from 200 to 300m are found in the northern
part of the district. In the valleys of the Sissili, Kulpawn and the White Volta in the south, the
slopes are more gentle and range from 150 to 200m. In general the low-lying nature of the
land makes the greater part of it liable to flooding in years of copious rains. The district falls
within the Volta Basin and is heavily dissected by the White Volta and its tributaries namely:
Sissili, Kulpawn, Belipieni, Bukpegi and Asebelika. Most of these streams are seasonal and
dry up during the extended dry season with an adverse effect on the supply of water for both
agricultural and domestic use (Builsa District Assembly, 2000; National Onchocerciasis
Committee Report, 1992).
2.6 Climate
The climate of the Builsa district is similar to the climate generally experienced in the Upper
regions of Ghana. Mean monthly temperatures range between 22°C and 35°C. The highest
temperatures are recorded in March/April and can rise to 45 °C, whereas the lowest
temperature is recorded in January. The dry season is characterised by dry hammattan winds
and wide diurnal temperature ranges. The critical factor in the climate is rainfall for farming.
There is only one rainy season, which builds up gradually from little rain in April to a
maximum in August-September. It then declines sharply to a complete halt in mid-October
15
University of Ghana http://ugspace.ug.edu.gh

when the dry season sets in. Rainfalls are very torrential and erratic and range between 85mm
and 1150mm with irregular dry spells occurring in June or July (Builsa District Assembly,
2000; (National Onchocerciasis Committee Report, 1992).
2.7 Soils
The greater part of the soils in the district comprises of ground water laterite, developed over
the granite formation. Soil textures vary within the district but coarse textured soils
predominate with various amounts of loosely packed stones and concretions. These soils
develop to depths, which make them cultivable. On upland, savannah ochrosols of various
depths and inherent low fertility prevail. Alluvial soils with high caolinitic clays ranging from
sandy clay loams to silty clay are found in most parts of the valley bottoms of the south.
These alluvial soils are comparatively higher in fertility but are most difficult to work and
subject to seasonal water logging and floods. In general, greater parts of the soils are poorly
drained. Intense erosion overtime has contributed to serious reduction in soil depth and
thereby to loss of arable land surface (Builsa District Assembly [BDA] 2000; National
Onchocerciasis Committee Report [NOCR], 1992).
2.8 Vegetation
The vegetation is characterised by parkland savannah. This contains economic trees such as
shea, baobab, acacia and dawadawa. This woodland savannah satisfies domestic requirements
of fuel wood and timber for house construction, kraals, vegetable garden fences and materials
for handicrafts. The grasses and shrubs provide pasture for the livestock population, mainly
goats, sheep and cattle. In the dry season, however, annual bush fires decimate the grasses
and shrubs and as a result pasture for livestock is largely destroyed (Builsa District
Assembly, 2000, National Onchocerciasis Committee Report, 1992).
16
University of Ghana http://ugspace.ug.edu.gh

2.9 Economic Activities
The people of Builsa are predominantly farmers. Very few are engaged in the fields of
manufacturing, industries, trade and hunting. Crops grown include millet, sorghum,
groundnuts, beans, rice, maize, vegetables, sweet potatoes and fara-fara potatoes. According
to the National Onchocerciasis Committee Report (1992), majority of farm households
(87.9%) cultivate up to 20 acres, although the average acreage per household was 12 acres,
and that 12% cultivated between 20 and 60 acres. Livestock and poultry are also kept. These
include cattle, donkeys, sheep, goats, pigs, fowls, guinea fowls, turkeys and ducks.
The availability and proper use of credit is important for increased agricultural productivity.
However, in the Builsa district, there is only one source of institutional credit - the Builsa
Community Bank. The other nearest banks are at Navrongo (29 km) and Bolgatanga (58 km).
Figure 2.1 shows credit acquisition in the Builsa District.
Table 2.1 Level of credit acquisition in the Builsa District
Item No of Households %Yes 12 7.3No 136 82.4Not Stated 17 10.3Total 165 100
Source: National Onchocerciasis Committee Report (1992)
2.10 Farming System
Mixed cropping is the main practice alongside sole cropping. Both distant and compound
farming is practised. Livestock and poultry production forms an integral part of crop
production system. It plays a central role in soil fertility restoration in addition to the
immediate utility in the form of meat, milk, cash outlays and of household ceremonies.
17
University of Ghana http://ugspace.ug.edu.gh

u I) /2.11 Agricultural Extension y f ' S -
Agricultural extension is that vital link between agricultural research^and farmers. They take
research findings necessary for agricultural development to farmers. They also make known
to agricultural research stations, problems encountered by farmers for investigation and
solution.
The Builsa district is divided into 17 operational areas (OA) for extension activities. Each OA
is headed by a District Development Officer (DDO). The District Director (DDA) of the
Ministry of Food and Agriculture (MoFA) is the over all boss. Every AEA has at least forty
(40) farmers with whom regular contact is maintained. In the Builsa district, like any other
rural area, the AEAs operate far from ideal conditions. These include lack of transportation
and logistics support, non-payment of transport claims, delays in promotion and low AEA-
farmer ratio. This contributes to low extension-farmer contact (DDA, personal
communication, 24th February 2002, NOC, 1992). Table 2.2 shows the number of households
that had contacts with AEAs.
Table 2.2 Number of Households who had contacts with AEAs
Period of contact No of Households %
Never 70 42.4
Under 1 month 30 18.2
2-3 months 22 13.3
4-6 months 17 10.3
7-12 months 2 1.2Over 1 year 22 13.3Not stated 2 1.2
Total 165 100
Source: NOC, 1992
18
University of Ghana http://ugspace.ug.edu.gh

CHAPTER THREE
THE HISTORY OF ANIM AL TRACTION IN GHANA
3.0 Introduction
This chapter, reviews the history of AT in Ghana. These include its origin, genesis, current
state and a historical development in the Builsa district.
3.1 Origin of Animal Traction
Animal traction was first started in Asia thousands of years ago. It was introduced into sub-
Saharan Africa through European settler farmers, early development programmes and
migration of workers within the region during the colonial period (Starkey, 1990).
3.2 The Genesis of AT in Ghana
The first pairs of working bullocks in Ghana were introduced at the Pong-Tamale
Agricultural Station in 1922 (Seifert, 1992). However, the technology was first adopted by
farmers in the early 1930's in the Upper East Region (Seifert, 1992). From 1934, the British
colonial government made more systematic attempts to introduce the use of draught oxen
with the purpose of increasing the area under cultivation. Demonstration farms were set up
and the use of draft oxen was generally encouraged (Seifert, 1992).
In those days, interested farmers were trained at stations set up at places like Tamale,
Zuarungu and Babile (Dibbits and Bobobee, 1997; Munzinger, 1982). Farmers in places like
Nakpanduri and Langbensi have used the technology for quite a long time. The use of the
technology was catching up well until the independence in 1957. At this time, due to the
government's expansion programme in agriculture, tractors were imported on a large scale to
the towns and surrounding areas where AT training centres had been set up. The relative
19
University of Ghana http://ugspace.ug.edu.gh
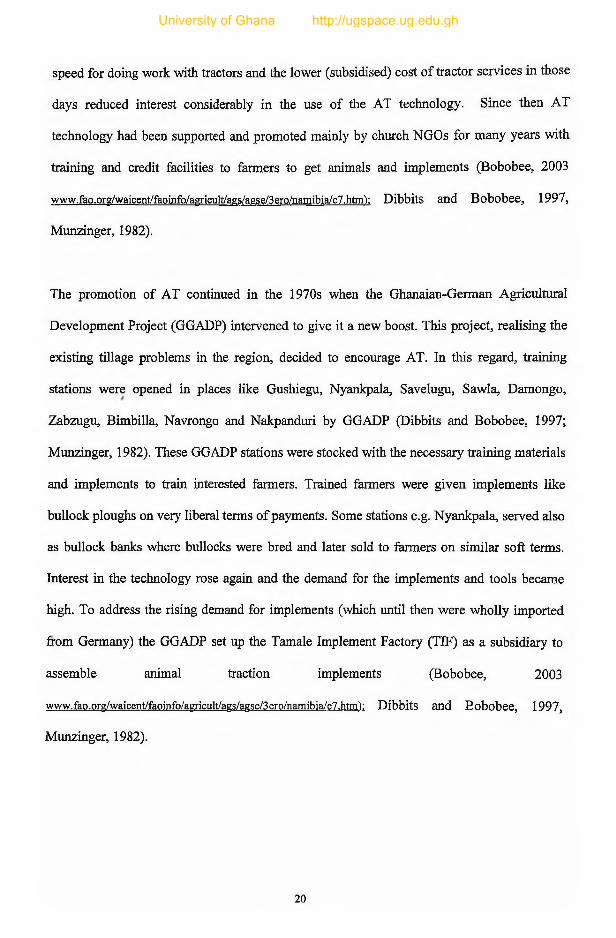
speed for doing work with tractors and the lower (subsidised) cost of tractor services in those
days reduced interest considerably in the use of the AT technology. Since then AT
technology had been supported and promoted mainly by church NGOs for many years with
training and credit facilities to farmers to get animals and implements (Bobobee, 2003
www.fao.org/waicent/faoinfo/agricult/ags/agse/3ero/namibia/c7.htm'): Dibbits and Bobobee, 1997,
Munzinger, 1982).
The promotion of AT continued in the 1970s when the Ghanaian-German Agricultural
Development Project (GGADP) intervened to give it a new boost. This project, realising the
existing tillage problems in the region, decided to encourage AT. In this regard, training
stations were opened in places like Gushiegu, Nyankpala, Savelugu, Sawla, Damongo,
Zabzugu, Bimbilla, Navrongo and Nakpanduri by GGADP (Dibbits and Bobobee, 1997;
Munzinger, 1982). These GGADP stations were stocked with the necessary training materials
and implements to train interested farmers. Trained farmers were given implements like
bullock ploughs on very liberal terms of payments. Some stations e.g. Nyankpala, served also
as bullock banks where bullocks were bred and later sold to farmers on similar soft terms.
Interest in the technology rose again and the demand for the implements and tools became
high. To address the rising demand for implements (which until then were wholly imported
from Germany) the GGADP set up the Tamale Implement Factory (TIF) as a subsidiary to
assemble animal traction implements (Bobobee, 2003
www.fao.org/waicent/faoinfo/agricult/ags/agse/3ero/namibia/c7.htm~): Dibbits and Bobobee, 1997,
Munzinger, 1982).
20
University of Ghana http://ugspace.ug.edu.gh

3.3 Current state of AT in Ghana
Animal traction is widely used only in Northern, Upper East and Upper West Regions. In
these regions, cattle are common and AT has been used for many years. In a few localities in
Volta, Brong Ahafo, Ashanti and Greater Accra regions, AT is being introduced. Constraints
in these localities include limited ownership of cattle, small number of bullocks, lack of
knowledge of AT, extensive farming systems based on shifting cultivation and difficulty in
clearing shrubs and difficult grasses. Here proper selection, training and guidance of
motivated farmers and financial assistance seem necessary for quite some time before a
momentum for continuous AT development can take place (Bobobee, 2003
www.fao.org/waicent/faomfo/aaricult/ags/agse/3ero/namibia/c7.htm'):~)
Most work animals are bullocks, but in the UER, many farmers also use donkeys. Donkeys
are mainly used for transport, but the interest to use donkeys also for ploughing and ridging is
increasing especially in the Upper regions. Working cows have been observed in the
Nakpanduri area. Bullocks are harnessed with very inefficient (cruel) double withers and
donkeys pulling carts with a simple kind of collar harness and a simple saddle (Dibbits and
Bobobee, 1997).
3.4 A historical development of AT in the Builsa District.
3.4.1 Pre-Independence
Recurrent food shortage in the then North Mamprusi district came to the notice of the
Department of Agriculture in the late 1920s. In 1931, an Agricultural Superintendent was
sent to Zuarungu the then capital of the district to investigate the causes of these food
shortages and to make recommendations as to what should be done to alleviate the situation.
21
University of Ghana http://ugspace.ug.edu.gh
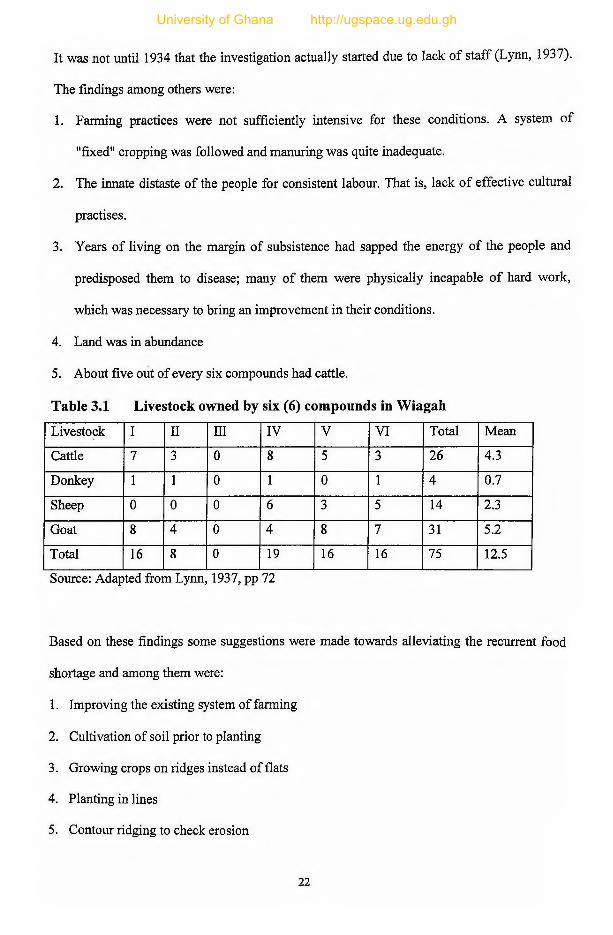
It was not until 1934 that the investigation actually started due to lack of staff (Lynn, 1937).
The findings among others were:
1. Farming practices were not sufficiently intensive for these conditions. A system of
"fixed" cropping was followed and manuring was quite inadequate.
2. The innate distaste of the people for consistent labour. That is, lack of effective cultural
practises.
3. Years of living on the margin of subsistence had sapped the energy of the people and
predisposed them to disease; many of them were physically incapable of hard work,
which was necessary to bring an improvement in their conditions.
4. Land was in abundance
5. About five out of every six compounds had cattle.
Table 3.1 Livestock owned by six (6) compounds in Wiagah
Livestock I II III IV V VI Total Mean
Cattle 7 3 0 8 5 3 26 4.3
Donkey 1 1 0 1 0 1 4 0.7
Sheep 0 0 0 6 3 5 14 2.3
Goat 8 4 0 4 8 7 31 5.2
Total 16 8 0 19 16 16 75 12.5
Source: Adapted from Lynn, 1937, pp 72
Based on these findings some suggestions were made towards alleviating the recurrent food
shortage and among them were:
1. Improving the existing system of farming
2. Cultivation of soil prior to planting
3. Growing crops on ridges instead of flats
4. Planting in lines
5. Contour ridging to check erosion
22
University of Ghana http://ugspace.ug.edu.gh

6. Rough cultivation after harvest
7. Controlled burning and
8. Increasing the area of land under cultivation.
Table 3.2 shows areas fanned (in acres), number of men farming and number of dependants
to support this last point (8).
Table 3.2 Areas farmed (in acres), number of men farming and number of dependants.
Name o f fanner
Area farmed (acres) Number o f men farming
Area perman(acres)
No ofdependants
Area perperson(acres)
Compoundfarm
Separate not bush
Bushfarm
Total
Abasu 3.12 0.760.46 4.34 3 1.45 10 0.43
Akulbalmi 4.62 0.89 -
0.77 -
0.57 - 6.85 2 3.43 8 0.86Anisedi 1.07 3.20 - 4.27 1 4.27 4 1.07Amanyidi 3.99 2.03 - 6.02 4 1.51 9 0.67Azurumi 2.86 1.01 - 3.87 2 1.94 12 0.32Ansoadi 1.87 0.37 - 2.24 1 2.24 9 0.25TOTAL 17.83 10.06 - 27.59 13 — 52 —
MEAN 1 - -- - 4.59 2.1 2.21 3.6 0.53Source: Lynn, 1937, pp 69
The introduction of AT was an obvious answer to these suggestions. Animal Traction was
therefore introduced into the Builsa District in 1937. A demonstration was started by
establishing mixed farming units attached to the Native Administration school, the then only
primary school in the Builsa district (Old Primary). This farm consisted of 8 acre units ran by
two paid labourers (Mr. Agazeri and Mr. Alung) working with the Native Administration
using a pair of bullocks, a plough and a locally made cultivator. The purpose of the school
farm was a dual one; firstly to produce food as economically as possible to reduce the school
mess expenses and secondly as a practical demonstration of improved methods of farming
(Lynn, 1937).
23
University of Ghana http://ugspace.ug.edu.gh

Sufficient interest was shown by the chiefs of Sandema and Nakon and their people in the
work of the plough and the mixed farming methods practised in the demonstration station that
they sent in bullocks and men including themselves (the chiefs) for training at Tono Farm
Centre. The chiefs of Sandema and Nakon were therefore among the first 19 influential
converts. The chief of Sandema - Chief Azantilow and the chief of Nakon were even quoted
as saying, "We will never return to the old and traditional methods" (Department of
Agriculture, Gold Coast, 1939-1940). Hence people began to realise that with the use of
bullock power, they would increase their cultivated areas considerably and at. the same time
improve the yields of their crops.
In 1940 the Builsa Native Administration started a loan scheme referred to as the Agricultural
Loan Scheme to provide farmers with bullocks and ploughs (Department of Agriculture,
Gold Coast, 1939-1940). Farmers from the Builsa district continued to take their bullocks to
Tono Farm Centre for training. The Tono Farm Centre was by then being financed by both
Navrongo and Builsa Native Administration. However, in 1945, it was agreed to layout a new
Native Authority Farm Centre between Sandema and Wiagah. Three hundred and twenty
pounds (£320) was voted to cover initial capital expenditure. Four (4) bullocks and two (2)
donkeys were purchased. An instructor's house, a large half-roofed cattle shed, a donkey
shed, a labourer's quarters, an office and some stores were put up. Two wells were sunk by
the Native Authority. Two acres each of sun hemp and groundnuts were planted to provide
fodder. In all hundred acres of land was acquired. Also one Grade 1 instructor assisted by two
Grade II instructors supervised the cultivation and building. Bullock and bullock men began
training at the Builsa Farm Centre (Department of Agriculture, Gold Coast, 1945-1946).
24
University of Ghana http://ugspace.ug.edu.gh

3.4.2 Post Independence
Much attention was being paid to animal traction until Ghana's Independence in 1957. At this
time, due to government's expansion programme in agriculture, tractors were imported on a
large scale to the towns and areas where AT training centres had been set up. The relative
speed for doing work with tractors and the lower (subsidised) cost of tractor services in those
days reduced interest considerably in the use of AT (Bobobee, 2003
www.fao.org/waicent/faomfo/agricult/ags/agse/3ero/namibia/c7,htm'): Dibbits and Bobobee, 1997;
Munzinger, 1982). The few farmers who still used AT had difficulties in getting ploughs and
spare parts. For example, in 1971, eighty-nine (89) farmers from the Builsa district applied
for bullock and plough loans but were told that such a scheme was not in operation. Again on
8th March 1972, Chief Azantilow on behalf of thirty-six (36) farmers applied for ploughs but
to no avail (Ministry of Agriculture, 1971).
Food shortage in the district continued to be a major problem, yet there was abundant land
and almost every household had cattle. This prompted some churches to intervene by giving
AT a new boost. Notable among them were the Roman Catholic and Presbyterian churches
who started AT in 1969 and 1974 respectively. The Presbyterian church concentrated its
activities within Sandema. The Catholic church covered areas like Wiaga, Kadema, Uwasi,
Gbedema, Kanjarga, Siniensi, Doninga and Fumbisi. In 1973, twenty-one (21) pairs of
bullocks were trained. The cost of housing and feeding became difficult because of increased
number of farmers wanting to be trained. The training was therefore shifted to the community
levels; hence the demand for AT implements continued increasing. Table 3.3 shows a
comparison of input sales for 1974 and 1975.
25
University of Ghana http://ugspace.ug.edu.gh
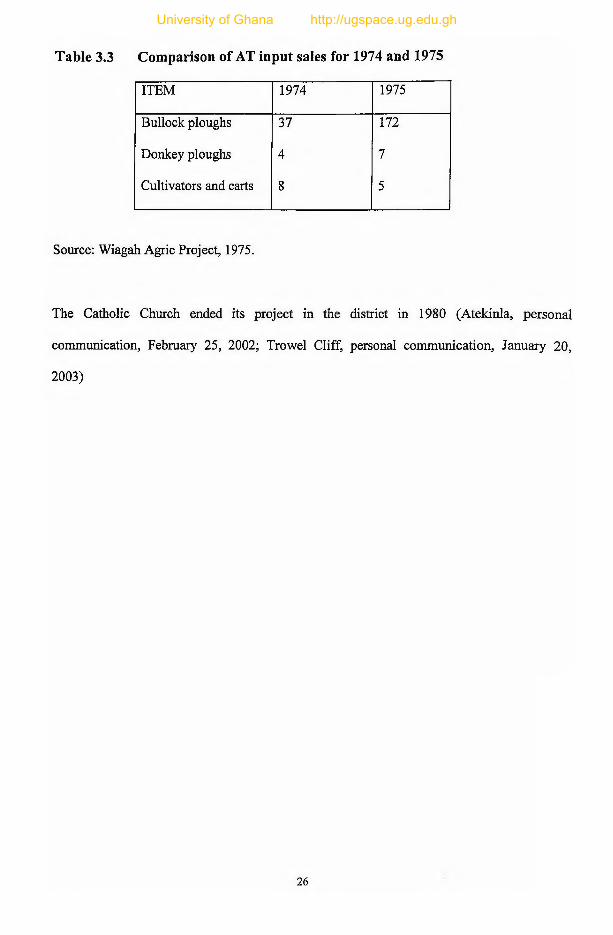
Table 3.3 Comparison of AT input sales for 1974 and 1975
ITEM 1974 1975
Bullock ploughs 37 172
Donkey ploughs 4 7
Cultivators and carts 8 5
Source: Wiagah Agric Project, 1975.
The Catholic Church ended its project in the district in 1980 (Atekinla, personal
communication, February 25, 2002; Trowel Cliff, personal communication, January 20,
2003)
26
University of Ghana http://ugspace.ug.edu.gh

CHAPTER FOUR
LITERATURE REVIEW
4.0 Introduction
Chapter four deals with literature on animal traction and adoption. Areas reviewed are
meaning of AT, contribution of AT to agricultural development, adoption and the adoption
process, meaning of communication, meaning of extension, the extension agent and
technology transfer. Others are extension teaching methods and adoption, technology
characteristics and adoption. The rest are socio-economic factors and adoption, socio-cultural
factors and adoption and obstacles to the adoption of AT technology. These areas are
reviewed because they influence adoption. Before a farmer adopts a technology he must
know its characteristics. Panin and Ellis (1992) said farmers are likely to adopt a technology
if they perceive the technology to be profitable. In the same vein the choice of extension
teaching methods and the ability to communicate effectively taking into consideration the
socio-economic and socio-culture of farmers play a significant role when introducing a
technology for adoption (Leagons, 1960; Maunder 1972).
4.1 Meaning of Animal Traction
Animal traction is the use of draft animals for tillage, seeding and other draft activities
(Barret, Lassister, Wilcock, Baker and Crawford, 1982). Munzinger (1982) described an'
traction as the employment of animals for draft activities. A variety of animals are used in
different parts of the world for animal traction. These include bullocks, cows bull
buffaloes, horse, mules, donkeys and camels. In Ghana, only bullocks, bulls and donkeys ar
mostly used for AT. In the Nakpanduri area of the Northern Region, the use of cows for AT
is being practised. Implements used for AT include ploughs, harrows, ridgers cultivate
planters, harvesters, millers, carts and water lifting equipment.
27
University of Ghana http://ugspace.ug.edu.gh
4.2 Contribution of AT to Agricultural Development
This section has the following sub-headings under it. These include AT and crop yields, AT
and fanning systems, AT and farmer preferences, AT and different ages and gender o f
farmers, AT and ownership of draft animals and lastly, AT and animal population.
4.2.1 Animal Traction and Crop Production and Yields
Animal traction may assist farmers to increase the total production of their crops. One of the
clearest ways to achieve this is through increase in area cultivated (Starkey, 1988). According
to him, there is very often a conelation between farm size and ownership of draft animals
although this does not necessarily mean that the animals are the cause of the large area of
cultivation. It may be that farmers who have big farms are the ones wealthy enough to use
draft animals. He observed that records on farmed areas before and after the adoption of draft
animals indicated that where land was available, farmers cultivated more land when they had
draft animals so that total yield over farm increased. However, in some areas there were
drops in yield per unit area as fanners tended to farm more extensively rather than j
intensively. Also, the use of AT can result in better timing due to faster and better land
preparation, seeding and weeding which may give rise to higher yields and less crop failures
(Seifert, 1992).
4.2.2 Animal Traction and Farming Systems o f Farmers
Animal traction is associated with the tendency to move from bush fallow cultivation
involving mixed cropping in partially cleared areas still containing stumps, to permanent
systems, in which single crops are grown in cleared fields. Animal traction may lead to
extensive farming with large areas being less intensively managed. One of the more notable
ways AT affects farming system is through the integration of crop and livestock enterprises
28
University of Ghana http://ugspace.ug.edu.gh
(Starkey, 1988). Also, AT may lead to changes in the crop mix, and therefore may have
differential effects on crop production. Starkey noted that AT has often been promoted in
West Africa for mono cropping in areas where inter-cropping was traditional. It was earlier
thought that AT led to increased production of cash crops to the detriment of food crops.
However, according to him, surveys have not found marked differences in crop mix
associated with AT.
4.2.3 Animal Traction and Farmer Preferences fo r Animals
In common with most aspects of life, AT both benefits and suffers from long standing
preferences and the vagaries of more rapidly changing "fashions". Animals often have
prestige status unrelated to their working abilities, so that one sickly horse may have higher
social status than a pair of strong oxen. In some countries and communities the colours of
animals and implements may be very important influencing decisions relating to adoption
even though it is unlikely that these factors would influence performance. Such preferences
that appear illogical may have a technical justification that is not immediately apparent to an
outsider. Nevertheless, farmer prejudice can be as important as farmer judgement, when it
comes to selecting animals, implements, harnesses or management regimes. In such
circumstances any reduction in possible technical efficiency may have to be set against the
pleasure associated with the choice, since "fashion' may sometimes be viewed as a social
benefit of animal traction (Starkey, 1988).
4.2.4 Animal traction and Different Ages and Gender o f Farmers.
The social costs and benefits of AT vary considerably between people of different ages and
gender in farm households. Men and children usually train the animals, work with them and
herd them. These people have the initial problems associated with first use of animals and
29
University of Ghana http://ugspace.ug.edu.gh

area expansion, but may later benefit from easier and more fulfilling work. In some
communities, men consider it appropriate to cultivate land for the crops usually grown by
women, in others, they do not. Women and children often have the tasks of weeding and
harvesting and their work may be increased if cultivated areas are expanded. Children often
tend draft animals and because of these their educational prospects can suffer, either due to
limited school attendance or due to fatigue when school is combined with looking after
animals. In some small survey in Sierra Leone, it was found that children of daft animal
owners were less likely to attend primary school. On the other hand, the general correlation
between draft animals and wealth might make it easier for animal owners to afford secondary
school fees (Allagnat and Koroma, 1984; Gboku, 1988).
4.2.5 Animal Traction and Ownership o f Draft Animals
In some parts of West Africa, AT has been introduced through communal ownership, often
encouraged by governments and Aid agencies. While there have been examples of successful
village associations for AT, many have experienced major social and organisational problems
associated with conflicting interests for access during the animal working hours and
responsibility for maintaining the animals at other times (Starkey, 1988). With individual
ownership, it is clear who is responsible for both costs and the benefits of animal
management. One of the costs is grazing supervision, and if this is not carried out with
dedication, the animals may suffer from insufficient food, accident or theft. Alternatively
growing crops can be eaten, causing much social conflict and expense (Starkey, 1988)
Corbel (1988) said in one survey in Sierra Leone a quarter of farmers reported that they had
to pay out significant sums in compensation as a result of the alleged misbehaviour of their
work oxen.
30
University of Ghana http://ugspace.ug.edu.gh

4.3.6 Animal Traction and Quality o f life o f Farmers
Animal Traction may well have a direct impact on the quality of life of farmers by reducing
drudgery of personal transport. It also provides opportunities for social and econom ic benefits
such as
♦ Enhanced possibilities for collecting and distributing harvest, water, building materials
timber, farm implements and other goods.
♦ Increased marketing opportunities for farm produce and
♦ Greater ease of utilising crop residues, compost and manure (Starkey, 1988).
4.3.7 Animal Traction and Animal Population
Starkey (1988) observed that castrated bulls remain the dominant draft animals in West
Africa. However, in some areas such as Northern Nigeria, uncastrated males are used for
work. In Sine Saloum in Senegal, cows are increasingly being worked. Reh and Horst (1982)
reported that N'dama cows used for draft purposes actually had higher reproductive
characteristics than similar cows kept in traditional herds. This was attributed to the fact that
the better husbandry associated with draft animal, more than compensated for the stresses
imposed by the work. In countries where work oxen come from small local herds, the "best"
males that seem large and strong are selected for work and so are castrated and are therefore
unable to breed. Thus the breeding bulls may be genetically inferior in terms of body size and
conformation (Starkey, 1988).
4.3 Meaning of Communication
Communication has been defined in several ways by different authors, van den Ban and
Hawkins (1996) defined communication as the process of sending and receiving message1
through channels, which establish common meaning between a source and a receiver Nnand'
31
University of Ghana http://ugspace.ug.edu.gh
(1997) sees it as a process of establishing a commonness or oneness of thought betw een a
sender and a receiver. Rolings and Leeuwis (2002) defined it as the process th rough w hich
people exchange meanings.
According to Rolings and Leeuwis (2002), communication has the following ingredients and
distinctions:
Communication is about using symbolic signals
Symbolic signals are transferred through channels and media.
It can be through more or less verbal and intentional 'messages'.
It takes place between people that are aware of each other
Communication takes place in a historical and relational context - people that
communicate with each other do so in the context of previous communications and
experiences.
• Communication can be more or less interactive
• Communication can be synchronical, that is, when on telephone or a-synchronical
that is, when using letters, articles etc.
• Communication messages have different levels and layers - messages can be imbi d
with various more implicit meanings and connotations
• It goes along with selection processes because of people's culture pre exist'
knowledge, goals, aspirations and interest.
According to them, there are three models of communication. These are:
1. The 'objective' or 'transmission model'. In this model, there is a sender who corn
a 'message' and sends through a 'channel' to a 'receiver'. In this process informat'
in the message has a fixed objective. The receiver provides the same informat'
intended by the sender unless something goes wrong in the channel Th*.j. ne weakness of
32
University of Ghana http://ugspace.ug.edu.gh
this model is that even if nothing is wrong with the channel, the sender and receiver
(i.e. the Extension Agent and farmer) would not end up with the same meanings and
information.
2. The 'subjective' or 'receiver-oriented' model. This is a refinement of the transmission
model. In this model, the personal history and context of the sender e.g. (Extension
Agent) and receiver (farmer) are seen as having a different 'lifeworld' or 'stock of
knowledge'. When a sender encodes a message, there is a high probability that the
receiver will use a different stock of knowledge to decode the message vis-a-vis if
roles are changed. Thus because meanings and information are constructed by
subjective individuals, effective communication can only occur if a sender makes an
effort to anticipate the frame -of reference of the receiver. This, an EA would for
example, have carefully studied farmers' perspectives and modes of thinking in order
to get their messages attuned and adapted to them. Hence, there is the need for
intensive interaction between EAs and farmers in which both parties become both
senders and receivers. Rolings and Leeuwis (2002) also noted that despite EA's
efforts to anticipate farmers' frame of reference and modes of thinking farmers would
in a number of cases still refuse to accept the meanings proposed by EAs and /or
would ignore their advice.
3. The 'Social' or ‘network-negotiation transaction' model. This model focuses on the
influence of communication in the wider social network of the sender (EA) and
receiver (farmer) since the EAs are not the only ones communicating. Thus the
meaning constructed by a farmer in interaction with an EA may be influenced
directly or indirectly by others such as other farmers, religious leaders, family, local
leaders, traders etc. Also the meanings constructed by farmers can be influenced by
33
University of Ghana http://ugspace.ug.edu.gh

politics, social relationship, struggle for resources, social interests and aspirations of
various kinds. (Rolings and Leeuwis, 2002).
4.4 Adoption and the Adoption process.
Rogers (1995) defined adoption as a decision to make full use of an innovation as the best
course of action available. Adoption process is the changes that take place within individuals
with regard to an innovation from the moment that they first became aware of the innovation
to the final decision to use it or not (Wilkenning, 1953). In Wilkenning's view, an individual's
decision to adopt an innovation is a process, which comprised of learning, deciding and
acting over a period. He further stated that the adoption of a specific practice is not the result
of a single decision to act but a series of actions and decisions. Bohlen (1966) noted that the
adoption of a new idea is not a single unit but a rather complex pattern of mental activities
combined with "actions" before the individual fully accepts or adopts the idea.
In the adoption process, an individual goes through five stages (van den Ban and Hawkins,
1996, Leeuwis and van den Ban, 2002: Rogers, 1995 ). These stages are:
1. Awareness: the individual first hears about the innovation
2. Interest: the individual seeks further information about the innovation he has heard about.
3. Evaluation: the individual weighs up the advantages and disadvantages of using the
innovation in his own circumstances.
4. Trial: the individual applies the innovation on a small scale.
5. Adoption: the individual applies the innovation on a large scale.
These stages were later elaborated by Rogers (1995), into knowledge, persuasion, decision,
implementation and confirmation.
34
University of Ghana http://ugspace.ug.edu.gh
Knowledge: This occurs when an individual or other decision making unit is exposed to the
innovation's existence and gains some understanding of how it functions. Knowing about an
innovation is often quite different from using the ideas. Most individuals know about many
innovations that they have not adopted because individuals may not regard it as relevant to
his situation or as potentially useful.
Persuasion: occurs when an individual forms a favourable or unfavourable attitude towards
the innovation. Here the individual becomes more psychologically involved with the
innovation, and he or she actively seeks information about the new idea. Here the important
behaviours are where he seeks information, what messages he receives and how he interprets
the information that is received. Thus selective perception is important here in determining
the individual behaviour. Relative advantage, compatibility and complexity are important at
this stage.
Decision: occurs when an individual or other decision-making unit engages in activities that
lead to a choice to adopt or reject the innovation. Innovations that can be divided for trial use
are generally accepted more rapidly.
Implementation: Problems in exactly how to use the innovation may crop up at the stage of
implementation. For example, unavailability of innovations. Questions to ask here include
where to obtain the innovation, how to use it, how it works, operational problems likely to be
encountered and how to solve them. Active information seeking takes place here.
Implementation ends when innovations become a routine or is institutionalised.
Confirmation: During this stage the individual wants supportive messages that will prevent
dissonance from occurring.
The elaboration of the adoption process to include knowledge, persuasion, decision,
implementation and confirmation is to provide for the fact that the new idea can possibly be
35
University of Ghana http://ugspace.ug.edu.gh

rejected at any point of the adoption process. They further indicated the idea that a change in
information is followed by a change in behaviour is no longer accepted as a pattern. Thus the
normative-decision-making model is no longer considered to provide an adequate explanation
of the way people make decisions.
4.5 Meaning of Extension
The term 'extension' has evolved over time, and has different connotations in different
countries. Hence there is no simple definition of extension, which is universally
accepted. It is a dynamic concept and its interpretation is always changing. According to
Rolings and Leeuwis (2002), the term extension itself is more recent; it originates from the
academia, and it's common use was first recorded in Britain in the 1840s in the context of
'university extension' or extension of the university. But now, it is applicable to other sectors
such as industry, health, energy and education. In their view the various definitions of
extension are in essence, normative definitions, in that they prescribe what the authors would
like extension to look like ideally. They also noted that alternatively, when extension is
defined more descriptively in terms of what Extensionists actually do, then its definition
might not correspond with normative definitions. This is because when taking a closer look at
what Extensionists do in actual practice, one might, for example, discover in some cases that
their work has little to do with 'help' but rather with imposing technologies and/or enhancing
state control over farmers. They went further to argue that extension in the 1980s could be
problematically regarded as 'help' and being in the interest of the recipients. That extension is
in many ways also an intervention that is undertaken and/or paid for by a party who is
interested to influence people in a particular manner. This often created tension between the
interest of the extension organisation (and/or its funding agency) and the interest of the
recipients.
36
University of Ghana http://ugspace.ug.edu.gh

However, the situation where extension derives from (semi-state) institution that is concerned
with the public interest or public policy is rapidly changing in view of the emergence of
private and NGO-based extension. Thus, it can be assumed that the interests and policies that
are pursued by extension are nowadays often more individual and/or localised than in the
1980s.
Rolings and Leeuwis (2002), citing Ison and Russel (2000) feel the word 'extension' itself is
already misleading and that it is practically impossible to stretch the meaning of the concept
in the necessary fashion; that, some senior authors in the field of extension no longer use the
concept in many of their writings. However, they maintained that if one is to use the concept
for the meantime then one should among others"
• Shift away from a focus on individual behaviour change, which has characterised most
of the definitions so far, and incorporate the idea that extension is about fostering new
patterns of co-ordination.
• Move away from the idea that extension works mainly on the basis of pre-defined
directions, policies and innovations and emphasise on generative dimensions.
• Indicate that changes usually have a dual (material-technical and social organisational)
component.
• Transcend the idea that extension is mainly concerned with decision-making, and
emphasise the importance of social learning and negotiation in extension process
• To define extension as a two-way (or multi-way) process, in which several parties can
be expected to contribute relevant insight, and which may have action implications for
all parties (not only farmers, but also researchers, Extensionists, policy makers, etc)
involved in the process. They have thus defined extension as:
37
University of Ghana http://ugspace.ug.edu.gh

"A series of professional communicative interventions amidst related interactions that is
meant - among others - to develop and/or induce novel patterns of co-ordination and
adjustment between people, technical devices and natural phenomena, in a direction that
supposedly helps to resolve problematic situations, which may be defined differently by
different actors involved" (Leeuwis and van den Ban, 2002 p. 19).
Earlier studies by Axinn (1988) and Rivera, Seepersad and Pletsch (1989), citing Malassis
(1976) categorised extension into three dimensions, namely
• Approach - different styles of action within an extension system
• Model - systems held to be worthy of transference to other situations e.g. Training and
visit
• Type - similarity among certain systems e.g. similar purposes among different
commodity specific extension systems.
However, later studies by Rolings and Leeuwis (2002) categorised extension into six
different dimensions namely:
• Extension strategies/or services
• Extension functions
• Extension approaches
• Extension methodologies
• Extension methods
• Extension tools and techniques
Extension strateeies/or services: This refers to a wider intervention purpose of the
organisation (Extensionists), that is whether the organisation is problem solving, knowledge
exchange, diffusion of innovation etc. The different extension strategies include
• Advisory communication
38
University of Ghana http://ugspace.ug.edu.gh

• Supporting horizontal knowledge exchange
• Generation of (policy and/or technical) innovations
• Facilitating conflict resolution
• Supporting organisational development and capacity building
• Persuasive transfer of (policy and /or technological) innovations
Extension functions: Functions relate to different communicative sub-goals that are deemei
useful as part of the wider strategy. Four of such functions are
• Awareness raising/conscientisation
• Exploration of views and issues
• Information provision
• Training
Extension approaches: This refers to the basic planning philosophy that is being adopted b]
Extensionists e.g.
• commodity - focused approach
• training and visit approach
• the technical innovation - centered approach
Extension Methodologies: These are more or less pre-defined series of steps or procedures,
whereby each step can involve the use of one of several methods e.g.
• Farmer Field School (FFS)
• Participatory Rural Appraisal (PRA)
• Rapid Appraisal of Agricultural Knowledge Systems (RAAKS)
39
University of Ghana http://ugspace.ug.edu.gh
Extension Methods: Methods can be seen as a particular mode of using media and media
combinations. Examples of methods include
• Farm visits
• Workshops
• Group discussion
• Priority ranking
Tools and Techniques: Tools and techniques are particular ways of operating a method.
However, whether something is considered a method or a tool is often debatable; thus no
sharp boundaries exist between them.
4.6 Extension Agent and Technology Transfer
The role of the extension agent is to disseminate new ideas; practices and knowledge to
farmers to enable them improve their productivity. Two main types of technology transfer
have been in use; formal and informal. The national extension services have generally
provided formal top-down training. This has effectively taught farmers to start to use work
animals in areas where AT was not known. However, the availability of resources to allow
frequent extension agent-farmer contact for technology being transferred and the agent's
ability to diagnose the farmers felt needs have affected the adoption of technologies (Starkey,
1988). He observed that once AT has started in a region, much transfer has been informal,
within families, from farmer to farmer or from regional immigrants to local farmers. Farmer-
led innovation has often been much more significant than formal extension advice. He
therefore concluded that formal extension is important for introduction of AT technology but
thereafter it does not keep up with the evolution of farming systems.
40
University of Ghana http://ugspace.ug.edu.gh

Public sector researchers have developed "improved" AT technologies on research stations.
These have then been promoted by the extension services, often to be rejected by farmers as
technically or economically inappropriate to their farming systems (Starkey, 1990). Whale
(1989) indicated that a technology is transferred if
a. The information is conveyed such that it fulfils a particular need of the client and
b. It can be effectively applied by the client to his own situation.
The farmers' decision to adopt or reject the technology depends to a large extent on the
extension agent's ability to convince the farmer, van den Ban and Hawkins (1996) observed
that the message has to be presented such that the client understands it and he is assisted to
balance the advantages and disadvantages of the new practice. In most countries in the
region, development programmes have tried to promote animal-drawn wheeled tool-carriers
but the transfer process has not succeeded; the technology has been "perfected yet rejected"
(Starkey, 1988). Successful farmer-to-farmer transfer appears to have been responsible for
the increase in the use of donkeys and working cows in several countries in Southern Africa.
This adoption has sometimes been against the advise of extension agents (Starkey, 1988).
4.7 Extension Teaching Methods and Adoption
Learning is an active process on the part of the learner. Unless he becomes interested to the
point of putting forth mental and physical effort to learn, nothing is accomplished. Leagans
(1960) observed that it is the task of the extension worker to:
a. provide farmers with an opportunity to learn
b. stimulate mental and physical activity that produces the desired learning
The choice of extension teaching method and the ability to communicate effectively therefore
plays a significant role when trying to influence the adoption of technologies. Maunder
41
University of Ghana http://ugspace.ug.edu.gh
(1972) observed that each culture and sometimes a region or community within a culture, has
its peculiar means of communication as well as those common to other cultures. It must not
be taken for granted that the channels and techniques of one culture necessarily exist in
another or that they would function effectively if they were introduced, for example, written
literature is of little value among groups that are highly illiterate.
According to Kang and Song (1984), a good number of proven educational methods or
techniques exist from which the extension agent may choose to set up learning situations and
maximise the transfer of information and skills to farmers from a broad perspective. These
methods are classified in terms of the target group into three main categories namely;
individual methods, group methods and mass methods (Kwarteng and Zinnah, 1994, van den
Ban and Hawkins, 1996).
According to Kang and Song (1984) and Kwarteng and Zinnah (1994) to create a conducive
atmosphere for effective extension delivery, a number of factors need to be considered in
deciding on the method to use. These include:
1. People learn best in different ways; some by listening, some by seeing, some by doing
and some by discussions. A combination of methods may be required to bring about the
desired learning in the target group. Studies have shown that the more different extension
methods are used the more people change their practice (Kang and Song, 1984; Maunder,
1972).
2. A number of teaching methods can overlap in trying to attain an objective. In this regard
special attention must be given to the stage of the adoption process at which the target
group is. It has been indicated that mass methods are most effective at the awareness
stage, while the individual and group methods may stimulate interest and play a major
42
University of Ghana http://ugspace.ug.edu.gh

role in farmer's opinion and decision-making (Bohlen, 1966; Maunder, 1972; Leeuwis
and van den Ban, 2002, van den Ban and Hawkins, 1996).
3. It has also been established that no extension method is better than the other. The
extension agent should choose the technique best suited to the situation (Kwarteng and
Zinnah, 1994).
4. A good knowledge and understanding of the audience, especially their differences and
similarities with respect to their age, level of education, available resources and their
entire social environment helps the extension agent select the most suitable method or a
combination of methods to suit the target group.
5. The characteristics of the message, the teaching and learning objectives and what the
participants are expected to be able to do with the content of message should also be
considered. For example, if the aim of the communication is to provide knowledge, the
extension agent may use the lecture, if the aim is to teach a skill, demonstration method
may be more appropriate.
6. Extension agents' ability to identify audience needs and involving them in the decision
making process may encourage the adoption of technologies. Conroy, Gordon and Marter
(1995), observed that the limited effectiveness of technologies is often associated with an
inadequate involvement of target beneficiaries, limits to multi-disciplinary technology
development process and insufficient allowance for the adaptive fine tuning necessary to
meet the end user's needs.
4.8 Technology Characteristics and Adoption
Various literature, Bohlen (1966) and Rogers (1983) have identified five main characteristics
of an innovation from the point of view of farmers, which affect their rate of adoption. These
43
University of Ghana http://ugspace.ug.edu.gh

1. Relative advantage
2. Compatibility
3. Complexity
4. Trialability
5. Observability
4.8.1 Relative Advantage o f the Technology
This is the degree to which a technology is perceived to be better than the ideas it supersedes
in terms of economic, profitability, social prestige, physical convenience, low initial cost,
lower perceived risk, decreasing discomfort, psychological satisfaction or saving time
(Association for International Agricultural and Extension Education [AIAEE], 1998). Panin
and Ellis (1992) said farmers are likely to adopt a technology if they perceive the technology
to be profitable, by either reducing costs and increasing income without necessitating major
changes in their farming systems.
4.8.2 Compatibility o f Technology.
This refers to the degree to which technology is perceived to be consistent with the farmer's
goals and aspiration, socio-cultural values, past experiences, needs and existing farm
practices (Association for International Agriculture and Extension [AIAEE], 1998). An
individual's perception is influenced by his beliefs, values, and attitudes and these can affect
adoption. Innovations, which are compatible with previous experiences usually, catch on
faster and are usually adopted more quickly than unusual ones (Adams, 1982).
44
University of Ghana http://ugspace.ug.edu.gh

4.8.3 Complexity o f the Technology
This refers to the degree to which an innovation is perceived as relatively difficult to
understand and use (AIAEE, 1998). Innovations, which are relatively simple usually, catch
on faster and are usually adopted more quickly than the more complicated ones (Adams,
1982).
4.8.4 Trialability o f the Technology
This is the degree to which an innovation may be experimented with on a limited basis
(Kwarteng and Zinnah, 1994). If a farmer can try an innovation without committing much of
his resources he will adopt it more readily, also if its performance meets his objectives.
4.8.5 Observability o f the Technology
This refers to the degree to which the results of an innovation are visible to others. Some
results are easily observed and communicated to others whereas others are difficult to
describe to others. Farmers learn much from observing and discussing their colleagues'
experiences, their observations often being a reason to start a discussion (van den Ban and
Hawkins, 1996). Bohlen (1966) noted that people who have low ability to mentally handle
abstract ideas tend to be more reluctant to adopt practices, which do not produce visible
outcomes when used.
4.9 Socio-economic Factors and Adoption
When introducing a technology due consideration should be given to the availability and
resource endowments of the potential adopter such as labour, land and capital. These can
permit the rejection or adoption of the technology that is being introduced. A technology can
be rejected due to the inadequacy of the farmer's resources, making him incapable of meeting
45
University of Ghana http://ugspace.ug.edu.gh

the requirements of the technology being promoted. Fliegel (1984) noted that some farmers
may be inclined to be innovative that is, psychologically predisposed to accept innovations
quickly but unable to act because of situational constraints such as insecure land tenure, lack
of access to credit and lack of access to markets.
4.10 Socio-cultural Factors and Adoption
A farmer's willingness to adopt a technology is also largely influenced by socio-cultural
factors such as beliefs, norms, values and taboos of the social system. Shaner, Philipp and
Schmehl (1982), citing Beal and Sibley (1967) said characteristics such as knowledge,
beliefs, attitudes, behaviour and goals of farmers are the most important factors to consider
when introducing new technologies to farmers. Bah (1988) said farmers attach great
importance to factors such as the social division of labour, cultural identity and compatibility
with traditional pattern of life when adopting a technology.
4.11 Constraints to the Adoption of AT Technology
There are difficulties that make the spread and adoption of AT problematic. These are:
Lack of appropriate implements.
(Bobobee, 2003 www.fao.org/waicent/faomfo/agricult/ags/agse/3ero/namibia/c7.htm'): said, lack of
appropriate implements could be an important constraint to the use of AT and farmers have
sometimes found it difficult or impossible to obtain suitable equipment.
Harnessing. Several people had suggested that harnessing was a major constraint. Starkey
(1988) named these people as Mucuta (1985), Smith (1988) and Vietmeyer (1982). They
strongly advocated the use of head/horn yokes, withers/shoulder yokes, collars, breast bands
single yokes or double yokes.
46
University of Ghana http://ugspace.ug.edu.gh
Human labour. Human labour can be a critical constraint in a family and AT may ease or
exacerbate this. Farm households that do not have sufficient labour to manage draft animals
throughout the year may be unable to adopt AT. Stumping fields to allow the use of animal
drawn ploughs itself requires much labour, and in some areas, this may be a critical constraint
to adoption (Seifert, 1992).
Lack of capital and/or credit. The adoption of AT can be highly dependent on the
availability of these resources. The market cost of oxen, cultivation implements and carts in
West Africa is high, relative to average farm incomes (Starkey, 1988). Seifert (1992) noted
that it would be impossible for poor peasants to introduce AT due to lack of funds, or it
would be inappropriate due to small acreage or family size.
Limited availability of animals. This can be a serious constraint to the employment of draft
animal power in some areas. In the humid and sub-humid zones of West and Central Africa,
there are very few cattle. Elsewhere, civil unrest or wars can restrict animal availability
(Starkey, 1988).
Social traditions. Starkey (1988) observed that in areas where AT is still a highly innovative
technology, it is common to hear someone argue that the technology is appropriate to one
tribal group, but not to another. Theft of animals or fear of this can affect AT users. In
Gambia, a reason given for using donkeys rather than oxen was the reduced risk of theft with
donkeys. In some countries, draft animals give prestige to their owners but they may also
cause jealousy and friction within communities (corbel, 1988).
National policies. National development policies can act as a major constraint to the
adoption of AT. Interventions at national level can greatly influence decisions at farm-level.
If AT is discouraged by governments as the case for Ghana in the late 1950's and early 1960's
(Munzinger, 1982), the necessary implements may become unavailable to the farmers. There
47
University of Ghana http://ugspace.ug.edu.gh

will not be allocation of resources for the provision of national services such as credit,
extension research and training.
48
University of Ghana http://ugspace.ug.edu.gh

CHAPTER FIVE
M ETHODOLOGY
5.0 Introduction
This chapter presents how the data for the study was collected, managed and processed.
There are various types of methodologies used in research. According to Sarantakos (1993)
the choice of any methodology depends on some factors. These factors are:
♦ The appropriateness of the method for the theoretical goals
♦ The adequacy of the method regarding the research objective
♦ The realisation of methodological rules which determine its structure, possibilities and
limitations and
♦ The examination of the prerequisites and conditions, which must be considered for the
performance of mathematical - statistical tests.
Survey was therefore found to be the most appropriate. Survey studies are studies that ask a
sample of respondents questions (often about opinions but commonly about factual matters as
well). Such survey generally interviews respondents in the field, mail questionnaires to the
respondents, households, or pass out questionnaires to a group (Bailey, 1987).
The discussion in this chapter falls under the following headings:
1. Research design
2. Population of the study
3. Procedure and selection of sample
4. Instrument development
5. Data gathering
6. Data management
7. Analysis of data
49
University of Ghana http://ugspace.ug.edu.gh
5.1 Research design
Since the study is a fact-finding exercise as stated earlier, a survey of the descriptive type was
used to collect the data. The design is cross-sectional. A cross-sectional study is one that
studies a cross-section of the population at a single point in time. Hence, a broad sampling of
persons of different ages, different educational and income levels, different races and
different religions is done for study (Bailey, 1987).
According to Bailey (1987), the basic advantage of a cross-sectional study is that data can be
gathered from a large number of people and these data are comparable since they are not
affected by changes over time. This suggested that although the field data was collected
within a short period of time, they were not significantly affected by the changes in time
between collection of information from a respondent to another.
5.2 Population of the study
The target population was taken as all farmers and Agricultural Extension Agents (AEAs) in
the Builsa traditional area. The target population is the unit for which the information is
required (Sarantakos, 1993). The "Unit of analysis" is the individual respondents in the
Builsa district. According to Bailey (1987) the unit of analysis refers to the different
characteristics of an individual person in the target population being studied.
5.3 Procedure and selection of sample
The Builsa district was selected as a case study. This is because AT was introduced into the
Builsa district around the same period with Navrongo, Bawku and Zuarungu which were all
under then North Mamprusi District. The study should have therefore covered the whole of
Upper East Region, but because of time, financial and language barriers, it restricted itself to
50
University of Ghana http://ugspace.ug.edu.gh

only the Builsa district and also because the researcher hails from Builsa District. Two-stage
random sampling was carried out to get a sample size of one hundred (100) respondents. This
sample size was chosen because of statistical analysis purpose. Bailey (1987) citing
Champion (1970) said for statistical data analysis to be done a sample size should not be less
than thirty (30) cases.
Firstly, four (4) villages were randomly selected from thirteen (13) villages. Only four
villages were selected because of time and financial constraints and also for easy supervision.
The selection was done by writing the names of villages on pieces of paper and rolling them
thoroughly. The rolled pieces of paper were then spread on the floor. Four persons were
asked to pick any of the rolled pieces of paper on the floor. The names of villages picked
became the four selected villages.
Secondly, one hundred (100) respondents (house) were also randomly selected from one
thousand and twenty-eight (1,028) houses using the same procedure for the selection of the
villages. The only difference was, instead of names of villages, names of houses were written
on the pieces of paper. House heads were interviewed.
Random sampling was done because the study population has the same cultural
characteristics and this was to give each respondent in the study population an equal
probability of being chosen for the sample. Sampling is the process of selecting a subset of
some pre-determined size from a population. According to Bailey (1987), sampling has the
following advantages:
1. Saves money
2. Saves time
51
University of Ghana http://ugspace.ug.edu.gh

3. Easy to supervise interviews
5.4 Agricultural Extension Agents (AEAs)
For the AEAs, the "complete survey" was used to collect data because they were only
seventeen (17) of them. The questionnaires were given to them to fill and return them within
two weeks.
5.5 Instrument development
A research instrument is "any type of written or physical device which is purported to
measure variables" (Sproul, 1988, cited in Atengdem, 1997). The choice of specific
instruments is influenced by some factors. According to Atengdem (1997) citing Sproul
(1988), the instruments should:
♦ Measure the variable appropriately
♦ Be sufficiently valid and reliable
♦ Yield the appropriate level of measurement for each variable
♦ Require an appropriate amount of time
♦ Be easy to acquire a response
♦ Be easy to administer
♦ Be easy to interpret and
♦ Incur costs within the researcher's budget
The following instruments and methods were therefore identified as the most appropriate for
the data collection:
1. Questionnaires
2. Informal interview and group discussions
3. Literature and documentary review formats
52
University of Ghana http://ugspace.ug.edu.gh
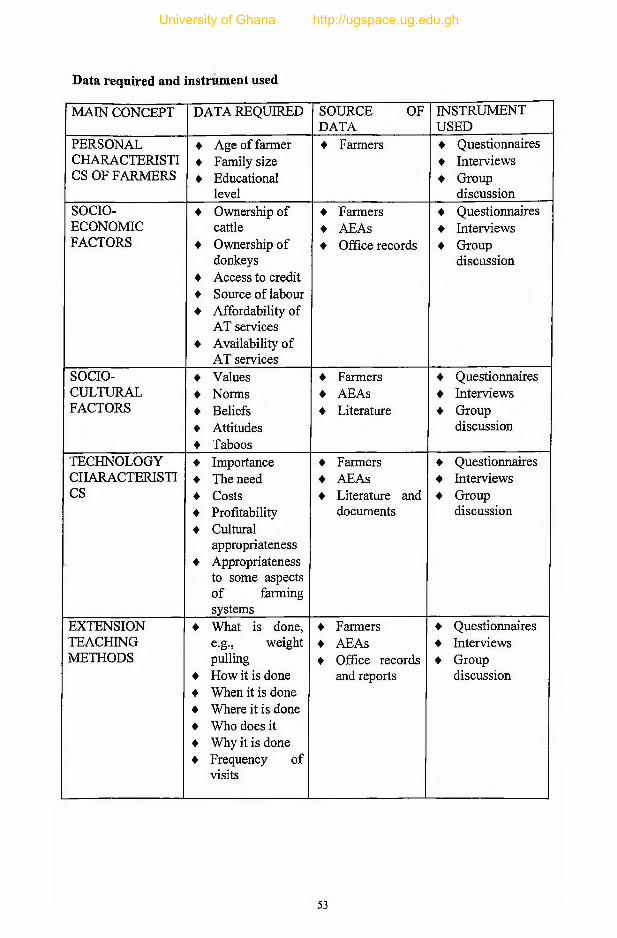
Data required and instrument used
MAIN CONCEPT DATA REQUIRED SOURCE OF DATA
INSTRUMENTUSED
PERSONAL CHARACTERISE CS OF FARMERS
♦ Age of farmer♦ Family size♦ Educational
level
♦ Farmers ♦ Questionnaires♦ Interviews♦ Group
discussionSOCIOECONOMICFACTORS
♦ Ownership of cattle
♦ Ownership of donkeys
♦ Access to credit♦ Source of labour♦ Affordability of
AT services♦ Availability of
AT services
♦ Farmers♦ AEAs♦ Office records
♦ Questionnaires♦ Interviews♦ Group
discussion
SOCIOCULTURALFACTORS
♦ Values♦ Norms♦ Beliefs♦ Attitudes♦ Taboos
♦ Farmers♦ AEAs♦ Literature
♦ Questionnaires♦ Interviews♦ Group
discussion
TECHNOLOGYCHARACTERISECS
♦ Importance♦ The need♦ Costs♦ Profitability♦ Cultural
appropriateness♦ Appropriateness
to some aspects of farming systems
♦ Farmers♦ AEAs♦ Literature and
documents
♦ Questionnaires♦ Interviews♦ Group
discussion
EXTENSIONTEACHINGMETHODS
♦ What is done, e.g., weight pulling
♦ How it is done♦ When it is done♦ Where it is done♦ Who does it♦ Why it is done♦ Frequency of
visits
♦ Farmers♦ AEAs♦ Office records
and reports
♦ Questionnaires♦ Interviews♦ Group
discussion
53
University of Ghana http://ugspace.ug.edu.gh

5.6 Data gathering process
The questionnaires and interview schedules were constructed. In order to ensure the validity
and reliability of the questionnaires, they were pre-tested.
Validity is the ability of an instrument to produce accurate results and to measure what is
supposed to be measured (Sarantakos, 1993). Reliability is the ability of an instrument to
produce consistent results (Sarantakos, 1993). Sarantakos (1993) noted that pre-testing helps
the researcher assess whether the interviewers understand and can administer the instrument
effectively and whether the target respondents find the interview schedule adequate for its
purpose. Bailey (1987) said pre-testing is done to remove ambiguous or extraneous questions.
The pre-testing was conducted in Sandema. Corrections were made by re-framing of
questions, deletions and additions.
5.6.1 Initial Arrangements
On arrival the researcher first visited the District Chief Executive (DCE) of the area to seek
permission from him to operate in the district. A similar visit was made to the DDA of MoFA
to seek permission from him to operate in the district, and to use some of his staff as research
assistants. It was also to collect documentary and literature materials, list of villages, names
of households and if possible names of farmers for sampling. Permission was also obtained
from NGOs operating in the communities where data was to be collected.
5.6.2 Interview Schedule
Lindzey and Aranson (1968) as cited in Kalton and Moser (1971) outlined three broad
conditions for a successful interview. These are:
♦ The accessibility of the information to the respondents
54
University of Ghana http://ugspace.ug.edu.gh
♦ Cognition or understanding by the respondent of what is required and
♦ Motivation on the part of the respondent not just to answer the questions but give accurate
answers.
The interview was conducted in the local dialect (Buli) since most of the respondents were
illiterate. The researcher and his assistants also speak the same dialect hence no need for
interpretation, which might distort information. The respondents were interviewed in their
respective homes. This was meant to get the individual's views and opinions.
5.6.3 Group Discussion
There was no formal group discussion but occasionally the researcher had informal group
discussions with the farmers. This was done to obtain a wide range of opinions as part of the
research was historical. Sarantakos (1993) said group discussion is a way of gaining
information in a short period of time about the breath or variation of opinions and of
establishing a mechanism of opinion information.
5.7 Data Management
Completed questionnaires were received they were scanned through to ensure that
information on the key concepts was collected. The responses for closed and open-ended
questions were coded appropriately. Coding is a process in which statements and answers are
translated into numbers (Sarantakos, 1993). Unlike the closed questions, the open-ended
questions were put into pattern of categories after studying the responses. These categories
are mutually exclusive and exhaustive and allow some degree of quantification if a
quantitative framework is employed (Sarantakos, 1993). Research assistants were trained on
how to administer the questionnaires.
55
University of Ghana http://ugspace.ug.edu.gh

5.8 Storage and Handling of Data
In order to establish uniformity with the closed responses for the purpose of analysis, the
open-ended responses were post-coded. The responses on the individual questionnaires were
coded following the listing and categorisation of the responses. Data was then transferred to a
sheet of paper for easy handling before entering it on to the computer. The data collected
from the group discussions, documents and literature were compiled into notes to be used to
support data during analysis, interpretation and discussion of results.
5.9 Data Analysis
The data was entered onto the computer using the Statistical Package for the Social Sciences
(SPSS). Frequencies and cross tabulations were ran, analysed and the results interpreted.
Non-parametric statistical tests were used to test the level of significance of the hypothesis.
Non-parametric tests are used when data is ordinal, nominal or when subjects are allocated to
categories (Greene and d'Oliveira, 1988).
To determine whether the hypotheses stated earlier were true, the degrees of freedom was
taken to be one (1) and the level of significance (critical value) as 0.05. The level of
significance is a statistical test value whose associated probability of occurrence under the
null hypothesis Ho is equal to or less than some small probability, usually denoted oc. The
purpose of setting a significance level is to define a rare event under (Ho) when the null
hypothesis(Ho) is true. Thus, if (Ho) were true, and if the result of the statistical test on the set
of observed data has a probability less than or equal to oc, it is the occurrence of a rare event
that would lead us, on a probabilistic basis, to reject (Ho) (Siegel and Castellan Jr., 1988).
56
University of Ghana http://ugspace.ug.edu.gh

According to Bailey (1987) the chi-square (%2) and Fisher’s Exact Tests are used to test the
level of significance, but that unless all expected values are at least 5, one cannot assume the
distribution to be %2, hence the chi-square can not be used in this case. For this reason, the
Fisher’s Exact Test was found more appropriate and was used. For the use of Fisher’s Exact
Test, all tables were re-grouped into 2 x 2 tables (Siegel and Castellan Jr., 1988). The Fisher’s
Exact Test Score was then compared with the level of significance, (0.05). If the Fisher’s
Exact Test Score was found to be less or equal to the level of significance, the null hypothesis
(Ho) was accepted. If it was found to be more than the level of significance, the null
hypothesis (Ho) was rejected. Hence, symbolically, it can be represented as p < 0.05 =
significant and p > 0.05 = not significant where p is the Fisher’s Exact Test Score.
57
University of Ghana http://ugspace.ug.edu.gh

CHAPTER SIX
CHARACTERISTICS OF THE STUDY PO PULATION
6.0 Introduction
This chapter presents the findings, presentation and discussion on the characteristics of the
study population. For ease of presentation the chapters is divided into two sections namely:
1. Characteristics of farmers
2. Characteristics of Agricultural Extension Agents.
SECTION ONE
6.1 Characteristics of Farmers
This section presents the findings, presentations and discussions on the personal, socio
economic and socio-cultural characteristics of farmers. The section tries to find out whether
the characteristics mentioned affect the adoption of AT as stated in Objectives 2, 3 and 4.
6.1.1 Personal Characteristics
Under this, only results of personal characteristics of respondents, which are relevant to the
objectives of the research, are presented. These include
• ages of respondents
• their family size
• educational levels.
Age of respondents
The ages of most of the respondents, especially those who were forty years or above were
estimated using important events in their years of birth. The percentage and age distribution
of respondents is presented in Table 6.1.
58
University of Ghana http://ugspace.ug.edu.gh

Table 6.1: Distribution of respondents by age
Age category (years) Frequency %
30 - 47 (Youth) 44 44.0
48 - 65 (middle age) 36 36.0
66+ (old age) 20 20.0
Total 100 100.0
Source: Field Survey 2002
The ages of respondents were classified into three categories, namely; the youth, (30-47)
years, the middle age (48-65) years and the old age (66 or above) years. The mean age was
50.8 years whilst the minimum and maximum ages were 30 and 95 years respectively.
Majority of respondents (44%) were in the youth category, followed by the middle age\
category (36%) and the old age category (20%). The economically active group in a nation is
between 15-64 years (Ghana Statistical Service 2002; Barrett et al 1982). As indicated in
Table 6.1, majority of the respondents fall within this range. Age can influence the adoption
or rejection of a technology. For example a technology that looks complex or needs more
labour and energy for an old person may be easy for a young person, van den Ban and
Hawkins (1996) and Swanson (1984) noted that innovators tend to be relatively young.
Atengdem (1997) also observed that age is an important factor in determining the working
ability of any person.
Family size of respondents
On the size of family, children who were four years or below were not included because at
those ages, children can neither farm nor tend livestock. The distribution of respondents by
family size is presented in Table 6.2.
59
University of Ghana http://ugspace.ug.edu.gh

Table 6.2: Distribution of respondents by family size
Family size (No. Of persons) Frequency %
1-5 9 9.06-10 50 50.011 -15 27 27.016-20 8 8.0
21+ 6 6.0
Total 100 100.0Source: Field Survey 2002
The minimum number of persons per family was four (4) with twenty-six (26) as the
maximum. The mean family size was ten (10). The average household size for the various
electoral areas in the Builsa District for 2000 population and housing census ranged from 3.9
to 6.9 persons (Ghana Statistical Service 2002). The mean for the study being more than the
mean for the population and housing census could be that the study was conducted in areas
with large compound houses.
Table 6.2 indicates that majority of respondents (59%) had family size between one and ten
(1 - 10). These are respondents from the big towns who practice the nucleus family system
due to pressure on land and other social amenities. The remaining respondents (41%) are
from the villages (outskirts) who still believe in the extended family system and that the
social status of a person is determined by the size of the family hence the need for large
families Lynn (1937) noted that in North Mamprusi (of which Builsa district was then part)
wealth and position are associated not with money but with the number of wives and children
and livestock that a man has. The large number of persons per family can affect the adoption
of a technology. A small family size is not likely to adopt a technology, which needs either
division of labour or larger work force, whilst a larger family size may adopt. Barrett,
60
University of Ghana http://ugspace.ug.edu.gh

Lassiter, Wilcock, Baker and Crawford (1982) observed that both oxen and donkey farmers
have larger families and larger work force than their hoe-farmer counter-parts. Stumping
fields to allow the use of animal-drawn ploughs itself requires much labour, and in some
areas this may be a critical constraint to adoption (Reynolds, 1988). Farm households that do
not have sufficient labour to manage draft animals throughout the year may be unable to
adopt animal traction (Starkey, 1988).
Educational Level of respondents
The distribution of respondents by educational level is presented in Table 6.3. As shown in
Table 6.3 majority of respondents (72%) had no formal education 25% had basic education
whilst 3% had secondary/tertiary education. The majority of respondents had no formal
education.
Table 6.3: Distribution of respondents by educational level
Educational Level Frequency %
No formal Education 72 72.0
Basic Education 25 25.0
Secondary/Tertiary Education 3 3.0
Total 100 100.0
Source: Field Survey 2002
Probably those who had formal education were in government work or migrated to the towns
and cities to look for “white collar jobs” or greener pastures. Education plays an important
role in the adoption process. An educated and literate person is likely to adopt an innovation
faster than an illiterate person if literacy is required. He has access to a lot of information
61
University of Ghana http://ugspace.ug.edu.gh

about the technology through reading. Urasa, (1994) said most smallholder farmers have had
only very limited education and so any new technology to be introduced should be simple
enough to be understood by the farmers. Swanson (1984) citing Rogers (1983) shows that
innovators tend to be relatively young, better educated and “better o f’.
6.1.2 Socio-economic characteristics
This section presents the findings, presentations and discussions on the socio-economic
characteristics of the study population. These include
• Ownership of cattle and donkeys
• Affordability and availability of Animal traction (A.T) services
• Source of A.T. services
• Availability of credit facilities
• Form and use of credit
• Adequacy and timeliness of credit
• Size of farms and
• Source of farm labour.
Munzinger (1982) observed that the economic situation of the individual farmer is the
decisive factor in determining whether he goes over to the use of draught oxen.
Ownership of Cattle
The percentage of ownership of cattle by respondents is presented in Table 6.4.
62
University of Ghana http://ugspace.ug.edu.gh

Table 6.4: Distribution of respondents by type of Ownership of Cattle
Type of Ownership Frequency %
Individual 21 21.0Family 56 56.0Both family and Individual 4 4.0No Cattle 19 19.0
Total 100 100.0Source: Field Survey 2002
Livestock, especially cattle play a vital role in terms of wealth of a person in the Builsa
District. Lynn (1937) noted that in North Mamprusi (Builsa District inclusive), wealth and
position are associated not with money, but with the number of wives and children and
livestock that a man has. The study showed that (56%) majority of respondents had family
cattle. This situation may reduce adoption of animal traction. This is because before some
animals are trained all family members must agree. Even when animals are trained there may
be conflicting interests for access during the crucial working hours and responsibility for
maintaining the animals at other times. The study noted that access to work animals during
the season was done according to seniority. The one maintaining the work animals may not
get access to the bullock services early, if he is not a senior. Even if he gets, it could be too
late. In this case even though there may be cattle, the individual prefers getting animal
traction services from outside or using the hoe.
Ownership of Donkeys
The distribution of respondents by type of ownership of donkeys is presented in Table 6.5.
63
University of Ghana http://ugspace.ug.edu.gh
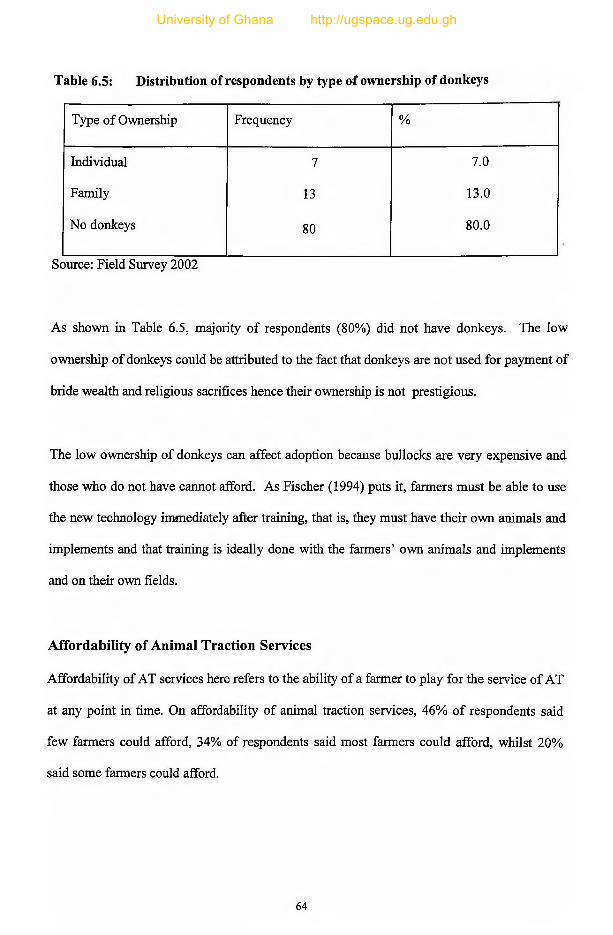
Table 6.5: Distribution of respondents by type of ownership of donkeys
Type of Ownership Frequency %
Individual 7 7.0
Family 13 13.0
No donkeys 80 80.0
Source: Field Survey 2002
As shown in Table 6.5, majority of respondents (80%) did not have donkeys. The low
ownership of donkeys could be attributed to the fact that donkeys are not used for payment of
bride wealth and religious sacrifices hence their ownership is not prestigious.
The low ownership of donkeys can affect adoption because bullocks are very expensive and
those who do not have cannot afford. As Fischer (1994) puts it, farmers must be able to use
the new technology immediately after training, that is, they must have their own animals and
implements and that training is ideally done with the farmers’ own animals and implements
and on their own fields.
Affordability of Animal Traction Services
Affordability of AT services here refers to the ability of a farmer to play for the service of AT
at any point in time. On affordability of animal traction services, 46% of respondents said
few farmers could afford, 34% of respondents said most farmers could afford, whilst 20%
said some fanners could afford.
64
University of Ghana http://ugspace.ug.edu.gh
The 46% respondents who said few fanners could afford animal traction services were
bullock owners. Some bullock owners complained that whenever they plough for people they
refuse to pay them, an indication that they cannot afford the cost of the services. The other
34% were bullock owners who have been paid for their services. This finding is consistent
with Galjart (1971), cited by Fliegel (1984), who observed that in addition to unwillingness to
adopt innovations one should raise questions about inability to adopt. Hawens and Flinn
(1975) cited by Fliegel (1984) in support said laggards are not necessarily unwilling to adopt
innovations, but are unable to implement their adoption decision.
Availability of Animal Traction Services
Availability of AT service is a situation where a farmer gets AT services any time he/she
wants without difficulty. The study showed that 65% of respondents said animal traction
services were not readily available, 22% said somewhat available whilst 13% said animal
traction services were readily available.
The 65% who said animal traction services were not readily available are those who do not
own bullocks or donkeys at all or those who have family ownership. In the case of the family
ownership, one would have to wait until his turn since they would be ploughing according to
seniority. In the case of those who do not own bullocks at all they will have to wait until the
owners finish ploughing. Even that, it will depend on how close he is to the owner or the
number of requests made before him. This can affect adoption since he might not see the
benefits or advantages of animal traction over the use of hoe because of the late ploughing.
Johnson and Kellogg's (1984) observed that farmers will accept new cultivated more land
when they had draft animals so that total yield over farm increased.
65
University of Ghana http://ugspace.ug.edu.gh

Source of Animal Traction Services
The study indicated that majority of respondents (69%) had their own animal traction
services, 22% hired animal traction services whilst 9% had no source of animal traction
services, hence they used the hoe. Of the nine (9) respondents who did not enjoy animal
traction services, four (4) of them said they could not afford the cost of ploughing, two (2)
said they feared disappointments, whilst three (3) said they had enough family labour and did
not need animal traction services.
This finding confirms Galjart (1971), as cited by Fliegel (1984), observations from his studies
of smallholder farmers that in addition to unwillingness to adopt innovations one should raise
questions about inability to adopt. Hawens and Flinn (1975) as cited by Fliegel (1984), also
observed that laggards are not necessarily unwilling to adopt innovations, but are unable to
implement their adoption decision. Beal and Sibley (1967) as cited by Shaner, Philipp and
Schmehl (1982) said beliefs might influence the farmer’s attitudes, behaviour and goals. For
example even though farmers may be treated fairly when seeking credit, the anticipation of
being treated unfairly may keep them from seeking credit as in the case of those respondents
who said they feared disappointments. Those who said they had enough family labour also
confirms Brown’s (1966) citing Mead (1955) observation that the introduction of
mechanisation of agriculture has either fallen through or encountered difficulties because the
local population has considered it not only uneconomical (since human labour is considered
cheaper) but also that it would leave the farmer “with even less of the creative work of which
he now has too little”.
66
University of Ghana http://ugspace.ug.edu.gh

Respondents who had access to credit facilities
The study conducted revealed that only (16) sixteen out of the hundred (100) respondents
interviewed had credit facilities for AT from financial institutions either in cash or in kind.
The remaining eighty-four (84) respondents did not get any credit facilities from any source
(formal and informal). Reasons given for not getting the credit facilities included the
following:
1) The procedures of getting credit is cumbersome.
2) They did not belong to any group or association, one of the criteria used in giving
credit.
3) They feared getting government loans because of prosecution and disappointments.
4) They applied but were denied because they did not belong to the party of the ruling
government.
5) The amount of loans approved were usually inadequate.
6) Could not use loan for its purpose because of late disbursement.
7) Others said they were self-sufficient and did not need any loan.
Credit can be a critical constraint to the adoption of animal traction. Some of the findings
above confirm the observations made by Munzinger (1982) that National development
policies can represent either an impetus to animal traction, or they can act as a major
constraint. Interventions at national level can greatly influence decisions at farm-level.
Out of the sixteen (16) respondents who had the credit facilities, seven (7) used the credit to
buy foodstuffs, whilst the remaining nine (9) used it for either funerals or payment of bride
wealth. The inability of respondents to use credit for its purpose, that is purchase of draught
animals or hiring of animal traction services was attributed to the inadequacy of the credit.
67
University of Ghana http://ugspace.ug.edu.gh

This is because fourteen (14) out of the sixteen (16) who had the loan said the loan was not
adequate. Another reason for using the credit for other purposes other than animal traction
was the time they received the credit. This is because out of the hundred (100) respondents
interviewed, ninety-five (95) of them said credit facilities were mostly late.
Availability of Credit Facilities
On the availability of credit facilities, the study showed that out of the hundred (100)
respondents interviewed ninety five (95) said credit facilities were not readily available, five
(5) said credit facilities were somewhat available. However, no respondent indicated that
credit facilities were readily available. But from the reasons given earlier in the forgone
paragraph for not getting the credit facilities, one is tempted to conclude that the problem of
respondents was not availability of credit, but rather accessibility of credit facilities. For
example reasons like procedure is cumbersome, do not belong to any group indicated that the
credit was available but how to access it could be the problem.
The Farm Size of Respondents
Farm sizes of respondents were put into three categories for easy analysis. The farm size of
each respondent was estimated using the then existing charges for ploughing one acre of land
in the community and the number of man days used in weeding each plot of land. The
distribution of respondents by size of farm is presented in Table 6.6.
68
University of Ghana http://ugspace.ug.edu.gh

Table 6.6: Distribution of respondents by the size of farms
Size of farm Category (acres) Frequency %
1-5 (small scale farmers) 24 24.06-10 (Medium scale farmers) 42 42.011+ (Large scale farmers) 34 34.0
Total 100 100.0Source: Field Survey 2002
The minimum farm size was two (2) acres with twenty-nine (29) acres as the maximum. The
mean farm size was nine (9) acres. From Table 6.6 the medium scale farmers were the
majority (42%) followed by the large scale fanners (34%) and the small-scale farmers were
the least (24%).
When interviewed the small-scale farmers complained of either lack of land or no money to
hire animal traction to increase their acreage. However, the medium and large scale farmers
said apart from the large number of dependents they had to feed, land was not a problem.
They also had their own bullocks or could afford the cost of ploughing. This confirms the
findings of Gboku (1988). He noted that animal traction might assist farmers to increase the
total production of their crops. One of the clearest ways in which this is achieved is through
increase in area cultivated. He said there is very often a correlation between farm size and
the ownership of draft animals, although this does not necessarily mean that the animals are
the cause of the large area of cultivation; it may be that the farmers that have big farms are
the ones wealthy enough to use draft animals, so that draft animals may be the result of large
farms. Recorded farm areas before and after the adoption of draft animals tend to indicate
that where land is available, farmers will cultivate more land when they have draft animals,
so that total yield per farm increases (Barrett et al, 1982; Panin, 1986.
69
University of Ghana http://ugspace.ug.edu.gh

6.1.3 Socio-cultural characteristics
Under this section, the results, presentations and discussions on the socio-cultural
characteristics of the study population are presented. These are:
• The cultural acceptability of animal traction technology,
• The level of respect given to cattle owners, donkey owners,
• The category of people who manage work animals.
Cultural Acceptability
All the hundred (100) respondents interviewed said animal traction technology was
acceptable in the community. However, the only reason why some cattle owners do not have
working animals is to avoid jealousy and hatred. That because animal traction owners
normally increase the total production of their crops through increases in area cultivated,
people tend to hate them and can kill them through spiritual means. This observation is in
line with Starkey (1988) who noted that the adoption of animal traction tends to increase
income differences between farmers within villages.
The traditional beliefs and attitudes of the people can also make the introduction of
technologies difficult in certain areas as the reasons given by some cattle owners for not
having work animals. Brown (1966) citing, Edwin (1939) noted that in India the Baiya
refused to use an iron plough because they believe that the iron plough would repay with
harshness the generosity of the land.
Level of respect given to cattle (bullock) owners
The distribution of respondents by their perception of the level of respect given to cattle
owners is presented in Table 6.7.
70
University of Ghana http://ugspace.ug.edu.gh

Table 6.7: Distribution of respondents by their perception of the level of respectgiven to cattle (bullock) owners
Level of respect Frequency %
Very high 34 34.0
High 56 56.0
Average 10 10.0
Low 0 0.0
Very low 0 0.0
Total 100 100.0Source: Field Survey 2002
From Table 6.7 majority of respondents (56%) ranked level of respect given to cattle owners
as being high, 34% ranked them as very high and 10% ranked them average. No respondent
ranked them low or very low.
This shows the importance respondents attach to ownership of cattle. This is even shown in
Table 6.4 where only nineteen (19) out of the hundred (100) respondents did not own cattle.
This level of respect could be attributed to the fact that cattle is used for funerals, sacrifices
bride wealth and for security purposes. Lynn (1937) noted that in North Mamprusi (Builsa
District inclusive) wealth and position are associated not with money, but with the number of
wives, children, and livestock that a man has. However, the eleven who ranked cattle owners
as being average said the respect given to a cattle owner depends on the respect he gives to
others. A cattle owner who does not respect people is not respected.
71
University of Ghana http://ugspace.ug.edu.gh

Level of respect given to donkey owners
The distribution of respondents by their perception of the level of respect given to donkey
owners is presented in Table 6.8. It can be seen from Table 6.8 that majority of respondents
(54%) ranked the level of respect for donkeys as being high, followed by those who ranked
them average (35%), very high 7% and low 4%. Nobody ranked them very low. Those who
ranked respect given to donkey owners as being high or very high are likely to be those who
own donkeys or have enjoyed the services of donkeys in one way or the other. Those who
ranked donkey owners as average or low are likely to be those who do not own donkeys or
have not enjoyed their services. And also for the mere fact that they are not used for
sacrifices and payment of bride wealth, they are of low status.
Table 6.8: Distribution of respondents by their perception of level of respect given to
donkey owners
Level of Respect Frequency %
Very high 7 7.0
High 54 54.0
Average 35 35.0
Low 4 4.0
Very low 0 0.0
Total 100 100.0
Source: Field Survey 2002
As compared to the level of respect given to cattle in Table 6.7, more respect is given to cattle
owners than donkey owners, probably due to the multiple functions it plays or because cattle
is naturally preferred. As noted by Starkey (1988) that animal traction both benefits from,
and suffers from long standing traditional preferences and the vagaries of more rapidly
72
University of Ghana http://ugspace.ug.edu.gh

changing “fashions”. That animals often have prestige status unrelated to their working
abilities, so that one sickly horse may have higher social status than a pair of strong oxen. In
some countries and communities the colours of animals and implements may be very
important influencing decisions relating to adoption, even though it is unlikely that these
factors would influence performance.
Category of people who manage work animals
Table 6.9 presents the distribution of respondents by the category of people who manage
work animals
Table 6. 9: Distribution of respondents by the category of people who manage workanimals
Category of people who manage work animals Frequency %(N=100)
Boys 100 100.0
Girls 56 56.0
Men 95 95.0
Women 14 14.0
Multiple response.Source: Field Survey 2002
Table 6.9 indicates that all the respondents (100%) said boys manage work animals, 95% said
men manage work animals whilst 56% and 14% said girls and women respectively.
The study indicated that there was no custom which prevents any gender from managing
work animals. That in a family where there are no children or the children are attending
school, then the men and women would manage the work animals. The reason why it is not
common to see women managing work animals may be just out of fear and also because of
the numerous roles women play in the household.
73
University of Ghana http://ugspace.ug.edu.gh

Starkey (1988) observed that men and children usually train the animals, work with them and
herd them. He said children often tend draft animals and because of this their educational
prospects can suffer, either due to limited school attendance or due to fatigue when school is
combined with looking after animals.
6.1.4 Summary: Characteristics o f Farmers
In summary, it was found under the social characteristics of the respondents that most of
them (44%) were the youth, 36% the middle age and 20% the old age. The study also
revealed that most respondents (50%) had family size between 6-10 person, whilst those with
21 or more persons were the least (6%). Out of the hundred (100) respondents interviewed
seventy two (72) had no formal education.
On the socio-economic characteristics of the respondents, the study indicated only 19% of
respondents did not own cattle. Also 80% of respondents did not own donkeys. Out of the
hundred (100) respondents interviewed on the affordability of animal traction services,
majority of them said few farmers could afford On availability, a majority of 65% said animal
traction services were not readily available, 22% said it was somewhat available. The study
again indicated that 69% of respondents, used their own draft animals, and 22% hired.
However, 9% did not use draft animals, either because they could not afford the cost of
ploughing or had enough family labour. From the interview it was shown that 84% of
respondents did not receive any credit facility, only sixteen (16) of the respondents had credit.
Of the sixteen (16) seven (7) of them use the credit to buy foodstuff, whilst nine (9) used the
credit for funerals, payment of marriage dowries with the reasons that either credit was
inadequate or it was received very late and could not be used for the intended purpose. On
availability of credit facilities 95 out of the 100 respondents said credit was not readily
74
University of Ghana http://ugspace.ug.edu.gh

available. The study also revealed that medium scale farmers were 42; large-scale farmers 34
and small-scale farmers were 24.
On the socio-cultural characteristics of respondents, all the hundred (100) respondents said
animal traction technology was culturally accepted in the community. Jealousy and hatred
might prevent people from owning draft animals. On respect given to bullock owners 56% of
respondents rated high, 34% rated very high and 10% rated average. No body rated them low
or very low. On the respect given to donkey owners those who rated them high was 54%,
average 35%, very high 7%, and low 4%. The study also indicated that 100% of the
respondents said boys manage work animals, 95% said men manage work animals, 56% said
girls manage work animals and 14% said women manage work animals. All the respondents
did indicate that there was no custom preventing women or girls from managing work
animals.
6.2 Characteristics of Extension Agents
This section presents findings, presentations and discussions on the characteristics of the
extension agents. This may help answer the research question whether the extension methods
used so far affected the adoption of AT and to find out its effectiveness in promoting AT as
demanded by Objective 8. Areas to look at therefore include:
• Number of in-service trainings
• Duration of the in-service training
• Source of in-service training
• Methods used in training AEAs
• Frequency of visits made by AEAs
• Reasons for inability to make visits to farmers
75
University of Ghana http://ugspace.ug.edu.gh
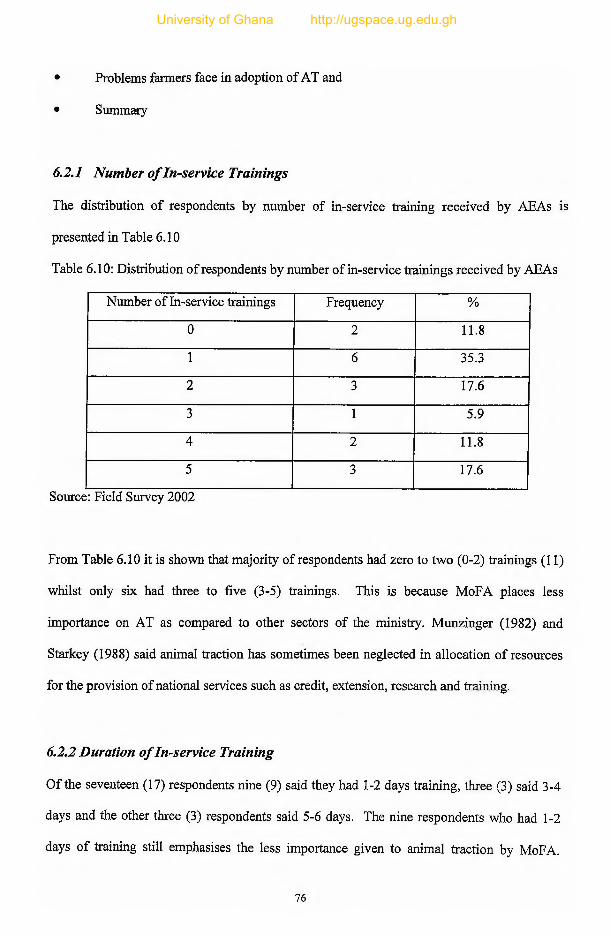
• Problems farmers face in adoption of AT and
• Summary
6.2.1 Number o f In-service Trainings
The distribution of respondents by number of in-service training received by AEAs is
presented in Table 6.10
Table 6.10: Distribution of respondents by number of in-service trainings received by AEAs
Number of In-service trainings Frequency %
0 2 11.8
1 6 35.3
2 3 17.6
3 1 5.9
4 2 11.8
5 3 17.6
Source: Field Survey 2002
From Table 6.10 it is shown that majority of respondents had zero to two (0-2) trainings (11)
whilst only six had three to five (3-5) trainings. This is because MoFA places less
importance on AT as compared to other sectors of the ministry. Munzinger (1982) and
Starkey (1988) said animal traction has sometimes been neglected in allocation of resources
for the provision of national services such as credit, extension, research and training.
6.2.2 Duration o f In-service Training
Of the seventeen (17) respondents nine (9) said they had 1-2 days training, three (3) said 3-4
days and the other three (3) respondents said 5-6 days. The nine respondents who had 1-2
days of training still emphasises the less importance given to animal traction by MoFA.
76
University of Ghana http://ugspace.ug.edu.gh
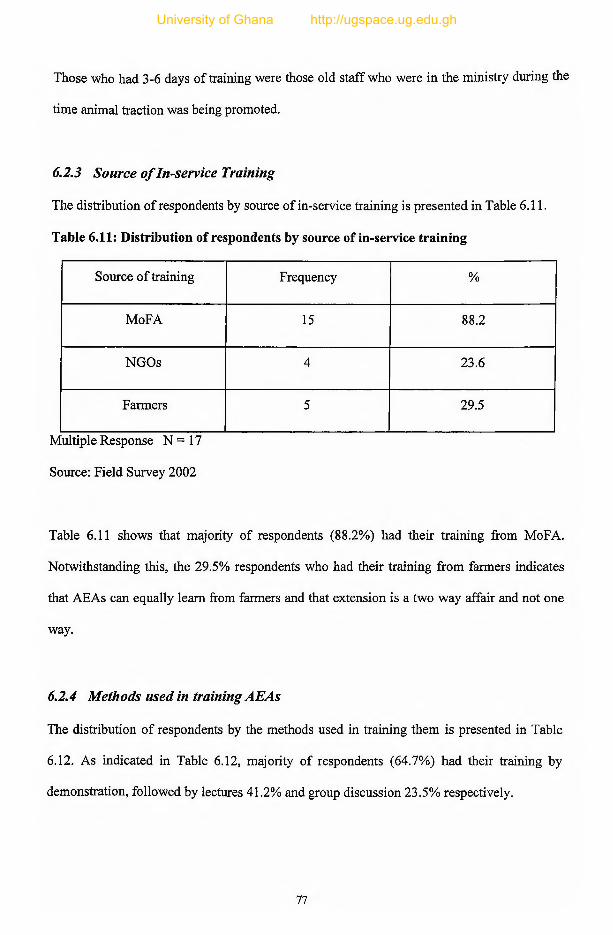
Those who had 3-6 days of training were those old staff who were in the ministry during the
time animal traction was being promoted.
6.2.3 Source o f In-service Training
The distribution of respondents by source of in-service training is presented in Table 6.11.
Table 6.11: Distribution of respondents by source of in-service training
Source of training Frequency %
MoFA 15 88.2
NGOs 4 23.6
Farmers 5 29.5
Multiple Response N=17
Source: Field Survey 2002
Table 6.11 shows that majority of respondents (88.2%) had their training from MoFA.
Notwithstanding this, the 29.5% respondents who had their training from farmers indicates
that AEAs can equally learn from farmers and that extension is a two way affair and not one
way.
6.2.4 Methods used in training AEAs
The distribution of respondents by the methods used in training them is presented in Table
6.12. As indicated in Table 6.12, majority of respondents (64.7%) had their training by
demonstration, followed by lectures 41.2% and group discussion 23.5% respectively.
77
University of Ghana http://ugspace.ug.edu.gh
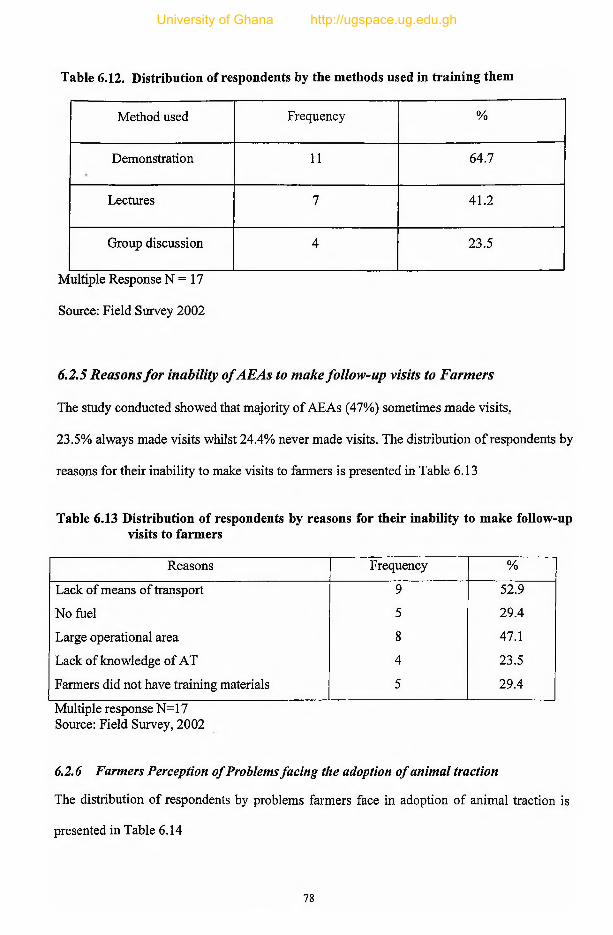
Table 6.12. Distribution of respondents by the methods used in training them
Method used Frequency %
Demonstration 11 64.7
Lectures 7 41.2
Group discussion 4 23.5
Multiple Response N = 17
Source: Field Survey 2002
6.2.5 Reasons fo r inability o f AEAs to make follow-up visits to Farmers
The study conducted showed that majority of AEAs (47%) sometimes made visits.
23.5% always made visits whilst 24.4% never made visits. The distribution of respondents by
reasons for their inability to make visits to fanners is presented in Table 6.13
Table 6.13 Distribution of respondents by reasons for their inability to make follow-up visits to farmers
Reasons Frequency %
Lack of means of transport 9 52.9
No fuel 5 29.4
Large operational area 8 47.1
Lack of knowledge of AT 4 23.5
Farmers did not have training materials 5 29.4
Multiple response N=17 Source: Field Survey, 2002
6.2.6 Farmers Perception of Problems facing the adoption of animal traction
The distribution of respondents by problems farmers face in adoption of animal traction is
presented in Table 6.14
78
University of Ghana http://ugspace.ug.edu.gh

Table 6.14 Distribution of respondents by problems farmers face in adoption of animal traction
Problem Frequency %
Lack of spare parts/implements 14 82.4
Lack of capital 16 94.1
Lack of bullocks 9 52.9
High cost of drugs 8 47.1
Illiteracy 9 52.9
High cost of implements 2 11.8Multiple Response N = 17Source: Field survey 2002
Table 6.14 shows that majority of respondents (94.1%) say lack of capital is the problem
facing farmers in the adoption of animal traction, followed by lack of spare parts 82.4%, lack
of bullocks 52.9%, illiteracy 52.9%, high cost of drugs 47.1% and high cost of implements
11.8% respectively.
6.2.7 Summary: Characteristics o f Extension Agents
In summary, majority of respondents (11 out of 17) had zero to two (0-2) trainings. The study
also showed that nine (9) out of seventeen (17) respondents had 1-2 days of training.
Respondents said there were no funds to keep them more than two days. On the source of
training, fifteen out of seventeen had their training from MoFA, five from farmers and four
from NGOs respectively. The five who had their training from farmers shows that AEAs can
equally learn from farmers. The study conducted also revealed that majority of AEAs
(47.0%) sometimes made visits to farmers, (23.5%) always made visits whilst (24.4%) never
made visits. Reasons for their inability to make visits were: lack of means of transport
(52.9%), large operational area (47.1%), no fuels (29.4%), farmers did not have training
79
University of Ghana http://ugspace.ug.edu.gh

materials (29.4%) and lack of knowledge in AT (23.5%). The study again indicated majority
of AEAs (64.7%) were trained using demonstration, followed by lectures (41.2%) and group
discussion (23.5%) respectively.
80
University of Ghana http://ugspace.ug.edu.gh
CHAPTER SEVEN
EXTENSION METHODS USED IN PROM OTING ANIM AL TRACTION
7.0 Introduction
The findings, presentations and discussions on extension methods used in promoting AT are
presented in this chapter. Here, attempts are made to answer the research question thus: Have
the extension methods used so far affected the adoption of AT? The objective to find out the
effectiveness of the extension methods used in promoting AT is also discussed here. Areas
looked at in the chapter therefore include:
• Awareness of AT
• Source of awareness
• Methods used in training
• Duration of training
• Adequacy of training
• Whether respondents were trained in groups
• Number in a group
• Respondents' participation in bullock handling during the training
• Level of respondents participation in yoking and nose-ringing
• Follow-up visits made by trainers
• Frequency of visits made by AEAs
• Effectiveness of extension methods
• Factors hindering the adoption of AT and
• Summary of the chapter.
81
University of Ghana http://ugspace.ug.edu.gh
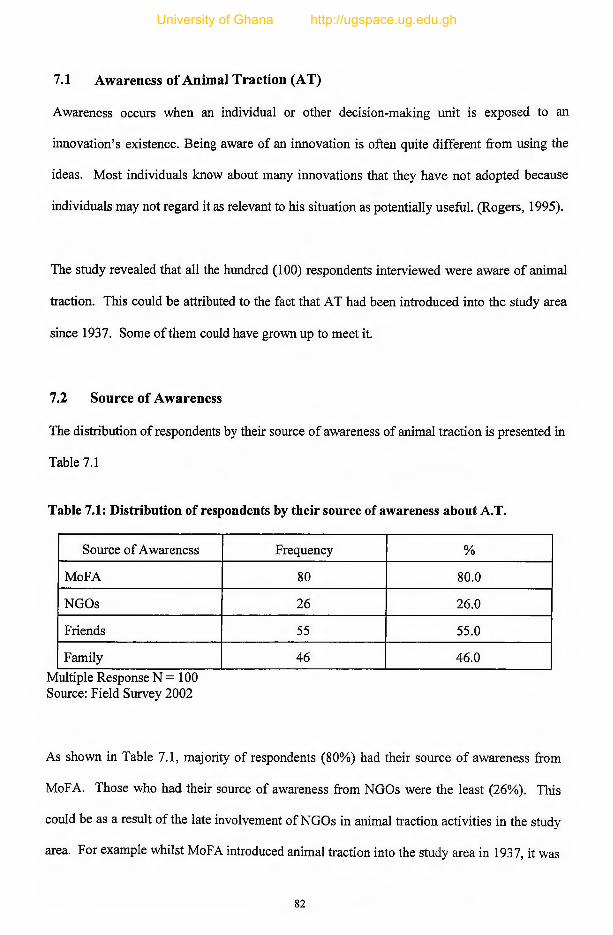
7.1 Awareness of Animal Traction (AT)
Awareness occurs when an individual or other decision-making unit is exposed to an
innovation’s existence. Being aware of an innovation is often quite different from using the
ideas. Most individuals know about many innovations that they have not adopted because
individuals may not regard it as relevant to his situation as potentially useful. (Rogers, 1995).
The study revealed that all the hundred (100) respondents interviewed were aware of animal
traction. This could be attributed to the fact that AT had been introduced into the study area
since 1937. Some of them could have grown up to meet it.
7.2 Source of Awareness
The distribution of respondents by their source of awareness of animal traction is presented in
Table 7.1
Table 7.1: Distribution of respondents by their source of awareness about A.T.
Source of Awareness Frequency %
MoFA 80 80.0
NGOs 26 26.0
Friends 55 55.0
Family 46 46.0Multiple Response N = 100 Source: Field Survey 2002
As shown in Table 7.1, majority of respondents (80%) had their source of awareness from
MoFA. Those who had their source of awareness from NGOs were the least (26%). This
could be as a result of the late involvement of NGOs in animal traction activities in the study
area. For example whilst MoFA introduced animal traction into the study area in 1937, it was
82
University of Ghana http://ugspace.ug.edu.gh

not until 1969 and 1974 that the Roman Catholic and Presbyterian churches respectively got
involved in animal traction activities.
7.3 Source of training
Training farmers and rural people often seeks to make available knowledge, skills and
attitudes required for more productive and efficient farming (Atengdem, 2001). Of the
hundred respondents interviewed eighty-four (84) of them had training in AT. Sixteen (16)
did not get training. Table 7.2 presents the distribution of respondents by their source of
training.
Table 7.2: Distribution of respondents by their source of training in A.T.
Source of training Frequency %
MoFA 18 21.4
NGO 22 26.2
Friends 29 34.5
Family 82 97.6
Multiple Response N = 100
Source: Field Survey 2002
Table 7.2 indicates that majority of respondents (82%) had their training in AT from their
families. Those who had their training from MoFA were the least (18%). This could be
attributed to the level of importance MoFA gives to A.T. as compared to other sectors of
MoFA. This finding supports the National Agricultural Extension Project (NAEP) animal
83
University of Ghana http://ugspace.ug.edu.gh

traction report (1997) that except few extension staff who in the past were involved in
training farmers and. bullocks and often supported by NGOs most of the frontline staff had
inadequate skills and confidence in training farmers and animals. Besides that animal
traction extension materials are limited. Majority of respondents had their training from their
families because, probably they grew up to meet their parents practicing AT As noted by
Helsloot and Kriut (1992) in Panin and Ellis (1992) that most transfer of technology relating
to AT had taken place through the family, neighbours and migrants. That there were very
few examples of knowledge or skills being obtained from the extension services which were
judged as rather irrelevant, unavailable or poor. Starkey (1988) observed that once AT has
started in a region, much transfer has been informal, within families from farmer to farmer or
from regional immigrants to local farmers. Thus formal extension is not important for
diffusion of animal traction. Successful farmer-to-farmer transfer appears to have been
responsible for the increase in the use of donkeys and working cows in several countries in
Southern Africa. This adoption has sometimes been against the advice of extension agents
(Starkey, 1994).
7.4 Methods Used in Training
Learning is an active process on the part of the learner. Unless he becomes interested to the
point of putting forth mental and physical effort to learn, nothing is accomplished. It is the
task of the extension worker to: (a) provide farmers with an opportunity to learn and (b)
stimulate mental and physical activity that produces the desired learning (Leagans, 1960).
The choice of extension teaching method and the ability to communicate effectively therefore
plays a significant role when trying to influence the adoption of technologies. Hence Table
7.3 presents the distribution of respondents by the methods used in training them.
84
University of Ghana http://ugspace.ug.edu.gh

Table 7.3: Distribution of respondents by the methods used in training them
Method Used Frequency %
Demonstration only 43 51.2
Group discussion only 8 9.5
Two or more methods 33 39.3
Source: Field Survey 2002
From Table 7.3 it is established that majority of respondents (51.2%) had their training by
demonstration followed by two or more methods 39.3% and group discussion 9.5%. The
reason for majority of respondents getting their training by demonstration could be that the
aim was to teach a skill. Also as indicated earlier most of them were trained by family
members and friends. Some of the respondents said they had lectures and group discussions
with MoFA staff who promised coming back to hold demonstration with them but never
turned up.
7.5 Duration of training
The distribution of respondents by duration of training is presented in Table 7.4. From Table
7.4, it is shown that majority of respondents sixty-seven (67) out of the eighty-four (84) who
had training had 1-2 days of training. This could be attributed to the fact that most of them
had their training from families or friends and also the period training took place. If training
was done during the cropping season both trainers and trainees might not have enough time
for the training since they will have other farming activities to carry out.
85
University of Ghana http://ugspace.ug.edu.gh

Table 7.4: Distribution of respondents by duration of training
Duration (days) Frequency %
1 -2 67 79.8
3 -4 8 9.5 |
5 -6 6 7.1
7+ 3 3.6
Total 84 100.0Source: Field Survey 2002
7.6 Adequacy of training
The distribution of respondents by adequacy of training is presented in Table 7.5
Table 7.5: Distribution of respondents by adequacy of training
Adequacy of training Frequency %
Highly inadequate 0 0.0
Inadequate 24 28.6
Somewhat adequate 10 11.9
Adequate 50 59.5
Highly adequate 0 0.0
Total 84 100.0Source: Field Survey, 2002
Table 7.5 indicates that majority of respondents 59.5% said training was adequate even
though majority of them said they had 1-2 days of training as indicated in Table 7.4. This
could be because of the need respondents had for animal traction and also most of the training
was done by demonstration. It has earlier been indicated that respondents ranked
demonstration as the most effective among all the teaching methods. One of the respondents
86
University of Ghana http://ugspace.ug.edu.gh

said “I watched my friend training his animal, I also went and cut sticks made yokes, nose
ringed my bullocks, harnessed them and started training them on my own. As noted by
Kwarteng and Zinnah (1994) a good knowledge and understanding of the audience,
especially their differences and similarities with respect to their age, level of education,
available resources and their entire social environment helps the extension agent select the
most suitable method. That the characteristics of the message, the teaching and learning
objectives and what the participants are expected to be able to do should also be considered.
For example if the aim is to provide knowledge, the extension agent may use lecture, if the
aim is to teach a skill, demonstration method may be more appropriate.
7.7 Whether respondents were trained in groups
On whether respondents were trained in groups fifty-five (55) of them said they were trained
in groups, whilst twenty-nine (29) of them said they were trained individually. On the number
of participants in a group fifty-five (55) of them said they were between 2-6 in a group.
7.8 Level of respondent's participation in bullock handling during the training
Majority of respondents said their level of participation in bullock handling was very high
whilst 27 said it was high. This could be as a result of the small number in the group thus
making it possible for every one to have a try. It could also be because most of them had
their training from families and friends, which was mostly by demonstration.
7.9 Level of respondent's participation in yoking and nose ringing
Out of the eighty-four (84) respondents who had training sixty-one (61) of them said their
level of participation in yoking and nose ringing was high, sixteen (16) ranked participation
87
University of Ghana http://ugspace.ug.edu.gh
as very high whilst six ranked participation as being average. Again the high level of
participation could be attributed to the training being done by family members and friends.
7.10 Follow-up visits by trainers
Seventy-seven (77) out of the eighty-four (84) said they never had follow-up visits, whilst
seven (7) said they had follow-up visits. This could be because most of the training was done
by fellow farmers; they did not have time to make such follow-up visits. The extension staff
might not also have the necessary logistics to enable them make follow-up visits.
7.11 Frequency of visits by AEAs
Ninety-three (93) out of the hundred (100) respondents said they never had visits from AEAs.
The remaining seven (7) who had visits from AEAs said it was quarterly. This could be lack
of logistics for the AEAs to make visits.
7.12 Effectiveness of Extension Methods
Farmers described effectiveness of extension methods as:
(1) Ability to explain to farmers the advantages and disadvantages of a technology
(2) Ability to convince farmers to adopt a technology
(3) The number of farmers adopting the technology
The distribution of respondents on their perception of effectiveness of Extension Methods is
presented in table 7.6.
University of Ghana http://ugspace.ug.edu.gh

Table 7.6: Distribution of respondents on their perception of effectiveness of ExtensionMethods
Extension methods Highlyineffective
Ineffective Some what effective
Effective Highlyeffective
Freq % Freq % Freq % Freq % Freq %
Demonstration 0 0 0 0 0 0 64 64 36 36
Group Discussion 0 0 28 28 62 62 10 10 0 0
Lectures 3 3 75 75 22 22 0 0 0 0
Audio visuals 25 25 68 68 7 7 0 0 0 0
Source: Field Survey, 2002
On the effectiveness of the extension methods used, the study showed that 36% of
respondents said demonstration was highly effective whilst 64% said it was effective.
Nobody ranked it as highly ineffective, ineffective or somewhat effective.
On group discussion 10% said it was effective, 62% somewhat effective, 28% ineffective.
Nobody ranked it as highly effective. Three percent (3%) rated lecture method as highly
ineffective, 75% ineffective and 22% somewhat effective. Nobody ranked it as highly
effective or effective. Audiovisuals had 25% rating it as highly ineffective, 68% ineffective
and 7% as somewhat effective. Nobody rated it as being highly effective or effective. In
order of effectiveness therefore demonstration ranks first, followed by group discussion,
lectures and audiovisuals respectively.
Respondents argued that with demonstration, you are always active and there is maximum
concentration. You do not easily forget. But with the other methods especially the lectures
and audiovisuals you can easily fall asleep. Moreover some of them because of old age they
have very poor retentive memory and also find it difficult to understand abstract things. That
89
University of Ghana http://ugspace.ug.edu.gh

some of them will not have the patience to sit and listen to lectures. It can be boring.
Therefore as noted by Kwarteng and Zinnah (1994), a good knowledge and understanding of
the audience, especially their differences and similarities with respect to their age, level of
education, available resources and their entire social environment helps the extension agent
select the most suitable method. The farmer’s decision to adopt or reject the technology
depends to a large extent on the extension agent’s ability to convince the farmer, van den
Ban and Hawkins (1996) noted that the message has to be presented such that the client
understands it. Also each culture and sometimes a region or community within a culture has
its peculiar means of communication as well as those common to other cultures. It must not
be taken for granted that the charnels and techniques of one culture necessarily exist in
another or that they would function effectively if they were introduced, for example written
literature is of little value among group’s that are highly illiterate (Maunder 1972). Starkey
(1988) said in most countries in the region, development programmes have tried to promote
animal-drawn wheel tool-carriers but the transfer process has not succeeded; the technology
has been "perfect yet rejected".
7.13 Factors hindering the adoption of animal traction
Distribution of respondents by factors hindering the adoption of animal traction is presented
in Table 7.6. It is shown that 83% of respondents said lack of capital hinders the adoption of
animal traction followed by high cost of bullock implements 44%, high cost of spare parts
34%, theft of cattle 32%, lack of bullocks 20% and illiteracy 13%. During the survey
respondents complained they did not have funds to purchase implements, spare parts and
bullocks. They did not also have funds to hire animal traction services. This problem is
captured in Chapter six (6) on affordability of animal traction services, where 46% of
respondents said few farmers could afford animal traction services. Barrett et al (1982)
90
University of Ghana http://ugspace.ug.edu.gh

observed that lack of capital or credit can be a critical constraint to agricultural development,
and the adoption of animal traction can be highly dependent on the availability of these
resources.
Table 7.6 Distribution of respondents by factors hindering the adoption of animal traction
Factor Frequency %
Lack of Capital 83 83.0
High cost of implements 44 44.0
High cost of spare parts 34 34.0
Lack of Bullocks 20 20.0
Theft of cattle 32 32.0
Feed 13 13.0Multiple Response N= 100 Source: Field Survey 2002
Respondents also complained of high cost and lack of bullock implements and spare parts.
This finding supports observations made by Starkey (1988) that lack of spare parts can also
be a constraint although it is seldom a critical one. Gifford, (1988) found that lack of
implements could be an important constraint to the use of animal traction.
The survey also revealed lack of bullocks and theft of cattle. Bullocks have either died or
been sold to purchase food stuff but could not be replaced because of their high cost. Theft
of cattle was also reported in Doninga where a respondent had all his cattle driven away. The
risk of animal mortality is particularly important for farmers who were not animal owners,
91
University of Ghana http://ugspace.ug.edu.gh

and who therefore purchased animals using savings or credit (Bangura, 1988). Havard and
Faye, (1988), as cited by Starkey (1990) also observed that the market cost of oxen,
cultivation implements and carts in West Africa is high relative to average farm incomes. In
some countries draft animals give prestige to their owners, but they may also cause jealousy
and friction within communities. In extreme cases this may lead to the loss of animals
through theft, poison or “witchcraft” (Corbel, 1988).
Respondents also complained that in the dry season all the grasses are burnt leaving nothing
for cattle to feed on. Cattle therefore travel long distances in search of feed and water and
never return. What they get is not sufficient and therefore animals are not strong enough to
do ploughing. This finding confirms observation made by Abiye Astatke, Reed and
Butterworth (1986), as cited by Starkey (1988) that large numbers of animals may die of
starvation especially in drought years. Furthermore it has been observed that farmers may
know how to improve the condition of their animals but choose not to. For example, farmers
in Ethiopia may sell hay for money, even when their own animals are in poor condition.
7.14 Summary: Extension methods used in promoting AT
Summarising the chapter, all the hundred respondents interviewed said they were aware of
animal traction. This could be attributed to the many years of its introduction into the study
area. On the source of awareness of animal traction, 80% of respondents had their source of
awareness from MoFA whilst those who had their source of awareness from NGOs were the
least (26%). This was also attributed to the late involvement of NGOs in animal traction
activities in the study area. The study also indicated that 84 of respondents had training and
that 97.6% of this number had their training from their families. Those who had their training
92
University of Ghana http://ugspace.ug.edu.gh

from MoFA were the least (21.4%). This was attributed to extension staff lacking skills to
train or did not have the materials necessary for training.
The study revealed that majority of respondents (51.2%) had their training by demonstration,
(39.3%) two or more methods and group discussion the least (9.5%). This was also because
most of them had their training from their family members. On the effectiveness of the
methods used, respondents ranked demonstration as the most effective, followed by group
discussion, lectures and audiovisuals respectively. Seventy-nine percent (79.8%) had 1-2
days of training. Those who had 7 or more days of training were the least (3.6%). This again
was because farmers did most of training. The study also showed that 59.5% of respondents
trained said the duration was adequate, 28.6% said training duration was inadequate. Fifty-
five (55) of respondents trained said they were trained in groups of between 2-6 people.
Twenty-nine (29) respondents said they were trained individually. On the level of
participation in handling bullocks, more than 60% of respondents ranked yoking and nose
. ringing, as very high. This could be due to the small size of the group and also farmers did
most of training. Seventy-seven respondents never had follow-up visits from trainers whilst
seven had follow-up visits. The study indicated 93 of the hundred (100) respondents never
had visits from AEAs. This could be attributed to lack of logistics for AEAs or lack of skills
in training. Respondents listed the following as factors hindering the adoption of animal
traction; lack of capital, high cost of implements and spare parts, lack of bullocks, theft of
cattle and inadequate feed for animals during the dry season.
93
University of Ghana http://ugspace.ug.edu.gh

CHAPTER EIGHT
USES, PERCEPTIONS AND EFFECTS OF ADO PTION OF ANIM AL TRACTION (AT) ON SELECTED ASPECTS OF THE FARM ING
SYSTEM S
8.0 Introduction
Chapter seven presents the findings, presentations and discussions on the uses, perceptions
and the effects of adoption of animal traction on selected aspects of the farming systems. The
Chapter tries to find out the influence the characteristics of animal traction technology have
on farmers adoption of the technology. It will find out the usefulness/importance of AT and
its compatibility within the farming system of the Builsa District.
8.1 Awareness of the Usefulness of AT
Variables under this are haulage and traction activities that bullocks are used for. For
eventual adoption to occur both the need for the technology and awareness of the potential
benefits of the technology must be present (Abdulai, 1994).
8.1.1 Haulage activities that bullocks are used for
Of the hundred (100) respondents interviewed all of them said they knew that bullocks were
used for carrying wood, gravel and farm produce. Eighty-five (85) of them said they knew
that bullocks were used in carrying water whilst only twenty-three (23) of them said bullocks
were used for transporting goods.
The reasons why only few of respondents knew that bullocks were used for transportation
could be that bullocks are normally not very docile to permit their usage for transporting
goods, and therefore using them to transport goods is not common in the study area. It also
depends on the way bullocks were trained and handled. If bullocks are well trained and
94
University of Ghana http://ugspace.ug.edu.gh

handled properly they can be used for any haulage activity. Bangura, (1988); Allagnat and
Koroma (1984) said farmers in Guinea argue that after working together for several seasons
their animals had become their friends.
8.1.2 Traction activities that bullocks are usedfor
On traction activities all the hundred (100) respondents said they knew that bullocks were
used for ploughing, ridging, harrowing and weeding. However, only three (3) of them said
they knew that bullocks were used for planting. This is because the introducers of animal
traction technology were more concerned with land preparation and haulage activities.
Planting implements in AT were not introduced to farmers early.
8.1.3 Haulage activities that donkey are usedfor
All the hundred (100) respondents said they knew that donkeys were used for carrying water,
wood, gravel, farm produce and transporting goods. This could be attributed to the fact that
donkeys were used since time immemorial as means of transport. Even today, donkeys are
still used as means of transport for people in the rural areas of the study area.
8.1.4 Traction activities that donkey are usedfor
The study indicated that all the hundred respondents (100%) knew that donkeys were used for
ploughing, and ridging. Ninety-two (92) knew that donkeys were used for weeding, whilst
eighty-five (85) knew of donkeys being used for harrowing. However nobody knew that
donkeys could be used for planting. This could be as a result of the late introduction of the
technology.
95
University of Ghana http://ugspace.ug.edu.gh
8.2 Perceptions about animal traction technology characteristics
Under this section, variables considered include: the relative economic advantage of animal
traction technology, the ease with which technology was understood and used, the ease with
which technology could be experimented and whether results of technology are visible for
others to observe.
8.2.1 Relative Economic Advantage
The study revealed that out of the 100 respondents interviewed, 96 said the use of animal
traction helps reduce drudgery, there is faster and better seed bed preparation, timely land
preparation, recommended spacing resulting in optimum plant population and increased farm
size resulting in increases in total production.
Johnson and Kellogg (1984) noted that fanners would accept new practices or technologies
when they perceive that the benefits are greater enough to outweigh the costs. Swanson
(1984) observed that small farmers would adopt a technology if it is economically and
technically superior to their farming systems. Conroy, et al (1995) citing Appleton (1993)
also noted that if farmers are to benefit, new technologies must either reduce their workload
significantly or be capable of being incorporated into the work without adding to the overall
burden.
8.2.2 Compatibility of animal traction technology
On the compatibility of animal traction technology, the study found that eighty-nine (89) of
the hundred (100) respondents said it was compatible with the culture of the study area. As
one respondent put it “These days we are looking for technologies which will make you
better and not necessarily what pleases your friend or the so- called gods”. This trend could
96
University of Ghana http://ugspace.ug.edu.gh

be attributed to respondent's interaction with outside life. Because it was noticed that more
than 90% of respondents were returned migrants. Hence this observation is in line with
Adams, (1982) and Leagans (1960) who observed that an individual’s perception is
influenced by his beliefs, values, attitudes and can affect adoption or practice of an
innovation. Farmers have rejected new methods because they were incompatible with their
values (Abdulai, 1994). The responsiveness of farmers to practise an innovation is greatly
enhanced when the proposed or introduced technology has the potential to solve a perceived
problem in particular localities. Hence both the need for the technology and the awareness of
the potential benefits of the technology must be present for eventual adoption to occur.
8.2.3 Ease with which technology was understood and used
When the study was conducted it was found that ninety-one (91) out of the hundred
respondents said the technology was easy to understand and use. One respondent said he
watched a neighbour train his bullocks. After that he went home cut sticks, made his yokes,
harnessed his animals and started training his bullocks. Some respondents remarked that no
technology is complex provided it has relative economic advantage and is profitable. "After
all, is it not a human being who invented that technology?" was what a farmer said. "If it
were complex how did he do it"? Adams (1982) said innovations, which are relatively
simple, usually catch on faster and are adopted more quickly than more complicated ones.
Kivlin (1960); and Singh and Petrini (1966), cited by Rogers (1983) found that the
complexity of farm innovations was more highly related in a negative direction to their rate
of adoption than any other characteristic of the innovation except relative advantage.
97
University of Ghana http://ugspace.ug.edu.gh

8.2.4 Ease with which technology can be experimented
Here the study indicated that sixty-eight (68) out of hundred (100) respondents said it was not
easy to experiment the technology on a limited basis. This, respondents indicated was due to
lack of draft animals, high cost of draft animals and high cost of implements which some
farmers could not afford. If a farmer can try an innovation without committing much of his
resources, he will adopt it more readily, or if its performance meets his objectives (Fliegel
and Kivlin, (1966a’) Singh, (1966); and Fliegel et al, (1968), as cited by Rogers, (1983).
8.2.5 Whether results o f technology are visible fo r others to observe
Some results are easily observed and communicated to others whereas others are difficult to
describe to others. According to Rogers (1983), for technology to be readily acceptable and
invite participation it must have advantage, be compatible with local customs, not too
complicated and easy to test and observe. Fanners learn much from observing and discussing
their colleagues' experiences, their observations often being a reason to start discussion (van
den Ban and Hawkins, 1996). Bohlen (1966) noted that people who have low ability to
mentally handle abstract ideas tend to be more reluctant to adopt practices, which do not
produce visible outcomes when used.
The study has revealed that eighty-five (85) out of the hundred respondents said results of
animal traction technology were visible. They gave examples as fast and timely land
preparation, reduced fatigue, increased farm size etc.
8.3 Effects of adoption of AT on selected aspects of the farming systems
The selected aspects of the farming systems include; type of crops grown, land preparation,
selection of farm sites, mixed cropping, planting pattern, farm size, crop yields and cost of
98
University of Ghana http://ugspace.ug.edu.gh

production. These are selected because they are, some of the factors, which have direct effect
on crop production, the purpose for which animal traction technology was introduced into the
Builsa district. If farmers perceive a technology to be profitable, by either reducing costs or
increasing income, without necessitating major changes in farming systems, they are likely to
adopt that technology. (Panin and Ellis, 1992).
The distribution of respondents by the effects of adoption of A.T. on selected aspects of
fanning system is presented in Table 8.1.
From the survey conducted as indicated in Table 8.1, the adoption of animal traction has
affected all the seven selected aspects of the farming system in one way or the other except
mixture of crops grown. Animal traction does not prevent them from growing mixture of
crops, that is putting more than one crop seed in one container, mix them and planting them
at stake. AT reduces labour, helps in cultivation of large acreage. With the large acreage land
is apportioned to different kinds of crops which will serve as security against total crop
failure. Urasa, (1994) noted that for new technologies to be widely accepted they have to
offer solutions to existing problems within traditional farming practices. Farmers who use
traditional methods of seedbed preparation, planting, weeding and even harvesting, threshing
and winnowing need to be convinced that alternative methods are cheaper, more effective and
sasier to operate, and/or that they lead to a higher work output.
99
University of Ghana http://ugspace.ug.edu.gh

Table 8.1 Distribution of respondents by the effects of adoption of AT on selectedaspects of farming system
Aspect of Farming System EffectsYes No
Types of crop grown V'Land preparation •/Site selection ■/Mixture of cropsPlanting pattern SSize of farms yCrops yields yCost of production ✓Source: Field Survey 2002
8.3.1 Type o f Crops grown
On type of crops grown, respondents said many different types of crops could be grown
within a season with the introduction of AT. They also observed that, with AT, crops that
need ploughing with AT could be done faster thus leaving enough time to crops that need
ploughing with hoe, for example fara-fara potatoes and sweet potatoes. Respondents also
indicated that acreage of food crops were reduced in favour of cash crops. For example
acreage of staple crops like sorghum and millet were reduced in favour of groundnuts and
rice. However, Deveze and Levaray (1988) as cited by Starkey (1988) noted that increased
production of cash crops does not necessarily imply lower production of food crops. They
said in the cotton zones in West Africa, where animal traction has been successfully
promoted by cotton companies, food grain production has increased.
8.3.2 Land Preparation
According to the respondents AT has made seed bed preparation faster, easier, better and
timely. Timeliness of ploughing, seeding and weeding may well improve with animal
100
University of Ghana http://ugspace.ug.edu.gh

traction, and lead to yield increases (Starkey, 1988). Respondents also noted that because
they use the ridges, there is good drainage. Mathews and Pullen (1974) as cited by Starkey
(1988) said crop yields may be affected by special techniques such as tied ridging. That
joining ridges to form a grid of mounds and hollows can assist in soil and water conservation
particularly in those semi-arid regions that have 400-700mm of annual rainfall.
8.3.3 Selection o f farm sites
The study revealed that rocky, stumpy and muddy lands with very heavy soils might be
avoided with the fear that implements might get damaged. Also the animals may not be
strong enough to pull the implements when such conditions exist. Starkey (1988) reported
that animal traction is associated with the tendency to move from bush fallow cultivation
involving mixed cropping in partially-cleared areas still containing stumps, to permanent
systems in which single crops are grown in cleared fields. The study also revealed that with
the introduction of AT distant farming is encouraged. This is because they need more area to
cultivate which they can not get within the compounds. Also farm produce can easily be
conveyed home using carts. This observation is in line with Starkey (1988) who noted that
AT may lead to intensification, with larger farm areas being less intensively managed. He
said AT may well have a direct impact on the quality of life, by reducing drudgery.
8.3.4 Mixture o f crops
Animal traction may lead to changes in the crop mix, and therefore may have differential
effects on crop production. However, the study indicated that all the respondents (100) said
AT has not affected their mixture of crops. Farmers still practice this system to avert total
crop failure, reduce labour and make maximum use of land. According to Barrett et al
(1982); and Panin, (1986); some surveys have not found marked differences in crop mix
1 0 1
University of Ghana http://ugspace.ug.edu.gh

associated with AT. They found that should a major change in crop mix be associated with
AT, this could well affect food production and the local economy, with significantly different
effects on the various members of farm households.
8.3.5 Planting Pattern
All respondents said the adoption of AT has affected their planting pattern. Apart from the
timely planting, planting is done in rows and on ridges thus maintaining recommended
spacing and optimum plant population. Others were of the view that AT wastes land
especially when planting groundnuts. The furrows between ridges are left which results in
low plant population and yield per unit area. However, all respondents indicated that with AT
cultural practices are easier because of the ridges and row planting. When one plants on the
ridges plants establish faster resulting in better yields. Lekezime (1988), cited by Starkey
(1988), observed that line planting followed by early or regular inter-row weeding with draft
animals may improve yield per unit of labour and unit of area.
8.3.6 Size o f farms
Out of the hundred respondents interviewed ninety-eight of them said AT increases their farm
size. Even those of them who do not practice AT agreed that AT increases farm size. The
other two who said it decreases farm size argued on the basis that most of the land is not
utilized - reference the spaces between the ridges. This results in low output per unit area.
These findings support the observations made by Barrett et al (1982); Allagnat and Koroma,
(1984); Panin, (1986); and Francis, (1988) that farmers will cultivate more land when they
have draft animals. Gboku (1988), had the same observation when he said “there is very
often a correlation between farm size and the ownership o f draft animals, although this does
not necessarily mean that the animals are the cause o f the large area o f cultivation; it may be
10 2
University of Ghana http://ugspace.ug.edu.gh

that the farmers that have big farms are the ones wealthy enough to use draft animals, so that
draft animals may be the result o f large farms".
8.3.7 Crop yields
Animal traction may assist fanners to increase the total production of their crops. From the
study conducted 99% of the respondents said AT assist them to increase their crop yield.
This they attributed to the timely ploughing, planting and weed control. The remaining 1%
said it decreases crop yield. This, they argued that with AT one is tempted to plough a large
area and may not be able to maintain the farms effectively thus the output per unit area will
be low. Also with the ridging only half the area will be planted, for example in the case of
groundnuts.
These diverse views were also noted by Sargent, Lichte, Matlan and Bloom (1981) as cited
by Starkey (1988). They said AT is often associated with higher crops yields than those
obtained by hoe-farming. However, this may not necessarily be a direct effect of the tillage,
for the yield increase may be due to factors associated with, but not caused by the working
animals. Panin (1986) found that a significant increase in total crop yield of maize, millet,
groundnuts and beans was associated with ridge formation using oxen. Starkey (1988) also
noted that timeliness of ploughing, seeding and weeding may well improve with AT, and lead
to yield increases. Even though AT may assist farmers to increase the total production of
their crops, Francis (1988), argued that in some cases there may be a drop in yields per unit
area, as farmers tend to farm more extensively rather than intensively as indicated by the 1 %
of the respondents.
103
University of Ghana http://ugspace.ug.edu.gh
S. 3.8 Cost o f production
On the question whether AT has any effect on cost of production, 97% of respondents said it
decreases cost of production, whilst 3% of them said it increases cost of production.
The 97% respondents argued that the amount spent to plough one acre of land using AT is far
less than using hoe to clear the same piece of land. They went further to give examples like
buying of drinks, cigarettes and food as the expenses. After spending so much, it is not a
guarantee that they will finish clearing that plot of land and there is nothing binding them to
come back the following day to complete. With draft animals, however there is a fixed
amount, and he will have to finish ploughing before he is paid. In addition to the less amount
spent on the cost of ploughing other cultural practices, such as planting and weeding are
made easier and on time because of the ridges, which results to good establishment of the
crop thus leading to higher yields. This agrees with the findings of Starkey (1988) who said
when crops are planted in lines, weeding becomes easier and faster AT.
However, the other 3% were of the opinion that draft animal owners cultivate more land and
because planting is done by hand, greater human labour is needed. More human labour is
also needed to weed, harvest and process. They argue that even though total output may be
more the total profit may be less compared to the hoe-farmer. This finding is in line with
Francis (1988), who observed that in some cases there may be a drop in yields per unit area,
as farmers tend to farm more extensively rather than intensively.
8.4 Summary: Uses, Perceptions and Effects of Adoption of AT on Selected Aspects of the Farming Systems
In summary all respondents said bullocks were used in carrying wood, gravel and farm
produce. Eighty-five percent (85%) said bullocks were used in carrying water whilst 23%
104
University of Ghana http://ugspace.ug.edu.gh

said they knew that bullocks were used for transporting goods. All respondents knew that
bullocks could be used for ploughing, ridging, harrowing and weeding. Only 3% said they
knew that bullocks could be used for planting. On the use of donkeys, all respondents
indicated that they knew donkeys were used for carrying water, wood, gravel, farm produce
and transporting goods. All respondents also said they knew donkeys were being used for
ploughing and ridging, Ninety-two percent (92%) said donkeys were used for weeding, whilst
85% said they were used for harrowing. Nobody knew that donkeys could be used for
planting.
The study also revealed that AT has helped to reduce drudgery of fanners. There is faster,
better and timely land preparation, recommended spacing resulting in optimum plant
population and increased farm size leading to increases in total crop production. It was also
noted that 89% of respondents said AT was consistent with their socio-cultural values, norms
and beliefs, needs and existing farming practices. Ninety-one percent (91%) of respondents
said AT technology was easy to understand, whilst 85% said results of AT could easily be
seen and observed by others. However, 68% of respondents indicated that it was not easy
experimenting with AT on small-scale basis because of the high cost and scarcity of draft
animals and implements.
The above paragraph therefore answers objective (5) of the specific objectives which states
“To find out respondents perception about the importance/usefulness of animal traction
technology”
On the effects of adoption of AT on selected aspects of the farming system it was found that
the adoption of AT has some effects on all of them, either positively or negatively with the
105
University of Ghana http://ugspace.ug.edu.gh
exception of the mixture of crops grown. However, it was found that there were more the
advantages of AT within the farming system such as, easy and better timely land preparation
and reduced drudgery. Animal traction also allows the practice of mixture of crops, which is
common in the study area. As noted by Panin and Ellis (1992) noted that if farmers perceive
a technology to be profitable, by either reducing costs or increasing income, without
necessitating major changes in farm systems, they are likely to adopt that technology. This
confirms that AT is compatible with the farming system within the study area.
106
University of Ghana http://ugspace.ug.edu.gh

CHAPTER NINE
ADOPTION OF ANIMAL TRACTION TECHNOLOGY
9.0 Introduction
Chapter nine presents the findings, presentations and discussions on categories of adoption
and testing of the hypothesis to find out whether the independent variables stated earlier
actually had effect on the adoption of AT technology. These independent variables include:
• Personal characteristics of farmers
• Socio-economic factors of farmers
• Socio-cultural factors of farmers and
• Extension methods used in promoting AT
9.1 Categories of adoption
The study came out with two categories of adoption namely:
• Those who adopted - those farmers who have decided to apply and continue to use
AT
• Those who never adopted - those farmers who have decided not to apply and use AT
Out of the hundred (100) respondents, ninety-one adopted whilst only nine (9) never adopted.
Of the nine (9) who did not adopt, four (4) could not afford the cost. Two (2) feared
disappointment whilst three (3) had enough family labour.
These findings confirm the observations made by Galjart (1971) and Havens and Flinn
(1975) as cited by Fliegel, (1984) that laggards are not necessarily unwilling to adopt
innovations, but are unable to implement their adoption decision. Beal and Sibley (1967)
cited by Shaner et al (1982) noted that even though farmers may be treated fairly, the
anticipation of being treated unfairly may keep them away. Brown (1966) citing Mead (1955)
107
University of Ghana http://ugspace.ug.edu.gh

said local population might consider an innovation not only uneconomical (since human
labour is considered cheaper) but also that it would leave the farmer "with even less of the
creative work of which he now has too little".
9.2 Personal characteristics of respondents on adoption
This section presents discussions on the relationship between adoption and some personal
characteristics of respondents. These are age of respondents, family size of respondents and
educational level of respondents.
Ages of respondents on adoption
Table 9.1 Distribution of respondents on adoption by age
AdoptionAges (years)
Total30-52 53+
Yes 50 54.9% 41 45.1% 91 100%
No 8 88.9% 1 11.1% 9 100%
Total 58 42 100
Source: Field Survey 2002 df=l N=100Fisher Exact Two-tailed test (p)0.08>p>0.07*p>0.05 Not significant
At 5% significant level, the Fisher exact two-tailed test shows no significant difference in
distribution of respondents by age category and adoption.
108
University of Ghana http://ugspace.ug.edu.gh

Respondents by Fam ily Size
Table 9.2 Distribution of respondents on adoption by family size
AdoptionFamily Size
Total1-13 14+Yes 71 78.0% 20 22.0% 91 100%No 9 100% 0 0.0% 9 100%Total 80 20 100Source: Field Survey 2002 df=l N=100Fisher Exact Two-tailed test (*p)*p= 0.1978*p>0.05 Not significant
At 5% significant level, the Fisher exact two-tailed test shows no significant difference in
distribution of respondents by family size category and adoption.
Educational level of Respondents
Table 9.3 Distribution of respondents on adoption by educational level
Adoption
Educational level
TotalNo Formal Formal
Yes 67 73.6% 24 26.4% 91 100%
No 5 55.6% 4 44.4% 9 100%
Total 72 42 100
Source: Field Survey 2002 df=l N=100Fisher Exact Two-tailed test (p)*p= 0.2620*p>0.05 Not significant
At 5% significant level, the Fisher exact two-tailed test indicates no significant difference in
distribution of respondents by educational level and adoption.
109
University of Ghana http://ugspace.ug.edu.gh

9.3 Socio-economic factors of respondents on adoption
Under this section, discussions are made on the relationship between adoption and socio
economic factors. These include ownership of cattle, ownership of donkeys, farm size and
credit.
Ownership of Cattle
Table 9.4 Distribution of respondents on adoption by ownership of cattle
Adoption
Ownership of cattle
TotalYes No
Yes 77 84.6% 14 15.4% 91 100%
No 4 44.4% 5 55.6% 9 100%
Total 81 19 100
Source: Field Survey 2002 df=l N=100Fisher Exact Two-tailed test (p)*p= 0.0114*p<0.05 Significant
At 5% significant level, the Fisher exact two-tailed test shows significant difference in
distribution of respondents by ownership of cattle category and adoption. There is a much
higher percentage of those who adopted and own cattle, that is, 84.6% as against only 44.4%
of those who did not adopt who own cattle. This finding confirms Fischer (1994) observation
that for farmers to be able to use a new technology immediately after training, they must have
their own animals and implements.
1 1 0
University of Ghana http://ugspace.ug.edu.gh

Ownership of Donkeys
Table 9.5: Distribution of respondents on adoption by ownership of donkeys
Adoption Ownership of donkeys
Yes No
Total
Yes 17 18.7% 74 81.3% 91 100.0%
No 3 33.3% 6 66.7% 9 100.0%
Total 20 80 100
Source: Field Survey, 2002 df = 1 N = 100*p = 0.3779*p> 0.05 Not significant
At 5% significant level, the Fishers exact two-tailed test shows no significant difference in
the distribution of respondents by ownership of donkeys category and adoption.
Respondent's farm size
Table 9.6: Distribution of respondents on adoption by size of farms.
Adoption Size of farms (acres) Total
1-7 8+
Yes 36 39.6% 55 60.4% 91 100.0%
No 9 100.0% 0 0.0% 9 100,0%
Total 45 55 100
Source: Field Survey, 2002 df = 1 N = 100 *p= 0.00046 *p < 0.05 significant
At 5% significant level, the Fisher exact two-tailed test indicates significant difference in the
distribution of respondents by farm size category and adoption. There is much less percentage
of those who adopted, who had 1-7 acres that is, 39.6% as against 100% of those who did not
adopt who had 1 - 7 acres. This finding confirms Starkey’s (1988) citing Barret et al (1982),
111
University of Ghana http://ugspace.ug.edu.gh
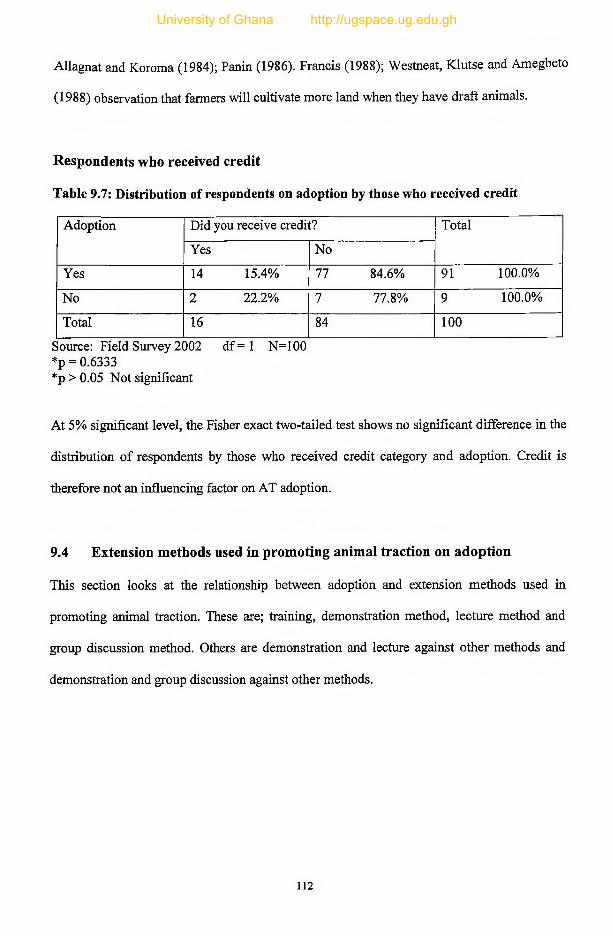
Allagnat and Koroma (1984); Panin (1986). Francis (1988); Westneat, Klutse and Amegbeto
(1988) observation that farmers will cultivate more land when they have draft animals.
Respondents who received credit
Table 9.7: Distribution of respondents on adoption by those who received credit
Adoption Did you receive credit? Total
Yes No
Yes 14 15.4% 77 84.6% 91 100.0%
No 2 22.2% 7 77.8% 9 100.0%
Total 16 84 100
Source: Field Survey 2002 df = 1 N=100 *p = 0.6333*p > 0.05 Not significant
At 5% significant level, the Fisher exact two-tailed test shows no significant difference in the
distribution of respondents by those who received credit category and adoption. Credit is
therefore not an influencing factor on AT adoption.
9.4 Extension methods used in promoting animal traction on adoption
This section looks at the relationship between adoption and extension methods used in
promoting animal traction. These are; training, demonstration method, lecture method and
group discussion method. Others are demonstration and lecture against other methods and
demonstration and group discussion against other methods.
1 1 2
University of Ghana http://ugspace.ug.edu.gh

Training
Table 9.8: Distribution of respondents on adoption by those who received training
Adoption Did you receive training? Total
Yes NoYes 77 84.6% 14 15.4% 91 100.0%No 4 44.4% 5 55.6% 9 100.0%Total 81 19 100
Source: Field Survey 2002 df = 1 N = 100*p = 0.0114*p < 0.05 Significant
At 5% significant level, the Fisher exact two-tailed test indicates significant difference in the
distribution of respondents by training category and adoption. This is because there is much
higher percentage of those who adopted who received training that is 84.6% as against only
44.4% of those who did not adopt who received training. Training is therefore an influencing
factor on adoption.
Demonstration method
Table 9.9 Distribution of respondents on adoption by demonstration method
Adoption Demonstration Total
Yes No
Yes 77 84.6% 14 15.4% 91 100.0%
No 4 44.4% 5 55.6% 9 100.0%
Total 81 19 100
Source: Field Survey 2002 df = 1 N = 100*p = 0.0114*p < 0.05 Significant
At 5% significant level, the Fisher exact two-tailed test indicates significant difference in the
distribution of respondents by demonstration method and adoption. This is because there is
113
University of Ghana http://ugspace.ug.edu.gh

much higher percentage of those who adopted that had demonstration (84.6%) as against only
44.4% of those who had demonstration method of training and did not adopt. Hence
demonstration method has influence on adoption.
Lecture method
Table 9.10: Distribution of respondents who received lecture method
Adoption Lecture method Total
Yes NoYes 4 84.6% 87 15.4% 91 100.0%
No 0 44.4% 9 55.6% 9 100.0%
Total 4 96 100
Source: Field Survey 2002 df = 1 N = 100*p= 1.0000*p > 0.05 Not significant
At 5% significant level, the Fisher exact two-tailed test indicates no significant difference in
the distribution of respondents by lecture method category and adoption. Thus, lecture
method has no influence in adoption.
Group discussion method
At 5% significant level, the Fisher exact two-tailed test shows significant difference in the
distribution of respondents by group discussion. This is because there is a lower percentage
of those who had group discussion method adopted (38.5%) as against 77.8% of those who
had group discussion method and yet did not adopt. Group discussions therefore has
influence on adoption.
114
University of Ghana http://ugspace.ug.edu.gh
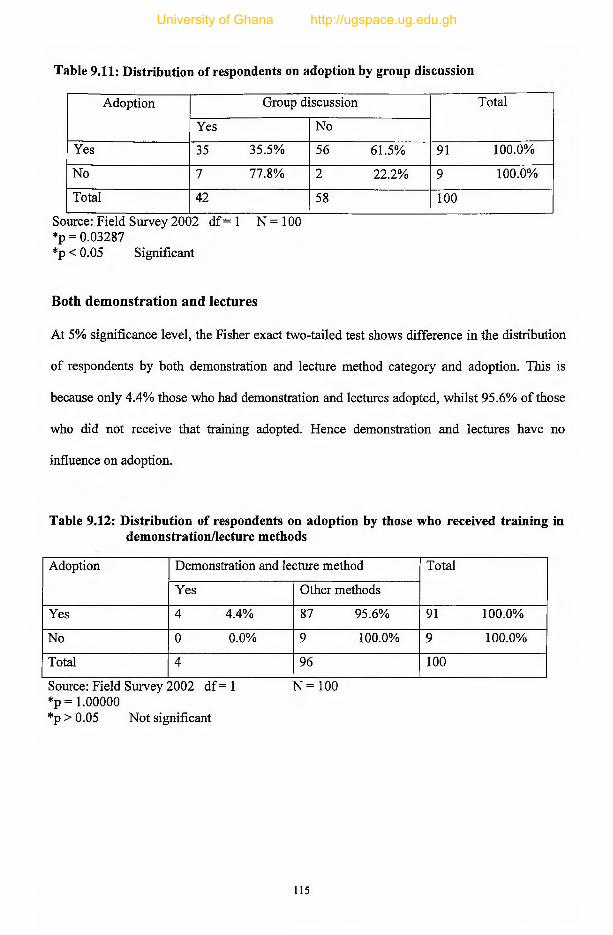
Table 9.11: Distribution of respondents on adoption by group discussion
Adoption Group discussion Total
Yes No
Yes 35 35.5% 56 61.5% 91 100.0%
No 7 77.8% 2 22.2% 9 100.0%Total 42 58 100
Source: Field Survey 2002 df = 1 N = 100*p = 0.03287*p < 0.05 Significant
Both demonstration and lectures
At 5% significance level, the Fisher exact two-tailed test shows difference in the distribution
of respondents by both demonstration and lecture method category and adoption. This is
because only 4.4% those who had demonstration and lectures adopted, whilst 95.6% of those
who did not receive that training adopted. Hence demonstration and lectures have no
influence on adoption.
Table 9.12: Distribution of respondents on adoption by those who received training in demonstration/lecture methods
Adoption Demonstration and lecture method Total
Yes Other methods
Yes 4 4.4% 87 95.6% 91 100.0%
No 0 0.0% 9 100.0% 9 100.0%
Total 4 96 100
Source: Field Survey 2002 df = 1 N= 100*p = 1.00000*p > 0.05 Not significant
115
University of Ghana http://ugspace.ug.edu.gh

Respondents who received both demonstration and group discussion methods
Table 9.13: Distribution of respondents on adoption by demonstration and group
discussion method
Adoption Demonstration and group discussion Total
Demonstration & group discussion
Other methods
Yes 27 84.6% 62 68.1% 91 100.0%
No 5 44.4% 4 44.4% 9 100.0%
Total 34 66 100
Source: Field Survey 2002 df = 1 N = 100*p = 0.26662*p > 0.05 Not significant
At 5% significant level, the Fisher exact two-tailed test indicates no significant difference in
the distribution of respondents by those who received both demonstration and group methods
category and adoption. This is because those who did not receive demonstration and group
discussion training and adopted (68.1%) are more than those who received demonstration and
group discussion and did not adopt (44.4%).
116
University of Ghana http://ugspace.ug.edu.gh

Summary of Fisher exact tests results
Independent Variable Fisher Exact Two-
Tailed Value at 0.05
Level of Significance
• Ages of respondents P = 0.08 > p > 0.07 Not Significant
• Respondents family size P = 0.1978 Not significant
• Educational level of
respondents P = 0.2620 Not significant
• Ownership of cattle
• Ownership of donkeys P = 0.0114 Significant
• Respondents farm size P = 0.3779 Not significant
• Respondents who received p = 0.00046 Significant
credit p = 0.6333 Not significant• Respondents who received
training p = 0.0114 Significant
• Respondents who receivedtraining by demonstration p = 0.0114 Significant
alone
• Respondent who receivedtraining by lecturers alone p = 1.0000 Not significant
• Respondents who received
training by group
discussion alone p = 0.03287 Significant
• Respondents who received
both demonstration andlecture methods p= 1.0000 Not significant
• Respondents who receivedboth demonstration andgroup discussion methods
p = 0.26662 Not significant
117
University of Ghana http://ugspace.ug.edu.gh
r ~ j • to
CHAPTER TEN # \ 4?V & J ; * *
SUMMARY, CONCLUSIONS AND RECOM M ENDATIONS
10.0 Introduction
The study was set out to verify and substantiate the speculation of low adoption of AT in the
Builsa district. This final chapter summarizes the activities that were undertaken during the
course of the study and the findings thereof. It also presents the implications of the findings
with regards to the research objectives and gives relevant recommendations.
10.1 Summary
In chapter one, mention is made that agriculture contributes a substantial proportion of the
foreign exchange earnings, provides employment to between 60-70% of the country’s
population. However the use of human power in agriculture still predominates over other
sources of farm power. This had led to low level of growth in agricultural production. To
increase agriculture output therefore Dibbits (1997) suggested the provision of more efficient
means of production that save labour and reduce drudgery, hence the use of draft animals.
But in doing so, it is necessary to identify district specific farmer needs to be able to propose
policies and measures. History has it that animal traction was introduced into the Builsa
district since 1937. Since farmers’ needs are location specific, the study came out to find the
causes of the low adoption of AT in the Builsa District. In an attempt to find these causes the
study came out with research questions, hypotheses and specific objectives.
Chapter two gave an overview of the study area with regard to location, population, age
distribution, distribution of household by size, topography, climate soils, vegetation,
economic activities, farming systems and agricultural extension in the Builsa District.
118
University of Ghana http://ugspace.ug.edu.gh

The history of animal traction in Ghana was examined in Chapter Three under the following
headings; origin of AT, the genesis of AT in Ghana, the current state of AT in Ghana and a
historical development of animal traction in the Builsa District.
In Chapter four, literature made mention of factors which can affect adoption. These include;
personal characteristics, socio-economic factors, socio-cultural factors external factors such
as the Extension Agents’ knowledge in animal traction and his communication skills.
Chapter five describes the methodology of the study. Descriptive survey was used to collect
the data. The study area was purposively selected. The population of the study was all
farmers and Agricultural Extension Agents (AEAs) in the district. A two stage random
sampling was used to select farmers to get a total of 100 respondents. Complete survey was
used for the AEAs. The following instruments were used to collect the data;
• Interview scheduled questionnaires
• Questionnaires
• Informal interviews with farmers
• Literature and office records
The data was edited, coded and entered into the Computer. Data was analysed using SPSS
and results interpreted and discussed.
In Chapter six, seven, eight and nine present the empirical findings of the study interlaced
with discussions of such findings. Section one of chapter six presents findings on personal
characteristics. Here it was found that 40% of farmers were between the ages of 30-45 years
(youth). Majority of respondents had family size of 1-9 members (44%). Those who had no
formal education formed 72%. On socio-economic factors 81% of respondents had cattle,
119
University of Ghana http://ugspace.ug.edu.gh
whilst 80% did not have donkeys. Majority of respondents (46%) said few fanners could
afford animal traction services and 65% of respondents said animal traction services were not
readily available. It was also indicated that 84% of respondents did not receive credit. Forty-
two percent of respondents were medium scale farmers. The small scale farmers were the
least (24%).
On socio-cultural factors, 100% of respondents said the use of animal traction was culturally
acceptable in the community; 56% of respondents rated status given to bullock owners as
high, 34% very high and 10% average, 54% rated status given to donkey owners as high,
35% average, 7% very high and 4% low. On average more status is given to bullock owners
than donkey owners. The study revealed that any category of people be they female or male,
could manage work animals.
In Chapter six section two, majority of AEAs (35%) had only one in-service training in
animal traction. Majority of respondents (88.2%) had their training from MoFA, followed by
fanners (29.5%) and NGOs (23.6%) respectively. Forty-seven percent sometimes made visits
to farmers. Only 23.5% always made visits whilst 24.4% never made visits to farmers.
Reasons for AEAs inability to make visits were; lack of means of transport (52.9%) large
operational areas (47.1%), no fuel (29.4%), fanners did not have training materials (29.4%)
and lack of knowledge in animal traction (23.5%). The study also found that majority of
AEAs (64.7%) was trained using demonstration method.
Chapter seven focused on findings in extension methods used in promoting AT. All
respondents were aware of animal traction. Majority of respondents (80%) had their source of
information from MoFA. The study also found that 84 out of 100 respondents had training.
12 0
University of Ghana http://ugspace.ug.edu.gh
Ninety-seven percent of this number had training from their families. The study also found
that majority of respondents (43%) had training through demonstration and 60% of
respondents ranked their level of participation in handling bullocks, yoking and nose ringing
as very high. Also 93% of respondents never had visits from AEAs. Respondent listed the
following as factors hindering the adoption of animal traction; lack of capital, high cost of
implements and spare parts, lack bullocks, theft of cattle and feed for animals during the dry
season.
In Chapter eight, uses, perception and effects of adoption of AT on selected aspects of the
farming system were discussed. Over 80% of respondents were aware that bullocks and
donkeys were used for traction and haulage activities. All respondents agreed that animal
traction reduces drudgery. Over 80% said animal traction was consistent with socio-cultural
values, norms, beliefs, needs and existing farming practices. Similarly, over 80% of
respondents also indicated that animal traction technology was easy to understand, see and
observe by others. However, 68% of respondents indicated that it was not easy experimenting
animal traction technology on small scale because of high cost and scarcity of draft animals
and implements.
In Chapter nine, adoption was found to be 91%. Personal characteristics and adoption, ages
of respondents, family size and educational level showed no significant difference. Under
socio-economic factors ownership of donkeys and credit also showed no significant
difference whilst ownership of cattle and farm size indicated significant difference. Under
extension methods used in promoting AT and adoption, training, demonstration method
alone, and group discussion alone showed significant difference whilst lectures alone, both
1 2 1
University of Ghana http://ugspace.ug.edu.gh

demonstration and lectures and both demonstration and group discussion indicated no
significant difference,
10.2 Conclusion and Implications
This section concludes the study with regards to whether the research objectives spelt out
have been met. It also highlights the implications of the findings of the study. Three of the
research questions were answered in chapter nine whilst the fourth one was answered in
chapter eight. Hence the conclusions and implications shall be based on these answers.
Objective 1: To fin d out the historical development o f animal traction in the Builsa district
Animal traction was introduced into Builsa District in 1937 to address the problem of
recurrent food shortage in the area. The paramount chief of the area was among the first 19
converts in the then Mamprusi district. The paramount chief met his sub-chiefs and told them
to inform their subjects of the existence of the animal traction programme and that interested
farmers should come along with their bullocks for training. Farmers were sent to Tono Farm
Centre for training. In 1940, under the initiative of the paramount chief, the Builsa Native
Administration started a loan scheme to provide farmers with bullocks and ploughs. In 1945
because of long distance from Tono Farm Centre, a new Native Authority Farm Centre was
opened in the district, under the influence of the paramount chief.
However, in the early years of Ghana’s Independence, the use of animal traction declined
because of large importation of tractors. Attention was again paid to animal traction in the
early 1970s when tractors were no longer available. The Roman Catholic and Presbyterian
Churches intervened in 1969 and 1974 respectively to give animal traction a new boost.
1 2 2
University of Ghana http://ugspace.ug.edu.gh

This suggests that before introducing a technology into a peasant-farming community, the
people must first of all express the need for the technology. This was shown when the people
said they can only improve their farms and be self-supporting if they practice animal traction.
Some of them were quoted as saying that they will never return to the old and traditional
methods. This means they saw the importance of the technology. Also the introduction of a
new technology into a peasant-farming community should be gradual and optional, thus no
force should be applied. This was shown by the paramount chief when he asked interested
farmers to come down with their bullocks. Omoding (1994), observed that chiefs and rulers
sometimes use coercion to implement programmes in order to please their masters, which
probably accounted for unsustainable adoption of ox cultivation is some areas in Uganda. It is
worth noting that farmers respect their traditional rulers. Hence in an attempt to introduce a
technology stakeholders (AEAs, NGOs) should first meet traditional rulers to solicit their
support. Some of them can be made contact farmers. This is because people will more readily
follow their chiefs example than they will for that of a private individual, however,
successful he may be.
Objective 2: To find out farmers’ personal characteristics and their effects on adoption o f animal traction
Majority of respondents (44%) were the youth whilst the aged were the least, (20%).
Respondents with family size of 1-9 persons were the majority (47%) with those having 20+
persons as the least (9%). The study also indicated that 72% of respondents had no formal
education. On personal characteristic and their effects on adoption, ages of respondents,
family size and level of education showed no significant difference, between the respondents
who had adopted AT and those who had not. This indicates that any body is capable of
adopting a technology irrespective of his age, educational level or the size of his family. It is
therefore suggested that AEAs and NGOs should not discriminate on the basis of age,
education or the size of the clients family when delivering their extension messages.
123
University of Ghana http://ugspace.ug.edu.gh
Objective 3: To determine the socio-economic factors o f farm ers which affect adoption o f animal tradition
On the socio-economic factors of farmers that affect adoption of animal traction, ownership
of cattle and farm size were found to be significant, whilst credit and ownership of donkeys
showed no significant difference between respondents who had adopted AT and those who
had not. From this it is shown that ownership of cattle and farm size has influence on AT
adoption. To make sure that farmers own their own cattle/bullocks it is suggested that AEAs
and NGOs should encourage farmers to form Associations and open bank accounts with the
Banks. This will enable individual farmers to be able to access loans to buy their own
bullocks. Bullock banks can also be established by MOFA and NGOs and sold to farmers on
soft terms. On the part of farm size AEAs should educate farmers on the need to have
manageable farms to derive maximum benefits from them.
Objective 4: To examine the socio-cultural factors o f farm ers which affect adoption o f animal traction
The study found that all the 100 respondents said the use of animal traction was culturally
acceptable. About 90% rated status given to draft animal owners as high. All respondents also
indicated that there was no taboo restraining any category of people from managing draft
animals, be they male or female. Thus a farmer’s willingness to adopt a technology is largely
influenced by socio-cultural factors such as beliefs, norms, values and taboos of the social
system in which he finds himself (Shaner, Philipp and Schemehl, 1982; de Graaf, 1992 and
Panin and Ellis, 1992). From the study it is shown that cultural acceptability of AT has
contributed to its high adoption (91%). It is therefore suggested that before a technology is
introduced into a community, AEAs and NGOs in agricultural extension should study the
socio-cultural factors of the area. It is also advised that MOFA should employ AEAs who can
empathise with farmers. These days people seek admission into agricultural colleges because
124
University of Ghana http://ugspace.ug.edu.gh
of job security and not for the love of it. It is also suggested that when MOFA is admitting
students into agricultural institutions, priority be given to students with farming background.
Objective 5: To fin d out farmers’ opinions on the importance/usefulness o f animal traction
More than 90% of respondents said draft animals could be used for traction and haulage
activities. All the respondents indicated that the use of draft animals reduces drudgery. This
implies that when introducing a technology, farmers must see it as useful. Conroy et al
(1995) citing Appleton (1993) said farmers will adopt new technologies if technologies either
reduce their workload significantly or is capable of being incorporated into the work without
adding to the overall burden. Even though more than 90% of respondents agreed to the
importance of AT, yet majority of them do not make use of them because they can not afford.
It is suggested the NGOs and MOFA establish implement stores in the district. These
implements can then be sold to farmers on hire purchase basis. Farmers Services Company
(FASCOM) is already in that business but farmers can not pay the cash demanded by
FASCOM.
Objective 6: To determine the compatibility o f animal traction within the farming system o f the Builsa district.
All the respondents indicated that animal traction did not interfere with their mixed cropping
system, which is commonly practised to avoid total crop failure and also to make sure they
get a bit of their traditional crops. It also makes land preparation planting, weeding etc. easy.
This suggests that a new technology will be accepted to the target group if it is compatible
with existing farming principles and cultivation practices (Urasa, 1994). From the study it is
shown that AT is compatible within the farming system. This has contributed to the high
adoption of AT (19%). It is suggested that the farming system of an area be studied before
125
University of Ghana http://ugspace.ug.edu.gh
introducing an intended technology. AEAs and NGOs should meet traditional leaders and
farmers to brief them on the intended technology. Use should also be made of available
reports and documents on agriculture in the area.
Objective 7: To find out the various categories o f adoption o f animal traction
There were two categories of adoption ' - -/'I ' * ^
• Those who adopted (91%) lH |
• Those who never adopted (9%) m ^
This disproves Starkey’s (1988) result of 10-20% adoption. However, this increase in
adoption could be due to the time lapse between 1988 and 2002. Also Starkey’s results
covered the whole North and not as specific as this study.
Objective 8: To find out the effectiveness o f the extension methods used in promoting animal traction
Farmers described effectiveness of extension methods as
(1) Ability of extension officer to explain to the understanding of farmers the advantages and
disadvantages of a technology.
(2) Ability to convince farmers that advantages out weigh the disadvantages and
(3). The number of farmers who will adopt the technology
From the description of effectiveness of extension methods from farmers view point, one can
say extension methods were effective with adoption of 91%. The findings also showed that
training, demonstration alone and group discussion alone were significant, whilst lectures,
demonstration/lectures and demonstration/group discussions were found to have no
significance on adoption of animal traction. The findings imply that even though most of the
126
University of Ghana http://ugspace.ug.edu.gh

training was done by families (refer to Table 7.2) the farmers needed the training (skills) and
the right methods were used in the right situations. Hence before using a method, the
characteristic of the message, the teaching and learning objectives and what the participants
are expected to be able to do with the content of the message should also be considered
(Kwarteng and Zinnah, 1994). Majority of farmers being trained by families implies that
transfer of technologies is not only done by extension staff (formal) but can also be done by
farmers themselves (informal) depending on the need they have for that particular
technology. Starkey (1990) found that once animal traction has started in a region, much
transfer has been informal, within families, from farmer to farmer or from regional
immigrants to local farmers.
Training is vital for the adoption of AT especially with the demonstration and group
discussion methods. But government (MOFA) has done very little with regards to the study
conducted. For example 11.8% of AEAs had AT training (Table 6.10). In table 7.2 only
21.4% of farmers had training from MOFA. To promote and maintain AT in the Builsa
district, it is suggested the MOFA in collaboration with NGOs interested in AT establish AT
training station in the district where practical training workshops will be organised for
farmers and AEAs periodically. This will create an atmosphere for demonstrations and group
discussions among participant.
10.4 RECOMMENDATIONS
This section gives recommendations based on the conclusions and implications of the
findings. However, these recommendations are limited to the Builsa district only since the
research was a purposive one.
127
University of Ghana http://ugspace.ug.edu.gh

In introducing a technology into a peasant farming community like the Builsa Community the
study has the following recommendations to make.
(1) The farmers must first of all express the need for the technology as indicated in
Chapter ten section 10.3 under Objective 1. Urasa (1994) found that for new
technologies to be widely accepted they have to offer solutions to existing problems
within traditional farming practices.
(2) The technology must fit into the existing farming system. One of the reasons for the
high adoption was that animal traction did not interfere with farmers' mixed farming
practice, a practice they do to avoid total crop failure. Bwalya (1988), observed that
for many small-scale farmers the bottom line of their activities is survival. This
means that their decisions on cropping patterns, implement choice, etc are essentially
based on risk avoidance.
(3) That traditional leaders/rulers should be involved when introducing a technology into
the Builsa community. This is because people will more readily follow their chiefs
example than they will a private individual however, successful he may be.
(4) From the study credit was identified by both farmers and AEAs as a major factor
hindering the adoption of AT yet credit facilities exist in the district. The problems of
farmers have been accessibility to these credit facilities. During the study farmers
enumerated reasons for not getting credit. Refer to Chapter six, section 6.2.2. This is
due to lack of education. It is recommended that financial institutions should get to
the doorsteps of the communities and educate farmers rather than sitting in offices
expecting farmers to come. In case these institutions lack personnel /staff, they can
collaborate with Ministry of Food and Agricultural to use some of their staff.
128
University of Ghana http://ugspace.ug.edu.gh

Further research:
(1). The study has only concentrated on animal traction and crop production. However, crop
production cannot go on without a favourable environment. The study therefore suggests
research into the impact of use of animal traction on the environment in the Builsa District.
(2). From the study also, it was noted that 72% had no formal education as against 28% with
formal education. Comparing with the level of AT adoption (91%) one is tempted to infer
that AT may have affected the number of children who go to school, hence the low level of
literacy in the district. The study suggests a research into the effect of AT adoption on
schooling.
129
University of Ghana http://ugspace.ug.edu.gh

LIST OF REFERENCES
Abdulai N. F. (1994). Factors Influencing the Adoption of Aeroforestrv bv Farmers:A Case Study of SRDF/IFAD Agroforestrv Extension Sub-Programme in Savelueu-Nanton District in the Northern Region of Ghana. Thesis. Institute of Renewable Natural Resources, UST, Kumasi.
Adams, M. E. (1982). Agricultural Extension in Developing Countries. England.English Language Book Society, Longman Group Ltd.
Allagnat, P. and Koroma, B (1984). Socio- economic survey of the use of ox tractionin the Mabole Valley, Bombale District, Sierra Leone Work Oxen Project and Association
Association for International Agricultural and Extension Education (AIAEE) (1998).Journal of International Agricultural and Extension Education Vol. 5 No. 1
Atengdem. P. B. (1997). Effectiveness and Relevance of Farmer Training: Lessons from Northern Ghana, PhD Thesis. University of Reading.
Atengdem, P. B. (2001). Education and Training. Lecture notes. Department of Agricultural Extension, University of Ghana - Legon.
Axinn, G. H. (1988). Guide on Alternative Extension Approaches. Rome. FAO
Bah, M. S. (1988). Social Constraints to the Adoption and Expansion of Workoxenin Sierra Leone. In: A. Faye and P. Starkey (Eds). Animal Traction for Agricultural Development pp. 337-341. Proceedings of Workshop held 7-12 July, 1988, Saly, Senegal. The Netherlands Technical Centre for Agriculture and Rural Co-operation.
Bailey. K. D. (1987). Methods of Social Research. (3rd Ed). New York. Free Press.
Bangura, A.B. (1988). Constraints to the extension of draft animal technology in thefanning systems of Sierra Leone. In P. Starkey and A. Faye (Eds). Animal Traction for Agricultural Development Proceedings of the Third Workshop of the West Africa Animal Traction Network held 7-12 July, 1988 Saly, Senegal Netherlands, CTA Publications.
Barret, V.; Lassiter, G.; Wilcock, D.; Baker, D.; and Crawford, E.; (1982). AnimalTraction in Eastern Upper Volta: A Technical, Economic and Institutional Analysis. International Development Paper 4. Michigan, USA, Department of Agricultural Economics, Michigan State University.
130
University of Ghana http://ugspace.ug.edu.gh

Bobobee, E. Y . H. (2003). rw w w .fao.org/w aicent/faoinfo/agricult/ags/agse/3zern/nam ihial/c7.htm 1.
Role of Draft Animal Power in Ghana Agriculture. University of Science and Technology, Kumasi. Agricultural Engineering Department.
Bohlen, J. M. (1966). The Adoption and Diffusion of Ideas in Agriculture. In: Copp(Ed) Our Changing Rural Society: Perspectives and Trends. Pp 265-287. Ames Iowa, USA, Iowa State University Press.
Brown, C. K. (1966). Attempts at Introducing Agricultural Change: A SociologicalViewpoint. In: The Ghana Farmer Bulletin. Vol. XVII. pp 19-24. Ghana. Ministry of Agriculture.
Builsa District Assembly (2000). Profile of the Builsa District. Sandema
Bwalya, M. (1988). Constraints and Opportunities in the Transfer of Draft AnimalTechnologies in Zambia. In: Mwenya J. Stares and P. Starkey (Eds). Improving Animal Traction Technology. Proceedings of the First Workshop of the ATNESA held 18-23 January 1992, Lusaka, Zambia. Germany CTA & GTZ.
Conroy, G., Gordon, A and Marter, A. (1995) Development and Dissemination ofAgroprocessing Technologies. NRI Socio-economic Series 8. Chatham, UK. Natural Resources Institute.
Corbel, H. (1986). The economics of animal power in Koinadugu District, SierraLeone: a case study of the work Oxen introduction and credit programme. In P.H. Starkey and F. Ndiame (Eds). Animals Power in Farming System. Pp 299-310. Proceedings of Networkshop held 17-26 September 1986 in Freetown, Sierra Leone. Eshbom. Vieweg for German Appropriate Technology Exchange, GTZ.
de Graaf, J. (1992). Increasing Agricultural Production by Using Animal Traction: A RuralDevelopment puzzle. In : E Mwenya, J. Stares and P. Starkey (Eds). Improving Animal Traction Technology. Proceedings of the First Workshop of the ATNESA held 18-23 January 1992, Lusaka Zambia. Germany CTA & GTZ.
Department of Agriculture, Gold Coast (1938-1939). Annual Report of theDepartment of Agriculture in North Mamprusi, RAO A. Tamale.
Department of Agriculture, Gold Coast (1938-1939). Annual Report on the Northern Territories of the Gold Coast. RAOA, NRG8/3/82. Tamale
Department of Agriculture, Gold Coast (1939-1940). Naovrongo Annual Report.RAOA, NRG8/3/97. Tamale.
Department of Agriculture, Gold Coast (1945-1946). District Annual Report,Navrongo. RAOA, NRG8/3/136, Tamale.
Department of Agriculture, Gold Coast (1960-1962). Agriculture in the Builsa Area.RAOA, NRG9/11/9. Tamale.
131
University of Ghana http://ugspace.ug.edu.gh

Dibbits, H. J. & Bobobee, E.Y.H. (1996) Animal Traction Technology andAgricultural Extension Services. Recommendations for Medium and Long- Term Animal Traction Development Programme. Ghana. Ministry of Food and Agriculture.
Fischer, R. (1994) Transfer of Animal Traction Technology: Lessons from ProjectExperiences in Zimbabwe, Cameroun and Tanzania. In: E Mwenya, J. Stares and P. Starkey (Eds). Improving Animal Traction Technology. Proceedings of the First Workshop of the ATNESA held 18-23 January 1992, Lusaka Zambia. Germany. ATNESA Publication.
Fliegel, F. C. (1984) Extension Communication and Adoption Process. In: B. E. Swanson (Ed), Agricultural Extension: A Reference Manual. 2nd ed. Pp 77-88. Rome. FAO. .................
Francis, P.A. (1988). Ox draught power and agricultural transformation in Northern Zambia. Agricultural Systems. Zambia.
Gboku, M. (1988). Farmer social variables influencing the adoption of agricultural innovation in Sierra Leone. In: P. H. Starkey and F. Ndiame (Eds). Animals Power in farming systems. Pp 311-319. Proceedings of Networkshop held 17-26 September 1986 in Freetown, Sierra-Leone Eschbom. Vieweg for German Appropriate Technology Exchange, GTZ.
Ghana Statistical Service (2002). 2000 Population and Housing Census: Special Report on 20 Largest Localities. Accra.
Ghana Statistical Service (2002). 2000 Population and Housing Census: Summary Report on Final Results. Accra.
Gibbons, M. J. & Schroeder, R. (1983). Agricultural Extension. Information Collection and Exchange Manual. M.0018. July 1983. USA Peace Corps of the USA.
Gifford, R. C. (1988). The Selection and use of animal Draft Technology. In F. Ndiame & P.H. Starkey (Eds). Animal Power in Farming Systems. Pp 116-118. Proceedings of Networkshop held 17-26 September 1986 in Freetown, Sierra Leone. Eschbom. Vieweg for German Appropriate Technology Exchange, GTZ.
Greene, J & d’, Olivera, M (1988). Learning to use Statistical Tests in Psychology: A Students' Guide. Philadelphia, USA. Open University Press.
International Livestock Centre for Africa (ILCA) (1994). Improving Livestock Production in Africa: Evaluation of ILCA's Programme, 1974-94. Addis Ababa, Ethiopia.
Johnson III, S. H. & Kellog, E. D. (1984). Extension's Role in Adapting and Evaluating New Technology for Farmers. In: B. E. Swanson (Ed), Agricultural Extension: A Reference Manual. 2nd ed. Pp 40-53. Rome. FAO.
132
University of Ghana http://ugspace.ug.edu.gh
Kalton, G & Moser, C. A. (1971). Survey Methods in Social Investigation. London. Heinemann.
Kang, J. T. & Song, H. K. (1984) Individual and Group Extension Teaching Methods. In: B.E. Swanson (Ed), Agricultural Extension: A Reference Manual. 2nd ed. Pp 130-142. Rome. FAO.
Kevin, M.C. (1993). A Strategy to Develop Agriculture in Sub-Saharan Africa and a Focus for the World Bank. World Bank Technical Paper No. 203. Washington D.C. Africa Technical Department Series.
Korang-Amoakoh, S.; Donkor, F. & Amoah, K (1994). Ghana. In: K.A. Cassadey, C.R.Dowswell and G. Monnet (Eds). Strengthening National Agricultural Extension Services in Sub-Saharan Africa: Proceedings of a Seminar for Extension Practitioners held 15-19 May 2000. Switzerland. SAA/Global 2000/CASIN,
Kwarteng, J. A. & Zinnah. M. M. (1994). Communication and Extension Methods: A Course Manual. Cape Coast, School of Agriculture. University of Cape Coast.
Leagans, J. A. (1960). Programme Planning to Meet People's Needs. In: M. G. Kamath (Ed).Extension Education in Community Development. Directorate of Extension, Government of India. MOFA.
Leeuwis, C & van den Ban (2002). Communication for Innovation in Agricultureand Resource Management. Building on the tradition of Agricultural Extension. In: N. Roling & C. Leeuwis (Eds). Introduction to Communication and Innovation Studies. Wageningen University. Blackwell Science. Oxford.
Lekezime, P. (1988). Mechanical weeding with animal traction: Some prerequisites. In P. H.Starkey & F. Ndiame (Eds). Animal power in farming systems. Pp 350-352. Proceedings of Networkshop held 17-26 September 1986 in Freetown, Sierra Leone. Vieweg for German Appropriate Technology Exchange, GTZ, Esenbom. Federal Republic of Germany.
Loewen-Rudgers, L; Rempel, E; Harder, J and Klassem-Harder, K. (1988). Constraints to the adoption of animal traction weeding technology in the Mbeya Region of Tanzania. In P. Starkey and A. Faye (Eds). Animal Traction for Agricultural Development. Proceedings of the Third Workshop of the West-Africa Animal Traction Network held 7 - 1 2 July, 1988, Saly, Senegal - Netherlands, CTA Publications.
Lynn, C. W. (1937). Agriculture in North Mamprushi. Bulletin No 34. Accra. Department of Agriculture.
Maunder, A. H. (1972). Agricultural Extension: A Reference Manual. 2nd ed. Rome FAO.
133
University of Ghana http://ugspace.ug.edu.gh

Ministry of Agriculture (1971). Bullock Ploughs on Loan. Ref No. RAO/UR/T.17/SF.1/32. RAO A. Tamale
Ministry of Food and Agriculture (MoFA) (1991). Medium Term Agricultural Development Programme. (MTADP) 1991-2000. Accra. MoFA.
Ministry of Food and Agriculture (MoFA) (1997). National Agriculture and Extension Project (NAEP) Report, 1997, Tamale, MoFA
Munzinger, P (1982) Animal Traction in Africa, Eschbom. GTZ
National Onchocerciasis Committee (NOC) (1992). Development Studies of theOnchocerciasis Free zone in Ghana: A Socio-economic Survey of the Builsa District of Upper East Region. Newtown, Accra. Project and Management Consultants Limited, and The National Onchocerciasis Secretariat. Ministry of Finance & Economics Planning.
Nnadi, E.E (1997). Handbook on Human Resources Management for Health Care Professionals. Washington, D.C. Howard University Press.
Oakley, P. & Garforth (1985). Guide to Extension Training. Agricultural Extension and Rural Development Centre, School of Education, University of Reading, U.K. Rome. FAO Training Series.
Omoding, J.O.Y. (1994). Developing Extension Programmes for Transfer of AnimalTraction Technology in Uganda. In: E. Mwenya J. Stares & P.H. Starkey (Eds), Improving Animal Traction Technology. Proceedings of the First Workshop of the ATNESA held 18-23, January, 1992, Zambia pp 334 -336. Germany. ATNESA Publications.
Panin, A & Ellis-Jones J. (1992) Increasing the Profitability of Draft Animal Power,In: E. Mwenya, J. Stares & P.H. Starkey (Eds), Improving Animal Traction Technology. Pp. 94. Proceedings of the First Workshop of the ATNESA held 18-23, January, 1992, Zambia. Germany. ATNESA Publications.
Panin, A. (1986). A Comparative Socio-economic Analysis of Hoe and BullockFarming Systems in Northern Ghana. Ph.D. Thesis Germany. University of Geottingen.
Reh, I and Horst, P (1982). Possibilities and limits of the use of trypanotolerant cattlefor draught purpose. In E. Karbe and and E. Freitas (Eds). Trvpanotoleramce: research and implementation. GTZ, Eschbom. Federal Republic of Germany.
Reijntjes, C., Haverkort, B & Water-Bayer, A (1992). Farming for the Future. An Introduction to Low-external Input. London. Macmillan Press. Ltd.
Reynolds, L. (1986). The relevance of AT to the humid zone. In P.H. Starkey and F.Ndiame (Eds). Animal Traction for Agricultural Development. Proceedings of the Third Workshop of the West Africa Animal Traction Network held 7-12, July, 1988, Saly, Senegal - Netherlands, CTA, Publications.
134
University of Ghana http://ugspace.ug.edu.gh

Rivera, W.M. Seepersad, J. & Pletscb, D.H. (1989). Comparative AgriculturalExtension Systems. In: D.J. Blackburn (Ed), Foundations and Changing Practices of Extension, pp 139-148. Canada. University of Guelph.
Rogers, E.M. & Kincaid, D. L. (1981) Communication Networks: Toward a New Paradigm for Research. New York. Free Press.
Rogers, E.M. (1983), Diffusion of Innovations 3rd ed. New York. The Free Prees.
Rogers, E.M. (1995) Diffusion of Innovations 4th ed. New York. The Free Press
Roling, N. & Leeuwis, C. (2002). Introduction to Communication and Innovation Studies. Wageningen University. Blackwell Science.
Sarantakos, S (1993). Social Research. London. Macmillan Press.
Seifert, M (1992). Animal Draft Power and the Evolution of Farming Systemson the West African Savannah: A Case Study from Northern Ghana. Speciale/M.Sc. Thesis Geografisk Institut - Kobenhavns Unversitet.
Shaner, W.W.; Philipp, P.F. & Schmehl, W.R. (1982). Farming Systems Researchand Development Guidelines for Developing Countries. Boulder, Colorado. Westview-Press.
Siegel, S. & Castellan Jr., N. (1988). Nonparametric Statistics for the Behavioural Science. New York. McGraw-Hill.
Starkey P. (1988). Animal Drawn Tool Carriers: Perfected vet Rejected. Eschbom.Germany. GTZ Publications.
Starkey P. (1990) Animal Traction for Agricultural Development in West-Africa:Production, Impact, Profitability and Constraints. In: P. Starkey, and Adama Faye (Eds), Animal Traction for Agricultural Development. Pp. 90 - 109. Proceedings of the Third Workshop of the West-Africa Animal Traction Network held 7 - 1 2 July, 1988 Saly, Senegal. Netherlands, CTA Publications,
Swanson, B. E. (1984). Agricultural Extension: A reference manual 2nd ed. Rome.FAO Series.
Urasa R.L.S. (1994). A note on issues to be addressed in the transfer of animaltraction technology in Tanzania. In: E. Mwenya J. Stares & P.H. Starkey (Eds) Improving Animal Traction Technology. Proceeding of the First Workshop of the ATNESA held 18-23 January 1992 Zambia pp 326 - 327. Germany ATNESA Publications.
van den Ban, A.W. & Hawkins, H.S. (1996). Agricultural Extension 2nd ed. London. Blackwell Science Ltd.
135
University of Ghana http://ugspace.ug.edu.gh

Whale, W.B. (1989). Technology Transfer Revisited: Canada.Blackburn (Ed), F o u n M o n O S < L ^ ^University of Guelph.
Wiagah Agriculutral Project (1975). Annual Reports. Wiagah.. RomanX K\ 1_Mission
Wilkening, E.A. (1953). Adoption of Improved Farm Practises as Related to FamilyFactors. Analysis of the Role of the Family in Farmers Adoption Decisions. Research Bulletin 183. Madison. Wisconsin Experimental Station.
136
University of Ghana http://ugspace.ug.edu.gh

LIST OF APPEDICES
APPENDIX 1
ADOPTION OF ANIMAL TRACTION TECHNOLOGY IN THE BUILSA DISTRICT OF UPPER EAST REGION OF GHANA
QUESTIONNAIRE FOR FARMERS OF VILLAGES WHERE ANIMAL TRACTION TECHNOLOGY HAS BEEN INTRODUCED IN THE BUILSA DISTRICT
PART ONE
INTERNAL FACORS OF FARMERS INFLUENCING ADOPTION OF ANIMALTRACTION TECHNOLOGY
A. BACKGROUND INFORMATION:
1. Name of Village:.................................................................................................
2. Name of section:................................................................................................-
3. Name of house:..................................................................................................4. Name of Farmer:................................................................................................
5. Sex: Male [ ] Female [ ]
6. Marital Status1. Married [ ]2. Single [ ]3. If a man, number of wives:......................................................................
7. Family size1. No. of adults [ ] Male [ ] Female [ ]
2. No. of children Boys [ ] Girls [ ]
8. Age of farmer:............................................................................................Years9. Farming experience:....................................................................................Year
10. Educational background
1. No formal education [ ]2. Primary School [ ]3. Middle/J.S.S [ ]4. Secondary/vocational [ ]5. Tertiary [ ]6. Other (specify) [ 1
137
University of Ghana http://ugspace.ug.edu.gh

SOCIO-ECONOMIC CHARACTERISTICS OF FARMER11. Ownership of draft animals. Tick all that apply
Type of ownershipANIMAL FAMILY INDIVIDUAL OTHER
SPECIFY1 • Cattle2. Working bullocks3- Donkeys
_4. Working donkeys
In question 12 and 13 indicate the activities you use draft animals for. 12. Use of Cattle. Tick all that apply.
Type of Haulage Type of traction1. Carrying water [ ] 1. Ploughing [ ]2. Carrying wood [ ] 2. Ridging [ ]3. Carrying gravel [ ] 3. Harrowing [ ]4. Carrying farm produce [ ] 4. Planting [ ]5. Transporting goods to market [ ] 5. Weeding [ ]6. Other specify [ ] 6. Other specify [ ]
13. Use of donkeys. Tick all that apply.
Type of Haulage Type of traction1. Carrying water [ ] 1. Ploughing [ ]2. Carrying wood [ ] 2. Ridging [ ]3. Carrying gravel [ ] 3. Harrowing [ ]4. Carrying farm produce [ ] 4. Planting [ ]5. Transporting goods and 5. Weeding [ ]
6.people to market [ ] Other specify [ ]
6. Other specify [ ]
14. Why don’t you use animal traction for the mentioned farm practices? Cattle
Farm Practice Use Not use Reasons1. Ploughing2. Ridging3. Harvesting4. Weeding5. Planting6. Haulage7. Other specify
138
University of Ghana http://ugspace.ug.edu.gh

15. Donkeys
Farm Practice Use Not use Reasons1. Ploughing2. Ridging3. Harvesting4. Weeding5. Planting6. Haulage7. Other specify
What is your opinion about the level of affordability of animal traction services by farmers in your community
1. All farmers can afford2. Most farmers can afford3. Some farmers can afford4. Few farmers can afford5. Most farmers can not afford
17. How would you rate the availability of animals traction services in your community?
1. Readily available [ ]2. Somewhat available [ ]3. Not readily available [ ]
18. Do you get any credit facility for farming? If yes, tick all that is applicable.
Source Type of credit Use of Credit Adequacy of CreditCash Inputs Equip
mentTo buy animals
To buy equipment
Tobuyfood
Otherspecify
Notadequate
Somewhatadequate
Veryadequate
1. Banks
2. NGOs
3. MoFA4. Money
lenders
5. Friends
6. Family7. Other
specify
139
University of Ghana http://ugspace.ug.edu.gh

How would you rate the availability of credit facilities in your community?1 • Readily available [ ]2. Some what available [ ]3- Not readily available [ ]
20. How would you rate the timeliness of credit?1- Always timely [ ]2- Sometimes on time [ ]3- Mostly late [ ]
21. How many farm sites do you have?...................................................................22. What is your total farm size?..............................................................................23. What is your source of farm labour?...................................................................
1- Family [ ]2. Hired [ ]3. Communal [ j4. Other specify [ ]
24. Apart from farming, what is your other source of income? Tick all applicable.1. Trading [ ]2. Blacksmith f |3. Crafts [ j4. Government employment [ 15. Other (specify) I 1
25. How do these sources of income influence your use of animal traction?
26. How does the use of animal traction influence the following aspects in your farming activities?
Activity Increase Decrease No Influence1. Crop yield2. Cost of production3. Use of farm labour
140
University of Ghana http://ugspace.ug.edu.gh

part tw o
EXTERNAL FACTORS INFLUENCING ADOPTION OF ANIMAL TRACTION TECHNOLOGY
c - SOCIO-CULTURAL FACTORS
27. Is it culturally acceptable to use animals to farm?
1. Yes [ ]
28. What level of respect/status is accorded for using animal traction in your community.
~~ . . Animal 1 2 3 4 5Very high
statusHigherstatus
Averagestatus
Lowstatus
Very low status
1 Donkeys1 Cattle
29. Who manages the work animals in your household? Tick all applicable1. Boys [ ]2. Girls [ ]3. Women [ I4. Men i i
30. How many people are required to manage work animals in your household?1. Donkeys...........................................................................2. Cattle..............................................
31. How does the use of animal traction influence the following aspects of your fanning?a. Crops cultivation.....................................................................b. Land reparation..........................................................................c. Site of farm..............................................................................d. Cropping system (mixed cropping.)......................................e. Planting pattern.......................................................................f. Size of farm..........................................................................
32. Rank in order of importance how the following influence the adoption of animaltraction with 1st being the most important influencing factor....................................5least important influencing factor.a. Reducing Cost. [ ]b. Increase in incomec. Yield increase [d. Use of labour [ ]e. Farm size [ ]
33. Rank the following in order of importance to consider when adopting a technology? ̂st 2nd 3 rd 4th
a. Compatibility [ ]b. Complexity [ ]
141
University of Ghana http://ugspace.ug.edu.gh

C. Trialability [ ]d. Relative economic advantage [ je. Observability [ ]
D- EXTENSION DELIVERY METHODS
34. Have you heard of animal traction before?L Yes [ ]2. No | |
35. If yes to question, 34 indicate your source of information. Tick all applicableMOFA (FLS) NGOs Friends Family Other specify
36. Did you get any training on animal traction?1. Yes [ ]2. No [ j
37. If yes to question 36 provide the following information
Organisation which trained you
Adequacy of durationDuration of
trainingHighly
InadequateInadequate Some what
adequateAdequate Highly
adequateMOFA f 1n g o s r 1Friends [ ]Otherspecify [ ]
38. Indicate the time of the year you had the training and its suitability. Give reasons
Time of yearSuitability Reasons
Suitable Not suitable1. Cropping season [ j2. Off season f ]3. Other specify [ ]
142
University of Ghana http://ugspace.ug.edu.gh

1- Demonstration [ ]2. Lectures [ ]4. Group discussion [ ]8- Individual [ ]
16- Audiovisuals [ ]
Which of the following methods were used during the training. Tick all applicable
How would you judge the effectiveness of these methods? Give reasons
Method1.
Highlyineffective
2.Ineffective
3.Some what
effective
4.Effective
5.Highly
effectiveReasons
DemonstrationsLectureGroupDiscussionsIndividual(Home/Farmvisit)Audio visuals
41. If you got trained in a group, how many were you?....................................
42. How would you rate your level of participation in the following activities?
ActivityLevel of Participation
Very high (1) High (2) Average (3) Low (4) Very low (5)Selecting of farmersSelecting of siteHandling of bullocksYoking of bullocksNose ringingSelecting of animals
43. Did the trainer allow you to ask questions?1. Yes [ ]2. No [ ]
44. Did the trainer respect your views?1. Yes. [ ]2. No [ ]
45. How would you rate the level of competence (knowledge, skills) of trainers during training?1. Very competent [ j2. Some what competent [ ]
143
University of Ghana http://ugspace.ug.edu.gh
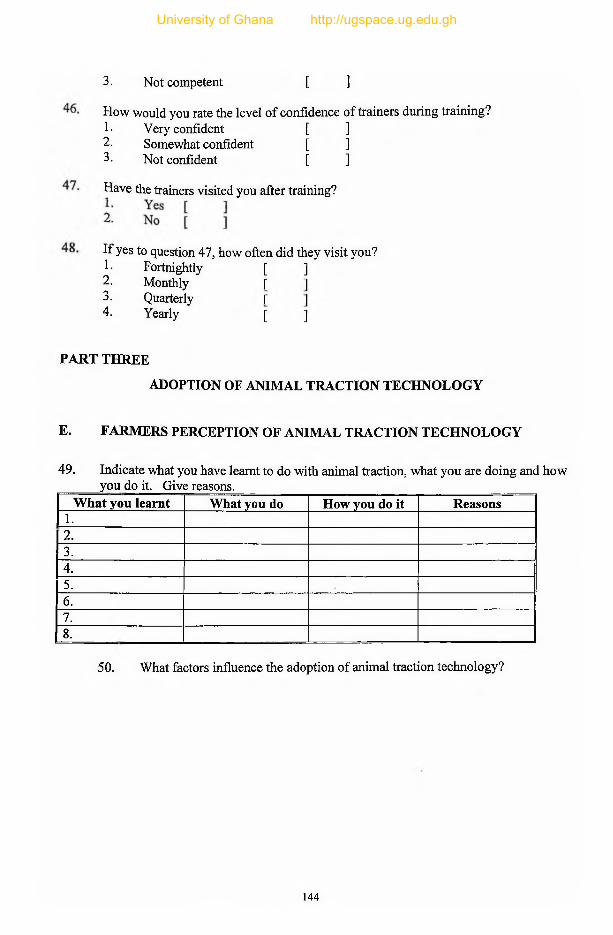
3. Not competent [ 1
How would you rate the level of confidence of trainers during training?1- Very confident [ j2- Somewhat confident [ ]3- Not confident [ ]
Have the trainers visited you after training?
If yes to question 47, how often did they visit you?1- Fortnightly [ ]2. Monthly [ j3- Quarterly j j4. Yearly [ ]
PART THREE
ADOPTION OF ANIMAL TRACTION TECHNOLOGY
E. FARMERS PERCEPTION OF ANIMAL TRACTION TECHNOLOGY
49. Indicate what you have learnt to do with animal traction, what you are doing and howyou do it. Give reasons.________ __________________________________
What you learnt What you do How you do it Reasons1.2.3.4.5.6.7.8.
50. What factors influence the adoption of animal traction technology?
144
University of Ghana http://ugspace.ug.edu.gh

APPENDIX 2
ADOPTION OF ANIMAL TRACTION TECHNOLOGY IN THE BUILSA DISTRICT OF UPPER EAST REGION OF GHANA.
QUESTIONNAIRE FOR AGRICULTURAL EXTENSION AGENTS WORKING IN BUILSA DISTRICT.
A. BACKGROUND INFORMATION1 .Name of Officer.............................................................................................
2. Operational Area...................................................................................
3- Sex: 1. Male [ ] 2. Female [ ]4.Ag e.................................................................................................................
5.Marital status: 1. Married [ ] 2. Single [ ]6.Number of years in service............................................................................
7.Languages spoken: 1. English [ ] 2. Buli [ ] 3. Other specify [ ]8.Highest formal educational level:
1. Agricultural College Certificate [ ]2. University Diploma [ ]3. University degree [ ]4. Other specify [ ]
9.List other courses attended
Course Place Year Duration Sponsors/organisation j|
145
University of Ghana http://ugspace.ug.edu.gh
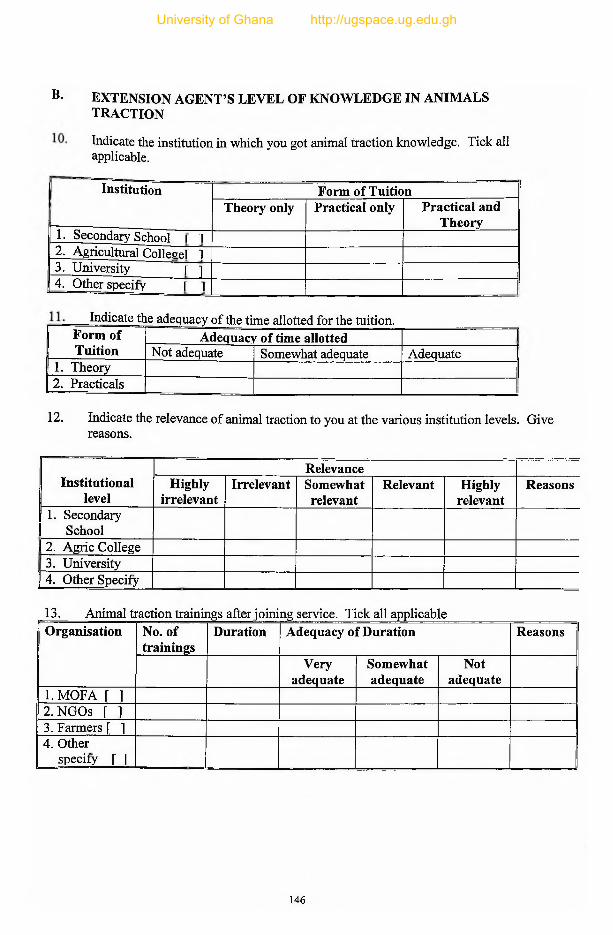
B- EXTENSION AGENT’S LEVEL OF KNOWLEDGE IN ANIMALS TRACTION
Indicate the institution in which you got animal traction knowledge. Tick all applicable.
Institution Form of TuitionTheory only Practical only Practical and
Theory1. Secondary School \ 12. Agricultural College! 13. University r 14. Other specify [ \
Indicate the adequacy of the time allotted for the tuition.Form of Tuition
Adequacy of time allottedNot adequate Somewhat adequate Adequate
1. Theory2. Practicals
12. Indicate the relevance of animal traction to you at the various institution levels. Give reasons.
Institutional i level
RelevanceHighly
irrelevantIrrelevant Somewhat
relevantRelevant Highly
relevantReasons
1. Secondary f School1 2. Agric College
3. Universityj 4. Other Specify
13. Animal traction trainings after joining service. Tick all applicableOrganisation No. of
trainingsDuration Adequacy of Duration Reasons
Veryadequate
Somewhatadequate
Notadequate
i . m o fa r 12. NGOs r 13. Farmers [ 14. Other
specify \ \
146
University of Ghana http://ugspace.ug.edu.gh

Indicate the time of the year trainings are usually done and its suitability. Give reasons __________
Time of year Suita bility ReasonsTraining done Suitability Not suitably1.2.
LET15. Which of the following methods were used during any of the animals traction
training? Tick all applicable.1. Demonstrations [ ]2. Lectures [ [3. Groups discussions [ ]4. Audio visuals ) I5. Role plays I ;
16. Rank in order of effectiveness the following methods which were used in helping you acquire knowledge in animals traction. 1st most - 5 least.
a. Demonstrationsb. Lecturesc. Groups discussionsd. Audio visualse. Role plays
17. Indicate the level of competence and confidence of resource persons during trainings.___________________________________________________
CompetenceKnowledge/skills
Confidence
Verycompetent
Somewhatcompetent
Notcompetent
Veryconfident
Somewhatconfident
Notconfident
18. Rank in order the following with regards to the frequency of training. 1st most -8 th least.
a. Crop Production [ ]b. Animals [ ]c. Fish Production [ ]d. WIAD activities [ ]e. Animal traction [ ]f. Extension methods [ ]g. Record keeping [ ]h. Post-harvest losses f 1
147
University of Ghana http://ugspace.ug.edu.gh
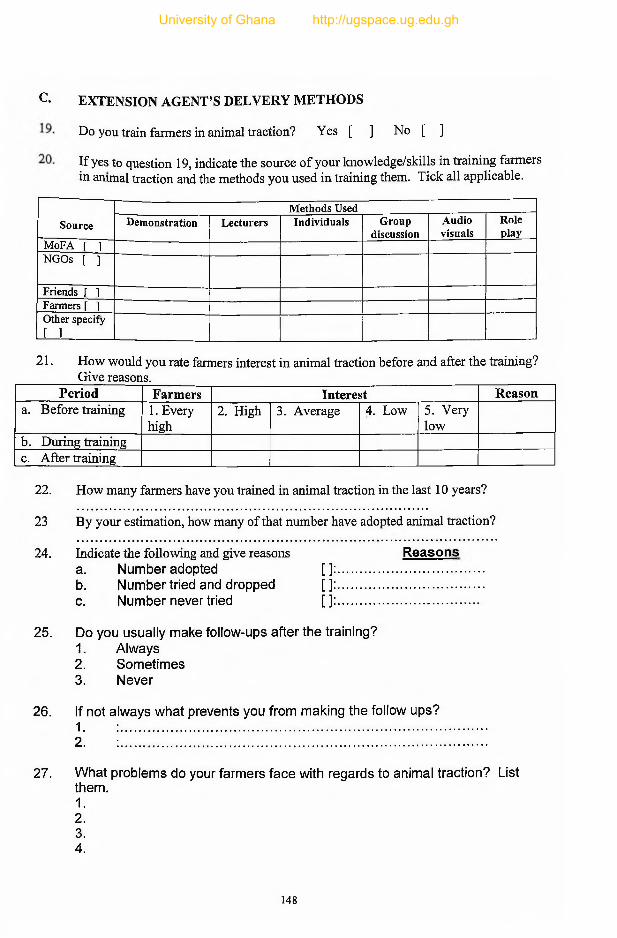
c - EXTENSION AGENT’S DEL VERY METHODS
Do you train farmers in animal traction? Yes [ ] No [ ]
If yes to question 19, indicate the source of your knowledge/skills in training farmers in animal traction and the methods you used in training them. Tick all applicable.
SourceMethods Used
Demonstration Lecturers Individuals Groupdiscussion
Audiovisuals
Roleplay
MoFA r 1NGOs [ ]
Friends \ 1Farmers \ IOther specifyr l
21. How would you rate farmers interest in animal traction before and after the training? Give reasons.
Period Farmers Interest Reasona. Before training 1. Every
high2. High 3. Average 4. Low 5. Very
lowb. During trainingc. After training
22. How many farmers have you trained in animal traction in the last 10 years?
23 By your estimation, how many of that number have adopted animal traction?
24. Indicate the following and give reasons Reasonsa. Number adopted [ ] : ........................................b. Number tried and dropped [ ]:........................................c. Number never tried [ j : .......................................
25. Do you usually make follow-ups after the training?1. Always2. Sometimes3. Never
26. If not always what prevents you from making the follow ups?1 . : ....................................................................................................................................2 . : .......................................................................................................................................
27. What problems do your farmers face with regards to animal traction? List them.1.2 .3.4.
148
University of Ghana http://ugspace.ug.edu.gh

28. Are you able to solve the farmers' problems with regards to animal traction adoption?1 ■ Always2. Sometimes3. Never
5.
149
University of Ghana http://ugspace.ug.edu.gh
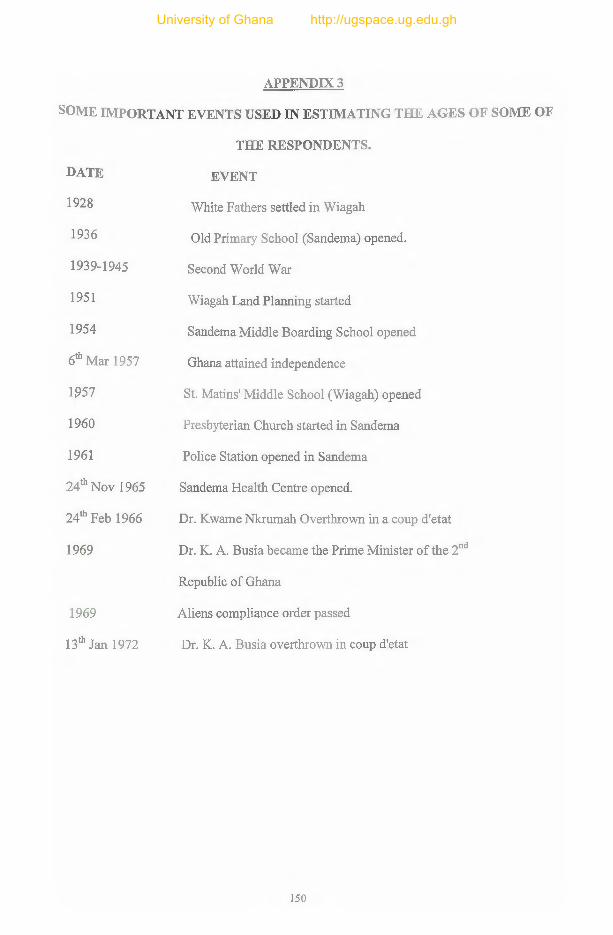
APPENDIX 3
SOME IMPORTANT EVENTS USED IN ESTIMATING THE AGES OF SOME OF
THE RESPONDENTS.
DATE EVENT
1928 White Fathers settled in Wiagah
1936 Old Primary School (Sandema) opened.
1939-1945 Second World War
1951 Wiagah Land Planning started
1954 Sandema Middle Boarding School opened
6th Mar 1957 Ghana attained independence
1957 St. Matins' Middle School (Wiagah) opened
1960 Presbyterian Church started in Sandema
1961 Police Station opened in Sandema
24th Nov 1965 Sandema Health Centre opened.
24th Feb 1966 Dr. Kwame Nkrumah Overthrown in a coup d'etat
1969 Dr. K. A. Busia became the Prime Minister of the 2nd
Republic of Ghana
1969 Aliens compliance order passed
13th Jan 1972 Dr. K. A. Busia overthrown in coup d'etat
150
University of Ghana http://ugspace.ug.edu.gh

APPENDIX 4
ENSTOOLMENT OF SOME CHIEFS WITHIN THE STUDY AREA
date NAME OF CHIEF VILLAGE STOOL NAME
1919 Anisonyaansa Siniensi Akpiok
1926 Adangabe Kadema Akaasanab
1927 Asangalisa Chuchuliga Azung
1927 Ayarik Gbedema Annab
1931 Azantilow Sandema Sandema-Nab
1938 Atong Doninga Anaah
1940 Abuntori Wiesi Anyaani
1948 Asuik Wiagah Anigiak
1949 Akauko Fumbisi Anyiab
1958 Atiamoah Bachonsa Afiok
1958 Atirikperi Gbedembilisi Agberikum
1959 Agaankoba Uwasi Anaab
1959 Akanfella Kanjarga Azundiok
151
University of Ghana http://ugspace.ug.edu.gh
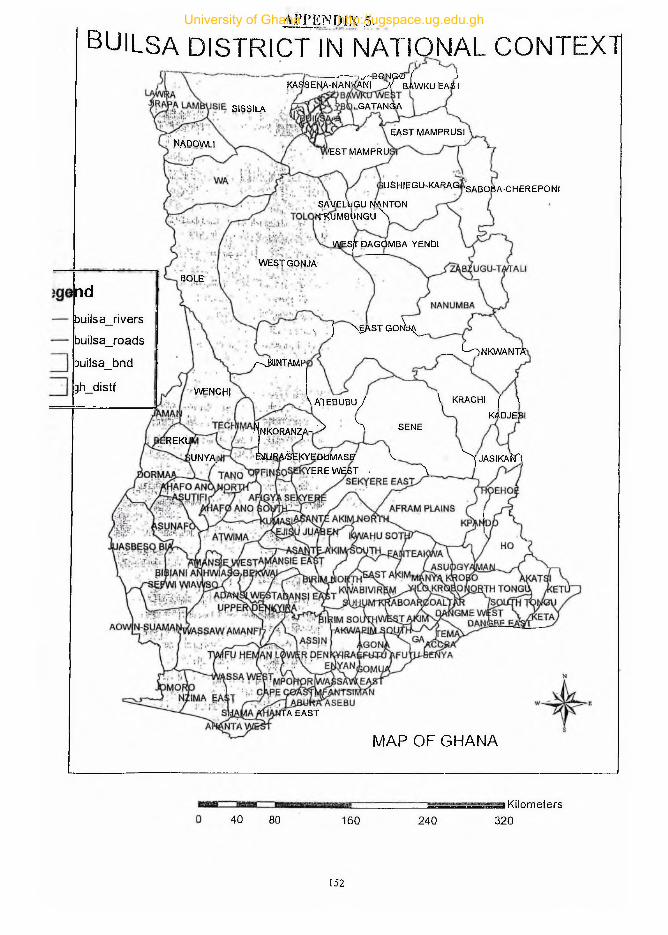
iLGATANGASISS1LA
EAST MAMPRUSINAPOWU
fEST MAMPRU:
lUSHIEGU-KARAG) 'SABOBA-CHEREPONI
SAVELUGU NANTON•t Ku m b u n g u N
WES/r DAGOMBA y e n d i
WEST G0NJA
BOLE
WENCH)
:rekuj
iUNYAJ
APPENDIX .5.
BUILSA DISTRICT IN NATIONAL CONTEXT i y -BGNG«i' f i
KASlSENA-NANtttNI j f bAwKU EAST
j n d
builsa_rivers
builsa_roads
Duilsa_bnd
gh_distf
, j \g A S T G o4k^__
/-xWNTAMP__ Lo n k w a n t a
^ K O R A N ^
\a t e b u b u J_ / > S SENE
V KRACHI [ \
KADJEB
BlURA^EKYEDaMASff V ^ jJ A S IK A fT tVERE WEST . V
TA EAST
MAP OF GHANA
! Kilometers40 80 160 240 320
15 2
University of Ghana http://ugspace.ug.edu.gh

ArriL .N U lX 6-
MAP OF BUILSA DISTICT
Legendbuilsa_communities
< builsa_roads builsa_rivers—— — builsa_paths_tracks
builsa_dist_bnd
builsa forest
153
University of Ghana http://ugspace.ug.edu.gh

University of Ghana http://ugspace.ug.edu.gh