adopted budget 2009.10 - setsoto local municipality · 2017-10-06 · budget speech by cllr...
TRANSCRIPT

ADOPTED
2008/2009
&
ADOPTED BUDGET2009/2010
ADOPTEDREVISED BUDGET

Description Page Table No.
Mayoral Budget Speech 3 - 7
Budget Related Resolutions 8 - 11
THE BUDGET & SUPPORTING INFORMATION
Executive Summary (Including budget assumptions) 12 - 14
Revenue by Source - Table 15 Table 1
Revenue by Major Source - Graph 16
Revenue by Minor Source - Graph 17
Operating Expenditure by Vote - Table 18 Table 2
Operating Expenditure by Major Vote - Graph 19
Operating Expenditure by Minor Vote - Graph 20
CAPEX by Vote - Table 21 Table 3
CAPEX by Major Vote - Chart 22
CAPEX by Minor Vote - Chart 23
CAPEX Funding - Table 24 Table 4
CAPEX Funding - Chart 25
Summary of Revenue & Expenditure by Vote - Table 26 Table 5
OPEX by Type - Table 27 Table 6
OPEX by Major Type - Chart 28
OPEX by Minor Type - Chart 29
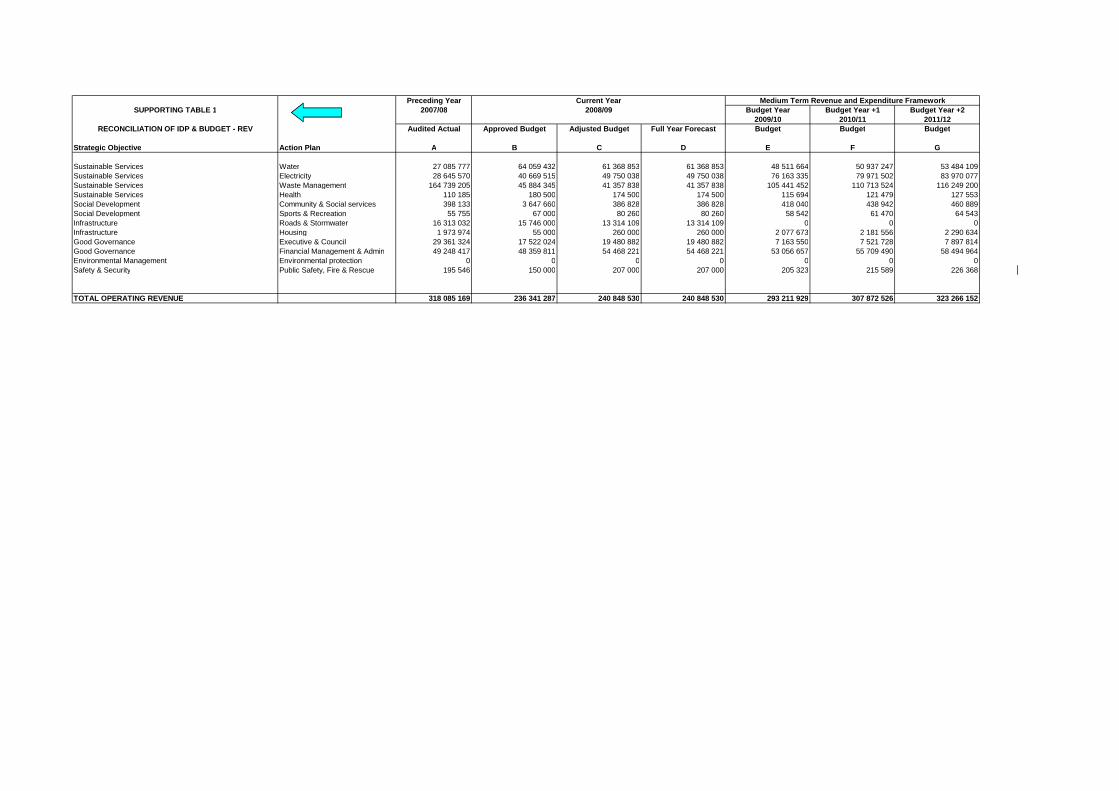
Reconciliation of IDP & Budget - Revenue 30 Supporting Table 1
Reconciliation of IDP & Budget - OPEX 31 Supporting Table 2
Reconciliation of IDP & Budget - CAPEX 32 Supporting Table 3
Investment Particulars by Type 33 Supporting Table 4
Investment Particulars by Maturity 34 Supporting Table 4(a)
Government Grants & Subsidies 35 Supporting Table 5
Disclosure of Salaries, Allowances & Benefits 36 Supporting Table 8
Summary of Salaries, Wages, & Allowances 37 Supporting Table 8(a)
Summary of Personell Numbers 38 Supporting Table 8(b)
Cash Flow Projections 39 Supporting Table 9
High level summary for Council Adoption - 2.1 40
High level summary for Council Adoption - 2.2 41
High level summary for Council Adoption - 2.3 42
High level summary for Council Adoption - 2.4 43
Actual Budget Summary - 2007/2008 44
Approved Budget - 2008/2009 45
Approved Budget (YTD) - 2008/2009 46
Revised Budget - 2008/2009 47
Draft Budget Summary - 2009/2010 48
Draft Budget Summary - 2010/2011 49
Draft Budget Summary - 2011/2012 50
Draft Budget - Summary 2009/2010 51
Draft Budget - Detailed Summary 2009/2010 52 - 53
Proposed Tariff List / Structure 2009/2010 54 - 67
Detailed Capital Budget 2009/2010 68 - 72
TABLE OF CONTENTS

BUDGET SPEECH BY CLLR MBOTHOMA MADUNA, THE MAYOR OF SETSOTO LOCAL MUNICIPALITY,
COUNCIL CHAMBER
04 JUNE 2009 AT 10:00
Honourable Speaker of our Council, Cllr Tshidiso Jakobo
The Executive Mayor of Thabo Mofutsanyana District Municipality, Mofumahadi Mathokoana Mopeli
Chiefwhip of African National Congress, Councilor Zim
All Exco Members
Chiefwhip of Democratic Alliance, Councilor Marwick
All Council Members
The Municipal Manager, Mr. Ratoolo Stephen Kau
All our Senior Management
All Municipal Employees
All our Political organizations
Civic Organizations
Ward Committees and Members of Community
Media Organizations
I am indeed pleased to be afforded with this opportunity to convey my heartfelt greetings to all our distinguished guests, Council andExco Members, Senior Management, all our Municipal Officials and our audience in attendance this morning.
The budget speech is presented hardly a month and few weeks after our national elections that were held on the 22 April 2009. Wewould like to thank all our citizens with their massive support. Hon. Council members, the Mayor of Setsoto Municipality, CllrMbothoma Maduna has attended Free State Provincial Lekgotla hence that he is not in attendance.
It must be noted that, the culmination of 2009/2010 budget is indeed absolutely another significant milestone for SetsotoMunicipality after we have interacted with our communities to enable to take make their contributions to our IntegratedDevelopment Plan (IDP). The budget speech is primarily informed by the priorities that our communities have advised us toconsider as this Municipality.
Re fela re fihletse katleho ho tse ding tsa dikateng tseo tokomane ya ditekanyetso ya selemo 2008/09 e neng e di behile. Tsenatsohle di fihlelehile ka hobane re na le Mookamedi wa Masepala le baokamedi bohle ba Masepala, ketjho le bona basebeletsi balekgotla la motse.
Tsohle dikopano le setjhaba metseng yohle ya Masepala wa Setsoto di re atlehisitse hore re nonye setjhaba maikutlo. E fela le sonasetjhaba se thotse monyetla wa ho ipeletsa ka hara tse ding bofokodi ba rona ka ditshebeletso, hara tse ding, ho phuthwa hamatlakala, hoo ho bile eka ho hotle ho ba le di ‘dumping zones’, ditsela tsa rona tse sa kgahliseng le di-tlankane tsa ditshebeletso tsesa tholahaleng ka nako e ka sita le motlakase wa mahala o ntseng o soka o fihleleha ho bohle.
We have taken a conscious decision to ensure that we continue with effort of ensuring that, local government works better and worksbetter for our people by in ensuring that there is provision of basic services to our people progressively with our limited resources.
Our budget for the financial year of 2009/2010 has been prepared and compiled within the confinements of National Treasury'srequirement.
Hon. Speaker, I would further appreciate to take this opportunity to state that, we have complied with the Municipal FinanceManagement Act and Municipal Structures Act in compiling this budget. It is strictly and directly aligned to the IntegratedDevelopment Plan (IDP).
Hon. Speaker, as the country we have just observed the National Child Protection Week, which started on 25 May and ended onSunday, 31 May 2009. We hope that we shall do better in our endeavor in creating much better enabling conditions for our children.
On the 16 June we shall be commemorating the African Child Day, a world-wide celebration that will focus international attentionon the needs of African children. The commemoration coincides with the date of the massacre of demonstrating Soweto
schoolchildren and somewhere else within our country by South African police on the 16th June in 1976. We must ensure that weuse this as an opportunity to educate our youth to be more responsible like the 1976 generation. We would like to urge the currentgeneration of young South Africans to face new challenges and defend their nation's hard-won democracy and to stay away fromcrime and drugs.
Last week Reserve Bank announced that our economy is officially in recession, we would like to urge our people not despair.Effects will be there but we still believe that our collective wisdom within government, business and labour should spare us from theworst effects of this downturn. We are an integrated economy and trends on the world stage reflect in our economy. However, wehave – for some time – been insulated by the sound policies and regulatory systems that have been put in place.
The budget of the municipality is compiled in an era characterized by economic recession since the late 80’s and the early 90’s.When there is a recession people lose jobs and as a result the expenditure for households shrinks which ultimately would thenadversely affect the municipal budget. Gross Domestic Price (GDP) is a yard stick that is used to determine the country’s growth.The huge decline in terms of Gross Domestic Product (GDP) is factored chiefly by the, Mining sector, Manufacturing sector, andAgricultural sector.

The budget of the municipality is informed by the income that we expect to receive from the households, businesses, andgovernment departments in terms of service charges. There has been an increasing level in terms of outstanding debts. The highoutstanding debt amount is chiefly attributed to households. The increase in outstanding debt inhibits the ability of the municipalityto achieve its set objectives. For the budget year 2009/10 we shall continue to be robust when it comes to collecting money that isdue to the municipality in our endeavor to ensure that there is a decline in outstanding debt.
Hon. Speaker, allow me to take this opportunity to reflect in detail in respect of our Draft Budget for the Financial Year of2009/2010
The total budget of the municipality is anticipated at R 293 million which is comprised of revenue and expenditure.
Total revenue is distinguished in terms of own revenue and grants derived or allocated in terms of Division of the Revenue Actwhich is published annually. Own revenue is anticipated to be R 140 million and grants as gazetted shall be a total R 153 million.Own revenue is expected to contribute only 48% towards total revenue while grants shall contribute 52% towards the total revenue.
The expenditure is characterized in terms of operating expenditure and capital expenditure. Operating expenditure is anticipated
to be R 243 million and Capital Expenditure is anticipated to be R 50 million.
The overall budget of the municipality has grown with an average of 24% compared the previous financial year. The biggestcontributing factor to that growth is the increase in the Division of Revenue Act allocations (DORA). Equitable share has increased
with an average of 29% from the current financial year (2008/09), MIG allocation increased with an average of 58% percent fromthe current financial year (2008/09).
The overall Capital Budget is anticipated to increase with an average of 63% which is expected to be funded as follows: Own
revenue shall contribute only 6% towards total capital expenditure and grants shall contribute 94% towards total capital expenditure.
Major Tariffs and Minor Tariffs:
In order to achieve what we have put for ourselves we need to ensure that the tariffs are set at a level that is going to be affordable toensure that the services are delivered efficiently and effectively to all the communities across the borders of Setsoto localmunicipality.
During the current year the valuation was compiled in terms of Municipal Property Rates Act (MPRA) and it is anticipated that thenew valuation shall be implemented from the 01 July 2009. The new valuation is based on the market value of properties. Theobjections were received and they shall be dealt with subject to the prescripts of the MPRA.
The total budget that is expected to be derived out of property rates is expected to the amount of R 20 million which represents a
decline of 14% from the current financial year (2008/09). Residential tariff is proposed at 10c of every rand with a 95% rebate,
Agricultural (Farms) tariff is anticipated to be 2.5c of every rand also with a 95% rebate, and Business tariff is proposed to be 20 c
of every rand with a 95% rebate as well. The municipality adheres to the ration determination as prescribed by the Minister withregard to the Municipal Property Rates.
The electricity tariff is expected to increase by an average of 15%. The increase is attributed to the application that is made by
Eskom to National Energy Regulator of South Africa (NERSA) in terms of interim price increase of 25% to 34% for electricity
purchases. The proposed 15% increase in terms of the tariff is expected to cover the overall proposed increase of 25% by Eskom.
Water tariff, Sewerage tariff, and all other tariffs are budgeted not to increase in the current budget year in an effort to ensure that theburden on household’s budget is relaxed.
Poverty Alleviation
We are proud of the fact that, for the financial year of 2008/2020 the Municipality managed to register a total number of 6960indigents and we have spent an amount of 11.4 million. I would like to take this opportunity to reflect specifically in respect of howmuch we have spent per town and the amount for each town. It is expected that the number is going to increase of our indigents dueto the global economic meltdown and now that we are officially on recession. The Municipality is indeed equally prepared to ensurethat it continues in providing its inhabitants with basic services. The anticipated total number of our indigents to be registered for the
financial year of 2009/2010 is 7 500, which will then cost the Municipality an amount of R 12 million.
UNIT
EQUITABLE
SHARE
INDIGENTS
MARQUARD 1,159,995.35 771
SENEKAL 2,396,350.72 1,358
CLOCOLAN 2,552,037.30 1,660
FICKSBURG 5,357,216.96 3,171
TOTAL 11,465,600.33 6,960
The Municipality Council has written off arrears of indigents for an amount of 11 million for the financial year of 2008/2009. Thefollowing amounts have been written off per town:

FICKSBURG 5.6 Million (5,671,920.84 )
CLOCOLAN 919,260.43
MARQUARD 2.2 Million (2,292,950.75)
SENEKAL (2,210,664.66)
GRAND TOTAL 11,094,796.68
Special Programs
Setsoto Municipal Council has budgeted an amount of R 500 000.00 for social relief programs during winter and festive seasons.
Churches
In accordance with Section 17 (1)(i) of the Municipal Property Act, all our churches are exempted from paying property rates. Ourchurches to be exempted from payment of services with 35% over a period of 3 years from this financial year of 2009/2010. Allchurches are going to be assessed individually to ascertain whether some of them shall be eligible for the aforesaid exemption orreduction. It is further a humble submission to the Council to take note of the fact that, to ease the burden of churches and to enablethem to start on a clean slate, all debts against our churches shall have to be written off effectively commencing from this financialyear of 2009/2010. The Council shall further be required to amend the Municipal policy to effect the abovementioned changes.
Usage of Recreational Facilities
With recognition of the fact that our young South Africans are actively engaged in distinctive sporting codes with lack of access torecreational facilities, which includes all our halls, tennis courts, stadiums or any recreational facility that enables our athletes toparticipate or train. Hon. Speaker, it shall be in the best interests of all our young athletes to have access to recreational facilitieswithout having to make any contribution. This exemption is only applicable to our teams and clubs.
Education is the centre of our efforts.
We have budgeted an amount of R 100 000.00 as an incentive for our top performers in matric examinations.
Crime
We have made a provision for our street lights to enable our law enforcement agencies to deal decisively with peace and stabilitywithin our jurisdictional boundaries and even beyond. It also incumbent upon all of us to ensure that we play a pivotal role byserving as members of Community Police Forum, Sector Police and Street Committees.
Decent jobs
Setsoto Municipality is yet again committed for decent jobs for its employees and we have budgeted an amount of R 76 million
(32%) for the salaries of Municipal employees. The total budget for employees’ salaries is informed by the following factors; firstly,it is anticipated that our Municipal employees are obliged to get their annual increment which has been agreed upon between
SALGA, SAMWU and Imatu; secondly, the Municipality is expected to fill all vacant posts.
Municipal Infrastructure Grant (MIG):
The following are projects that have been identified for the financial year if 2009/2010 and we have already started with some of the
project. We are mainly focusing on expanded public works program to ensure that we create more job opportunities for ourpeople.
Setsoto:Raising of Meulspruit Dam Wall 19,672,682.46
Marquard: Upgrading/Augmentation of raw water supply, pipeline from Clocolan to Marquard (started already) 15,051,122.46
Marquard Upgrading of water treatment works 5,939,172.00
Senekal: Upgrading of waste water treatment works (started already) 10,396,800.00
Marquard/Moemaneng: Upgrading of oxidation ponds (started already) 17,100,000.00
The following are included in the capital budget for 2010/2011.
We have made a provision for Ficksburg of R400 000 for upgrading of substation, R350 000 jail mini substation and R500 000 to
replace overhead lines. We have made a provision for Senekal of R350 000 for to remove overhead lines at Langestreet, and R400
00 11Kv Cable for Bellstreet.
In order for the Municipality to be able to provide our people with services in a manner that is efficient, effective and sustainable, wehave made a provision for the financial year of 2010/2011 to purchase the following equipments:
An amount R450 000 has been budget for purchasing cherry picker (Hoist Truck) for Ficksburg.
An amount of R160 000 1 x LDV Ficksburg;
An amount of R450 000 has been budgeted for the purchasing of cherry picker (Hoist Truck) for Senekal.
We have also budgeted an amount of R324 000 to enable us to purchase 2 x LDV’s for Senekal.
We have made a provision for our roads & storm water for the financial year of 2009/2010 in the following order:
1.8 million (R1 800 000) to upgrade water channel at Zone 7 Ficksburg;
2.9 million (R2 900 000) for upgrading storm water channels at Zone 8, Ficksburg
R270 000 for upgrading of PWD Stores at Ficksburg.
R160 000 for purchasing of vehicle shed for Ficksburg;
1 million (R1000 000) re-seal tar roads Senekal
R380 000 for our gravel roads at Marquard
R406 000 for storm water at Marquard
Project Description Project Value

1.6 million (R1 600 000) for re-sealing of tar roads
Roads & Storm Water.
An amount of R9 000 000 (9 million) is included in the budget for 2010/2011 for maintenance of Roads & Storm Water in all 4units;
An amount of R 40 000.00 for fencing of water purification plant at Ficksburg to deal specifically with issues of security and safetyof our employees. Furthermore to ensure that are communities have access to safe water.
Electricity:
The following amounts are included:
R1 000 000 (1 million) is included for network distribution.
R229 000 for maintenance of our streetlights in all 4 units.
R350 000 for maintenance of transformers.
Honorable Speaker, for housing we have also made the following provision:
Planning and Surveying of Cemeteries for a total budget of R150 000.00 specifically for Meqheleng Cemetery which is nearlyfull.
Purchasing of adjacent farms for new township establishment and commonage in Clocolan for R 4.8 million.
Purchasing of 4X LDV pick-up vehicles at R 390 000.00 for the effective and efficient monitoring of RDP Housing projectsand inspections on all sites, allocations of new sites, commonages etc.
Purchasing and installation of GIS system at R 500 000.00. This system will enhance the turn-around time for specificapplications for rezoning, land use, which are permitted per site, RDP housing projects and the impact made by same, it will also beused by Technical Department to address the level of services in terms of roads and storm-water, electricity network, water andsanitation.
Integrated Waste Management
An amount of R 2 550 000. 00 has been budgeted for purchasing of mobile compactors for the benefit all 4 units.
We have also made a provision for an amount of R 500.000.00 for tipper trucks for Ficksburg and Clocolan.
An amount of R 40 000.00 has been budgeted for mass containers for Ficksburg.
Parks and Properties
In terms of the Capital budget:
We have prioritized to build at least on park per unit for an amount of R 600 000.00.
An amount of R 200 000.00 has been budget for the development of tennis and netball courts.
There is an amount of R 600 000.00 has been budget for fencing of our cemeteries with prime focus to afford our youth to beresponsible this particular program.
The budget also covers purchasing of back actor for an amount of R 1 000 000.00.
We have budgeted an amount of R 180 000.00 toilets and water services at our cemeteries.
An amount of R 196 500.00 has been budgeted for the purchasing of lawn mowers, weed eaters and equipments at our parks.
There is also an amount of R 400 000.00 for purchasing of a tractor to be used at our parks.
We made a provision for an amount of R 168 000.00 for purchasing of furniture, such chairs and tables for our halls within 4units.
Our expenditure for water, electricity and refuse removal is structured in the following order per unit/town:
WATER: TOTAL EXPENDITURE 8,640,273.57
SENEKAL/MATWABENG 1,877,237.80
FICKSBURG/MEQHELENG 4,603,811.90
CLOCOLAN/HLOHLOLWANE 1,075,683.51
MARQUARD/MOEMANENG 1,083,540.37
REFUSE: TOTAL EXPENDITURE 8,194,457.44
SENEKAL/MATWABENG 2,228,846.65
FICKSBURG/MEQHELENG 3,477,879.08
CLOCOLAN/HLOHLOLWANE 1,358,178.49
MARQUARD/MOEMANENG 1,129,553.29
ELECTRICITY: TOTAL EXPENDITURE 19,357,688.55
SENEKAL/MATWABENG 4,531,723.80
FICKSBURG/MEQHELENG 11,308,659.22
CLOCOLAN/HLOHLOLWANE 2,119,631.28
MARQUARD/MOEMANENG 1,397,674.25
ELECTRICITY: 50 UNITS ELECTRICITY 4,109,187.50
SENEKAL/MATWABENG 961,979.67
FICKSBURG/MEQHELENG 2,400,565.59
CLOCOLAN/HLOHLOLWANE 449,948.47

MARQUARD/MOEMANENG 296,693.77
ELECTRICITY: STREET LIGHTING 1,304,390.20
SENEKAL/MATWABENG 305,363.74
FICKSBURG/MEQHELENG 762,017.85
CLOCOLAN/HLOHLOLWANE 142,828.33
MARQUARD/MOEMANENG 94,180.28
We have further made a provision for the following:
Park Meters R 150 000.00
Waste recycling R 100 000.00
Sandstone Mining R 100 000.00
Handcrafting R 200 000.00
Tourism signage R 100 000.00
An amount of R 600 000.00 has been budgeted for Setsoto Dairy Project. The aforesaid amount is precisely meant for the paymentof training of our trainees in Germany before the end of this year. It is expected that this particular project will make a difference tothe lives of the majority of our people by addressing the scourge of unemployment, to ensure that we transfer skill to our people, wecreate a type of environment with characteristics of broad based black economic empowerment. Established business communitiesshall not be deprived of any opportunity from taking part or adding value to this particular program. We have appointed the ProjectManager and 4 trainees.
They say that courage comes from doing it well. Security comes from knowing you can do it well. Confidence comes from knowingyou have done it well. It therefore without saying that, I must on behalf of this council give courage to men and women who arecharged with the responsibility of implementation of this budget to do it well , of cause driven by “Business Unusual All hands onDeck”.
This is the clarion call at the centre of which is the urgent need to entrench the ethos of transformative morality, discipline and caringamong council employees and management as a whole-to improve their understanding of their managerial professional and technicalrequirements necessary for the effective delivery of services. In effect this must call the competition of service delivery and budgetimplementation plan within fourteen (14) days from the date of adoption of our budget.
Hon. Council members are kindly advised to take note of the fact that, ‘Working Together, We Can Do More’
With that Hounarable Speaker, I will now wish to move for the adoption of our IDP/Budget for the Financial Year of 2009/2010 interms of section 24(1) of the Municipal Finance Act.
Thank you.
Cllr. T. Tsolo
ACTING MAYOR: SETSOTO LOCAL MUNICIPALITY
A: REVISED BUDGET 2008/2009 &
B: DRAFT BUDGET 2009/2010
DATE : 26/05/2009
AGENDA : COUNCIL MEETING: 04/06/2009
======================================================================================
A: REVISED BUDGET 2008/2009
REPORT: CHIEF FINANCIAL OFFICER
INTRODUCTION & OVERVIEW
In terms of the Municipal Finance Management Act 56 of 2003 Section 28, the municipality may revise its approved budget if
there is an indication of material under collection which may affect the performance of the budget and it is also used for the
purposes of the appropriating additional revenue which may become available than what was initially anticipated (Budgeted).
OBJECTIVE
The objective is to recommend to Council for the approval of the revised budget
2008/2009 financial year.
Attached is an Annexure of the Revised Budget for 2008/2009.
FINANCIAL IMPLICATIONS
The overall budget has increased with an average of 2% as a result of an additional R 2 million that that was received for the
equitable share and the additional interest that is levied in terms of outstanding debts. The additional increases were used to
increase the provision for bad debts as a result of growing outstanding debts. The capital budget have only declined with R
120,000 as a result grant that was supposed to be received from the Thabo Mofutsanyane District Municipality which is not
probable that it would be received.
LEGAL IMPLICATIONS
None
CURRENT POLICY
Municipal Finance Management Act 56 of 2003
DELEGATION
Council
=======================================================================================

B: DRAFT BUDGET 2009/2010
REPORT: CHIEF FINANCIAL OFFICER
INTRODUCTION & OVERVIEW
In terms section 24 of the Municipal Finance Management Act No. 56 of 2003, read in conjunction with circular 28 issued by the
National treasury the municipal Council must at least 30 days prior to the start of the financial year consider approval of the
budget.
The budget timelines was tabled in the Council on the 14/10/2008 in line with section 21(1)(b) of the MFMA. The Draft budget
was then tabled to Council on the 31 March 2009 for the purposes of inviting various stakeholders to make inputs on the draft
budget. Budget road shows were held from 28 – 07 May 2009 in all the units of Setsoto Local municipality for the purposes of
advancing the community participation in relation to the draft budget. The inputs of the members of the community have been
taken into consideration in preparing this draft budget.
OBJECTIVE
The objective of the attached draft budget is to recommend to the municipal Council for the approval of the budget.
Attached is an Annexure of the Draft Budget for 2009/2010.
RECOMMENDATIONS:
1. That the Council approve the Revised Budget of 2008/2009 as reflected
2. That the Draft Budget of the municipality for the financial year 2009/10 and indicative for the two projected outer years,
2010/11 and 2011/12 be approved as follows:
2.1 Operating revenue by source reflected in Table 1
2.2 Operating expenditure by vote reflected in Table 2
2.3 Capital expenditure by vote reflected in Table 3
2.4 Capital funding by source reflected in Table 4
3. That the property rates tariff as reflected for the 2009/10 be approved.
4. That the services charges tariffs and other tariffs as reflected in the 2009/10 be approved
5. That the measurable performance objectives for revenue from each source reflected in the indigent equity area be
approved for the budget year 2009/10
(FOR RECOMMENDATION TO COUNCIL)
======================================================================================

Minutes: Exco Meeting: 25/05/2009
Cllr Zim proposed that the matter be recommended to council as follows and seconded by Cllr Lithebe.
RECOMMENDED:
1. That the Council approve the Revised Budget of 2008/2009 as reflected
2. That the Draft Budget of the municipality for the financial year 2009/10 and indicative for the two projected outer years,
2010/11 and 2011/12 be approved as follows:
2.1 Operating revenue by source reflected in Table 1
2.2 Operating expenditure by vote reflected in Table 2
2.3 Capital expenditure by vote reflected in Table 3
2.4 Capital funding by source reflected in Table 4
3. That the property rates tariff as reflected for the 2009/10 be approved.
4. That the services charges tariffs and other tariffs as reflected in the 2009/10 be approved
5. That the measurable performance objectives for revenue from each source reflected in the indigent equity area be
approved for the budget year 2009/10
======================================================================================
Minutes Council Meeting: 04/06/2009
The Acting Mayor, Cllr Tsolo presented the Budget Speech which was attached as an annexure, whereafter each party was given
an opportunity to make input and comments on the budget.
Cllr Zim proposed that an amount of R204-000-00 be included in the budget 2009/2010 for the expenditure relevant to ward
committees as promulgated in the Gazette and was seconded by Cllr Lithebe.
Cllr Bester from FF+ indicated that she was not in support of the budget on the basis that property tax has increased by 14% and
she indicated that there are about 300 objections in Senekal against the property tax and she was skeptic as to whether
management will be able to respond on those objections before 1`st July 2009 and also poor arrangement with regard to budget
roads shows.
Cllr Marwick from DA made deliberations on the budget and indicted that DA was in support of the budget, however they are
Cllr Zim congratulated the Mayor, Exco Members, and Officials with a budget which he believed was compiled for bettering the
lives of the community of Setsoto whereby they had saved the poor of the poorest.
After some further deliberations on the Budget 2009/2010 whereby it found that some members were against the budget the
Speaker make a ruling for counting which was as follows:
In support of the budget = 21
Against the budget = 05

Cllr Muso proposed that the matter be resolved as follows and was seconded by Cllr Nketoane.
RESOLVED:
1. That the Council approve the Revised Budget of 2008/2009 as reflected
2. That the Draft Budget of the municipality for the financial year 2009/10 and indicative for the two projected outer years,
2010/11 and 2011/12 be approved as follows:
2.1 Operating revenue by source reflected in Table 1
2.2 Operating expenditure by vote reflected in Table 2
2.3 Capital expenditure by vote reflected in Table 3
2.4 Capital funding by source reflected in Table 4
3. That the property rates tariff as reflected for the 2009/10 be approved.
4. That the services charges tariffs and other tariffs as reflected in the 2009/10 be approved
5. That the measurable performance objectives for revenue from each source reflected in the indigent equity area be
approved for the budget year 2009/10
=======================================================================================

EXECUTIVE SUMMARY
INTRODUCTION & OVERVIEW
The draft budget 2009/2010 was drafted taken into consideration the following pieces of legislation into consideration, Constitution of the of the Republicof South Africa, Municipal structures act, Municipal systems act, Municipal finance management act, Division of Revenue Act, PPPFA, Competition act,Property rates act, National credit act, Basic Conditions of Employment Act, Labour Relations Act, Skills Development Act, Skills Levies Act,Employment Equity Act, Occupational Health and Safety Act, Compensation for Occupational Injuries, Budget related Circulars, and All MunicipalPolicies
Chief of legislation is the MFMA (read into conjunction with Circular 28) which stipulates that the municipality budget must be funded from, realisticallyanticipated revenue to be collected, cash backed accumulated funds from previous year’s surplus not committed for other purposes, and borrowed fundsbut only for capital budget .
In drafting our draft budget the municipality have then ensured that our draft budget is based on realistic revenue to be collected. In order to achieve theforegoing principle the municipality has taken into consideration the IDP, the current and past year performance of the budget. Only those items ofexpenditure that are included in the IDP and consistent with the IDP have been taken into consideration in drafting the budget for the 2009/2010. For thepurposes of supplementing the municipality’s capital budget the municipality have indicated anticipated capital loans to be acquired in its overall capitalbudget if the conditions of the MFMA have been satisfied (sec. 46).
The budget timelines was tabled in the Council on the 14/10/2008 which stipulated the Preparation, Tabling, and Approval stage of the budget. The budgettimelines also covered various activities that were going to be undertaken in order to ensure that the budget is fully compiled on the basis of ensuring thatthe items that are in the IDP are achieved. The Draft budget was then tabled to Council on the 31 March 2009 for the purposes of inviting variousstakeholders to make inputs on the draft budget. Budget road shows were held from 28 – 07 May 2009 in all the units of Setsoto Local municipality for thepurposes of advancing the community participation in relation to the draft budget. The inputs of the members of the community have been taken intoconsideration in preparing this draft budget.
REVENUE
The total revenue of the municipality is comprised of Own Revenue and Grants and subsidies. Own revenue refers mainly to revenue derived from servicecharges and Grants and subsides refers to revenue that is received in the form of a grant from the National government. Grant and subsidies aredistinguished between conditional grants and unconditional grant. Conditional grant refers to a grant that is provided for a specific purpose andUnconditional grant refers to a grant where there is no specific condition attached to it. Grants and subsidies are indicated in the Division of Revenue Actfor each respective financial year. Own Revenue is estimated to contribute 48% towards total revenue and Grants and subsidies are estimated to contribute52% towards total revenue of the municipality.
Own Revenue is reflected by Property rates which is budgeted an amount of R 20 million which represents a decrease of approximately 14% from theoriginal budget. The decrease is mainly attributed to the implementation of the Municipal Property Rates Act (MPRA).
Service charges consists of Electricity, Water, Refuse, and Sewerage have been budgeted a total amount of R 83 million which represents an increase of anapproximate 9%. The increase is chiefly attributed to an increase in the electricity tariff (please see section on “Tariffs” ).
Interest on investments has been budget an amount of R2.9 which represents an increase of 400% from that of the original budget. The increase is based onthe interest that was actually received from investments for the audited financial year 2007/08. Interest on outstanding debtors have been budgeted anamount of R 15 million which represents an increase of 26% from that of the original budget. The increase is attributed to the growing outstanding debtamount.
Grants and subsides have been budgeted to increase with approximately 39% and an total amount of R 153 million is anticipated to be received in termsDORA 2009. The increase is attributed to an increase in Equitable share allocation, Municipal Infrastructure Grant (MIG), and Financial Management Grant(FMG). The full list of grants and subsidies is reflected in Supporting Table 5 to the draft budget 2009/10.
TARIFFS
Electricity tariff is estimated to increase with an average to 15%. The increase is brought by an anticipated increase of 25% in terms of electricity. Nationaltreasury has advised municipalities to budget for at least an average increase of 25% in terms of electricity purchases in view of an anticipated increase oftariff by Eskom.

Property rates is now going to be levied in terms of the Market value prices in terms of the implementation of the MPRA as opposed to old practices wherelevying was based on the land value and the improvement value. It is estimated that the following categories shall be levied as follows based on the marketvalue of properties:
Residential properties – 0.100
State owned properties – 0.100
Industrial properties – 0.200
Agricultural properties – 0.0250
There are however exemptions, rebates, discounts, and reduction that are provided in terms of the Council rates policy and the Rates Bi-law in orderminimise the burden on individual categories of properties.
All other Tariffs are estimated not to increase for the financial year 2009/2010.
OPERATING EXPENDITURE
Operating expenditure refers to the expenditure that is incurred in the normal operating activities of the council.
Employee related costs have been estimated to increase with an average of 14% from that of the original budget. The increase is attributed an anticipatedincrease of 9.5% in terms of salaries and the vacant posts that have been provided. Employee related costs accounts 32% towards total operatingexpenditure.
Remuneration of councillors is estimated to increase with an average of 24% from that of the original budget. The original budget did not take into accountthe upper limits that were implemented and they have therefore been catered for.
Working capital reserve (Provision for bad debts) is estimated to increase with an average of 5% from that of the original budget. The increase is attributedto growing percentage in terms of outstanding debtors.
Depreciation is estimated to increase with an average of 28% as a result of the implementation of the new GRAP statements which requires that all the assetsbe unbundled and the unbundling process is expected to increase the provision for depreciation.
Repairs and maintenance is estimated to increase with an average of 31% from that of the original budget. Repairs and maintenance is estimated to accountapproximately 9% towards total operating expenditure.
Interest on external debt is estimated to increase with an average 6% from that of the original budget. Bulk purchase (Electricity purchase) is estimated toincrease with an average of 25% as a result of anticipated increase in terms of Eskom tariff.
Grants and subsides given which refers to indigent subsidy that is provided to indigent households is estimated to increase with an average 20%. It isanticipated that more consumers shall apply for the indigent subsidy as a result of the current adverse economic conditions that the world and the country isexperiencing.
CAPITAL EXPENDITURE
Capital expenditure refers to expenditure that is incurred for the purposes of acquiring new infrastructural items.
Capital expenditure is estimated to increase with an average of 63% and the resultant increase is attributed to the increase in terms of the MIG allocation thatis anticipated to increase.
Capital expenditure is anticipated to be funded as follows:
Funding Source Amount
Own Income R 2,870,000
Grants - MIG R 46,742,000
Grants - Other R 429,000
Total R 50,041,000
BUDGET ASSUMPTIONS
In preparing the draft budget the municipality has made the following assumption:

Budget growth
In is assumed that the budget shall grow by an average of 5% for the two outer financial years respectively (2010/11: 2011/2012). The 5% is informed bythe average inflation target of the National treasury and the CPIX. The purpose of making an assumption is to indicate to the reader of the budget that if thebudget grows from the current status quo what would be the financial position or status of the budget in the upcoming two outer financial years. The otherpurpose is to ensure that the municipality strategizes their financial resources and appropriate them accordingly in the future years.
Increase in terms of employee related costsFor the current budget year the municipality has assumed an increase of 9.5% in terms of salary increases and it is informed by the average increases that
have persisted for the previous financial years. The purpose of the assumption is to prepare the Council accordingly when SALGA pronounces itself on the
salary increases for the 2009

Preceding Year Current Year Medium Term Revenue and Expenditure Framework
TABLE 1 2007/08 2008/09 Budget Year Budget Year +1 Budget Year +2
2009/10 2010/11 2011/12
REVENUE BY SOURCE Audited Actual Approved Budget Adjusted Budget Full Year Forecast Budget Budget Budget
A B C D E F G
Revenue by Source
Property rates 22 814 808 23 442 278 23 444 350 23 444 350 20 142 278 21 149 392 22 206 862
Property rates - penalties imposed and collection charges 0 0 0 0 0 0 0
Service charges - electricity revenue from tariff billings 24 332 856 34 672 015 30 593 181 30 593 181 40 236 319 42 248 135 44 360 542
Service charges - water revenue from tariff billings 16 295 318 18 132 493 18 135 288 18 135 288 19 312 922 20 278 568 21 292 497
Service charges - sanitation revenue from tariff billings 11 790 026 10 099 938 10 125 048 10 125 048 10 099 938 10 604 935 11 135 182
Service charges - refuse removal from tariff billings 14 706 809 13 512 029 13 517 735 13 517 735 13 510 029 14 185 531 14 894 807
Service charges - other 100 852 110 000 123 333 123 333 79 885 83 879 88 073
Regional Service Levies - turnover 0 0 0 0 0 0 0
Regional Service Levies - remuneration 0 0 0 0 0 0 0
Rental of facilities and equipment 549 645 609 000 676 148 676 148 558 492 586 416 615 737
Interest earned - external investments 2 665 725 500 000 740 000 740 000 2 932 298 3 078 913 3 232 858
Interest earned - outstanding debtors 14 428 998 12 000 000 17 500 000 17 500 000 15 150 448 15 907 970 16 703 369
Dividends received 0 0 0 0 0 0 0
Fines 200 407 154 000 211 600 211 600 210 428 220 949 231 997
Licenses and permits 430 7 000 8 050 8 050 2 000 2 100 2 205Licenses and permits 430 7 000 8 050 8 050 2 000 2 100 2 205
Income for agency services 0 0 0 0 0 0 0
Government grants & subsidies 198 237 909 110 498 500 112 795 445 112 795 445 153 538 299 161 215 214 169 275 975
Public contributions & donated or contributed PPE 0 0 0 0 0 0 0
Gain on disposal of property plant and equipment 246 644 0 0 0 0 0 0
Other income 11 714 741 12 604 032 12 968 352 12 968 352 17 438 593 18 310 523 19 226 049
Total Revenue By Source 318 085 169 236 341 287 240 838 530 240 838 530 293 211 929 307 872 526 323 266 152

200 000 000
250 000 000
300 000 000
350 000 000
Revenue by Major Source (see next chart for break down of other)
0
50 000 000
100 000 000
150 000 000
07/08Aud 08/09 Bud 08/09 Adj 08/09 Est 09/10 Bud 10/11 Proj 11/12 Proj
Other 56 404 279 49 596 000 55 870 266 55 870 266 59 982 111 62 981 216 66 130 277
Water tariffs 16 295 318 18 132 493 18 135 288 18 135 288 19 312 922 20 278 568 21 292 497
Grants & subsidies 198 237 909 110 498 500 112 795 445 112 795 445 153 538 299 161 215 214 169 275 975
Property rates 22 814 808 23 442 278 23 444 350 23 444 350 20 142 278 21 149 392 22 206 862
Electricity tariffs 24 332 856 34 672 015 30 593 181 30 593 181 40 236 319 42 248 135 44 360 542
R('000)

20 000 000
25 000 000
30 000 000
35 000 000
40 000 000
45 000 000
50 000 000
R'000
Revenue By Minor Source (break down of other from previous chart)
0
5 000 000
10 000 000
15 000 000
07/08Aud 08/09 Bud 07/08 Adj 08/09 Est 09/10 Bud 10/11 Proj 11/12 Proj
Licenses and permits 430 7 000 8 050 8 050 2 000 2 100 2 205
Interest earned - outstanding debtors 14 428 998 12 000 000 17 500 000 17 500 000 15 150 448 15 907 970 16 703 369
Income for agency services 0 0 0 0 0 0 0
Sanitation tariffs 11 790 026 10 099 938 10 125 048 10 125 048 10 099 938 10 604 935 11 135 182
Refuse tariffs 14 706 809 13 512 029 13 517 735 13 517 735 13 510 029 14 185 531 14 894 807
Interest earned - external investments 2 665 725 500 000 740 000 740 000 2 932 298 3 078 913 3 232 858
Rental of facilities and equipment 549 645 609 000 676 148 676 148 558 492 586 416 615 737
Fines 200 407 154 000 211 600 211 600 210 428 220 949 231 997
Regional service levies 0 0 0 0 0 0 0

Preceding Year Current Year Medium Term Revenue and Expenditure Framework
TABLE 2 2007/08 2008/09 Budget Year Budget Year +1 Budget Year +2
2009/10 2010/11 2011/12
OPERATING EXPENDITURE BY VOTE Audited Actual Approved Budget Adjusted Budget Full Year Forecast Budget Budget Budget
A B C D E F G
Executive & Council 33 551 652 36 973 804 38 839 736 38 839 736 44 262 836 46 475 977 48 799 776
Finance & Admin 27 278 385 25 606 979 27 925 315 27 925 315 34 284 624 35 998 855 37 798 798
Planning & Development 0 0 0 0 0 0 0
Health 152 588 185 500 185 500 185 500 0 0 0
Community & Social Services 4 928 494 7 630 458 4 626 964 4 626 964 8 030 120 8 423 957 8 845 155
Housing 2 476 033 3 248 890 2 579 459 2 579 459 3 467 469 3 640 843 3 822 885
Public Safety 3 618 508 4 418 071 4 187 686 4 187 686 4 739 175 4 976 134 5 224 941
Sport and Recreation 6 272 719 8 115 064 8 438 082 8 438 082 8 944 582 9 391 811 9 861 402
Environmental Health 1 819 32 000 32 000 32 000 0 0 0
Waste Management 25 980 258 33 011 485 37 959 629 37 959 629 40 523 590 42 549 770 44 677 258
Road Transport 13 166 510 24 849 692 17 727 316 17 727 316 26 202 412 27 512 532 28 888 159
Water 24 625 691 25 519 904 30 523 549 30 523 549 28 204 722 29 614 958 31 095 706
Electricity 26 737 653 33 877 631 37 190 559 37 190 559 41 732 146 43 818 753 46 009 691
Other 2 017 408 1 738 343 0 0 2 773 601 2 912 281 3 057 895
OPERATING EXPENDITURE BY VOTE 170 807 717 205 207 820 210 215 795 210 215 795 243 165 278 255 315 873 268 081 667

0
50 000 000
100 000 000
150 000 000
200 000 000
250 000 000
300 000 000
07/08Aud 08/09 Bud 08/09 Adj 08/09 Est 09/10 Bud 10/11 Proj 11/12 Proj
Housing 2 476 033 3 248 890 2 579 459 2 579 459 3 467 469 3 640 843 3 822 885
Sport and Recreation 6 272 719 8 115 064 8 438 082 8 438 082 8 944 582 9 391 811 9 861 402
Executive & Council 33 551 652 36 973 804 38 839 736 38 839 736 44 262 836 46 475 977 48 799 776
Health 152 588 185 500 185 500 185 500 0 0 0
Other 63 774 278 83 413 081 86 242 494 86 242 494 94 930 724 99 677 260 104 661 124
Public Safety 3 618 508 4 418 071 4 187 686 4 187 686 4 739 175 4 976 134 5 224 941
Finance & Admin 27 278 385 25 606 979 27 925 315 27 925 315 34 284 624 35 998 855 37 798 798
Community & Social Services 4 928 494 7 630 458 4 626 964 4 626 964 8 030 120 8 423 957 8 845 155
Water 26 737 653 33 877 631 37 190 559 37 190 559 41 732 146 43 818 753 46 009 691
Electricity 2 017 408 1 738 343 0 0 2 773 601 2 912 281 3 057 895
R('000)
Operating Expenditure by Major Vote (see next chart for breakdown of other)

30 000 000
35 000 000
40 000 000
45 000 000
Operating Expenditure by Minor Vote (breakdown of other from previous chart)
0
5 000 000
10 000 000
15 000 000
20 000 000
25 000 000
07/08Aud 08/09 Bud 08/09 Adj 08/09 Est 09/10 Bud 10/11 Proj 11/12 Proj
Waste Management 25 980 258 33 011 485 37 959 629 37 959 629 40 523 590 42 549 770 44 677 258
R('000)

Preceding Year Current Year Medium Term Revenue and Expenditure Framework
TABLE 3 2007/08 2008/09 Budget Year Budget Year +1 Budget Year +2
2009/10 2010/11 2011/12
CAPITAL EXPENDITURE BY VOTE Audited Actual Approved Budget Adjusted Budget Full Year Forecast Budget Budget Budget
A B C D E F G
Executive & Council 813 341 370 000 250 000 250 000 1 170 000 1 228 500 1 289 925
Finance & Admin 250 371 1 700 000 1 700 000 1 700 000 429 000 450 450 472 973
Planning & Development 0 0 0 0 0 0 0
Health 0 0 0 0 0 0 0
Community & Social Services 12 565 160 000 160 000 160 000 0 0 0
Housing 0 0 0 0 0 0 0
Public Safety 0 0 0 0 0 0 0
Sport and Recreation 0 3 500 000 3 500 000 3 500 000 0 0 0
Environmental Health 0 0 0 0 0 0 0
Waste Management 222 767 4 737 000 4 737 000 4 737 000 2 240 000 2 352 000 2 469 600
Road Transport 47 938 2 010 000 2 010 000 2 010 000 1 600 000 1 680 000 1 764 000
Water 129 104 15 870 000 15 870 000 15 870 000 44 602 000 46 832 100 49 173 705
Electricity 8 050 2 200 000 2 200 000 2 200 000 0 0 0
Other 0 0 0 0 0 0 0
CAPITAL EXPENDITURE BY VOTE 1 484 136 30 547 000 30 427 000 30 427 000 50 041 000 52 543 050 55 170 203

30 000 000
40 000 000
50 000 000
60 000 000
R('000)
Capital Expenditure by Major Vote (see next chart for breakdown of other)
0
10 000 000
20 000 000
07/08Aud 08/09 Bud 08/09 Adj 08/09 Est 09/10 Bud 10/11 Proj 11/12 Proj
Sport and Recreation 0 3 500 000 3 500 000 3 500 000 0 0 0
Public Safety 0 0 0 0 0 0 0
Housing 0 0 0 0 0 0 0
Other 1 076 277 2 230 000 2 110 000 2 110 000 1 599 000 1 678 950 1 762 898
Waste Management 222 767 4 737 000 4 737 000 4 737 000 2 240 000 2 352 000 2 469 600
Water 8 050 2 200 000 2 200 000 2 200 000 0 0 0
Road Transport 129 104 15 870 000 15 870 000 15 870 000 44 602 000 46 832 100 49 173 705
Electricity 0 0 0 0 0 0 0
Waste Water Management 47 938 2 010 000 2 010 000 2 010 000 1 600 000 1 680 000 1 764 000

1
1
1
1
Capital Expenditure by Minor Vote (breakdown of other from previous chart)
0
0
0
0
0
1
1
07/08Aud 08/09 Bud 08/09 Adj 08/09 Est 09/10 Bud 10/11 Proj 11/12 Proj
Health 0 0 0 0 0 0 0
R('000)

Preceding Year Current Year Medium Term Revenue and Expenditure Framework
TABLE 4 2007/08 2008/09 Budget Year Budget Year +1 Budget Year +2
2009/10 2010/11 2011/12
CAPITAL FUNDING BY SOURCE Audited Actual Approved Budget Adjusted Budget Full Year Forecast Budget Budget Budget
R R R
A B C D E F G
National Government
Amounts allocated / gazetted for that year 198237908.5 30 018 000 30 018 000 30 018 000 47 171 000.00 49 529 550.00 52 006 027.50
Amounts carried over from previous years 0 - 0 0 0 0 0
Total Grants & Subsidies - National Government 198237908.5 30 018 000 30018000 30018000 47 171 000.00 49 529 550.00 52 006 027.50
Provincial Government
Amounts allocated / gazetted for that year 0 120 000 0 0 - - -
Amounts carried over from previous years 0 - 0 0 0 0 0
Total Grants & Subsidies - Provincial Government 0 120 000 0 0 - - -
District Municipality
Amounts allocated for that year 0 - 0 0 0 0 0
Amounts carried over from previous years 0 - 0 0 0 0 0
Total Grants & Subsidies - District Municipalities 0 - 0 0 0 0 0
Total Government Grants & Subsidies 198237908.5 30 138 000 30018000 30018000 47 171 000.00 49 529 550.00 52 006 027.50
Public Contributions & Donations 0 - 0 0 0 0 0Public Contributions & Donations 0 - 0 0 0 0 0
Accumulated Surplus (Own Funds) 0 409 000 409 000 409 000 2 870 000.00 3 013 500.00 3 164 175.00
External Loans 0 22 963 000 0 0 - - -
TOTAL FUNDING OF CAPITAL EXPENDITURE 198237908.5 53 510 000 30427000 30427000 50 041 000.00 52 543 050.00 55 170 202.50

120 000 000
140 000 000
160 000 000
180 000 000
200 000 000
Capital Funding by Source
0
20 000 000
40 000 000
60 000 000
80 000 000
100 000 000
07/08Aud 08/09 Bud 08/09 Adj 08/09 Est 09/10 Bud 10/11 Proj 11/12 Proj
Accumulated Surplus 0 409 000 409 000 409 000 2 870 000 3 013 500 3 164 175
External Loans 0 22 963 000 0 0 0 0 0
Grants - Provincial Government 0 120 000 0 0 0 0 0
Grants - National Government 198 237 909 30 018 000 30 018 000 30 018 000 47 171 000 49 529 550 52 006 028
R('000)

TABLE 5 2009/10 2010/11 2011/12
Appropriations Funding Surplus / Appropriations Funding Surplus / Appropriations Funding Surplus /
SUMMARY OF REV & EXP Capital Operating Total Own Source External Total (Deficit) Capital Operating Total Own Source External Total (Deficit) Capital Operating Total Own Source External Total (Deficit)
BY VOTE R'000 R'000 R'000 R'000 R'000 R'000 R'000 R'000 R'000 R'000 R'000 R'000 R'000 R'000 R'000 R'000 R'000 R'000 R'000 R'000 R'000
Executive & Council -1 170 000 -44 262 836 -45 432 836 221 550 6 942 000 7 163 550 -38 269 286 -1 228 500 -46 475 977 -47 704 477 232 628 7 289 100 7 521 728 -40 182 750 -1 289 925 -48 799 776 -50 089 701 244 259 7 653 555 7 897 814 -42 191 887
Finance & Admin -429 000 -34 284 624 -34 713 624 51 877 657 1 179 000 53 056 657 18 343 033 -450 450 -35 998 855 -36 449 305 54 471 540 1 237 950 55 709 490 19 260 184 -472 973 -37 798 798 -38 271 770 57 195 117 1 299 848 58 494 964 20 223 194
Planning and Development - - - - - - - - - - - - - - - - - - - - -
Health - - - 10 395 105 299 115 694 115 694 - - - 10 915 110 564 121 479 121 479 - - - 11 460 116 092 127 553 127 553
Community & Social Services - -8 030 120 -8 030 120 418 040 - 418 040 -7 612 080 - -8 423 957 -8 423 957 438 942 - 438 942 -7 985 015 - -8 845 155 -8 845 155 460 889 - 460 889 -8 384 266
Housing - -3 467 469 -3 467 469 2 077 673 - 2 077 673 -1 389 796 - -3 640 843 -3 640 843 2 181 556 - 2 181 556 -1 459 286 - -3 822 885 -3 822 885 2 290 634 - 2 290 634 -1 532 250
Public Safety - -4 739 175 -4 739 175 205 323 - 205 323 -4 533 853 - -4 976 134 -4 976 134 215 589 - 215 589 -4 760 545 - -5 224 941 -5 224 941 226 368 - 226 368 -4 998 572
Sport & Recreation - -8 944 582 -8 944 582 58 542 - 58 542 -8 886 040 - -9 391 811 -9 391 811 61 470 - 61 470 -9 330 342 - -9 861 402 -9 861 402 64 543 - 64 543 -9 796 859
Environmental Protection - - - - - - - - - - - - - - - - - - - - -
Waste Management -2 240 000 -40 523 590 -42 763 590 23 691 352 81 750 100 105 441 452 62 677 861 -2 352 000 -42 549 770 -44 901 770 24 875 919 85 837 605 110 713 524 65 811 754 -2 469 600 -44 677 258 -47 146 858 26 119 715 90 129 485 116 249 200 69 102 342
Road Transport -1 600 000 -26 202 412 -27 802 412 - - - -27 802 412 -1 680 000 -27 512 532 -29 192 532 - - - -29 192 532 -1 764 000 -28 888 159 -30 652 159 - - - -30 652 159
Water -44 602 000 -28 204 722 -72 806 722 19 449 264 29 062 400 48 511 664 -24 295 059 -46 832 100 -29 614 958 -76 447 058 20 421 727 30 515 520 50 937 247 -25 509 812 -49 173 705 -31 095 706 -80 269 411 21 442 813 32 041 296 53 484 109 -26 785 302
Electricity - -41 732 146 -41 732 146 41 663 835 34 499 500 76 163 335 34 431 189 - -43 818 753 -43 818 753 43 747 027 36 224 475 79 971 502 36 152 748 - -46 009 691 -46 009 691 45 934 378 38 035 699 83 970 077 37 960 386
Other - -2 773 601 -2 773 601 - - - -2 773 601 - -2 912 281 -2 912 281 - - - -2 912 281 - -3 057 895 -3 057 895 - - - -3 057 895
TOTAL -50 041 000.00 -243 165 278.19 -293 206 278.19 139 673 630.19 153 538 298.89 293 211 929.08 5 650.90 -52 543 050.00 -255 315 872.90 -307 858 922.90 146 657 311.70 161 215 213.84 307 872 525.54 13 602.64 -55 170 202.50 -268 081 666.54 -323 251 869.04 153 990 177.29 169 275 974.53 323 266 151.82 14 282.78

TABLE 6 Preceding Year Current Year Medium Term Revenue and Expenditure Framework
2007/08 2008/09 Budget Year Budget Year +1 Budget Year +2
OPERATING EXPENDITURE BY TYPE 2009/10 2010/11 2011/12
Audited Actual Approved Budget Adjusted Budget Full Year Forecast Budget Budget Budget
A B C D E F G
Operating Expenditure by Type
Employee related costs 64 923 272 67 726 482 71 497 092 71 497 092 76 923 476 80 769 650 84 808 132
Remuneration of Councillors 6 505 023 5 927 803 7 051 842 7 051 842 7 365 557 7 733 835 8 120 527
Bad debts 11 760 575 12 500 000 20 800 000 20 800 000 13 125 000 13 781 250 14 470 313
Collection costs 0 5 000 0 0 8 000 8 400 8 820
Depreciation 15 564 032 13 099 000 17 929 000 17 929 000 16 728 492 17 564 917 18 443 163
Repairs and maintenance 7 009 852 16 884 027 10 409 674 10 409 674 22 144 769 23 252 008 24 414 608
Interest paid 4 654 748 11 449 192 6 769 083 6 769 083 12 220 736 12 831 772 13 473 361
Bulk purchases - Electricity 14 775 478 19 348 875 19 358 213 19 358 213 24 186 094 25 395 398 26 665 168
Bulk purchases - Water 0 0 0 0 0 0 0
Contracted services 0 0 0 0 0 0 0
Grants and subsidies paid 7 008 192 10 005 000 10 005 000 10 005 000 12 000 000 12 600 000 13 230 000
Advertising -555 0 0 0 0 0 0
Audit fees 0 0 0 0 0 0 0
Bank charges 0 0 0 0 0 0 0
Communications -621 0 0 0 0 0 0Communications -621 0 0 0 0 0 0
Insurance 0 0 0 0 0 0 0
Legal fees 0 0 0 0 0 0 0
Seminar / Conferences 0 0 0 0 0 0 0
Travel and Accommodation 0 0 0 0 0 0 0
Other 31 622 687 37 589 908 35 723 358 35 723 358 46 056 587 48 351 747 50 769 335
Total Operating Expenditure By Type 163 822 682 194 535 287 199 543 262 199 543 262 230 758 712 242 288 978 254 403 427

150 000 000
200 000 000
250 000 000
300 000 000
R'000
Operating Expenditure by Major Type (see next chart for break down of other)
0
50 000 000
100 000 000
07/08 Aud 07/08 Bud 07/08 Adj 07/08 Est 08/09 Bud 09/10 Proj 10/11 Proj
Insurance 0 0 0 0 0 0 0
Interest paid 4 654 748 11 449 192 6 769 083 6 769 083 12 220 736 12 831 772 13 473 361
Bulk purchases - Water 0 0 0 0 0 0 0
Depreciation 15 564 032 13 099 000 17 929 000 17 929 000 16 728 492 17 564 917 18 443 163
Repairs and maintenance 7 009 852 16 884 027 10 409 674 10 409 674 22 144 769 23 252 008 24 414 608
Other 56 895 300 66 027 711 73 580 199 73 580 199 78 555 145 82 475 233 86 598 994
Bulk purchases - Electricity 14 775 478 19 348 875 19 358 213 19 358 213 24 186 094 25 395 398 26 665 168
Employee related costs 64 923 272 67 726 482 71 497 092 71 497 092 76 923 476 80 769 650 84 808 132

30 000 000
40 000 000
50 000 000
60 000 000
70 000 000
80 000 000
90 000 000
R'000
Operating Expenditure by Minor Type (break down of other from previous chart)
(10 000 000)
0
10 000 000
20 000 000
07/08 Aud 07/08 Bud 07/08 Adj 07/08 Est 08/09 Bud 09/10 Proj 10/11 Proj
Collection costs 0 5 000 0 0 8 000 8 400 8 820
Remuneration of Councillors 6 505 023 5 927 803 7 051 842 7 051 842 7 365 557 7 733 835 8 120 527
Travel and Accommodation 0 0 0 0 0 0 0
Other 31 622 687 37 589 908 35 723 358 35 723 358 46 056 587 48 351 747 50 769 335
Audit fees 0 0 0 0 0 0 0
Grants and subsidies paid 7 008 192 10 005 000 10 005 000 10 005 000 12 000 000 12 600 000 13 230 000
Bank charges 0 0 0 0 0 0 0
Advertising (555) 0 0 0 0 0 0
Bad debts 11 760 575 12 500 000 20 800 000 20 800 000 13 125 000 13 781 250 14 470 313
Legal fees 0 0 0 0 0 0 0
Communications (621) 0 0 0 0 0 0
Contracted services 0 0 0 0 0 0 0
Preceding Year Current Year Medium Term Revenue and Expenditure Framework
SUPPORTING TABLE 1 2007/08 2008/09 Budget Year Budget Year +1 Budget Year +2
2009/10 2010/11 2011/12
RECONCILIATION OF IDP & BUDGET - REV Audited Actual Approved Budget Adjusted Budget Full Year Forecast Budget Budget Budget
Strategic Objective Action Plan A B C D E F G
Sustainable Services Water 27 085 777 64 059 432 61 368 853 61 368 853 48 511 664 50 937 247 53 484 109
Sustainable Services Electricity 28 645 570 40 669 515 49 750 038 49 750 038 76 163 335 79 971 502 83 970 077
Sustainable Services Waste Management 164 739 205 45 884 345 41 357 838 41 357 838 105 441 452 110 713 524 116 249 200
Sustainable Services Health 110 185 180 500 174 500 174 500 115 694 121 479 127 553
Social Development Community & Social services 398 133 3 647 660 386 828 386 828 418 040 438 942 460 889
Social Development Sports & Recreation 55 755 67 000 80 260 80 260 58 542 61 470 64 543
Infrastructure Roads & Stormwater 16 313 032 15 746 000 13 314 109 13 314 109 0 0 0
Infrastructure Housing 1 973 974 55 000 260 000 260 000 2 077 673 2 181 556 2 290 634
Good Governance Executive & Council 29 361 324 17 522 024 19 480 882 19 480 882 7 163 550 7 521 728 7 897 814
Good Governance Financial Management & Admin 49 248 417 48 359 811 54 468 221 54 468 221 53 056 657 55 709 490 58 494 964
Environmental Management Environmental protection 0 0 0 0 0 0 0
Safety & Security Public Safety, Fire & Rescue 195 546 150 000 207 000 207 000 205 323 215 589 226 368
TOTAL OPERATING REVENUE 318 085 169 236 341 287 240 848 530 240 848 530 293 211 929 307 872 526 323 266 152

Preceding Year Current Year Medium Term Revenue and Expenditure Framework
SUPPORTING TABLE 2 2007/08 2008/09 Budget Year Budget Year +1 Budget Year +2
2009/10 2010/11 2011/12
RECONCILIATION OF IDP & BUDGET - OPEX Audited Actual Approved Budget Adjusted Budget Full Year Forecast Budget Budget Budget
Strategic Objective Action Plan A B C D E F G
Sustainable Services Water -24 625 691 -25 519 904 -30 523 549 -30 523 549 -28 204 722 -29 614 958 -31 095 706
Sustainable Services Electricity -26 737 653 -33 877 631 -37 190 559 -37 190 559 -41 732 146 -43 818 753 -46 009 691
Sustainable Services Waste Management -25 980 258 -33 011 485 -37 959 629 -37 959 629 -40 523 590 -42 549 770 -44 677 258
Sustainable Services Health -152 588 -185 500 -185 500 -185 500 0 0 0
Social Development Community & Social services -4 928 494 -7 630 458 -4 626 964 -4 626 964 -8 030 120 -8 423 957 -8 845 155
Social Development Sports & Recreation -6 272 719 -8 115 064 -8 438 082 -8 438 082 -8 944 582 -9 391 811 -9 861 402
Infrastructure Roads & Stormwater -12 926 971 -24 849 692 -17 727 316 -17 727 316 -26 202 412 -27 512 532 -28 888 159
Infrastructure Housing -2 476 033 -3 248 890 -2 579 459 -2 579 459 -3 467 469 -3 640 843 -3 822 885
Good Governance Executive & Council -33 551 652 -36 973 804 -38 839 736 -38 839 736 -44 262 836 -46 475 977 -48 799 776
Good Governance Financial Management & Admin -27 251 774 -25 606 979 -27 925 315 -27 925 315 -34 284 624 -35 998 855 -37 798 798
Environmental Management Environmental protection -1 819 -32 000 -32 000 -32 000 0 0 0
Safety & Security Public Safety, Fire & Rescue -3 618 508 -4 418 071 -4 187 686 -4 187 686 -4 739 175 -4 976 134 -5 224 941
Other Other -2 017 408 -1 738 343 0 0 -2 773 601 -2 912 281 -3 057 895
TOTAL OPERATING EXPENDITURE -170 275 417 -205 207 820 -210 215 795 -210 215 795 -243 165 278 -255 315 873 -268 081 667

Preceding Year Current Year Medium Term Revenue and Expenditure Framework
SUPPORTING TABLE 3 2007/08 2008/09 Budget Year Budget Year +1 Budget Year +2
2009/10 2010/11 2011/12
RECONCILIATION OF IDP & BUDGET - CAPEX Audited Actual Approved Budget Adjusted Budget Full Year Forecast Budget Budget Budget
Strategic Objective Action Plan A B C D E F G
Sustainable Services Water -129 103.6 -15 870 000.0 -15 870 000.0 -15 870 000 -44 602 000.0 -46 832 100.0 -49 173 705.0
Sustainable Services Electricity -8 050.0 -2 200 000.0 -2 200 000.0 -2 200 000 0.0 0.0 0.0
Sustainable Services Waste Management -222 766.9 -4 737 000.0 -4 737 000.0 -4 737 000 -2 240 000.0 -2 352 000.0 -2 469 600.0
Sustainable Services Health 0.0 0.0 0.0 0 0.0 0.0 0.0
Social Development Community & Social services -12 565.0 -160 000.0 -160 000.0 -160 000 0.0 0.0 0.0
Social Development Sports & Recreation 0.0 -3 500 000.0 -3 500 000.0 -3 500 000 0.0 0.0 0.0
Infrastructure Roads & Stormwater -47 938 -2 010 000 -2 010 000 -2 010 000 -1 600 000 -1 680 000 -1 764 000
Infrastructure Housing 0.0 0.0 0.0 0 0.0 0.0 0.0
Good Governance Executive & Council -813 341 -370 000 -250 000 -250 000 -1 170 000 -1 228 500 -1 289 925
Good Governance Financial Management & Admin -250 371.3 -1 700 000.0 -1 700 000.0 -1 700 000 -429 000.0 -450 450.0 -472 972.5
Environmental Management Environmental protection 0.0 0.0 0.0 0 0.0 0.0 0.0
Safety & Security Public Safety, Fire & Rescue 0.0 0.0 0.0 0 0.0 0.0 0.0
Other Other 0.0 0.0 0.0 0 0.0 0.0 0.0
TOTAL CAPITAL EXPENDITURE -1 484 136 -30 547 000 -30 427 000 -30 427 000 -50 041 000 -52 543 050 -55 170 203

Preceding Year Current Year Medium Term Revenue and Expenditure Framework
SUPPORTING TABLE 4 2007/08 2008/09 Budget Year Budget Year +1 Budget Year +2
2009/10 2010/11 2011/12
INVESTMENT PARTICULARS BY TYPE Audited Actual Approved Budget Adjusted Budget Full Year Forecast Budget Budget Budget
A B C D E F G
Investment Type
Securities - National Government
Listed Corporate Bonds
Deposits - Banks
Deposits - Public Investment Commissioners
Deposits - Corporation for Public Deposits
Bankers Acceptance Certificates
Negotiable Certificate of Deposit - Banks
Guaranteed Endowment Policies (sinking funds)
Repurchase Agreements - Banks
Municipal Bonds
Other 7 970 774 7 970 774 7 970 774 7 970 774 7 970 774 8 369 312.68 8 787 778.31
TOTAL INVESTMENTS 7970773.98 7970773.98 7970773.98 7970773.98 7970773.98 8369312.679 8787778.313

SUPPORTING TABLE 4a Period of Type of Expiry date Monetary Interest to be
Investment Investment of Investment Value Realised
INVESTMENT PARTICULARS BY MATURITY R'000 R'000
Name of Institution / Investment ID
ABSA Housing collateral N/A 20 032
FNB Housing collateral N/A 17 095
FNB Business Money Market N/A 1 049 450
FNB Call account / Savings accountN/A 5 929 260
SANLAM Overdraft facility N/A 352 269
SANLAM Redemption fund N/A 323 798
SANLAM Shares N/A 172 560
EASTERN FS CO-OPERATION Shares N/A 67 682
EASTERN FS CO-OPERATION Members fund N/A 38 601
Taurus shares Shares 26
TOTAL 7 970 774
NB: Please take note that the above amounts have been stated as at 30 June 2008 and have then been audited. The movement in terms of growth
shall be taken into account when the financial statements for the 2008/09 are prepared.

Preceding Year Current Year Medium Term Revenue and Expenditure Framework
SUPPORTING TABLE 5 2007/08 2008/09 Budget Year Budget Year +1 Budget Year +2
2009/10 2010/11 2011/12
GOVERNMENT GRANTS & SUBSIDIES - ALLOCATIONS1
Audited Actual Approved Budget Adjusted Budget Full Year Forecast Budget Budget Budget
A B C D E F G
National Grant Allocations2
1. Equitable share 64 635 000.00 79 416 000.00 81 654 577.00 81 654 577.00 105 206 000.00 130 421 000.00 142 422 000.00
2. Municipal infrastructure grant 132 268 624.00 29 563 000.00 29 563 000.00 29 563 000.00 46 742 000.00 55 004 000.00 47 222 000.00
3. Financial management grant 500 000.00 500 000.00 500 000.00 500 000.00 750 000.00 1 000 000.00 1 250 000.00
Sub Total - National Grant Allocations 197 403 624.00 109 479 000.00 111 717 577.00 111 717 577.00 152 698 000.00 186 425 000.00 190 894 000.00
Provincial Grant Allocations2
1. Municipal systems improvement grant 734 000.00 735 000.00 734 000.00 734 000.00 735 000.00 750 000.00 840 000.00
2. Department of Health 100 285.00 164 500.00 164 500.00 164 500.00 105 299.00
3. Cleanest town program 178 368.00
Sub Total - Provincial Grant Allocations 834 285.00 899 500.00 1 076 868.00 898 500.00 840 299.00 750 000.00 840 000.00
Municipal Grant Allocations3
Thabo Mofutsanyane District Muncipality DC19 0.00 120 000.00 0.00
Sub Total - Municipal Grant Allocations 0.00 120 000.00 0.00 0.00 0.00 0.00 0.00
TOTAL GRANT ALLOCATIONS 198 237 909.00 110 498 500.00 112 794 445.00 112 616 077.00 153 538 299.00 187 175 000.00 191 734 000.00

SUPPORTING TABLE 8 Salary Social Allowances Performance Total
Contributions4 Bonuses Package
DISCLOSURE OF SALARIES, ALLOWANCES & BENEFITS Rand pa Rand ('000) pa Rand pa Rand ('000) pa Rand ('000) pa
Councillors
Mayor 361 286 48 146 145 656 555 088
Speaker 289 024 38 556 119 724 447 304
818 803 169 207 380 772 1 368 782
Other councillors 2 659 381 412 911 1 221 849 4 294 141
Officials of the Municipality
Municipal Manager (MM) 641 790 12 836 53 483 708 109
Chief Finance Officer 493 037 98 952 41 086 633 075
Director of Corporate Services 483 734 9 674 97 355 590 763
Director of Technical Services 505 255 10 106 101 686 617 047
Director of Community & Economic services 493 037 9 860 41 086 543 984
TOTAL COST OF REMUNERATION TO MUNICIPALITY 6 745 347 810 248 1 868 001 334 697 9 758 293TOTAL COST OF REMUNERATION TO MUNICIPALITY 6 745 347 810 248 1 868 001 334 697 9 758 293

Preceding Year Current Year Medium Term Revenue and Expenditure Framework
SUPPORTING TABLE 8a 2007/08 2008/09 Budget Year Budget Year +1 Budget Year +2
2009/10 2010/11 2011/12
SUMMARY OF TOTAL SALARIES, WAGES, ALLOWANCES etc Audited Actual Approved Budget Adjusted Budget Full Year Forecast Budget Budget Budget
A B C D E F G
Councillors (Political Office Bearers plus Other) 0 0Basic Salaries 4 318 684.00 3 850 074.00 4 587 299.20 3 850 074.00 4 828 736.00 5070172.8 5323681.44
Pension Contributions 483 849.00 577 521.00 445 639.30 577 521.00 469 094.00 492548.7 517176.135
Medical Aid Contributions 176 792.00 276 156.00 189 739.70 276 156.00 199 726.00 209712.3 220197.915
Allowances 1 703 697.00 1 480 928.00 1 774 600.95 1 480 928.00 1 868 001.00 1961401.05 2059471.103
Sub Total - Councillors 6 683 022.00 6 184 679.00 6 997 279.15 6 184 679.00 7 365 557.00 7 733 834.85 8 120 526.59
Senior Managers of the Municipality (s 57 of Systems Act)
Basic Salaries 3 889 580.00 2 063 029.50 2 063 029.50 2 063 029.50 2 616 853.00 2747695.65 2885080.433
Pension Contributions 195 214.95 195 214.95 195 214.95 89 092.00 93546.6 98223.93
Medical Aid Contributions 100 521.75 100 521.75 100 521.75 0 0
Allowances 794 286.00 747 124.35 747 124.35 747 124.35 0 0
Performance Bonus 670 816.00 182 227.50 182 227.50 182 227.50 334 696.00 351430.8 369002.34
Sub Total - Senior Managers of Municipality 5 354 682.00 3 288 118.05 3 288 118.05 3 288 118.05 3 040 641.00 3 192 673.05 3 352 306.70
Other Municipal Staff
Basic Salaries 45 908 809.00 37 354 232.50 50 582 865.46 37 354 232.50 53 811 559.00 56502136.95 59327243.8
Pension Contributions 9 064 825.00 6 482 091.05 8 174 447.74 6 482 091.05 8 696 221.00 9131032.05 9587583.653
Medical Aid Contributions 1 951 063.25 2 902 613.78 1 951 063.25 3 087 887.00 3242281.35 3404395.418
Allowances 3 575 399.00 5 207 833.65 3 680 896.18 5 207 833.65 3 915 847.00 4111639.35 4317221.318
Overtime 2 462 941.00 1 738 300.00 1 738 300.00 - 0 0
Performance Bonus 3 921 298.00 3 225 916.50 4 109 041.74 3 225 916.50 4 371 321.00 4589887.05 4819381.403
Sub Total - Other Municipal Staff 64 933 272.00 55 959 436.95 69 449 864.90 55 959 436.95 73 882 835.00 77 576 976.75 81 455 825.59
TOTAL EMPLOYEE COSTS 76 970 976.00 65 432 234.00 79 735 262.10 65 432 234.00 84 289 033.00 88 503 484.65 92 928 658.88

Preceding Year Current Year Medium Term Revenue and Expenditure Framework
SUPPORTING TABLE 8b 2007/08 2008/09 Budget Year Budget Year +1 Budget Year +2
2009/10 2010/11 2011/12
SUMMARY OF PERSONNEL NUMBERS Audited Actual Approved Budget Adjusted Budget Full Year Forecast Budget Budget Budget
(Full Time Equivalent) No. No. No. No. No. No. No.
A B C D E F G
Municipality
Councillors (Political Office Bearers plus Other) 33 33 33 33 33 33 33
Senior Managers including Municipal Manager (s 57 of Systems Act) 5 5 5 5 5 5 5
Other Managers
Technical / Professional Staff
Other Staff (clerical, labourers etc) 646 646 646 646 646 646 646
Sub Total - Municipality 684 684 684 684 684 684 684
Entities
Board Members
Senior Managers including CEO
Other Managers
Technical / Professional Staff
Other Staff (clerical, labourers etc)
Sub Total - EntitiesSub Total - Entities
TOTAL PERSONNEL NUMBERS 684 684 684 684 684 684 684

SUPPORTING TABLE 9 Budget Budget Budget Budget Budget Budget Budget Budget Budget Budget Budget Budget Budget Budget Budget
July August September October November December January February March April May June Full Year Full Year Full Year
MONTHLY CASH FLOWS 2009 2009 2009 2009 2009 2009 2010 2010 2010 2010 2010 2010 2009/10 2010/11 2011/12
Cash Operating Receipts by Source
Property rates 1 678 523.18 1 678 523.18 1 678 523.18 1 678 523.18 1 678 523.18 1 678 523.18 1 678 523.18 1 678 523.18 1 678 523.18 1 678 523.18 1 678 523.18 1 678 523.18 20 142 278.12 21 149 392.02 22 206 861.63
Property rates - penalties imposed and collection charges - - - - - - - - - - - - - - -
Service charges - electricity 3 353 026.61 3 353 026.61 3 353 026.61 3 353 026.61 3 353 026.61 3 353 026.61 3 353 026.61 3 353 026.61 3 353 026.61 3 353 026.61 3 353 026.61 3 353 026.61 40 236 319.32 42 248 135.29 44 360 542.05
Service charges - water 1 609 410.18 1 609 410.18 1 609 410.18 1 609 410.18 1 609 410.18 1 609 410.18 1 609 410.18 1 609 410.18 1 609 410.18 1 609 410.18 1 609 410.18 1 609 410.18 19 312 922.11 20 278 568.22 21 292 496.63
Service charges - sanitation 841 661.53 841 661.53 841 661.53 841 661.53 841 661.53 841 661.53 841 661.53 841 661.53 841 661.53 841 661.53 841 661.53 841 661.53 10 099 938.34 10 604 935.26 11 135 182.02
Service charges - refuse 1 125 835.79 1 125 835.79 1 125 835.79 1 125 835.79 1 125 835.79 1 125 835.79 1 125 835.79 1 125 835.79 1 125 835.79 1 125 835.79 1 125 835.79 1 125 835.79 13 510 029.46 14 185 530.93 14 894 807.48
Service charges - other 6 657.08 6 657.08 6 657.08 6 657.08 6 657.08 6 657.08 6 657.08 6 657.08 6 657.08 6 657.08 6 657.08 6 657.08 79 884.99 83 879.24 88 073.20
Regional Service Levies - turnover - - - - - - - - - - - - - - -
Regional Service Levies - remuneration - - - - - - - - - - - - - - -
Rental of facilities and equipment 46 540.98 46 540.98 46 540.98 46 540.98 46 540.98 46 540.98 46 540.98 46 540.98 46 540.98 46 540.98 46 540.98 46 540.98 558 491.79 586 416.38 615 737.20
Interest earned - external investments 244 358.15 244 358.15 244 358.15 244 358.15 244 358.15 244 358.15 244 358.15 244 358.15 244 358.15 244 358.15 244 358.15 244 358.15 2 932 297.76 3 078 912.65 3 232 858.28
Interest earned - outstanding debtors 1 262 537.30 1 262 537.30 1 262 537.30 1 262 537.30 1 262 537.30 1 262 537.30 1 262 537.30 1 262 537.30 1 262 537.30 1 262 537.30 1 262 537.30 1 262 537.30 15 150 447.64 15 907 970.02 16 703 368.52
Dividends received - - - - - - - - - - - - - - -
Fines 17 535.65 17 535.65 17 535.65 17 535.65 17 535.65 17 535.65 17 535.65 17 535.65 17 535.65 17 535.65 17 535.65 17 535.65 210 427.79 220 949.18 231 996.64
Licenses and permits 166.67 166.67 166.67 166.67 166.67 166.67 166.67 166.67 166.67 166.67 166.67 166.67 2 000.00 2 100.00 2 205.00
Income for agency services - - - - - - - - - - - - - - -
Grants - operating (incl. grants from other municipalities) - - - - - - - - - - - - - - -
Grants - capital (incl. grants from other municipalities) - - - - - - - - - - - - - - -
Etc (list each source) - - - - - - - - - - - -
Cash Operating Receipts by Source 10 186 253.11 10 186 253.11 10 186 253.11 10 186 253.11 10 186 253.11 10 186 253.11 10 186 253.11 10 186 253.11 10 186 253.11 10 186 253.11 10 186 253.11 10 186 253.11 122 235 037.31 128 346 789.18 134 764 128.64
Other Cash Receipts by Source
New Loans Raised - - - - - - - - - - - - - - -
Receipts from old outstanding debtors - - - - - - - - - - - - - - -
Etc (list each source)
Total Cash Receipts by Source - - - - - - - - - - - - - - -
Cash Operating Payments by Type
Employee related costs 6 410 289.67 6 410 289.67 6 410 289.67 6 410 289.67 6 410 289.67 6 410 289.67 6 410 289.67 6 410 289.67 6 410 289.67 6 410 289.67 6 410 289.67 6 410 289.67 76 923 476.00 80 769 649.80 84 808 132.29
Remuneration of Councillors 613 796.46 613 796.46 613 796.46 613 796.46 613 796.46 613 796.46 613 796.46 613 796.46 613 796.46 613 796.46 613 796.46 613 796.46 7 365 557.47 7 733 835.34 8 120 527.11
Collection costs 666.67 666.67 666.67 666.67 666.67 666.67 666.67 666.67 666.67 666.67 666.67 666.67 8 000.00 8 400.00 8 820.00
Repairs and maintenance 1 845 397.42 1 845 397.42 1 845 397.42 1 845 397.42 1 845 397.42 1 845 397.42 1 845 397.42 1 845 397.42 1 845 397.42 1 845 397.42 1 845 397.42 1 845 397.42 22 144 769.07 23 252 007.52 24 414 607.90
Interest paid 1 018 394.63 1 018 394.63 1 018 394.63 1 018 394.63 1 018 394.63 1 018 394.63 1 018 394.63 1 018 394.63 1 018 394.63 1 018 394.63 1 018 394.63 1 018 394.63 12 220 735.62 12 831 772.40 13 473 361.02
Bulk purchases - Electricity 2 015 507.81 2 015 507.81 2 015 507.81 2 015 507.81 2 015 507.81 2 015 507.81 2 015 507.81 2 015 507.81 2 015 507.81 2 015 507.81 2 015 507.81 2 015 507.81 24 186 093.75 25 395 398.44 26 665 168.36
Bulk purchases - Water - - - - - - - - - - - - - - -
Bulk purchases - Sewer - - - - - - - - - - - - - - -
Contracted services - - - - - - - - - - - - - - -
Grants and subsidies paid - other municipalities 1 000 000.00 1 000 000.00 1 000 000.00 1 000 000.00 1 000 000.00 1 000 000.00 1 000 000.00 1 000 000.00 1 000 000.00 1 000 000.00 1 000 000.00 1 000 000.00 12 000 000.00 12 600 000.00 13 230 000.00Grants and subsidies paid - other municipalities 1 000 000.00 1 000 000.00 1 000 000.00 1 000 000.00 1 000 000.00 1 000 000.00 1 000 000.00 1 000 000.00 1 000 000.00 1 000 000.00 1 000 000.00 1 000 000.00 12 000 000.00 12 600 000.00 13 230 000.00
Grants and subsidies paid - other - - - - - - - - - - - - - - -
Etc (list each type) - - - - - - - - - - - - - - -
Cash Operating Payments by Type 12 904 052.66 12 904 052.66 12 904 052.66 12 904 052.66 12 904 052.66 12 904 052.66 12 904 052.66 12 904 052.66 12 904 052.66 12 904 052.66 12 904 052.66 12 904 052.66 154 848 631.90 162 591 063.50 170 720 616.67
Other Cash Payments by Type
Capital Expenditure - - - - - - - - - - - - - - -
Loans repaid - - - - - - - - - - - - - - -
Etc (list each source) - - - - - - - - - - - - - - -
Total Cash Payments by Type - - - - - - - - - - - - - - -
NET INCREASE / (DECREASE) IN CASH & INVESTMENTS -2 717 799.55 -2 717 799.55 -2 717 799.55 -2 717 799.55 -2 717 799.55 -2 717 799.55 -2 717 799.55 -2 717 799.55 -2 717 799.55 -2 717 799.55 -2 717 799.55 -2 717 799.55 -32 613 594.59 -34 244 274.32 -35 956 488.04

F2.1 - HIGH LEVEL BUDGET SUMMARY FOR COUNCIL ADOPTION
Function 2009/10
Appropriations Funding Surplus /
Capital Operating Total Own Source External Total (Deficit)
Executive & Council (1 170 000) (44 262 836) (45 432 836) 221 550 6 942 000 7 163 550 (38 269 286)
Finance & Admin (429 000) (34 284 624) (34 713 624) 51 877 657 1 179 000 53 056 657 18 343 033
Planning and Development 0 0 0 0 0 0 0
Health 0 0 0 10 395 105 299 115 694 115 694
Community & Social Services 0 (8 030 120) (8 030 120) 418 040 0 418 040 (7 612 080)
Housing 0 (3 467 469) (3 467 469) 2 077 673 0 2 077 673 (1 389 796)
Public Safety 0 (4 739 175) (4 739 175) 205 323 0 205 323 (4 533 853)
Sport & Recreation 0 (8 944 582) (8 944 582) 58 542 0 58 542 (8 886 040)
Environmental Health 0 0 0 0 0 0 0
Waste Management (2 240 000) (40 523 590) (42 763 590) 23 691 352 81 750 100 105 441 452 62 677 861
Road Transport (1 600 000) (26 202 412) (27 802 412) 0 0 0 (27 802 412)
Water (44 602 000) (28 204 722) (72 806 722) 19 449 264 29 062 400 48 511 664 (24 295 059)
Electricity 0 (41 732 146) (41 732 146) 41 663 835 34 499 500 76 163 335 34 431 189
Other 0 (2 773 601) (2 773 601) 0 0 0 (2 773 601)
TOTAL (50 041 000) (243 165 278) (293 206 278) 139 673 630 153 538 299 293 211 929 5 651

F2.1 - HIGH LEVEL BUDGET SUMMARY FOR COUNCIL ADOPTION
Function 2009/10
Appropriations Funding Surplus /
Capital Operating Total Own Source External Total (Deficit)
Executive & Council (1 170 000) (44 262 836) (45 432 836) 221 550 6 942 000 7 163 550 (38 269 286)
Operating (1 170 000) (44 262 836) (45 432 836) 221 550 6 942 000 7 163 550 (38 269 286)
Capital 0 0 0
Finance & Admin (429 000) (34 284 624) (34 713 624) 51 877 657 1 179 000 53 056 657 18 343 033
Operating (429 000) (34 284 624) (34 713 624) 51 877 657 1 179 000 53 056 657 18 343 033
Capital 0 0 0
Planning and Development 0 0 0 0 0 0 0
Operating 0 0 0 0 0 0 0
Capital 0 0 0
Health 0 0 0 10 395 105 299 115 694 115 694
Operating 0 0 0 10 395 105 299 115 694 115 694
Capital 0 0 0
Community & Social Services 0 (8 030 120) (8 030 120) 418 040 0 418 040 (7 612 080)
Operating 0 (8 030 120) (8 030 120) 418 040 0 418 040 (7 612 080)Operating 0 (8 030 120) (8 030 120) 418 040 0 418 040 (7 612 080)
Capital 0 0 0
Housing 0 (3 467 469) (3 467 469) 2 077 673 0 2 077 673 (1 389 796)
Operating 0 (3 467 469) (3 467 469) 2 077 673 0 2 077 673 (1 389 796)
Capital 0 0 0
Public Safety 0 (4 739 175) (4 739 175) 205 323 0 205 323 (4 533 853)
Operating 0 (4 739 175) (4 739 175) 205 323 0 205 323 (4 533 853)
Capital 0 0 0
Sport & Recreation 0 (8 944 582) (8 944 582) 58 542 0 58 542 (8 886 040)
Operating 0 (8 944 582) (8 944 582) 58 542 0 58 542 (8 886 040)
Capital 0 0 0
Environmental Health 0 0 0 0 0 0 0
Operating 0 0 0 0 0 0 0
Capital 0 0 0
Wastr Management (2 240 000) (40 523 590) (42 763 590) 23 691 352 81 750 100 105 441 452 62 677 861
Operating (2 240 000) (40 523 590) (42 763 590) 23 691 352 81 750 100 105 441 452 62 677 861
Capital 0 0 0
Road Transport (1 600 000) (26 202 412) (27 802 412) 0 0 0 (27 802 412)
Operating (1 600 000) (26 202 412) (27 802 412) 0 0 0 (27 802 412)
Capital 0 0 0
Water (44 602 000) (28 204 722) (72 806 722) 19 449 264 29 062 400 48 511 664 (24 295 059)
Operating (44 602 000) (28 204 722) (72 806 722) 19 449 264 29 062 400 48 511 664 (24 295 059)
Capital 0 0 0
Electricity 0 (41 732 146) (41 732 146) 41 663 835 34 499 500 76 163 335 34 431 189
Operating 0 (41 732 146) (41 732 146) 41 663 835 34 499 500 76 163 335 34 431 189
Capital 0 0 0
Other 0 (2 773 601) (2 773 601) 0 0 0 (2 773 601)
Operating 0 (2 773 601) (2 773 601) 0 0 0 (2 773 601)Capital 0 0 0
TOTAL (50 041 000) (243 165 278) (293 206 278) 139 673 630 153 538 299 293 211 929 5 651

F2.1 - HIGH LEVEL BUDGET SUMMARY FOR COUNCIL ADOPTION
Function 2009/10 2010/11 2011/12
Appropriations Funding Surplus / Appropriations Funding Surplus / Appropriations Funding Surplus /
Capital Operating Total Own Source External Total (Deficit) Capital Operating Total Own Source External Total (Deficit) Capital Operating Total Own Source External Total (Deficit)
Executive & Council (1 170 000) (44 262 836) (45 432 836) 221 550 6 942 000 7 163 550 (38 269 286) (1 228 500) (46 475 977) (47 704 477) 232 628 7 289 100 7 521 728 (40 182 750) (1 289 925) (48 799 776) (50 089 701) 244 259 7 653 555 7 897 814 (42 191 887)
Finance & Admin (429 000) (34 284 624) (34 713 624) 51 877 657 1 179 000 53 056 657 18 343 033 (450 450) (35 998 855) (36 449 305) 54 471 540 1 237 950 55 709 490 19 260 184 (472 973) (37 798 798) (38 271 770) 57 195 117 1 299 848 58 494 964 20 223 194
Planning and Development 0 0 0 0 0 0 0 0 0 0 0 0 0 0 0 0 0 0 0 0 0
Health 0 0 0 10 395 105 299 115 694 115 694 0 0 0 10 915 110 564 121 479 121 479 0 0 0 11 460 116 092 127 553 127 553
Community & Social Services 0 (8 030 120) (8 030 120) 418 040 0 418 040 (7 612 080) 0 (8 423 957) (8 423 957) 438 942 0 438 942 (7 985 015) 0 (8 845 155) (8 845 155) 460 889 0 460 889 (8 384 266)
Housing 0 (3 467 469) (3 467 469) 2 077 673 0 2 077 673 (1 389 796) 0 (3 640 843) (3 640 843) 2 181 556 0 2 181 556 (1 459 286) 0 (3 822 885) (3 822 885) 2 290 634 0 2 290 634 (1 532 250)
Public Safety 0 (4 739 175) (4 739 175) 205 323 0 205 323 (4 533 853) 0 (4 976 134) (4 976 134) 215 589 0 215 589 (4 760 545) 0 (5 224 941) (5 224 941) 226 368 0 226 368 (4 998 572)
Sport & Recreation 0 (8 944 582) (8 944 582) 58 542 0 58 542 (8 886 040) 0 (9 391 811) (9 391 811) 61 470 0 61 470 (9 330 342) 0 (9 861 402) (9 861 402) 64 543 0 64 543 (9 796 859)
Environmental Health 0 0 0 0 0 0 0 0 0 0 0 0 0 0 0 0 0 0 0 0 0
Waste Management (2 240 000) (40 523 590) (42 763 590) 23 691 352 81 750 100 105 441 452 62 677 861 (2 352 000) (42 549 770) (44 901 770) 24 875 919 85 837 605 110 713 524 65 811 754 (2 469 600) (44 677 258) (47 146 858) 26 119 715 90 129 485 116 249 200 69 102 342
Road Transport (1 600 000) (26 202 412) (27 802 412) 0 0 0 (27 802 412) (1 680 000) (27 512 532) (29 192 532) 0 0 0 (29 192 532) (1 764 000) (28 888 159) (30 652 159) 0 0 0 (30 652 159)
Water (44 602 000) (28 204 722) (72 806 722) 19 449 264 29 062 400 48 511 664 (24 295 059) (46 832 100) (29 614 958) (76 447 058) 20 421 727 30 515 520 50 937 247 (25 509 812) (49 173 705) (31 095 706) (80 269 411) 21 442 813 32 041 296 53 484 109 (26 785 302)
Electricity 0 (41 732 146) (41 732 146) 41 663 835 34 499 500 76 163 335 34 431 189 0 (43 818 753) (43 818 753) 43 747 027 36 224 475 79 971 502 36 152 748 0 (46 009 691) (46 009 691) 45 934 378 38 035 699 83 970 077 37 960 386
Other 0 (2 773 601) (2 773 601) 0 0 0 (2 773 601) 0 (2 912 281) (2 912 281) 0 0 0 (2 912 281) 0 (3 057 895) (3 057 895) 0 0 0 (3 057 895)
TOTAL (50 041 000) (243 165 278) (293 206 278) 139 673 630 153 538 299 293 211 929 5 651 (52 543 050) (255 315 873) (307 858 923) 146 657 312 161 215 214 307 872 526 13 603 (55 170 203) (268 081 667) (323 251 869) 153 990 177 169 275 975 323 266 152 14 283

F2.1 - HIGH LEVEL BUDGET SUMMARY FOR COUNCIL ADOPTION
Function 2009/10 2010/11 2011/12
Appropriations Funding Surplus / Appropriations Funding Surplus / Appropriations Funding Surplus /
Capital Operating Total Own Source External Total (Deficit) Capital Operating Total Own Source External Total (Deficit) Capital Operating Total Own Source External Total (Deficit)
Executive & Council (1 170 000) (44 262 836) (45 432 836) 221 550 6 942 000 7 163 550 (38 269 286) (1 228 500) (46 475 977) (47 704 477) 232 628 7 289 100 7 521 728 (40 182 750) (1 289 925) (48 799 776) (50 089 701) 244 259 7 653 555 7 897 814 (42 191 887)Operating (1 170 000) (44 262 836) (45 432 836) 221 550 6 942 000 7 163 550 (38 269 286) (1 228 500) (46 475 977) (47 704 477) 232 628 7 289 100 7 521 728 (40 182 750) (1 289 925) (48 799 776) (50 089 701) 244 259 7 653 555 7 897 814 (42 191 887)Capital 0 0 0 0 0 0 0 0 0Finance & Admin (429 000) (34 284 624) (34 713 624) 51 877 657 1 179 000 53 056 657 18 343 033 (450 450) (35 998 855) (36 449 305) 54 471 540 1 237 950 55 709 490 19 260 184 (472 973) (37 798 798) (38 271 770) 57 195 117 1 299 848 58 494 964 20 223 194Operating (429 000) (34 284 624) (34 713 624) 51 877 657 1 179 000 53 056 657 18 343 033 (450 450) (35 998 855) (36 449 305) 54 471 540 1 237 950 55 709 490 19 260 184 (472 973) (37 798 798) (38 271 770) 57 195 117 1 299 848 58 494 964 20 223 194Capital 0 0 0 0 0 0 0 0 0Planning and Development 0 0 0 0 0 0 0 0 0 0 0 0 0 0 0 0 0 0 0 0 0Operating 0 0 0 0 0 0 0 0 0 0 0 0 0 0 0 0 0 0 0 0 0Capital 0 0 0 0 0 0 0 0 0Health 0 0 0 10 395 105 299 115 694 115 694 0 0 0 10 915 110 564 121 479 121 479 0 0 0 11 460 116 092 127 553 127 553Operating 0 0 0 10 395 105 299 115 694 115 694 0 0 0 10 915 110 564 121 479 121 479 0 0 0 11 460 116 092 127 553 127 553Capital 0 0 0 0 0 0 0 0 0Capital 0 0 0 0 0 0 0 0 0Community & Social Services 0 (8 030 120) (8 030 120) 418 040 0 418 040 (7 612 080) 0 (8 423 957) (8 423 957) 438 942 0 438 942 (7 985 015) 0 (8 845 155) (8 845 155) 460 889 0 460 889 (8 384 266)Operating 0 (8 030 120) (8 030 120) 418 040 0 418 040 (7 612 080) 0 (8 423 957) (8 423 957) 438 942 0 438 942 (7 985 015) 0 (8 845 155) (8 845 155) 460 889 0 460 889 (8 384 266)Capital 0 0 0 0 0 0 0 0 0Housing 0 (3 467 469) (3 467 469) 2 077 673 0 2 077 673 (1 389 796) 0 (3 640 843) (3 640 843) 2 181 556 0 2 181 556 (1 459 286) 0 (3 822 885) (3 822 885) 2 290 634 0 2 290 634 (1 532 250)Operating 0 (3 467 469) (3 467 469) 2 077 673 0 2 077 673 (1 389 796) 0 (3 640 843) (3 640 843) 2 181 556 0 2 181 556 (1 459 286) 0 (3 822 885) (3 822 885) 2 290 634 0 2 290 634 (1 532 250)Capital 0 0 0 0 0 0 0 0 0Public Safety 0 (4 739 175) (4 739 175) 205 323 0 205 323 (4 533 853) 0 (4 976 134) (4 976 134) 215 589 0 215 589 (4 760 545) 0 (5 224 941) (5 224 941) 226 368 0 226 368 (4 998 572)Operating 0 (4 739 175) (4 739 175) 205 323 0 205 323 (4 533 853) 0 (4 976 134) (4 976 134) 215 589 0 215 589 (4 760 545) 0 (5 224 941) (5 224 941) 226 368 0 226 368 (4 998 572)Capital 0 0 0 0 0 0 0 0 0Sport & Recreation 0 (8 944 582) (8 944 582) 58 542 0 58 542 (8 886 040) 0 (9 391 811) (9 391 811) 61 470 0 61 470 (9 330 342) 0 (9 861 402) (9 861 402) 64 543 0 64 543 (9 796 859)Operating 0 (8 944 582) (8 944 582) 58 542 0 58 542 (8 886 040) 0 (9 391 811) (9 391 811) 61 470 0 61 470 (9 330 342) 0 (9 861 402) (9 861 402) 64 543 0 64 543 (9 796 859)
Capital 0 0 0 0 0 0 0 0 0Environmental Health 0 0 0 0 0 0 0 0 0 0 0 0 0 0 0 0 0 0 0 0 0Operating 0 0 0 0 0 0 0 0 0 0 0 0 0 0 0 0 0 0 0 0 0Capital 0 0 0 0 0 0 0 0 0Wastr Management (2 240 000) (40 523 590) (42 763 590) 23 691 352 81 750 100 105 441 452 62 677 861 (2 352 000) (42 549 770) (44 901 770) 24 875 919 85 837 605 110 713 524 65 811 754 (2 469 600) (44 677 258) (47 146 858) 26 119 715 90 129 485 116 249 200 69 102 342Operating (2 240 000) (40 523 590) (42 763 590) 23 691 352 81 750 100 105 441 452 62 677 861 (2 352 000) (42 549 770) (44 901 770) 24 875 919 85 837 605 110 713 524 65 811 754 (2 469 600) (44 677 258) (47 146 858) 26 119 715 90 129 485 116 249 200 69 102 342Capital 0 0 0 0 0 0 0 0 0Road Transport (1 600 000) (26 202 412) (27 802 412) 0 0 0 (27 802 412) (1 680 000) (27 512 532) (29 192 532) 0 0 0 (29 192 532) (1 764 000) (28 888 159) (30 652 159) 0 0 0 (30 652 159)Operating (1 600 000) (26 202 412) (27 802 412) 0 0 0 (27 802 412) (1 680 000) (27 512 532) (29 192 532) 0 0 0 (29 192 532) (1 764 000) (28 888 159) (30 652 159) 0 0 0 (30 652 159)Capital 0 0 0 0 0 0 0 0 0Water (44 602 000) (28 204 722) (72 806 722) 19 449 264 29 062 400 48 511 664 (24 295 059) (46 832 100) (29 614 958) (76 447 058) 20 421 727 30 515 520 50 937 247 (25 509 812) (49 173 705) (31 095 706) (80 269 411) 21 442 813 32 041 296 53 484 109 (26 785 302)Operating (44 602 000) (28 204 722) (72 806 722) 19 449 264 29 062 400 48 511 664 (24 295 059) (46 832 100) (29 614 958) (76 447 058) 20 421 727 30 515 520 50 937 247 (25 509 812) (49 173 705) (31 095 706) (80 269 411) 21 442 813 32 041 296 53 484 109 (26 785 302)Capital 0 0 0 0 0 0 0 0 0Electricity 0 (41 732 146) (41 732 146) 41 663 835 34 499 500 76 163 335 34 431 189 0 (43 818 753) (43 818 753) 43 747 027 36 224 475 79 971 502 36 152 748 0 (46 009 691) (46 009 691) 45 934 378 38 035 699 83 970 077 37 960 386Operating 0 (41 732 146) (41 732 146) 41 663 835 34 499 500 76 163 335 34 431 189 0 (43 818 753) (43 818 753) 43 747 027 36 224 475 79 971 502 36 152 748 0 (46 009 691) (46 009 691) 45 934 378 38 035 699 83 970 077 37 960 386Capital 0 0 0 0 0 0 0 0 0Other 0 (2 773 601) (2 773 601) 0 0 0 (2 773 601) 0 (2 912 281) (2 912 281) 0 0 0 (2 912 281) 0 (3 057 895) (3 057 895) 0 0 0 (3 057 895)Operating 0 (2 773 601) (2 773 601) 0 0 0 (2 773 601) 0 (2 912 281) (2 912 281) 0 0 0 (2 912 281) 0 (3 057 895) (3 057 895) 0 0 0 (3 057 895)Capital 0 0 0 0 0 0 0 0 0
TOTAL (50 041 000) (243 165 278) (293 206 278) 139 673 630 153 538 299 293 211 929 5 651 (52 543 050) (255 315 873) (307 858 923) 146 657 312 161 215 214 307 872 526 13 603 (55 170 203) (268 081 667) (323 251 869) 153 990 177 169 275 975 323 266 152 14 283

F3 - OPERATING INCOME & EXPENDITURE BY FUNCTIONAL CLASSIFICATION (Summary Report)
2007/2008
DETAIL Executive &
Council
Finance &
Admin
Planning &
Development
Health Community&
Social ServicesHousing Public
Safety
Sport &
Recreation
Environmental
Health
Waste
Management
Road
Transport
Water Electricity Other Total
-1- -2- -3- -4- -5- -6- -7- -8- -9- -10- -11- -12- -13- -14-1 INCOME
2 PROPERTY RATES 0 22 814 808 0 0 0 0 0 0 0 0 0 0 0 0 22 814 808
3 PLUS PENALTIES IMPOSED 0 0 0 0 0 0 0 0 0 0 0 0 0 0 0
4 USER CHARGES FOR SERVICES 0 49 351 0 0 0 0 0 51 501 0 26 496 835 0 16 295 318 24 332 856 0 67 225 861
5 REGIONAL SERVICE LEVIES - Turnover 0 0 0 0 0 0 0 0 0 0 0 0 0 0 0
6 REGIONAL SERVICE LEVIES - Remuneration 0 0 0 0 0 0 0 0 0 0 0 0 0 0 0
7 RENT OF FACILITIES AND EQUIPMENT 0 468 254 0 9 900 49 489 0 0 4 254 0 0 684 0 17 064 0 549 645
8 INTEREST EARNED - EXTERNAL INVESTMENTS 0 2 665 725 0 0 0 0 0 0 0 0 0 0 0 0 2 665 725
9 INTEREST EARNED - OUTSTANDING DEBTORS 0 14 428 998 0 0 0 0 0 0 0 0 0 0 0 0 14 428 998
10 DIVIDENDS RECEIVED - EXTERNAL ENTITIES 0 0 0 0 0 0 0 0 0 0 0 0 0 0 0
11 FINES 0 0 0 0 4 862 0 195 546 0 0 0 0 0 0 0 200 407
12 LICENSES & PERMITS 430 0 0 0 0 0 0 0 0 0 0 0 0 0 430
13 INCOME FOR AGENCY SERVICES 0 0 0 0 0 0 0 0 0 0 0 0 0 0 0
14 OPERATING GRANTS & SUBSIDIES (agrees to line 18 of F4.1) 29 126 133 938 185 0 100 285 0 0 0 0 0 138 164 861 16 311 724 10 660 610 2 936 110 0 198 237 909
15 OTHER INCOME 234 761 490 224 0 0 343 782 1 973 974 14 924 0 10 795 77 508 624 213 092 1 397 333 0 4 757 018
16 SURPLUS ON SALE OF ASSETS (GAMAP to add) 28 838 0 0 0 0 0 55 173 0 29 848 0 132 786 0 0 0 246 644
17 OPERATING INCOME GENERATED 29 390 161 41 855 546 0 110 185 398 133 1 973 974 265 642 55 755 40 643 164 739 205 16 445 818 27 169 020 28 683 364 0 311 127 446
18 LESS INCOME FOREGONE (agrees to line 81 on F8) 0 (27 312) 0 0 0 0 0 0 0 0 0 0 0 0 (27 312)
19 DIRECT OPERATING INCOME 29 390 161 41 828 235 0 110 185 398 133 1 973 974 265 642 55 755 40 643 164 739 205 16 445 818 27 169 020 28 683 364 0 311 100 134
20 INTERNAL TRANSFERS – (the items below must net out with the corresponding items under expenditure) 0 0 0 0 0 0 0 0 0 0 0 0 0 0 0
21 INTEREST RECEIVED - INTERNAL LOANS 0 0 0 0 0 0 0 0 0 0 0 0 0 0 0
22 REDEMPTION RECEIVED - INTERNAL LOANS (GAMAP to remove) 0 0 0 0 0 0 0 0 0 0 0 0 0 0 0
23 INTERNAL RECOVERIES (Activity Based Costing etc) 0 6 985 035 0 0 0 0 0 0 0 0 0 0 0 0 6 985 035
24 DIVIDENDS RECEIVED - INTERNAL (from Municipal Entities) 0 0 0 0 0 0 0 0 0 0 0 0 0 0 0
25 TOTAL OPERATING INCOME 29 390 161 48 813 270 0 110 185 398 133 1 973 974 265 642 55 755 40 643 164 739 205 16 445 818 27 169 020 28 683 364 0 318 085 169
26 EXPENDITURE
27 EMPLOYEE RELATED COSTS - WAGES & SALARIES (8 183 837) (12 893 558) 0 0 (2 807 624) (1 372 482) (2 593 907) (3 772 745) 0 (11 845 493) (5 538 482) (3 248 267) (1 821 489) (1 790 564) (55 868 447)
28 EMPLOYEE RELATED COSTS - SOCIAL CONTRIBUTIONS (523 026) (2 344 842) 0 0 (576 830) (282 571) (426 751) (811 385) 0 (2 016 556) (981 302) (643 177) (332 258) (116 129) (9 054 825)
29 LESS EMPLOYEE COSTS CAPITALISED 0 0 0 0 0 0 0 0 0 0 0 0 0 0 029 LESS EMPLOYEE COSTS CAPITALISED 0 0 0 0 0 0 0 0 0 0 0 0 0 0 0
30 LESS EMPLOYEE COSTS ALLOCATED TO OTHER OPERATING ITEMS 0 0 0 0 0 0 0 0 0 0 0 0 0 0 0
31 REMUNERATION OF COUNCILLORS (6 505 023) 0 0 0 0 0 0 0 0 0 0 0 0 0 (6 505 023)
32 WORKING CAPITAL RESERVE (1 940 000) 0 0 0 0 0 0 0 0 (1 500 000) 0 (7 337 261) (983 314) 0 (11 760 575)
33 COLLECTION COSTS 0 0 0 0 0 0 0 0 0 0 0 0 0 0 0
34 DEPRECIATION (GAMAP to add) (28 529) (2 648 263) 0 (42 269) (91 892) (209 182) (56 071) (315 672) 0 (5 173 513) (2 190 988) (4 187 554) (620 099) 0 (15 564 032)
35 REPAIRS AND MAINTENANCE - MUNICIPAL ASSETS (agrees to line 41 for Prog Maint on F5.3)(73 433) (492 826) 0 (543) (237 429) (106 470) (287 206) (436 322) (752) (1 018 933) (1 865 990) (1 598 560) (891 388) 0 (7 009 852)
36 INTEREST EXPENSE - EXTERNAL BORROWINGS (827 305) (1 481 223) 0 (857) (3 461) (10 242) (15 283) (12 226) (1 067) (419 443) (431 871) (907 840) (543 930) 0 (4 654 748)
37 REDEMPTION PAYMENTS - EXTERNAL BORROWINGS (GAMAP to remove) 0 0 0 0 0 0 0 0 0 0 0 0 0 0 0
38 BULK PURCHASES 0 0 0 0 0 0 0 0 0 0 0 0 (14 775 478) 0 (14 775 478)
39 CONTRACTED SERVICES 0 0 0 0 0 0 0 0 0 0 0 0 0 0 0
40 GRANTS & SUBSIDIES PAID (F4.2) (7 008 192) 0 0 0 0 0 0 0 0 0 0 0 0 0 (7 008 192)
41 GENERAL EXPENSES - OTHER (8 462 308) (7 391 062) 0 (108 918) (1 211 258) (495 086) (239 291) (924 370) 0 (2 167 166) (1 918 339) (3 889 035) (4 437 814) (110 715) (31 355 361)
42 DEFICIT ON SALE OF ASSETS (GAMAP to add) 0 (26 610) 0 0 0 0 0 0 0 0 (239 539) 0 0 0 (266 149)43 DIRECT OPERATING EXPENDITURE (33 551 652) (27 278 385) 0 (152 588) (4 928 494) (2 476 033) (3 618 508) (6 272 719) (1 819) (24 141 103) (13 166 510) (21 811 694) (24 405 770) (2 017 408) (163 822 682)
44 INTERNAL TRANSFERS - (the items below must net out with the corresponding items under Income) 0 0 0 0 0 0 0 0 0 0 0 0 0 0 0
45 INTEREST - INTERNAL BORROWINGS 0 0 0 0 0 0 0 0 0 0 0 0 0 0 0
46 REDEMPTION - INTERNAL BORROWINGS (GAMAP to remove) 0 0 0 0 0 0 0 0 0 0 0 0 0 0 0
47 INTERNAL CHARGES (Activity Based Costing etc) 0 0 0 0 0 0 0 0 0 (1 839 155) 0 (2 813 997) (2 331 883) 0 (6 985 035)48 TOTAL OPERATING EXPENDITURE (33 551 652) (27 278 385) 0 (152 588) (4 928 494) (2 476 033) (3 618 508) (6 272 719) (1 819) (25 980 258) (13 166 510) (24 625 691) (26 737 653) (2 017 408) (170 807 717)
49 OPERATING SURPLUS / (DEFICIT) - Total Income less Total Expenditure (4 161 490) 21 534 885 0 (42 403) (4 530 361) (502 059) (3 352 866) (6 216 964) 38 824 138 758 947 3 279 308 2 543 329 1 945 711 (2 017 408) 147 277 453
50 LESS TAX 0 0 0 0 0 0 0 0 0 0 0 0 0 0 051 OPERATING SURPLUS / (DEFICIT) - AFTER TAX (4 161 490) 21 534 885 0 (42 403) (4 530 361) (502 059) (3 352 866) (6 216 964) 38 824 138 758 947 3 279 308 2 543 329 1 945 711 (2 017 408) 147 277 453
52 DIVIDENDS PAID (Municipal Entities Only) 0 0 0 0 0 0 0 0 0 0 0 0 0 0 0
53 CROSS SUBSIDISATION 0 0 0 0 0 0 0 0 0 0 0 0 0 0 054 SURPLUS / (DEFICIT) AFTER TAX, DIVIDENDS and CROSS SUBSIDIES (4 161 490) 21 534 885 0 (42 403) (4 530 361) (502 059) (3 352 866) (6 216 964) 38 824 138 758 947 3 279 308 2 543 329 1 945 711 (2 017 408) 147 277 453
55 PLUS OPENING UNAPPROPRIATED SURPLUS / (ACCUMULATED DEFICIT) 0 0 0 0 0 0 0 0 0 0 0 0 0 0 056 AVAILABLE UNAPPROPRIATED SURPLUS / (ACCUMULATED DEFICIT) (4 161 490) 21 534 885 0 (42 403) (4 530 361) (502 059) (3 352 866) (6 216 964) 38 824 138 758 947 3 279 308 2 543 329 1 945 711 (2 017 408) 147 277 453
57 OTHER ADJUSTMENTS AND TRANSFERS 0 0 0 0 0 0 0 0 0 0 0 0 0 0 0
58 CONTRIBUTIONS FROM OPERATING (TO) CAPITAL (813 341) (250 371) 0 0 (12 565) 0 0 0 0 (222 767) (47 938) (129 104) (8 050) 0 (1 484 136)
59 TRANSFERS FROM / (TO) OTHER RESERVES 0 0 0 0 0 0 0 0 0 0 0 0 0 0 0
60 PRIOR YEAR ADJUSTMENTS 0 0 0 0 0 0 0 0 0 0 0 0 0 0 061 CLOSING UNAPPROPRIATED SURPLUS / (ACCUMULATED DEFICIT) (4 974 831) 21 284 514 0 (42 403) (4 542 926) (502 059) (3 352 866) (6 216 964) 38 824 138 536 180 3 231 370 2 414 225 1 937 661 (2 017 408) 145 793 317
62 PLUS INTERESTS IN ENTITIES NOT WHOLLY OWNED 0 0 0 0 0 0 0 0 0 0 0 0 0 0 063 UNAPPROPRIATED SURPLUS / (ACCUMULATED DEFICIT) C/F TO BALANCE SHEET (4 974 831) 21 284 514 0 (42 403) (4 542 926) (502 059) (3 352 866) (6 216 964) 38 824 138 536 180 3 231 370 2 414 225 1 937 661 (2 017 408) 145 793 317

F3 - OPERATING INCOME & EXPENDITURE BY FUNCTIONAL CLASSIFICATION (Summary Report)
2008/2009
DETAIL Executive &
Council
Finance &
Admin
Planning &
Development
Health Community&
Social ServicesHousing Public
Safety
Sport &
Recreation
Environmental
Health
Waste
Management
Road
Transport
Water Electricity Other Total
-1- -2- -3- -4- -5- -6- -7- -8- -9- -10- -11- -12- -13- -14-1 INCOME
2 PROPERTY RATES 0 23 442 278 0 0 0 0 0 0 0 0 0 0 0 0 23 442 278
3 PLUS PENALTIES IMPOSED 0 0 0 0 0 0 0 0 0 0 0 0 0 0 0
4 USER CHARGES FOR SERVICES 0 50 000 0 0 0 0 0 60 000 0 23 611 968 0 18 132 493 34 672 015 0 76 526 476
5 REGIONAL SERVICE LEVIES - Turnover 0 0 0 0 0 0 0 0 0 0 0 0 0 0 0
6 REGIONAL SERVICE LEVIES - Remuneration 0 0 0 0 0 0 0 0 0 0 0 0 0 0 0
7 RENT OF FACILITIES AND EQUIPMENT 0 517 000 0 16 000 51 000 0 0 5 000 0 0 10 000 0 10 000 0 609 000
8 INTEREST EARNED - EXTERNAL INVESTMENTS 0 500 000 0 0 0 0 0 0 0 0 0 0 0 0 500 000
9 INTEREST EARNED - OUTSTANDING DEBTORS 0 12 000 000 0 0 0 0 0 0 0 0 0 0 0 0 12 000 000
10 DIVIDENDS RECEIVED - EXTERNAL ENTITIES 0 0 0 0 0 0 0 0 0 0 0 0 0 0 0
11 FINES 0 0 0 0 4 000 0 150 000 0 0 0 0 0 0 0 154 000
12 LICENSES & PERMITS 2 000 5 000 0 0 0 0 0 0 0 0 0 0 0 0 7 000
13 INCOME FOR AGENCY SERVICES 0 0 0 0 0 0 0 0 0 0 0 0 0 0 0
14 OPERATING GRANTS & SUBSIDIES (agrees to line 18 of F4.1) 17 309 024 980 000 0 164 500 3 181 660 0 0 0 0 22 209 877 15 730 000 45 923 439 5 000 000 0 110 498 500
15 OTHER INCOME 211 000 213 000 0 0 411 000 55 000 0 2 000 0 62 500 6 000 3 500 987 500 0 1 951 500
16 SURPLUS ON SALE OF ASSETS (GAMAP to add) 0 0 0 0 0 0 0 0 0 0 0 0 0 0 0
17 OPERATING INCOME GENERATED 17 522 024 37 707 278 0 180 500 3 647 660 55 000 150 000 67 000 0 45 884 345 15 746 000 64 059 432 40 669 515 0 225 688 754
18 LESS INCOME FOREGONE (agrees to line 81 on F8) 0 (20 000) 0 0 0 0 0 0 0 0 0 0 0 0 (20 000)
19 DIRECT OPERATING INCOME 17 522 024 37 687 278 0 180 500 3 647 660 55 000 150 000 67 000 0 45 884 345 15 746 000 64 059 432 40 669 515 0 225 668 754
20 INTERNAL TRANSFERS – (the items below must net out with the corresponding items under expenditure) 0 0 0 0 0 0 0 0 0 0 0 0 0 0 0
21 INTEREST RECEIVED - INTERNAL LOANS 0 0 0 0 0 0 0 0 0 0 0 0 0 0 0
22 REDEMPTION RECEIVED - INTERNAL LOANS (GAMAP to remove) 0 0 0 0 0 0 0 0 0 0 0 0 0 0 0
23 INTERNAL RECOVERIES (Activity Based Costing etc) 0 10 672 532 0 0 0 0 0 0 0 0 0 0 0 0 10 672 532
24 DIVIDENDS RECEIVED - INTERNAL (from Municipal Entities) 0 0 0 0 0 0 0 0 0 0 0 0 0 0 0
25 TOTAL OPERATING INCOME 17 522 024 48 359 811 0 180 500 3 647 660 55 000 150 000 67 000 0 45 884 345 15 746 000 64 059 432 40 669 515 0 236 341 28725 TOTAL OPERATING INCOME 17 522 024 48 359 811 0 180 500 3 647 660 55 000 150 000 67 000 0 45 884 345 15 746 000 64 059 432 40 669 515 0 236 341 287
26 EXPENDITURE
27 EMPLOYEE RELATED COSTS - WAGES & SALARIES (4 242 147) (12 161 015) 0 0 (3 781 082) (1 494 618) (2 367 680) (3 996 312) 0 (14 497 617) (6 305 959) (4 152 567) (2 058 202) (1 463 782) (56 520 981)
28 EMPLOYEE RELATED COSTS - SOCIAL CONTRIBUTIONS (569 679) (2 606 631) 0 0 (872 232) (317 001) (440 820) (939 980) 0 (2 715 724) (1 285 554) (874 603) (391 216) (192 061) (11 205 501)
29 LESS EMPLOYEE COSTS CAPITALISED 0 0 0 0 0 0 0 0 0 0 0 0 0 0 0
30 LESS EMPLOYEE COSTS ALLOCATED TO OTHER OPERATING ITEMS 0 0 0 0 0 0 0 0 0 0 0 0 0 0 0
31 REMUNERATION OF COUNCILLORS (5 927 803) 0 0 0 0 0 0 0 0 0 0 0 0 0 (5 927 803)
32 WORKING CAPITAL RESERVE (2 000 000) 0 0 0 0 0 0 0 0 (4 000 000) 0 (5 000 000) (1 500 000) 0 (12 500 000)
33 COLLECTION COSTS 0 0 0 0 0 (5 000) 0 0 0 0 0 0 0 0 (5 000)
34 DEPRECIATION (GAMAP to add) (425 000) (1 600 000) 0 (55 000) (92 000) (220 000) (65 000) (312 000) (30 000) (3 150 000) (2 200 000) (4 200 000) (750 000) 0 (13 099 000)
35 REPAIRS AND MAINTENANCE - MUNICIPAL ASSETS (agrees to line 41 for Prog Maint on F5.3)(227 100) (726 700) 0 (12 500) (498 855) (105 475) (461 500) (824 724) 0 (1 903 388) (9 425 895) (1 111 445) (1 586 445) 0 (16 884 027)
36 INTEREST EXPENSE - EXTERNAL BORROWINGS (1 000 000) (1 975 303) 0 (2 000) (126 613) (12 000) (538 071) (853 373) (2 000) (2 618 838) (1 912 376) (1 472 413) (936 206) 0 (11 449 192)
37 REDEMPTION PAYMENTS - EXTERNAL BORROWINGS (GAMAP to remove) 0 0 0 0 0 0 0 0 0 0 0 0 0 0 0
38 BULK PURCHASES 0 0 0 0 0 0 0 0 0 0 0 0 (19 348 875) 0 (19 348 875)
39 CONTRACTED SERVICES 0 0 0 0 0 0 0 0 0 0 0 0 0 0 0
40 GRANTS & SUBSIDIES PAID (F4.2) (10 005 000) 0 0 0 0 0 0 0 0 0 0 0 0 0 (10 005 000)
41 GENERAL EXPENSES - OTHER (12 577 075) (6 537 330) 0 (116 000) (2 259 676) (1 094 796) (545 000) (1 188 676) 0 (1 831 701) (3 719 908) (3 584 121) (4 053 126) (82 500) (37 589 908)
42 DEFICIT ON SALE OF ASSETS (GAMAP to add) 0 0 0 0 0 0 0 0 0 0 0 0 0 0 043 DIRECT OPERATING EXPENDITURE (36 973 804) (25 606 979) 0 (185 500) (7 630 458) (3 248 890) (4 418 071) (8 115 064) (32 000) (30 717 268) (24 849 692) (20 395 149) (30 624 070) (1 738 343) (194 535 287)
44 INTERNAL TRANSFERS - (the items below must net out with the corresponding items under Income) 0 0 0 0 0 0 0 0 0 0 0 0 0 0 0
45 INTEREST - INTERNAL BORROWINGS 0 0 0 0 0 0 0 0 0 0 0 0 0 0 0
46 REDEMPTION - INTERNAL BORROWINGS (GAMAP to remove) 0 0 0 0 0 0 0 0 0 0 0 0 0 0 0
47 INTERNAL CHARGES (Activity Based Costing etc) 0 0 0 0 0 0 0 0 0 (2 294 217) 0 (5 124 755) (3 253 561) 0 (10 672 533)48 TOTAL OPERATING EXPENDITURE (36 973 804) (25 606 979) 0 (185 500) (7 630 458) (3 248 890) (4 418 071) (8 115 064) (32 000) (33 011 485) (24 849 692) (25 519 904) (33 877 631) (1 738 343) (205 207 820)
49 OPERATING SURPLUS / (DEFICIT) - Total Income less Total Expenditure (19 451 780) 22 752 832 0 (5 000) (3 982 798) (3 193 890) (4 268 071) (8 048 064) (32 000) 12 872 860 (9 103 692) 38 539 528 6 791 884 (1 738 343) 31 133 467
50 LESS TAX 0 0 0 0 0 0 0 0 0 0 0 0 0 0 051 OPERATING SURPLUS / (DEFICIT) - AFTER TAX (19 451 780) 22 752 832 0 (5 000) (3 982 798) (3 193 890) (4 268 071) (8 048 064) (32 000) 12 872 860 (9 103 692) 38 539 528 6 791 884 (1 738 343) 31 133 467
52 DIVIDENDS PAID (Municipal Entities Only) 0 0 0 0 0 0 0 0 0 0 0 0 0 0 0
53 CROSS SUBSIDISATION 0 0 0 0 0 0 0 0 0 0 0 0 0 0 054 SURPLUS / (DEFICIT) AFTER TAX, DIVIDENDS and CROSS SUBSIDIES (19 451 780) 22 752 832 0 (5 000) (3 982 798) (3 193 890) (4 268 071) (8 048 064) (32 000) 12 872 860 (9 103 692) 38 539 528 6 791 884 (1 738 343) 31 133 467
55 PLUS OPENING UNAPPROPRIATED SURPLUS / (ACCUMULATED DEFICIT) 0 0 0 0 0 0 0 0 0 0 0 0 0 0 056 AVAILABLE UNAPPROPRIATED SURPLUS / (ACCUMULATED DEFICIT) (19 451 780) 22 752 832 0 (5 000) (3 982 798) (3 193 890) (4 268 071) (8 048 064) (32 000) 12 872 860 (9 103 692) 38 539 528 6 791 884 (1 738 343) 31 133 467
57 OTHER ADJUSTMENTS AND TRANSFERS 0 0 0 0 0 0 0 0 0 0 0 0 0 0 0
58 CONTRIBUTIONS FROM OPERATING (TO) CAPITAL (370 000) (1 700 000) 0 0 (160 000) 0 0 (3 500 000) 0 (4 737 000) (2 010 000) (15 870 000) (2 200 000) 0 (30 547 000)
59 TRANSFERS FROM / (TO) OTHER RESERVES 0 0 0 0 0 0 0 0 0 0 0 0 0 0 0
60 PRIOR YEAR ADJUSTMENTS 0 0 0 0 0 0 0 0 0 0 0 0 0 0 061 CLOSING UNAPPROPRIATED SURPLUS / (ACCUMULATED DEFICIT) (19 821 780) 21 052 832 0 (5 000) (4 142 798) (3 193 890) (4 268 071) (11 548 064) (32 000) 8 135 860 (11 113 692) 22 669 528 4 591 884 (1 738 343) 586 467
62 PLUS INTERESTS IN ENTITIES NOT WHOLLY OWNED 0 0 0 0 0 0 0 0 0 0 0 0 0 0 063 UNAPPROPRIATED SURPLUS / (ACCUMULATED DEFICIT) C/F TO BALANCE SHEET (19 821 780) 21 052 832 0 (5 000) (4 142 798) (3 193 890) (4 268 071) (11 548 064) (32 000) 8 135 860 (11 113 692) 22 669 528 4 591 884 (1 738 343) 586 467

F3 - OPERATING INCOME & EXPENDITURE BY FUNCTIONAL CLASSIFICATION (Summary Report)
YEAR TO DATE: 2008/2009
DETAIL Executive &
Council
Finance &
Admin
Planning &
Development
Health Community&
Social ServicesHousing Public
Safety
Sport &
Recreation
Environmental
Health
Waste
Management
Road
Transport
Water Electricity Other Total
-1- -2- -3- -4- -5- -6- -7- -8- -9- -10- -11- -12- -13- -14-1 INCOME
2 PROPERTY RATES 0 20 823 080 0 0 0 0 0 0 0 0 0 0 0 0 20 823 080
3 PLUS PENALTIES IMPOSED 0 0 0 0 0 0 0 0 0 0 0 0 0 0 0
4 USER CHARGES FOR SERVICES 0 43 896 0 0 0 0 0 73 071 0 23 977 137 0 18 799 370 23 827 651 0 66 721 125
5 REGIONAL SERVICE LEVIES - Turnover 0 0 0 0 0 0 0 0 0 0 0 0 0 0 0
6 REGIONAL SERVICE LEVIES - Remuneration 0 0 0 0 0 0 0 0 0 0 0 0 0 0 0
7 RENT OF FACILITIES AND EQUIPMENT 0 526 402 0 0 53 192 0 0 6 044 0 0 2 395 0 14 220 0 602 254
8 INTEREST EARNED - EXTERNAL INVESTMENTS 0 0 0 0 0 0 0 0 0 0 0 0 0 0 0
9 INTEREST EARNED - OUTSTANDING DEBTORS 0 16 464 262 0 0 0 0 0 0 0 0 0 0 0 0 16 464 262
10 DIVIDENDS RECEIVED - EXTERNAL ENTITIES 0 0 0 0 0 0 0 0 0 0 0 0 0 0 0
11 FINES 0 0 0 0 4 519 0 205 935 0 0 0 0 0 0 0 210 454
12 LICENSES & PERMITS 7 230 50 0 0 0 0 0 0 0 0 0 0 0 0 7 280
13 INCOME FOR AGENCY SERVICES 0 0 0 0 0 0 0 0 0 0 0 0 0 0 0
14 OPERATING GRANTS & SUBSIDIES (agrees to line 18 of F4.1) 81 909 577 980 000 0 0 0 0 0 0 0 0 0 0 0 0 82 889 577
15 OTHER INCOME 164 544 479 982 0 0 273 986 0 0 0 0 31 636 250 17 550 888 173 0 1 856 121
16 SURPLUS ON SALE OF ASSETS (GAMAP to add) 0 0 0 0 0 0 0 0 0 0 0 0 0 0 0
17 OPERATING INCOME GENERATED 82 081 351 39 317 673 0 0 331 697 0 205 935 79 115 0 24 008 773 2 645 18 816 920 24 730 045 0 189 574 153
18 LESS INCOME FOREGONE (agrees to line 81 on F8) 0 (22 071) 0 0 0 0 0 0 0 0 0 0 0 0 (22 071)
19 DIRECT OPERATING INCOME 82 081 351 39 295 602 0 0 331 697 0 205 935 79 115 0 24 008 773 2 645 18 816 920 24 730 045 0 189 552 081
20 INTERNAL TRANSFERS – (the items below must net out with the corresponding items under expenditure) 0 0 0 0 0 0 0 0 0 0 0 0 0 0 0
21 INTEREST RECEIVED - INTERNAL LOANS 0 0 0 0 0 0 0 0 0 0 0 0 0 0 0
22 REDEMPTION RECEIVED - INTERNAL LOANS (GAMAP to remove) 0 0 0 0 0 0 0 0 0 0 0 0 0 0 0
23 INTERNAL RECOVERIES (Activity Based Costing etc) 0 0 0 0 0 0 0 0 0 0 0 0 0 0 0
24 DIVIDENDS RECEIVED - INTERNAL (from Municipal Entities) 0 0 0 0 0 0 0 0 0 0 0 0 0 0 0
25 TOTAL OPERATING INCOME 82 081 351 39 295 602 0 0 331 697 0 205 935 79 115 0 24 008 773 2 645 18 816 920 24 730 045 0 189 552 081
26 EXPENDITURE
27 EMPLOYEE RELATED COSTS - WAGES & SALARIES (4 925 302) (10 842 563) 0 0 (2 460 061) (1 256 234) (2 383 941) (4 603 152) 0 (11 308 429) (4 693 069) (3 040 785) (1 639 789) (1 276 956) (48 430 283)
28 EMPLOYEE RELATED COSTS - SOCIAL CONTRIBUTIONS (643 938) (2 184 261) 0 0 (537 441) (312 399) (412 518) (827 011) 0 (1 965 282) (821 813) (712 911) (307 706) (105 403) (8 830 682)28 EMPLOYEE RELATED COSTS - SOCIAL CONTRIBUTIONS (643 938) (2 184 261) 0 0 (537 441) (312 399) (412 518) (827 011) 0 (1 965 282) (821 813) (712 911) (307 706) (105 403) (8 830 682)
29 LESS EMPLOYEE COSTS CAPITALISED 0 0 0 0 0 0 0 0 0 0 0 0 0 0 0
30 LESS EMPLOYEE COSTS ALLOCATED TO OTHER OPERATING ITEMS 0 0 0 0 0 0 0 0 0 0 0 0 0 0 0
31 REMUNERATION OF COUNCILLORS (5 876 535) 0 0 0 0 0 0 0 0 0 0 0 0 0 (5 876 535)
32 WORKING CAPITAL RESERVE 0 0 0 0 0 0 0 0 0 0 0 0 0 0 0
33 COLLECTION COSTS 0 0 0 0 0 0 0 0 0 0 0 0 0 0 0
34 DEPRECIATION (GAMAP to add) 0 0 0 0 0 0 0 0 0 0 0 0 0 0 0
35 REPAIRS AND MAINTENANCE - MUNICIPAL ASSETS (agrees to line 41 for Prog Maint on F5.3)(118 261) (854 685) 0 (84) (72 702) (85 696) (317 205) (332 152) 0 (1 220 554) (2 306 567) (1 514 106) (1 072 756) 0 (7 894 770)
36 INTEREST EXPENSE - EXTERNAL BORROWINGS 0 (465 082) 0 0 0 0 0 0 0 0 0 0 0 0 (465 082)
37 REDEMPTION PAYMENTS - EXTERNAL BORROWINGS (GAMAP to remove) 0 0 0 0 0 0 0 0 0 0 0 0 0 0 0
38 BULK PURCHASES 0 0 0 0 0 0 0 0 0 0 0 0 (16 131 844) 0 (16 131 844)
39 CONTRACTED SERVICES 0 0 0 0 0 0 0 0 0 0 0 0 0 0 0
40 GRANTS & SUBSIDIES PAID (F4.2) 0 0 0 0 0 0 0 0 0 0 0 0 0 0 0
41 GENERAL EXPENSES - OTHER (6 507 154) (5 703 783) 0 (59 393) (58 567) (210 131) (238 029) (594 437) 0 (1 128 320) (1 186 249) (3 372 273) (5 619 170) (25 448) (24 702 954)
42 DEFICIT ON SALE OF ASSETS (GAMAP to add) 0 0 0 0 0 0 0 0 0 0 0 0 0 0 043 DIRECT OPERATING EXPENDITURE (18 071 190) (20 050 374) 0 (59 478) (3 128 772) (1 864 460) (3 351 694) (6 356 752) 0 (15 622 585) (9 007 699) (8 640 075) (24 771 266) (1 407 807) (112 332 150)
44 INTERNAL TRANSFERS - (the items below must net out with the corresponding items under Income) 0 0 0 0 0 0 0 0 0 0 0 0 0 0 0
45 INTEREST - INTERNAL BORROWINGS 0 0 0 0 0 0 0 0 0 0 0 0 0 0 0
46 REDEMPTION - INTERNAL BORROWINGS (GAMAP to remove) 0 0 0 0 0 0 0 0 0 0 0 0 0 0 0
47 INTERNAL CHARGES (Activity Based Costing etc) 0 0 0 0 0 0 0 0 0 0 0 (199) 0 0 (199)48 TOTAL OPERATING EXPENDITURE (18 071 190) (20 050 374) 0 (59 478) (3 128 772) (1 864 460) (3 351 694) (6 356 752) 0 (15 622 585) (9 007 699) (8 640 274) (24 771 265) (1 407 807) (112 332 348)
49 OPERATING SURPLUS / (DEFICIT) - Total Income less Total Expenditure 64 010 161 19 245 228 0 (59 478) (2 797 075) (1 864 460) (3 145 759) (6 277 637) 0 8 386 188 (9 005 054) 10 176 646 (41 220) (1 407 807) 77 219 733
50 LESS TAX 0 0 0 0 0 0 0 0 0 0 0 0 0 0 051 OPERATING SURPLUS / (DEFICIT) - AFTER TAX 64 010 161 19 245 228 0 (59 478) (2 797 075) (1 864 460) (3 145 759) (6 277 637) 0 8 386 188 (9 005 054) 10 176 646 (41 220) (1 407 807) 77 219 733
52 DIVIDENDS PAID (Municipal Entities Only) 0 0 0 0 0 0 0 0 0 0 0 0 0 0 0
53 CROSS SUBSIDISATION 0 0 0 0 0 0 0 0 0 0 0 0 0 0 054 SURPLUS / (DEFICIT) AFTER TAX, DIVIDENDS and CROSS SUBSIDIES 64 010 161 19 245 228 0 (59 478) (2 797 075) (1 864 460) (3 145 759) (6 277 637) 0 8 386 188 (9 005 054) 10 176 646 (41 220) (1 407 807) 77 219 733
55 PLUS OPENING UNAPPROPRIATED SURPLUS / (ACCUMULATED DEFICIT) 0 0 0 0 0 0 0 0 0 0 0 0 0 0 056 AVAILABLE UNAPPROPRIATED SURPLUS / (ACCUMULATED DEFICIT) 64 010 161 19 245 228 0 (59 478) (2 797 075) (1 864 460) (3 145 759) (6 277 637) 0 8 386 188 (9 005 054) 10 176 646 (41 220) (1 407 807) 77 219 733
57 OTHER ADJUSTMENTS AND TRANSFERS 0 0 0 0 0 0 0 0 0 0 0 0 0 0 0
58 CONTRIBUTIONS FROM OPERATING (TO) CAPITAL (452 149) (645 562) 0 0 0 0 (225 878) (229 247) 0 0 (73 491) (179 120) (15 053) 0 (1 820 500)
59 TRANSFERS FROM / (TO) OTHER RESERVES 0 0 0 0 0 0 0 0 0 0 0 0 0 0 0
60 PRIOR YEAR ADJUSTMENTS 0 0 0 0 0 0 0 0 0 0 0 0 0 0 061 CLOSING UNAPPROPRIATED SURPLUS / (ACCUMULATED DEFICIT) 63 558 012 18 599 666 0 (59 478) (2 797 075) (1 864 460) (3 371 637) (6 506 883) 0 8 386 188 (9 078 545) 9 997 526 (56 273) (1 407 807) 75 399 233
62 PLUS INTERESTS IN ENTITIES NOT WHOLLY OWNED 0 0 0 0 0 0 0 0 0 0 0 0 0 0 063 UNAPPROPRIATED SURPLUS / (ACCUMULATED DEFICIT) C/F TO BALANCE SHEET 63 558 012 18 599 666 0 (59 478) (2 797 075) (1 864 460) (3 371 637) (6 506 883) 0 8 386 188 (9 078 545) 9 997 526 (56 273) (1 407 807) 75 399 233

F3 - OPERATING INCOME & EXPENDITURE BY FUNCTIONAL CLASSIFICATION (Summary Report)
2008/2009
DETAIL Executive &
Council
Finance &
Admin
Planning &
Development
Health Community&
Social ServicesHousing Public
Safety
Sport &
Recreation
Environmental
Health
Waste
Management
Road
Transport
Water Electricity Other Total
-1- -2- -3- -4- -5- -6- -7- -8- -9- -10- -11- -12- -13- -14-1 INCOME
2 PROPERTY RATES 0 23 444 350 0 0 0 0 0 0 0 0 0 0 0 0 23 444 350
3 PLUS PENALTIES IMPOSED 0 0 0 0 0 0 0 0 0 0 0 0 0 0 0
4 USER CHARGES FOR SERVICES 0 49 573 0 0 0 0 0 73 760 0 23 642 783 0 18 135 288 30 593 181 0 72 494 585
5 REGIONAL SERVICE LEVIES - Turnover 0 0 0 0 0 0 0 0 0 0 0 0 0 0 0
6 REGIONAL SERVICE LEVIES - Remuneration 0 0 0 0 0 0 0 0 0 0 0 0 0 0 0
7 RENT OF FACILITIES AND EQUIPMENT 0 586 583 0 0 53 500 0 0 6 500 0 0 2 500 0 17 064 0 666 148
8 INTEREST EARNED - EXTERNAL INVESTMENTS 0 750 000 0 0 0 0 0 0 0 0 0 0 0 0 750 000
9 INTEREST EARNED - OUTSTANDING DEBTORS 0 17 500 000 0 0 0 0 0 0 0 0 0 0 0 0 17 500 000
10 DIVIDENDS RECEIVED - EXTERNAL ENTITIES 0 0 0 0 0 0 0 0 0 0 0 0 0 0 0
11 FINES 0 0 0 0 4 600 0 207 000 0 0 0 0 0 0 0 211 600
12 LICENSES & PERMITS 8 000 50 0 0 0 0 0 0 0 0 0 0 0 0 8 050
13 INCOME FOR AGENCY SERVICES 0 0 0 0 0 0 0 0 0 0 0 0 0 0 0
14 OPERATING GRANTS & SUBSIDIES (agrees to line 18 of F4.1) 19 275 429 980 000 0 164 500 0 0 0 0 0 17 683 415 13 311 349 43 233 365 18 147 387 0 112 795 445
15 OTHER INCOME 197 453 507 204 0 0 328 728 260 000 0 0 0 31 640 260 200 992 406 0 2 317 891
16 SURPLUS ON SALE OF ASSETS (GAMAP to add) 0 0 0 0 0 0 0 0 0 0 0 0 0 0 0
17 OPERATING INCOME GENERATED 19 480 882 43 817 760 0 164 500 386 828 260 000 207 000 80 260 0 41 357 838 13 314 109 61 368 853 49 750 038 0 230 188 069
18 LESS INCOME FOREGONE (agrees to line 81 on F8) 0 (22 071) 0 0 0 0 0 0 0 0 0 0 0 0 (22 071)
19 DIRECT OPERATING INCOME 19 480 882 43 795 689 0 164 500 386 828 260 000 207 000 80 260 0 41 357 838 13 314 109 61 368 853 49 750 038 0 230 165 997
20 INTERNAL TRANSFERS – (the items below must net out with the corresponding items under expenditure) 0 0 0 0 0 0 0 0 0 0 0 0 0 0 0
21 INTEREST RECEIVED - INTERNAL LOANS 0 0 0 0 0 0 0 0 0 0 0 0 0 0 0
22 REDEMPTION RECEIVED - INTERNAL LOANS (GAMAP to remove) 0 0 0 0 0 0 0 0 0 0 0 0 0 0 0
23 INTERNAL RECOVERIES (Activity Based Costing etc) 0 10 672 532 0 0 0 0 0 0 0 0 0 0 0 0 10 672 532
24 DIVIDENDS RECEIVED - INTERNAL (from Municipal Entities) 0 0 0 0 0 0 0 0 0 0 0 0 0 0 0
25 TOTAL OPERATING INCOME 19 480 882 54 468 221 0 164 500 386 828 260 000 207 000 80 260 0 41 357 838 13 314 109 61 368 853 49 750 038 0 240 838 530
26 EXPENDITURE
27 EMPLOYEE RELATED COSTS - WAGES & SALARIES (6 808 367) (13 071 739) 0 0 (3 118 968) (1 532 069) (2 860 730) (5 539 457) 0 (15 341 672) (6 372 823) (3 674 142) (1 978 547) 0 (60 298 515)
28 EMPLOYEE RELATED COSTS - SOCIAL CONTRIBUTIONS (772 725) (2 735 340) 0 0 (685 222) (374 878) (495 022) (1 042 141) 0 (2 535 391) (1 285 554) (888 584) (383 720) 0 (11 198 577)LESS EMPLOYEE COSTS CAPITALISED 0 0 0 0 0 0 0 0 0 0 0 0 0 0 029 LESS EMPLOYEE COSTS CAPITALISED 0 0 0 0 0 0 0 0 0 0 0 0 0 0 0
30 LESS EMPLOYEE COSTS ALLOCATED TO OTHER OPERATING ITEMS 0 0 0 0 0 0 0 0 0 0 0 0 0 0 0
31 REMUNERATION OF COUNCILLORS (7 051 842) 0 0 0 0 0 0 0 0 0 0 0 0 0 (7 051 842)
32 WORKING CAPITAL RESERVE (2 000 000) 0 0 0 0 0 0 0 0 (7 300 000) 0 (9 000 000) (2 500 000) 0 (20 800 000)
33 COLLECTION COSTS 0 0 0 0 0 0 0 0 0 0 0 0 0 0 0
34 DEPRECIATION (GAMAP to add) (850 000) (2 400 000) 0 (55 000) (97 000) (220 000) (65 000) (362 000) (30 000) (6 400 000) (2 200 000) (4 500 000) (750 000) 0 (17 929 000)
35 REPAIRS AND MAINTENANCE - MUNICIPAL ASSETS (agrees to line 41 for Prog Maint on F5.3)(138 740) (1 055 815) 0 (12 500) (265 847) (102 835) (386 381) (621 606) 0 (1 464 665) (3 257 050) (1 816 927) (1 287 308) 0 (10 409 674)
36 INTEREST EXPENSE - EXTERNAL BORROWINGS (1 000 000) (1 717 658) 0 (2 000) (65 806) (12 000) (35 000) (76 000) (2 000) (700 000) (750 000) (1 472 413) (936 206) 0 (6 769 083)
37 REDEMPTION PAYMENTS - EXTERNAL BORROWINGS (GAMAP to remove) 0 0 0 0 0 0 0 0 0 0 0 0 0 0 0
38 BULK PURCHASES 0 0 0 0 0 0 0 0 0 0 0 0 (19 358 213) 0 (19 358 213)
39 CONTRACTED SERVICES 0 0 0 0 0 0 0 0 0 0 0 0 0 0 0
40 GRANTS & SUBSIDIES PAID (F4.2) (10 005 000) 0 0 0 0 0 0 0 0 0 0 0 0 0 (10 005 000)
41 GENERAL EXPENSES - OTHER (10 213 062) (6 944 763) 0 (116 000) (394 121) (337 677) (345 553) (796 877) 0 (1 923 684) (3 861 889) (4 046 728) (6 743 004) 0 (35 723 358)
42 DEFICIT ON SALE OF ASSETS (GAMAP to add) 0 0 0 0 0 0 0 0 0 0 0 0 0 0 043 DIRECT OPERATING EXPENDITURE (38 839 736) (27 925 315) 0 (185 500) (4 626 964) (2 579 459) (4 187 686) (8 438 082) (32 000) (35 665 412) (17 727 316) (25 398 794) (33 936 998) 0 (199 543 262)
44 INTERNAL TRANSFERS - (the items below must net out with the corresponding items under Income) 0 0 0 0 0 0 0 0 0 0 0 0 0 0 0
45 INTEREST - INTERNAL BORROWINGS 0 0 0 0 0 0 0 0 0 0 0 0 0 0 0
46 REDEMPTION - INTERNAL BORROWINGS (GAMAP to remove) 0 0 0 0 0 0 0 0 0 0 0 0 0 0 0
47 INTERNAL CHARGES (Activity Based Costing etc) 0 0 0 0 0 0 0 0 0 (2 294 217) 0 (5 124 755) (3 253 561) 0 (10 672 533)48 TOTAL OPERATING EXPENDITURE (38 839 736) (27 925 315) 0 (185 500) (4 626 964) (2 579 459) (4 187 686) (8 438 082) (32 000) (37 959 629) (17 727 316) (30 523 549) (37 190 559) 0 (210 215 795)
49 OPERATING SURPLUS / (DEFICIT) - Total Income less Total Expenditure (19 358 854) 26 542 906 0 (21 000) (4 240 136) (2 319 459) (3 980 686) (8 357 822) (32 000) 3 398 208 (4 413 207) 30 845 304 12 559 480 0 30 622 734
50 LESS TAX 0 0 0 0 0 0 0 0 0 0 0 0 0 0 051 OPERATING SURPLUS / (DEFICIT) - AFTER TAX (19 358 854) 26 542 906 0 (21 000) (4 240 136) (2 319 459) (3 980 686) (8 357 822) (32 000) 3 398 208 (4 413 207) 30 845 304 12 559 480 0 30 622 734
52 DIVIDENDS PAID (Municipal Entities Only) 0 0 0 0 0 0 0 0 0 0 0 0 0 0 0
53 CROSS SUBSIDISATION 0 0 0 0 0 0 0 0 0 0 0 0 0 0 054 SURPLUS / (DEFICIT) AFTER TAX, DIVIDENDS and CROSS SUBSIDIES (19 358 854) 26 542 906 0 (21 000) (4 240 136) (2 319 459) (3 980 686) (8 357 822) (32 000) 3 398 208 (4 413 207) 30 845 304 12 559 480 0 30 622 734
55 PLUS OPENING UNAPPROPRIATED SURPLUS / (ACCUMULATED DEFICIT) 0 0 0 0 0 0 0 0 0 0 0 0 0 0 056 AVAILABLE UNAPPROPRIATED SURPLUS / (ACCUMULATED DEFICIT) (19 358 854) 26 542 906 0 (21 000) (4 240 136) (2 319 459) (3 980 686) (8 357 822) (32 000) 3 398 208 (4 413 207) 30 845 304 12 559 480 0 30 622 734
57 OTHER ADJUSTMENTS AND TRANSFERS 0 0 0 0 0 0 0 0 0 0 0 0 0 0 0
58 CONTRIBUTIONS FROM OPERATING (TO) CAPITAL (250 000) (1 700 000) 0 0 (160 000) 0 0 (3 500 000) 0 (4 737 000) (2 010 000) (15 870 000) (2 200 000) 0 (30 427 000)
59 TRANSFERS FROM / (TO) OTHER RESERVES 0 0 0 0 0 0 0 0 0 0 0 0 0 0 0
60 PRIOR YEAR ADJUSTMENTS 0 0 0 0 0 0 0 0 0 0 0 0 0 0 061 CLOSING UNAPPROPRIATED SURPLUS / (ACCUMULATED DEFICIT) (19 608 854) 24 842 906 0 (21 000) (4 400 136) (2 319 459) (3 980 686) (11 857 822) (32 000) (1 338 792) (6 423 207) 14 975 304 10 359 480 0 195 734
62 PLUS INTERESTS IN ENTITIES NOT WHOLLY OWNED 0 0 0 0 0 0 0 0 0 0 0 0 0 0 063 UNAPPROPRIATED SURPLUS / (ACCUMULATED DEFICIT) C/F TO BALANCE SHEET (19 608 854) 24 842 906 0 (21 000) (4 400 136) (2 319 459) (3 980 686) (11 857 822) (32 000) (1 338 792) (6 423 207) 14 975 304 10 359 480 0 195 734

F3 - OPERATING INCOME & EXPENDITURE BY FUNCTIONAL CLASSIFICATION (Summary Report)
2009/2010
DETAIL Executive &
Council
Finance &
Admin
Planning &
Development
Health Community&
Social ServicesHousing Public
Safety
Sport &
Recreation
Environmental
Health
Waste
Management
Road
Transport
Water Electricity Other Total
-1- -2- -3- -4- -5- -6- -7- -8- -9- -10- -11- -12- -13- -14-1 INCOME
2 PROPERTY RATES 0 20 142 278 0 0 0 0 0 0 0 0 0 0 0 0 20 142 278
3 PLUS PENALTIES IMPOSED 0 0 0 0 0 0 0 0 0 0 0 0 0 0 0
4 USER CHARGES FOR SERVICES 0 25 809 0 0 0 0 0 54 076 0 23 609 968 0 19 312 922 40 236 319 0 83 239 094
5 REGIONAL SERVICE LEVIES - Turnover 0 0 0 0 0 0 0 0 0 0 0 0 0 0 0
6 REGIONAL SERVICE LEVIES - Remuneration 0 0 0 0 0 0 0 0 0 0 0 0 0 0 0
7 RENT OF FACILITIES AND EQUIPMENT 0 491 667 0 10 395 51 964 0 0 4 466 0 0 0 0 0 0 558 492
8 INTEREST EARNED - EXTERNAL INVESTMENTS 0 2 932 298 0 0 0 0 0 0 0 0 0 0 0 0 2 932 298
9 INTEREST EARNED - OUTSTANDING DEBTORS 0 15 150 448 0 0 0 0 0 0 0 0 0 0 0 0 15 150 448
10 DIVIDENDS RECEIVED - EXTERNAL ENTITIES 0 0 0 0 0 0 0 0 0 0 0 0 0 0 0
11 FINES 0 0 0 0 5 105 0 205 323 0 0 0 0 0 0 0 210 428
12 LICENSES & PERMITS 0 2 000 0 0 0 0 0 0 0 0 0 0 0 0 2 000
13 INCOME FOR AGENCY SERVICES 0 0 0 0 0 0 0 0 0 0 0 0 0 0 0
14 OPERATING GRANTS & SUBSIDIES (agrees to line 18 of F4.1) 6 942 000 1 179 000 0 105 299 0 0 0 0 0 81 750 100 0 29 062 400 34 499 500 0 153 538 299
15 OTHER INCOME 221 550 748 662 0 0 360 972 2 077 673 0 0 0 81 384 0 136 342 1 427 516 0 5 054 098
16 SURPLUS ON SALE OF ASSETS (GAMAP to add) 0 0 0 0 0 0 0 0 0 0 0 0 0 0 0
17 OPERATING INCOME GENERATED 7 163 550 40 672 161 0 115 694 418 040 2 077 673 205 323 58 542 0 105 441 452 0 48 511 664 76 163 335 0 280 827 434
18 LESS INCOME FOREGONE (agrees to line 81 on F8) 0 (22 071) 0 0 0 0 0 0 0 0 0 0 0 0 (22 071)
19 DIRECT OPERATING INCOME 7 163 550 40 650 090 0 115 694 418 040 2 077 673 205 323 58 542 0 105 441 452 0 48 511 664 76 163 335 0 280 805 362
20 INTERNAL TRANSFERS – (the items below must net out with the corresponding items under expenditure) 0 0 0 0 0 0 0 0 0 0 0 0 0 0 0
21 INTEREST RECEIVED - INTERNAL LOANS 0 0 0 0 0 0 0 0 0 0 0 0 0 0 0
22 REDEMPTION RECEIVED - INTERNAL LOANS (GAMAP to remove) 0 0 0 0 0 0 0 0 0 0 0 0 0 0 0
23 INTERNAL RECOVERIES (Activity Based Costing etc) 0 12 406 567 0 0 0 0 0 0 0 0 0 0 0 0 12 406 567
24 DIVIDENDS RECEIVED - INTERNAL (from Municipal Entities) 0 0 0 0 0 0 0 0 0 0 0 0 0 0 0
25 TOTAL OPERATING INCOME 7 163 550 53 056 657 0 115 694 418 040 2 077 673 205 323 58 542 0 105 441 452 0 48 511 664 76 163 335 0 293 211 929
26 EXPENDITURE
27 EMPLOYEE RELATED COSTS - WAGES & SALARIES (4 727 662) (16 417 577) 0 0 (3 120 231) (1 967 510) (2 226 171) (5 609 014) 0 (13 844 965) (7 289 366) (4 352 435) (2 189 761) (2 255 769) (64 000 461)
28 EMPLOYEE RELATED COSTS - SOCIAL CONTRIBUTIONS (810 906) (3 393 179) 0 0 (762 754) (422 846) (437 490) (1 091 872) 0 (2 773 996) (1 409 381) (969 034) (420 158) (431 399) (12 923 015)
0 0 0 0 0 0 0 0 0 0 0 0 0 0 0
Adopted Budget 2009.10
28 (810 906) (3 393 179) 0 0 (762 754) (422 846) (437 490) (1 091 872) 0 (2 773 996) (1 409 381) (969 034) (420 158) (431 399) (12 923 015)
29 LESS EMPLOYEE COSTS CAPITALISED 0 0 0 0 0 0 0 0 0 0 0 0 0 0 0
30 LESS EMPLOYEE COSTS ALLOCATED TO OTHER OPERATING ITEMS 0 0 0 0 0 0 0 0 0 0 0 0 0 0 0
31 REMUNERATION OF COUNCILLORS (7 365 557) 0 0 0 0 0 0 0 0 0 0 0 0 0 (7 365 557)
32 WORKING CAPITAL RESERVE (2 100 000) 0 0 0 0 0 0 0 0 (4 200 000) 0 (5 250 000) (1 575 000) 0 (13 125 000)
33 COLLECTION COSTS 0 0 0 0 (8 000) 0 0 0 0 0 0 0 0 0 (8 000)
34 DEPRECIATION (GAMAP to add) (449 955) (2 780 676) 0 0 (107 128) (219 641) (58 875) (331 455) 0 (5 432 189) (2 300 538) (4 396 932) (651 104) 0 (16 728 492)
35 REPAIRS AND MAINTENANCE - MUNICIPAL ASSETS (agrees to line 41 for Prog Maint on F5.3)(138 149) (1 160 834) 0 0 (623 798) (120 000) (564 575) (748 785) 0 (2 761 625) (10 014 190) (3 620 062) (2 392 751) 0 (22 144 769)
36 INTEREST EXPENSE - EXTERNAL BORROWINGS (1 000 000) (3 008 244) 0 0 (478 804) 0 (834 320) 0 0 (4 117 109) (1 054 383) (904 800) (823 076) 0 (12 220 736)
37 REDEMPTION PAYMENTS - EXTERNAL BORROWINGS (GAMAP to remove) 0 0 0 0 0 0 0 0 0 0 0 0 0 0 0
38 BULK PURCHASES 0 0 0 0 0 0 0 0 0 0 0 0 (24 186 094) 0 (24 186 094)
39 CONTRACTED SERVICES 0 0 0 0 0 0 0 0 0 0 0 0 0 0 0
40 GRANTS & SUBSIDIES PAID (F4.2) (12 000 000) 0 0 0 0 0 0 0 0 0 0 0 0 0 (12 000 000)
41 GENERAL EXPENSES - OTHER (15 670 605) (7 524 113) 0 0 (2 929 406) (737 472) (617 745) (1 163 456) 0 (2 121 634) (4 134 554) (4 830 527) (6 240 642) (86 433) (46 056 587)
42 DEFICIT ON SALE OF ASSETS (GAMAP to add) 0 0 0 0 0 0 0 0 0 0 0 0 0 0 043 DIRECT OPERATING EXPENDITURE (44 262 836) (34 284 624) 0 0 (8 030 120) (3 467 469) (4 739 175) (8 944 582) 0 (35 251 518) (26 202 412) (24 323 789) (38 478 585) (2 773 601) (230 758 712)
44 INTERNAL TRANSFERS - (the items below must net out with the corresponding items under Income) 0 0 0 0 0 0 0 0 0 0 0 0 0 0 0
45 INTEREST - INTERNAL BORROWINGS 0 0 0 0 0 0 0 0 0 0 0 0 0 0 0
46 REDEMPTION - INTERNAL BORROWINGS (GAMAP to remove) 0 0 0 0 0 0 0 0 0 0 0 0 0 0 0
47 INTERNAL CHARGES (Activity Based Costing etc) 0 0 0 0 0 0 0 0 0 (5 272 073) 0 (3 880 933) (3 253 561) 0 (12 406 567)48 TOTAL OPERATING EXPENDITURE (44 262 836) (34 284 624) 0 0 (8 030 120) (3 467 469) (4 739 175) (8 944 582) 0 (40 523 590) (26 202 412) (28 204 722) (41 732 146) (2 773 601) (243 165 278)
49 OPERATING SURPLUS / (DEFICIT) - Total Income less Total Expenditure (37 099 286) 18 772 033 0 115 694 (7 612 080) (1 389 796) (4 533 853) (8 886 040) 0 64 917 861 (26 202 412) 20 306 941 34 431 189 (2 773 601) 50 046 651
50 LESS TAX 0 0 0 0 0 0 0 0 0 0 0 0 0 0 051 OPERATING SURPLUS / (DEFICIT) - AFTER TAX (37 099 286) 18 772 033 0 115 694 (7 612 080) (1 389 796) (4 533 853) (8 886 040) 0 64 917 861 (26 202 412) 20 306 941 34 431 189 (2 773 601) 50 046 651
52 DIVIDENDS PAID (Municipal Entities Only) 0 0 0 0 0 0 0 0 0 0 0 0 0 0 0
53 CROSS SUBSIDISATION 0 0 0 0 0 0 0 0 0 0 0 0 0 0 054 SURPLUS / (DEFICIT) AFTER TAX, DIVIDENDS and CROSS SUBSIDIES (37 099 286) 18 772 033 0 115 694 (7 612 080) (1 389 796) (4 533 853) (8 886 040) 0 64 917 861 (26 202 412) 20 306 941 34 431 189 (2 773 601) 50 046 651
55 PLUS OPENING UNAPPROPRIATED SURPLUS / (ACCUMULATED DEFICIT) 0 0 0 0 0 0 0 0 0 0 0 0 0 0 056 AVAILABLE UNAPPROPRIATED SURPLUS / (ACCUMULATED DEFICIT) (37 099 286) 18 772 033 0 115 694 (7 612 080) (1 389 796) (4 533 853) (8 886 040) 0 64 917 861 (26 202 412) 20 306 941 34 431 189 (2 773 601) 50 046 651
57 OTHER ADJUSTMENTS AND TRANSFERS 0 0 0 0 0 0 0 0 0 0 0 0 0 0 0
58 CONTRIBUTIONS FROM OPERATING (TO) CAPITAL (1 170 000) (429 000) 0 0 0 0 0 0 0 (2 240 000) (1 600 000) (44 602 000) 0 0 (50 041 000)
59 TRANSFERS FROM / (TO) OTHER RESERVES 0 0 0 0 0 0 0 0 0 0 0 0 0 0 0
60 PRIOR YEAR ADJUSTMENTS 0 0 0 0 0 0 0 0 0 0 0 0 0 0 061 CLOSING UNAPPROPRIATED SURPLUS / (ACCUMULATED DEFICIT) (38 269 286) 18 343 033 0 115 694 (7 612 080) (1 389 796) (4 533 853) (8 886 040) 0 62 677 861 (27 802 412) (24 295 059) 34 431 189 (2 773 601) 5 651
62 PLUS INTERESTS IN ENTITIES NOT WHOLLY OWNED 0 0 0 0 0 0 0 0 0 0 0 0 0 0 063 UNAPPROPRIATED SURPLUS / (ACCUMULATED DEFICIT) C/F TO BALANCE SHEET (38 269 286) 18 343 033 0 115 694 (7 612 080) (1 389 796) (4 533 853) (8 886 040) 0 62 677 861 (27 802 412) (24 295 059) 34 431 189 (2 773 601) 5 651
Adopted Budget 2009.10

F3 - OPERATING INCOME & EXPENDITURE BY FUNCTIONAL CLASSIFICATION (Summary Report)
2010/2011
DETAIL Executive &
Council
Finance &
Admin
Planning &
Development
Health Community&
Social ServicesHousing Public
Safety
Sport &
Recreation
Environmental
Health
Waste
Management
Road
Transport
Water Electricity Other Total
-1- -2- -3- -4- -5- -6- -7- -8- -9- -10- -11- -12- -13- -14-1 INCOME
2 PROPERTY RATES 0 21 149 392 0 0 0 0 0 0 0 0 0 0 0 0 21 149 392
3 PLUS PENALTIES IMPOSED 0 0 0 0 0 0 0 0 0 0 0 0 0 0 0
4 USER CHARGES FOR SERVICES 0 27 099 0 0 0 0 0 56 780 0 24 790 466 0 20 278 568 42 248 135 0 87 401 049
5 REGIONAL SERVICE LEVIES - Turnover 0 0 0 0 0 0 0 0 0 0 0 0 0 0 0
6 REGIONAL SERVICE LEVIES - Remuneration 0 0 0 0 0 0 0 0 0 0 0 0 0 0 0
7 RENT OF FACILITIES AND EQUIPMENT 0 516 250 0 10 915 54 562 0 0 4 690 0 0 0 0 0 0 586 416
8 INTEREST EARNED - EXTERNAL INVESTMENTS 0 3 078 913 0 0 0 0 0 0 0 0 0 0 0 0 3 078 913
9 INTEREST EARNED - OUTSTANDING DEBTORS 0 15 907 970 0 0 0 0 0 0 0 0 0 0 0 0 15 907 970
10 DIVIDENDS RECEIVED - EXTERNAL ENTITIES 0 0 0 0 0 0 0 0 0 0 0 0 0 0 0
11 FINES 0 0 0 0 5 360 0 215 589 0 0 0 0 0 0 0 220 949
12 LICENSES & PERMITS 0 2 100 0 0 0 0 0 0 0 0 0 0 0 0 2 100
13 INCOME FOR AGENCY SERVICES 0 0 0 0 0 0 0 0 0 0 0 0 0 0 0
14 OPERATING GRANTS & SUBSIDIES (agrees to line 18 of F4.1) 7 289 100 1 237 950 0 110 564 0 0 0 0 0 85 837 605 0 30 515 520 36 224 475 0 161 215 214
15 OTHER INCOME 232 628 786 095 0 0 379 020 2 181 556 0 0 0 85 453 0 143 159 1 498 891 0 5 306 802
16 SURPLUS ON SALE OF ASSETS (GAMAP to add) 0 0 0 0 0 0 0 0 0 0 0 0 0 0 0
17 OPERATING INCOME GENERATED 7 521 728 42 705 770 0 121 479 438 942 2 181 556 215 589 61 470 0 110 713 524 0 50 937 247 79 971 502 0 294 868 805
18 LESS INCOME FOREGONE (agrees to line 81 on F8) 0 (23 175) 0 0 0 0 0 0 0 0 0 0 0 0 (23 175)
19 DIRECT OPERATING INCOME 7 521 728 42 682 595 0 121 479 438 942 2 181 556 215 589 61 470 0 110 713 524 0 50 937 247 79 971 502 0 294 845 631
20 INTERNAL TRANSFERS – (the items below must net out with the corresponding items under expenditure) 0 0 0 0 0 0 0 0 0 0 0 0 0 0 0
21 INTEREST RECEIVED - INTERNAL LOANS 0 0 0 0 0 0 0 0 0 0 0 0 0 0 0
22 REDEMPTION RECEIVED - INTERNAL LOANS (GAMAP to remove) 0 0 0 0 0 0 0 0 0 0 0 0 0 0 0
23 INTERNAL RECOVERIES (Activity Based Costing etc) 0 13 026 895 0 0 0 0 0 0 0 0 0 0 0 0 13 026 895
24 DIVIDENDS RECEIVED - INTERNAL (from Municipal Entities) 0 0 0 0 0 0 0 0 0 0 0 0 0 0 0
25 TOTAL OPERATING INCOME 7 521 728 55 709 490 0 121 479 438 942 2 181 556 215 589 61 470 0 110 713 524 0 50 937 247 79 971 502 0 307 872 526
26 EXPENDITURE26 EXPENDITURE
27 EMPLOYEE RELATED COSTS - WAGES & SALARIES (4 964 045) (17 238 456) 0 0 (3 276 243) (2 065 886) (2 337 480) (5 889 465) 0 (14 537 213) (7 653 834) (4 570 057) (2 299 249) (2 368 557) (67 200 484)
28 EMPLOYEE RELATED COSTS - SOCIAL CONTRIBUTIONS (851 451) (3 562 838) 0 0 (800 892) (443 988) (459 365) (1 146 466) 0 (2 912 696) (1 479 850) (1 017 486) (441 166) (452 969) (13 569 166)
29 LESS EMPLOYEE COSTS CAPITALISED 0 0 0 0 0 0 0 0 0 0 0 0 0 0 0
30 LESS EMPLOYEE COSTS ALLOCATED TO OTHER OPERATING ITEMS 0 0 0 0 0 0 0 0 0 0 0 0 0 0 0
31 REMUNERATION OF COUNCILLORS (7 733 835) 0 0 0 0 0 0 0 0 0 0 0 0 0 (7 733 835)
32 WORKING CAPITAL RESERVE (2 205 000) 0 0 0 0 0 0 0 0 (4 410 000) 0 (5 512 500) (1 653 750) 0 (13 781 250)
33 COLLECTION COSTS 0 0 0 0 (8 400) 0 0 0 0 0 0 0 0 0 (8 400)
34 DEPRECIATION (GAMAP to add) (472 453) (2 919 710) 0 0 (112 484) (230 623) (61 818) (348 028) 0 (5 703 798) (2 415 564) (4 616 778) (683 659) 0 (17 564 917)
35 REPAIRS AND MAINTENANCE - MUNICIPAL ASSETS (agrees to line 41 for Prog Maint on F5.3)(145 057) (1 218 876) 0 0 (654 988) (126 000) (592 804) (786 224) 0 (2 899 706) (10 514 899) (3 801 065) (2 512 389) 0 (23 252 008)
36 INTEREST EXPENSE - EXTERNAL BORROWINGS (1 050 000) (3 158 657) 0 0 (502 744) 0 (876 036) 0 0 (4 322 964) (1 107 103) (950 040) (864 230) 0 (12 831 772)
37 REDEMPTION PAYMENTS - EXTERNAL BORROWINGS (GAMAP to remove) 0 0 0 0 0 0 0 0 0 0 0 0 0 0 0
38 BULK PURCHASES 0 0 0 0 0 0 0 0 0 0 0 0 (25 395 398) 0 (25 395 398)
39 CONTRACTED SERVICES 0 0 0 0 0 0 0 0 0 0 0 0 0 0 0
40 GRANTS & SUBSIDIES PAID (F4.2) (12 600 000) 0 0 0 0 0 0 0 0 0 0 0 0 0 (12 600 000)
41 GENERAL EXPENSES - OTHER (16 454 136) (7 900 319) 0 0 (3 068 207) (774 346) (648 632) (1 221 629) 0 (2 227 716) (4 341 282) (5 072 053) (6 552 674) (90 755) (48 351 747)
42 DEFICIT ON SALE OF ASSETS (GAMAP to add) 0 0 0 0 0 0 0 0 0 0 0 0 0 0 043 DIRECT OPERATING EXPENDITURE (46 475 977) (35 998 855) 0 0 (8 423 957) (3 640 843) (4 976 134) (9 391 811) 0 (37 014 094) (27 512 532) (25 539 979) (40 402 514) (2 912 281) (242 288 978)
44 INTERNAL TRANSFERS - (the items below must net out with the corresponding items under Income) 0 0 0 0 0 0 0 0 0 0 0 0 0 0 0
45 INTEREST - INTERNAL BORROWINGS 0 0 0 0 0 0 0 0 0 0 0 0 0 0 0
46 REDEMPTION - INTERNAL BORROWINGS (GAMAP to remove) 0 0 0 0 0 0 0 0 0 0 0 0 0 0 0
47 INTERNAL CHARGES (Activity Based Costing etc) 0 0 0 0 0 0 0 0 0 (5 535 676) 0 (4 074 980) (3 416 239) 0 (13 026 895)48 TOTAL OPERATING EXPENDITURE (46 475 977) (35 998 855) 0 0 (8 423 957) (3 640 843) (4 976 134) (9 391 811) 0 (42 549 770) (27 512 532) (29 614 958) (43 818 753) (2 912 281) (255 315 873)
49 OPERATING SURPLUS / (DEFICIT) - Total Income less Total Expenditure (38 954 250) 19 710 634 0 121 479 (7 985 015) (1 459 286) (4 760 545) (9 330 342) 0 68 163 754 (27 512 532) 21 322 288 36 152 748 (2 912 281) 52 556 653
50 LESS TAX 0 0 0 0 0 0 0 0 0 0 0 0 0 0 051 OPERATING SURPLUS / (DEFICIT) - AFTER TAX (38 954 250) 19 710 634 0 121 479 (7 985 015) (1 459 286) (4 760 545) (9 330 342) 0 68 163 754 (27 512 532) 21 322 288 36 152 748 (2 912 281) 52 556 653
52 DIVIDENDS PAID (Municipal Entities Only) 0 0 0 0 0 0 0 0 0 0 0 0 0 0 0
53 CROSS SUBSIDISATION 0 0 0 0 0 0 0 0 0 0 0 0 0 0 054 SURPLUS / (DEFICIT) AFTER TAX, DIVIDENDS and CROSS SUBSIDIES (38 954 250) 19 710 634 0 121 479 (7 985 015) (1 459 286) (4 760 545) (9 330 342) 0 68 163 754 (27 512 532) 21 322 288 36 152 748 (2 912 281) 52 556 653
55 PLUS OPENING UNAPPROPRIATED SURPLUS / (ACCUMULATED DEFICIT) 0 0 0 0 0 0 0 0 0 0 0 0 0 0 056 AVAILABLE UNAPPROPRIATED SURPLUS / (ACCUMULATED DEFICIT) (38 954 250) 19 710 634 0 121 479 (7 985 015) (1 459 286) (4 760 545) (9 330 342) 0 68 163 754 (27 512 532) 21 322 288 36 152 748 (2 912 281) 52 556 653
57 OTHER ADJUSTMENTS AND TRANSFERS 0 0 0 0 0 0 0 0 0 0 0 0 0 0 0
58 CONTRIBUTIONS FROM OPERATING (TO) CAPITAL (1 228 500) (450 450) 0 0 0 0 0 0 0 (2 352 000) (1 680 000) (46 832 100) 0 0 (52 543 050)
59 TRANSFERS FROM / (TO) OTHER RESERVES 0 0 0 0 0 0 0 0 0 0 0 0 0 0 0
60 PRIOR YEAR ADJUSTMENTS 0 0 0 0 0 0 0 0 0 0 0 0 0 0 061 CLOSING UNAPPROPRIATED SURPLUS / (ACCUMULATED DEFICIT) (40 182 750) 19 260 184 0 121 479 (7 985 015) (1 459 286) (4 760 545) (9 330 342) 0 65 811 754 (29 192 532) (25 509 812) 36 152 748 (2 912 281) 13 603
62 PLUS INTERESTS IN ENTITIES NOT WHOLLY OWNED 0 0 0 0 0 0 0 0 0 0 0 0 0 0 063 UNAPPROPRIATED SURPLUS / (ACCUMULATED DEFICIT) C/F TO BALANCE SHEET (40 182 750) 19 260 184 0 121 479 (7 985 015) (1 459 286) (4 760 545) (9 330 342) 0 65 811 754 (29 192 532) (25 509 812) 36 152 748 (2 912 281) 13 603

F3 - OPERATING INCOME & EXPENDITURE BY FUNCTIONAL CLASSIFICATION (Summary Report)
2011/2012
DETAIL Executive &
Council
Finance &
Admin
Planning &
Development
Health Community&
Social ServicesHousing Public
Safety
Sport &
Recreation
Environmental
Health
Waste
Management
Road
Transport
Water Electricity Other Total
-1- -2- -3- -4- -5- -6- -7- -8- -9- -10- -11- -12- -13- -14-1 INCOME
2 PROPERTY RATES 0 22 206 862 0 0 0 0 0 0 0 0 0 0 0 0 22 206 862
3 PLUS PENALTIES IMPOSED 0 0 0 0 0 0 0 0 0 0 0 0 0 0 0
4 USER CHARGES FOR SERVICES 0 28 454 0 0 0 0 0 59 619 0 26 029 989 0 21 292 497 44 360 542 0 91 771 101
5 REGIONAL SERVICE LEVIES - Turnover 0 0 0 0 0 0 0 0 0 0 0 0 0 0 0
6 REGIONAL SERVICE LEVIES - Remuneration 0 0 0 0 0 0 0 0 0 0 0 0 0 0 0
7 RENT OF FACILITIES AND EQUIPMENT 0 542 063 0 11 460 57 290 0 0 4 924 0 0 0 0 0 0 615 737
8 INTEREST EARNED - EXTERNAL INVESTMENTS 0 3 232 858 0 0 0 0 0 0 0 0 0 0 0 0 3 232 858
9 INTEREST EARNED - OUTSTANDING DEBTORS 0 16 703 369 0 0 0 0 0 0 0 0 0 0 0 0 16 703 369
10 DIVIDENDS RECEIVED - EXTERNAL ENTITIES 0 0 0 0 0 0 0 0 0 0 0 0 0 0 0
11 FINES 0 0 0 0 5 628 0 226 368 0 0 0 0 0 0 0 231 997
12 LICENSES & PERMITS 0 2 205 0 0 0 0 0 0 0 0 0 0 0 0 2 205
13 INCOME FOR AGENCY SERVICES 0 0 0 0 0 0 0 0 0 0 0 0 0 0 0
14 OPERATING GRANTS & SUBSIDIES (agrees to line 18 of F4.1) 7 653 555 1 299 848 0 116 092 0 0 0 0 0 90 129 485 0 32 041 296 38 035 699 0 169 275 975
15 OTHER INCOME 244 259 825 400 0 0 397 971 2 290 634 0 0 0 89 726 0 150 317 1 573 836 0 5 572 143
16 SURPLUS ON SALE OF ASSETS (GAMAP to add) 0 0 0 0 0 0 0 0 0 0 0 0 0 0 0
17 OPERATING INCOME GENERATED 7 897 814 44 841 058 0 127 553 460 889 2 290 634 226 368 64 543 0 116 249 200 0 53 484 109 83 970 077 0 309 612 246
18 LESS INCOME FOREGONE (agrees to line 81 on F8) 0 (24 334) 0 0 0 0 0 0 0 0 0 0 0 0 (24 334)
19 DIRECT OPERATING INCOME 7 897 814 44 816 724 0 127 553 460 889 2 290 634 226 368 64 543 0 116 249 200 0 53 484 109 83 970 077 0 309 587 912
20 INTERNAL TRANSFERS – (the items below must net out with the corresponding items under expenditure) 0 0 0 0 0 0 0 0 0 0 0 0 0 0 0
21 INTEREST RECEIVED - INTERNAL LOANS 0 0 0 0 0 0 0 0 0 0 0 0 0 0 0
22 REDEMPTION RECEIVED - INTERNAL LOANS (GAMAP to remove) 0 0 0 0 0 0 0 0 0 0 0 0 0 0 0
23 INTERNAL RECOVERIES (Activity Based Costing etc) 0 13 678 240 0 0 0 0 0 0 0 0 0 0 0 0 13 678 240
24 DIVIDENDS RECEIVED - INTERNAL (from Municipal Entities) 0 0 0 0 0 0 0 0 0 0 0 0 0 0 0
25 TOTAL OPERATING INCOME 7 897 814 58 494 964 0 127 553 460 889 2 290 634 226 368 64 543 0 116 249 200 0 53 484 109 83 970 077 0 323 266 152
26 EXPENDITURE26 EXPENDITURE
27 EMPLOYEE RELATED COSTS - WAGES & SALARIES (5 212 247) (18 100 379) 0 0 (3 440 055) (2 169 180) (2 454 354) (6 183 938) 0 (15 264 074) (8 036 526) (4 798 560) (2 414 212) (2 486 985) (70 560 508)
28 EMPLOYEE RELATED COSTS - SOCIAL CONTRIBUTIONS (894 024) (3 740 980) 0 0 (840 936) (466 188) (482 333) (1 203 789) 0 (3 058 331) (1 553 843) (1 068 360) (463 224) (475 617) (14 247 624)
29 LESS EMPLOYEE COSTS CAPITALISED 0 0 0 0 0 0 0 0 0 0 0 0 0 0 0
30 LESS EMPLOYEE COSTS ALLOCATED TO OTHER OPERATING ITEMS 0 0 0 0 0 0 0 0 0 0 0 0 0 0 0
31 REMUNERATION OF COUNCILLORS (8 120 527) 0 0 0 0 0 0 0 0 0 0 0 0 0 (8 120 527)
32 WORKING CAPITAL RESERVE (2 315 250) 0 0 0 0 0 0 0 0 (4 630 500) 0 (5 788 125) (1 736 438) 0 (14 470 313)
33 COLLECTION COSTS 0 0 0 0 (8 820) 0 0 0 0 0 0 0 0 0 (8 820)
34 DEPRECIATION (GAMAP to add) (496 076) (3 065 696) 0 0 (118 108) (242 154) (64 909) (365 430) 0 (5 988 988) (2 536 343) (4 847 617) (717 842) 0 (18 443 163)
35 REPAIRS AND MAINTENANCE - MUNICIPAL ASSETS (agrees to line 41 for Prog Maint on F5.3)(152 310) (1 279 819) 0 0 (687 737) (132 300) (622 444) (825 535) 0 (3 044 692) (11 040 644) (3 991 118) (2 638 008) 0 (24 414 608)
36 INTEREST EXPENSE - EXTERNAL BORROWINGS (1 102 500) (3 316 590) 0 0 (527 881) 0 (919 837) 0 0 (4 539 112) (1 162 458) (997 542) (907 441) 0 (13 473 361)
37 REDEMPTION PAYMENTS - EXTERNAL BORROWINGS (GAMAP to remove) 0 0 0 0 0 0 0 0 0 0 0 0 0 0 0
38 BULK PURCHASES 0 0 0 0 0 0 0 0 0 0 0 0 (26 665 168) 0 (26 665 168)
39 CONTRACTED SERVICES 0 0 0 0 0 0 0 0 0 0 0 0 0 0 0
40 GRANTS & SUBSIDIES PAID (F4.2) (13 230 000) 0 0 0 0 0 0 0 0 0 0 0 0 0 (13 230 000)
41 GENERAL EXPENSES - OTHER (17 276 842) (8 295 335) 0 0 (3 221 617) (813 063) (681 064) (1 282 710) 0 (2 339 101) (4 558 346) (5 325 656) (6 880 307) (95 292) (50 769 335)
42 DEFICIT ON SALE OF ASSETS (GAMAP to add) 0 0 0 0 0 0 0 0 0 0 0 0 0 0 043 DIRECT OPERATING EXPENDITURE (48 799 776) (37 798 798) 0 0 (8 845 155) (3 822 885) (5 224 941) (9 861 402) 0 (38 864 798) (28 888 159) (26 816 978) (42 422 640) (3 057 895) (254 403 427)
44 INTERNAL TRANSFERS - (the items below must net out with the corresponding items under Income) 0 0 0 0 0 0 0 0 0 0 0 0 0 0 0
45 INTEREST - INTERNAL BORROWINGS 0 0 0 0 0 0 0 0 0 0 0 0 0 0 0
46 REDEMPTION - INTERNAL BORROWINGS (GAMAP to remove) 0 0 0 0 0 0 0 0 0 0 0 0 0 0 0
47 INTERNAL CHARGES (Activity Based Costing etc) 0 0 0 0 0 0 0 0 0 (5 812 460) 0 (4 278 729) (3 587 051) 0 (13 678 240)48 TOTAL OPERATING EXPENDITURE (48 799 776) (37 798 798) 0 0 (8 845 155) (3 822 885) (5 224 941) (9 861 402) 0 (44 677 258) (28 888 159) (31 095 706) (46 009 691) (3 057 895) (268 081 667)
49 OPERATING SURPLUS / (DEFICIT) - Total Income less Total Expenditure (40 901 962) 20 696 166 0 127 553 (8 384 266) (1 532 250) (4 998 572) (9 796 859) 0 71 571 942 (28 888 159) 22 388 403 37 960 386 (3 057 895) 55 184 485
50 LESS TAX 0 0 0 0 0 0 0 0 0 0 0 0 0 0 051 OPERATING SURPLUS / (DEFICIT) - AFTER TAX (40 901 962) 20 696 166 0 127 553 (8 384 266) (1 532 250) (4 998 572) (9 796 859) 0 71 571 942 (28 888 159) 22 388 403 37 960 386 (3 057 895) 55 184 485
52 DIVIDENDS PAID (Municipal Entities Only) 0 0 0 0 0 0 0 0 0 0 0 0 0 0 0
53 CROSS SUBSIDISATION 0 0 0 0 0 0 0 0 0 0 0 0 0 0 054 SURPLUS / (DEFICIT) AFTER TAX, DIVIDENDS and CROSS SUBSIDIES (40 901 962) 20 696 166 0 127 553 (8 384 266) (1 532 250) (4 998 572) (9 796 859) 0 71 571 942 (28 888 159) 22 388 403 37 960 386 (3 057 895) 55 184 485
55 PLUS OPENING UNAPPROPRIATED SURPLUS / (ACCUMULATED DEFICIT) 0 0 0 0 0 0 0 0 0 0 0 0 0 0 056 AVAILABLE UNAPPROPRIATED SURPLUS / (ACCUMULATED DEFICIT) (40 901 962) 20 696 166 0 127 553 (8 384 266) (1 532 250) (4 998 572) (9 796 859) 0 71 571 942 (28 888 159) 22 388 403 37 960 386 (3 057 895) 55 184 485
57 OTHER ADJUSTMENTS AND TRANSFERS 0 0 0 0 0 0 0 0 0 0 0 0 0 0 0
58 CONTRIBUTIONS FROM OPERATING (TO) CAPITAL (1 289 925) (472 973) 0 0 0 0 0 0 0 (2 469 600) (1 764 000) (49 173 705) 0 0 (55 170 203)
59 TRANSFERS FROM / (TO) OTHER RESERVES 0 0 0 0 0 0 0 0 0 0 0 0 0 0 0
60 PRIOR YEAR ADJUSTMENTS 0 0 0 0 0 0 0 0 0 0 0 0 0 0 061 CLOSING UNAPPROPRIATED SURPLUS / (ACCUMULATED DEFICIT) (42 191 887) 20 223 194 0 127 553 (8 384 266) (1 532 250) (4 998 572) (9 796 859) 0 69 102 342 (30 652 159) (26 785 302) 37 960 386 (3 057 895) 14 283
62 PLUS INTERESTS IN ENTITIES NOT WHOLLY OWNED 0 0 0 0 0 0 0 0 0 0 0 0 0 0 063 UNAPPROPRIATED SURPLUS / (ACCUMULATED DEFICIT) C/F TO BALANCE SHEET (42 191 887) 20 223 194 0 127 553 (8 384 266) (1 532 250) (4 998 572) (9 796 859) 0 69 102 342 (30 652 159) (26 785 302) 37 960 386 (3 057 895) 14 283

SETSOTO MUNICIPALITYDRAFT BUDGET 2009/2010
DESCRIPTION ACTUAL BUDGET PROJECTED PROJECTED PROJECTED2007/2008 2008/2009 2009/2010 2010/2011 2011/2012
A BEXPENDITURESALARIES & ALLOWANCES -71 428 295 -73 654 285 -84 289 033 -88 503 485 -92 928 659GENERAL EXPENDITURE -60 124 066 -77 621 316 -94 657 248 -99 382 441 -104 351 563REPAIR & MAINTENANCE -7 009 852 -16 884 027 -22 144 769 -23 252 008 -24 414 608CAPITAL CHARGES -20 218 780 -24 548 192 -28 949 228 -30 396 689 -31 916 524CONTRIBUTION TO CAPITAL -1 484 136 -30 547 000 -50 041 000 -52 543 050 -55 170 203CONTRIBUTIONS -11 760 575 -12 500 000 -13 125 000 -13 781 250 -14 470 313SUB-TOTAL -172 025 703 -235 754 820 -293 206 278 -307 858 923 -323 251 869
LESS: CHARGED OUT 6 985 035 10 672 533 12 406 567 13 026 895 13 678 240TOTAL -165 040 668 -225 082 287 -280 799 712 -294 832 028 -309 573 629
INCOMEASSESSMENT RATES 22 787 497 23 422 278 20 120 207 21 126 217 22 182 528GRANTS & DONATIONS 198 237 909 110 498 500 153 538 299 161 215 214 169 275 975LEVIES: USER CHARGES 60 240 826 65 853 943 83 239 094 74 374 154 78 092 862OTHER 22 602 224 25 894 033 23 907 763 38 130 046 40 036 548TOTAL 303 868 455 225 668 754 280 805 362 294 845 631 309 587 912
SURPLUS / (DEFICIT) 138 827 787 586 467 5 651 13 603 14 283
Adopted Budget 2009.10

OPERATING INCOME & EXPENDITURE BY FUNCTIONAL CLASSIFICATION (Summary Report)
LINE AUDITED ACTUAL ORIGINAL
BUDGET
ACTUAL REVISED
BUDGET
PROJECTED
BUDGET
% VARIANCE
ORIGINAL BUDGET
PROJECTED
FORCAST
PROJECTED
FORCAST
PREVIOUS YEAR CURRENT YEAR CURRENT YTD CURRENT YEAR NEXT YEAR YEAR 1 to YEAR 0
DETAIL SUMMARY 2007/2008 2008/2009 2008/2009 2008/2009 2009/2010 [(4-2)/2]*100 2010/2011 2011/2012
-1- -2- -3- -4- -5- -6- -7-
1 INCOME
2 PROPERTY RATES 22 814 808 23 442 278 20 823 080 23 444 350 20 142 278 (14.08) 21 149 392 22 206 862
3 PLUS PENALTIES IMPOSED 0 0 0 0 0 0.00 0 0
4 USER CHARGES FOR SERVICES 67 225 861 76 526 476 66 721 125 72 494 585 83 239 094 8.77 87 401 049 91 771 101
5 REGIONAL SERVICE LEVIES - Turnover 0 0 0 0 0 0.00 0 0
6 REGIONAL SERVICE LEVIES - Remuneration 0 0 0 0 0 0.00 0 0
7 RENT OF FACILITIES AND EQUIPMENT 549 645 609 000 602 254 676 148 558 492 (8.29) 586 416 615 737
8 INTEREST EARNED - EXTERNAL INVESTMENTS 2 665 725 500 000 0 740 000 2 932 298 486.46 3 078 913 3 232 858
9 INTEREST EARNED - OUTSTANDING DEBTORS 14 428 998 12 000 000 16 464 262 17 500 000 15 150 448 26.25 15 907 970 16 703 369
10 DIVIDENDS RECEIVED - EXTERNAL ENTITIES 0 0 0 0 0 0.00 0 0
11 FINES 200 407 154 000 210 454 211 600 210 428 36.64 220 949 231 997
12 LICENSES & PERMITS 430 7 000 7 280 8 050 2 000 (71.43) 2 100 2 205
13 INCOME FOR AGENCY SERVICES 0 0 0 0 0 0.00 0 0
Adopted Budget 2009.10
13 INCOME FOR AGENCY SERVICES 0 0 0 0 0 0.00 0 0
14 OPERATING GRANTS & SUBSIDIES (agrees to line 26 of F4.1) 198 237 909 110 498 500 82 889 577 112 795 445 153 538 299 38.95 161 215 214 169 275 975
15 OTHER INCOME 4 757 018 1 951 500 1 856 121 2 317 891 5 054 098 158.99 5 306 802 5 572 143
16 SURPLUS ON SALE OF ASSETS (GAMAP to add) 246 644 0 0 0 0 0.00 0 0
17 OPERATING INCOME GENERATED 311 127 446 225 688 754 189 574 153 230 188 069 280 827 434 24.43 294 868 805 309 612 246
18 LESS INCOME FOREGONE (agrees to line 81 on F8.1) (27 312) (20 000) (22 071) (22 071) (22 071) 10.36 (23 175) (24 334)
19 DIRECT OPERATING INCOME 311 100 134 225 668 754 189 552 081 230 165 997 280 805 362 24.43 294 845 631 309 587 912
20 INTERNAL TRANSFERS – (the items below must net out with the corresponding items under expenditure)0 0 0 0 0 0.00 0 0
21 INTEREST RECEIVED - INTERNAL LOANS 0 0 0 0 0 0.00 0 0
22 REDEMPTION RECEIVED - INTERNAL LOANS (GAMAP to remove) 0 0 0 0 0 0.00 0 0
23 INTERNAL RECOVERIES (Activity Based Costing etc) 6 985 035 10 672 532 0 10 672 532 12 406 567 16.25 13 026 895 13 678 240
24 DIVIDENDS RECEIVED - INTERNAL (from Municipal Entities) 0 0 0 0 0 0.00 0 0
25 TOTAL OPERATING INCOME 318 085 169 236 341 287 189 552 081 240 838 530 293 211 929 24.06 307 872 526 323 266 152
26 EXPENDITURE
27 EMPLOYEE RELATED COSTS - WAGES & SALARIES (55 868 447) (56 520 981) (48 430 283) (60 298 515) (64 000 461) 13.23 (67 200 484) (70 560 508)
28 EMPLOYEE RELATED COSTS - SOCIAL CONTRIBUTIONS (9 054 825) (11 205 501) (8 830 682) (11 198 577) (12 923 015) 15.33 (13 569 166) (14 247 624)
29 LESS EMPLOYEE COSTS CAPITALISED 0 0 0 0 0 0.00 0 0
30 LESS EMPLOYEE COSTS ALLOCATED TO OTHER OPERATING ITEMS 0 0 0 0 0 0.00 0 0
31 REMUNERATION OF COUNCILLORS (6 505 023) (5 927 803) (5 876 535) (7 051 842) (7 365 557) 24.25 (7 733 835) (8 120 527)
32 WORKING CAPITAL RESERVE (11 760 575) (12 500 000) 0 (20 800 000) (13 125 000) 5.00 (13 781 250) (14 470 313)
33 COLLECTION COSTS 0 (5 000) 0 0 (8 000) 60.00 (8 400) (8 820)
34 DEPRECIATION (GAMAP to add) (15 564 032) (13 099 000) 0 (17 929 000) (16 728 492) 27.71 (17 564 917) (18 443 163)
35 REPAIRS AND MAINTENANCE - MUNICIPAL ASSETS (agrees to line 41 for Prog Maint on F5.3)(7 009 852) (16 884 027) (7 894 770) (10 409 674) (22 144 769) 31.16 (23 252 008) (24 414 608)
36 INTEREST EXPENSE - EXTERNAL BORROWINGS (4 654 748) (11 449 192) (465 082) (6 769 083) (12 220 736) 6.74 (12 831 772) (13 473 361)
37 REDEMPTION PAYMENTS - EXTERNAL BORROWINGS (GAMAP to remove) 0 0 0 0 0 0.00 0 0
38 BULK PURCHASES (14 775 478) (19 348 875) (16 131 844) (19 358 213) (24 186 094) 25.00 (25 395 398) (26 665 168)
39 CONTRACTED SERVICES 0 0 0 0 0 0.00 0 0
40 GRANTS & SUBSIDIES GIVEN (F4.2) (7 008 192) (10 005 000) 0 (10 005 000) (12 000 000) 19.94 (12 600 000) (13 230 000)
Adopted Budget 2009.10

41 GENERAL EXPENSES - OTHER (31 355 361) (37 589 908) (24 702 954) (35 723 358) (46 056 587) 22.52 (48 351 747) (50 769 335)
42 DEFICIT ON SALE OF ASSETS (GAMAP to add) (266 149) 0 0 0 0 0.00 0 0
43 DIRECT OPERATING EXPENDITURE (163 822 682) (194 535 287) (112 332 150) (199 543 262) (230 758 712) 18.62 (242 288 978) (254 403 427)
44 INTERNAL TRANSFERS - (the items below must net out with the corresponding items under Income) 0 0 0 0 0 0.00 0 0
45 INTEREST - INTERNAL BORROWINGS 0 0 0 0 0 0.00 0 0
46 REDEMPTION - INTERNAL BORROWINGS (GAMAP to remove) 0 0 0 0 0 0.00 0 0
47 INTERNAL CHARGES (Activity Based Costing etc) (6 985 035) (10 672 533) (199) (10 672 533) (12 406 567) 16.25 (13 026 895) (13 678 240)
48 TOTAL OPERATING EXPENDITURE (170 807 717) (205 207 820) (112 332 348) (210 215 795) (243 165 278) 18.50 (255 315 873) (268 081 667)
49 OPERATING SURPLUS / (DEFICIT) - Total Income less Total Expenditure 147 277 453 31 133 467 77 219 733 30 622 734 50 046 651 60.75 52 556 653 55 184 485
50 LESS TAX 0 0 0 0 0 0.00 0 0
51 OPERATING SURPLUS / (DEFICIT) - AFTER TAX 147 277 453 31 133 467 77 219 733 30 622 734 50 046 651 60.75 52 556 653 55 184 485
52 DIVIDENDS PAID (Municipal Entities Only) 0 0 0 0 0 0.00 0 0
53 CROSS SUBSIDISATION 0 0 0 0 0 0.00 0 0
54 SURPLUS / (DEFICIT) AFTER TAX, DIVIDENDS and CROSS SUBSIDIES 147 277 453 31 133 467 77 219 733 30 622 734 50 046 651 60.75 52 556 653 55 184 485
55 PLUS OPENING UNAPPROPRIATED SURPLUS / (ACCUMULATED DEFICIT) 0 0 0 0 0 0.00 0 0
56 AVAILABLE UNAPPROPRIATED SURPLUS / (ACCUMULATED DEFICIT) 147 277 453 31 133 467 77 219 733 30 622 734 50 046 651 60.75 52 556 653 55 184 485
57 OTHER ADJUSTMENTS AND TRANSFERS 0 0 0 0 0 0.00 0 0
58 CONTRIBUTIONS FROM OPERATING (TO) CAPITAL (1 484 136) (30 547 000) (1 820 500) (30 427 000) (50 041 000) 63.82 (52 543 050) (55 170 203)
59 TRANSFERS FROM / (TO) OTHER RESERVES 0 0 0 0 0 0.00 0 0
60 PRIOR YEAR ADJUSTMENTS 0 0 0 0 0 0.00 0 0
61 CLOSING UNAPPROPRIATED SURPLUS / (ACCUMULATED DEFICIT) 145 793 317 586 467 75 399 233 195 734 5 651 (99.04) 13 603 14 283
62 PLUS INTERESTS IN ENTITIES NOT WHOLLY OWNED 0 0 0 0 0 0.00 0 0
Adopted Budget 2009.10
62 PLUS INTERESTS IN ENTITIES NOT WHOLLY OWNED 0 0 0 0 0 0.00 0 0
63 UNAPPROPRIATED SURPLUS / (ACCUMULATED DEFICIT) C/F TO BALANCE SHEET 145 793 317 586 467 75 399 233 195 734 5 651 (99.04) 13 603 14 283
Adopted Budget 2009.10

TARIFF TARIFF TARIFF
DESCRIPTION No VAT No VAT Inc Vat2008/2009 2009/2010 2009/2010
Photocopies
- Photostats A4 2.19 2.19 2.50
- Photostats A3 4.56 4.56 5.20
Copies of Maps 65.00 65.00 74.10
Clearance Certificate 70.00 70.00 79.80
Valuation Certificate 70.00 70.00 79.80
Look-up-fees per hour or part per hour 6.00 6.00 6.84
Building Plan Copies 70.00 70.00 79.80
Faxes : Per page
- Sending 6.00 6.00 6.84
- Receiving 6.00 6.00 6.84
Voters roll per page 2.50 2.50 2.85
Valuation Roll per unit 700.00 700.00 798.00
Address Roll per unit 700.00 700.00 798.00
Posters :
- Deposit 300.00 300.00 342.00
- Rental per poster 0.50 0.50 0.57
Enquiry Fees -per hour of part thereof (Special Requests) 40.00 40.00 45.60
Deeds Office Enquiries per property (Aktex) 30.00 30.00 34.20
Pointing of Site Pens - Surveyor Costs plus 10.00% 10.00%
Pound Fees per day (per head) -
Only for Cattle, Horses and Donkeys
First day 70.00 70.00 79.80
Second Day and longer per day 70.00 70.00 79.80
Only for Buck, Sheep and Pigs
First day 20.00 20.00 22.80
Second Day and longer per day 20.00 20.00 22.80
Wood (if available)
- Droppers (if available)
Per 100 for 1.2m lengths 120.00 120.00 136.80
Per 100 for 1.8m lengths 180.00 180.00 205.20
- Selling of Wood (if available)
Per bundle carried by single human 20.00 20.00 22.80
Dry wood per cubic meter 70.00 70.00 79.80
Saw Timber per cubic meter (chopped) 180.00 180.00 205.20
Saw Timber - 1 meter lengts 90.00 90.00 102.60
Per Bag 20.00 20.00 22.80
Valuation Objection Fees
- Per property with a minimum of R 3500-00 if less than four
objections, there after 300.00 300.00 342.00
Encroachments on sidewalks
- Application for advertising boards and other encroachments
* Permanent structure per year plus 10% escalation per year 270.00 270.00 307.80
* Temporary structure per year plus 10% escalation per year 220.00 220.00 250.80
Building Approvals/Inspections Fees
- Residential Sites
0-100m2 65.00 65.00 74.10
101-200m2 185.00 185.00 210.90
201-300m2 250.00 250.00 285.00
301m2+ 400.00 400.00 456.00
- Sewerage Inspect - Per sewerage point (new buildings) 30.00 30.00 34.20
- Trading and Industrial Sites
0-200m2 400.00 400.00 456.00
201-500m2 650.00 650.00 741.00
501m2+ 1 500.00 1 500.00 1 710.00
- Sewerage Inspect - Per sewerage point (new buildings) 35.00 35.00 39.90
Debtors Collection Fee
Default charge 50.00 50.00 57.00
CORPORATE SERVICES
Adopted Budget 2009.10

TARIFF TARIFF TARIFF
DESCRIPTION No VAT No VAT Inc Vat2008/2009 2009/2010 2009/2010
TOWN :
- Selling of graves:
- Adults 450.00 450.00 513.00
- Children under the age of 10 250.00 250.00 285.00
- Stillborn No charge No charge No charge
- Non Residence 750.00 750.00 855.00
TOWN SHIP :
- Residence 120.00 120.00 136.80
- Children under the age of 10 90.00 90.00 102.60
- Stillborn No charge No charge No charge
- Non Residence 500.00 500.00 570.00
OPEN AND CLOSURE
Weekdays 200.00 200.00 228.00
Weekends & Public Holidays 350.00 350.00 399.00
Burial on top of each other 350.00 350.00 399.00
Erection of Tombstone plans 20.00 20.00 22.80
Wall of Remembrance :
- Residence 400.00 400.00 456.00
- Non Residence 500.00 500.00 570.00
Muslim Graves 650.00 650.00 741.00
Erection / Replacement of tombstones :
- Residence 85.00 85.00 96.90
- None Residence 150.00 150.00 171.00
Traffic Assistance / Escourt 500.00 500.00 570.00
CEMETRIES
Adopted Budget 2009.10

LIBRARY
TARIFF TARIFF TARIFF
DESCRIPTION No VAT No VAT Inc Vat2008/2009 2009/2010 2009/2010
Penalty Fees
Per Book per Week 1.50 1.50 1.71
Donation for Lecture Hall 120.00 120.00 136.80
Cultural Organisations 170.00 170.00 193.80
Membership \ Subscription
Rate Payers 7.50 7.50 8.55
Non Rate Payers 50.00 50.00 57.00
Rental of Library Halls
Deposit 200.00 200.00 228.00
Rent - 08:00-17:00 100.00 100.00 114.00
Rent - 17:00-24:00 150.00 150.00 171.00
Adopted Budget 2009.10

TARIFF TARIFF TARIFF
DESCRIPTION No VAT No VAT Inc Vat2008/2009 2009/2010 2009/2010
Parking Area
- Busses per day 25.00 25.00 28.50
- Taxi / Busses Loading 4.00 4.00 4.56
Vendors
- per day 5.00 5.00 5.70
- weekly 20.00 20.00 22.80
- monthly 75.00 75.00 85.50
Caravan Park
Out of Season tariff (03 January to 31 October each year)
- overnight tariff - first four persons 78.95 78.95 90.00
- per extra person 13.16 13.16 15.00
- additional vehicle 17.54 17.54 20.00
Day visitor to park 21.93 21.93 25.00
Pensioners visiting park
- Overnight tariff - first four persons 43.86 43.86 50.00
- per extra person 6.58 6.58 7.50
- day visitor 10.97 10.97 12.50
Maximum of six (6) persons per stand
Contractors - an additional 17.54 17.54 20.00
- no storage of any material / vehicles /
equipment
In Season tariff (01 November to 02 January each year)
- overnight tariff - first four persons 157.90 157.90 180.01
- per extra person 26.32 26.32 30.00
- additional vehicle 35.08 35.08 39.99
Day visitor to park 43.86 43.86 50.00
Pensioners visiting park
- Overnight tariff - first four persons 87.72 87.72 100.00
- per extra person 13.16 13.16 15.00
- day visitor 21.93 21.93 25.00
Maximum of six (6) persons per stand
Contractors - an additional 35.09 35.09 40.00
- no storage of any material / vehicles /
equipment
Abattoir
- Inspections Fees
Cattle 10.00 10.00 11.40
Calf 4.00 4.00 4.56
Sheep 2.00 2.00 2.28
Pigs 5.00 5.00 5.70
Suckling 3.00 3.00 3.42
Tripe per kg 0.75 0.75 0.86
Sundry
Sale of Sand Per 6 m3 250.00 250.00 285.00
Sale of Gravel Per 6 m3 250.00 250.00 285.00
Hire of Back-actor Per Hour - Driver included 350.00 350.00 399.00
Hire of Grader Per Hour - Driver included 600.00 600.00 684.00
PROPERTIES
Adopted Budget 2009.10

TARIFF TARIFF TARIFF
DESCRIPTION No VAT No VAT Inc Vat2008/2009 2009/2010 2009/2010
A DEPOSIT TO BE PAID AT ALL TIMES.
DEPOSIT FOR RATE PAYERS
Halls 300.00 300.00 300.00
Crockery 300.00 300.00 300.00
DEPOSIT FOR NON RATE PAYERS
Halls 800.00 800.00 800.00
Crockery 800.00 800.00 800.00
RENTAL
Rate Payers
Town Hall
per day or part thereof 263.16 263.16 300.00
Extra day for preparations after 17h00 105.26 105.26 120.00
Organisation with WO nr
S A Police (not recruting purposes)
Clinic
Schools without halls
Church
Repitions
Non Rate Payers
Town Hall
per day or part thereof 350.00 350.00 399.00
Horticultural Hall
per day or part thereof 180.00 180.00 205.20
repititions (each) 25.00 25.00 28.50
Sports Sessions (between 08:00-17:00) 25.00 25.00 28.50
(between 17:00-24:00) 40.00 40.00 45.60
Township Community Halls & LDF Sports Hall
if no entrance fee is charged & for community organisations
LDF Hall 40.00 40.00 45.60
Community Halls 75.00 75.00 85.50
if entrance fee is charged & for Political Meetings
LDF Hall 75.00 75.00 85.50
Community Halls 120.00 120.00 136.80
Sportsclubs per year or part thereof (only if hall is not needed
for other purposes) - Only Communit Halls and LDF Hall
Maximum of 4 hours per week per club 132.00 132.00 150.48
Stadiums and Open Grounds
Townships
Deposit 100.00 100.00 100.00
Practise session per activity per day or part thereof 65.00 65.00 74.10
Matches per activity per day or part thereof 100.00 100.00 114.00
Any other non-sport functions 120.00 120.00 136.80
Rent : 06:00-18:00 120.00 120.00 136.80
Towns
Deposit 400.00 400.00 400.00
Practise session per activity per day or part thereof 100.00 100.00 114.00
Matches per activity per day or part thereof 150.00 150.00 171.00
Rent : 06:00-18:00 120.00 120.00 136.80
Rent after 18:00 without lights 140.00 140.00 159.60
Rent after 18:00 with lights 180.00 180.00 205.20
Any other non-sport functions 200.00 200.00 228.00
300.00 300.00 342.00
Cricket Field
Practise session per activity per day or part thereof 100.00 100.00 114.00
Rent : 09:00-19:00 180.00 180.00 205.20
Rent with lights 240.00 240.00 273.60
Athletic Track (Unmarked) per day or part thereof 240.00 240.00 273.60
TOWN HALL & BUILDINGS
Adopted Budget 2009.10
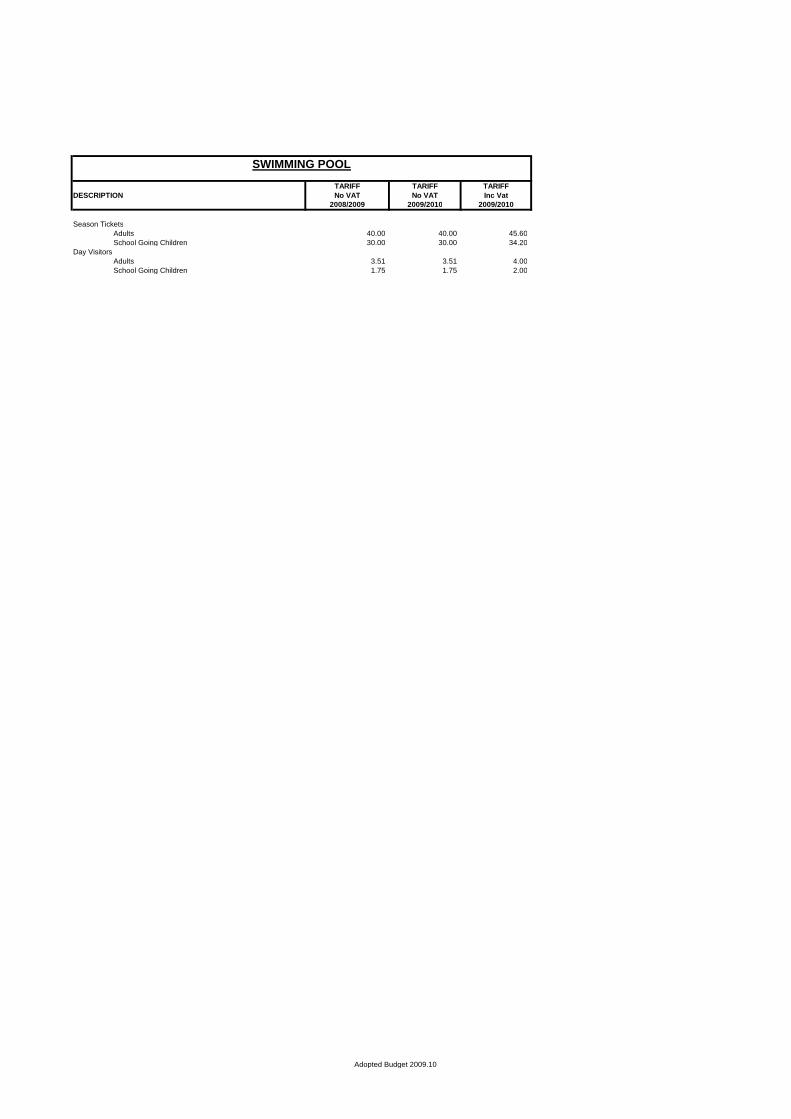
SWIMMING POOL
TARIFF TARIFF TARIFF
DESCRIPTION No VAT No VAT Inc Vat2008/2009 2009/2010 2009/2010
Season Tickets
Adults 40.00 40.00 45.60
School Going Children 30.00 30.00 34.20
Day Visitors
Adults 3.51 3.51 4.00
School Going Children 1.75 1.75 2.00
Adopted Budget 2009.10

TARIFF TARIFF TARIFF
DESCRIPTION No VAT No VAT Inc Vat2008/2009 2009/2010 2009/2010
VELD FIRES
Area of Rate Payers
Call out fee - payable by owner 100.00 100.00 114.00
Area outside of Rate Payers
Call out fee - payable by owner 700.00 700.00 798.00
Running cost per vehicle per kilometer 2.75 2.75 3.14
Tariff per hour 550.00 550.00 627.00
PROTECTION SERVICES
Adopted Budget 2009.10

TARIFF TARIFF TARIFF
DESCRIPTION No VAT No VAT Inc Vat2008/2009 2009/2010 2009/2010
Public / Residential
Site 0.0438
Improvements 0.0162
Market Value 0.1000
Government / State Owned
Site 0.6086
Improvements 0.0397
Market Value 0.1000
Business / Industrial
Site 0.1389
Improvements 0.0111
Market Value 0.2000
Farms / Agricultural
Site 0.0015
Improvements 0.0015
Market Value 0.025
Public Service Infrastructure
Market Value 0.025
Exemptions, Rebates, Discounts & Reductions.
As stipulated in the Council's Rates Policy and Rates By-Law
Settlement Discount
ASSESSMENT RATES
Residential Properties: If the full current Resitential service account are paid before or on the last day of each month
Agricultural Properties: If the full years Agricultural rates account are paid/setteled before or on the last day of August
Adopted Budget 2009.10

TARIFF TARIFF TARIFF
DESCRIPTION No VAT No VAT Inc Vat2008/2009 2009/2010 2009/2010
Availibility: 44.45 51.12 58.27
Basic Charges
Domestic 114.43 131.59 150.02
Business 141.27 162.46 185.20
Industrial High > 15000 kwh 1 610.36 1 851.91 2 111.18
Industrial Low < 15000 kwh 107.95 124.14 141.52
Small Holdings / Farms 171.45 197.17 224.77
Goverment & Provincial 259.00 297.85 339.55
School Hostels 114.43 131.59 150.02
Sport 103.60 119.14 135.82
Municipal use 103.60 119.14 135.82
Unit Price per Kwh
Domestic (First 50 Kwh free) 0.43 0.49 0.56
Business (No free Kwh applicable) 0.44 0.51 0.58
Small Holdings / Farms (No free Kwh applicable) 0.48 0.55 0.63
Goverment & Provincial (No free Kwh aplicable) 0.66 0.76 0.87
Sport (No free Kwh aplicable) 0.46 0.53 0.60
Municipal use (No free Kwh aplicable) 0.50 0.58 0.66
Single rate tariff / Prepaid 0.58 0.67 0.76
Bulk Users
K V A High voltage 68.17 78.40 89.37
K V A Low voltage 62.87 72.30 82.42
0 - 15000 0.29 0.33 0.380
15001 > 0.25 0.29 0.328
Deposit
Domestic 500.00 500.00
Business 700.00 700.00
Non Citizen - Domestic 1 000.00 1 000.00
Non Citizen - Business 1 400.00 1 400.00
New Connections
Domestic Single Phase 1 500.00 1 500.00 1 710.000
Business Single Phase 3 000.00 3 000.00 3 420.000
Domestic Other - Cost plus 10.00% 10.00%
Business Other - Cost plus 10.00% 10.00%
or actual cost which ever is the highest.
Re Connection cost
Domestic 1 000.00 1 000.00 1 140.000
Business 1 000.00 1 000.00 1 140.000
Testing of Meters 150.00 150.00 171.000
The Financial Manager will charge a Deposit to his own discretion on any
applicants who are not a South African citizen.
ELECTRICITY
Adopted Budget 2009.10

TARIFF TARIFF TARIFF
DESCRIPTION No VAT No VAT Inc Vat2008/2009 2009/2010 2009/2010
HOUSEHOLD
Township 47.01 47.01 53.59
Town 57.17 57.17 65.18
Business
Town & Township Factor Value 59.71 59.71 68.07
Business to start with a value of 2
All Business' must be valued by Enviromental Health Officers
Tuckshop 47.01 47.01 53.59
Provincial & Government Buildings 160.08 160.08 182.49
Garden Refuse 101.64 101.64 115.87
Building Rubble per 8 ton Load 1 000.00 1 000.00 1 140.00
Cleaning of Sites ( Vacant Sites Only) 500.00 500.00 570.00
Removal of Carcass
Cattle 200.00 200.00 228.00
Other Than Cattle 100.00 100.00 114.00
Services to be rendered once a week.
REFUSE SERVICES
Adopted Budget 2009.10

TARIFF TARIFF TARIFF
DESCRIPTION No VAT No VAT Inc Vat2008/2009 2009/2010 2009/2010
Bucket System / VIP System 36.84 36.84 42.00
Domestic 47.01 47.01 53.59
Septic Tank 47.01 47.01 53.59
Septic Tank Indigent only - - -
Business 68.61 68.61 78.21
Provincial Administration 161.35 161.35 183.94
- Hospitals 470.09 470.09 535.90
- Jails 533.61 533.61 608.32
Availability 26.05 26.05 29.69
Services:
Blockages office hours 80.00 80.00 91.20
after hours 160.00 160.00 182.40
Inspection fees 40.00 40.00 45.60
Connection Fees or actual cost, which ever is 1 500.00 1 500.00 1 710.00
the highest.
Service based on once per week
SEWERAGE SERVICES
Adopted Budget 2009.10

TARIFF TARIFF TARIFF
DESCRIPTION No VAT No VAT Inc Vat2008/2009 2009/2010 2009/2010
Availibility: 45.12 45.12 51.44
Basic Charge
Domestic Use
Fully Connected Site with Meter 53.26 53.26 60.72
Site with Communial Tap/Basic charge 45.12 45.12 51.44
Site with tap without meter 52.76 52.76 60.15
Business 67.37 67.37 76.81
Small Holdings 64.60 64.60 73.65
Government & Provincial 165.10 165.10 188.22
Sports Clubs 129.21 129.21 147.30
Unit Price
0 - 6 (Domestic users only) 0.00 - -
0 - 6 (All other users and consumers) 2.13 2.13 2.42
6,1 - 10 2.50 2.50 2.85
10,1 - 20 2.73 2.73 3.12
20,1 - 30 3.01 3.01 3.43
30,1 > 3.24 3.24 3.69
Municipal Use & Sports Clubs 2.30 2.30 2.62
Deposit
Household 200.00 200.00 200.00
Business 400.00 400.00 400.00
Non Citizen - Domestic 400.00 400.00 400.00
Non Citizen - Business 800.00 800.00 800.00
New Connection
Household 949.69 997.18 1 136.78
Business 2 374.23 2 492.94 2 841.95
or actual cost, which ever is the highest.
Re-Connection
Household 273.46 273.46 311.74
Business 410.19 410.19 467.62
No Charge to be levied for Call Out
Testing of Watermeters 150.00 150.00 171.00
Prepaid Water meters
Tariff to be determined once meters are installed.
WATER SERVICES
Adopted Budget 2009.10

DESCRIPTION
Cleansing services 5.00%
Sewer services 5.00%
Electricity services 8.00%
Water services 5.00%
Departmental Income2009/2010
ADMINISTRATION COST
% of
Adopted Budget 2009.10

DESCRIPTION
INCOME CATEGORY
A R 0 - R 800 per household per month 100%
B R 801 - R 1000 per household per month 80%
C R 1001 - R 1200 per household per month 60%
D R 1201 - R1400 per household per month 25%
PROPOSED INDIGENT SUBSIDY
%
SUBSIDY2009/2010
Adopted Budget 2009.10

SETSOTO LOCAL MUNICIPALITY
CAPITAL PROJECTS 2006/2011ITEM No. IDP REF. UNIT Fin.Resource 2010/2011 2011/2012 Details 2008/2009 2009/2010
TECHNICAL - ADMIN FURNITURE AND EQUIPMENT Income 0
ELECTRICITY VEHICLES, TOOLS AND EQUIPMENTClocolan/Hlohlolwane Income
ELECTRICITY VEHICLES, TOOLS AND EQUIPMENTSenekal/Matwabeng Grants - Conditional Transformer - Zuiderstr 300 000
ELECTRICITY VEHICLES, TOOLS AND EQUIPMENTSenekal/Matwabeng Grants - Conditional Mini Sub De Rust 350 000
ELECTRICITY NETWORK Senekal/Matwabeng Grants - Conditional Network 600 000
ELECTRICITY VEHICLES, TOOLS AND EQUIPMENTSenekal/Matwabeng Loans 1 x Cherry picker 400 000 450 000
ELECTRICITY VEHICLES, TOOLS AND EQUIPMENTSenekal/Matwabeng Loans 2 x LDV 160 000 324 000
ELECTRICITY NETWORK Senekal/Matwabeng Loans Income Minisub De Rust
ELECTRICITY NETWORK Senekal/Matwabeng Loans Remove Overhead Lines - Lange Street 350 000
ELECTRICITY NETWORK Senekal/Matwabeng Loans 11 Kv Cable Bell Street 400 000
ELECTRICITY VEHICLES, TOOLS AND EQUIPMENTFicksburg/Meqheleng Loans 1 x Cherry picker 450 000
ELECTRICITY VEHICLES, TOOLS AND EQUIPMENTFicksburg/Meqheleng Loans 1 x LDV 160 000
ELECTRICITY VEHICLES, TOOLS AND EQUIPMENTFicksburg/Meqheleng Loans 1 x Cable detector 200 000
ELECTRICITY VEHICLES, TOOLS AND EQUIPMENTFicksburg/Meqheleng Loans 1 x Cable locater 90 000
ELECTRICITY NETWORK Ficksburg/Meqheleng Loans Upgrading substation 400 000
ELECTRICITY NETWORK Ficksburg/Meqheleng Loans Mini sub jail 350 000
ELECTRICITY NETWORK Ficksburg/Meqheleng Loans Replacement overhead lines 500 000
ELECTRICITY NETWORK Marquard/Moemaneng Grants - Conditional Upgrade - Network 500 000 0
WATER VEHICLES AND EQUIPMENT Loans
WATER NETWORK All Units Grants - MIG Sparta Development: Raising of wall 15 000 000
WATER VEHICLES AND EQUIPMENT All Units Grants - Conditional P M U
WATER TOOLS & EQUIPMENT Ficksburg/Meqheleng Loans Tools & Equipment 80 000
WATER VEHICLES AND EQUIPMENT Ficksburg/Meqheleng Loans 3 x LDV 150 000 510 000
WATER EQUIPMENT Ficksburg/Meqheleng Loans Computers & Software(Laptops) 45 000
WATER NETWORK Loans Raw water pumps 800 000
WATER NETWORK Ficksburg/Meqheleng Loans Fencing-Water purification 100 000 300 000
WATER NETWORK Ficksburg/Meqheleng Grants - MIG Upgrading: Bulk water supply 26 315 789
WATER NETWORK Marquard/Moemaneng Grants - MIG Upgrading-Water plant 5 700 000 1 786 211
WATER NETWORK Marquard/Moemaneng Loans Fencing - New hope dam 420 000 480 000
WATER NETWORK Marquard/Moemaneng Loans Telemetrix 100 000 150 000
WATER VEHICLES AND EQUIPMENT Marquard/Moemaneng Loans 1 x LDV 170 000
WATER NETWORK Senekal/Matwabeng Loans Flocculant channel 500 000 500 000
WATER NETWORK Senekal/Matwabeng Grants - MIG Upgrading-Water water treatment 1 500 000
WATER VEHICLES AND EQUIPMENT Senekal/Matwabeng Loans 1 x 2 Ton truck 300 000 300 000
WATER VEHICLES AND EQUIPMENT Senekal/Matwabeng Loans 1 x LDV 170 000
WATER VEHICLES AND EQUIPMENT Clocolan/Hlohlolwane Loans 2 x LDV 150 000 340 000
WATER NETWORK Clocolan/Hlohlolwane Loans Testing equipment 80 000
WATER NETWORK Clocolan/Hlohlolwane Grants - Conditional New pumpstation 500 000
ROADS AND STORMWATER VEHICLES AND EQUIPMENT Loans
ROADS AND STORMWATER NETWORK Senekal/Matwabeng Loans Upgrading access street
ROADS AND STORMWATER VEHICLES AND EQUIPMENT Senekal/Matwabeng Loans 1 x 3 truck 220 000
ROADS AND STORMWATER VEHICLES AND EQUIPMENT Senekal/Matwabeng Loans 1 x Compressor 300 000
ROADS AND STORMWATER VEHICLES AND EQUIPMENT Senekal/Matwabeng Loans 1 x Bomac Roiler 150 000
ROADS AND STORMWATER VEHICLES AND EQUIPMENT Senekal/Matwabeng Loans 1 x Compactor 30 000
ROADS AND STORMWATER VEHICLES AND EQUIPMENT Senekal/Matwabeng Loans 1 x Water tank 50 000
ROADS AND STORMWATER VEHICLES AND EQUIPMENT Senekal/Matwabeng Loans 1 x Back actor 350 000
ROADS AND STORMWATER NETWORK Senekal/Matwabeng Loans Re-sealing of Tar Roads 1 000 000
ROADS AND STORMWATER NETWORK Ficksburg/Meqheleng Loans Busroute
ROADS AND STORMWATER NETWORK Ficksburg/Meqheleng Loans Upgrading access street
ROADS AND STORMWATER VEHICLES AND EQUIPMENT Ficksburg/Meqheleng Loans 1xGrader 1 000 000
ROADS AND STORMWATER VEHICLES AND EQUIPMENT Ficksburg/Meqheleng Loans 1xTipper
ROADS AND STORMWATER VEHICLES AND EQUIPMENT Ficksburg/Meqheleng Loans 1XRoller
ROADS AND STORMWATER VEHICLES AND EQUIPMENT Marquard/Moemaneng Loans 1xTipper
Adopted Budget 2009.10

ROADS AND STORMWATER VEHICLES AND EQUIPMENT Marquard/Moemaneng Loans 1xGrader
ROADS AND STORMWATER VEHICLES AND EQUIPMENT Marquard/Moemaneng Loans 1xTipper
ROADS AND STORMWATER NETWORK Marquard/Moemaneng Loans Upgrading access street
ROADS AND STORMWATER VEHICLES AND EQUIPMENT Marquard/Moemaneng Loans 1 x Grader 1 700 000
ROADS AND STORMWATER VEHICLES AND EQUIPMENT Marquard/Moemaneng Loans Front end loader 950 000
ROADS AND STORMWATER VEHICLES AND EQUIPMENT Marquard/Moemaneng Loans Spinnekop Tractor Sweeper 415 000
ROADS AND STORMWATER NETWORK Marquard/Moemaneng Loans Tar roads re-seal
ROADS AND STORMWATER NETWORK Marquard/Moemaneng Loans Gravel roads 380 000
ROADS AND STORMWATER NETWORK Marquard/Moemaneng Loans Stormwater 406 000
ROADS AND STORMWATER NETWORK All units Loans Street naming
ROADS AND STORMWATER VEHICLES AND EQUIPMENT Ficksburg/Meqheleng Loans 1 x 1,5 Ton flat Deck LDV(Tipper like) 150 000 165 000
ROADS AND STORMWATER VEHICLES AND EQUIPMENT Ficksburg/Meqheleng Loans 2 x 2 Ton Double axle trailers 350 000
ROADS AND STORMWATER VEHICLES AND EQUIPMENT Ficksburg/Meqheleng Loans 1 x 1.8 Ton Fork-lift 135 000
ROADS AND STORMWATER VEHICLES AND EQUIPMENT Ficksburg/Meqheleng Loans 1 x Bomac Roller/Compactor 125 000
ROADS AND STORMWATER VEHICLES AND EQUIPMENT Ficksburg/Meqheleng Loans 1 x Plate Compactor 15 000 12 000
ROADS AND STORMWATER VEHICLES AND EQUIPMENT Ficksburg/Meqheleng Loans 1 x Rubber drum roller 550 000 350 000
ROADS AND STORMWATER VEHICLES AND EQUIPMENT Ficksburg/Meqheleng Loans 45 Kw 4x4 Road sweeper 270 000
ROADS AND STORMWATER VEHICLES AND EQUIPMENT Ficksburg/Meqheleng Loans 1 x 6 T u-shape mainframe trailor 120 000
ROADS AND STORMWATER VEHICLES AND EQUIPMENT Ficksburg/Meqheleng Loans 1 x 6 T 6000lt water tanker 25 000
ROADS AND STORMWATER VEHICLES AND EQUIPMENT Ficksburg/Meqheleng Loans 1 x Back Actor (TLB) - 2 wheel drive 400 000
ROADS AND STORMWATER VEHICLES AND EQUIPMENT Ficksburg/Meqheleng Loans 1 x 80 Kw Tractor 410 000
ROADS AND STORMWATER VEHICLES AND EQUIPMENT Ficksburg/Meqheleng Loans Grader 1 700 000
ROADS AND STORMWATER VEHICLES AND EQUIPMENT Ficksburg/Meqheleng Loans 5 x Mobile radio sets 22 000
ROADS AND STORMWATER VEHICLES AND EQUIPMENT All units Loans 1 x Tar truck 1 300 000
ROADS AND STORMWATER NETWORK Ficksburg/Meqheleng Income Re-sealing of Tar roads/ side walks 1 600 000
ROADS AND STORMWATER NETWORK Ficksburg/Meqheleng Loans Upgrading water channels - Zone 7 1 800 000
ROADS AND STORMWATER NETWORK Ficksburg/Meqheleng Loans Upgrading stormwater - Zone 8 2 900 000
ROADS AND STORMWATER NETWORK Ficksburg/Meqheleng Loans Re-seal Chip & Spray Mc Cabe Street&Erwee
ROADS AND STORMWATER NETWORK Ficksburg/Meqheleng Loans Upgrading PWD Stores 270 000
ROADS AND STORMWATER VEHICLES AND EQUIPMENT Ficksburg/Meqheleng Loans Vehicle shed 160 000
ROADS AND STORMWATER VEHICLES AND EQUIPMENT Ficksburg/Meqheleng Grants - Conditional Paving roads 1 400 000
ROADS AND STORMWATER VEHICLES AND EQUIPMENT Clocolan/Hlohlolwane Loans 1 x TLB(4 in 1 bucket) 550 000
ROADS AND STORMWATER VEHICLES AND EQUIPMENT Clocolan/Hlohlolwane Grants - Conditional 1 x Tractor 450 000
ROADS AND STORMWATER VEHICLES AND EQUIPMENT Clocolan/Hlohlolwane Loans 1 x 1 Ton LDV 160 000 165 000
ROADS AND STORMWATER VEHICLES AND EQUIPMENT Clocolan/Hlohlolwane Loans 1 x 1,5 Ton flat Deck LDV(Tipper like) 165 000
ROADS AND STORMWATER VEHICLES AND EQUIPMENT Clocolan/Hlohlolwane Loans 1 x Plate Compactor 12 000
ROADS AND STORMWATER VEHICLES AND EQUIPMENT Clocolan/Hlohlolwane Loans Spinnekop Tractor Sweeper 270 000
ROADS AND STORMWATER VEHICLES AND EQUIPMENT Clocolan/Hlohlolwane Loans 2 x Trailors 25 000
SEWERAGE SERVICES NETWORK Ficksburg/Meqheleng Grants - Conditional Bucket Eradication 0
SEWERAGE SERVICES NETWORK Ficksburg/Meqheleng Grants - Conditional Upgrading Sewer Treatment
SEWERAGE SERVICES VEHICLES AND EQUIPMENT Ficksburg/Meqheleng Loans Vehicles and equipment
SEWERAGE SERVICES VEHICLES AND EQUIPMENT Ficksburg/Meqheleng Loans 2 x Trailers 80 000 80 000
SEWERAGE SERVICES VEHICLES AND EQUIPMENT Ficksburg/Meqheleng Loans 1 x Tractor 0 350 000
SEWERAGE SERVICES VEHICLES AND EQUIPMENT Ficksburg/Meqheleng Loans 1 x LDV 150 000 170 000
SEWERAGE SERVICES BUILDINGS Ficksburg/Meqheleng Loans Change Room 150 000 150 000
SEWERAGE SERVICES VEHICLES AND EQUIPMENT Senekal/Matwabeng Loans 1 x LDV 150 000 170 000.00
SEWERAGE SERVICES VEHICLES AND EQUIPMENT Senekal/Matwabeng Loans 1 x Trailer 15 000 15 000.00
SEWERAGE SERVICES NETWORK Senekal/Matwabeng Loans Upgrading STW 2 500 000
SEWERAGE SERVICES NETWORK Senekal/Matwabeng Loans Upgrading pumpstation 500 000 500 000.00
SEWERAGE SERVICES VEHICLES AND EQUIPMENT Senekal/Matwabeng Loans Roll on Tanker 250 000 250 000.00
SEWERAGE SERVICES BUILDINGS Senekal/Matwabeng Loans Change Room 150 000
SEWERAGE SERVICES VEHICLES AND EQUIPMENT Clocolan/Hlohlolwane Loans 1 x LDV 150 000 170 000.00
SEWERAGE SERVICES NETWORK Clocolan/Hlohlolwane Loans New pumpstation 500 000 500 000.00
SEWERAGE SERVICES NETWORK Clocolan/Hlohlolwane Loans 1 x Trailers 15 000.00
SEWERAGE SERVICES BUILDINGS Clocolan/Hlohlolwane Loans Change Room 150 000
SEWERAGE SERVICES VEHICLES AND EQUIPMENT Marquard/Moemaneng Loans 1 x Tractor 350 000 350 000.00
SEWERAGE SERVICES VEHICLES AND EQUIPMENT Marquard/Moemaneng Loans 1 x LDV 150 000
Adopted Budget 2009.10

SEWERAGE SERVICES BUILDINGS Marquard/Moemaneng Loans Change Room 150 000
SEWERAGE SERVICES VEHICLES AND EQUIPMENT Marquard/Moemaneng Loans 1 x Conservancy tanker 800 000
SEWERAGE SERVICES NETWORK Marquard/Moemaneng Income Fencing 100 000 100 000.00
SEWERAGE SERVICES NETWORK All units Loans Bucket eradication 4 500 000.00
SEWERAGE SERVICES NETWORK Ficksburg/Meqheleng Grants - MIG Sanitation: Treatment works 2 140 000.00
CLEANING SERVICES FURNITURE AND EQUIPMENT All Units Loans Street refuse Containers
CLEANING SERVICES FURNITURE AND EQUIPMENT All Units Loans 23000 x 85 Liter Plastic Bins 0
CLEANING SERVICES VEHICLES AND EQUIPMENT Ficksburg/Meqheleng Loans 1x Mobile Compactor 750 000 850 000
CLEANING SERVICES TOOLS AND EQUIPMENT Ficksburg/Meqheleng Loans Street refuse Containers 4 000
CLEANING SERVICES VEHICLES AND EQUIPMENT Ficksburg/Meqheleng Loans 1x Mobile Compactor 500 000 850 000
CLEANING SERVICES FURNITURE AND EQUIPMENT Ficksburg/Meqheleng Loans Mass Containers 40 000
CLEANING SERVICES VEHICLES AND EQUIPMENT Senekal/Matwabeng Loans 1x Mobile Compactor
CLEANING SERVICES VEHICLES AND EQUIPMENT Senekal/Matwabeng Loans 1 x LDV 100 000
CLEANING SERVICES VEHICLES AND EQUIPMENT Loans Tipper 500 000
CLEANING SERVICES TOOLS AND EQUIPMENT Loans Street refuse Containers 3 000
CLEANING SERVICES VEHICLES AND EQUIPMENT Loans 1 x Mobile Compactor 700 000
CLEANING SERVICES VEHICLES AND EQUIPMENT Clocolan/Hloklowane Loans 1xFront End Loader 700 000
CLEANING SERVICES VEHICLES AND EQUIPMENT Clocolan/Hloklowane Loans 1x Tractor
CLEANING SERVICES VEHICLES AND EQUIPMENT Loans Street refuse Containers 2 000
CLEANING SERVICES VEHICLES AND EQUIPMENT Loans 1 x LDV 100 000.00
CLEANING SERVICES FURNITURE AND EQUIPMENT Marquard/Moemaneng Loans Street refuse Containers 2 000
CLEANING SERVICES VEHICLES AND EQUIPMENT Loans 1 x Mobile Compactor 0 850 000
CLEANING SERVICES NETWORK Loans Transfer station 300 000
CLEANING SERVICES VEHICLES AND EQUIPMENT Loans Tipper 0 500 000
PARKS AND RECREATION TOOLS AND EQUIPMENT Loans Vehicles and equipment
PARKS AND RECREATION Loans Kudu Lawn mower 35 000
PARKS AND RECREATION Loans Wheet eaters 30 000
PARKS AND RECREATION Loans 1 x Chain saw 9 500
PARKS AND RECREATION VEHICLES, TOOLS AND EQUIPMENTAll units Grants - Conditional Lawnmowers 108 000.00
PARKS AND RECREATION Loans Develop park 150 000.00 150 000
PARKS AND RECREATION VEHICLES AND EQUIPMENT Loans Vehicles and equipment
PARKS AND RECREATION VEHICLES AND EQUIPMENT Senekal/Matwabeng Loans 1x Tractor
PARKS AND RECREATION Loans 1 ton LDV 170 000
PARKS AND RECREATION Loans Kudu Lawn mower 34 000
PARKS AND RECREATION Loans Wheet eaters 18 000
PARKS AND RECREATION Loans Develop park 150 000.00 150 000
PARKS AND RECREATION Senekal/Matwabeng Loans Tennis/Netbal coutrs 200 000 200 000
PARKS AND RECREATION VEHICLES AND EQUIPMENT Marquard/Moemaneng Loans 1x Tractor
PARKS AND RECREATION Loans Wheet eaters 15 000 15 000
PARKS AND RECREATION Loans 1 x LDV 100 000
PARKS AND RECREATION Loans Develop park 150 000.00 150 000
PARKS AND RECREATION NETWORK Grants - Conditional Tennis/Netbal coutrs 200 000
PARKS AND RECREATION Loans Kudu Lawn mower 32 000 20 000
PARKS AND RECREATION VEHICLES AND EQUIPMENT Clocolan/Hlohlolwane Loans Kudu Lawn mower 32 000 20 000
PARKS AND RECREATION Loans Wheet eaters 15 000 15 000
PARKS AND RECREATION Loans Develop park 150 000.00 150 000
PARKS AND RECREATION Loans LDV 80 000
PARKS AND RECREATION Loans 1x Tractor 400 000
COMMUNITY HALLS TOOLS AND EQUIPMENT Loans Tools and equipment 160 000 168 000
CEMETERY VEHICLES AND EQUIPMENT Ficksburg/Meqheleng Loans Fencing 500 000 150 000
CEMETERY Loans Toilet and water facilities 40 000 90 000
CEMETERY VEHICLES AND EQUIPMENT Clocolan/Hlohlolwane Loans 1x Back Actor 1 000 000
CEMETERY Loans Fencing 200 000 150 000
CEMETERY Loans Toilet and water facilities 40 000 90 000
CEMETERY VEHICLES AND EQUIPMENT Senekal/Matwabeng Loans 1x Back Actor 500 000
CEMETERY VEHICLES AND EQUIPMENT Senekal/Matwabeng Loans Fencing 200 000 150 000
CEMETERY VEHICLES AND EQUIPMENT Senekal/Matwabeng Loans
Adopted Budget 2009.10

CEMETERY VEHICLES AND EQUIPMENT Marquard/Moemaneng Loans Fencing 200 000 150 000
LIBRARIES FURNITURE AND EQUIPMENT Loans
PROPERTIES TOOLS & EQUIPMENT Loans New offices - PWD 200 000
SWIMMING POOL TOOLS & EQUIPMENT Ficksburg/Meqheleng Loans Filters
SWIMMING POOL TOOLS & EQUIPMENT Loans Reconstruction
TRAFFIC SERVICES VEHICLES AND EQUIPMENT Loans LDV 2 x Maintanance 130 000 150 000
TRAFFIC SERVICES VEHICLES AND EQUIPMENT Loans Radio's - Vehicles 32 000
TRAFFIC SERVICES TOOLS & EQUIPMENT Loans Speed equipment 160 000
TRAFFIC SERVICES TOOLS & EQUIPMENT Loans 8 x Firearms 0 40 000
TRAFFIC SERVICES TOOLS & EQUIPMENT Loans 5 x Sirens & Blue Led Lights 30 000
TRAFFIC SERVICES TOOLS & EQUIPMENT Loans Parking meters 150 000
TRAFFIC SERVICES TOOLS & EQUIPMENT Loans T.C.S 136 500
FIRE, SECURITY & DISASTER MANAGEMENT VEHICLES AND EQUIPMENT Loans LDV 200 000 150 000
FIRE, SECURITY & DISASTER MANAGEMENT TOOLS & EQUIPMENT Loans Protective Clothing 184 000
FIRE, SECURITY & DISASTER MANAGEMENT TOOLS & EQUIPMENT Loans Jaws of Life 0
FIRE, SECURITY & DISASTER MANAGEMENT TOOLS & EQUIPMENT Loans Accident safety kit 20 000
FIRE, SECURITY & DISASTER MANAGEMENT TOOLS & EQUIPMENT Loans Hazmat trailer Complete 0
FIRE, SECURITY & DISASTER MANAGEMENT TOOLS & EQUIPMENT Loans Gear i.e. Hoses, Standpipes 80 000
FIRE, SECURITY & DISASTER MANAGEMENT TOOLS & EQUIPMENT Loans Generator - Small 20 000
FIRE, SECURITY & DISASTER MANAGEMENT TOOLS & EQUIPMENT Loans Generator - Large 0
FIRE, SECURITY & DISASTER MANAGEMENT TOOLS & EQUIPMENT Loans Submersible pump 20 000
FIRE, SECURITY & DISASTER MANAGEMENT TOOLS & EQUIPMENT Loans Winch system 0 120 000
FIRE, SECURITY & DISASTER MANAGEMENT TOOLS & EQUIPMENT Loans JOC Caravan 0 100 000
FIRE, SECURITY & DISASTER MANAGEMENT TOOLS & EQUIPMENT Loans Ultra High Pressure 0 400 000
FIRE, SECURITY & DISASTER MANAGEMENT TOOLS & EQUIPMENT Loans Communication radios / GPS 50 000 110 000
FIRE, SECURITY & DISASTER MANAGEMENT TOOLS & EQUIPMENT Loans __ x Firearms 0 70 000
FIRE, SECURITY & DISASTER MANAGEMENT TOOLS & EQUIPMENT Loans 3 x Closed Circuit Cameras 0
FIRE, SECURITY & DISASTER MANAGEMENT TOOLS & EQUIPMENT Loans 4 x Metal Detectors 25 000
FIRE, SECURITY & DISASTER MANAGEMENT TOOLS & EQUIPMENT Loans Safe 18 000
FIRE, SECURITY & DISASTER MANAGEMENT TOOLS & EQUIPMENT Loans Intercom 0 35 000
FIRE, SECURITY & DISASTER MANAGEMENT TOOLS & EQUIPMENT Loans 15 x Handcuffs 0 8 000
FIRE, SECURITY & DISASTER MANAGEMENT TOOLS & EQUIPMENT Loans 13 x Radio's 15 000 15 000
FIRE, SECURITY & DISASTER MANAGEMENT VEHICLES AND EQUIPMENT Loans 1 x Vehicle 250 000
FIRE, SECURITY & DISASTER MANAGEMENT TOOLS & EQUIPMENT Loans Installation of Alarm systems & Access control 300 000
FIRE, SECURITY & DISASTER MANAGEMENT TOOLS & EQUIPMENT Loans Upgrading of CCTV camera's 700 000
FIRE, SECURITY & DISASTER MANAGEMENT Loans Parking meters 150 000
FIRE, SECURITY & DISASTER MANAGEMENT Loans Disaster management: 4 x 4 1 000 000
LOCAL ECONOMIC DEVELOPMENT VEHICLES AND EQUIPMENT Loans 4 x 4 0 300 000
LOCAL ECONOMIC DEVELOPMENT Loans Development of emerging businesses 100 000
LOCAL ECONOMIC DEVELOPMENT Loans Hydroponics 50 000
LOCAL ECONOMIC DEVELOPMENT Loans Waste recycling project 100 000
LOCAL ECONOMIC DEVELOPMENT Loans Textile project 100 000
LOCAL ECONOMIC DEVELOPMENT Loans Sanstone mining 100 000
LOCAL ECONOMIC DEVELOPMENT Loans Nursery project 50 000
LOCAL ECONOMIC DEVELOPMENT Loans Tourism singanges 100 000
LOCAL ECONOMIC DEVELOPMENT Loans LED Summit 500 000
LOCAL ECONOMIC DEVELOPMENT Loans Cherry festival 200 000
LOCAL ECONOMIC DEVELOPMENT Loans Leader handgrfting 200 000
LOCAL ECONOMIC DEVELOPMENT Loans Asparagus 50 000
LOCAL ECONOMIC DEVELOPMENT Loans 10 000 000
FINANCIAL SERVICES FURNITURE AND EQUIPMENT Grants - Conditional Fixed asset register 200 000 200 000.00
FINANCIAL SERVICES FURNITURE AND EQUIPMENT Grants - Conditional Valuation roll 229 000.00
FINANCIAL SERVICES FURNITURE AND EQUIPMENT Loans Financial system 4 000 000 7 000 000.00
CORPORATE SERVICES ADMIN FURNITURE AND EQUIPMENT Loans Electronic document system 200 000 300 000
CORPORATE SERVICES ADMIN FURNITURE AND EQUIPMENT Loans Central Fax Server 60 000
CORPORATE SERVICES ADMIN FURNITURE AND EQUIPMENT Loans Furniture & Equipment 180 000 100 000
HOUSING SERVICES VEHICLES AND EQUIPMENT Loans Furniture & Equipment 50 000
Adopted Budget 2009.10

HOUSING SERVICES Loans Planning and surveying of cemeteries 150 000
HUMAN RESOURCES FURNITURE AND EQUIPMENT Loans Furniture & Equipment 40 000
MUNICIPAL MANAGER FURNITURE AND EQUIPMENT Income
IT NETWORK Income Website/Intranet 400 000 120 000
IDP IDP Income Implementation of PMS 50 000 100 000
IDP IDP Loans Approval of IDPRPP 50 000 450 000
IDP IDP Loans Satisfactory survey 250 000 250 000
IDP IDP Grants - Other Approval of IDP 70 000
IT NETWORK Income Network changes 400 000
IT NETWORK Income Server Room Upgrade 550 000
Internal Audit TOOLS & EQUIPMENT Loans Quality assurance, IT audit, & ACL data 450 000
MUNICIPAL MANAGER VEHICLES AND EQUIPMENT Loans Vehicle: 4 x 4 300 000
MUNICIPAL MANAGER Loans Strategic planning 350 000
COUNCIL GENERAL EXPENDITURE FURNITURE AND EQUIPMENT Loans 50 000.00
COUNCIL GENERAL EXPENDITURE Income
GRAND TOTAL - SOURCE OF FUNDING Income Income Income 409 000.00 2 870 000.00
Lotto Lotto Lotto - -
Loans Loans Loans 22 963 000.00 61 325 000.00
Grants - Conditional Grants - Conditional Grants - Conditional 30 018 000.00 429 000.00
Grants - MIG Grants - MIG Grants - MIG - 46 742 000.00
Postponed Postponed Postponed - 292 781 468.00
Grants - Other Grants - Other Grants - Other - -
TOTAL FUNDING 53 390 000.00 404 147 468
Adopted Budget 2009.10