admixture patterns and genetic differentiation in negrito ... · asli (which translates to...
TRANSCRIPT

Human BiologyVolume 85Issue 1 Special Issue on Revisiting the "Negrito"Hypothesis
Article 8
2013
Admixture Patterns and Genetic Differentiation inNegrito Groups from West Malaysia Estimatedfrom Genome-wide SNP DataTimothy A. JinamDepartment of Genetics, School of Life Science, Graduate University for Advanced Studies (SOKENDAI), Mishima, Japan
Maude E. PhippsSchool of Medicine and Health Sciences, Monash University (Sunway Campus), Selangor, Malaysia
Naruya SaitouDivision of Population Genetics, National Institute of Genetics, Mishima, Japan, [email protected]
The Hugo Pan-Asian SNP Consortium
Follow this and additional works at: http://digitalcommons.wayne.edu/humbiol
Part of the Biological and Physical Anthropology Commons, and the Genetics and GenomicsCommons
Recommended CitationJinam, Timothy A.; Phipps, Maude E.; Saitou, Naruya; and The Hugo Pan-Asian SNP Consortium (2013) "Admixture Patterns andGenetic Differentiation in Negrito Groups from West Malaysia Estimated from Genome-wide SNP Data," Human Biology: Vol. 85: Iss.1, Article 8.Available at: http://digitalcommons.wayne.edu/humbiol/vol85/iss1/8
Admixture Patterns and Genetic Differentiation in Negrito Groups fromWest Malaysia Estimated from Genome-wide SNP Data
AbstractSoutheast Asia houses various culturally and linguistically diverse ethnic groups. In Malaysia, where theMalay, Chinese, and Indian ethnic groups form the majority, there exist minority groups such as the "negritos"who are believed to be descendants of the earliest settlers of Southeast Asia. Here we report patterns of geneticsubstructure and admixture in two Malaysian negrito populations ( Jehai and Kensiu), using ~50,000 genome-wide single-nucleotide polymorphism (SNP) data. We found traces of recent admixture in both the negritopopulations, particularly in the Jehai, with the Malay through principal component analysis andSTRUCTURE analysis software, which suggested that the admixture was as recent as one generation ago. Wealso identified significantly differentiated nonsynonymous SNPs and haplotype blocks related to intracellulartransport, metabolic processes, and detection of stimulus. These results highlight the different levels ofadmixture experienced by the two Malaysian negritos. Delineating admixture and differentiated genomicregions should be of importance in designing and interpretation of molecular anthropology and diseaseassociation studies.
KeywordsAdmixture, Negrito, Indigenous, Structure
This open access article is available in Human Biology: http://digitalcommons.wayne.edu/humbiol/vol85/iss1/8
1Department of Genetics, School of Life Science, Graduate University for Advanced Studies (SOKENDAI), Mishima, Japan.
2Division of Population Genetics, National Institute of Genetics, Mishima, Japan.3School of Medicine and Health Sciences, Monash University (Sunway Campus), Selangor, Malaysia.4Department of Biological Sciences, School of Science, University of Tokyo, Tokyo, Japan,*Present address: Division of Human Genetics, National Institute of Genetics, Mishima, Japan.†Correspondence to: Naruya Saitou, Division of Population Genetics, National Institute of Genetics,
Mishima, 411-0831 Japan. E-mail: [email protected].
Human Biology, February–June 2013, v. 85, no. 1–3, pp. 173–188.Copyright © 2013 Wayne State University Press, Detroit, Michigan 48201-1309
KEY WORDS: ADMIXTURE, NEGRITO, INDIGENOUS, STRUCTURE.
Admixture Patterns and Genetic Differentiation in Negrito Groups from West Malaysia Estimated from Genome-wide SNP Data
TIMOTHY A. JINAM,1,2* MAUDE E. PHIPPS,3 NARUYA SAITOU,2,1,4† AND THE HUGO PAN-ASIAN SNP CONSORTIUM
Abstract Southeast Asia houses various culturally and linguistically diverse ethnic groups. In Malaysia, where the Malay, Chinese, and Indian ethnic groups form the majority, there exist minority groups such as the “negritos” who are believed to be descendants of the earliest settlers of Southeast Asia. Here we report patterns of genetic substructure and admixture in two Malaysian negrito populations (Jehai and Kensiu), using ~50,000 genome-wide single-nucleotide polymorphism (SNP) data. We found traces of recent admixture in both the negrito populations, particularly in the Jehai, with the Malay through principal component analysis and STRUCTURE analysis software, which suggested that the admixture was as recent as one generation ago. We also identified significantly differentiated nonsynonymous SNPs and haplotype blocks related to intracellular transport, metabolic processes, and detection of stimulus. These results highlight the different levels of admixture experienced by the two Malaysian negritos. Delineating admixture and differentiated genomic regions should be of importance in designing and interpretation of molecular anthropology and disease association studies.
The Southeast Asian region represents an intriguing avenue into the study of human population genetics, given the rich ethnic diversity of the region. The general consensus from various population genetic studies are the African origin of modern human populations based on mitochondrial, Y-chromosomal, and autosomal DNA markers (e.g., Underhill 2003; Li et al. 2008; Stoneking and Delfin 2010). With
174 / JINAM ET AL.
regards to the Southeast Asian region, linguistic and archaeological data suggested the two epochs of modern human migrations into the region: the late-Pleistocene (≥40 kya) arrival from Africa (Glover and Bellwood 2004; O’Connell and Allen 2004) and the more recent expansion of Austronesian-speaking agriculturalists from southern China during the mid-Holocene (Bellwood 2005, 2007).
The populations in Malaysia typify the diversity found in this region, with a mix of indigenous groups and those with ancestry tracing back to China and India. The population composition in both Malaysia and neighboring Singapore consists mainly of the three ethnic groups: Malay, Chinese, and Indian. The latter two groups may trace their recent ancestry to South China and South India, respectively (Andaya and Andaya 1984). In addition to those three major ethnic groups, there exist indigenous minority groups that consist of the Orang Asli (which translates to “original people”) in the Malay Peninsula and various ethnic tribes in Borneo. Within the Orang Asli, there are several subgroups that are identified as “negritos.”
Negrito is a blanket term for several indigenous populations from Peninsular Malaysia, the Philippines, and the Andaman Islands who exhibit phenotypes that are distinct from the general surrounding population, mostly described as frizzy/curly hair, dark skin, and short stature. They are thought to be descendants of the earliest migrants to the Southeast Asian region, along with Papuans and Australian Aboriginals (Macaulay et al. 2005; Hill et al. 2006). A recent analysis of mito-chondrial DNA (mtDNA) complete sequences and the genome-wide autosomal single-nucleotide polymorphism (SNP) data showed that the Malaysian negritos, Philippine negritos, and Papuans appeared quite genetically distinct (Jinam et al. 2012), which suggests that these may have experienced differing demographic histories and possibly reflects early divergence and long-term isolation.
Genetic admixture with neighboring populations has a significant impact on the genetic diversity of negrito populations; ancient admixture with Denisovans was found in the Philippine negritos and Papuans but not in the Malaysian negritos (Reich et al. 2011), whereas recent admixture with neighboring non-negrito populations has been reported in the Philippine negritos (Scholes et al. 2011). Past genetic studies regarding Malaysian negritos have focused on mtDNA (Macaulay et al. 2005; Hill et al. 2006, 2007) or a specific autosomal region (Jinam et al. 2010). Genome-wide SNP data have been generated in various human populations, including some Malaysian negrito populations (HUGO Pan-Asian SNP Consortium 2009; Reich et al. 2011), and the availability of such data has allowed for a more targeted analysis (Yang et al. 2011; Jinam et al. 2012; Xu et al. 2012).
We therefore aim to further the utility of those genome-wide SNP data by focusing on the admixture patterns and genetic differentiation in the Malaysian ne-gritos; specifically, we wish to characterize in further detail the impact of admixture within the negritos in relation to their surrounding populations. Part of the reason for much interest in the negritos is because of their distinct physical appearance. Identification of differentiated genomic regions in the negritos may therefore aid in the discovery of specific loci that contribute to the observed phenotypes, as
Admixture Patterns and Genetic Differentiation in Negrito Groups / 175
well as helping to avoid spurious associations in genome-wide association studies (Yamaguchi-Kabata et al. 2008).
Materials and Methods
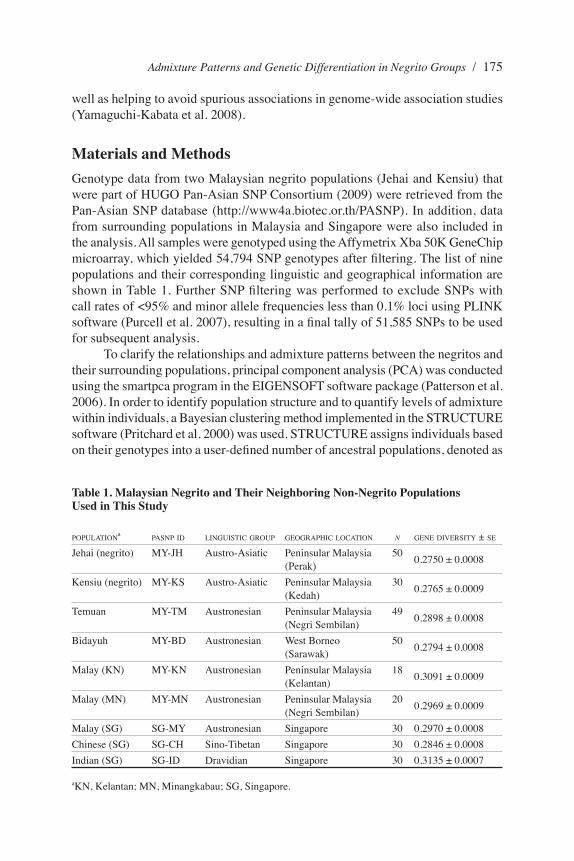
Genotype data from two Malaysian negrito populations (Jehai and Kensiu) that were part of HUGO Pan-Asian SNP Consortium (2009) were retrieved from the Pan-Asian SNP database (http://www4a.biotec.or.th/PASNP). In addition, data from surrounding populations in Malaysia and Singapore were also included in the analysis. All samples were genotyped using the Affymetrix Xba 50K GeneChip microarray, which yielded 54,794 SNP genotypes after filtering. The list of nine populations and their corresponding linguistic and geographical information are shown in Table 1. Further SNP filtering was performed to exclude SNPs with call rates of <95% and minor allele frequencies less than 0.1% loci using PLINK software (Purcell et al. 2007), resulting in a final tally of 51,585 SNPs to be used for subsequent analysis.
To clarify the relationships and admixture patterns between the negritos and their surrounding populations, principal component analysis (PCA) was conducted using the smartpca program in the EIGENSOFT software package (Patterson et al. 2006). In order to identify population structure and to quantify levels of admixture within individuals, a Bayesian clustering method implemented in the STRUCTURE software (Pritchard et al. 2000) was used. STRUCTURE assigns individuals based on their genotypes into a user-defined number of ancestral populations, denoted as
Table 1. Malaysian Negrito and Their Neighboring Non-Negrito Populations Used in This Study
POPULATIONa
PASNP ID LINGUISTIC GROUP GEOGRAPHIC LOCATION N GENE DIVERSITY ± SE
Jehai (negrito) MY-JH Austro-Asiatic Peninsular Malaysia (Perak)
500.2750 ± 0.0008
Kensiu (negrito) MY-KS Austro-Asiatic Peninsular Malaysia (Kedah)
300.2765 ± 0.0009
Temuan MY-TM Austronesian Peninsular Malaysia (Negri Sembilan)
490.2898 ± 0.0008
Bidayuh MY-BD Austronesian West Borneo (Sarawak)
500.2794 ± 0.0008
Malay (KN) MY-KN Austronesian Peninsular Malaysia (Kelantan)
180.3091 ± 0.0009
Malay (MN) MY-MN Austronesian Peninsular Malaysia (Negri Sembilan)
200.2969 ± 0.0009
Malay (SG) SG-MY Austronesian Singapore 30 0.2970 ± 0.0008
Chinese (SG) SG-CH Sino-Tibetan Singapore 30 0.2846 ± 0.0008
Indian (SG) SG-ID Dravidian Singapore 30 0.3135 ± 0.0007
aKN, Kelantan; MN, Minangkabau; SG, Singapore.

176 / JINAM ET AL.
k. Under the admixture model, individuals who are jointly assigned to two or more ancestry components are considered to be admixed. Burn-in length and number of repeats were both set to 10,000.
To identify genetically differentiated regions in the negritos, pairwise FST (Weir and Cockerham 1984) values for each SNP locus was calculated in negritos and Malays, after removing admixed individuals identified using methods described above. In addition, haplotype blocks were identified in the negrito and Malay groups using PLINK software and the haplotype frequencies between those two groups were compared. The motivation for using haplotypes is that it allows finding differentiated genomic regions even if the individual SNP were not directly genotyped, due to high linkage disequilibrium between markers. The chi-square test was performed to identify significantly differentiated SNP loci and haplotypes, and p-values were subjected to Bonferroni correction.
Results
The observed gene diversities for the populations analyzed are listed in Table 1. Gene diversities (average heterozygosities) were lower in the two negrito popula-tions compared with the other populations. Gene diversities using the same SNP sets in HapMap populations showed that Yorubans and Europeans had fairly similar values (0.2918 and 0.2958, respectively), which was slightly lower than the value observed in Singapore Indians. The gene diversity of the Han Chinese in Beijing (0.2739) was lower than that in the Singapore Chinese and was comparable to the gene diversities observed in the negritos and Bidayuh.
The results of PCA for the first two principal components (PCs) are shown in Figure 1, where PC1 (x-axis) and PC2 (y-axis) describe 2.6% and 2.3% of the variation between individuals, respectively. We supplemented the data with popula-tions from South India (Indian-Dravidian) and South China (Chinese-South) as the putative parental populations for the Indians and Chinese in Singapore, respectively, and indeed, they cluster accordingly in the PCA plot. PC1 separates the Indians from the other populations, whereas PC2 separates the two negrito populations from the others. As a result, three broad groupings were observed corresponding to the negritos, Indians, and the rest, consisting of the Bidayuh, Temuan, Malays, and Chinese (Figure 1).
We confirm the “comet-like” pattern in the PCA plot of admixed negrito individuals forming a gradient along PC2, similar to what was observed in Jinam et al. (2012). This was particularly true in the Jehai, where several individuals form a gradient leading toward the cluster consisting of Temuan (Proto-Malay), Malay, and Chinese. The Kensiu appeared to form a much tighter cluster in the PCA plot, except for one individual who is located in the middle of Kensiu and Malay clusters. Two Jehai individuals are also in a relatively similar position, and we suspect that these individuals might be recent F1 hybrids with Temuan, Malay, or Chinese populations who are clustered closely in Figure 1. Several Indian and Malay individuals in Singapore were observed to be in intermediate positions

Admixture Patterns and Genetic Differentiation in Negrito Groups / 177
between their respective population clusters, also suggesting fairly recent admixture between these two populations.
To further investigate admixture and population structure in these populations, we performed Bayesian clustering implemented in the STRUCTURE software in which individuals were assigned into k number of clusters. Starting from k = 2, the number of k is increased until the k value showing the greatest posterior probability was reached, in this case k = 6. Increasing k to 7 or 8 did not reveal any meaningful information. The results of STRUCTURE analysis from k = 2 to k = 6 is shown in Figure 2. Each individual is represented by a vertical bar, and respective ancestry components are indicated by different colors. Multiple ancestry clusters within an individual (multiple colors in a single vertical bar) signifies an admixed individual. At k = 2, the two population subdivisions correspond to the negritos (Jehai and Kensiu) and Indians in the blue component against the rest of the populations in green component. With k increased to 3, the population clusters correspond to the Indians, negritos, and the other populations. At k = 4, there appeared to be a component shared mostly among the Chinese from Singapore and southern China (orange component). At this point, the population components observed corresponds to the negrito (blue), Indian (brown), Southeast Asian (light green), and Chinese
Figure 1. The first two principal component (PC) analysis plots of individuals. Numbers in paren-theses are percent variation explained by the PC. Possible recent hybrids between negrito (Jehai and Kensiu) with Malay are indicated by red arrows. Abbreviations: DR, Dravidian; KN, Kelantan; MN, Minangkabau; SG, Singapore.

178 / JINAM ET AL.
Figure 2. STRUCTURE output from k = 2 to k = 6. Each individual is represented by a vertical bar and the proportions of each cluster (k) are represented by different colors. Popula-tion labels are listed at the bottom. Abbreviations: DR, Dravidian; KN, Kelantan; MN, Minangkabau; SG, Singapore.
(orange). As the value of k is increased, further differentiation of subgroups was observed that corresponds to the Temuan (dark green component) at k = 5 and at k = 6, whereby the previous negrito component (dark blue) was further split into the Jehai and Kensiu. At k = 6, the six ancestry components correspond to the Jehai, Kensiu, Indian, Temuan, Southeast Asian, and Chinese components.
Admixed negrito individuals as well as Indian and Malay individuals identified from the PCA plots were also confirmed as having mixed ancestry components in the STRUCTURE analysis. In order to analyze more closely the comet-like pattern observed in the PCA plot, the PC2 coordinates in the negritos (Figure 1) were plotted against ancestry components at k = 4 obtained from the STRUCTURE analysis. The resulting plot in Figure 3 shows a high correlation between the PC coordinates and the amount of admixture from STRUCTURE analysis, underlining the fact that despite the different approaches used in PCA and STRUCTURE, they both show the same results regarding quantification of admixture.
Regarding the admixed Jehai and Kensiu individuals, we performed PCA separately using the negritos, Malay, Chinese, and Temuan in order to identify the closest parental source population for the admixture. The result in Figure 4 shows that both negrito groups and the Temuan form a gradient toward the Malay groups, while the Chinese appear to be separate from the Malays. We thus conclude that the source population for admixture in the negrito (and Temuan) was most likely the

Admixture Patterns and Genetic Differentiation in Negrito Groups / 179
Malay. For subsequent analyses, we omitted the Malay individuals admixed with Indians and merged the three Malay subgroups (Malay-Minangkabau, -Kelantan, and -Singapore). In order to strengthen the support for the hypothesis that the Jehai and Kensiu individuals located in the intermediate position between negrito and Malay clusters in PCA plot (Figures 1 and 4) were actually F1 hybrids, we generated 10 artificial F1 hybrids by merging haploid chromosomes from Malay with Jehai and Kensiu separately. The haploid chromosomes were obtained by phasing the genotypes from less admixed individuals using fastPHASE software (Scheet and Stephens 2006) and they represent the parental gametes. We then used the genotype data from those artificial F1 hybrids and plotted them on a PCA plot, together with the parental Malay and respective negrito populations. Figure 5 shows the relation between the artificial F1 hybrids and putative hybrids in the Jehai and Kensiu with the parental Malay population. In both cases, the PC1 coordinates of individuals from the “ancestral” Malay and Jehai/Kensiu populations are averaged and then normalized so that value 0 represents the position of the Malay and value 1 repre-sents the position of the negrito (Jehai/Kensiu). Figure 5 shows that the artificial F1 hybrids appear in the intermediate position between the Malay and negrito clusters together with the putative F1 hybrids in the Jehai and Kensiu populations.
Figure 3. Correlation between principal component values and STRUCTURE ancestry proportions in the two negrito groups. Negrito ancestry at k = 4 (dark blue component in Figure 2) is used as the y-axis, while PC2 coordinates in the Jehai and Kensiu (Figure 1) are used as the x-axis. PC coordinates have been normalized to range from 0 to 1 so that 0 reflects the coordinate closest to the Malay and 1 reflects the position farthest from the Malay in PCA plots. Possible recent hybrids between negrito (Jehai and Kensiu) with Malay are indicated by red arrows.

180 / JINAM ET AL.
Figure 4. Principal component analysis (PCA) plot of individuals from the negrito (Jehai and Ken-siu), Malay (Malay-Minangkabau, Malay-Kelantan, Malay-Singapore), Temuan, and Chi-nese populations. (A) PC1 versus PC2 plot and (B) PC1 versus PC3 plot. Possible recent hybrids between negrito (Jehai and Kensiu) with Malay is indicated by red arrows.

Admixture Patterns and Genetic Differentiation in Negrito Groups / 181
Interestingly, another Jehai individual was located between the Malay and the F1 hybrids, and we suspect that this individual might be an F2 hybrid: an offspring of an F1 Jehai with a Malay parent. This simulation is a very primitive one, and a more sophisticated simulation that takes into account other parameters such as recombination rates should be conducted in future studies. Nevertheless, at least for the Kensiu individual who was suspected for an F1 hybrid, our conjecture may be the most likely one. It should be noted that this kind of simulation may satisfy only “necessary” condition, and we definitely need to satisfy the “sufficient” condition to really prove our hypothesis. While we collected blood samples from the Kensiu population, we were informed that one blood-donating person was a hybrid between Kensiu and Malay. We thus conclude that at least the Kensiu individual who was suspected to be an F1 hybrid from PCA and STRUCTURE analyses is in fact the F1 hybrid. Other Kensiu individuals are tightly clustered and are quite distant from the geographically surrounding Malay population. This indicates that the Kensiu population was genetically isolated for a long time.
The nonsynonymous SNPs that have FST values > 0 in a pairwise comparison between negrito (Jehai and Kensiu merged) and Malay are listed in Table 2. Of those, seven SNP differ significantly in terms of allele frequencies (p < 0.05 after correction) and are involved with intracellular transport, metabolic processes,
Figure 5. Affirmation of putative F1 hybrids in the Jehai (A) and Kensiu (B) with the Malay popula-tion. “Artificial” F1 hybrid individuals (green diamonds) were made by randomly merg-ing phased haploid chromosomes from Malay and Jehai/Kensiu population. The x-axis represents the first principal component (PC1) coordinates, and the individual values in the parental Malay and Jehai/Kensiu are averaged. The coordinates are then normalized so that the value 0 represents the Malay and 1 represents the negritos (Jehai or Kensiu).

182 / JINAM ET AL.Ta
ble
2. N
onsy
nony
mou
s SN
P w
ith
FST
val
ues
grea
ter
than
zer
o be
twee
n th
e ne
grit
os a
nd M
alay
s.
CH
R.
DB
SNP
ID
POSI
TIO
N
AN
CE
STR
AL A
LL
EL
E
AL
LE
LE F
RE
QU
EN
CY
F
ST
P-V
AL
UE
a G
EN
E
BIO
LO
GIC
AL P
RO
CE
SSE
S
NE
GR
ITO
M
AL
AY
3 rs
1387
4 66
4199
56
T
0.97
32
0.81
00
0.12
60
0.00
19
SLC
25A
26
Tra
nspo
rt o
f pr
otei
ns in
the
mito
chon
dria
2 rs
9613
60
1363
9365
8 A
0.
8661
0.
6200
0.
1409
0.
0020
R
3HD
M1
Nuc
leic
aci
d m
etab
olic
pro
cess
6 rs
5954
13
4069
166
C
0.48
21
0.75
00
0.13
18
0.00
24
C6o
rf14
6 —
1 rs
3738
671
4031
5888
T
0.
4375
0.
2200
0.
0934
0.
0100
T
RIT
1 tR
NA
met
abol
ic p
roce
ss3
rs37
7472
9 63
9820
82
A
0.28
57
0.50
00
0.08
47
0.01
85
AT
XN
7 N
euro
logi
cal s
yste
m p
roce
s2
rs10
4971
99
1596
6361
6 G
1.
0000
0.
9184
0.
0788
0.
0342
D
AP
L1
Indu
ctio
n of
apo
ptos
is5
rs22
7704
4 35
7794
47
C
0.00
00
0.08
00
0.07
63
0.03
82
SPE
F2
Sper
m fl
agel
lar
prot
ein
9 rs
6154
74
3504
3291
T
0.
4286
0.
6020
0.
0489
0.
2738
C
9orf
131
—6
rs10
4441
8 13
9229
872
C
0.99
11
0.94
00
0.03
13
0.52
19
RE
PS1
N
euro
tran
smitt
er s
ecre
tion
4 rs
9328
764
2176
454
A
0.32
14
0.45
00
0.02
39
0.79
07
PO
LN
D
NA
rep
air,
DN
A r
eplic
atio
n1
rs78
25
1119
5709
7 G
0.
5804
0.
6735
0.
0084
0.
9821
O
VG
P1
Poly
sacc
hari
de m
etab
olic
pro
cess
3 rs
1051
0592
27
3328
20
G
0.05
36
0.10
00
0.00
67
0.98
55
NE
K10
Ph
osph
ate
met
abol
ic p
roce
ss6
rs10
4848
47
3898
0081
A
0.
8929
0.
9400
0.
0045
0.
9953
D
NA
H8
Sper
mat
ogen
esis
, fer
tiliz
atio
n
a p-va
lue
of c
hi-s
quar
e te
st a
fter
Bon
ferr
oni c
orre
ctio
n.
Tabl
e 3.
Top
10
Mos
t Si
gnifi
cant
ly D
iffe
rent
iate
d H
aplo
type
Blo
cks
in t
he N
egri
to a
nd M
alay
Pop
ulat
ions
CH
R
RA
NG
E
SIZ
E (
KB)
SNP
FST
a H
APL
OT
YPE
F(
NE
G)
F(M
LY)
CH
I SQ
UA
RE
D
P-V
AL
UE
b FL
AN
KIN
G G
EN
ES
1 18
4721
517–
1847
2382
4 2.
3 rs
1048
9392
, 0.
468
GC
G
0.65
8 0.
110
65.8
5 1.
18E
-12
PD
C
rs10
4893
93,
rs
7544
457
A
TC
0.
342
0.89
0 65
.85
1.18
E–1
2
3 14
9863
233–
1498
8474
3 21
.5
rs71
8424
, 0.
319
CTA
0.
616
0.13
0 52
.63
1.07
E-0
9 R
PL
38P
1,
rs81
3992
,
rs14
9209
0
TC
T
0.33
0 0.
740
35.5
4 6.
61E
-06
RP
L38
P2
C
CA
0.
027
0.11
0 5.
93
NS
RP
L38
P3
C
CT
0.
027
0.02
0 0.
11
NS

Admixture Patterns and Genetic Differentiation in Negrito Groups / 183
4 67
7461
19–6
7747
035
0.9
rs10
5180
24,
0.41
8 G
C
0.67
0 0.
155
56.2
3 1.
71E
-10
CE
NP
C1,
rs
1051
8025
AT
0.
330
0.84
5 56
.23
1.71
E-1
0 C
EN
PC
2
5 11
8038
953–
1180
4009
9 1.
1 rs
2376
685,
0.
761
TC
0.
098
0.55
1 50
.14
3.79
E-0
9 D
TW
D2
rs
1429
711
C
T
0.90
2 0.
449
50.1
4 3.
79E
-09
6 81
7268
28–8
1816
063
89.2
rs
7770
969,
0.
212
TG
CG
T
0.59
8 0.
110
54.1
5 4.
92E
-10
—
rs92
9418
7,
rs10
4852
80,
G
AT
GT
0.
134
0.57
0 44
.79
5.80
E-0
8
rs72
4993
,
rs69
1169
7
TG
CG
G
0.04
5 0.
250
18.3
4 0.
048
TA
CT
T
0.22
3 0.
070
9.68
N
S
10
8214
0615
–821
4602
2 5.
4 rs
7899
545,
0.
375
GG
0.
679
0.19
2 50
.28
3.53
E-0
9 D
YD
C2
rs
7898
787
C
A
0.32
1 0.
808
50.2
8 3.
53E
-09
C10
orf5
8
12
7600
5454
–760
0583
4 0.
4 rs
3108
45,
0.25
5 G
A
0.43
8 0.
090
32.1
0 3.
88E
-05
E2F
7
rs31
0849
C
T
0.56
3 0.
910
32.1
0 3.
88E
-05
NA
V3
12
7667
0293
–766
8027
1 10
.0
rs10
5067
59,
0.32
1 G
GT
0.
188
0.68
9 54
.48
4.17
E-1
0 E
2F7
rs23
6994
2,
rs14
0231
9
AA
C
0.68
8 0.
280
35.0
9 8.
32E
-06
NA
V3
G
AT
0.
098
0.00
0 10
.36
NS
G
GC
0.
027
0.03
1 0.
03
NS
12
7831
8095
–783
2203
3 3.
9 rs
1405
493,
0.
405
GC
0.
768
0.23
5 59
.52
3.20
E-1
1 —
rs
7303
658
A
A
0.23
2 0.
714
48.9
6 6.
92E
-09
G
A
0.00
0 0.
051
5.85
N
S
13
6133
2602
–613
4455
9 12
.0
rs10
5076
74,
0.39
0 G
G
0.68
8 0.
174
55.8
5 2.
07E
-10
—
rs14
1248
3
CA
0.
304
0.77
6 46
.67
2.22
E-0
8
CG
0.
009
0.05
1 3.
34
NS
a Mea
n F
ST v
alue
s fo
r SN
P w
ithin
the
hapl
otyp
e bl
ock.
b p-V
alue
of
chi-
squa
re te
st a
fter
Bon
ferr
oni c
orre
ctio
n.
184 / JINAM ET AL.
apoptosis, and sperm production. The 10 most differentiated haplotype blocks between the negritos and Malays are listed in Table 3. The SNPs that make up those haplotype blocks tend to have high FST values. Although none of the SNPs in the significantly differentiated haplotype blocks are located within a gene (except one), the genes flanking the haplotype blocks are related to detection of stimulus, protein binding, enzyme inhibitor activity, and regulation of biological process, based on gene ontology search.
Discussion
This report describes the admixture patterns within the two negrito populations in Malaysia and their relationship with their surrounding populations. In terms of gene diversity, the two negrito populations, Jehai and Kensiu, appeared to have lower values than the rest of the neighboring populations. This may reflect smaller effective population sizes in the negritos, which make them more disposed to the effects of the random genetic drift, or it may be partially due to the effects of ascertainment bias of the Affymetrix 50K chip.
STRUCTURE and PCA results revealed the possible presence of recent admixture in both the Malaysian negrito groups, but was more pronounced in the Jehai, shown by the comet-like gradient in the PCA plots (Figures 1 and 4). The source population for the admixture was most likely the Malay, as shown in Figure 4, and is quite reasonable given that the Malays are the most populous ethnic group with a history of admixture (Vlieland 1934; Teng and Tan 1979; Andaya 2001) and are found in most geographical regions in West Malaysia, including the rural areas where most of the negrito groups are found. There have been attempts by the Malaysian federal government and/or individual bodies to resettle the negritos into permanent villages. The Kensiu have had a history of resisting such resettlement programs (Nagata 1997), with some still frequently traversing back and forth across the border with neighboring Thailand. We suppose that because of that and perhaps other socioeconomic barriers, there would be fewer admixture events with the Malays. The Jehai have traditionally lived in an area that had a history of being well traveled by the Malay (Benjamin 1987). Prolonged contact between these two populations would have eventually led to greater chance of mixed marriages, resulting in the pattern observed in the PCA plots. Of course these explanations may be too simplistic as there may be several other underlying socioeconomic factors (Benjamin this issue; Lye this issue) that differ between the Jehai and Kensiu that could have led to the observed differences in the admixture patterns.
The Jehai and Kensiu are genetically closer to each other than they are to other populations. mtDNA data also shows that the Jehai and Kensiu share almost similar mtDNA haplogroup frequencies (Jinam et al. 2012). However, if we look at Figure 4B, these two negrito groups appear quite distinct from each other if we focus on PC3. STRUCTURE results at k = 6 also appears to separate these two populations, indicated by dark blue and light blue proportions. These observations hint at a population substructure within the negritos that was not directly influenced

Admixture Patterns and Genetic Differentiation in Negrito Groups / 185
by recent admixture events. Whether the said substructure was due to differences in ancient demographic history or just due to genetic drift warrants further investiga-tion. It is also interesting to note that the Andaman negritos (Great Andamanese and Onge) share some degree of admixture proportions with the Malaysian negritos (Chaubey and Endicott this issue). The Andaman and Malaysian negritos also share another similarity, which is the very low proportion of Denisovan admixture, in contrast to Philippine negritos and Papuans (Reich et al. 2011). These observations suggest a possible ancestral link between the geographically separate Andaman and Malaysian negrito groups.
We examined whether the negrito individuals who are located in the interme-diate positions between parental clusters in PCA plots (Figures 1 and 4) were the result of F1 hybridization by manually generating “artificial” F1 admixed hybrids done via the merging of random phased haploid chromosomes from the two parental populations. PCA plots (Figure 5) show that these putative F1 hybrids in the negritos locate at similar PC1 coordinates with our “artificial” F1 hybrids. This observation suggests that admixture between the negritos and Malays might have occurred as early as one generation ago, but caution is warranted in interpreting the results. Our method to generate “artificial” F1 hybrids is very primitive, since we did not consider recombination and that a more direct and detailed analysis to estimate the time since admixture is needed to further confirm our conclusions. Nevertheless, using our rough approximation, we were able to suggest that the Kensiu and Jehai individual located on the halfway point between the Malay and respective negrito clusters on the PCA plot, and this fits well with the hypothesis that these individuals are F1 hybrids.
The STRUCTURE output also seems to indicate consistent values of Indian ancestry (averaging 18%) in the Malay groups, suggesting there was a much older admixture event involving Indians and Malays. This corresponds to the historical records of trade between India and Malaya dating back to at least 1,000 BP (Andaya and Andaya 1984) and corroborated by Y-chromosomal data (Karafet et al 2010). The comet-like pattern seen in the PCA plots of the negritos was also observed in other indigenous populations from Australia (McEvoy et al. 2010) and Latin America (Bryc et al. 2010). The observed pattern is likely to have been the result of continuous and sustained admixture with West Eurasian descendants in the case of those two populations. However, it does not seem the case for the Malaysian negritos, as the PCA plot did not reveal any admixture with Europeans (data not shown).
We have also identified nonsynonymous SNP and haplotype blocks that are differentiated between the negrito and Malays. Although the regions we identified are related with various intracellular components and metabolic processes, we found no genes directly related with phenotypes such as skin color or hair type. This might reflect the sparseness of SNP covered on the Affymetrix 50K chip. Although more than sufficient for phylogenetic studies, it may not be dense enough to identify more genetic regions of interest.Our report reveals in further detail the admixture patterns in the Malaysian negritos in relation to other groups
186 / JINAM ET AL.
within Malaysia and demonstrates that the Malaysian negritos, too, have been influenced by their surrounding populations, just like the Philippine negritos. We demonstrated the utility of PCA in detecting admixed individuals that should be taken into consideration when conducting association studies, because the presence of population stratification and outlier individuals may lead to increased false positive results (Tian et al. 2008; Yamaguchi-Kabata et al. 2008).
Received 10 October 2012; revision accepted for publication 5 May 2013.
Literature CitedAndaya, B. W., and L. Y. Andaya. 1984. A History of Malaysia. New York: St. Martin’s Press.Andaya, L. Y. 2001. The search for the origins of Melayu. J. Southeast Asian Stud. 32:315–330.Bellwood, P. S. 2005. The First Farmers: The Origins of Agricultural Societies. Malden, MA: Wiley-
Blackwell.Bellwood, P. 2007. Prehistory of the Indo-Malaysian Archipelago. Canberra: ANU E Press.Benjamin, G. 1987. Ethnohistorical perspectives on Kelantan’s prehistory. In Kelantan Zaman Awal:
Kajian Arkeologi dan Sejarah di Malaysia. Nik Hassan Shuhaimi bin Nik Abdul Rahman, ed. Kota Bharu: Perpaduan Muzium Negeri Kelantan.
Benjamin, G. 2013. Why have the peninsular “negritos” remained distinct? Hum. Biol. 85:445–484.Bryc, K., C. Velez, T. Karafet et al. 2010. Colloquium paper: Genome-wide patterns of population
structure and admixture among Hispanic/Latino populations. Proc. Natl. Acad. Sci. USA 107:8,954–8,961.
Chaubey, G., and P. Endicott. 2013. The Andaman Islanders in a regional genetic context: Reex-amining the evidence for an early peopling of the archipelago from South Asia. Hum. Biol. 85:153–172.
Glover, I., and P. S. Bellwood. 2004. Southeast Asia: From Prehistory to History. New York: Rout-ledgeCurzon.
Hill, C., P. Soares, M. Mormina et al. 2007. A mitochondrial stratigraphy for island southeast Asia. Am. J. Hum. Genet. 80:29–43.
Hill, C., P. Soares, M. Mormina et al. 2006. Phylogeography and ethnogenesis of aboriginal Southeast Asians. Mol. Biol. Evol. 23:2,480–2,491.
HUGO Pan-Asian SNP Consortium. 2009. Mapping human genetic diversity in Asia. Science 326:1,541–1,545.
Jinam, T. A., L. C. Hong, M. E. Phipps et al. 2012. Evolutionary history of continental Southeast Asians: “Early train” hypothesis based on genetic analysis of mitochondrial and autosomal DNA data. Mol. Biol. Evol. 29:3,513–3,527.
Jinam, T. A., N. Saitou, J. Edo et al. 2010. Molecular analysis of HLA class I and class II genes in four indigenous Malaysian populations. Tissue Antigens 75:151–158.
Karafet, T. M., B. Hallmark, M. P. Cox et al. 2010. Major east–west division underlies Y chromosome stratification across Indonesia. Mol. Biol. Evol. 27:1,833–1,844.
Li, J. Z., D. M. Absher, H. Tang et al. 2008. Worldwide human relationships inferred from genome-wide patterns of variation. Science 319:1,100–1,104.
Lye Tuck-Po. 2013. Making friends in the rainforest: “Negrito” adaptation to risk and uncertainty. Hum. Biol. 85:417–444.
Macaulay, V., C. Hill, A. Achilli et al. 2005. Single, rapid coastal settlement of Asia revealed by analysis of complete mitochondrial genomes. Science 308:1,034–1,036.
McEvoy, B. P., J. M. Lind, E. T. Wang et al. 2010. Whole-genome genetic diversity in a sample of Australians with deep aboriginal ancestry. Am. J. Hum. Genet. 87:297–305.

Admixture Patterns and Genetic Differentiation in Negrito Groups / 187
Nagata, S. 1997. The origin of an Orang Asli reserve in Kedah. In Indigenous Peoples and the State: Politics, Land, and Ethnicity in the Malayan Peninsula and Borneo, R. L. Winzeler, ed. New Haven, CT: Yale University Southeast Asia Studies.
O’Connell, J. F., and J. Allen. 2004. Dating the colonization of Sahul (Pleistocene Australia-New Guinea): A review of recent research. J. Archaeol. Sci. 31:835–853.
Patterson, N., A. L. Price, and D. Reich. 2006. Population structure and eigenanalysis. PLoS Genet. 2:e190.
Pritchard, J. K., M. Stephens, and P. Donnelly. 2000. Inference of population structure using multilo-cus genotype data. Genetics 155:945–959.
Purcell, S., B. Neale, K. Todd-Brown et al. 2007. PLINK: A tool set for whole-genome association and population-based linkage analyses. Am. J. Hum. Genet. 81:559–575.
Reich, D., N. Patterson, M. Kircher et al. 2011. Denisova admixture and the first modern human dispersals into Southeast Asia and Oceania. Am. J. Hum. Genet. 89:516–528.
Scheet, P., and M. Stephens. 2006. A fast and flexible statistical model for large-scale population genotype data: Applications to inferring missing genotypes and haplotypic phase. Am. J. Hum. Genet. 78:629–644.
Scholes, C., K. Siddle, A. Ducourneau et al. 2011. Genetic diversity and evidence for population admixture in Batak negritos from Palawan. Am. J. Phys. Anthropol. 146:62–72.
Stoneking, M., and F. Delfin. 2010. The human genetic history of East Asia: Weaving a complex tapestry. Curr. Biol. 20:R188–R193.
Teng, Y. S., and S. G. Tan. 1979. Genetic evidence of gene flow from Indians to Malays. J. Hum. Genet. 24:1–8.
Tian, C., P. K. Gregersen, and M. F. Seldin. 2008. Accounting for ancestry: Population substructure and genome-wide association studies. Hum. Mol. Genet. 17:R143–R150.
Underhill, P. A. 2003. Inferring human history: Clues from Y-chromosome haplotypes. Cold Spring Harb. Symp. Quant. Biol. 68:487–494.
Vlieland, C. A. 1934. The population of the Malay Peninsula: A study in human migration. Geogr. Rev. 24:61–78.
Weir, B. S., and C. C. Cockerham. 1984. Estimating F-statistics for the analysis of population struc-ture. Evolution 38:1,358–1,370.
Yamaguchi-Kabata, Y., K. Nakazono, A. Takahashi et al. 2008. Japanese population structure, based on SNP genotypes from 7003 individuals compared to other ethnic groups: Effects on popula-tion-based association studies. Am. J. Hum. Genet. 83:445–456.
Xu, S., I. Pugach, M. Stoneking et al. 2012. Genetic dating indicates that the Asian–Papuan admixture through Eastern Indonesia corresponds to the Austronesian expansion. Proc. Natl. Acad. Sci. USA 109:4,574–4,579.
Yang, X., S. Xu, and the HUGO Pan-Asian SNP Consortium. 2011. Identification of close relatives in the HUGO Pan-Asian SNP database. PLoS One 6:e29502.