administrative science quarterly these unequal states: the
TRANSCRIPT

Administrative Science Quarterly1–37� The Author(s) 2016Reprints and permissions:sagepub.com/journalsPermissions.navDOI: 10.1177/0001839216673823asq.sagepub.com
These Unequal States:CorporateOrganization andIncome Inequality inthe United States
J. Adam Cobb1 and Flannery G. Stevens2
Abstract
In an analysis of data on employment in the 48 contiguous United States from1978 to 2008, we examine the connection between organizational demographyand rising income inequality at the state level. Drawing on research on socialcomparisons and firm boundaries, we argue that large firms are susceptible totheir employees making social comparisons about wages and that firms under-take strategies, such as wage compression, to help ameliorate their damagingeffects. We argue that wage compression affects the distribution of wagesthroughout the broader labor market and that, consequently, state levels ofincome inequality will increase as fewer individuals in a state are employed bylarge firms. We hypothesize that the negative relationship between large-firmemployment and income inequality will weaken when large employers aremore racially diverse and their workers are dispersed across a greater numberof establishments. Our results show that as the number of workers in a stateemployed by large firms declines, income inequality in that state increases.When these firms are more racially diverse, however, the negative relationshipbetween large-firm employment and income inequality weakens. These resultspoint to the importance of considering how corporate demography influencesthe dispersion of wages in a labor market.
Keywords: employment, firm boundaries, income inequality, social compari-sons, wage compression
How economic rewards in a society are distributed is a central question of thesocial sciences, and scholars from a variety of disciplines have developed the-ories in attempts to answer it. For example, building from the human capital tra-dition (e.g., Becker, 1964), skill-biased technological change (e.g., Autor, Katz,and Kearney, 2008) emphasizes how the adoption of information and communi-cation technologies differentially affects the productivity, and thus the earnings,
1 The Wharton School, University of Pennsylvania2 David Eccles School of Business, University of Utah
at UNIV OF PENNSYLVANIA on October 17, 2016asq.sagepub.comDownloaded from

of high- and low-skilled workers, leading to greater income inequality. Similarly,globalization is thought to increase inequality by increasing the demand forskilled labor and decreasing the demand for unskilled labor in developed coun-tries (Bentele and Kenworthy, 2013). Institutional-based accounts for the rise ofof income inequality have found that declining rates of unionization (Westernand Rosenfeld, 2011), changes to the occupational structure (e.g., Mouw andKalleberg, 2010), financialization (e.g., Lin and Tomaskovic-Devey, 2013), gov-ernment policy (e.g., Kenworthy and Pontusson, 2005), and family formationpractices (see McCall and Percheski, 2010) each have had an important influ-ence on the distribution of income in the United States.
More recently, other scholars have studied the ways in which firms affectthe distribution of income that results in rising levels of income inequality.Because wages are often tied to jobs rather than to individuals (Granovetter,1981), and because the pricing and allocation of labor are often governed byadministrative rules rather than market forces (Doeringer and Piore, 1971),advocates of this approach contend that to understand how rewards in a soci-ety are distributed, one must examine employers’ decisions about the alloca-tion of money, opportunity, and status (Baron, 1984; Bidwell et al., 2013). Todate, however, few studies have examined how firms affect income inequalityin the broader labor market (Sørensen, 2007). Rather, most studies in this areahave focused on explaining patterns of inequality within organizations (e.g.,Kalleberg and Van Buren, 1994), which may mask the broader impact ofemployers’ choices about how to structure employment relations. For instance,strategies that likely decrease within-firm income inequality, such as outsour-cing and layoffs, may increase societal-level inequality (Cobb, 2016). Althoughprevious studies have found that wage variation among employers accountsfor a significant part of the overall variance in workers’ wages (e.g., Song et al.,2015), we still lack a robust understanding of the ways in which firms affectthe distribution of income in a labor market (Sørensen and Sorenson, 2007).
To help address this concern, we leverage insights from research on theeffect of firm size on wages (e.g., Oi and Idson, 1999), social comparisons andfirm boundaries (e.g., Nickerson and Zenger, 2008), and organizational wagesetting (e.g., Granovetter, 1981) to develop a simple theory about how changesin corporate employment affect rates of income inequality in a labor market.Our core argument is that rates of income inequality are affected by the extentto which workers in a labor market are employed by large firms. Prior researchhas found that otherwise identical workers earn more when working for largefirms and that this firm-size wage effect is greater for low-skilled workers thanfor high-skilled workers (Hollister, 2004). By paying lower-skilled workers agreater wage premium than higher-skilled ones, large firms compress wages.They may do so to reduce the costs of social comparisons, as researchers con-tend that workers are prone to compare their rewards with those received bysimilar others (Festinger, 1954; Adams, 1963) and that employees’ responsesto any perceived inequity arising from these evaluations impose costs on thefirm (Cohn et al., 2014). To minimize these costs, firms may attempt to estab-lish a sense of internal pay equity by compressing wages. Because social com-parison costs increase with the scale and scope of the firm (Nickerson andZenger, 2008), large firms should be more likely than smaller firms to compresswages. On average across large firms, the wages for lower-skilled workers arehigher than the going market wage, and wages for higher-skilled workers are at
2 Administrative Science Quarterly XX (2016)
at UNIV OF PENNSYLVANIA on October 17, 2016asq.sagepub.comDownloaded from

or below the going wage. This leads us to expect that the overall distribution ofwages in a labor market will be narrower when more workers are employed bylarge firms.
If large firms compress wages at least in part to minimize their social com-parison costs, factors that affect the strength of social comparison processesin large firms should moderate the relationship between large-firm employmentand income inequality. Prior research has suggested that people comparethemselves with those who belong to the same social categories and thoseabout whom they have more information (Lansberg, 1989). Thus when thelarge corporate employers in a state are more racially diverse and when theiremployment is more dispersed across establishments, firms are likely to havegreater leeway in differentiating rewards across groups of workers, weakeningthe relationship between large-firm employment and levels of income inequalityin the labor market.
We test our hypotheses on the contiguous 48 U.S. states from 1978 to2008. Research has found abundant evidence indicating that income inequalityin the United States grew dramatically during this period (Atkinson, Piketty, andSaez, 2011), and this growth has been highly uneven across states. Statessuch as Arkansas, Florida, New York, and South Carolina experienced a growthin inequality of over 50 percent during the period, while Colorado, Delaware,Minnesota, and South Dakota had less than 38 percent growth. Becausechanges in income inequality and corporate demography are not uniform acrossstates over time, we can exploit this variation to examine the impact of large-firm employment on state levels of income inequality.
SOCIAL COMPARISON, CORPORATE ORGANIZATION, AND INEQUALITY
Social Comparison and Wage Compression in Firms
One of the most consistent findings in the research on employment and com-pensation is that otherwise identical workers earn more when working for largefirms. Numerous theories for this empirical regularity have been proposed,including differences related to firm size in information acquisition and monitor-ing costs, technology, organizational characteristics, and union threats, amongothers (see Oi and Idson, 1999). Though researchers in this area have primarilyfocused on examining the causes of the firm-size wage effect, its distributionalconsequences for employees have been largely unexplored. Yet research hasfound evidence that large-firm employment is particularly rewarding to lower-skilled workers, who receive an even greater wage premium than higher-skilledones (Hollister, 2004). These findings suggest that whatever factors lead largefirms to offer premium wages, the motivation to do so is stronger for lower-skilled, lower-wage workers, leading firms to compress wages. One factor thatmight explain why large firms compress wages in this manner is the desire toreduce the costs that arise from perceptions of inequity that occur whenrewards inside a firm are widely dispersed.
Large firms compress wages to counter the effects of individuals’ tendencyto compare their rewards with those received by a set of salient referents, asestablished in early research on social comparisons (Festinger, 1954; Adams,1963). Individual motivation is influenced by perceptions of fairness or inequityarising from such comparisons, and, complicating this process, individuals tend
Cobb and Stevens 3
at UNIV OF PENNSYLVANIA on October 17, 2016asq.sagepub.comDownloaded from

to overestimate their performance (Weinstein, 1980; Larkin, Pierce, and Gino,2012) and compare their rewards with those who are similar in perceived per-formance but receive greater rewards (Martin, 1981). To address these percep-tions of inequity, individuals engage in such tactics as reducing their effort(Cohn et al., 2014), lobbying managers who assign compensation (Milgrom andRoberts, 1988), leaving the organization (Carnahan, Agarwal, and Campbell,2012), or otherwise engaging in counterproductive behaviors that are costly forthe group (Gino and Pierce, 2010). We refer to these resulting costs as socialcomparison costs (Nickerson and Zenger, 2008).
Although social comparisons can arise in any group, prior literature hasestablished that similarity, proximity, the degree of interaction, and the availabil-ity of information are key determinants of how employees select salient refer-ents (Festinger, 1954; Kulik and Ambrose, 1992). In the marketplace,individuals have little personal contact and less information about the rewardsof others, making social comparisons across firm boundaries more difficult(Akerlof and Yellen, 1988). Thus firm boundaries serve as a natural referencepoint for employees who are more sensitive to pay differences within a firmthan between firms.
Also, the social comparison costs are likely to increase with the scale andscope of the firm, such that these costs are proportionately greater in largerfirms than in smaller ones (Nickerson and Zenger, 2008). That is, although indi-viduals compare their rewards with those of others irrespective of firm size,the costs that accrue from the perceived inequities arising from these compari-sons should be proportionally greater in large firms, for at least two reasons.First, as the number of employees in a firm increases, the disparity betweenthe most and least productive workers should also increase. If workers earneda wage equal to their marginal product, the disparity in performance and thuswages should exacerbate their propensity to engage in invidious social compari-sons.1 Second, large firms are typically more complex and differentiated(Kalleberg and Van Buren, 1996), forcing them to integrate activities that vary intheir average marginal products. Workers within these different activities thenbecome part of each other’s reference group, raising the potential for perceivedinequities (Nickerson and Zenger, 2008).
Given the disruptive nature of social comparisons and their propensity toarise within larger organizations, a key task for a firm’s executives is to struc-ture the organization in a way that forms the desired bundle of human assetswhile minimizing governance and social comparison costs (Zenger and Huang,2009). A number of scholars have suggested that one of the key ways in whichorganizational leaders respond to social comparison costs is by weakening thelink between pay and performance (e.g., Akerlof and Yellen, 1988). Orthodoxeconomic theory predicts that wages are likely to be based on the relative qual-ity of workers—evidenced by performance, skills, and credentials—as well ason the broader market forces of supply and demand. Wage-setting systemsthat reward workers based on their marginal product can lead to higher levels
1 Throughout, we make reference to pay being determined by workers’ productivity. We are agnos-
tic, however, regarding whether wages are a true reflection of workers’ productivity, which is diffi-
cult to measure, or an outcome of social processes that influence perceptions of workers’ value
(see Avent-Holt and Tomaskovic-Devey, 2014). Here we are concerned only with the going wage in
the labor market rather than what factors determine that wage.
4 Administrative Science Quarterly XX (2016)
at UNIV OF PENNSYLVANIA on October 17, 2016asq.sagepub.comDownloaded from

of wage dispersion within organizations because they increase the wage gapbetween more and less productive workers (Bandiera, Barankay, and Rasul,2007). Because organizations often lack objective, observable, and nonsocialstandards for performance assessments (Larkin, Pierce, and Gino, 2012) andbecause individuals have a proclivity to overestimate their abilities (Zenger,1992), paying individuals differently for the same job will likely exacerbate thecosts of social comparisons.
In practice, wages are often tied to jobs rather than to individuals(Granovetter, 1981). Historically, large corporate employers systemized thewage-setting process through job evaluation. In a prototypical job evaluationsystem, each job is evaluated along dimensions such as the required skill,effort, scope of responsibility, and working conditions (Boxall and Purcell,2011). Jobs are then assigned wages based on their value to the firm and inrelation to other jobs within the organization. To ensure consistency and avoidconflict, pay increases are restricted within modest ranges (Beer, Spector,and Lawrence, 1984). One of the consequences of these types of systems isthat they ‘‘bend the market wages for each job—raising some and loweringothers . . .’’ (Cappelli, 2001: 227), reducing wage dispersion in firms comparedwith the hypothesized marginal product schedule (Sanchez and Levine, 2012).By assigning wages to jobs and establishing criteria by which jobs are com-pared, employers hope to mitigate perceptions of inequity (Pfeffer and Davis-Blake, 1992). Not surprisingly, studies on wage setting inside large firms con-firm that a weak link exists between performance measures and pay and thatnon-performance-related factors such as workers’ age, tenure, and job gradeexplain most of the variance in pay (e.g., Brown and Medoff, 1989). Thoughworkers may feel that their efforts merit greater pay, they cannot dispute theprocedural fairness of these systems and have little recourse in appeals tomanagement to adjust their pay (Zenger and Huang, 2009).
Forming a sense of internal pay equity requires employers to compress payalong two dimensions. First, horizontal compression occurs when those in thesame job receive relatively equal pay even if what they contribute varies. Jobevaluation systems have been shown to create only modest wage variationamong employees doing the same job (O’Shaughnessy, Levine, and Cappelli,2001). Second, vertical compression occurs when pay differentials across jobsare flattened, despite the varying contributions to organizational output associ-ated with those positions. Flattening differentials between jobs requires thatthe firm pay above the marginal product for some employees, typically lower-skilled, lower-wage workers, and/or pay near or below the marginal product forother workers, typically higher-skilled, higher-wage ones (Groshen, 1991).
Though large firms may use wage compression to reduce social comparisoncosts, they may also use it for other purposes. Some researchers speculatethat large firms are likely to pay above-market wages to help stave off unioniza-tion attempts (e.g., Mellow, 1982). In the United States many types of profes-sional workers have historically not joined labor organizations (Lichtenstein,2002), so we might expect that wage premiums resulting from unionizationthreats would be greater for low- to mid-skill workers. Prior research also sug-gests that large firms offer premium wages because their monitoring andscreening costs are higher (Garen, 1985). If these costs vary within the firmsuch that they are disproportionately higher for the lower-skilled than higher-skilled workers, large firms may have a more compressed wage distribution
Cobb and Stevens 5
at UNIV OF PENNSYLVANIA on October 17, 2016asq.sagepub.comDownloaded from

than smaller firms, so as to gain efficiency from standardizing wages acrossjobs.
Although there may be other rationales for why large firms compresswages, a vast interdisciplinary literature supports the idea that large firms do soto foster perceptions of equity and to lower social comparison costs (e.g.,Baker, Jensen, and Murphy, 1988; Lazear, 1989; Groshen and Levine, 1998;Larkin, Pierce, and Gino, 2012). Additionally, research on internal labor marketssuggests that one of the overriding goals of organizational wage-setting policiesis to use administrative procedures that help foster perceptions of equity andfairness (Doeringer and Piore, 1971). The literature on wage systems based onjob evaluations similarly argues that such systems are designed specifically toensure a more equitable and procedurally fair distribution of wages inside firms(Bartling and von Siemens, 2010). Moreover, there is little empirical support forunion threats, monitoring costs, and information-acquisition costs being respon-sible for compressed wages (see Brown and Medoff, 1989; Cappelli andChauvin, 1991). Although we cannot definitively rule out these or other reasonsthat large firms may be more likely than smaller ones to compress wages, thedesire to maintain perceptions of equity seems a crucial motivator.
Social Comparison, Wage Compression, and Firm Boundaries
From 1978 to 2008, large U.S. corporations also undertook a variety of tacticsthat helped redraw firm boundaries. As a result of divestitures, spin-offs, andother forms of restructuring associated with de-conglomeration, the relativesize of the largest employers declined. The number of workers employed byFortune 500 firms dropped from 16.2 million in 1979 to 11.5 million in 1993(Useem, 1996). Breaking up these conglomerates was expected to increasethe variation in performance across firms’ subunits (Jensen, 1993), and theless-profitable subunits would no longer be subsidized by the more-profitableones. If these diversified business units varied in terms of their average mar-ginal product schedule, separating them into distinct organizations would allowpay to be set more closely to market levels. Batt (2001) found support for theseclaims in her study of wage inequality in the telecommunications industry: thebreakup of the Bell system in 1984 allowed wage inequality among telecom-munications service and sales workers to grow over 30 percent between 1983and 1998.
Though the ‘‘bust-up’’ takeover wave subsided by the end of the 1980s,restructuring persisted throughout the following two decades. Beginning in theearly 1990s, the use of outsourcing helped disaggregate corporate employmentfurther. When a large firm outsources some of its tasks, the distribution of jobswithin the firm changes as entire functions and departments are extricatedfrom within the firm’s boundaries and handed to outside vendors. Cappelli(1999: 74) recounted how IBM outsourced all clerical jobs below the rank ofexecutive secretary to employment agencies such as Manpower, Inc., whichmeant that these jobs became separated from the internal labor markets thatreduced wage disjunctures within the firm. Dube and Kaplan (2010) found thatoutsourced janitors and security guards routinely earned less than their in-house counterparts, as firms removed those mid- to high-paying jobs andturned them into lower-paying jobs. By moving employees outside the bound-ary of the firm, outsourcing limits the amount of within-firm heterogeneity of
6 Administrative Science Quarterly XX (2016)
at UNIV OF PENNSYLVANIA on October 17, 2016asq.sagepub.comDownloaded from

abilities and rewards, reducing envy and social comparison costs (Rawley andSimcoe, 2010: 1535).
Though the dynamics mentioned above, in aggregate, shrank firm bound-aries such that the average proportion of U.S. workers employed in the largest100 firms declined between 1978 and 2008 (Davis and Cobb, 2010), the trendsvaried across the U.S. states: the proportion of the labor force employed byfirms with at least 10,000 employees in the U.S. declined in 17 states andincreased in 31 states. We exploit this variance to examine whether within-state changes in employment at large firms have affected changes in the ratesof income inequality in those states over time.
Wage Compression and State-level Income Inequality
Though research has focused primarily on how social comparison costs—andthe strategies that managers employ to mitigate them—affect organizationaloutcomes, these strategies may also affect the distribution of income in a labormarket. We do not suggest that all large firms compress wages or even that,within a given firm, all employees are subject to the same wage-setting consid-erations (Lepak and Snell, 1999). But because large firms on average areexpected to compress wages to maintain perceptions of equity (Nickerson andZenger, 2008), we expect to find, controlling for the size of a state’s labor force,a negative relationship between large-firm employment and income inequalityat the labor-market level.
To illustrate the mechanisms undergirding the aggregation process wedescribe above, consider a hypothetical state where in year 1 all labor marketparticipants work for a single employer that compresses wages to constrainthe disjuncture between differentially skilled workers. In this firm, lower-skilledworkers are paid, on average, above their marginal product while higher-skilledworkers are paid closer to or below their marginal product. Income inequality inthis case, as measured by the Gini coefficient, is 20.4, as shown in figure 1.2 Inyear 2, half of all workers remain employed by the large firm, and the other halfare outsourced, work as independent contractors, and get paid according totheir marginal product. The slope between wages and skill will be greater thanin year 1, and the Gini coefficient increases to 25.8. In year 3, all labor force par-ticipants are independent contractors paid according to their marginal product,and the Gini coefficient increases to 32.7. We therefore suggest the followinghypothesis:
Hypothesis 1 (H1): As fewer (or more) workers in a state are employed by largefirms, income inequality in the state will increase (or decrease).
2 In this example, skill levels range from 0 to 100 in increments of two, and an equal number of indi-
viduals works at each skill level in each year. Individual wage rates vary depending on whether the
individual is employed by the firm or is an independent contractor. We calculated the wage rates
using the following formulas:
Wlarge firm = s+ 12
� �× ln sð Þ� �� �
2× $1,000
Wmarket = s× $1,000
where s equals the worker’s skill level. The Gini coefficient was calculated for each state-year using
the ginidesc command in Stata.
Cobb and Stevens 7
at UNIV OF PENNSYLVANIA on October 17, 2016asq.sagepub.comDownloaded from

Though organizational membership serves as a powerful force in determin-ing the referents used in social comparisons within organizations, additional fac-tors may influence this process, in particular racial diversity and establishmentdispersion.
Social Comparison and the Moderating Impact of Racial Diversity
Prior research has established that social comparison processes are affectedby individuals’ propensity to separate collectives into smaller social categories(e.g., Blanton, Crocker, and Miller, 2000). Because demographic characteristicsare commonly used to distinguish social categories (Tajfel, 1978) and shape theformation of identity groups (Alderfer, 1977), demographic diversity may createa larger number of social categories within the firm, thereby minimizing thescope of social comparisons. Employees who are demographically similar aremore likely to view themselves as part of the same social category and selectother category members as their referents when making social comparisons(Goodman, 1977). That is, whites are more likely to compare their opportunitiesand rewards with other whites, blacks with blacks, etc. People tend to makewithin-group comparisons because they assume in-group referents are similarin attributes related to achievement, such as education and background(Gibson and Lawrence, 2010). We should expect, then, that social comparisonswill operate more strongly within these social categories than between them.
To compare differences between groups, individuals engage in social con-trasting (Harris, Anseel, and Lievens, 2008). Although people often seek infor-mation about others who are dissimilar, social contrasting does not assumeexpectations of equal entitlement across social categories. Rather, social con-trasting assumes that individuals will expect individuals who are dissimilar to
Figure 1. Wage compression and state-level income inequality.
G = 20.4
G = 32.7G = 25.8
025
5075
100
Wag
e (0
00s)
0 25 50 75 100
Skill
Year 1 Year 2Year 3
8 Administrative Science Quarterly XX (2016)
at UNIV OF PENNSYLVANIA on October 17, 2016asq.sagepub.comDownloaded from

receive unequal treatment (Lansberg, 1989). The unequal outcomes receivedby disadvantaged members are often then appraised as legitimate (Wood,1994) or are otherwise discounted (Markovsky, 1985). Consequently, compari-sons with dissimilar individuals do not invite the same sorts of reactions as docomparisons with similar ones. More demographically homogenous firmsshould therefore have a smaller number of social categories, which wouldexpand the number of salient referents within each category, placing greaterpressure on organizations to employ strategies to minimize social comparisoncosts.
Yet studies have also shown that larger firms are more likely to standardizetheir wage-setting functions, which can help close the wage gap between themore-advantaged and less-advantaged groups (Hirsh and Kornrich, 2008). Thisstandardization implies that minorities working in large firms receive greaterrewards than do otherwise similar minorities working in small firms and thatthere should be a narrower wage gap between otherwise similar white andminority workers in large firms. In the United States, evidence reveals thatracial wage gaps have remained relatively constant (see Leicht, 2008) ordeclined modestly over the past 40 years (Lang and Lehmann, 2012), but largefirms have become much more racially diverse during this period, suggestingthat the increased diversity of large-firm employment has not closed racialwage gaps, at least in the aggregate.
Moreover, research has found that perceptions of fairness and egalitarianismare stronger in more demographically homogenous groups (Rothschild-Whitt,1979) and that diverse groups have more dispersed wages than homogenousgroups (Pfeffer and Davis-Blake, 1990). Carrington and Troske (1998) found in astudy of large manufacturing firms that most of the black–white wage gapamong men was accounted for by within-plant differences. Additionally, theyfound that whites earn more in plants with more blacks and blacks earn themost in plants that are nearly all white. In other words, while racial minoritiesmay benefit from large-firm employment, that advantage occurs when theoverall diversity of the firm is lower. Consistent with our argument that theneed to compress wages horizontally and vertically is weaker when firms aremore racially diverse, the wage gaps between minority and white workers willalso be greater. Accordingly, we expect that social comparisons will operateless vigorously as large firms become more racially diverse, allowing managersto engage in less wage compression.
Hypothesis 2 (H2): The negative effect of large-firm employment on income inequal-ity will weaken (or strengthen) as employment in large firms in a state becomesmore (or less) racially diverse.
Social Comparison and the Moderating Impact of EstablishmentDispersion
Managers can also reduce social comparison costs by increasing the physicaland informational distance between jobs (Nickerson and Zenger, 2008: 1437).Prior work has established that distance serves as an important barrier to thediffusion and exchange of information (Sorenson, 2003), which could hinderworkers’ ability to know about the rewards of less-proximate others. Distancewill also hinder the formation of social ties (Festinger, Schachter, and Back,
Cobb and Stevens 9
at UNIV OF PENNSYLVANIA on October 17, 2016asq.sagepub.comDownloaded from

1950), which are crucial to the formation of reference groups (Lawrence,2006). Conversely, when workers are located in close proximity to one another,they are more likely to identify each other as salient referents, which canincrease the costs of social comparisons if their income is more dispersed(Obloj and Zenger, 2015).
One proxy for the physical and informational distance between workers in afirm is the extent to which large-firm employment is spread out across a largernumber of establishments—that is, separate locations where the firm’s busi-ness is conducted. As firms grow, they often build or acquire new plants andsubsidiaries in different locations, which increases both the physical and infor-mational distance between jobs. Geographic expansion may give firms accessto new markets, lower costs, and other operational benefits, and it can alsolower social comparison costs as workers have a smaller set of salient refer-ents. In fact, one reason firms may create separate establishments is to sepa-rate higher-wage workers from lower-wage ones to reduce social comparisoncosts (Nickerson and Zenger, 2008).
Imagine a firm that employs two types of workers: highly skilled engineersand lower-skilled production workers. Were the firm to have all workersemployed in the same location, giving a raise to the engineers would likely elicitenvy among production workers. Were production and engineering separatedin different establishments, however, production workers might be less awareof wage increases for engineers. Thus by segregating high- and low-skill work-ers, the firm may be better able to adjust wages for engineers without havingto increase wages for production workers (see Obloj and Zenger, 2015).
But this relationship might not be so straightforward. If, for example, largefirms standardize wages as a means to economize on monitoring, information,and/or administrative costs, we might expect that the firms’ wage distributionswill be unaffected by establishment dispersion. Furthermore, employees maystill have information on wage differentials across establishments. Williamson(1985) recounted the story of a failed post-merger integration betweenTenneco, Inc. and Houston Oil and Minerals Corp. because of the variance inhow workers from the old and new firms were paid, suggesting that maintain-ing wage-setting consistency across establishments is still necessary to mini-mize social comparison costs. Despite these possibilities, if establishing newplants and subsidiaries allows firm managers to have more discretion in differ-entiating rewards across workers or to segregate higher- and lower-incomeworkers, managers of these firms will have less need to compress wages.Hence we expect that when large firms’ employment is spread out over alarger number of establishments, overall social comparison costs should belower and firms will have less need to compress wages:
Hypothesis 3 (H3): The negative effect of large-firm employment on income inequal-ity will weaken (or strengthen) as employment in large firms in a state becomesmore (or less) dispersed across establishments.
METHODS
Unit of Analysis and Sample
To examine the connection between organizational demography and risingincome inequality at the state level, we used establishment-level employment
10 Administrative Science Quarterly XX (2016)
at UNIV OF PENNSYLVANIA on October 17, 2016asq.sagepub.comDownloaded from
data derived from reports filed annually with the Equal EmploymentOpportunity Commission (EEOC), known as EEO-1 reports.3 As mandated byTitle VII of the Civil Rights Act (1964), the EEOC requires all private workestablishments with at least 100 employees, all federal contractors with atleast 50 employees, and first-tier subcontractors in agreements worth atleast $50,000 to file these reports each year. EEO-1 reports cover approxi-mately 40 percent of private-sector employment nationally (Robinson et al.,2005) and contain information on an establishment’s size, parent company,industry, demographic composition (e.g., race/ethnicity, sex), and employ-ment across nine occupational categories: officials and managers, profes-sionals, technicians, sales workers, administrative support workers, craftworkers, operatives, laborers and helpers, and service workers. Because thedata are at the establishment level (i.e., individual work sites) rather thanfirms as a whole, we were able to isolate firm employment at the state level.We incorporated data from a variety of other sources as well, including theBureau of Labor Statistics, Bureau of Economic Analysis, and U.S. CensusBureau. Table 1 contains information on the data sources for each of the vari-ables used in the study.
Though we cannot directly assess wage compression or the presence ofcorporate restructuring, we can capture shifts in the number of workers in astate employed by large firms as well as the racial diversity and establishmentdispersion of large firms, allowing us to determine whether these organizationalfactors have influenced changes in income inequality over time. The sampleincludes all U.S. states for which we could find reliable measures for incomeinequality, corporate employment, racial diversity, establishment dispersion,and the control variables between 1978 and 2008. Because of missing data onsome of the covariates, the final balanced sample consists of 1,488 observa-tions from the 48 contiguous states.4
We chose to analyze states because there are far better data for states thanfor any other subnational entity. Annual historical data on income inequality andother covariates are not available below the state level, complicating efforts toexamine factors related to income inequality at lower levels of analysis.Furthermore, while conventional wisdom suggests that workers are moremobile now than in years past, evidence shows that interstate migration is lowand has been falling since the early 1980s (Molloy, Smith, and Wozniak, 2013),suggesting that states are a suitable labor market for the study of firms andincome inequality.
Measures
Dependent variable. The measure of income inequality used in this studyis the Gini coefficient, which measures the extent to which the distribution ofincome deviates from a perfectly equal distribution. The Lorenz curve is a gra-phical representation of cumulative income share on the vertical axis and the
3 The EEO-1 reports are confidential and not publicly available; the data were obtained from the
EEOC through an Intergovernmental Personnel Act (IPA) agreement by one of the authors.4 Data on educational attainment were not available for Alaska or Hawaii, and there appear to be
issues with missing employment data for both of these states prior to 1986. Including both states
without the measures of educational attainment from 1986 to 2008 does not materially affect the
results.
Cobb and Stevens 11
at UNIV OF PENNSYLVANIA on October 17, 2016asq.sagepub.comDownloaded from

distribution of the population on the horizontal axis. Each point on the Lorenzcurve represents the share of income held by x percent of the population. TheGini coefficient measures the percentage of area that lies between the Lorenzcurve and a line of perfect equality. The coefficient varies between 0, whichrepresents complete equality, and 1, which indicates complete inequality (i.e.,one person earns all income). For ease of interpretation, we express the Ginicoefficient in percentage terms.
The historical Gini coefficient data were compiled from pre-tax income fromIRS tax records by Frank (2009). At the national level, capital income (e.g., capi-tal gains and dividends) is separated from salary income; at the state level,however, there is no way to distinguish between the two sources. Atkinson,Piketty, and Saez (2011) found that, for top earners in the United States since1970, income is derived primarily from salary, suggesting that any concernsregarding whether our measure of income inequality is affected by capitalincome are minimal. To ensure that our results were not sensitive to the
Table 1. Means, Standard Deviations, and Data Source of Variables in the Analysis of State-
level Income Inequality (N = 1,488)*
Variable Mean S.D. Min. Max. Source
Gini coefficient 57.28 7.31 43.90 87.78 Frank (2009)
Large-firm employment (log) 12.20 1.21 9.31 14.75 EEO-1
Large-firm racial diversity 49.35 10.37 24.80 81.58 EEO-1
Large-firm establishment dispersion 93.96 3.60 57.78 98.84 EEO-1
Labor force (log) 14.42 0.99 12.37 16.85 BLS (State & Area Employment,
Hours, & Earnings)
GDP per capita (log) 10.04 0.47 8.87 11.17 BEA (Regional Economic Accounts)
Black employment (%) 10.61 9.41 0.24 43.20 EEO-1
Urban population (%) 68.65 14.57 32.20 94.46 U.S. Census (Urban Percentage of
the Population for States,
Historical)
Large-firm service employment (%) 39.80 8.64 17.14 65.98 EEO-1
Government employment (%) 16.01 3.03 10.11 25.72 U.S. Census (County Business
Patterns)
Manufacturing employment (%) 19.49 8.19 4.01 42.81 U.S. Census (County Business
Patterns)
Retail employment (%) 19.32 4.12 11.18 28.75 U.S. Census (County Business
Patterns)
College graduates (%) 14.23 4.08 6.44 30.56 Frank (2009)
Foreign direct investment (log) 8.33 1.20 3.86 11.16 BEA (Activities of U.S. Affiliates of
Foreign Multinational Enterprises)
Union density (%) 14.55 6.75 2.30 38.30 Hirsch and Macpherson (2003)
Unemployment (%) 5.73 1.95 2.30 17.40 BLS (Local Area Unemployment
Statistics)
Democrats in state legislature (%) 56.00 16.94 10.71 98.10 Klarner (2014)
Tax rate (%) 44.31 8.44 28.00 75.94 NBER
Minimum wage 3.13 0.38 2.55 4.08 TPC; DOL (Wage & Hour Division)
Government transfers per capita (log) 4.75 0.19 4.18 5.37 BEA (Regional Economic Accounts)
Patents (per 000s) 0.42 0.39 0.02 2.72 Lai et al. (2015)
* EEO-1 = EEOC’s annual EEO-1 reports; BLS = Bureau of Labor Statistics; BEA = Bureau of Economic Analysis;
NBER = National Bureau of Economic Research; TPC = Tax Policy Center; DOL = Department of Labor.
12 Administrative Science Quarterly XX (2016)
at UNIV OF PENNSYLVANIA on October 17, 2016asq.sagepub.comDownloaded from
ultimate source of the data, we also used Gini data taken from the CurrentPopulation Survey (CPS), available through the University of Texas InequalityProject (Galbraith and Hale, 2008). The results are consistent with those pre-sented here.
Independent variables. Our main independent variable is large-firmemployment. Corporate employment data at the state level were derivedfrom EEO-1 reports, as described above. One challenge in capturing employ-ment by a state’s largest employers is that there is no consensus about whatconstitutes a ‘‘large’’ firm. Prior studies have used 1,000 employees as thecutoff (e.g., Bidwell, 2013), which is the largest category used in manyindividual-level datasets such as that of the CPS. The U.S. Census Bureau,however, provides aggregated employment data at the national level for firmsizes up to 10,000 employees. In the analyses presented below, we used asour measure of large-firm employment the log value of the number of work-ers in each state employed by firms with 10,000 or more workers nationally.5
Thus if a firm has 10,000 domestic workers—5,000 in State A and 5,000 inState B—our measure of large-firm employment in each state would reflectthe 5,000 workers employed in each state. The correlations between the lognumber of workers in a state employed by firms with 1,000, 5,000, 10,000,20,000, and 50,000 or more workers all exceed .97. We ran analysesusing these cutoffs, and the results are largely consistent with those pre-sented below.
Our examination of racial diversity’s effect on the relationship betweenlarge-firm employment and income inequality is based on the conceptualizationof diversity as ‘‘variety’’ (Harrison and Klein, 2007), with specific interest in thedistribution of employees across distinct racial categories within firms. Theseracial categories do not have meaningful continuous distances between them,so we created a Blau index of racial diversity for each firm from EEO-1 reportsto capture the spread of individuals across qualitatively distinct racial cate-gories. The Blau index reflects the chance that two randomly selected groupmembers belong to different categories. Its computational formula is 1 –�pk
2,where p is the proportion of unit members in the kth category. We then stan-dardized the Blau index by dividing it by its theoretical maximum, (K–1)/K,where K represents the total number of categories, to create the index of qual-ity variation (IQV) of racial diversity for each large firm. We have four race cate-gories—white, black, Hispanic, and Asian—so the theoretical maximum forracial diversity is .75.6 We took a weighted average of the IQV of racial diversityfor all the large firms that employed workers in each state in each year and mul-tiplied this value by 100 for ease of interpretation to derive our measure of
5 Davis and Cobb (2010) used the ratio of employees working in the largest firms over the size of
the labor force as their measure of large-firm employment. Following this approach would allow us
to capture the hypothesized dynamics in a single, self-contained measure. Yet prior research has
argued that using ratios in regression analyses may lead to spurious findings because the correla-
tions among ratios will produce a non-zero association even though the components (i.e., the
numerators and denominators) are unrelated (Wiseman, 2009). In the supplemental analyses we
test our hypotheses using the ratio measure of large-firm employment.6 Because whites and Asians tend to be advantaged in the labor market more than blacks and
Hispanics, we also calculated an IQV measure of inequality using two categories: (a) white and
Asian, and (b) black and Hispanic. The results are similar to those presented below.
Cobb and Stevens 13
at UNIV OF PENNSYLVANIA on October 17, 2016asq.sagepub.comDownloaded from
large-firm racial diversity. In 1978, the average racial diversity of large firmswas 36.53 (s.d. = 5.05). By 2008, that number was 65.35 (s.d. = 5.30). In sup-plementary analyses, we examined alternative measures of racial diversity.
The EEO-1 reports contain employment data for each establishment, allow-ing us to calculate how dispersed each firm’s employment was across estab-lishments. To examine the effect of large-firm establishment dispersion on therelationship between large-firm employment and income inequality, we createda Blau index to indicate how dispersed employment was in each large firm.7
We took a weighted average of the Blau index for all the large firms thatemployed workers in each state in each year, giving us a state-level index ofestablishment dispersion. Once again, we multiplied the measure by 100. In1978, the average establishment dispersion of large firms was 94.37 (s.d. =2.37). By 2008, that number was 97.56 (s.d. = 3.19). In the supplemental analy-ses, we examined an alternative measure of establishment dispersion.
Control variables. Income inequality may relate to several factors notincluded in the discussion of the hypotheses. It is possible that large-firmemployment, diversity, and establishment dispersion are due, in part, to thesize of a state’s labor force and economy. To account for these possibilities,we included a log measure of each state’s nonfarm labor force and the naturallog of the state’s real gross domestic product per capita (GDP per capita).
Because we were interested in how racial diversity affects the relationshipbetween large-firm employment and income inequality, we included a measureof the percentage of each state’s labor force that is black (black employment).We tested alternative measures, such as the percentage that is black andHispanic and the percentage that is nonwhite, and the results are similar tothose presented below. The Bureau of Labor Statistics (BLS), in its‘‘Geographic Profile of Employment and Unemployment,’’ presents collecteddata that break down each state’s labor force by race for 1970, 1980, 1990,and annually from 1999 onward. We linearly interpolated the BLS data for theintervening years and found that this measure and our EEO-based measurewere correlated at .98. The results are unaffected by the data source. Becauseresearch has shown that there are differences in workers’ skills and returns toworkers’ skills in urban versus non-urban settings (Bacolod, Blum, and Strange,2009), we controlled for the proportion of each state’s population that lives inurban areas (urban population). We linearly interpolated these data for the rele-vant years between 1970, 1980, 1990, 2000, and 2010.
It is possible that racial diversity and establishment dispersion are affectedby changes in the types of occupations large firms now employ. To account forthese shifts, we created variables to represent the average proportion of large-firm employment in a state in production, professional, and service occupa-tions. Following Lin (2016), we divided the total number of workers in eachoccupation by the total number of workers employed by large firms for eachstate in each year. Production employment includes technicians, craft workers,
7 Because there is no theoretical maximum for the number of establishments a firm can have, we
did not standardize our measure of establishment dispersion. For robustness, however, we
assumed a theoretical maximum equal to the largest number of establishments we observed in our
sample and standardized our measure of establishment diversity with this number. The results are
nearly identical to those presented below.
14 Administrative Science Quarterly XX (2016)
at UNIV OF PENNSYLVANIA on October 17, 2016asq.sagepub.comDownloaded from
operatives, laborers, and helpers. Professional employment includes managersand professionals. Service employment includes sales workers, administrativesupport workers, and service workers. Because the three measures are highlycorrelated with one another, we include only the large-firm service employmentmeasure in our analyses. We also analyzed production and professionalemployment in separate equations, and the results were similar to those pre-sented below.
To rule out the possibility that our measures of large-firm employment, racialdiversity, and establishment dispersion simply capture the propensity of work-ers to be employed in certain industries that vary in their pay practices, weincluded several state-level control variables related to industry employment.Because there are a limited number of within-state observations, we facedsome constraints regarding the number of industry employment variables thatwe could include in our analyses. To determine which measures to include, weregressed the percentage of employment in the agricultural, manufacturing,construction, mining, retail, FIRE (finance, insurance, and real estate), govern-ment, and temporary employment sectors along with year dummies on statelevels of income inequality and found that manufacturing and governmentemployment had a significant and negative relationship; retail had a significantand positive relationship; and agricultural, construction, mining, FIRE, and tem-porary employment had no relationship with income inequality. Based on theseresults, we included measures of government employment, manufacturingemployment, and retail employment.8
The relative skill of workers in a state, which some scholars have argued is adirect cause of rising income inequality (e.g., Autor, Levy, and Murnane, 2003),may also influence large-firm employment, diversity, and establishment disper-sion. Although we do not have data on the individual characteristics of employ-ees, a common proxy for workers’ skill is the level of workers’ education in apopulation (Alderson and Nielsen, 2002); thus we included a measure of thepercentage of individuals in the state who are college graduates (percentagecollege graduates). To account for the influence of globalization, we included ameasure of the logged real foreign direct investment. Rates of income inequal-ity as well as large-firm employment, diversity, and establishment dispersionmay also be influenced by rates of unionization, which have been found to benegatively related to income inequality (Western and Rosenfeld, 2011), so weincluded a control for union density. Additionally, we included a measure of thestate’s rate of unemployment to account for broader labor market conditionsthat may affect the relationship between large-firm employment and incomeinequality.
We also included measures to capture the impact of public policy on incomeinequality. A number of researchers have suggested that the political ideologyin a region has important implications for levels of income inequality (e.g.,Volscho and Kelly, 2012). To account for the extent of a state’s liberality, wetook an equally weighted average of the percentage of Democrats in eachstate’s House of Representatives and Senate for each year of study(Democrats in state legislature). To test the influence of a specific policydesigned to redistribute income more directly, we included a measure of the
8 As a robustness check, we also ran models including agricultural, construction, mining, FIRE, and
temporary employment, and the predicted findings are unaffected by their inclusion.
Cobb and Stevens 15
at UNIV OF PENNSYLVANIA on October 17, 2016asq.sagepub.comDownloaded from

state income tax rate. The rate is the maximum rate for an additional $1,000 ofincome on an initial $1,500,000 of wage income split evenly between a hus-band and wife filing a joint tax return, and it includes combined state and fed-eral income taxes.
Studies have also found minimum wage rates to be an important predictorof income inequality. To calculate the real minimum wage, we took the greatervalue between federal and state minimum wage rates.9 In cases in which theminimum wage changed in the middle of the year, we took a weighted averageof the minimum wage pre- and post-change. We then deflated this by the con-sumer price index (1982–1984 = 100). To capture the extent of redistributionpolicy at the state level, we included a measure of the real government trans-fers per capita. We included only total state-level receipts of retirement, incomemaintenance, and state and federal unemployment benefits rather than cash-in-kind benefits such as medical and food assistance. The results are similar ifwe use all benefits. We divided transfers by the population of the state andtook the natural log of this figure.
Aghion and colleagues (2015) recently used state-level panel data to inves-tigate the co-occurrence of rising rates of innovativeness and income inequal-ity. Although their study included several measures of income inequality,they found a positive and significant relationship between innovation and thetop 1-percent income share, specifically, and not the top 10-percent incomeshare or other measures that capture the entire distribution of incomes (e.g.,the Gini coefficient). Despite there being a significant relationship onlybetween innovation-led growth and top incomes in their study, we included acontrol for state-level innovation, as it may affect the relationship betweenlarge-firm employment and income inequality. Innovation is captured by thenumber of patents granted by the U.S. Patent and Trademark Office per1,000 people.
We also included year dummy codes in all of our analyses, which allowedus to attribute some of the variation in our data to unobserved events in agiven year, such as events that affected overall changes in income inequalityand the other covariates.10 The correlation matrix is presented in table 2. Wechecked for possible multicollinearity in our model by conducting a varianceinflation factor (VIF) test. The maximum VIF score obtained for our indepen-dent variables was 1.97 and the overall mean VIF was 2.72, both below thecommonly used threshold value of 10 (Kennedy, 2003), indicating that multi-collinearity was not a concern.
9 Some researchers have argued that, because federal minimum wage rates do not apply to all
workers, one should examine state minimum wage rates even if they are below the federal rate
(e.g., Volscho, 2005). But a significant percentage of workers are covered by federal wage laws,
and where workers are covered by both state and federal law, the higher rate applies. Because
there are 230 state-years in which the state had no minimum wage and 531 state-years in which
the state minimum was lower than the federal rate, using the state rather than the higher of the
federal or state rate may overstate the impact of state rates on income inequality.10 Because we expected that our key independent measures should have a contemporaneous
effect on individual income and thus income inequality at the state level, we did not include lagged
measures of our measures in our main analyses. For robustness, we ran analyses using lagged
measures of the covariates to predict state rates of income inequality. The results are similar to
those presented below and are available upon request.
16 Administrative Science Quarterly XX (2016)
at UNIV OF PENNSYLVANIA on October 17, 2016asq.sagepub.comDownloaded from

Analytic Approach
In this study, the unit of analysis is the state, and the unit of observation is thestate-year. Our dependent variable is income inequality, which we measuredusing the Gini coefficient. To examine the relationship between income inequal-ity and large-firm employment, racial diversity, and establishment dispersion,we used a fixed effects, pooled time-series regression analysis. This specifica-tion is achieved by subtracting the values of each observation from the statemean, removing all between-firm differences, and leaving only within-state var-iation to be explained by the covariates (Wooldridge, 2002). A fixed effectsframework helps rule out the possibility that states had stable unobserved fac-tors that influenced income inequality. Specifically, we estimated the effects ofthe covariates on the Gini coefficient as follows:
Yij = β0 + β1X1ij + β2X2ij + β3 X1ij ×X2ij
� �. . . + βpXpij +αj + εij
Table 2. Correlation Matrix
Variable 1 2 3 4 5 6 7 8 9 10 11
1. Gini coefficient
2. Large-firm employment (log) .12
3. Large-firm racial diversity .77 .34
4. Large-firm establishment dispersion –.30 –.27 –.17
5. Labor force (log) .15 .98 .34 –.23
6. GDP per capita (log) .77 .24 .83 –.19 .24
7. Black employment (%) .09 .45 .32 –.01 .40 .08
8. Urban population (%) .12 .54 .31 –.17 .54 .29 .03
9. Large-firm service employment (%) .56 –.04 .58 –.03 .03 .59 –.16 .34
10. Government employment (%) –.23 –.46 –.30 .22 –.41 –.46 .09 –.33 –.22
11. Manufacturing employment (%) –.49 .17 –.52 –.09 .10 –.55 .19 –.28 –.71 –.07
12. Retail employment (%) –.45 –.42 –.67 .19 –.37 –.63 –.24 –.27 –.26 .51 .18
13. College graduates (%) .56 .23 .58 –.18 .25 .79 –.03 .38 .49 –.44 –.44
14. Foreign direct investment (log) .30 .83 .50 –.16 .84 .46 .43 .47 .16 –.34 –.13
15. Union density (%) –.42 .15 –.44 –.07 .15 –.34 –.26 .25 –.25 –.21 .29
16. Unemployment (%) –.32 .10 –.33 .06 .10 –.49 .11 –.03 –.40 .22 .31
17. Democrats in state legislature (%) –.24 .15 –.13 .01 .13 –.30 .45 –.06 –.29 .14 .33
18. Tax rate (%) –.54 –.10 –.46 .09 –.12 –.59 –.07 –.07 –.40 .21 .35
19. Minimum wage –.50 –.07 –.46 .02 –.08 –.56 –.13 .04 –.38 .12 .35
20. Government transfers per capita (log) .46 .16 .42 –.12 .17 .52 –.02 .00 .31 –.44 –.14
21. Patents (per 000s) .33 .21 .37 –.20 .19 .57 –.13 .31 .24 –.51 –.21
Variable 12 13 14 15 16 17 18 19 20
13. College graduates (%) –.52
14. Foreign direct investment (log) –.42 .31
15. Union density (%) .10 –.15 –.01
16. Unemployment (%) .29 –.45 .07 .37
17. Democrats in state legislature (%) .06 –.22 .09 .09 .33
18. Tax rate (%) .16 –.38 –.31 .33 .26 .16
19. Minimum wage .14 –.28 –.28 .46 .23 .25 .68
20. Government transfers per capita (log) –.41 .37 .27 .15 .07 –.02 –.31 –.28
21. Patents (per 000s) –.51 .66 .25 .04 –.27 –.20 –.17 –.02 .31
Cobb and Stevens 17
at UNIV OF PENNSYLVANIA on October 17, 2016asq.sagepub.comDownloaded from
where all state-specific effects are accommodated by αj , the error term is cap-tured by εij , and within-state effects are explained by the covariates, repre-sented by the X ’s. Some scholars question the use of fixed effects in cross-national studies of income inequality, noting that much of the variance occursbetween countries (Alderson and Nielsen, 2002). Prior work, however, has sug-gested that these concerns are minimal when analyzing states (Frank, 2009).
RESULTS
The results of the fixed effects regressions are listed in table 3. Model 1 con-tains the results of the controls, and in model 2, we introduced our measure oflarge-firm employment. We included the main-effect measures of racial diver-sity and establishment dispersion in model 3. In models 4 and 5, we tested theinteractions between large-firm employment and racial diversity and large-firmemployment and establishment dispersion, respectively.
A number of control variables are significantly related to changes in stateincome inequality. The size of the labor force is positively related to incomeinequality, as is foreign direct investment. Conversely, the proportion of work-ers employed in manufacturing industries, the real minimum wage, and thepercentage of Democrats in the state legislature are negatively related toincome inequality. Furthermore, we also see a positive and significant relation-ship between the main effect of large-firm racial diversity and income inequal-ity. Though we did not hypothesize this main effect, the results wereunexpected, as they indicate that income inequality in a state increases as theracial diversity of large firms in a state increases. We discuss this finding in theDiscussion section.
For hypothesis 1, we predicted that large-firm employment would be nega-tively related to income inequality. The results indicate that income inequality islower when more workers in a state are employed by large firms, supportingthe first hypothesis. Based on the results in model 3, a 10-percent increase (ordecrease) in non-log transformed large-firm employment lowers (or raises) theGini value by .29 points (.51 percent). Though it appears to be somewhat small,the size of the effect of large-firm employment on income inequality is net ofcontrols and state and year fixed effects. Furthermore, Volscho (2005) foundthat a $ 0.81 increase in the real hourly minimum wage rate would decreasethe Gini coefficient by .10 points for the average state, suggesting that large-firm employment has a similar effect on state levels of income inequality as a$2.40 increase in the real minimum wage. In the supplemental analyses, wefurther discuss the magnitude of the hypothesized effects on changes inincome inequality.
Hypothesis 2 predicted that more racial diversity in large employers in astate would moderate the relationship between large-firm employment andincome inequality such that the effect becomes weaker. In support of hypoth-esis 2, the results in model 4 reveal a positive and significant relationshipbetween income inequality and the interaction of large-firm employment anddiversity. For hypothesis 3, we predicted that when large-firm employment ismore dispersed across establishments, the negative relationship betweenlarge-firm employment and income inequality would become weaker. The coef-ficient for the interaction term is significant and positive, which supportshypothesis 3.
18 Administrative Science Quarterly XX (2016)
at UNIV OF PENNSYLVANIA on October 17, 2016asq.sagepub.comDownloaded from

Table 3. Fixed Effects Regressions on State Income Inequality, 1978–2008*
Variable 1 2 3 4 5
Large-firm employment (log) – –2.886••• –3.034••• –2.644••• –3.121•••
(.474) (.496) (.504) (.495)
Large-firm racial diversity – – .105••• .124••• .110•••
(.025) (.026) (.025)
Large-firm employment × Large-firm racial diversity – – – .019••• –
(.005)
Large-firm establishment dispersion – – –.035 –.039 –.030
(.022) (.022) (.022)
Large-firm employment × Large-firm establishment dispersion – – – – .035••
(.011)
Labor force (log) .055 3.815••• 3.710••• 2.390• 3.936•••
(.786) (.992) (1.009) (1.063) (1.009)
GDP per capita (log) –2.434• –1.643 –1.610 –.947 –1.821
(.995) (.991) (.986) (.996) (.985)
Black employment (%) –.061 –.049 –.094 –.131• –.098
(.051) (.050) (.051) (.051) (.051)
Urban population (%) .012 .025 .005 .002 .000
(.035) (.034) (.034) (.034) (.034)
Large-firm service employment (%) .010 –.019 –.022 .006 –.022
(.014) (.015) (.015) (.017) (.015)
Government employment (%) .321••• .281••• .267•• .195• .281•••
(.086) (.085) (.084) (.086) (.084)
Manufacturing employment (%) –.163••• –.104••• –.119••• –.089•• –.123•••
(.025) (.026) (.027) (.028) (.027)
Retail employment (%) .033 .060 .093 .094 .096
(.049) (.049) (.049) (.049) (.049)
College graduates (%) –.114•• –.104• –.108• –.104• –.102•
(.043) (.043) (.043) (.042) (.042)
Foreign direct investment (log) .879••• 1.007••• .986••• .890••• .980•••
(.165) (.164) (.163) (.165) (.163)
Union density (%) –.010 .016 .017 .023 .010
(.028) (.028) (.028) (.028) (.028)
Unemployment (%) –.086 –.064 –.062 –.066 –.055
(.053) (.052) (.052) (.052) (.052)
Democrats in state legislature (%) –.039••• –.038••• –.040••• –.033••• –.042•••
(.007) (.007) (.007) (.007) (.007)
State income tax rate (%) –.050 –.086 –.069 –.079 –.067
(.075) (.074) (.074) (.074) (.074)
Minimum wage –.744• –.750• –1.007•• –1.040•• –.913••
(.320) (.316) (.323) (.322) (.324)
Government transfers per capita (log) 1.859 2.162• 2.084 3.027•• 1.778
(1.097) (1.084) (1.078) (1.101) (1.079)
Patents (per 000s) .166 –.113 –.060 .075 –.129
(.246) (.247) (.258) (.259) (.258)
Constant 49.763••• 51.030••• 52.181••• 53.140••• 52.014•••
(2.180) (2.163) (2.167) (2.171) (2.160)
R-squared .81 .86 .88 .89 .88
•p < .05; ••p < .01; •••p < .001.
* 1,488 observations in 48 states. Year dummies are included in all models. Standard errors are in parentheses.
Cobb and Stevens 19
at UNIV OF PENNSYLVANIA on October 17, 2016asq.sagepub.comDownloaded from
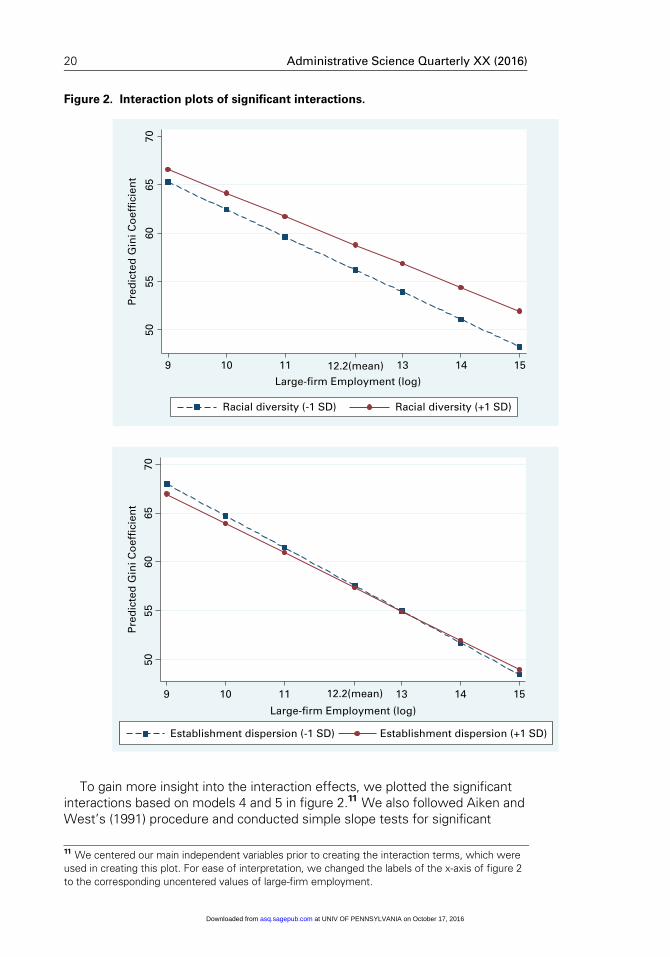
To gain more insight into the interaction effects, we plotted the significantinteractions based on models 4 and 5 in figure 2.11 We also followed Aiken andWest’s (1991) procedure and conducted simple slope tests for significant
Figure 2. Interaction plots of significant interactions.
5055
6065
70
Pre
dic
ted
Gin
i Co
effi
cien
t
9 10 11 12.2(mean) 13 14 15
Large-firm Employment (log)
Racial diversity (-1 SD) Racial diversity (+1 SD)
5055
6065
70
Pre
dic
ted
Gin
i Co
effi
cien
t
9 10 11 12.2(mean) 13 14 15
Large-firm Employment (log)
Establishment dispersion (-1 SD) Establishment dispersion (+1 SD)
11 We centered our main independent variables prior to creating the interaction terms, which were
used in creating this plot. For ease of interpretation, we changed the labels of the x-axis of figure 2
to the corresponding uncentered values of large-firm employment.
20 Administrative Science Quarterly XX (2016)
at UNIV OF PENNSYLVANIA on October 17, 2016asq.sagepub.comDownloaded from

interactive terms. We split the large-firm employment variable into twogroups—low (one standard deviation below the mean) and high (one standarddeviation above the mean)—and estimated the effect of racial diversity andestablishment dispersion for both levels. We found that racial diversity is nega-tively related to income inequality when large-firm employment is high (simpleslope b = .199, p < .05) but not when it is low (b = .104, p > .10), supportinghypothesis 2. Employment dispersion is not significantly related to incomeinequality when large-firm employment is high (b = –.006, p > .10) or low (b =–.008, p > .10). Given that figure 2 indicates the presence of a modest crossoverinteraction, this null result is not surprising (Keppell and Wickens, 2004), butbecause the results of model 5 do not fully conform to our theory and becausewe did not find a consistent effect of this interaction term in our supplementaryanalyses (see below), we do not find strong support for hypothesis 3.
To better illustrate the magnitude of our effects, as well as examine someof the state-level variation in income inequality and large-firm employment, weran a set of models using the ratio of the number of workers employed by largeemployers to the size of the overall nonfarm labor force as our measure oflarge-firm employment (see Davis and Cobb, 2010). This choice was motivatedby the fact that the log value of large-firm employment increased or held rela-tively constant in most states during the observation period. Yet in many ofthese states, the size of the labor force grew such that the proportion of work-ers employed by large firms declined. To illustrate our results, using the propor-tion of workers employed by large firms gives us more flexibility as it allows usto hold constant all the other covariates while manipulating a single, scaledmeasure of large-firm employment. The results of the analyses, shown in table4, reveal a negative and significant relationship between the ratio measure oflarge-firm employment and income inequality; however, this relationship isweaker when those large employers are more racially diverse.
Table 4. Fixed Effects Regressions Using the Ratio of Large-firm Employment to the Non-farm
Labor Force, 1978–2008*
Variable 6 7
Proportion of large-firm employment (%) –.271••• –.258•••
(.048) (.047)
Large-firm racial diversity .108••• .117•••
(.026) (.025)
Proportion of large-firm employment × Large-firm racial diversity .008• –
(.004)
Large-firm establishment dispersion –.037 –.044
(.022) (.023)
Proportion of large-firm employment × Large-firm establishment dispersion – –.002
(.002)
Constant 52.334••• 52.362•••
(2.179) (2.171)
R-squared .85 .86
•p < .05; ••p < .01; •••p < .001.
* 1,488 observations in 48 states. Year dummies are included. Standard errors are in parentheses.
Cobb and Stevens 21
at UNIV OF PENNSYLVANIA on October 17, 2016asq.sagepub.comDownloaded from
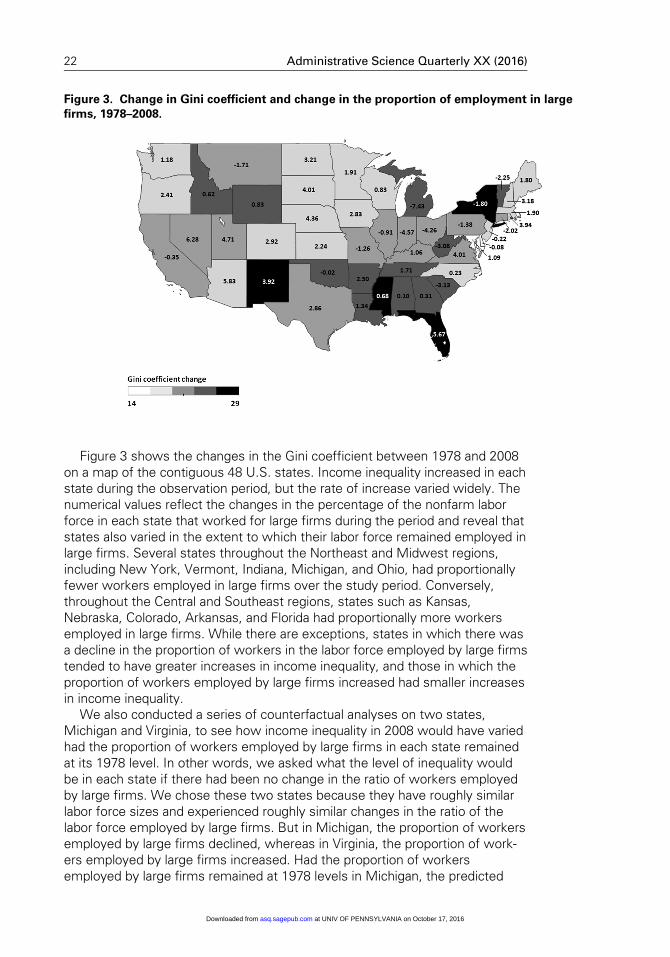
Figure 3 shows the changes in the Gini coefficient between 1978 and 2008on a map of the contiguous 48 U.S. states. Income inequality increased in eachstate during the observation period, but the rate of increase varied widely. Thenumerical values reflect the changes in the percentage of the nonfarm laborforce in each state that worked for large firms during the period and reveal thatstates also varied in the extent to which their labor force remained employed inlarge firms. Several states throughout the Northeast and Midwest regions,including New York, Vermont, Indiana, Michigan, and Ohio, had proportionallyfewer workers employed in large firms over the study period. Conversely,throughout the Central and Southeast regions, states such as Kansas,Nebraska, Colorado, Arkansas, and Florida had proportionally more workersemployed in large firms. While there are exceptions, states in which there wasa decline in the proportion of workers in the labor force employed by large firmstended to have greater increases in income inequality, and those in which theproportion of workers employed by large firms increased had smaller increasesin income inequality.
We also conducted a series of counterfactual analyses on two states,Michigan and Virginia, to see how income inequality in 2008 would have variedhad the proportion of workers employed by large firms in each state remainedat its 1978 level. In other words, we asked what the level of inequality wouldbe in each state if there had been no change in the ratio of workers employedby large firms. We chose these two states because they have roughly similarlabor force sizes and experienced roughly similar changes in the ratio of thelabor force employed by large firms. But in Michigan, the proportion of workersemployed by large firms declined, whereas in Virginia, the proportion of work-ers employed by large firms increased. Had the proportion of workersemployed by large firms remained at 1978 levels in Michigan, the predicted
Figure 3. Change in Gini coefficient and change in the proportion of employment in large
firms, 1978–2008.
22 Administrative Science Quarterly XX (2016)
at UNIV OF PENNSYLVANIA on October 17, 2016asq.sagepub.comDownloaded from

Gini coefficient would have been 2.27 points (3.4 percent) lower. In Virginia,the predicted Gini coefficient would have been 1.66 points (2.3 percent) higher.To put these counterfactual results in some perspective, using the results frommodel 6, the reduction in income inequality for Michigan associated with main-taining the same proportion of large-firm employment over the period would beequivalent to the effect of a hypothetical increase in the minimum wage in2008 from $7.28 to $11.70 per hour in that state.12 For Virginia, maintaining thesame proportion of large-firm employment over the period would be equivalentto the effect of a hypothetical decrease in the minimum wage in 2008 from$6.16 to $3.88 per hour in that state.13
Supplementary Analyses
We conducted various robustness checks and extensions of our baseline analy-sis. Unless noted, we included the full complement of control variables in themodels.
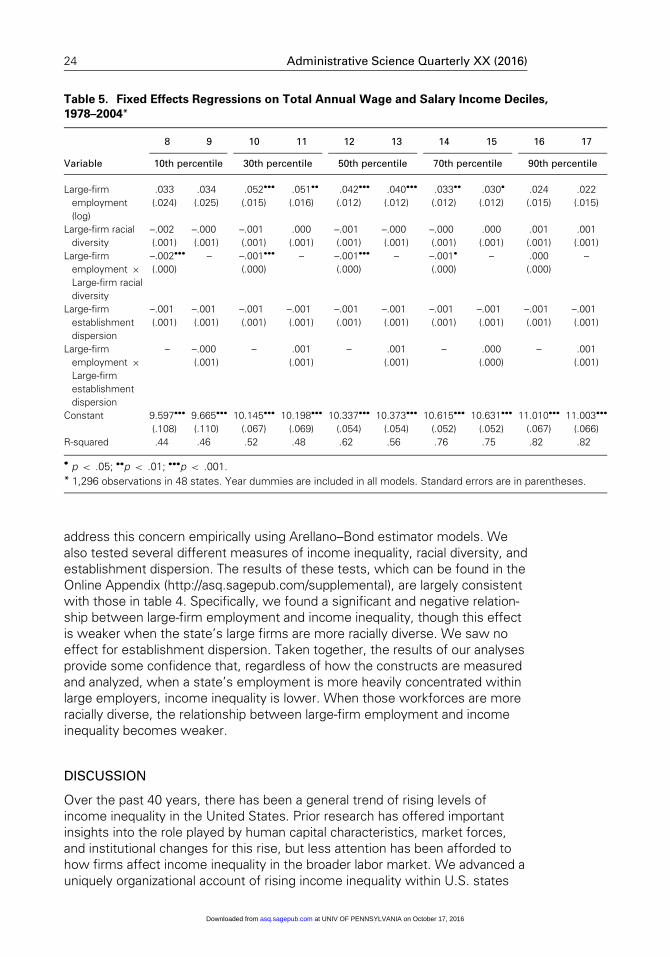
Distributional effects. Using aggregate measures of income inequality maymask where in the income distribution the covariates have the strongest effect,as the Gini coefficient can increase for different reasons, such as when topincomes increase and/or low incomes decrease. We predicted that large-firmemployment would affect income inequality by raising the wage floor forlower-skilled workers relative to higher-skilled ones; therefore, large-firmemployment should have a positive and significant effect on incomes at thelower end of the income distribution while having no effect, or possibly a nega-tive effect, on incomes at the higher end of the income distribution. To test thisassumption, we used data taken from http://www.inequality.org/ and ran fixedeffects regressions in which the dependent variable is the total annual wageand salary income at each decile. Table 5 presents the results of the analysesfor the 10th, 30th, 50th, 70th, and 90th deciles in models 8 through 17. Astable 5 indicates, large-firm employment has a positive and significant effect onincomes at the 30th, 50th, and 70th percentiles, but it has no effect onincomes at the 10th or 90th percentiles. Large-firm employment also has a pos-itive and significant effect on incomes at the 20th, 40th, and 60th percentilesbut no effect on incomes at the 80th percentile. These findings indicate thatlarge-firm employment increases incomes for individuals at the lower, middle,and upper-middle portions of the income distribution. These results suggestthat state levels of income inequality are lower, in part, because large-firmemployment raises wages for these individuals. This positive effect is alsonegatively moderated by the racial diversity of these large firms, which is con-sistent with hypothesis 2.
Additional analyses. In observational studies of this type, establishingcausality between the covariates and the dependent variable can be challen-ging, and we are aware of concerns about endogeneity affecting the associa-tions along with any inferences made about causality. We attempted to
12 The minimum wage rate in Michigan increased from $7.15/hr. to $7.40/hr. effective July 1, 2008.13 The minimum wage rate in Virginia increased from $5.85/hr. to $6.55/hr. effective July 24, 2008.
Cobb and Stevens 23
at UNIV OF PENNSYLVANIA on October 17, 2016asq.sagepub.comDownloaded from
address this concern empirically using Arellano–Bond estimator models. Wealso tested several different measures of income inequality, racial diversity, andestablishment dispersion. The results of these tests, which can be found in theOnline Appendix (http://asq.sagepub.com/supplemental), are largely consistentwith those in table 4. Specifically, we found a significant and negative relation-ship between large-firm employment and income inequality, though this effectis weaker when the state’s large firms are more racially diverse. We saw noeffect for establishment dispersion. Taken together, the results of our analysesprovide some confidence that, regardless of how the constructs are measuredand analyzed, when a state’s employment is more heavily concentrated withinlarge employers, income inequality is lower. When those workforces are moreracially diverse, the relationship between large-firm employment and incomeinequality becomes weaker.
DISCUSSION
Over the past 40 years, there has been a general trend of rising levels ofincome inequality in the United States. Prior research has offered importantinsights into the role played by human capital characteristics, market forces,and institutional changes for this rise, but less attention has been afforded tohow firms affect income inequality in the broader labor market. We advanced auniquely organizational account of rising income inequality within U.S. states
Table 5. Fixed Effects Regressions on Total Annual Wage and Salary Income Deciles,
1978–2004*
8 9 10 11 12 13 14 15 16 17
Variable 10th percentile 30th percentile 50th percentile 70th percentile 90th percentile
Large-firm
employment
(log)
.033 .034 .052••• .051•• .042••• .040••• .033•• .030• .024 .022
(.024) (.025) (.015) (.016) (.012) (.012) (.012) (.012) (.015) (.015)
Large-firm racial
diversity
–.002 –.000 –.001 .000 –.001 –.000 –.000 .000 .001 .001
(.001) (.001) (.001) (.001) (.001) (.001) (.001) (.001) (.001) (.001)
Large-firm
employment ×Large-firm racial
diversity
–.002••• – –.001••• – –.001••• – –.001• – .000 –
(.000) (.000) (.000) (.000) (.000)
Large-firm
establishment
dispersion
–.001 –.001 –.001 –.001 –.001 –.001 –.001 –.001 –.001 –.001
(.001) (.001) (.001) (.001) (.001) (.001) (.001) (.001) (.001) (.001)
Large-firm
employment ×Large-firm
establishment
dispersion
– –.000 – .001 – .001 – .000 – .001
(.001) (.001) (.001) (.000) (.001)
Constant 9.597••• 9.665••• 10.145••• 10.198••• 10.337••• 10.373••• 10.615••• 10.631••• 11.010••• 11.003•••
(.108) (.110) (.067) (.069) (.054) (.054) (.052) (.052) (.067) (.066)
R-squared .44 .46 .52 .48 .62 .56 .76 .75 .82 .82
•p < .05; ••p < .01; •••p < .001.
* 1,296 observations in 48 states. Year dummies are included in all models. Standard errors are in parentheses.
24 Administrative Science Quarterly XX (2016)
at UNIV OF PENNSYLVANIA on October 17, 2016asq.sagepub.comDownloaded from

over time by proposing that the propensity for workers in a state to beemployed by large firms is negatively related to income inequality at the statelevel. Drawing on research on social comparisons, we argued that large firmsare particularly susceptible to invidious social comparisons and try to help ame-liorate their damaging effects by compressing wages. Large firms pay someworkers, typically lower-wage workers, more than their market wage and otherworkers, typically higher-wage workers, less than the market wage. These stra-tegies affect the distribution of wages throughout the labor market. The resultssupport our argument, as large-firm employment has a significant and negativerelationship with income inequality.
We also argued that social comparison processes will operate less vigor-ously when large firms are more racially diverse, thus allowing these firms tocompress wages to a lesser extent. The results showed that the relationshipbetween employment in a state’s largest firms and income inequality becomesweaker when those large employers are also racially diverse. We are not pro-posing that racial diversity is problematic but are suggesting that, because ofsocial categorization, social comparison processes operate differently in more-diverse firms and that inequities between otherwise similar workers do notinvite the same kind of invidious social comparisons in those firms. While thereare many organizational and societal benefits to having a more diverse work-force, the results are consistent with the notion that when large firms are moreracially diverse, there is less pressure to compress wages, weakening theeffect of large-firm employment on state levels of income inequality.
Similarly, although we contended that social comparison processes willoperate less vigorously when employment in large firms is more dispersedacross establishments, we found little evidence to support our claims.Descriptive statistics revealed that there is little variance over time withinstates in levels of establishment dispersion, suggesting that employment inlarge firms is no more dispersed across establishments in 2008 than in 1978.Additionally, it is possible that large firms are prone to standardize wagesacross establishments.
Implications for Organizational Studies
Despite evidence suggesting that employers play a role in determining societalrates of income inequality, contemporary organizational scholarship has beenmostly silent about the phenomenon. Scholars have explored the conse-quences of wage dispersion at the intraorganizational level (see Shaw, 2014)without giving much attention to where inequality emerges. Furthermore, orga-nizational scholars have documented the practices used over the past fourdecades to reshape firm boundaries. Major organizational restructuring resultedfrom leveraged buy-outs, mergers and acquisitions, divestitures of unrelatedbusinesses, and the growth of contract and temporary work (Davis and Stout,1992; Cappelli and Keller, 2013; Feldman, 2014). Despite these radical changesto firm boundaries and organizational practices over the past 40 years, fewattempts have been made to link changes in corporate demography to broaderlabor market outcomes.
We see these oversights as part of a broader trend whereby the impact offirms on society is largely ignored in contemporary scholarship on organizations(Tilcsik and Marquis, 2013; Cobb, Wry, and Zhao, 2016). How organizations
Cobb and Stevens 25
at UNIV OF PENNSYLVANIA on October 17, 2016asq.sagepub.comDownloaded from

affect the general social welfare was a key focus of earlier scholars (e.g.,Whyte, 1956), and scholars taking the neostructuralist perspective of stratifica-tion have been keenly interested in the impact of hierarchies on inequality,arguing that firms, through their decisions about job allocation and wage set-ting, help determine levels of income stratification (Baron and Bielby, 1980).Empirical studies in this area, however, have documented the features of orga-nizations associated with inequality within the firm (e.g., Pfeffer and Langton,1988). In this study, we developed a simple theory that articulates a set oftransformational mechanisms (Hedstrom and Swedberg, 1998) through whichfirms’ strategy and structure lead to state levels of income inequality. In sodoing, we offer suggestive evidence that many of the changes to large corpo-rate employers documented in other studies (Osterman, 1996; Davis, 2009a;Cobb, 2015) have played a role in rising levels of income inequality in U.S.states.
Furthermore, by situating organizations squarely in the conversation onincome inequality in the broader labor market, our approach highlights thenuanced relationship between firms and their increasingly diverse workforces.The practical inevitability of a racially diverse workplace has directed the atten-tion of organizational scholars and practitioners alike toward understanding itschallenges and opportunities (see Williams and O’Reilly, 1998), resulting in aconsiderable body of literature demonstrating how internal workplace condi-tions affect ascriptive inequality within organizations (e.g., Kalev, Dobbin, andKelly, 2006). Although internal organizational processes and dynamics areclearly important for our understanding of inequality, there are obvious implica-tions beyond the boundaries of the firm. For example, Cohen and Huffman(Huffman and Cohen, 2004; Cohen and Huffman, 2007) have suggested thatblack–white income inequality is driven by the underrepresentation of blackemployees in managerial positions relative to their concentration in the locallabor market. Our research similarly moves beyond firm boundaries by explor-ing the interplay between corporate employment and the diversity of the work-force in affecting levels of income inequality in the broader labor market.
Implications for Income Inequality Research
Existing perspectives on the rise of income inequality focus primarily onmarket-based (e.g., skill-biased technological change, globalization) orinstitutional-based (e.g., unions, minimum wage) explanations (Morris andWestern, 1999: 642). Although each of these streams has provided valuableinsights into the drivers of income inequality, considerable variance remainsunexplained. New and complementary explanations have the potential to addto our understanding of the phenomenon. In this study, we advance a firm-centered perspective on income inequality, arguing that because employershelp determine labor market outcomes (Baron and Bielby, 1980) and becausemuch of the increase in income inequality is due to employers paying similarworkers differently (Groshen, 1991), corporate organizations are an overlookeddriver of income inequality at the state level.
We draw on recent literature on social comparisons and firm boundaries(e.g., Nickerson and Zenger, 2008), the firm-size wage effect (e.g., Hollister,2004), and organizational wage setting (e.g., Granovetter, 1981) to elaborate afirm-centered theory for how income inequality within a labor market is
26 Administrative Science Quarterly XX (2016)
at UNIV OF PENNSYLVANIA on October 17, 2016asq.sagepub.comDownloaded from
influenced by the characteristics of employers in that market. A few scholarshave been interested in how organizations affect income inequality and havefocused on the important role played by corporate demography. We comple-ment and extend the work of Davis and Cobb (2010) through data improve-ments and a clearer articulation of the theoretical mechanisms linking firmstructure to income inequality. We also build on the work of Sørensen andSorenson (2007) by focusing on the role of firm size rather than industrial diver-sity in influencing income inequality in a labor market.
Moreover, although the state is often treated as a single entity, a more rea-listic conceptualization is that of a highly differentiated and often looselycoupled political and economic entity operating across federal, state/region,and local geographies (Scott and Davis, 2007: 266). Previous studies havefound relationships between income inequality at the U.S. state level and vari-ous factors such as the percentage of blacks in the labor force (e.g., Jonish andKau, 1973), rates of immigration (e.g., Partridge, Rickman, and Levernier,1996), political party influence (e.g., Kelly and Witko, 2012), and different publicpolicies (e.g., Barrilleaux and Davis, 2003; Volscho, 2005). A related stream ofresearch has also found that discrimination and attainment vary across the U.S.because of the legal institutions present in the state or community (e.g.,Tilcsik, 2011). By documenting a relationship between employment in largefirms and income inequality at the state level, our research points to the impor-tance and value of examining within-country patterns of inequality, as well asthe variance of corporate demography across labor markets.
Limitations and Future Directions
One limitation of this study is that we cannot examine the wage-setting prac-tices of these large firms. U.S. matched employer–employee data on a scale ofthis size do not readily exist, making it necessary to rely on the demographicdimensions of organizational populations (Carroll and Hannan, 2000). Futurework can leverage matched employer–employee data available in many coun-tries, such as Germany and throughout Scandinavia, to add increased precisionto the mechanisms we propose here.
We also cannot capture social comparison dynamics directly and are insteadrelying on firm size as a proxy. We essentially argue that if existing theoryabout social comparison and firm size is correct, then the steps that firms taketo manage social comparison costs have implications for income inequality in alabor market. As we mentioned above, there may be a number of reasons whya firm might compress wages. Although the results of our moderators help pro-vide some confidence that social comparisons are an important factor motivat-ing firms to do so, we cannot rule out these alternative explanations.
The significant and positive main effect between the racial diversity of largefirms and income inequality is an interesting finding and one potentially worthyof additional inquiry. In particular, one might reasonably expect that the wagestandardization practices employed by large firms would have lowered overallincome inequality by closing the racial wage gap. During the observation period,large-firm employment in most states became significantly more diverse.Evidence indicates, however, that the average racial wage gap in the U.S.remained relatively constant or declined modestly during the observation period(Leicht, 2008; Lang and Lehmann, 2012). Moreover, prior research has found
Cobb and Stevens 27
at UNIV OF PENNSYLVANIA on October 17, 2016asq.sagepub.comDownloaded from

that blacks earn more in establishments with a greater proportion of whiteworkers (Carrington and Troske, 1998), casting some doubt on the idea thatthe increased racial diversity of large-firm employment should lower racialwage inequality. Future research can productively examine how changes in theracial diversity of organizations affect the distribution of income inside firms aswell as in the broader labor market.
We used establishment dispersion as a proxy for the physical and informa-tional distance between jobs, but future work may be able to find more precisemeasures, such as geographic distance, to examine whether the proximity ofworkers across establishments moderates the relationships we hypothesized.Other potential moderators between large-firm employment and incomeinequality exist, such as unionization and corporate governance structures,which may be of interest to future researchers as well.
Our theory also builds on the idea that, in large firms, lower-skilled workersreceive a wage premium, whereas higher-skilled workers receive wages closerto or even below the going market wage. Yet we do not believe that thesesame dynamics apply well to wage setting closer to the apex of the organiza-tion, in executive compensation. In recent years, a number of studies havefound that when setting executive pay, corporate boards reference the pay ofexecutives of similar firms and/or a set of ‘‘aspirational’’ firms that are typicallylarger and where executives get paid more (DiPrete, Eirich, and Pittinsky, 2010;Kim, Kogut, and Yang, 2015). Arguably, social comparisons still play a role insetting executive compensation, but it is a comparison across firms rather thanwithin them. Given this, and as our supplementary analyses reveal, our theoryis less applicable to measures that rely heavily on top incomes (e.g., the top 1percent) and are more useful in explorations of income inequality at lowerincome ranges (e.g., the Gini coefficient).
Finally, it is also important to recognize that the mechanisms we addresshere are potentially unique to a given time and place and may not hold in othercontexts. Over the past several decades, the U.S. economy has undergone asignificant transition during which measures of firm size such as revenues,assets, and employment have become increasingly disaggregated (Davis,2009b). The largest employers are now concentrated more heavily in retail,whereas in the earlier half of our study period many large firms were still inindustrial sectors (Davis and Cobb, 2010). Evidence also indicates a weakeningof the firm-size wage effect (Hollister, 2004; Cobb, Lin, and Gabriel, 2016) andan increase in the use of pay-for-performance schemes to remunerate higher-skilled workers (Lemieux, MacLeod, and Parent, 2009), which would put theirpay closer to market rates. Thus the connections we suggest here may havebeen stronger in earlier periods and may weaken or reverse as the economycontinues to evolve and large firms use wage compression less frequently.
Large-firm employment and racial diversity are not the only factors affectinga state’s level of income inequality. Nevertheless, the data presented here sug-gest an important role for organizational theory in linking market and institu-tional change to societal change by considering how firms react to externaldemands. Firms play a central role in how workers are matched to jobs andhow they are rewarded for their labor. That these practices have importantimplications for how income is distributed in a region suggests that more atten-tion be given to understanding how changes in corporate organization affectlabor market outcomes.
28 Administrative Science Quarterly XX (2016)
at UNIV OF PENNSYLVANIA on October 17, 2016asq.sagepub.comDownloaded from

Acknowledgments
We thank Forrest Briscoe and three anonymous reviewers for their helpful guidance onthis paper. We also thank Peter Cappelli, Jerry Davis, Stanislav Dobrev, J. P. Ferguson,Mauro Guillen, Katherine Klein, Ken-Hou Lin, Mae McDonnell, Todd Zenger, and partici-pants at the Academy of Management Conference, European Group for OrganizationalStudies Conference, Wharton People and Organizations Conference, and the WhartonOrganizational Theory workshop for thoughtful comments on earlier versions of thepaper. We would also like to thank Matthew Bidwell, Zeke Hernandez, and JR Keller fortheir invaluable feedback on multiple versions of the manuscript.
REFERENCES
Adams, J. S.1963 ‘‘Toward an understanding of inequity.’’ Journal of Abnormal Psychology, 67:422–436.
Aghion, P., U. Akcigit, A. Bergeaud, R. Blundell, and D. Hemous2015 ‘‘Innovation and top income inequality.’’ NBER Working Paper No. 21247: 1–57.
Aiken, L. S., and S. G. West1991 Multiple Regression: Testing and Interpreting Interactions. Thousand Oaks, CA:Sage.
Akerlof, G. A., and J. L. Yellen1988 ‘‘Fairness and unemployment.’’ American Economic Review, 78: 44–49.
Alderfer, C. P.1977 ‘‘Group and intergroup relations.’’ In J. R. Hackman and J. L. Suttle (eds.),Improving Life at Work: 227–296. Santa Monica, CA: Goodyear.
Alderson, A. S., and F. Nielsen2002 ‘‘Globalization and the great U-turn: Income inequality trends in 16 OECD coun-tries.’’ American Journal of Sociology, 107: 1244–1299.
Atkinson, A. B., T. Piketty, and E. Saez2011 ‘‘Top incomes in the long run of history.’’ Journal of Economic Literature, 49:3–71.
Autor, D. H., L. F. Katz, and M. S. Kearney2008 ‘‘Trends in US wage inequality: Revising the revisionists.’’ Review of Econom-ics and Statistics, 90: 300–323.
Autor, D. H., F. Levy, and R. J. Murnane2003 ‘‘The skill content of recent technological change: An empirical exploration.’’Quarterly Journal of Economics, 118: 1279–1333.
Avent-Holt, D., and D. Tomaskovic-Devey2014 ‘‘A relational theory of earnings inequality.’’ American Behavioral Scientist, 58:379–399.
Bacolod, M., B. S. Blum, and W. C. Strange2009 ‘‘Skills in the city.’’ Journal of Urban Economics, 65: 136–153.
Baker, G. P., M. C. Jensen, and K. J. Murphy1988 ‘‘Compensation and incentives: Practice vs. theory.’’ Journal of Finance, 43:593–616.
Bandiera, O., I. Barankay, and I. Rasul2007 ‘‘Incentives for managers and inequality among workers: Evidence from a firm-level experiment.’’ Quarterly Journal of Economics, 122: 729–773.
Baron, J. N.1984 ‘‘Organizational perspectives on stratification.’’ Annual Review of Sociology, 10:37–69.
Baron, J. N., and W. T. Bielby1980 ‘‘Bringing the firms back in: Stratification, segmentation, and the organization ofwork.’’ American Sociological Review, 45: 737–765.
Cobb and Stevens 29
at UNIV OF PENNSYLVANIA on October 17, 2016asq.sagepub.comDownloaded from

Barrilleaux, C., and B. C. Davis2003 ‘‘Explaining state-level variations in levels and change in the distribution ofincome in the United States, 1978–1990.’’ American Politics Research, 31: 280–300.
Bartling, B., and F. A. von Siemens2010 ‘‘The intensity of incentives in firms and markets: Moral hazard with envious
agents.’’ Labour Economics, 17: 598–607.Batt, R.
2001 ‘‘Explaining wage inequality in telecommunications services: Customer seg-
mentation, human resource practices, and union decline.’’ Industrial and Labor Rela-
tions Review, 54: 425–449.Becker, G. S.
1964 Human Capital: A Theoretical and Empirical Analysis, with Special Reference to
Education. New York: National Bureau of Economic Research.Beer, M., B. Spector, and P. R. Lawrence
1984 Managing Human Assets. New York: Free Press.Bentele, K. G., and L. Kenworthy
2013 ‘‘Globalization and earnings inequality in the United States.’’ In R. Rycroft (ed.),
The Economics of Inequality, Poverty and Discrimination in the 21st Century: 343–
358. Santa Barbara, CA: Praeger.Bidwell, M. J.
2013 ‘‘What happened to long-term employment? The role of worker power and
environmental turbulence in explaining declines in worker tenure.’’ Organization Sci-
ence, 24: 1061–1082.Bidwell, M. J., F. Briscoe, I. Fernandez-Mateo, and A. Sterling
2013 ‘‘The employment relationship and inequality: How and why changes in employ-ment practices are reshaping rewards in organizations.’’ Academy of Management
Annals, 7: 61–121.Blanton, H., J. Crocker, and D. T. Miller
2000 ‘‘The effects of in-group versus out-group social comparison on self-esteem inthe context of a negative stereotype.’’ Journal of Experimental Social Psychology, 36:
519–530.Boxall, P., and J. Purcell
2011 Strategy and Human Resource Management, 3rd ed. New York: PalgraveMacmillan.
Brown, C., and J. Medoff1989 ‘‘The employer size wage effect.’’ Journal of Political Economy, 97: 1027–1059.
Cappelli, P. H.1999 The New Deal at Work: Managing the Market-driven Workforce. Boston:Harvard University Press.
Cappelli, P. H.2001 ‘‘Assessing the decline of internal labor markets.’’ In I. Berg and A. L. Kalleberg
(eds.), Sourcebook of Labor Markets: Evolving Structures and Processes: 207–245.New York: Kluwer Academic/Plenum.
Cappelli, P. H., and K. W. Chauvin1991 ‘‘An interplant test of the efficiency wage hypothesis.’’ Quarterly Journal of
Economics, 106: 769–787.Cappelli, P. H., and J. Keller
2013 ‘‘A study of the extent and potential causes of alternative employment arrange-
ments.’’ ILR Review, 66: 874–901.Carnahan, S., R. Agarwal, and B. A. Campbell
2012 ‘‘Heterogeneity in turnover: The effect of relative compensation dispersion offirms on the mobility and entrepreneurship of extreme performers.’’ Strategic
Management Journal, 33: 1411–1430.
30 Administrative Science Quarterly XX (2016)
at UNIV OF PENNSYLVANIA on October 17, 2016asq.sagepub.comDownloaded from

Carrington, W. J., and K. R. Troske1998 ‘‘Interfirm segregation and the black/white wage gap.’’ Journal of Labor
Economics, 16: 231–260.Carroll, G. R., and M. T. Hannan
2000 The Demography of Corporations and Industries. Princeton, NJ: Princeton
University Press.Cobb, J. A.
2015 ‘‘Risky business: Firms’ shifting of retirement risk and the decline of defined
benefit pension plans.’’ Organization Science, 26: 1332–1350.Cobb, J. A.
2016 ‘‘How firms shape income inequality: Stakeholder power, executive decision-making, and the structuring of employment relationships.’’ Academy of Management
Review, 41: 324–348.Cobb, J. A., K.-H. Lin, and P. Gabriel
2016 ‘‘Growing apart: The changing firm-size wage effect and its inequality conse-
quences.’’ Available at SSRN: http://ssrn.com/abstract=2785868.Cobb, J. A., T. Wry, and E. Y. Zhao
2016 ‘‘Funding financial inclusion: Institutional logics and the contextual contingencyof funding for microfinance organizations.’’ Academy of Management Journal, pub-
lished online ahead of print May 6. DOI: 10.5465.amj.2015.0715.Cohen, P. N., and M. L. Huffman
2007 ‘‘Black under-representation in management across US labor markets.’’ Annals
of the American Academy of Political and Social Science, 609: 181–199.Cohn, A., E. Fehr, B. Herrmann, and E. Schneider
2014 ‘‘Social comparison and effort provision: Evidence from a field experiment.’’
Journal of the European Economic Association, 12: 877–898.Davis, G. F.
2009a Managed by the Markets: How Finance Re-Shaped America. New York:Oxford University Press.
Davis, G. F.2009b ‘‘The rise and fall of finance and the end of the society of organizations.’’ Acad-emy of Management Perspectives, 23 (3): 27–44.
Davis, G. F., and J. A. Cobb2010 ‘‘Corporations and economic inequality around the world: The paradox of hierar-chy.’’ In A. P. Brief and B. M. Staw (eds.), Research in Organizational Behavior, 30:
35–53. New York: Elsevier/JAI.Davis, G. F., and S. K. Stout
1992 ‘‘Organization theory and the market for corporate control: A dynamic analysisof the characteristics of large takeover targets, 1980–1990.’’ Administrative Science
Quarterly, 37: 305–633.DiPrete, T. A., G. M. Eirich, and M. Pittinsky
2010 ‘‘Compensation benchmarking, leapfrogs, and the surge in executive pay.’’
American Journal of Sociology, 115: 1671–1712.Doeringer, P., and M. J. Piore
1971 Internal Labor Markets and Manpower Analysis. Lexington, MA: D.C. Heath.Dube, A., and E. Kaplan
2010 ‘‘Does outsourcing reduce wages in the low-wage service occupations? Evi-dence from janitors and guards.’’ Industrial and Labor Relations Review, 63: 287–306.
Feldman, E. R.2014 ‘‘Legacy divestitures: Motives and implications.’’ Organization Science, 25:815–832.
Festinger, L.1954 ‘‘A theory of social comparison processes.’’ Human Relations, 7: 117–140.
Cobb and Stevens 31
at UNIV OF PENNSYLVANIA on October 17, 2016asq.sagepub.comDownloaded from

Festinger, L., S. Schachter, and K. W. Back1950 Social Pressures in Informal Groups: A Study of Human Factors in Housing.New York: Harper.
Frank, M. W.2009 ‘‘Inequality and growth in the United States: Evidence from a new state-level
panel of income inequality measures.’’ Economic Inquiry, 47: 55–68.Galbraith, J. K., and J. T. Hale
2008 ‘‘State income inequality and presidential election turnout and outcomes.’’
Social Science Quarterly, 89: 887–901.Garen, J. E.
1985 ‘‘Worker heterogeneity, job screening, and firm size.’’ Journal of Political Econ-omy, 93: 715–739.
Gibson, D. E., and B. S. Lawrence2010 ‘‘Women’s and men’s career referents: How gender composition and compari-
son level shape career expectations.’’ Organization Science, 21: 1159–1175.Gino, F., and L. Pierce
2010 ‘‘Lying to level the playing field: Why people may dishonestly help or hurt
others to create equity.’’ Journal of Business Ethics, 95: 89–103.Goodman, P. S.
1977 ‘‘Social comparison processes in organizations.’’ In B. M. Staw and G. R.Salancik (eds.), New Directions in Organizational Behavior: 97–132. Chicago: St. Clair
Press.Granovetter, M.
1981 ‘‘Toward a sociological theory of income differences.’’ In I. Berg (ed.), Sociologi-
cal Perspectives on Labor Markets: 11–47. New York: Academic Press.Groshen, E. L.
1991 ‘‘Sources of intraindustry wage dispersion: How much do employers matter?’’
Quarterly Journal of Economics, 106: 869–884.Groshen, E. L., and D. I. Levine
1998 ‘‘The rise and decline (?) of U.S. internal labor markets.’’ Federal Reserve Boardof New York Research Paper 9819: 1–51.
Harris, M. M., F. Anseel, and F. Lievens2008 ‘‘Keeping up with the Joneses: A field study of the relationships among
upward, lateral, and downward comparisons and pay level satisfaction.’’ Journal ofApplied Psychology, 93: 665–673.
Harrison, D. A., and K. J. Klein2007 ‘‘What’s the difference? Diversity constructs as separation, variety, or disparity
in organizations.’’ Academy of Management Review, 32: 1199–1228.Hedstrom, P., and R. Swedberg
1998 ‘‘Social mechanisms: An introductory essay.’’ In P. Hedstrom and R. Swedberg
(eds.), Social Mechanisms: An Analytical Approach to Social Theory: 1–31. Cam-
bridge: Cambridge University Press.Hirsch, B. T., and D. A. Macpherson
2003 ‘‘Union membership and coverage database from the current population survey:
Note.’’ Industrial and Labor Relations Review, 56: 349–354.Hirsh, C. E., and S. Kornrich
2008 ‘‘The context of discrimination: Workplace conditions, institutional environ-ments, and sex and race discrimination charges.’’ American Journal of Sociology,
113: 1394–1432.Hollister, M. N.
2004 ‘‘Does firm size matter anymore? The new economy and firm size wageeffects.’’ American Sociological Review, 69: 659–676.
32 Administrative Science Quarterly XX (2016)
at UNIV OF PENNSYLVANIA on October 17, 2016asq.sagepub.comDownloaded from
Huffman, M. L., and P. N. Cohen2004 ‘‘Racial wage inequality: Job segregation and devaluation across US labor mar-kets.’’ American Journal of Sociology, 109: 902–936.
Jensen, M. C.1993 ‘‘The modern industrial revolution, exit, and the failure of internal control sys-
tems.’’ Journal of Finance, 48: 831–880.Jonish, J. E., and J. B. Kau
1973 ‘‘State differentials in income inequality.’’ Review of Social Economy, 31:
179–190.Kalev, A., F. R. Dobbin, and E. Kelly
2006 ‘‘Best practices or best guesses? Assessing the efficacy of corporate affirma-tive action and diversity policies.’’ American Sociological Review, 71: 589–617.
Kalleberg, A. L., and M. E. Van Buren1994 ‘‘The structure of organizational earnings inequality.’’ American Behavioral
Scientist, 37: 930–947.Kalleberg, A. L., and M. E. Van Buren
1996 ‘‘Is bigger better? Explaining the relationship between organization size and job
rewards.’’ American Sociological Review, 61: 47–66.Kelly, N. J., and C. Witko
2012 ‘‘Federalism and American inequality.’’ Journal of Politics, 74: 414–426.Kennedy, P.
2003 A Guide to Econometrics, 5th ed. Cambridge, MA: MIT Press.Kenworthy, L., and J. Pontusson
2005 ‘‘Rising inequality and the politics of redistribution in affluent countries.’’
Perspectives on Politics, 3: 449–471.Keppell, G., and T. D. Wickens
2004 Design and Analysis: A Researcher’s Handbook, 4th ed. Upper Saddle River,NJ: Prentice Hall.
Kim, J., B. Kogut, and J.-S. Yang2015 ‘‘Executive compensation, fat cats and best athletes.’’ American Sociological
Review, 80: 299–328.Klarner, C.
2014 ‘‘Klarner politics.’’ Indiana State University Center for Governmental Services.Kulik, C. T., and M. L. Ambrose
1992 ‘‘Personal and situational determinants of referent choice.’’ Academy of Man-
agement Review, 17: 212–237.Lai, R., A. D’Amour, A. Yu, Y. Sun, and L. Fleming
2015 ‘‘Disambiguation and co-authorship networks of the U.S. patent inventor data-
base (1975–2010).’’ Harvard Dataverse.Lang, K., and J.-Y. K. Lehmann
2012 ‘‘Racial discrimination in the labor market: Theory and empirics.’’ Journal ofEconomic Literature, 50: 959–1006.
Lansberg, I.1989 ‘‘Social categorization, entitlement, and justice in organizations: Contextual
determinants and cognitive underpinnings.’’ Human Relations, 41: 871–899.Larkin, I., L. Pierce, and F. Gino
2012 ‘‘The psychological costs of pay-for-performance: Implications for the strategic
compensation of employees.’’ Strategic Management Journal, 33: 1194–1214.Lawrence, B. S.
2006 ‘‘Organizational reference groups: A missing perspective on social context.’’Organization Science, 17: 80–100.
Lazear, E. P.1989 ‘‘Pay equality and industrial politics.’’ Journal of Political Economy, 97: 561–580.
Cobb and Stevens 33
at UNIV OF PENNSYLVANIA on October 17, 2016asq.sagepub.comDownloaded from

Leicht, K. T.2008 ‘‘Broken down by race and gender? Sociological explanations of new sourcesof earnings inequality.’’ Annual Review of Sociology, 34: 237–255.
Lemieux, T., W. B. MacLeod, and D. Parent2009 ‘‘Performance pay and wage inequality.’’ Quarterly Journal of Economics, 124:
1–49.Lepak, D. P., and S. A. Snell
1999 ‘‘The human resource architecture: Toward a theory of human capital allocation
and development.’’ Academy of Management Journal, 24: 31–48.Lichtenstein, N.
2002 State of the Union: A Century of American Labor. Princeton, NJ: PrincetonUniversity Press.
Lin, K.-H.2016 ‘‘The rise of finance and firm employment dynamics.’’ Organization Science,
27: 972–988.Lin, K.-H., and D. Tomaskovic-Devey
2013 ‘‘Financialization and US income inequality, 1970–2008.’’ American Journal of
Sociology, 118: 1284–1329.Markovsky, B.
1985 ‘‘Toward a multilevel distributive justice theory.’’ American Sociological Review,50: 822–839.
Martin, J.1981 ‘‘Relative deprivation: A theory of distributive injustice for an era of shrinking
resources.’’ In L. L. Cummings and B. M. Staw (eds.), Research in Organizational
Behavior, 3: 53–107. Greenwich, CT: JAI Press.McCall, L., and C. Percheski
2010 ‘‘Income inequality: New trends and research directions.’’ Annual Review of
Sociology, 36: 329–347.Mellow, W.
1982 ‘‘Employer size and wages.’’ Review of Economics and Statistics, 64: 495–501.Milgrom, P. R., and J. Roberts
1988 ‘‘An economic approach to influence activities in organizations.’’ American Jour-
nal of Sociology, 94: S154-S179.Molloy, R., C. L. Smith, and A. Wozniak
2013 ‘‘Declining migration within the US: The role of the labor market.’’ In FederalReserve Board (ed.), Finance and Economics Discussion Series: 1–49. Washington,
DC: Federal Reserve Board.Morris, M., and B. Western
1999 ‘‘Inequality in earnings at the close of the twentieth century.’’ Annual Review ofSociology, 25: 623–657.
Mouw, T., and A. L. Kalleberg2010 ‘‘Occupations and the structure of wage inequality in the United States, 1980s
to 2000s.’’ American Sociological Review, 75: 402–431.Nickerson, J. A., and T. R. Zenger
2008 ‘‘Envy, comparison costs, and the economic theory of the firm.’’ Strategic
Management Journal, 29: 1429–1449.Obloj, T., and T. R. Zenger
2015 ‘‘Incentives, social comparison costs, and the proximity of envy’s object.’’ HECParis Research Paper No. SPE-2015-1085. Available at SSRN: http://ssrn.com/
abstract=2574248.Oi, W. Y., and T. L. Idson
1999 ‘‘Firm size and wages.’’ In O. Ashenfelter and D. Card (eds.), Handbook ofLabor Economics: 2165–2214. Amsterdam: Elsevier Science B.V.
34 Administrative Science Quarterly XX (2016)
at UNIV OF PENNSYLVANIA on October 17, 2016asq.sagepub.comDownloaded from
O’Shaughnessy, K. C., D. I. Levine, and P. H. Cappelli2001 ‘‘Changes in managerial pay structures 1986–1992 and rising returns to skill.’’Oxford Economic Papers, 3: 482–507.
Osterman, P. S.1996 Broken Ladders: Managerial Careers in the New Economy. New York: Oxford
University Press.Partridge, M. D., D. S. Rickman, and W. Levernier
1996 ‘‘Trends in US income inequality: Evidence from a panel of states.’’ Quarterly
Review of Economics and Finance, 36: 17–37.Pfeffer, J., and A. Davis-Blake
1990 ‘‘Determinants of salary dispersion in organizations.’’ Industrial Relations, 29:38–57.
Pfeffer, J., and A. Davis-Blake1992 ‘‘Salary dispersion, location in the salary distribution, and turnover among col-
lege administrators.’’ Industrial and Labor Relations Review, 45: 753–763.Pfeffer, J., and N. Langton
1988 ‘‘Wage inequality and the organization of work: The case of academic depart-
ments.’’ Administrative Science Quarterly, 33: 588–606.Rawley, E., and T. S. Simcoe
2010 ‘‘Diversification, diseconomies of scope, and vertical contracting: Evidence fromthe taxicab industry.’’ Management Science, 56: 1534–1550.
Robinson, C. L., D. Tomaskovic-Devey, C. Zimmer, and M. W. Irvin, Jr.2005 ‘‘Studying race or ethnic and sex segregation at the establishment level: Metho-
dological issues and substantive opportunities using EEO-1 reports.’’ Work and Occu-
pations, 32: 5–38.Rothschild-Whitt, J.
1979 ‘‘Collectivist organization: An alternative to rational-bureaucratic models.’’
American Sociological Review, 44: 509–527.Sanchez, J. I., and E. L. Levine
2012 ‘‘The rise and fall of job analysis and the future of work analysis.’’ AnnualReview of Psychology, 63: 397–425.
Scott, W. R., and G. F. Davis2007 Organizations and Organizing: Rational, Natural, and Open Systems Perspec-
tives. Upper Saddle River, NJ: Prentice Hall.Shaw, J. D.
2014 ‘‘Pay dispersion.’’ Annual Review of Organizational Psychology and Organiza-
tional Behavior, 1: 521–544.Song, J., D. J. Price, F. Guvenen, and N. Bloom
2015 ‘‘Firming up inequality.’’ Working Paper 21199. Cambridge, MA: NationalBureau of Economic Research.
Sørensen, J. B.2007 ‘‘Organizational diversity, labor markets, and wage inequality.’’ American Beha-
vioral Scientist, 50: 659–676.Sørensen, J. B., and O. Sorenson
2007 ‘‘Corporate demography and income inequality.’’ American Sociological Review,
72: 766–783.Sorenson, O.
2003 ‘‘Social networks and industrial geography.’’ Journal of Evolutionary Economics,13: 513–527.
Tajfel, H.1978 Differentiation between Social Groups: Studies in the Social Psychology of
Intergroup Relations. New York: Academic Press.
Cobb and Stevens 35
at UNIV OF PENNSYLVANIA on October 17, 2016asq.sagepub.comDownloaded from

Tilcsik, A.2011 ‘‘Pride and prejudice: Employment discrimination against openly gay men in theUnited States.’’ American Journal of Sociology, 117: 586–626.
Tilcsik, A., and C. Marquis2013 ‘‘Punctuated generosity: How mega-events and natural disasters affect
corporate philanthropy in U.S. communities.’’ Administrative Science Quarterly, 58:111–148.
Useem, M.1996 ‘‘Corporate education and training.’’ In C. Kaysen (ed.), The American Corpora-
tion Today: 292–326. New York: Oxford University Press.Volscho, T. W.
2005 ‘‘Minimum wages and income inequality in the American states, 1960–2000.’’
In D. J. Ketchen, Jr. and D. D. Bergh (eds.), Research in Social Stratification and
Mobility, 23: 343–368. New York: Elsevier.Volscho, T. W., and N. J. Kelly
2012 ‘‘The rise of the super-rich: Power resources, taxes, financial markets, and the
dynamics of the top 1 percent, 1949 to 2008.’’ American Sociological Review, 77:
679–699.Weinstein, N. D.
1980 ‘‘Unrealistic optimism about future life events.’’ Journal of Personality and
Social Psychology, 39: 806–820.Western, B., and J. Rosenfeld
2011 ‘‘Unions, norms, and the rise in U.S. wage inequality.’’ American SociologicalReview, 76: 513–537.
Whyte, W. H.1956 The Organization Man. New York: Simon & Schuster.
Williams, K. Y., and C. A. O’Reilly1998 ‘‘Demography and diversity in organizations: A review of 40 years of research.’’
In B. M. Staw and L. L. Cummings (eds.), Research in Organizational Behavior, 20:77–140. Greenwich, CT: JAI Press.
Williamson, O. E.1985 The Economic Institutions of Capitalism. New York: Free Press.
Wiseman, R. M.2009 ‘‘On the use and misuse of ratios in strategic management research.’’ In D. D.Bergh and D. J. Ketchen (eds.), Research Methodology in Strategy and Management,
5: 75–110. Bingley, UK: Emerald Group.Wood, B.
1994 ‘‘From social inequality to personal entitlement: The role of social comparisons,legitimacy appraisals, and group membership.’’ Advances in Experimental Social Psy-
chology, 26: 293–355.Wooldridge, J. M.
2002 Econometric Analysis of Cross Section and Panel Data. Cambridge, MA: MITPress.
Zenger, T. R.1992 ‘‘Why do employers only reward extreme performance? Examining the relation-
ships among performance, pay, and turnover.’’ Administrative Science Quarterly, 37:198–219.
Zenger, T. R., and J. X. Huang2009 ‘‘Limits to the scale and scope of the firm.’’ In B. S. Silverman (ed.), Advances
in Strategic Management, 26: 267–286. Bingley, UK: Emerald Group.
36 Administrative Science Quarterly XX (2016)
at UNIV OF PENNSYLVANIA on October 17, 2016asq.sagepub.comDownloaded from

Authors’ Biographies
J. Adam Cobb is an assistant professor in the Management Department at TheWharton School, University of Pennsylvania, Philadelphia, PA 19128 (e-mail:[email protected]). His research examines the historical development andreconfiguration of employment relations and their implications. He received his Ph.D. inManagement and Organizations from the University of Michigan’s Ross School ofBusiness.
Flannery G. Stevens is an assistant professor in the Department of Management at theDavid Eccles School of Business, University of Utah, Salt Lake City, UT 84112 (e-mail:[email protected]). Her research falls at the intersection of organiza-tions and inequality, across several levels of analysis. She received her Ph.D. inManagement and Organizations from the University of Michigan’s Ross School ofBusiness.
Cobb and Stevens 37
at UNIV OF PENNSYLVANIA on October 17, 2016asq.sagepub.comDownloaded from