administrative records modeling update for the census ... 2.3 lays out the integration of...
TRANSCRIPT

1
Administrative Records Modeling Update for the Census Scientific Advisory Committee
Spring 2017, February 24, 2017
Administrative Records Modeling Team
1. Introduction
The goal of the 2020 Census is to count each person only once and in the correct location. This is
to be achieved at a lower cost per household (adjusted for inflation) than the 2010 Census while
maintaining the same data quality. To meet this goal, the Census Bureau has researched
fundamental changes to the design, implementation, and management of the 2020 Census. The
Census Bureau laid out its methodology for achieving this task in the 2020 Operational Plan
(U.S. Census Bureau 2015). One of the major innovation research areas for the 2020 Census has
been approaches to incorporate administrative records (AR) and third-party data into the census
design. AR are data maintained by external government entities, and third-party data are sources
compiled by private organizations. These data are obtained by the Census Bureau to aid in the
census and surveys from organizations such as the Internal Revenue Service (IRS), Social
Security Administration (SSA), and third-party sources.
This paper describes our methodology for using AR in the Nonresponse followup (NRFU)
operation for the decennial census. In the 2010 Census, the NRFU operation encompassed
census enumerators visiting areas to verify the status for every address that received a 2010
Census questionnaire but did not respond by mail. NRFU included about fifty million addresses
requiring up to six enumerator contacts each, totaling about $1.6 billion (Walker et al. 2012).
Following NRFU, each of the previously unresolved fifty million addresses was assigned one of
three possible housing unit statuses: occupied, vacant, or non-existent. If the unit was determined
to be occupied, a housing unit count was determined and each person was rostered with basic
demographic characteristics such as name, age, date of birth, race, Hispanic origin, and
relationship to the householder.
When researching changes to the census design, one of the challenges is assessing how the
proposed changes can have impacts on Census quality. This is challenging because the
decennial census is used to produce numerous results for both housing units and population. For
population, the decennial census provides results for the total population and subpopulations by
race, Hispanic origin, age, sex, relationship, and tenure. Our paper shares some of the quality
assessments that we have done in our research.
2. Administrative Record Methodology for Nonresponse Followup
For the 2020 Census planning, the U.S. Census Bureau has the challenge to conduct the next
census at a lower cost per household after adjusting for inflation than the 2010 Census while
maintaining high quality results. Utilizing administrative records and third-party data is one of
the four innovation areas and is intended to reduce the costs of the door-to-door enumeration of

2
addresses in the Nonresponse Followup operation. In this section, we provide an overview of
how administrative records are integrated into the NRFU operation to determine vacant and non-
existent addresses and to enumerate occupied addresses. For the 2020 Census, the Census
Bureau has come up with methods for the partial usage of administrative record information
where they are strongest, thus allowing a full field contact strategy to be conducted for the
remaining addresses.
2.1 Nonresponse Followup Operation of the 2010 Decennial Census
The enumeration portion of the 2010 Census was essentially completed in three stages. To begin,
most of the country received a mail form as part of the self-response stage. Then, nonrespondents
from the self-response stage were part of the NRFU operation. For 2010 NRFU, a maximum of
six contact attempts was permitted with a proxy response permitted only after the maximum
attempts to interview a household member had failed. The contact strategy was fixed for all
households and AR were not used. The third stage was count imputation. Historically, count
imputation constitutes a necessary step occurring at the end of each census in order to produce
population totals for both persons and housing units. In past censuses, the rate of addresses
requiring imputation for either housing unit status or household size has been very low. Less
than one-half of one percent of addresses required count imputation in the 2010 Census (Keller
2016). In this paper, we focus on the use of administrative records during the NRFU portion of
the census.
2.2 Administrative Record Usage Determinations
For this application, we have researched using administrative records and third-party data to
reduce the number of times that an address must be contacted during the NRFU Operation. In
order to understand how we are proposing to use administrative records, we lay out the
determinations that the NRFU operation is attempting to make for addresses requiring followup.
For each address, the NRFU operation must determine one of the following three outcomes for
each address:
Occupied: The address is a valid housing unit and is occupied on Census Day based on
the residence rules. For occupied addresses, the roster of all of the people living at the
address needs to be obtained with the demographic characteristics of age, sex, race,
Hispanic origin, relationship to householder, and whether the house is owned or rented.
Vacant: The address is a valid housing unit but was unoccupied on Census Day. For
vacant addresses, the reason for being vacant needs to be obtained, such as for sale, for
rent, or seasonal vacancy.
Non-Existent or Delete: The address does not meet the Census Bureau’s definition of a
housing unit and needs to be removed from the Census list. This includes addresses that
are businesses as well as units that do not physically exist.
3
We have developed an approach where the usage of administrative records allows us to make
these determinations for each address. Section 2.3 lays out the integration of administrative
record usage into the modes of data collection. The operation includes the use of fieldwork,
administrative records, and additional mailings to be able to use multiple modes to try to obtain
the best quality data for an address. Later sections will discuss the statistical modeling approach
used to make the AR determinations.
2.3 Nonresponse Followup Design Incorporating Administrative Records
This section gives an overview of the NRFU contact strategy related to administrative record
occupied and vacant cases proposed for the 2020 Census. The strategy outlined here was
implemented in the 2016 Census Test. Before the NRFU operation, an address will have received
multiple mailings before and after Census Day. Most addresses will receive a letter with an
invitation to complete the census on the Internet, followed by a reminder letter a few days later.
In some areas, a paper questionnaire will be included in the first mailing. If an address has not
responded after these first two mailings, additional reminder postcards and a paper questionnaire
will be sent to the address. If the address still does not respond to these mailings, then a decision
needs to be made about how many times to contact the address during the NRFU operation.
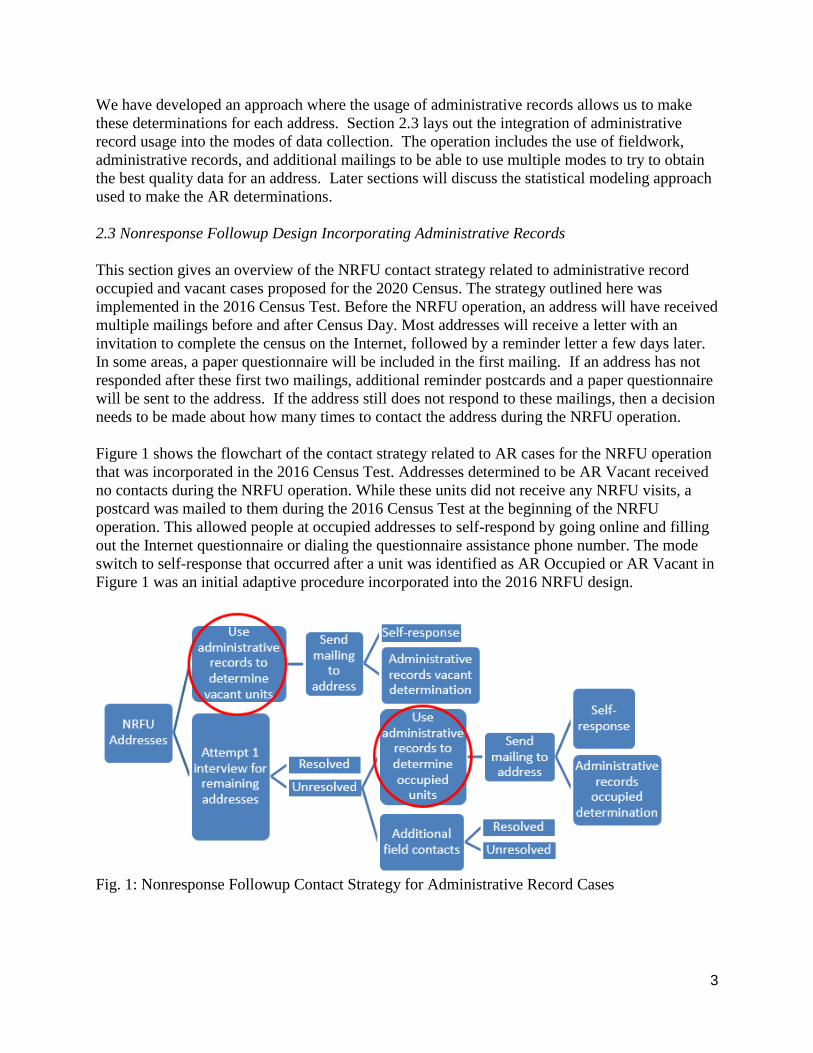
Figure 1 shows the flowchart of the contact strategy related to AR cases for the NRFU operation
that was incorporated in the 2016 Census Test. Addresses determined to be AR Vacant received
no contacts during the NRFU operation. While these units did not receive any NRFU visits, a
postcard was mailed to them during the 2016 Census Test at the beginning of the NRFU
operation. This allowed people at occupied addresses to self-respond by going online and filling
out the Internet questionnaire or dialing the questionnaire assistance phone number. The mode
switch to self-response that occurred after a unit was identified as AR Occupied or AR Vacant in
Figure 1 was an initial adaptive procedure incorporated into the 2016 NRFU design.
Fig. 1: Nonresponse Followup Contact Strategy for Administrative Record Cases

4
The remaining cases received an initial field visit. This visit allowed each case to be resolved in
several ways. A case could be resolved by
• completing the interview with the household member,
• determining the address to be vacant, or
• determining the address is not a housing unit.
If nobody in the household was home, the enumerator left a notice of visit. This notice of visit
included information that allowed the persons in the household to respond by
• going online,
• dialing the questionnaire assistance number, or
• sending back the paper questionnaire that they received earlier.
For cases determined to be occupied by AR, they received only the initial visit in the 2016
Census Test. While they received only the initial visit, an additional postcard mailing was sent to
the address. This postcard had information detailing how the household could still go online or
dial the questionnaire assistance number to self-respond. As shown, there are several ways
before and during NRFU that the Census Bureau is attempting to obtain and use self-responses
before having to use AR determinations. The remainder of this paper focuses on the
methodology to determine the AR vacant and AR occupied cases that are circled in Figure 1 and
the coverage ramifications for this approach.
2.4 Administrative Records Sources and Data Preparation
This section summarizes the administrative record and third-party data sources used in this
analysis. Because the United States has a decentralized statistical system, the Census Bureau has
made the necessary agreements so that information about income tax payments, health care, and
other government programs can be provided to the Census Bureau. The Census Bureau also uses
information obtained from third-party data vendors.
In order to allow linkage of the person from the different sources, the Census Bureau’s Person
Identification Validation System has been used to assign a Protected Identification Key (PIK) to
each person record on the administrative record and third-party files. The PIK is a one-time
encryption of the person’s Social Security or Tax Identification number. Most of the
administrative record files received from other federal agencies were able to provide the Social
Security or Tax Identification Number of the person. For these instances, the Person Validation
System needs to verify the Social Security Number and assign the encrypted PIK in its place.
For some files like the 2010 Census, the Social Security or Tax Identification Number was not
collected. For this case, the Person Validation System uses record linkage techniques to compare
the name, date of birth, age, sex, and address information from a given file to the analogous
information available for each PIK record. Based on the variable comparisons and the matching
scores for the specific blocking pass, the PIK can be assigned to person records. For the 2010
Census, PIKs were able to be assigned to 90 percent of the census enumerations. See Layne et
al. (2014) for more information about the Person Validation System processing. For
administrative record and third-party files that have address information, we are able to assign
our Master Address File Identification Number (MAFID). This allows us to identify any of the
person records from multiple sources who are associated with a given address.

5
Table 1 documents the administrative records from the Internal Revenue Service (IRS), Center
for Medicare and Medicaid Services (CMS), Indian Health Service (IHS), United States Postal
Service (USPS), Social Security Administration (SSA), Department of Housing and Urban
Development (HUD), Selective Service System (SSS), and the 2010 Census. Our approach also
used information from two third-party files: Veterans Service Group of Illinois (VSGI) and
Targus. We are continuing to research the set of AR and third-party data sources to use in this
process. The final decision on the set of sources will be made in September 2018.
Table 1: Administrative Record and Third Party Sources
Core Data Sources Additional Data Sources Used to Corroborate Information in Core
Sources and/or Used In Models
IRS 1040 Individual Tax Returns
IRS 1099 Informational Returns
CMS Medicare Enrollment Database
IHS Patient Registration File
USPS Undeliverable-As-Addressed
NIXIE reasons From Census Mailings
IRS 1040 Individual Tax Returns
IRS 1099 Informational Returns
CMS Medicare Enrollment Database
IHS Patient Registration File
CMS Medicaid Statistical Information System
SSA Numerical Identification (NUMIDENT) file
HUD Public and Indian Housing Information Center
HUD Tenant Rental Assistance Certification System
HUD Computerized Homes Underwriting Management System
SSS Registration File
USPS National Change of Address
2010 Census
Census Bureau Master Address File
American Community Survey 5-year Block Group estimates
CARRA Best Race and Best Hispanic Research
Here is a summary of the processing steps of the administrative record and third-party data
sources listed above.
One of the first steps was to build rosters using the person records found on the IRS 1040
Individual Tax Returns, IRS 1099 Informational returns, CMS Medicare Enrollment
Database, and IHS Patient Registration File. Only persons rostered from these federal
sources were used. We did not build rosters using third-party information.
Only person records that were assigned a Protected Identification Key (PIK) were used.
PIKs are one-time encryption of Social Security or Tax Identification Numbers. Since
the rosters were built from federal sources that provided us Social Security or Tax
Identification Numbers, most of the person records from these AR files could have the
PIK assigned.
The files in the Additional Data Sources column of Table 1 are used to indicate if the
person rostered from the core data sources are found at that address on those other
sources.
For our processing, only household rosters where there were multiple sources that
indicated that a family lived at an address were eligible to have their contacts reduced. If
only one source was providing the information, then we did not reduce their contacts.

6
For the AR people on the roster, we obtained age and sex from the NUMIDENT file. For
race and Hispanic origin, we utilized best race and best Hispanic origin assignments for
the person based on research by the Center for Administrative Records Research and
Applications (CARRA). Their research used previous census responses, administrative
records, and third-party information where available to assign seven values of race based
on six race alone categories and two or more races. The research used similar
administrative record and third-party information where available to assign people as
Hispanic or Non-Hispanic.
From the first and the second census mailings, we obtained the detailed USPS
Undeliverable-as-Addressed (UAA) Nixie reasons. These are the detailed reasons like
“Vacant” or “No Such Number” that explain why the postal carrier could not deliver the
census mailing. Only cases that have at least one UAA reason from these two mailings
are eligible to be AR vacant or AR non-existent.
For the methodology described in the next three sections, we used information from the
Master Address File (MAF) and ACS 5-year block group estimates as modeling
covariates. For the ACS block groups, we used estimates including vacancy rate,
mobility rate, Hispanic population rate, and Black population rate.
2.5 Approach To Determine Administrative Record Vacant Addresses
In this section, we provide an overview of predictive modeling approaches to determine vacant
addresses. In Section 2.6, we will extend the approaches described here to be able to determine
addresses as being non-existent. In researching approaches to identify addresses that were
vacant, we need to make a prediction based on the information available before NRFU fieldwork
is conducted as to whether an address is vacant. Other areas of statistical research have been
faced with this challenge and have developed predictive model approaches. Some examples of
predictive modeling approaches have been developed for health care to predict diabetes. Collins
et al. (2011) summarizes the 39 studies that have developed 43 predictive models for type 2
diabetes. We researched similar approaches of supervised learning to apply to our census
application.
Section 2.2 laid out that we want to classify each address as either occupied, vacant, or non-
existent. For this, we have a multinomial outcome that we want to make predictions about. For
this instance, there are several possible predictive modeling approaches that can be utilized for
multinomial outcome variables. These include multinomial logistic regression, decision tree
classification, and random forest models. Multinomial logistic regression allows the nominal
outcome variables to be modeled in relation to available covariates. This approach allows a
parametric framework to be utilized to assess the relationships. Decision trees are classification
algorithms that identify the key variables and produce a series of nodes like a tree that show
those relationships. Based on the parameters specified, the trees can have various number of
levels and final nodes. While a finite number of nodes may limit the number of unique
predictions that can be made to cases, the decision trees do have the advantage of producing a
pictorial final representation that are easier to explain which cases are being determined to be
7
vacant. Random forests is a supervised modeling approach based on developing decisions trees
on multiple bootstrap samples of the training data. For our application, we used multinomial
logistic regression that allowed us to include more covariates in the final model. Our research
showed similar results for this and the random forest approaches.
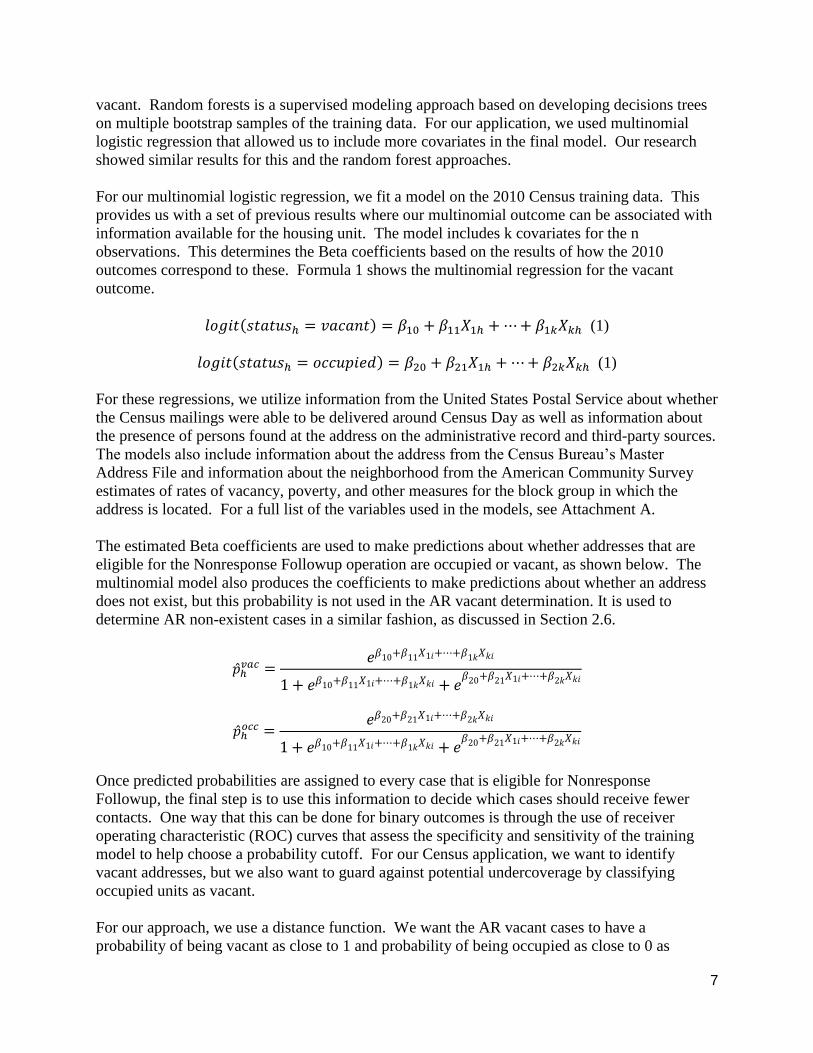
For our multinomial logistic regression, we fit a model on the 2010 Census training data. This
provides us with a set of previous results where our multinomial outcome can be associated with
information available for the housing unit. The model includes k covariates for the n
observations. This determines the Beta coefficients based on the results of how the 2010
outcomes correspond to these. Formula 1 shows the multinomial regression for the vacant
outcome.
𝑙𝑜𝑔𝑖𝑡(𝑠𝑡𝑎𝑡𝑢𝑠ℎ = 𝑣𝑎𝑐𝑎𝑛𝑡) = 𝛽10 + 𝛽11𝑋1ℎ + ⋯ + 𝛽1𝑘𝑋𝑘ℎ (1)
𝑙𝑜𝑔𝑖𝑡(𝑠𝑡𝑎𝑡𝑢𝑠ℎ = 𝑜𝑐𝑐𝑢𝑝𝑖𝑒𝑑) = 𝛽20 + 𝛽21𝑋1ℎ + ⋯ + 𝛽2𝑘𝑋𝑘ℎ (1)
For these regressions, we utilize information from the United States Postal Service about whether
the Census mailings were able to be delivered around Census Day as well as information about
the presence of persons found at the address on the administrative record and third-party sources.
The models also include information about the address from the Census Bureau’s Master
Address File and information about the neighborhood from the American Community Survey
estimates of rates of vacancy, poverty, and other measures for the block group in which the
address is located. For a full list of the variables used in the models, see Attachment A.
The estimated Beta coefficients are used to make predictions about whether addresses that are
eligible for the Nonresponse Followup operation are occupied or vacant, as shown below. The
multinomial model also produces the coefficients to make predictions about whether an address
does not exist, but this probability is not used in the AR vacant determination. It is used to
determine AR non-existent cases in a similar fashion, as discussed in Section 2.6.
�̂�ℎ𝑣𝑎𝑐 =
𝑒𝛽10+𝛽11𝑋1𝑖+⋯+𝛽1𝑘𝑋𝑘𝑖
1 + 𝑒𝛽10+𝛽11𝑋1𝑖+⋯+𝛽1𝑘𝑋𝑘𝑖 + 𝑒𝛽20+𝛽21𝑋1𝑖+⋯+𝛽2𝑘𝑋𝑘𝑖
�̂�ℎ𝑜𝑐𝑐 =
𝑒𝛽20+𝛽21𝑋1𝑖+⋯+𝛽2𝑘𝑋𝑘𝑖
1 + 𝑒𝛽10+𝛽11𝑋1𝑖+⋯+𝛽1𝑘𝑋𝑘𝑖 + 𝑒𝛽20+𝛽21𝑋1𝑖+⋯+𝛽2𝑘𝑋𝑘𝑖
Once predicted probabilities are assigned to every case that is eligible for Nonresponse
Followup, the final step is to use this information to decide which cases should receive fewer
contacts. One way that this can be done for binary outcomes is through the use of receiver
operating characteristic (ROC) curves that assess the specificity and sensitivity of the training
model to help choose a probability cutoff. For our Census application, we want to identify
vacant addresses, but we also want to guard against potential undercoverage by classifying
occupied units as vacant.
For our approach, we use a distance function. We want the AR vacant cases to have a
probability of being vacant as close to 1 and probability of being occupied as close to 0 as

8
possible. We calculate the distance of the two predicted probabilities from our multinomial
logistic model to the ideal point of (�̂�ℎ𝑜𝑐𝑐 = 0, �̂�ℎ
𝑣𝑎𝑐 = 1). This distance is used in our
administrative record vacant determination.
We define the Euclidian vacant distance function for vacant determination as:
𝑑ℎ𝑣𝑎𝑐 = √(1 − �̂�ℎ
𝑣𝑎𝑐)
2+ (�̂�ℎ
𝑜𝑐𝑐)
2
This continuous measure is assigned to every address. The cutoff can be adjusted upwards or
downwards based on the tradeoff between reduction of the Nonresponse Followup workload
versus the allowable differences between the administrative record and census fieldwork
determinations. We are continuing to research the impact of differentially weighting the two
components of this distance function.
2.6 Extension of AR Vacant Methodology to AR Non-Existent Cases
The approach described in Section 2.5 for determining AR vacant addresses was extended to be
able to determine AR non-existent addresses that can receive fewer contacts as well. We take
advantage of our multinomial outcome space of addresses being classified as occupied, vacant or
delete.
We define the non-existent distance function based on the non-existent probability and occupied
probability in a similar manner to determining vacant addresses. We substitute the non-existent
probability for the vacant probability. In this instance, the ideal situation is for an address to
have a non-existent probability of one and an occupied probability of zero.
As a result, we define the Euclidian non-existent distance function as:
𝑑ℎ𝑛𝑒 = √(1 − �̂�ℎ
𝑛𝑒)
2+ (�̂�ℎ
𝑜𝑐𝑐)
2
This continuous measure is assigned to every address eligible for the Nonresponse Followup
Operation. The cutoff can be adjusted upwards or downwards based on the tradeoff between
fieldwork reduction and allowable differences.
2.7 Approaches to Determine AR Occupied Addresses
This section lays out the methodology to determine AR occupied addresses. As laid out in
Section 2.2, a roster of people eligible for enumeration was developed based on information from
tax returns, tax information, and federal health care enrollment in Medicare or Indian Health
Services.
For our census applications, determining if the roster developed for an address is of good enough
quality to reduce contacts is a challenge because there are multiple dimensions of quality that
need to be assessed. Healthcare and other predictive modeling applications tend to assess binary
outcomes about whether someone has a disease or if a new medicine was able to successfully

9
treat a disease. For our application, there are several components. One is a comparison of
population counts to see if they agree. A second is assessing whether the individual people
found on the administrative record sources were counted at the address in the Census. A third is
to compare the household composition of adults and children found on the administrative record
sources to the composition of Census. Other comparisons can be done as well.
For our application, we developed an approach that allows the results of multiple comparisons to
be used to assess the address. Our approach described in this section uses two models. The two
approaches are similar to the previous section where predictive models are developed using 2010
Census results.
Our first model is the person-place model. This model assesses whether the administrative
record sources are placing the people at the same address as the Census enumeration would.
This model predicts the probability of enumerating the AR person at the sample address if
fieldwork were conducted. Morris (2014) has shown these person-place predictions to be
correlated with count agreement between the AR data and the census result.
We compile person-place pairs in AR files mentioned above as well as the 2010 Census person-
place pairs to define the dependent variable of interest in the person-place model:
𝑦𝑖ℎ = { 1 if person 𝑖 is found in AR and 2010 Census at the same address ℎ 0 otherwise
We are interested in a predictive model for estimating the probability 𝑝𝑖ℎ = 𝑃(𝑦𝑖ℎ = 1); that is,
the probability that the 2010 Census and the AR roster data place the person at the same address.
These probabilities are estimated via a logistic regression model. Morris (2014) documents initial
work on this person-place model and investigates logistic regression, decision tree, and random
forest methodologies for estimating the models. This research showed little difference in
predictive power between the three methodologies.
The person-place model is fit at the person-level, but decisions are made at the housing unit-
level. Therefore, the person-level predicted probabilities, �̂�𝑖ℎ, are summarized for each address
such that the housing unit-level predicted probability for address h is defined as:
�̂�ℎ𝑝�̂� = min (�̂�1ℎ, … , �̂�𝑛ℎℎ)
where 𝑛ℎ is the number of people at address h. This minimum criterion assigns to the housing
unit the predicted probability for the person in the housing unit for which we have the lowest
confidence trying to be a conservative approach.
The second model is the household composition model. The household composition model
predicts the probability that the sample address would have the same household composition
determined by NRFU fieldwork as its pre-identified AR household composition. The results
from the 2014 Census Test motivated the development of the household composition model.
During that test, Keller et al. (2016) observed that units identified as occupied with AR were
more likely to be occupied and have higher count agreement in NRFU if the household

10
composition of the AR unit was a single adult, a two-person adult unit without kids, or a two-
person adult unit with kids.
We begin by categorizing each AR household roster in this manner:
No AR persons
1 Adult, 0 Child
1 Adult, >0 Child
2 Adult, 0 Child
2 Adult, >0 Child
3 Adult, 0 Child
3 Adult, >0 Child
Someone with undetermined age in household
Other
We then create a dependent variable from the household composition on the 2010 Census as
well. The categorization is similar except that, in all units, all persons have an age. This is
because we are using the Census Edited File as the basis for forming the census household
composition. Since this data has age imputed, there are no missing values for age. We fit a
multinomial logistic model with the 2010 Census household composition as the dependent
variable over a sample of the data. The predicted probability for the housing unit is the
multinomial probability associated with the AR household type. For every eligible NRFU
address, we can assigned a predicted household composition probability:
�̂�ℎℎℎ𝑐 = 𝑝𝑟𝑜𝑏 (𝐶𝑒𝑛ℎ,𝑘
ℎℎ𝑐|𝐴𝑑𝑟𝑒𝑐ℎ,𝑘ℎℎ𝑐 , 𝑋)
Where h is the address,
k is the household composition category, and
X are other covariates.
Since fieldwork may not be done at the address, we would like to predict what the probability of
the fieldwork resulting in the same household composition category as observed based on the
administrative record information available.
For our occupied decision, we use the two predicted probabilities as inputs. The first is the
minimum person-place probability for the address. For the person-place probability, we would
like this probability to be as close to one as possible. The second is the household composition
probability. This is the probability that given we have observed a certain AR household
composition, the census household would be enumerated with the same household composition.
For this household composition probability, we would also like that to be as close to one as
possible.
Based on this, our situation can be thought of as a two-dimensional plane where each probability
is on one dimension with values between zero and one. Based on the two probabilities, each
address would have a point in this two-dimensional space. The best AR cases would be those
that have shortest distance to the point where the person-place model equals one and the
household composition equals one (i.e., the (1,1) point).

11
Based on this idea, we proceed to use the Euclidian distance. Hence, we define the occupied
distance function as:
𝑑ℎ𝑜𝑐𝑐 = √(1 − �̂�ℎ
𝑝𝑝)
2+ (1 − �̂�ℎ
ℎℎ𝑐)
2
This continuous measure is assigned to every address. The cutoff can be adjusted upwards or
downwards based on the tradeoff between reduction of the Nonresponse Followup workload
versus the allowable differences between the administrative record and census fieldwork
determinations. As a rule, a unit must have one of the six valid household compositions
(between 1 and three adults, with or without children) and between one and six AR persons to be
eligible for an AR occupied determination.
2.8 Making AR Determinations via an Optimization Approach with Linear Programming
The previous sections described how we used a Euclidean distance function to make AR
determinations based on the predicted probabilities from the various models. That was the
approach used in the 2016 Census Test. In prior research and the 2015 Census Test, we used an
optimization approach with linear programming to select the set of cases for AR determinations.
This section describes this optimization approach. For more information, see Morris et al.
(2016). Materials discussing this approach for the 2015 Census Test were previously shared with
the Census Scientific Advisor Committee for the November 2015 virtual meeting.
The motivation of this research was to maximize the reduction of NRFU workload through the
identification of vacant units prior to visits from enumerators. To accomplish this, we
simultaneously applied two constraints when maximizing our NRFU workload reduction to
identify AR Vacant cases. The first constraint was that the average vacant probability of
identified units was above some threshold. The second constraint was that the sum of the
occupied probabilities did not exceed a certain percentage of the estimate of occupied units from
the ACS.
The first constraint attempted to reduce the amount of misclassification of occupied or delete
units as vacant units. Those units for which the model was most confident are vacant had a high
probability of vacancy. We specified an average vacant probability of no less than 0.8. The
second constraint aimed to reduce the amount of misclassification of occupied units as vacant. It
imposed a restriction on the occupied probability. As discussed earlier, each NRFU address had a
three-vector probability space. The second constraint distinguished between households with
comparable vacant probabilities yet different probabilities of being occupied by allowing only a
desired tolerance of the amount of occupied units possibly being misclassified. We identified a
threshold of 0.5 percent. Therefore, the sum of the occupied probabilities was no greater than
one-half percent of the number occupied units from the ACS over the relevant geography. The
thresholds were designed to meet an identification of about 10% of all NRFU cases as AR
Vacant while maintaining an acceptable level of false positive errors.
Formally written, suppose that 𝑁 is the NRFU universe, 𝑋𝑗 be an binary indicator equal to 1 if
unit 𝑗 is vacant and removed from the workload, 𝑁𝑎 be the number or addresses in area 𝑎, 𝑁𝑎𝑜𝑐𝑐

12
be the number of occupied units in area 𝑎, 𝑇𝑢𝑛𝑜𝑐𝑐1 and 𝑇𝑢𝑛𝑜𝑐𝑐2 be the chosen thresholds. The
optimization procedure attempted to:
Maximize 𝑈 = ∑ 𝑋𝑗𝑁𝑗=1
Subject to 1
𝑈∑ 𝑋𝑗
𝑁𝑗=1 �̂�𝑗
𝑣𝑎𝑐 ≥ 𝑇𝑢𝑛𝑜𝑐𝑐1
1
𝑁𝑎𝑜𝑐𝑐 ∑ 𝑋𝑗,𝑎
𝑁𝑎
𝑗=1
�̂�𝑗,𝑎𝑜𝑐𝑐 ≥ 𝑇𝑢𝑛𝑜𝑐𝑐2, ∀𝑎
We also used linear programming to integrate information from the person-place and household
composition models and identify AR Occupied units in the 2015 Census Test. The predicted
probabilities �̂�ℎ𝑜𝑐𝑐1 and �̂�ℎ
𝑜𝑐𝑐2 from the two models were passed to the linear program. For the
linear program, we maximized the occupied identification subject to constraints on the predicted
probabilities resulting from both models. In addition, we added constraints that the size of the
AR unit must not be greater than six people and the AR HH composition had between one and
three adults (with or without children). While the predictions from these two sources were
correlated, Morris et al. (2016) showed higher agreement of population count and household
compositions when using both together as compared to using only one or the other.
This processing used the OPTMODEL procedure in SAS. The OPTMODEL procedure provides
several mathematical approaches to solve linear, nonlinear, quadratic and other optimization
problems. OPTMODEL allowed specification of our specific linear optimization problem with
the ability to add multiple constraints.
The motivation underlying the use of linear programming to identify AR Occupied units was that
we could integrate information from multiple occupied models. To achieve this, we
simultaneously applied two constraints when maximizing our occupied identification. For
example, suppose the HH composition model indicated that a unit with two adult and children
had a high-predicted probability of also having been a two adult with children HH in the census.
Furthermore, suppose that the person-place model showed that one of the children had a low
predicted probability of being in the census. Using only the information from the HH
composition model would probably have led to removing the unit from the NRFU workload.
However, also including the information from the person-place model may have caused the unit
to remain in the workload since the status of one person was in question. In short, incorporating
information via a linear program allowed for a type of consistency check across both models.
The first constraint was that the average probability of identified units for the person-place model
was above some threshold. We identified a threshold of 0.68 for this research. The second
constraint was that the average probability of identified units for the HH composition model is
above some threshold. We identified a threshold of 0.57 for this research. The thresholds were
designed to meet an identification of about 15% of all NRFU cases as AR Occupied while
maintaining an acceptable level of false positive errors. Higher thresholds would have resulted in
lower false positive errors but also a lower identification of AR Occupied cases.

13
Formally written, suppose that 𝑁∗ is the NRFU universe for which we have units with AR , 𝑋𝑗∗
be an binary indicator equal to 1 if unit 𝑗 is enumerated as occupied via AR, 𝑇𝑜𝑐𝑐1 is the chosen
threshold for the person-place model and 𝑇𝑜𝑐𝑐2 is the chosen thresholds for the household
composition model. The optimization procedure attempted to:
Maximize 𝑈∗ = ∑ 𝑋𝑗∗𝑁∗
𝑗=1
Subject to 1
𝑈∗∑ 𝑋𝑗
∗𝑁∗
𝑗=1 �̂�𝑗𝑜𝑐𝑐1 ≥ 𝑇𝑜𝑐𝑐1
1
𝑈∗∑ 𝑋𝑗
∗
𝑁∗
𝑗=1
�̂�𝑗𝑜𝑐𝑐2 ≥ 𝑇𝑜𝑐𝑐2
(𝐴𝑅 ℎ𝑜𝑢𝑠𝑒ℎ𝑜𝑙𝑑 𝑠𝑖𝑧𝑒)𝑗 ≤ 6, ∀𝑗
(𝐴𝑅 ℎ𝑜𝑢𝑠𝑒ℎ𝑜𝑙𝑑 𝑐𝑜𝑚𝑝𝑜𝑠𝑖𝑡𝑖𝑜𝑛)𝑗 ∈ (1,2,3,4,5,6) ∀𝑗
One problem with using such optimization techniques was the use of average of probabilities to
identify AR Vacant and AR Occupied cases. For example, suppose we compare two NRFU
workloads w, each of four addresses h with the following vacant probabilities:
Workload 1: �̂�ℎ𝑤=1 = (�̂�11
1 = 0.81, �̂�121 = 0.81, �̂�13
1 = 0.75, �̂�141 = 0.50),
Workload 2: �̂�ℎ𝑤=2 = (�̂�21
2 = 0.90, �̂�222 = 0.90, �̂�23
2 = 0.72, �̂�242 = 0.50),
Using the 0.8 cutoff to optimize workload removal, if we take the average approach, we identify
address 11 and address 12 as AR Vacant in Workload 1. We identify address 21, address 22, and
address 23 as AR Vacant in Workload 2. This happens despite address 23 having a lower predicted
probability of vacancy than address 13. In other words, the averaging approach allows other cases
to contribute to identification of AR Vacant units. Another criticism was the decision about which
cases would contribute to the averaging. Since averages are computed over a pre-defined area, a
decision has to be made about over what areas the averaging is done. One possibility would be to
run the linear optimization over the entire nation. This could cause a disproportionate amount of
cases to be removed in one area, resulting in unbalanced workloads. Another alternative could be
to run the linear optimization for each state or county. Doing this would require running the
optimization to 50 or 3,000 times which could increase the computational time and complexity. In
an environment where field operations are waiting on results from the AR models, the time frame
it may take to run the optimization routine would make timing more challenging. Based on these
criticisms, we proceeded to use the distance function approach described previously instead of the
optimization approach.
2.9 Demographic Characteristics of Administrative Record Enumeration
For the 2020 Census, the administrative record information will only be used for enumeration if
the address does not self-respond or is resolved during the one visit of fieldwork enumeration.
For the people enumerated based on administrative records, the demographic characteristics of
age, sex, race, Hispanic origin, and relationship will need to be obtained from administrative
record sources like past census responses or the Social Security Numident file. For
characteristics like race and Hispanic origin, the final determination of assignment will also need
to account for potential changes to the question to possibly include the Middle Eastern or North

14
African response option. For any of these characteristics that cannot be assigned directly based
on administrative record information, imputation procedures will need to be used.
2.10 Multiple Implementations Throughout the Nonresponse Followup Period
The administrative record procedures to reduce contacts can be implemented throughout the
Nonresponse Followup data collection window. For our application, we receive an additional
delivery of IRS tax returns in the middle of the operation. We are able to process this new
information so that new or updated predicted probabilities can be assigned to the cases still
active in the NRFU operation. During this processing of comparing the new distance function
results to our determined cutoffs, we are able to determine that additional cases can have their
contacts reduced.
2.11 Other Considerations of this Application
Sections 2.1 through 2.10 provided details of how the Census Bureau is proposing to use
predictive models so that administrative record and third-party information can be used to reduce
the number of necessary contacts during the Nonresponse Followup operation. These sections
provide the most up-to-date research applications. This section provides some possible
alternatives that could also be utilized.
Section 2.2 listed the administrative record and third-party data sources that have been used in
the Census Tests. The Census Bureau will make a final decision on the administrative record
and third-party data files to be used in September 2018. The Census Bureau is pursuing making
agreements to obtain additional data sources. For example, individual states implement
programs that provide nutritional and other support for families that need assistance. Since
these are implemented by individual states, the Census Bureau is working to obtain agreement
and data about the addresses and people who are participating. These sources can provide
coverage of harder-to-count populations that are not as fully covered in other available federal
sources.
Another potential AR source we have researched is a research file created by CARRA that
attempts to link children to their parents. The CARRA Kidlink file assigns a mother PIK and
father PIK to children using the names of the parents from the Social Security number
application for the child. By associating children with their parents, this file allows us to address
the possible undercoverage of children in the other AR sources. Attachment B provides a
summary of the methodology for incorporating this file into the determination of occupied units
as well as the quality implications.
The 2020 proposed application uses the 2010 Census as the source of the training data. Instead
of using the past Census as a training source, another possibility is to use more current data from
an ongoing survey that is collected closer to the time of the 2020 Census. One possibility would
be to train our model using responses from the American Community Survey. The Census
Bureau is researching if this can be used as a source of the training data for AR occupied models.
Nevertheless, a potential benefit from training on ACS data is the recentness of the ACS data.
For example, for the 2020 Census, AR removals could be trained in 2018 ACS data as opposed

15
to 2010 NRFU data. In addition, the ongoing nature of the ACS data could allow for the
inclusion of administrative record datasets not necessarily available or could not provide 2010
vintage data for training. Attachment C provides a summary of this research.
Lastly, use of administrative records data may also reduce the status imputation workload. In the
2010 Census, count imputation was a one-time process performed following the completion of
the NRFU operation. This ensured that each census address was provided a final status of
occupied, vacant, or non-existent (also known as delete). Following count imputation,
characteristic imputation was also a one-time process, completed to ensure that each person was
provided characteristics including age, sex, race, Hispanic origin, and relationship to
householder.
3. Quality Assessment
The development of the AR models has been guided by two processes. First, we have tested our
approaches as part of the mid-decade census tests and have made modifications based on the
results of these small-scale tests. Second, we have performed an internal validation by comparing
models retrospectively to 2010 Census results. For example, running a simulation on 2010
Census data, we counted how many addresses identified as vacant by the AR model were
actually vacant during the 2010 census. Essentially, this type of analysis treats 2010 Census
results as ‘truth’. However, a difficulty underlying the evaluation of AR modeling is the inherent
error in Census results. Although the analysis using the 2010 Census results as ‘truth’ provides a
solid basis for assessing model performance, it is not the only way model performance can be
measured. It is possible that census quality could be improved using AR data that is not reflected
by solely comparing model against 2010 Census ‘truth’.
In this section, we first present results of the AR modeling from the 2015 and 2016 Census Tests.
Then, we utilize a retrospective analysis of applying these approaches on the 2010 Census. For
this analysis, we determined about 10 percent of the addresses to be administrative record vacant
and about 15 percent of the addresses to be administrative record occupied and about 0.1 percent
determined to be administrative record deletes or non-existent addresses.
3.1 Quality Results from the 2015 Census Test
The 2015 Census Test was conducted in portions of Maricopa County, Arizona. This was the
first test in which we used predictive models to identify occupied and vacant units. An
optimization approach was used to select the set of AR occupied and vacant units based on the
predicted probabilities from the models and a set of constraints (see Section 2.10 for a discussion
of the optimization approach). One of the panels of the 2015 Census Test was a control panel
that mimicked the 2010 Census contact strategy as closely as possible. Because no AR were used
in production for this panel, we were able to retrospectively evaluate our AR modeling approach
on the control panel in a similar fashion to the previous research using the 2010 Census. That is,
we compared our AR determinations to the fieldwork resolutions for addresses in the control
panel. This section summarizes the AR modeling results for the 2015 Census Test. For a
complete analysis, see Clark et al. (2016).

16
For the Control Panel, we determined 2,672 Control Panel units as vacant through administrative
records. Fieldwork successfully assigned a housing unit status to 93.4 percent, or 2,496 NRFU
units. Table 2 shows the NRFU status assigned to those resolved Control Panel NRFU units
determined vacant through administrative records. Of these 2,496 units, fieldwork assigned a
status of vacant to 46.0 percent. This result was lower than anticipated. Based on parameters that
were set, the anticipation was that about 80 percent of the cases would have been vacant. The
table shows that a main part of the difference is that census fieldwork determined that 34.8
percent of the administrative record vacant units were nonexistent or did not meet the definition
of a housing unit.
The remaining 19.2 percent of the AR vacant units were determined to be occupied by the NRFU
fieldwork. About 20 percent of the 479 AR vacant units that were determined to be occupied did
not have a UAA for the census mailing that was used in the model. We did not require a UAA
for AR vacant cases in the 2015 Census Test. Based on these results, we did make this a
requirement in the 2016 Census Test.
Table 2. Housing Unit Status for Resolved Cases Assigned as AR Vacant in the Control Panel
Panel
Units AR vacant and
an assigned status
through fieldwork Occupied Vacant Nonexistent
N N % SE N % SE N % SE
Control 2,496 479 19.2 6.4 1,149 46.0 4.3 868 34.8 9.8
Table 3 shows the NRFU status for the AR occupied units in the control panel. The AR
modeling and fieldwork agreed on an occupied status 90.8 percent of the time. This result was
similar to the 2014 Census Test results where occupancy status agreed over 90 percent of the
time.
Table 3. Housing Unit Status for Cases Assigned as AR Occupied in the Control Panel
Panel
Units Occupied Vacant Nonexistent Unresolved NRFU status
N N % SE N % SE N % SE N % SE
Control 3,797 3,447 90.8 1.0 234 6.2 0.9 31 0.8 0.2 85 2.2 0.3
For the 3,447 AR occupied cases that were also determined to be occupied by NRFU fieldwork,
Table 4 compares the household population counts from administrative records to the fieldwork
result. The household counts matched about 60 percent of the time. For 15.9 percent of the
units, the household count was greater in AR, and for 23.7 percent of the units, the household
count was greater in the fieldwork. When the counts disagreed, the two sources usually
disagreed by one person.
Table 4. Population Count Comparison for AR and Field Occupied Units in the Control Panel
Panel
Units Equal
2+ Fewer
Persons in
AR
1 Fewer
Person in
AR
1 More
Person in
AR
2+ More
Persons in
AR
Fieldwork
Count
Unknown
N % SE % SE % SE % SE % SE % SE
Control 3,447 60.2 1.6 8.1 0.6 15.5 0.8 11.4 0.7 4.5 0.5 0.2 0.1

17
3.2 Quality Results from the 2016 Census Test
The 2016 Census Test was conducted in portions of Los Angeles County, California and Harris
County, Texas. We again used predictive models to identify AR occupied and vacant units. The
AR model used for identification in 2016 incorporated a few changes from the 2015 Census Test.
First, we used the distance function as described in Sections 2.5 through 2.7 to select the set of
units for AR determinations. Next, the use of AR to identify non-existent units was moved up in
our plan to be part of the 2016 Census Test for the first time. We also added a requirement for
the existence of UAA codes on one of the census mailings for AR vacant and AR delete units.
Lastly, we updated the NRFU contact strategy for the cases with AR determinations. All of the
AR determination cases were sent an additional mailing during the NRFU operation to
encourage self response. This section summarizes the AR modeling results for the 2016 Census
Test. For a complete analysis, see Kjeldgaard and Konicki (2017 forthcoming).
There was no control panel for the 2016 Census Test. In order to evaluate the results of the AR
determinations, the we selected an evaluation sample of AR determinations in Phase 1 and Phase
2 to remain in the NRFU universe, where they were sent to the field. The subset was selected by
sorting by how confident we were in the determination – from most to least – and systematically
selecting every 5th unit. The resolution of these units by NRFU fieldwork is used to assess the
accuracy of our AR determinations. That being said, many of the cases in the evaluation sample
were not resolved by the NRFU fieldwork. This limited our ability to assess the AR
determinations.
Table 5 compares the AR determinations to the information collected in NRFU fieldwork for the
evaluation sample. Overall, the AR Occupied, Phase 1 units have about 80 percent status
agreement, AR Vacant have about 43 percent status agreement, and AR Delete units have about
49 percent status agreement. Note that each of these classifications is also associated with an
unresolved rate near or above 10 percent. For the AR vacant and delete cases, the percent of
cases that were resolved as occupied was higher than expected. This result has led us to update
the contact strategy for cases with AR determinations (see Section 4).

18
Table 5. Housing Unit Status for AR Determinations in the Evaluation Sample
AR Determination
Total Occupied Vacant Delete Unresolved
N % SE % SE % SE % SE
AR Occupied, Phase 1
Total 2,338 80.3 0.7 4.8 0.4 1.7 0.2 13.2 0.6
LA County 1,241 87.3 0.9 3.4 0.5 1.2 0.3 8.1 0.7
Harris County 1,097 72.4 1.2 6.4 0.7 2.3 0.4 19.0 1.0
AR Vacant
Total 715 21.1 1.3 42.8 1.6 20.7 1.2 15.4 1.2
LA County 236 19.9 2.3 43.2 2.9 22.5 2.3 14.4 2.1
Harris County 479 21.7 1.6 42.6 2.0 19.8 1.5 15.9 1.4
AR Delete
Total 313 29.1 2.1 10.9 1.4 48.6 2.2 11.5 1.7
LA County 172 24.4 2.9 7.6 1.9 57.0 3.3 11.0 2.2
Harris County 141 34.8 3.2 14.9 2.1 38.3 2.7 12.1 2.5
AR Occupied, Phase 2
Total 64 51.6 5.9 4.7 2.2 1.6 1.4 42.2 5.7
LA County 35 57.1 8.0 5.7 3.7 2.9 2.6 34.3 7.6
Harris County 29 44.8 8.9 3.4 2.2 0.0 0.0 51.7 8.6
For the AR occupied cases that were also determined to be resolved by NRFU fieldwork, Table 6
compares the household population counts from administrative records to the fieldwork result.
Across both test sites, the counts matched about 67.7 percent of the time. About 14.2 percent of
the cases had one fewer person in the AR household count.
Table 6. Population Count Comparison for AR and Field Resolved Units
Count Agreement:
Resolved in
Field/Occupied in AR
AR
Occupied
Units
Equal
2+ Fewer
Persons in
AR
1 Fewer
Person in
AR
1 More
Person in
AR
2+ More
Persons in
AR
N % SE % SE % SE % SE % SE
Total 2,030 67.7 0.9 5.0 0.4 14.2 0.7 8.8 0.6 4.4 0.4
LA County 1,141 66.7 1.2 6.2 0.6 14.4 0.9 7.4 0.7 5.3 0.6
Harris County 889 69.0 1.4 3.4 0.5 13.9 1.1 10.6 0.9 3.1 0.5
Table 7 shows the distribution of UAA reasons for the AR Vacant cases that were census
fieldwork occupied. The 21.1 percent are 151 cases. For AR Vacant cases that were vacant, we
had two indications of the address being vacant 86 or 57 percent of the time. For 29 or 19
percent, we had an indication on one of the mailings.

19
Table 7. UAA Reasons for AR Vacant & Fieldwork Occupied Addresses
Reasons Number Percent
Vacant in both 86 57.0%
Vacant in one 29 19.2%
Any other reason twice 25 16.6%
Any other reason once 11 7.3%
Total 151 100.0%
Table 8 shows the distribution of UAA reasons for the AR Delete cases that were fieldwork
occupied. The 29.1 percent are 91 cases. For 26 or 29 percent of these cases, the UAA reason
was No Such Number for both deliveries. Another 29 or 32 percent of these cases, the UAA
reason was No Such Number on one of the deliveries. For addresses that are housing units that
do not exist, these results are concerning.
Table 8. UAA Reasons for AR Delete & Fieldwork Occupied Addresses
Reasons Number Percent
No Such Number in both 26 28.6%
No Such Number in one 29 31.9%
Any other reason twice 28 30.8%
Any other reason once 9 9.9%
Total 91 100.0%
A possible reason for disagreement in the occupancy status for these units is that the occupancy
status of the unit changed around Census Day (April 1). If a household moved into or out of the
housing unit near to Census Day, the occupancy status of the housing unit on Census Day may
not have been clear to either the postal carrier who marked the mail as UAA or the NRFU
respondent who answered about the unit many weeks after Census Day. To see if there was any
evidence of mobility at these units around Census Day, we looked at the USPS National Change
of Address (NCOA) file. The NCOA file contains records of people who have filed a change of
address with the USPS so that their mail can be forwarded to their new address. Each record
contains the address the person moved from (from unit) and the address the person moved to (to
unit). While people are not required to file a change of address with the USPS, this file does
provide the opportunity to see if there was an indication that the occupancy status of a unit may
have changed. For example, moves into a unit before April 1 and moves out of a unit after April
1 are indications that the unit may have been occupied on Census Day.
We matched the 715 AR Vacant addresses to both the from units and to units on the NCOA file
and looked at changes of addresses by month for 2016. Table 9 shows the results by the
occupancy status assigned by the NRFU fieldwork. The top half of the table shows addresses
that matched to an NCOA record for a move to the unit, and the bottom half of the table shows
addresses that matched to an NCOA record for a move from the unit. For the 151 AR Vacant,

20
Fieldwork Occupied units, 26 had an NCOA record for a move into the unit. Nearly all of these
records had a date in April or later. This does not provide evidence that the disagreement in the
occupancy status is due to people moving into the unit shortly before Census Day. Rather, the
movement into the unit after Census Day suggests that the unit may have been vacant on Census
Day. A similar pattern is seen for all AR vacant cases and those that were also determined to be
vacant by NRFU fieldwork.
The bottom portion of the table shows that 30 of the 151 AR Vacant, Fieldwork Occupied units
had a NCOA record for a move from the unit. Of these, 22 were in March or earlier. This does
not provide evidence that the unit was occupied on Census Day with movement out of the unit
shortly after. The results again suggest that the unit may have been vacant on Census Day since
there is an indication of people moving out of the unit before April. In summary, for the 151 AR
Vacant, Fieldwork Occupied units, 46 (30 percent) have an indication from the NCOA file
suggesting vacancy on Census Day, rather than occupancy.
Table 9. National Change of Address Information for Administrative Record Vacant Cases
Month of Change of Address
Fieldwork Occupancy Status
Total Occupied Vacant
Count Percent Count Percent Count Percent
Total 715 151 306
Moved To Unit in 2016 126 100.0 26 100.0 80 100.0
January – March 3 2.4 2 7.7 0 0.0
April – October 123 97.6 24 92.3 80 100.0
Moved From Unit in 20126 118 100.0 30 100.0 67 100.0
January – March 96 81.4 22 73.3 58 86.6
April – October 22 18.6 8 26.7 9 13.4
Kjeldgaard and Konicki (2017 draft) also evaluated the additional mailing sent to the
administrative record cases. Table 10 shows the Undeliverable-As-Addressed determinations for
this NRFU mailing. For a case to be administrative record vacant or delete, the cases had to be
UAA on at least one of the first two mailings around Census Day. For AR vacant and delete
cases, the additional mailing was sent at the start of the NRFU operation in mid-May. For AR
occupied cases, the additional mailing was sent after the one contact attempt if that attempt was
not successful at resolving the case. The table shows that AR delete cases were UAA on the
mailing 6 weeks after Census Day about 75 percent of the time. The thought would be that these
cases would be closer to 100 percent of the time since the initial mailings had UAA Nixie
reasons of No Such Number, No Such Address, or other codes related to addresses not being a
housing unit. For administrative record vacant cases, they were UAA again about 6 weeks later
57 percent of the time.

21
Table 10. UAA Status of Administrative Records Mailing
AR Occupied
(Phase 1) AR Vacant AR Delete
Count % Count % Count %
Total 9,353 2,856 1,252
AR Mailing Sent 8,418 2,848 1,252
UAA on AR Mailing Sent 125 1.5 1,631 57.3 944 75.4
Cresce (2012) compared gross vacancy rates from the decennial census to other surveys. The
following figure is taken from that analysis. The figure shows that the recent decennial censuses
each had a lower gross vacancy rate than the estimates from the American Housing Survey
(AHS), the Current Population Survey/Housing Vacancy Survey (HVS), and the American
Community Survey (ACS). In the 2010 Census, the gross vacancy rate was 11.4 percent, while
the 2010 ACS one-year estimate was 13.1 percent. These results show that the decennial census
has continually understated the vacancy rate relative to other benchmarks. This provides macro-
level support for our AR vacant assignment. The higher-than-expected rate of AR vacant cases
that were occupied in the 2016 Census Test analysis sample may be perpetuating this trend.
Figure 2. Comparison of Gross Vacancy Rates, 1990 to 2010
Source: Figure 1 of Cresce (2012)
3.3 Retrospective Evaluations of Quality using the 2010 Census
This section describes a retrospective evaluation of quality by applying our distance function
approach to the 2010 Census. For this analysis, we determined about 10 percent of the addresses
to be administrative record vacant and about 15 percent of the addresses to be administrative
record occupied. For the about 10 percent of the NRFU eligible cases determined to be
administrative record vacant, Table 11 shows the comparison of occupancy status of the
administrative record cases to the 2010 Census NRFU outcomes. The table shows that 80
percent of the cases were both vacant in our determination and the Census NRFU outcome.

22
There is 10 percent of the cases for which the Census result was occupied. The first thought was
that this could be a potential source of undercounts. In assessing this result, Cresce (2012)
documents that the gross vacancy rates from the Housing Unit Vacancy Survey was higher than
the 1990, 2000, and 2010 Census results. This indicates that the Decennial census has had a
trend of understating the number of vacant addresses. Also, to potentially minimize
undercoverage, the NRFU contact strategy shown in Section 2.3 includes an additional mailing
during the Nonresponse Followup operation. This provides another opportunity for people that
should be enumerated at these addresses to respond without being visited by an enumerator.
Table 11. 2010 Census NRFU Status Outcomes for Administrative Record Vacant Cases
2010 Census NRFU Outcome Percent
Occupied 10.4
Vacant 79.8
Non-Existent 9.8
For the about 15 percent of the NRFU eligible cases determined to administrative record
occupied, Table 12 shows the comparison of the occupancy status of the administrative cases to
the 2010 Census NRFU outcomes. The table shows that 89.9 percent of the time, the
administrative records and NRFU interview determined that the address was occupied. There
were 10 percent that were either vacant or determined to not exist. One part of the design that
addresses this finding is that the NRFU contact strategy does conduct one field visit for these
cases. This field visit does allow the enumerator to determine that these cases are vacant or are
non-existent (deletes).
Table 12. 2010 Census NRFU Status Outcomes for Administrative Record Occupied Cases
2010 Census NRFU Outcome Percent
Occupied 89.9
Vacant 8.4
Non-Existent 1.6
For the administrative record occupied cases, we also compared the population count based on
the administrative record roster to the Census result. Table 13 shows that the population count
agreed 62.1 percent of the time. For 22.3 percent of the cases, the administrative record count
was higher than the census result. For 15.7 percent, the administrative record count was lower
than the census count. Census results that were vacant or non-existent had a population count of
zero for these comparisons. These results show that when the counts differ that the
administrative record counts were higher more often.
Table 13. Count Agreement for Administrative Record Occupied Cases
Count agreement Percent
AR count higher 22.3
Same count 62.1
AR count lower 15.7
Another comparison for housing units that could be enumerated based on rosters determined
from administrative records is the availability of characteristics. During the enumeration, the
respondent is asked to provide sex, race, Hispanic origin, relationship, age, date of birth, and

23
tenure of the housing unit. Our research has focused on the availability of age, sex, race, and
Hispanic Origin in administrative records or third-party sources.
Table 14 summarizes the ability to assign these characteristics. Based on the requirement that all
roster people need to have age available, age was available 100 percent of the time. Sex was
available almost 100 percent of the time as well. Both of these were obtained from the SSA
Numident file. Combined race and Hispanic origin was able to be assigned 89.8 percent of the
time at the person level. This assignment was based on being able to assign a person to being
Hispanic, or if not Hispanic, race was based on being able to assign someone to one of the six
race categories alone or being two or more races. For the persons who could not be assigned a
race or Hispanic origin, it was most often the case that these persons were at an address where
the information was available for someone else in the household. For example, we have the race
and Hispanic origin for the adults in the household, but not the children.
Table 14. Characteristic Availability for Administrative Record Occupied Cases
Characteristic Availability Percent
Age 100.0
Sex 100.0
2010 Combined Race and Hispanic Origin 89.8
Another method of assessing the quality is to examine the extent of administrative records usage
by different geographic areas. Here, we consider areas defined by concentrations of Hispanic and
Non-Hispanic Black populations based on the 5-year ACS block group estimates. Table 15
shows the number of 2010 NRFU addresses by concentrations of the Hispanic population in the
block group. The table also shows the percent of NRFU cases that were assigned the AR
occupied and vacant determinations by concentrations of the Hispanic population. We see that
areas with higher Hispanic concentrations have lower rates of AR occupied and vacant
determinations. Thus, these areas have a higher rate of cases that receive the full contact strategy.
Table 15. 2010 Administrative Records Usage by Hispanic Population Concentration
ACS 5-Year Estimate of Percent
of Block Group that is Hispanic
2010 NRFU
Addresses
(millions)
AR Determination (row percent)
AR Vacant
(%)
AR Occupied
(%)
Full Contacts
(%)
0 to 10 percent 31.3 11.6 15.9 72.5
10 to 20 percent 6.8 9.4 15.7 74.9
20 to 30 percent 3.6 8.5 14.4 77.1
30 to 40 percent 2.2 7.6 13.3 79.1
40 to 50 percent 1.6 7.5 12.0 80.5
50+ percent 4.2 4.3 9.6 86.1
Total 49.8 10.1 15.0 74.9
Table 16 repeats this analysis for the Non-Hispanic Black population. As with the Hispanic
concentrations, we generally see lower rates of AR usage in areas with higher Non-Hispanic
Black concentrations. However, we do see a higher rate of AR vacant assignment in the areas
where the Non-Hispanic Black population is estimated to be 50 percent or more of the
population total. This result along with results from the mid-decade tests discussed in the next

24
sections have led us to update the NRFU contact strategy for cases with AR determinations that
will be shown in the next section..
Table 16. 2010 Administrative Records Usage by Non-Hispanic Black Population Concentration
ACS 5-Year Estimate of Percent of
Block Group that is Non-Hispanic Black
2010 NRFU
Addresses
(millions)
AR Determination (row percent)
AR Vacant
(%)
AR Occupied
(%)
Full Contacts
(%)
0 to 10 percent 33.6 10.5 16.0 73.5
10 to 20 percent 5.4 8.2 15.6 76.2
20 to 30 percent 2.9 8.1 14.1 77.8
30 to 40 percent 1.8 8.3 13.0 78.7
40 to 50 percent 1.2 8.9 11.9 79.2
50+ percent 4.9 12.1 9.6 78.3
Total 49.8 10.1 15.0 74.9
4. Change in Contact Strategy for the 2018 End-to-End Test
Based on the research and results of the 2015 and 2016 Census Tests, we have modified the AR
usage and contact strategy in the NRFU operation for the 2018 End-to-End Test. As previously
mentioned, we included an additional mailing in the 2016 Census Test for addresses with AR
determinations. While the addresses received no more contacts, this mailing allowed any
residents of the addresses another opportunity to self-respond. This was added to the 2016
Census Test to help address concerns about missing occupied housing units.
Figure 3 shows the change in the contact strategy for the 2018 End-to-End Test. For cases
initially determined to be AR occupied, vacant, or delete, we will use the UAA information from
the USPS on the additional mailing to make a final determination. For AR vacant and delete
cases, only those addresses for which the additional mailing is returned as UAA will receive the
AR determination. If the postal carrier is able to deliver the additional mailing, then the address
will be added back to the NRFU field workload and receive the full contact strategy of
enumerator visits. For AR occupied cases, if the additional mailing is returned as UAA, then we
will add the address back into the NRFU field workload. If the additional mailing was able to be
delivered and we do not receive a self response, then AR will be used to resolve the address as
occupied.

25
Figure 3. Contact Strategy for the 2018 End-to-End Test
5. Summary
This paper provides details of the AR modeling methodology to determine occupied, vacant, and
non-existent addresses that can receive fewer contact during the NRFU operation. Our
methodology uses predictive models based on relationships observed in 2010 between census
outcomes and administrative records and third-party data. These methods allow us to have a
continuous measure that facilitates workload reduction based on analysis of cost and quality.
This paper provided results on the use of AR in the 2015 and 2016 Census Tests. We described
how the results from these tests have influenced the evolution of our methodology, ultimately
leading to the contact strategy for the 2018 End-to-End Test. This design change uses the UAA
information for an additional mailing sent in May to inform which of these cases will receive the
AR treatment and which cases will be reintroduced into the NRFU field workload. This new
requirement based on the results of the additional mailing will help guard against
misclassification error for the AR determinations.
We also included in this analysis where we nationally set a cutoff that determined 10 percent of
NRFU to be administrative record vacant and 15 percent to be administrative record occupied.
In order to show potential subnational implications, we included how those determinations were
distributed by the percent of Hispanic and the percent of Non-Hispanic Black population in the
tract. For the Hispanic concentrations, we see that using one distance function for the entire
county shows decreasing AR determinations as the concentration increases. For the Non-
Hispanic Black concentrations, we see similar results for AR occupied. For the AR vacant units,
we see that 12 percent of the addresses in tracts with 50 percent or more concentration of Non-

26
Hispanic Black population would be classified as vacant. This large amount could lead to
potential net undercoverage if these units were occupied on Census Day. The proposed 2018
contact strategy helps guard against this by requiring UAA determination on both Census Day
and the about 6 weeks later during the start of the NRFU operation.
6. Discussion Questions
1. What are your reactions and suggestions for the current algorithm to identify occupied,
vacant and non-existent addresses?
2. What is your reaction to the changes in the contact strategy to be used in the 2018 End-
to-End Test?
7. References
Clark, B. Mule, T., Keller, A., and Konicki, S. (2016). “Final Report on the Administrative
Record Usage in the 2015 Census Test.” U.S. Census Bureau.
Collins, G., Mallett, S., Omar, O. and Yu, L. (2011) “Developing risk prediction models for type
2 diabetes: a systematic review of methodology and reporting” BMC Medicine.
Cresce. A (2012), “Evaluation of Gross Vacancy Rates From the 2010 Census Versus Current
Surveys: Early Findings from Comparisons with the 2010 Census and the 2010 ACS 1-
Year Estimates” Federal Committee on Statistical Methodology Research Conference
Keller, A. (2016). “Imputation Research for the 2010 Census,” Statistical Journal of the
International Association of Official Statistics, 32 (2016): 189-198.
Keller, A., Fox, T., and Mule, V.T. (2016). “Analysis of Administrative Record Usage for
Nonresponse Followup in the 2014 Census Test.” U.S. Census Bureau.
Kjeldgaard, I. and Konicki, S. (2017). “Results of Administrative Record Use in the 2016 Census
Test.” U.S. Census Bureau.
Layne, M., Wagner, D. and Rothhaas (2014), “Estimating Record Linkage False Match Rate for
the Person Identification Validation System” CARRA Working Paper #2014-02
Morris, D.S. (2014), “A Comparison of Methodologies for Classification of
Administrative Records Quality for Census Enumeration,” in JSM Proceedings, Survey
Research Methods Section. Alexandria, VA: American Statistical Association. 1729-
1743.
Morris, D.S., Keller, A., and Clark B. (2016). “An Approach for Using Administrative Records
to Reduce Contacts in the 2020 Census,” Statistical Journal of the International

27
Association of Official Statistics, 32 (2016): 177-188.
Mule, V.T. and Keller, A. (2014), “Using Administrative Records to Reduce
Nonresponse Followup Operations,” in JSM Proceedings, Survey Research Methods
Section. Alexandria, VA: American Statistical Association. 3601-3608.
Mule, V.T., Keller, A., Konicki, S. and Kjeldgaard, I. (2017 upcoming), “The Use of
Administrative Records To Reduce Costs in the 2020 Decennial Nonresponse Followup
Operation” Presented at the 2016 Federal Committee on Statistical Methodology Policy
Conference.
U.S. Census Bureau (2015). 2020 Census Operational Plan. Washington DC: Census Bureau.
Available at: http://www2.census.gov/programs-surveys/decennial/2020/program-
management/planning-docs/2020-oper-plan.pdf. (accessed March 2016).
Walejko, G., Keller, A., Dusch, G., and Miller, P.V. (2014). “2020 Research and Testing: 2013
Census Test Assessment.” U.S. Census Bureau.
Walker, S., Winder, S., Jackson, G., and Heimel, S. (2012). “2010 Census Nonresponse
Followup Operations Assessment,” 2010 Census Planning Memoranda Series, No. 190,
April 30, 2012.

A1
Attachment A. Covariates for Administrative Record Models
Variable Unoccupied Model Person-Place HH Composition
% of block group… age 25-44 X X
age 65+ X X X
black X X X
hispanic X X X
related family X X X
other language X X X
mobile home X X X
married X X X
rental X X X
vacant X X
occupied X
in poverty X X X
# of neighbors in NRFU X
USPS UAA reason (first two mailings) X X X
USPS UAA reason agreement - Kappa Coefficient X
housing unit type (e.g. multi-family) X X X
within structure description X
has Delivery Sequence File "X" status and both neighbors are in NRFU X
on fall Delivery Sequence File of 2015 X X X
apartment with a UTF UAA reason code on first mailing X
>= 1 person in HU is… white X
black X X
hispanic X
missing ethnicity X
age < 2 X X
age <10 X X
age 10-17 X X
age 18-24 X
age 25-44 X
age 65+ X X
AR HH count X
AR HH composition X X X
Unit had IRS 1040 TY 2014 persons, but no AR persons in current year X
>= 1 person in HU is IRS 1040 TY 2015 X X
placed at this HU according to… IRS 1099 X X
IHS X
Medicare X
VSGI X X
IRS 1040 TY 2014 X X
>= 1 person in HU is IRS 1040 X X
placed in another HU according to… IRS1099 X X
Medicare X
VSGI X
Person is placed in this HU according to… IRS 1040 TY 2015 X
IRS 1099 X
IHS X
Medicare X
VSGI X
IRS 1040 TY 2014 X
Person is placed at another HU according to… IRS 1040 X
IRS1099 X
IHS X
Medicare X
VSGI X
Occupied Models
Housing Unit Level Administrative Record Source Information
Person Level Administrative Record Source Information
ACS Block Group Level Variables
Housing Unit Characteristics
Housing Unit Characteristics from Administrative Records

B1
Attachment B. Research of the CARRA Kidlink File for Administrative Records Modeling
In this attachment, we summarize our research for incorporating data from the CARRA Kidlink
file into the AR modeling process. Section 2 of this document outlined the methodology for
determining and enumerating occupied addresses using AR and other data. The core AR sources
used to create household rosters were:
IRS 1040 Individual Tax Returns
IRS 1099 Informational Returns
CMS Medicare Enrollment Database
IHS Patient Registration File
While children can appear on any of these sources, the vast majority of children are found only
on the IRS 1040 file. IRS 1099 information returns include records such as bank account interest
statements and W-2 wage statements. These are person-level records. Therefore, if we identify
a unit as AR occupied based on the adult(s) from 1099 returns without a 1040 filing, there is the
possibility that our AR roster is missing other persons in the unit, especially children.
The CARRA Kidlink file is a research file produced by the Center for Administrative Records
Research and Applications (CARRA) at the Census Bureau. The purpose of this file was to
create a parent-child relationship dataset using Social Security data from the Census Numident.
For each child on the Numident, CARRA attempted to assign a mother Protected Identification
Key (PIK) and father PIK using the names of the parents on the Numident. The parent names
usually come from Social Security Number applications. Note that social security numbers were
not available for the parent records. Therefore, while each child record has a PIK based on the
child’s social security number, not all parent records are assigned a PIK. There may also be
errors in the parent PIK assignment.
An issue with the CARRA Kidlink file is that it does not provide address information; the file
only provides the child PIK and the PIKs of the parents, if they could be assigned. To place
children from the CARRA Kidlink file in MAFIDs, we added the child to the AR roster for each
of the units in which either the mother or the father appeared. This is a very liberal use of the
information. If the mother and father appear in AR at separate units, then we added the child to
each of these units. Similarly, if a parent appeared in multiple units in AR, then we added the
child to each of those units.
We consider two methods for using the CARRA Kidlink file in the administrative records
modeling process.
1. Using CARRA Kidlink to build AR rosters from the beginning
In this first approach, we used the CARRA Kidlink file to supplement the core AR sources when
building the AR rosters on which to train and apply the models. The occupied models were fit
using these rosters with CARRA Kidlink persons. Analogous variables for “on Kidlink” and “on
Kidlink elsewhere” were added to the models to note the presence of children on CARRA
Kidlink at the given address and also at other addresses. Only units that had between 1 and 6
people and had a valid household composition were eligible for AR occupied identification. The
valid household compositions are 1 to 3 adults, with or without children.

B2
The following tables compare quality metrics between the baseline approach (as described in
Section 2) and the approach that includes children from the CARRA Kidlink file. Note that the
set of addresses selected as AR occupied may differ between the two approaches. Table B1
shows that the address status outcomes are nearly the same for the two approaches. Table B2
shows that the count agreement rate is about the same for the two approaches, and the approach
with the CARRA Kidlink file has a slightly higher rate of cases with a higher count in AR than
the census.
Table B1: Status Agreement for Administrative Record Occupied Cases using CARRA Kidlink
in the Model Training
2010 Census NRFU Outcome
Baseline
(%)
With Kidlink
(%)
Occupied 89.9 89.7
Vacant 8.4 8.6
Non-Existent 1.6 1.6
Table B2: Count Agreement for Administrative Record Occupied Cases using CARRA Kidlink
in the Model Training
Count Agreement
Baseline
(%)
With Kidlink
(%)
AR count higher 22.3 23.6
Same count 62.1 62.5
AR count lower 15.7 13.9
2. Adding CARRA Kidlink children to rosters after the AR occupied identification
For this approach, we conducted the AR modeling as in the baseline approach, without any
additional information from the CARRA Kidlink file. This identifies a set of AR occupied units.
We then added any additional children from the CARRA Kidlink file to these AR occupied units.
If any of the AR persons in a unit are listed as a mother or father on the CARRA Kidlink file,
then we added all the children from CARRA Kidlink to that unit. For this initial research, we did
not place any restrictions on how many children could be added to a unit. Therefore, there are
many units that met the household size and composition criteria for AR occupied identification
before adding children from CARRA Kidlink, but then did not meet these criteria after the
children were added. For this analysis, we still allowed such units to be identified as AR
occupied.
Table B3 shows the count agreement rate for the AR occupied units. After adding children to the
AR occupied units, we see an even higher rate of case with a higher AR count than census count.
Table B3: Count Agreement for Administrative Record Occupied Cases using CARRA Kidlink
after the Occupied Identification
Count Agreement
Baseline
(%)
With Kidlink
(%)
AR count higher 22.3 25.6
Same count 62.1 61.2
AR count lower 15.7 13.2

C1
Attachment C. Research of the American Community Survey for Model Training
The body of this report described the methodology for using predictive models to assign NRFU
outcomes using AR. The AR models were estimated using 2010 Census responses and
contemporaneous AR for training. This attachment summarizes research of using the American
Community Survey (ACS) for training the predictive models. The ACS provides an independent
training module for AR models. The ACS will be more a more current for the 2020 Census and
will allow for the incorporation of new administrative records sources into modeling. Drawbacks
of ACS include the smaller sample size, a lack of detailed UAA codes, and the year-round
sampling, which is less targeted for the April 1 reference date.
We constructed a training dataset using the 2014 ACS responses, analogous to the training
dataset using 2010 Census responses discussed in the body of this report. The 2015 Census Test
data were used for evaluation. Contemporaneous administrative records as well as neighborhood
and address information were used in all three datasets.
The Person-Place model and Household Composition models were estimated using the 2014
ACS responses, and the model parameters were applied to the 2015 Census Test data. Using the
same Euclidean distance function, the AR occupied units were determined. We did not estimate
the vacancy model using the ACS data. The UAA reasons are the most significant predictor of
vacancy, and these detailed reasons are not available for the ACS sample addresses.
Furthermore, the reference period for the ACS is the date that a response is obtained, regardless
of the month chosen for the sampling frame. Therefore, the UAA indications for the ACS
mailings are for one point in time, but the followup operations to determine vacant addresses
refer to a different point in time a few months later. This differs from the decennial census where
all data collection is conducted with an April 1 reference date. For these reasons, our evaluation
was limited to the AR occupied methodology.
A comparison of model predictions for the ACS trained and 2010 Census trained models found
overall similarity in the accuracy of predictions for count and household composition when
evaluated on the 2015 Census Test control panel. Table C1 shows that the ACS training sample
matched the NRFU responses in count with a rate of 58.2 percent compared to 56.6 percent for
2010 Census training. Likewise, for household composition, the respective rates are 54.4 and
54.0 percent. The mixed approach, which uses 2010 Census to evaluate vacancy, minimizes the
impact of not having detailed UAA codes and the different reference period in the ACS.
Training Data
Household
Composition
Match
(%)
Household
Count Match
(%)
2010 Census 54.0 56.6
American Community Survey 54.4 58.2
Additional analyses restricted that ACS training dataset to only those addresses in Arizona
(where the 2015 Census Test was located) as well as to ACS cases completed only during a
given month (as opposed to the whole year sample for 2014). The accuracy in terms of
household composition and count match did not appear to be especially sensitive to these
restrictions in the ACS training data.