administrative performance and process improvement ... · pdf file• um must expand these...
TRANSCRIPT

OPEN – GB – INFO 5-3December 7-8, 2017
Administrative Performance and Process Improvement Assessment
Related to RFP #31018
-- Final Report --November 29, 2017

OPEN – GB – INFO 5-4 December 7-8, 2017
Table of Contents
Section Page
1. Executive Summary 5 – 15
2. Summary of Workstream Findings 16 – 24
3. Facilities Workstream 25 – 41
4. Finance and Supply Chain Workstream 42 – 72
5. Human Resources Workstream 73 – 100
6. Information Technology Workstream 101 – 117
7. Sustainability and Operating Model 118 – 123
8. Implementation Timelines 124 – 158
Appendix 159 – 161

OPEN – GB – INFO 5-5December 7-8, 2017
1. Executive Summary

OPEN – GB – INFO 5-6 December 7-8, 2017
Assessment ContextExecutive Summary Summary Findings Facilities Finance Human Resources IT Sustainability and
Operating ModelImplementation
Timeline
• The University of Missouri’s four campuses and System Administration addressed a budget shortfall of $62M in FY18
• The two primary traditional revenue sources (1) State Appropriations (2) Net tuition and student fees are expected to be limited over the next five years
State Appropriations
$170
$394 $384 $332
$273 $272 $266 $261 $248 $244
$- $50
$100 $150 $200 $250 $300 $350 $400 $450
Per Capita FY2016 State Appropriations for Higher Ed
• The state of Missouri’s Higher Ed appropriation amount on a per capital basis ranks 46th across the nation at $170, the national average is $244
• State appropriations have fallen from 62% of total revenues in 2000 to 35% in 2016
• Moody’s projects lower state appropriations nationally due to competing priorities
• Moody’s projects the State of Missouri revenues to drop by 7% over the upcoming five years
Note: Budget shortfall projection from June 2017 Budget Presentation; Public University Tuition Increases per Moody’s Investor Services – Universities Face Another Year of Low Net Tuition Revenue Growth, November 2016; State of Missouri Revenue Outlook per Moody’s Investor Services August 2017 Rating report

OPEN – GB – INFO 5-7 December 7-8, 2017
Assessment ContextExecutive Summary Summary Findings Facilities Finance Human Resources IT Sustainability and
Operating ModelImplementation
Timeline
• The University of Missouri’s four campuses and System Administration addressed a budget shortfall of $62M in FY18
• The two primary traditional revenue sources (1) State Appropriations (2) Net tuition and student fees are expected to be limited over the next five years
• “Subdued growth underscores a heightened focus on freezing or limiting tuition increases coupled with a highly competitive environment” – Moody’s
• “The Midwest, confronted with a declining number of high school graduates, faces the greatest amount of pressure with over 61% of survey respondents reporting decreasing enrollment in fall of 2017” –Moody’s
0%1%2%3%4%5%6%7%8%9%
10%
2012 2013 2014 2015 2016 (est) 2017 (proj)
Public University Tuition Increases
Total Comprehensive Public University
Moderate-sized Public University Small Public UniversityNote: Budget shortfall projection from June 2017 Budget Presentation; Public University Tuition Increases per Moody’s Investor Services – Universities Face Another Year of Low Net Tuition Revenue Growth, November 2016
Net Tuition and Student Fees

OPEN – GB – INFO 5-8 December 7-8, 2017
Assessment ContextExecutive Summary Summary Findings Facilities Finance Human Resources IT Sustainability and
Operating ModelImplementation
Timeline
• Revenue growth is not a viable path to a healthy bottom-line
• In order to balance the budget and make strategic reinvestments, UM has commissioned this report to identify potential cost savings opportunities at MU and the UM System Office and MU that may be implemented to improve the university‘s overall financial health
• UM must expand these findings to all campuses in order to capture additional operational benefits
• This report is the first step in a multi-year transformation to create operational efficiency and excellence
• Through this work, it has become clear that the operating model will need to be transformed in order to improve operational effectiveness and to generate and sustain savings

OPEN – GB – INFO 5-9 December 7-8, 2017
Assessment OverviewThis document represents the findings related to the University of Missouri’s “RFP #31018 -- Consulting services for
identification of administrative performance and process improvement opportunities”
Scope• UM System central office and
MU campus• Facilities, Finance, Human
Resources and Information Technology at the UM system central office and MU campus have been analyzed
• Findings that expand beyond UM System and MU campus are noted accordingly
Approach• Based on Fiscal Year 2017 data• For those changes that already occurred
in FY18, findings have been adjusted• Performed over 70 interviews with key
leaders and stakeholders (details p.8)• Over eight weeks the four teams
collaborated to identify and quantify opportunities
• Many opportunities will require robust planning to ensure successful execution
Limitations• Opportunities were based on
currently available data and assumptions reviewed by UM leads
• Findings, while based on best available data, are directional and shouldn’t be taken as final as they will be refined during future stages of work
• Applicability of opportunities to other campuses will require further study
Executive Summary Summary Findings Facilities Finance Human Resources IT Sustainability and Operating Model
Implementation Timeline

OPEN – GB – INFO 5-10 December 7-8, 2017
Information Gathering Process• This assessment included an analysis of primary data sets such as the general ledger, payroll and accounts
payables
• Each workstream also collected data and information to develop an understanding of operations within each functional area
• To supplement this dataset over 70 stakeholder interviews were performed to further identify and refine improvement opportunities
• Additional engagement is being planned at UMKC, UMSL and S&T
Executive Summary Summary Findings Facilities Finance Human Resources IT Sustainability and Operating Model
Implementation Timeline
University of Missouri Stakeholder Input by Workstream
UM System
Columbia UMKC UMSL S&T Total
Faculty and Staff Representation 3 4 1 1 1 9
Facilities 3 5 8
Information Technology 10 2 12
Engagement Leadership and Communications 10 7 1 19
Finance 5 2 1 1 1 10
Human Resources 6 3 9
Supply Chain 6 6
Total: 43 23 3 2 2 72
OPEN – GB – INFO 5-11 December 7-8, 2017
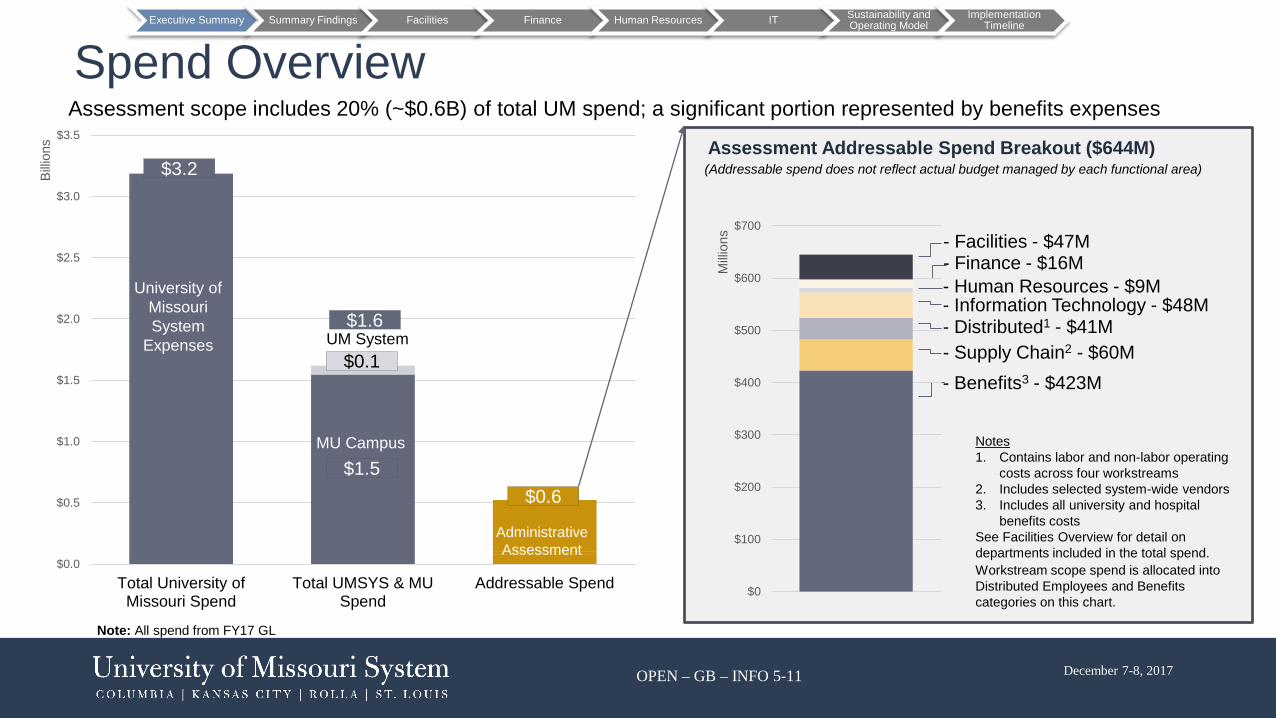
Spend Overview
$0.0
$0.5
$1.0
$1.5
$2.0
$2.5
$3.0
$3.5
Total University ofMissouri Spend
Total UMSYS & MUSpend
Addressable Spend
Billio
ns
University of Missouri System
Expenses
MU Campus
Note: All spend from FY17 GL
Administrative Assessment
Assessment scope includes 20% (~$0.6B) of total UM spend; a significant portion represented by benefits expenses
Assessment Addressable Spend Breakout ($644M)
- Facilities - $47M - Finance - $16M - Human Resources - $9M - Information Technology - $48M - Distributed1 - $41M - Supply Chain2 - $60M - Benefits3 - $423M
Notes1. Contains labor and non-labor operating
costs across four workstreams2. Includes selected system-wide vendors3. Includes all university and hospital
benefits costsSee Facilities Overview for detail on departments included in the total spend.Workstream scope spend is allocated into Distributed Employees and Benefits categories on this chart.
$3.2
$1.6
$1.5
UM System$0.1
$0.6
(Addressable spend does not reflect actual budget managed by each functional area)
Executive Summary Summary Findings Facilities Finance Human Resources IT Sustainability and Operating Model
Implementation Timeline
$0
$100
$200
$300
$400
$500
$600
$700
Milli
ons

OPEN – GB – INFO 5-12 December 7-8, 2017
Decision Rights& Norms
Information & Data Structure Change
Management• Solutions to operational
issues are generally known, but coming to agreement on how to implement is a challenge
• Sustainability of changes unwinds due to lack of accountability, metrics and oversight
• Near-term budgetaryconstraints have hindered long-term strategic planning
• Executive decision making not always informed by robust and timely data
• Few leaders have access to information across organizational boundaries
• Multiple instances of key systems diminishes integrity and utility of data
• Campus independence overrides “systemness”
• Inefficiencies have been created by distributed roles and accountability across system, campuses, and divisions
• Similar administrative functions and processes exist across campuses and between departments
• Recognition that the status quo is unsustainable
• An atmosphere of uncertainty and desire for transparency exists
• Communication and alignment across the university, including faculty and staff, will be a key to success
ObservationsBased on the information gathered through interviews and data analysis, several observations are noteworthy and possibly explain the challenges to date in optimizing administrative operations. Consideration of these observations is needed when advancing forward with implementation
Executive Summary Summary Findings Facilities Finance Human Resources IT Sustainability and Operating Model
Implementation Timeline
OPEN – GB – INFO 5-13 December 7-8, 2017
Keys to SuccessExecutive Summary Summary Findings Facilities Finance Human Resources IT Sustainability and
Operating ModelImplementation
Timeline
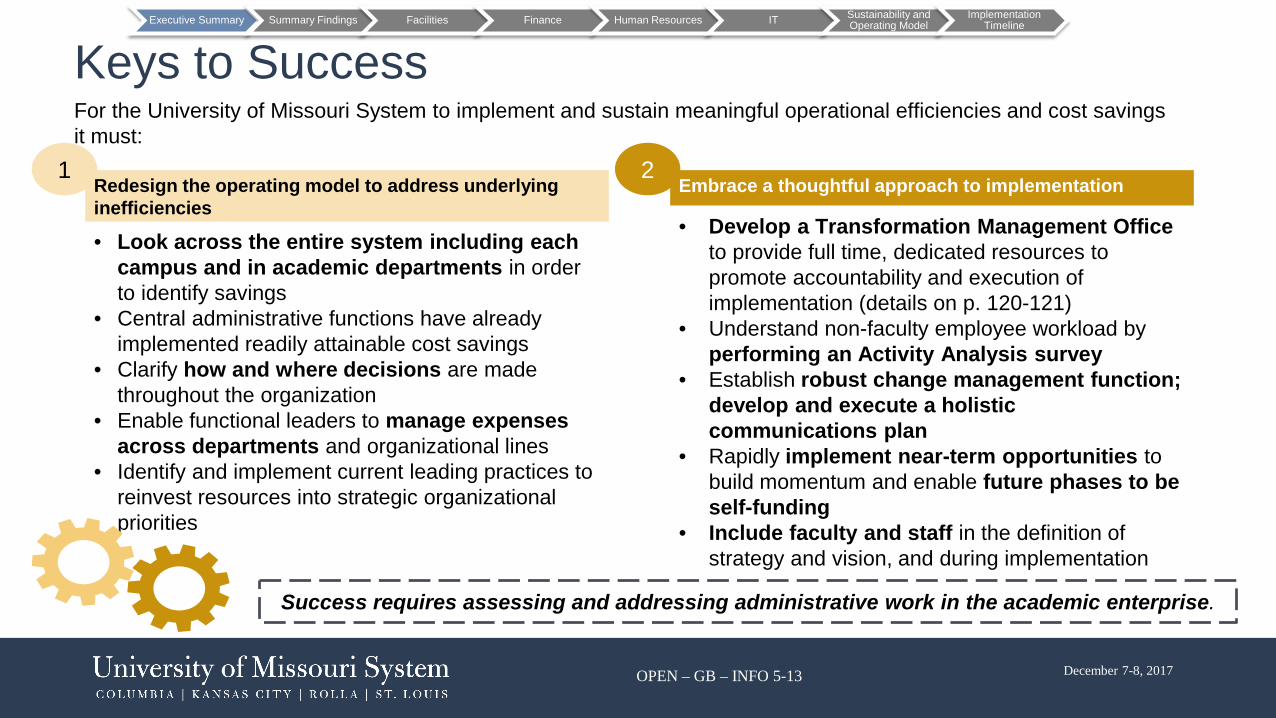
For the University of Missouri System to implement and sustain meaningful operational efficiencies and cost savings it must:
Redesign the operating model to address underlying inefficiencies
• Look across the entire system including each campus and in academic departments in order to identify savings
• Central administrative functions have already implemented readily attainable cost savings
• Clarify how and where decisions are made throughout the organization
• Enable functional leaders to manage expenses across departments and organizational lines
• Identify and implement current leading practices to reinvest resources into strategic organizational priorities
1Embrace a thoughtful approach to implementation
• Develop a Transformation Management Officeto provide full time, dedicated resources to promote accountability and execution of implementation (details on p. 120-121)
• Understand non-faculty employee workload by performing an Activity Analysis survey
• Establish robust change management function; develop and execute a holistic communications plan
• Rapidly implement near-term opportunities to build momentum and enable future phases to be self-funding
• Include faculty and staff in the definition of strategy and vision, and during implementation
2
Success requires assessing and addressing administrative work in the academic enterprise.

OPEN – GB – INFO 5-14 December 7-8, 2017
Workstream1 # of Opportunities4
Calendar Year Benefit ($M) – “Low” Estimate
2018 2019 2020
Facilities2 6 $1.2 $1.5 $6.8Finance 6 $4.4 $8.8 $8.8Human Resources3 2 $2.2 $3.3 $3.3Information Technology 6 $1.7 $2.6 $4.2Supply Chain 4 $3.7 $3.7 $3.7Total Administrative Efficiency 24 $13.2 $19.9 $26.8Benefits5 * - $17.5 $17.5TOTAL 24 $13.2 $37.4 $44.3
Summary of Financial Opportunities$44.3M of net financial impact identified out of $644M in total addressable spend (7%)$26.8M of net financial impact identified out of $221M in non-benefits spend (12%)
Notes:1 Indicates opportunities are net of non-capital investments2 Facilities includes cost savings and revenue enhancement opportunities3 HR includes administrative staff opportunity 4 Some opportunities have been scaled to multiple campuses to realize the benefit amount stated; details are provided within the workstream specific section5 Benefits opportunities encompass several potential changes to health and welfare plans. Any plan changes should be vetted by the Total Rewards Advisory Committee and consider the impact on recruitment and retention as a part of a comprehensive total rewards package.
Executive Summary Summary Findings Facilities Finance Human Resources IT Sustainability and Operating Model
Implementation Timeline

OPEN – GB – INFO 5-15 December 7-8, 2017
Summary of Required Investments
WorkstreamInvestment Type and Description
Description One-Time Operating
Annual Operating Capital
FacilitiesSpace rationalization of real estate portfolio will require a capital outlay for furniture, fixtures, equipment, move costs, and reconfiguration / renovation of space. Reducing 3rd party leasing will require investment to relocate functions to new locations.
- - $13.7M
Finance
Expected financial investment is low, around 5 FTEs. Most of the needed investment is around people –training for talent development, communication, team building and responding to feedback. There is potential one time operating investment to reflect process changes in system(s) from consolidating functions and increasing accountability.
- $500K -
Human Resources
Required investment of 30 to 50 additional FTEs in critical HR capabilities that are currently understaffed. There will also be an investment of time from HR leadership and impacted stakeholders to implement these opportunities.
- $2.6 - $4.2M -
Information Technology
The primary investment for IT is labor for implementation projects. There is a potential for minor phone or computer equipment investment if current systems can’t be reused or require expansion. $900K $670K $175K
Supply Chain No financial investment has been noted - - -
TOTAL $900k $3.8 - $5.4M $13.9M
UM will need to make key strategic investments to achieve the benefits and savings of the opportunities. Certain investments below are the reallocation of resources into different functional groups. All cost savings on previous page were net of these operating investments.
Investments noted below are approximate and will be refined during the planning phase
Executive Summary Summary Findings Facilities Finance Human Resources IT Sustainability and Operating Model
Implementation Timeline
Note: Most investments require further data in order to calculate, however they are not expected to compose a large percentage of the total calculated financial opportunitiesThe opportunities for these workstreams are net of non-capital investments (these investments have already been incorporated)

OPEN – GB – INFO 5-16December 7-8, 2017
2. Summary of Workstream Findings

OPEN – GB – INFO 5-17 December 7-8, 2017
Purpose
High level assessment to determine direction and approximate magnitude of savings opportunities
Assess current state of operations and determine relevance of findings across other campuses
Design future state operating model and construct how the university will perform administrative functions
Execute changes to operations, measure and improve as appropriate
Activities
• Identify potential improvement opportunities
• Quantify approximate magnitude of benefits
• Identify and plan to address further data needs
• High level opportunities development
• Assess operations from campuses excluded from initial assessment
• Determine applicability of current findings and relevance of potential opportunities
• Improve quality and depth of data• Perform activity analysis workload
survey
• Collaborative, cross campus and functional area design sessions
• Development of and iteration on future state design
• Redesign policies, procedures and processes around future design
• Develop new service level agreement and incentives
• Implement changes from design phase
• Pilot opportunities (as deemed appropriate)
• Test, refine and improve
Outputs
• List of recommendations• Go forward strategy • Understanding of additional data
needs
• Refinement of opportunities across the system
• Completed activity analysis workload survey
• Recommended future state design with cost benefit analysis completed including investments needed
• Implemented, tested and refined new set of operating norms
• Improved operating model
Transformation Timeframe
“We Are Here”
This assessment report is the next phase of a multi-phased transformation to coordinate efforts currently underway at the campus level; further analysis and input will be incorporated before changes to the university’s operations are implemented
ImplementationFY 2019
Design(Apr-Jun)
Expanded Assessment(Jan-Mar)
Initial Assessment1 2 3 4
Executive Summary Summary Findings Facilities Finance Human Resources IT Sustainability and Operating Model
Implementation Timeline

OPEN – GB – INFO 5-18 December 7-8, 2017
$4.23 M&R
Projects16%
$2.82 Landscape Services10%
$16.92 Facility
Operations63%
$2.35Campus Facilities
9%
$0.47 Space
Planning2%
$9.40 Parking & Transportation
Svcs47%
$10.81 Plan, Design & Construction
53%
Facilities Area Overview
Opportunities identified as part of preliminary analysis
Additional opportunities to be evaluated
Executive Summary Summary Findings Facilities Finance Human Resources IT Sustainability and Operating Model
Implementation Timeline
Key Recommendations• Execute space utilization and rationalization opportunities• Optimize lease portfolio to reduce operating costs• Optimize operating costs and generate capital through partnerships
and monetization opportunities
Facilities Spend* - $47M
Note: Spend represents net or gross departmental expense depending on charge-backsAnnual benefits are net of non-capital investments
*Facilities spend includes select spend from certain Operations, Auxiliary and other areas, based on discussion with the Facilities Department leads. Does not represent Facilities department budget only.
Opportunity Implementation Duration Implementation Risk
1 Real Property Operating Model Realignment Two Year 4
2 Real Property Rationalization (Owned and Leased Space) Two Year* 4
3 Rationalize Landscaping Scope Near-Term 2
Opportunity Implementation Duration Implementation Risk
4 Monetize Excess and/or Underutilized Real Property Assets Two Year* 4
5 Identify Public-Private Partnership Opportunities Two Year 3
6 Review Staffing Model Efficiency Two Year 4
The Facilities workstream has identified $6.8M to $13.6M in net annual benefits
Facilities E&G Spend$27M
Auxiliary Spend$20M
*Implementation of certain opportunities can be achieved in two years others are expected to have a longer lead time
Example Action: Ending a lease to occupy underutilized space.

OPEN – GB – INFO 5-19 December 7-8, 2017
Finance Area OverviewIn Scope Finance Spend - $34M*
(Excludes other campuses)
Salaries and Wages, $11.4,
34%
Staff Benefits, $3.8, 11%
Distributed Salaries and
Wages, $10.7, 31%
Distributed Benefits, $3.4,
10%
Supplies, Services and Other Operating Expenses, $4.7,
14%
Opportunity Implementation Duration Implementation Risk
1 Design Future Operating Model (Align Finance Personnel) Six Months 42 Identify Opportunities to Consolidate Activities Currently Centralized at the Campus Level (Operating Model) One Year 33 Identify Opportunities to Consolidate Activities Currently Occurring at the College/Department Level (Operating Model) Two Years 54 Drive Broader Financial Accountability One Year 5
5 Improve Business Insight Reporting and Planning Capabilities One Year 4
6 Further Development of a Finance Talent Development Strategy Two Years 3
Executive Summary Summary Findings Facilities Finance Human Resources IT Sustainability and Operating Model
Implementation Timeline
The Finance workstream identified $8.8M to $13.3M in net annual savingsKey Recommendations• Redesign operating model to improve efficiency of Finance-related resources
across the university• Drive broader accountability for financial results and budget targets including
margin expectations and adopt an all funds approach to financial management • Continue to leverage recently-installed technologies to improve business insight
and planning capabilities• Continue development of a Finance talent management program (recruitment,
training, and progression)• Improve supplier contract controls to allow Supply Chain to further manage
vendor spend*Includes distributed resources
Note: Annual savings are net of non-capital investments
Example Action: Creating a single point of contact for contract execution.

OPEN – GB – INFO 5-20 December 7-8, 2017
Human Resources Spend - $19.3M (Excludes System-wide Benefits)
Human Resources Area Overview
1 Savings opportunity primarily resides in departmental spend
Executive Summary Summary Findings Facilities Finance Human Resources IT Sustainability and Operating Model
Implementation Timeline
The Human Resources workstream identified $2.2M to $2.4M in net HR related savingsTotal Rewards savings is $17.5M to $30.4M in total savings Administrative Assistant Realignment is an additional $1.1M to $2.2M in savingsKey Recommendations• Launch a formal HR Transformation effort focused on standardizing HR processes and
governance structures, optimizing the usage of HR technology and redesigning the HR service delivery model
• Invest in HR technology and core HR capabilities that are currently missing or underutilized
• Involve campus leaders in the development of a system-wide “people strategy”• Redesign benefit and pay packages to align the total dollars spent with what is most
valued by employees
HR Related Opportunities Implementation Duration Implementation Risk 2 Total Rewards Rationalization Two Years 53 Administrative Assistant Realignment Six Months 3
HR Related Opportunities Implementation Duration Implementation Risk 1 HR Transformation1
Efficiencies in Distributed HR Spend Two Years 5Efficiencies in HR Spend Two Years 4Investments in Critical HR Capabilities and Roles Two Years 4Optimization of HR Technology Two Years 4
* Assumes 30% of work executed by 477 non-HR professionals identified as performing some level of HR work is attributable to HR** May not include total costs associated with HR vendor/consultant fees and should be validated with HR; additionally, HR technology expenses may be currently mapped to IT spend and should be further validated with HR
MU HR Labor, $2.6, 14%
MU Distributed HR Labor
Costs*, $8.4, 44%
MU Distributed HR Technology, Vendor and Other HR-Related
Expenses**, $1.6, 8%UM HR Labor, $4.5, 23%
UM HR Technology, Vendor and Other HR-Related
Expenses**, $2.2, 11%
Note: Annual savings are net of non-capital investments
Example Action: Expanding the CAPS model for HR transaction processing.

OPEN – GB – INFO 5-21 December 7-8, 2017
Information Technology Area OverviewInformation Technology Spend - $77.5M*
Executive Summary Summary Findings Facilities Finance Human Resources IT Sustainability and Operating Model
Implementation Timeline
Key Recommendations• Redesign operating model to improve efficiency of IT-related resources
across the university• Consolidate IT services to reduce risk and lower costs• Streamline student servicing across campuses to improve efficiency• Empower IT to operate in a strategic manner across departments and
campuses to better manage functional expensesSalaries and
Wages, $26.0, 34%
Staff Benefits,
$8.8, 11%
Distributed Salaries
and Wages, $0.5, 1%
Distributed Benefits, $0.1, 0%
UM & MU Non-Labor Expenses, $22.1, 28%
Distributed Non-Labor Expenses, $20.0, 26%
The IT workstream identified net annual savings of $4.2M to $7.7M
* Includes $20M of distributed non-labor IT expenses, not managed by Centralized departments, excludes depreciation
Opportunity Implementation Duration
Implementation Risk
1 Governance and Operating Model Three Year 52 IT Spend Governance One Year 33 Rationalize Distributed IT Desktop / Support Services One Year 34 Consolidate Web Hosting Platforms One Year 25 Increase App Development/Support ROI Requirements One Year 36 Reduce Innotas Licensing Two Year 1
Note: Annual savings are net of non-capital investments
Example Action: Implementing a standard web delivery platform.

OPEN – GB – INFO 5-22 December 7-8, 2017
Supply Chain Overview Supply Chain identified net annual savings of $3.7M to $4.0M
Executive Summary Summary Findings Facilities Finance Human Resources IT Sustainability and Operating Model
Implementation Timeline
Key Recommendations• Improve Supply Chain’s ability to develop and enforce purchasing policies and processes in order to better manage cost• Review departmental spend and partner with functional and academic leaders to address non-labor expense variances
Opportunity Implementation Duration Implementation Risk
1 Support Operating Model Redesign for Non-Labor Spend Two Year 2
2 Improve Enforcement of Supply Chain Controls Near-Term 2
3 Increase Spend Under Management Near-Term 2
4 Enhance Contract Review Process Near-Term 2
A selection of University of Missouri contracts and procurement policies were reviewed in conjunction with the Finance Workstream, labor opportunities for Supply Chain are noted in the Finance sectionNote: Annual savings are net of non-capital investments

OPEN – GB – INFO 5-23 December 7-8, 2017
Near-Term OpportunitiesCertain opportunities have been identified that can quickly impact the FY18 budget, the savings captured from these initiatives can be used to fund future strategic initiatives. Additional opportunities may be identified upon further analysis.
# Workstream Opportunity Time to Complete (Months)
$ Benefit (Low End of Range)
1 Facilities Rationalize Landscaping Scope 6 $50K
2 Supply Chain Improve Enforcement of Supply Chain Controls 3 $500K
3 Supply Chain Increase Spend Under Management 3 $1.5M
4 Supply Chain Enhance Contract Review Process 3 $1.5M
Near-Term opportunities can be fully implemented by June 30, 2018 and will result in annual savings of $3.5M
Note:Rapidly implementing operating model changes in the other centralized functional areas would result in additional savings in FY18Full impact of near-term opportunities will not be realized until FY19
Executive Summary Summary Findings Facilities Finance Human Resources IT Sustainability and Operating Model
Implementation Timeline
OPEN – GB – INFO 5-24 December 7-8, 2017
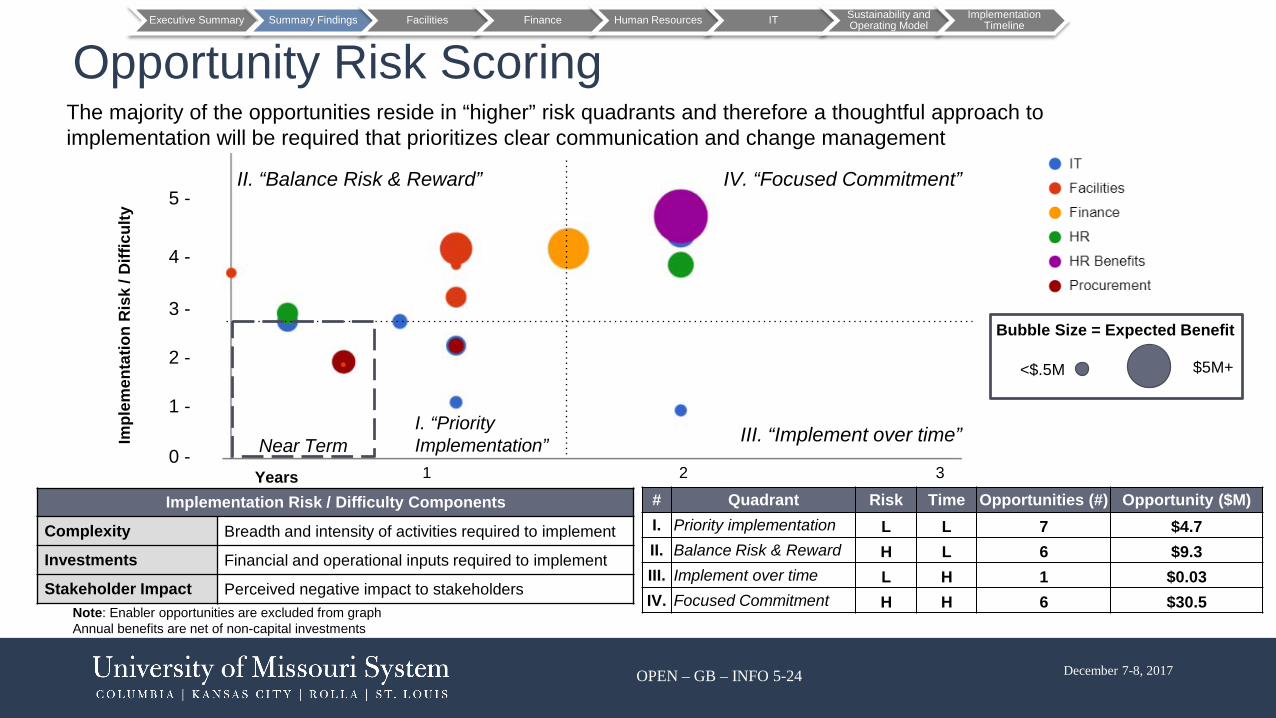
II. “Balance Risk & Reward” IV. “Focused Commitment”
III. “Implement over time”
Opportunity Risk ScoringThe majority of the opportunities reside in “higher” risk quadrants and therefore a thoughtful approach to implementation will be required that prioritizes clear communication and change management
Implementation Risk / Difficulty Components
Complexity Breadth and intensity of activities required to implement
Investments Financial and operational inputs required to implement
Stakeholder Impact Perceived negative impact to stakeholders
<$.5M $5M+
Bubble Size = Expected Benefit
Years
Impl
emen
tatio
n R
isk
/ Diff
icul
ty
1 2 3
# Quadrant Risk Time Opportunities (#) Opportunity ($M)I. Priority implementation L L 7 $4.7II. Balance Risk & Reward H L 6 $9.3III. Implement over time L H 1 $0.03IV. Focused Commitment H H 6 $30.5
Near TermI. “Priority Implementation”
Note: Enabler opportunities are excluded from graphAnnual benefits are net of non-capital investments
5 -
4 -
3 -
2 -
1 -
0 -
Executive Summary Summary Findings Facilities Finance Human Resources IT Sustainability and Operating Model
Implementation Timeline

OPEN – GB – INFO 5-25December 7-8, 2017
3. Facilities Workstream3.1 – Facilities Workstream Summary
3.2 – Individual Opportunity Overviews
3.3 – Additional Opportunities to be evaluated

OPEN – GB – INFO 5-26December 7-8, 2017
3.1 Facilities Workstream Summary

OPEN – GB – INFO 5-27 December 7-8, 2017
The Facilities workstream reviewed $47M of spend and identified 6 opportunities. The initial analysis projects an identified net annual benefits of $6.8M to $13.6M
Workstream Approach Observations Key Recommendations
• Data sourced primarily fromo FY17 GL, payroll file, FY18
budget, and others• Scope focused on select facilities
functions• Met with 8 Facilities leaders and
staff throughout MU and the system• Space opportunities include off
campus or leased residential life buildings
• Areas not addressed / out of scope include construction, energy management, environmental safety, security, and parking (except for public-private partnerships) and others
• Cost cutting measures / budget reductions over the past 15 years has significantly reduced the department’s size and operating expenses
• The university may consider making additional investments in facilities to better manage costs
• The existing infrastructure and spatial footprint serves as a catalyst for underutilization of space, lack of density, growing cost inefficiencies, and deferred maintenance needs
• Institutional legacy overshadows strategic innovation of "next-gen" concepts
• Departmental strategic planning is happening but there is a lack of a unified plan across Facilities / Real Estate departments
• Decisions typically managed by Facilities departments reside with academic departments (e.g. space, new building leases, new buildings, renovations, construction, etc.)
• Address decision rights through operating model changes in order to better manage overall Facilities and Real Estate portfolio costs
• Execute space utilization and rationalization opportunities
• Optimize lease portfolio to reduce operating costs
• Optimize operating costs and generate capital through partnerships and monetization opportunities
• Facilities will likely need to make investments in this department to execute these opportunities in a timely fashion, staffing needs will be identified during the design phase
SummaryExecutive Summary Summary Findings Facilities Finance Human Resources IT Sustainability and
Operating ModelImplementation
Timeline
Note: Annual benefits are net of non-capital investments
OPEN – GB – INFO 5-28 December 7-8, 2017
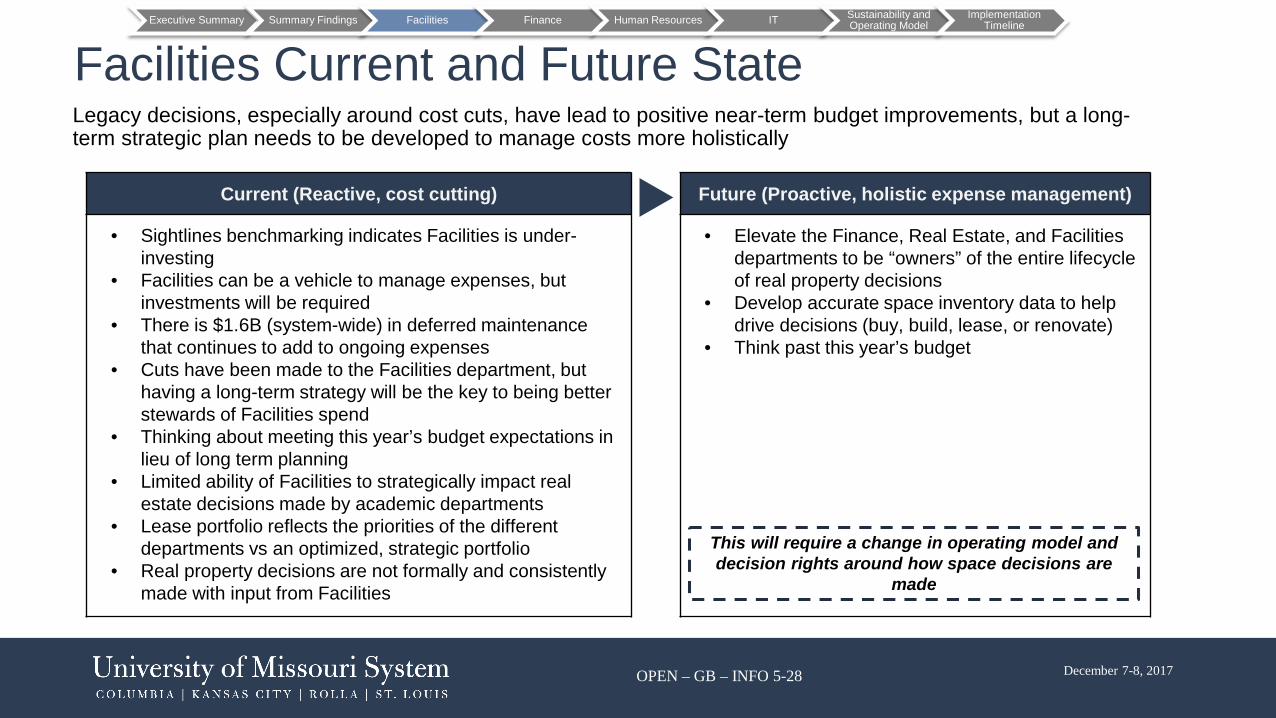
Legacy decisions, especially around cost cuts, have lead to positive near-term budget improvements, but a long-term strategic plan needs to be developed to manage costs more holistically
Current (Reactive, cost cutting) Future (Proactive, holistic expense management)
• Sightlines benchmarking indicates Facilities is under-investing
• Facilities can be a vehicle to manage expenses, but investments will be required
• There is $1.6B (system-wide) in deferred maintenance that continues to add to ongoing expenses
• Cuts have been made to the Facilities department, but having a long-term strategy will be the key to being better stewards of Facilities spend
• Thinking about meeting this year’s budget expectations in lieu of long term planning
• Limited ability of Facilities to strategically impact real estate decisions made by academic departments
• Lease portfolio reflects the priorities of the different departments vs an optimized, strategic portfolio
• Real property decisions are not formally and consistently made with input from Facilities
• Elevate the Finance, Real Estate, and Facilities departments to be “owners” of the entire lifecycleof real property decisions
• Develop accurate space inventory data to help drive decisions (buy, build, lease, or renovate)
• Think past this year’s budget
Facilities Current and Future StateExecutive Summary Summary Findings Facilities Finance Human Resources IT Sustainability and
Operating ModelImplementation
Timeline
This will require a change in operating model and decision rights around how space decisions are
made

OPEN – GB – INFO 5-29 December 7-8, 2017
Facilities Needs Spend
0.00%
0.50%
1.00%
1.50%
2.00%
2.50%
Target
Year
% C
urre
nt R
epla
cem
ent V
alue
of B
uild
ings
History of Target Spend• 1994 - Analysis of Facilities
determined 1.5% of Current Replacement Value (CRV) of E&G Facilities is required to maintain campus portfolio
• 2001 - Budget cuts resulted in less investment in Facilities and increased Facilities needs
• 2016 - Sightlines evaluation of Facilities recommends 2% of CRV of E&G space to meet Facilities needs
Note: Sightlines is engaged each year to benchmark facilities operations with peer institutions
External benchmarking indicates under-investment in Facilities and preventative maintenance
Executive Summary Summary Findings Facilities Finance Human Resources IT Sustainability and Operating Model
Implementation Timeline

OPEN – GB – INFO 5-30 December 7-8, 2017
Facilities Workstream ScopeExecutive Summary Summary Findings Facilities Finance Human Resources IT Sustainability and
Operating ModelImplementation
Timeline
Labor Department Focus Non-Labor Areas Out of Scope
• Facilities Administration• Facility Operations• Landscape Services• Space Planning and
Management• Property Maintenance,
Custodial / Janitorial• Space Management• Landscape Services• Print and Mail Services
• Leasing Portfolio• Space Utilization• Public-private Partnerships
• Parking and Transport Services• Environmental Health and
Safety• Construction Management• Security• Sustainability• Energy Management• Real Estate / Lease
Management
Facilities scope includes the maintenance and upkeep of UM facilities along with real estate management and related activities

OPEN – GB – INFO 5-31 December 7-8, 2017
$9.40 Parking & Transportation
Svcs47%
$10.81 Plan, Design & Construction
53%
$4.23 M&R
Projects16%
$2.82 Landscape Services10%
$16.92 Facility
Operations63%
$2.35Campus Facilities
9%
$0.47 Space
Planning2%
FY2017 Baseline Total Spend * UM and MU Central Headcount
Facilities Functional Rollup $47M 232
Expense Breakdown*
Expense ProfileExecutive Summary Summary Findings Facilities Finance Human Resources IT Sustainability and
Operating ModelImplementation
Timeline
Note: Plan, Design & Construction includes In-House Design & Construction, and Project Management of $150 million D&C spend .
Facilities E&G Spend$27M
Auxiliary Spend$20M
*Facilities spend includes select spend from certain Operations, Auxiliary and other areas, based on discussion with the Facilities Department leads. Does not represent Facilities department budget only.

OPEN – GB – INFO 5-32 December 7-8, 2017
Opportunity SummaryThe Facilities Workstream identified 6 opportunities with an annual benefit range of $7.0M to $13.6M
Executive Summary Summary Findings Facilities Finance Human Resources IT Sustainability and Operating Model
Implementation Timeline
Opportunities identified as part of preliminary analysis
Additional opportunities to be evaluated
Opportunity Implementation Duration Implementation Risk
1 Real Property Operating Model Realignment Two Year 4
2 Real Property Rationalization (Owned and Leased Space) Two Year* 4
3 Rationalize Landscaping Scope Near-Term 2
Opportunity Implementation Duration Implementation Risk
4 Monetize Excess and/or Underutilized Real Property Assets Two Year* 4
5 Identify Public-Private Partnership Opportunities Two Year 3
6 Review Staffing Model Efficiency Two Year 4
During the design phase opportunities will undergo additional analysis to confirm savings, timeframe, and investment requiredNote: Annual benefits are net of non-capital investments*Implementation of certain opportunities can be achieved in two years others are expected to have a longer lead time

OPEN – GB – INFO 5-33 December 7-8, 2017
Implementation Risk Summary
Risk Assessment Key
Complexity Assessment based on the number of actions required to implement the opportunity and the breadth of stakeholder buy-in needed
Investments Assessment based on amount of technological, financial, personnel, and/or “soft” investments needed to implement the opportunity
Stakeholder Impact
Assessment based on the opportunity’s impact to normal workflow as well as the perceived impact of the opportunity to stakeholders
Implementation Risk Score is an index that factors in (1) Complexity (2) Investment Required (3) Impact to Stakeholders
Low Risk – Limited risk to internal stakeholders; proceed with implementation, 1 – 2
Moderate Risk – Develop and execute change management, Track and manage progress closely 3
High Risk – Develop tactical work plan, execute change management strategy, involve key leaders 4 - 5
Opportunity Complexity Investments Stakeholder Impact Total Risk
1 Real Property Operating Model Realignment 5 4 4 4
2 Real Property Rationalization (Owned and Leased Space) 5 4 4 4
3 Rationalize Landscaping Scope 2 1 4 2
Opportunities identified as part of preliminary analysis
Opportunity Complexity Investments Stakeholder Impact Total Risk
4 Monetize Excess and/or Underutilized Real Property Assets
5 3 3 4
5 Identify Public-Private Partnership Opportunities 5 3 3 3
6 Review Staffing Model Efficiency 5 2 5 4
Additional opportunities to be evaluated
Executive Summary Summary Findings Facilities Finance Human Resources IT Sustainability and Operating Model
Implementation Timeline

OPEN – GB – INFO 5-34December 7-8, 2017
3.2 Facilities Individual OpportunitiesOverview
Full-time equivalent (FTE) impacts and investments require additional analysis to be performed during the design phase
OPEN – GB – INFO 5-35 December 7-8, 2017
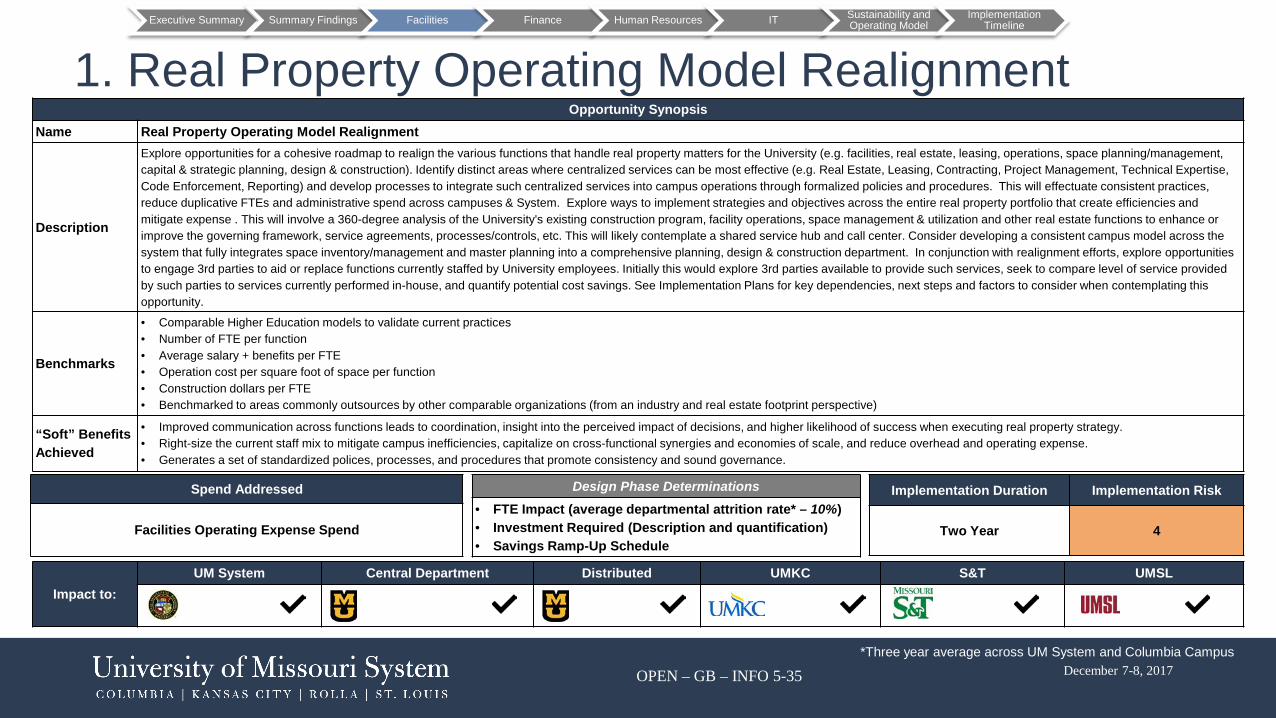
1. Real Property Operating Model RealignmentOpportunity Synopsis
Name Real Property Operating Model Realignment
Description
Explore opportunities for a cohesive roadmap to realign the various functions that handle real property matters for the University (e.g. facilities, real estate, leasing, operations, space planning/management, capital & strategic planning, design & construction). Identify distinct areas where centralized services can be most effective (e.g. Real Estate, Leasing, Contracting, Project Management, Technical Expertise, Code Enforcement, Reporting) and develop processes to integrate such centralized services into campus operations through formalized policies and procedures. This will effectuate consistent practices, reduce duplicative FTEs and administrative spend across campuses & System. Explore ways to implement strategies and objectives across the entire real property portfolio that create efficiencies and mitigate expense . This will involve a 360-degree analysis of the University's existing construction program, facility operations, space management & utilization and other real estate functions to enhance or improve the governing framework, service agreements, processes/controls, etc. This will likely contemplate a shared service hub and call center. Consider developing a consistent campus model across the system that fully integrates space inventory/management and master planning into a comprehensive planning, design & construction department. In conjunction with realignment efforts, explore opportunities to engage 3rd parties to aid or replace functions currently staffed by University employees. Initially this would explore 3rd parties available to provide such services, seek to compare level of service provided by such parties to services currently performed in-house, and quantify potential cost savings. See Implementation Plans for key dependencies, next steps and factors to consider when contemplating this opportunity.
Benchmarks
• Comparable Higher Education models to validate current practices• Number of FTE per function• Average salary + benefits per FTE• Operation cost per square foot of space per function• Construction dollars per FTE• Benchmarked to areas commonly outsources by other comparable organizations (from an industry and real estate footprint perspective)
“Soft” Benefits Achieved
• Improved communication across functions leads to coordination, insight into the perceived impact of decisions, and higher likelihood of success when executing real property strategy. • Right-size the current staff mix to mitigate campus inefficiencies, capitalize on cross-functional synergies and economies of scale, and reduce overhead and operating expense.• Generates a set of standardized polices, processes, and procedures that promote consistency and sound governance.
Executive Summary Summary Findings Facilities Finance Human Resources IT Sustainability and Operating Model
Implementation Timeline
Spend Addressed
Facilities Operating Expense Spend
Implementation Duration Implementation Risk
Two Year 4
Design Phase Determinations• FTE Impact (average departmental attrition rate* – 10%)• Investment Required (Description and quantification)• Savings Ramp-Up Schedule
Impact to:UM System Central Department Distributed UMKC S&T UMSL
*Three year average across UM System and Columbia Campus

OPEN – GB – INFO 5-36 December 7-8, 2017
2. Real Property Rationalization (Owned and Leased Space)Opportunity Synopsis
Name Real Property Rationalization (Owned and Leased Space)
Description
Analyze the University's real estate and facility needs to right-size the portfolio and explore opportunities to maximize utilization, density, external funding, flexible work arrangements and, importantly, the user experience. Deferred maintenance, facility condition needs index, utilization metrics and other key performance indicators will be utilized to align the portfolio with the University's mission and needs. Stratify and analyze the University’s real property portfolio to better understand business and contractual limitations associated with each space/use and explore alternative ways to optimize and reduce the University’s existing space expense. This will be a multi-year process that will encompass the University's entire real estate footprint (owned and leased space), with the goal of reducing square footage and creating a self-funding real estate strategy. Review owned and leased buildings/spaces to identify each building's primary/secondary functions or purposes. Develop a list of considerations around redesign requirements necessary to repurpose certain buildings/spaces for multiple uses, increasing density and space utilization. University or leased facilities might be used for temporary purposes throughout the year, which can lead to underutilization across the portfolio. The goal is to analyze the impact of space optimization through redesign, furniture, fixtures and equipment investment, or shifts in previous operating models. Assess opportunities to right size the mix of owned vs. lease space taking into account the System’s stated decision making factors for lease-build-buy-renovate decisions (e.g. availability of space and market, suitability of space, urgency of need, duration of need, adaptability, location, services required, costs, funding availability and funding type). Implement framework to require all new space requests be initiated through a formal business plan process that sets forth: program and space allocation plan, project definition/description, project justification, project costs and schedule, funding strategy, supporting documents, lease-build-buy-renovate considerations and present value analysis. Explore opportunities as it relates to spatial occupancy and rethinking the University's administrative and faculty operating model. For example, is there an opportunity to redesign the administrative model to allow certain personnel to work off campus, at home, or in more flexible space arrangements? Can the number of spaces occupied by faculty be reduced and/or identify areas or opportunities for shared space or consolidation? See Implementation Plans for key dependencies, next steps and factors to consider when contemplating this opportunity.
Benchmarks
• University prepared draft space analysis • Reduced anticipated savings by the $1.4M already anticipated based on planned relocations in process• Market lease rates for comparable spaces in the local area• Relocation cost quotes from local moving companies• All administrative functions occupy campus real estate. Leading practice standards are being used to identify functions that (a) could employ a flexible work arrangement with a high-level of success and (b) would yield significant
benefits and cost saving opportunities to the University
“Soft” Benefits Achieved
• Updated infrastructure• Improved space utilization across the portfolio both on and off campus• Opportunity to realize campus and department synergies that are related to realigning physical presence• Improve the University's ability to track and monitor space utilization and enhance real-time efforts to address University priorities in unison with real estate strategy• Enhance the reliability, relevance, and integrity of data used at varying levels in the decision making process• Increase the level of administrative time put towards maintaining and monitoring the optimal leased portfolio in lieu of simply administering a larger portfolio• Establishes a controlled environment that can improve productivity and product quality• With an option to remain flexible in the workplace, employee satisfaction could increase and as a result benefit the University's ability to execute its mission
Executive Summary Summary Findings Facilities Finance Human Resources IT Sustainability and Operating Model
Implementation Timeline
Spend Addressed Investment RequiredReduces Capital Costs (annual savings based on Facilities Needs, Capital Expense) Renovation, relocation, design costs and fit-out costs
Implementation Duration Implementation RiskTwo Years* 4
Impact to:UM System Central Department Distributed UMKC S&T UMSL
*Implementation of certain opportunities can be achieved in two years others are expected to have a longer lead time

OPEN – GB – INFO 5-37 December 7-8, 2017
3. Rationalize Landscaping ScopeOpportunity Synopsis
Name Rationalize Landscaping Scope
Description
Analyze the University's landscaping spend to identify opportunities to reduce cost by creating tiered landscaping requirements based on (a) student footprint, (b) campus tour routes, (c) planned facility demolition and relocation, (d) botanical garden areas, (e) safety, and (f) other aesthetic considerations. Creating tiered landscaping services may lead to cost savings, reduced FTE count, and allow high-traffic / priority areas to receive additional services. See Implementation Plans for key dependencies, next steps and factors to consider when contemplating this opportunity.
Benchmarks
• Landscaping cost per square foot• FTE per acre• Land areas• Anticipated savings of $265,000 planned by landscaping department in FY18 budget
“Soft” Benefits Achieved Introduces flexibility in the way upper-management prioritizes evaluation and continuous improvement efforts
Executive Summary Summary Findings Facilities Finance Human Resources IT Sustainability and Operating Model
Implementation Timeline
Spend Addressed Investment Required
Landscaping Operating Expense Spend None
Implementation Duration Implementation Risk
Near-Term 2
Impact to:
UM System Central Department Distributed UMKC MS&T UMSL
Near-Term Opportunity

OPEN – GB – INFO 5-38December 7-8, 2017
3.3 Facilities - Additional Opportunities to be evaluated

OPEN – GB – INFO 5-39 December 7-8, 2017
4. Monetize Excess and/or Underutilized Real Property Assets
Opportunity SynopsisName Monetize Excess and/or Underutilized Real Property Assets
Description
Continue and expand upon ongoing efforts to monetize current real estate holdings. Identify additional resources required for real estate staff to: quantify the value of saleable/leasable real estate; understand market dynamics; identify potential lessees/buyers; advertise and solicit offers and; negotiate real property transactions . This is intended to focus on excess land holdings and underutilized buildings that are not part of the main campus. See Implementation Plans for key dependencies, next steps and factors to consider when contemplating this opportunity.
Benchmarks Identification of buildings & land that are nonessential to the University's mission, objectives, or real estate platform and have the potential for generating capital
“Soft” Benefits Achieved
• Mitigate the risk associated with incurring reactive deferred maintenance for property nonessential to the University's core and/or ancillary missions• Allow employees to focus on the locations that are core to the University's mission
Executive Summary Summary Findings Facilities Finance Human Resources IT Sustainability and Operating Model
Implementation Timeline
Design Phase Determinations• Spend Addressed• FTE Impact• Investment Required (Description and quantification)• Savings Ramp-Up Schedule
Implementation Duration Implementation Risk
Two Year* 4
Impact to:
UM System Central Department Distributed UMKC S&T UMSL
*Implementation of certain opportunities can be achieved in two years others are expected to have a longer lead time

OPEN – GB – INFO 5-40 December 7-8, 2017
5. Identify Public-Private Partnership OpportunitiesOpportunity Synopsis
Name Identify Public-Private Partnership Opportunities
DescriptionIdentify public-private partnership opportunities that would optimize, complement, and improve the University's financial position to fund mission-oriented needs (education/research). See Implementation Plans for key dependencies, next steps and factors to consider when contemplating this opportunity. Evaluate the ability to raise rates for parking, residential life, and other auxiliaries.
Benchmarks • Relevant market rents, capitalization rates, sales pricing etc. from industry surveys and public articles pertaining to other universities• University financial reporting and projected capital upgrades
“Soft” Benefits Achieved
• Transfer financial and operating risk to a third-party operator• Ability to establish key performance indicators thresholds and hold third-party operators accountable, which in turn could improve service delivery efforts
Executive Summary Summary Findings Facilities Finance Human Resources IT Sustainability and Operating Model
Implementation Timeline
Spend Addressed
Increases Cash Inflows (minor reduction in operating costs, but more so an increase in revenue that does not currently exist)
Design Phase Determinations
• FTE Impact• Investment Required (Description and quantification)• Savings Ramp-Up Schedule
Implementation Duration Implementation Risk
Two Year 3
Impact to:
UM System Central Department Distributed UMKC S&T UMSL

OPEN – GB – INFO 5-41 December 7-8, 2017
6. Review Staffing Model EfficiencyOpportunity Synopsis
Name Review Staffing Model Efficiency
DescriptionAssess opportunities to redefine roles and responsibilities that could be leveraged using part-time and/or student resources that command lower costs of labor and relieve pressure on University benefit packages. Consider replication of managerial functions. See Implementation Plans for key dependencies, next steps and factors to consider when contemplating this opportunity.
Benchmarks• Number of administrative employees across facilities department• Average administrative salary & benefits costs/person• Average hourly cost/student employee
“Soft” Benefits Achieved
• Improve connectivity between students and campus employees – an opportunity to empower students and enhance their educational experience and the overall campus culture• Increase capacity that may otherwise be constrained by budget limitations• Improve student employment rates and engagement in on campus operations
Executive Summary Summary Findings Facilities Finance Human Resources IT Sustainability and Operating Model
Implementation Timeline
Spend Addressed
Operating Expense for All Operations (including Facilities) Full-and Part-Time Employees
Design Phase Determinations
• FTE Impact• Investment Required (Description and quantification)• Savings Ramp-Up Schedule
Implementation Duration Implementation Risk
Two Year 4
Impact to:
UM System Central Department Distributed UMKC S&T UMSL

OPEN – GB – INFO 5-42December 7-8, 2017
4. Finance and Supply Chain Workstream4.1 – Finance Workstream Summary4.2 – Individual Opportunity Overviews4.3 – Supply Chain Workstream Summary

OPEN – GB – INFO 5-43 December 7-8, 2017
The Finance Workstream reviewed an estimated $34M of spend at UM system and MU and an estimated $6M spend at UM’s other campuses and identified 6 opportunities with a projected net savings of $8.8M to $13.3M
Workstream Approach Observations Key Recommendations
• Data usedo FY17 GL and payroll file, Finance organizational
trees • Scope focused on traditional Finance and Supply
Chain functions• Met with 10 Finance leaders throughout UM, MU,
including the CFOs of each campus• Areas not addressed / out of scope include
administrative processes and expenses related to research, e.g. sponsored programs, institutional research
• Significant improvements appear to have occurred in the relationship between the Finance teams at the System and the campuses. However the operating model does not support efficient leverage of Finance related resources as evidenced by significantly distributed Finance resources and responsibilities.
• While the campuses are able to understand how they are doing in comparison to budget, financial accountability does not appear present especially as you move into deeper levels on each campus. Opportunities to improve interim forecasting ability also exist. Reporting does not clearly link business drivers (student credit hours, research, etc.) and financial performance.
• Though technology improvements have been made in recent years (Tableau, Hyperion, etc.), the Finance team acknowledges the benefit from additional enhancements to improve ease of use and integrate various data sets.
• Finance recognizes the strength and commitment within the existing Finance team but acknowledges the need to develop a strategy to maintain, develop and recruit Finance talent.
• Redesign operating model to improve efficiency of Finance-related resources across the University
• Drive broader accountability for financial results and budget targets including margin expectations and adopt an All Funds approach to financial management.
• Continue to leverage recently-installed technologies to improve business insight and planning capabilities
• Continue development of a Finance talent management program (recruitment, training, and progression)
• Improve supplier contract controls to allow Supply Chain to further manage vendor spend
SummaryExecutive Summary Summary Findings Facilities Finance Human Resources IT Sustainability and
Operating ModelImplementation
Timeline
Note: An activity analysis survey will be key to determination of Finance activity and related FTEs
Note: Annual savings are net of non-capital investments
OPEN – GB – INFO 5-44 December 7-8, 2017
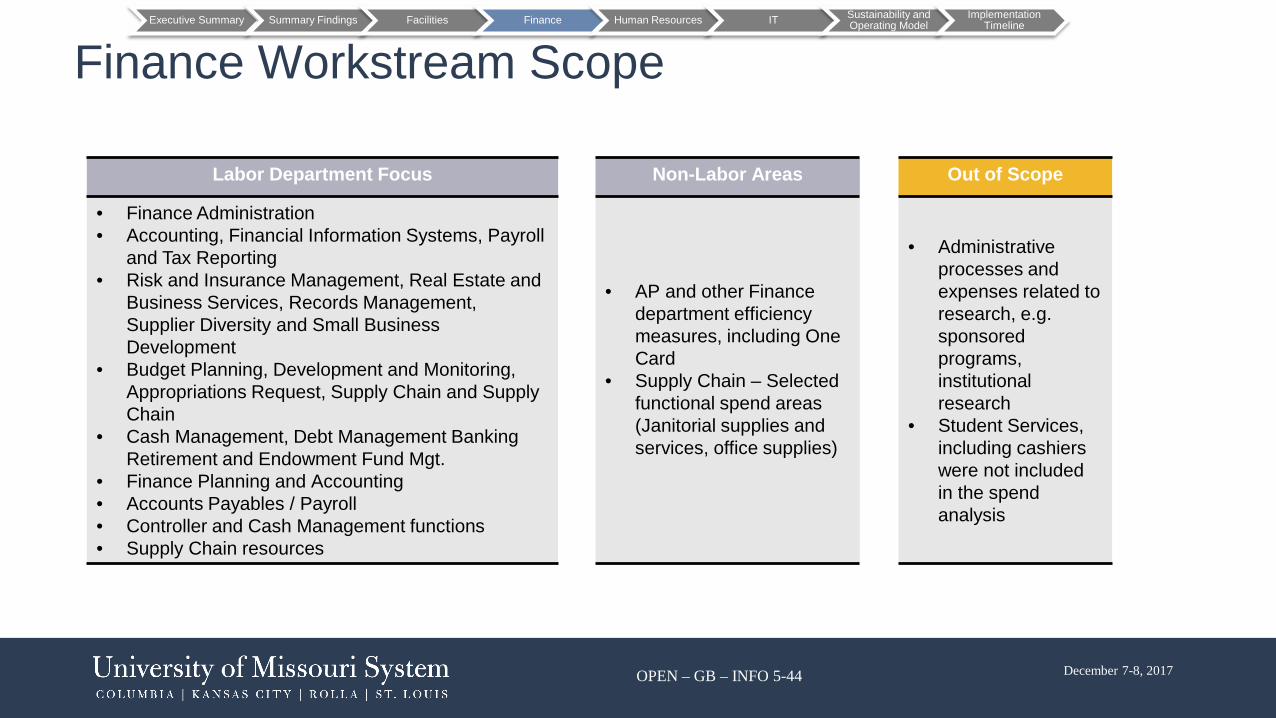
Finance Workstream ScopeExecutive Summary Summary Findings Facilities Finance Human Resources IT Sustainability and
Operating ModelImplementation
Timeline
Labor Department Focus Non-Labor Areas Out of Scope
• Finance Administration• Accounting, Financial Information Systems, Payroll
and Tax Reporting• Risk and Insurance Management, Real Estate and
Business Services, Records Management, Supplier Diversity and Small Business Development
• Budget Planning, Development and Monitoring, Appropriations Request, Supply Chain and Supply Chain
• Cash Management, Debt Management Banking Retirement and Endowment Fund Mgt.
• Finance Planning and Accounting• Accounts Payables / Payroll• Controller and Cash Management functions• Supply Chain resources
• AP and other Finance department efficiency measures, including One Card
• Supply Chain – Selected functional spend areas (Janitorial supplies and services, office supplies)
• Administrative processes and expenses related to research, e.g. sponsored programs, institutional research
• Student Services, including cashiers were not included in the spend analysis

OPEN – GB – INFO 5-45 December 7-8, 2017
Expense Profile
Salaries and Wages, $11.4,
34%
Staff Benefits, $3.8, 11%
Distributed Salaries and
Wages, $10.7, 31%
Distributed Benefits, $3.4,
10%
Supplies, Services and Other Operating Expenses,
$4.7, 14%
Expense Breakdown* Distributed Methodology
• Stakeholder interviews acknowledged that significant employees with Finance function responsibilities exist throughout the University
• Identified total number of individuals executing Finance-related transactions in Finance PeopleSoft module
• Further evaluated list of individuals by using job titles, working with campus leadership to confirm
• Applied an estimated percent effort to estimate the dollar value (salaries, wages, and benefits) of the distributed headcount
• Activity analysis survey will be performed to more precisely identify distributed activities
FY2017 Baseline Total Spend UM and MU Central Headcount MU Distributed Headcount
Finance Functional Rollup $34 M 209 1,500 (approx.)
$34M of spend was reviewed including labor and non-labor expenses, labor includes known Finance employees and a count of “Distributed” employees which will be refined through an activity analysis survey
Executive Summary Summary Findings Facilities Finance Human Resources IT Sustainability and Operating Model
Implementation Timeline
*Includes distributed resources

OPEN – GB – INFO 5-46 December 7-8, 2017
Finance is highly decentralized and opportunities for improvement exist across each aspect of the Finance operating model
Executive Summary Summary Findings Facilities Finance Human Resources IT Sustainability and Operating Model
Implementation Timeline
Finance Organizational Structures & Roles
• Based on Finance individuals mapped to Central Finance roles (79 FTEs), University of Missouri Columbia Campus and System is below the Higher Ed benchmarks, however, it is estimated that there are an additional 223 to 279 Finance FTEs supporting Finance activities that are disturbed across the organization or at UMSL, UMKC or S&T; a formal activity analysis is required to more accurately understand FTEs supporting Finance processes across the organization
• The Finance service model is highly decentralized and fragmented which creates inefficiencies, potential redundancies and quality issues
• Significant improvements appear to have occurred in the relationship between the Finance teams at the System and the campuses, however, the operating model does not support efficient leverage of Finance related resources as displayed by significantly distributed Finance resources (1500+ distributed headcount performing finance functions) and responsibilities
Finance Technology
• Though technology improvements have been made in recent years (Tableau, Hyperion, etc.), the Finance team acknowledges the benefit from additional enhancements to improve ease of use and integrate various data sets
• People do not feel empowered to use existing tools to get to key metrics and insights
Finance Processes
• The current decentralized and fragmented structure of the Finance organization results in inconsistencies in how results are analyzed and presented
• Finance recognizes the strength and commitment within the existing Finance team but acknowledges the need to develop a strategy to maintain, develop and recruit Finance talent

OPEN – GB – INFO 5-47 December 7-8, 2017
Representative quotes from interviews with leadership and staff across the System and all four campuses
Executive Summary Summary Findings Facilities Finance Human Resources IT Sustainability and Operating Model
Implementation Timeline
“Finance is held back by wide fragmentation making it hard to
prioritize.”“Communication is not done well enough. Hard to get the right message to the right people.”
“Need different talent to move the organization. Need critical thinkers,
not just transaction processers.”
“Need more analytical, data driven decisions.”
“Progress has been made with Hyperion and it is more efficient than it used to be but we need to better
empower people to be more effective. It’s an organizational
issue.”
“Transactions take so much time, especially with their fragmentation.”
“We haven’t been forceful on how things are done and we haven’t limited people’s
ability to do transactions.”
“Need more standardization, automation, less redundancy
and lower cost of transactional processing.”
“Transaction authorization to disseminated across the University leading to spending in excess of budget as
well as transactions out of compliance with policy.”
“Departments spend a significant amount of time managing and reconciling payroll.”“Toolsets to manage budget non-existent, we have created
workarounds using Excel.”
“Historically difficult to engage with the fiscal officers since they are
accountable to the deans and other leadership at the campus.”
“It’s more important to focus on positioning UM as a world class AAU research and academic institution. Finance, HR
and IT are commodities that need to work better.”
“Development of analytic tools has led to silos of data – finance, HR, student data – that isn’t easily aligned.”
“There is a significant amount of activity at the department level related to intercompany transfers.”
“Too many finance leads and therefore difficult to interface with never mind partner with the academic departments.”
“Need to remain supportive of the uniqueness of each
campus.”
“Everyone working on their own list of priorities and
individual business focus.”
“There is a wide variation and therefore inconsistency in talent
and capabilities across fiscal roles.”
“There is significant lack of economic scale due to the widely
distributed nature of fiscal activity.”

OPEN – GB – INFO 5-48 December 7-8, 2017
Leading Finance organizations invest more into value-add activities by reducing effort on traditional transactional processes
Executive Summary Summary Findings Facilities Finance Human Resources IT Sustainability and Operating Model
Implementation Timeline
Benchmarking allows us to assess the Finance
function using a fact-based approach
Business Insight• Strategy & Planning• Budgeting & Forecasting• Business Analysis• Performance Improvement Projects• Tax Planning
Transactional Efficiency• Accounts Payable (including T&E)• Accounts Receivable• Credit Management• Customer Billing• General Accounting• Financial / External Reporting• Management Reporting
Compliance and Control• Treasury• Internal Audit• Process Controls & Compliance• Tax Accounting & Compliance
Business Insight
Compliance and
Control
Transactional Efficiency
Business InsightEffective ways of working with the business to provide:• Valued business partners• Sustainable business
growth• Relevant and timeline
performance management information
Transactional EfficiencyImproving task performance in a timely and cost effective manner by:• Simplifying processes
enabled by technology• Outsourcing and using
shared services for non-core activities
Compliance and ControlHow to balance sustainable cost without constraining the business:• Optimize risk management• Stay flexible for future
changes in regulation

OPEN – GB – INFO 5-49 December 7-8, 2017
Finance Benchmark Scope
• Interviews with senior Finance executives to qualify benchmark findings
• Provides a diverse view of functional priorities, challenges and direct feedback about leadership, technology, support, organization and people
• Assessment of the resources and costs supporting the Finance function
• Enables objective comparison of the Finance function with external peers and supports leading practice gap analysis
• Data collected using data collection template and participant guide
• Provides an analysis of strength and opportunities, and actionable recommendations
2) Finance Executive Interviews1) Finance FTE and Cost Benchmark
Executive Summary Summary Findings Facilities Finance Human Resources IT Sustainability and Operating Model
Implementation Timeline
The project scope includes two key components –

OPEN – GB – INFO 5-50 December 7-8, 2017
Finance and Supply Chain Benchmark TaxonomyMapped UM FTEs and process costs to the standard Finance and Supply Chain benchmark processes to promote relevant comparisons
Finance – Transactional Efficiency
• Cash Disbursementso Accounts Payableo Travel & Entertainment Accounting
• Customer Billing• Accounts Receivable• Credit Management• Debt Collection• Payroll• General Accounting
o Fixed Asset Accountingo Intercompany Accountingo Inventory Accountingo Reconciliations, Consolidation and Closing
the Books• Financial & External Reporting• Management Reporting
Finance – Compliance & Control
• Treasuryo Cash Managemento Risk Management
• Internal Audit• Process Controls & Compliance• Tax Accounting & Compliance
Finance – Business Insight
• Tax Planning• Strategy & Planning• Budgeting & Forecasting• Business Analysis
o Decision Supporto Mergers & Acquisitionso Pricing & Analysiso Investor Relations
• Performance Improvement Projects
Supply Chain
• Transaction Processing• Supplier & Contract Management• Strategic Sourcing• Performance Management
Executive Summary Summary Findings Facilities Finance Human Resources IT Sustainability and Operating Model
Implementation Timeline

OPEN – GB – INFO 5-51 December 7-8, 2017
Typical Finance proportional effort on value-adding business insight activities has remained at 24% but will likely increase with rising expectations for Finance outcomes
Executive Summary Summary Findings Facilities Finance Human Resources IT Sustainability and Operating Model
Implementation Timeline
Average Distribution of Finance time - BenchmarkA prior activity analysis
study not only indicated a significant level of
Finance activity but over 75% related to
efficiency/transaction processing
38.5
121.026.0
Benchmark FTEs Normalized to UM Revenue ($2.2B)
20.1%
77.3%2.6%
University of Missouri System Distribution of Finance time
Expected FTE for University of Missouri System Scope

OPEN – GB – INFO 5-52 December 7-8, 2017
Executive Summary Summary Findings Facilities Finance Human Resources IT Sustainability and Operating Model
Implementation Timeline
39.9
121.027.0
26.0
11.8
38.5
U of Missouri Higher Ed Median
Business Insight
Compliance & Control
Transaction Processing
Centralized University of Missouri System and Columbia FTEs (Excludes All Other Finance Support) to Benchmark
FTEs Normalized to UM Revenue ($2.2B)
Additional Finance FTEs to be
understood as part of Activity Analysis effort
Finance FTEs Normalized to UM Revenue ($2.2B)
301357
185
111
192143
U of M (LowEstimate)
U of M (HighEstimate)
Higher EdMedian
Higher EdTop Quartile
X-SectorMedian
X-SectorTop Quartile
Centralized resources at UMSYS and MU are below benchmarks
• Finance workstream had difficulty identifying the FTEs associated to functions without an activity analysis which will provide understanding of:
o Centralized resources at the other campuseso Distributed resource support at all four campuses (estimated additional 222 to 278 FTEs for total of an estimated 301 to 357 FTEs)
Centralized function compares well to benchmarks Opportunity comes with estimated decentralized effort in finance
UM (Low Estimate)
UM(High Estimate)UM

OPEN – GB – INFO 5-53 December 7-8, 2017
Leading Finance functions are also set apart by their ability to do the following
Executive Summary Summary Findings Facilities Finance Human Resources IT Sustainability and Operating Model
Implementation Timeline
Build a clear role for business partners
Invest in emerging technologies
Take the lead in driving behaviour and cultural change
Drive transformation

OPEN – GB – INFO 5-54 December 7-8, 2017
Finance leaders are improving business results by investing in commercial insight, spending less time on transactional work and running at lower costs
Executive Summary Summary Findings Facilities Finance Human Resources IT Sustainability and Operating Model
Implementation Timeline
Top performers in the industry operate at lower cost not by reducing service levels but by standardizing and simplifying their core processes and systems – enabling them to free up resources to focus on business partnering
Many Finance functions have self-reported over 30% of their
time is spent on “waste”
A combination of Lean process improvement and automation would release
these costs
Waste reduction and automation potential based on industry benchmarks
At UM, many of the below processes are performed across the organization. The results of a multi-function activity analysis will demonstrate the opportunities to leverage LEAN concepts to reduce effort in transactional areas.

OPEN – GB – INFO 5-55 December 7-8, 2017
20679
357
185127 182
3427
36
206
050
100150200250300350400
CentralizedFTEs (System
Office &Columbia)
Revised Base(Excl Proc)
MU Distributed UMSL UMKC S&T Total(Including
Revised Base)
Higher EdMedian
206
79
301185
127 135
3025
33206
050
100150200250300350
CentralizedFTEs (System
Office &Columbia)
Revised Base(Excl Proc)
MU Distributed UMSL UMKC S&T Total(Including
Revised Base)
Higher EdMedian
Finance Area OverviewFactoring distributed and campus FTEs into the Finance benchmark data shows a gap of 116 FTEs to 172 FTEs to median
Finance FTEs Normalized to UM Revenue ($2.2B)UM Finance FTE Summary (Low Estimate)
UM Finance FTE Summary (High Estimate)
Legend
Base of FTE Analysis
Removal of FTEs Performing Non-Finance Roles
Additions of FTEs
Gap toMedian
= 116 FTEs
Gap toMedian
= 172 FTEs
Executive Summary Summary Findings Facilities Finance Human Resources IT Sustainability and Operating Model
Implementation Timeline
Activity Analysis is key to the true determination of Finance activity and related FTEs beyond the estimates below
301357
185
111
192143
U of M (LowEstimate)
U of M (HighEstimate)
Higher EdMedian
Higher EdTop Quartile
X-SectorMedian
X-SectorTop Quartile
UM (Low Estimate)
UM (High Estimate)

OPEN – GB – INFO 5-56 December 7-8, 2017
Opportunity Summary
Opportunity OverviewTotal System-wide Spend = Estimated $40M
Opportunity - $8.8M(Variance from median benchmark, includes benefits)
Revised Base (across all campuses –detail in following slide)
Executive Summary Summary Findings Facilities Finance Human Resources IT Sustainability and Operating Model
Implementation Timeline
Opportunity Implementation Duration Implementation Risk
1 Design Future Operating Model (Align Finance Personnel) Six Months 4
2 Identify Opportunities to Consolidate Activities Currently Centralized at the Campus Level (Operating Model) One Year 3
3 Identify Opportunities to Consolidate Activities Currently Occurring at the College/Department Level (Operating Model) Two Years 5
4 Drive Broader Financial Accountability One Year 5
5 Improve Business Insight Reporting and Planning Capabilities One Year 4
6 Further Development of a Finance Talent Development Strategy Two Years 3
The Finance Workstream identified $8.8M to $13.3M in annual net savings
Note: Annual benefits are net of non-capital investment in capabilities needed

OPEN – GB – INFO 5-57 December 7-8, 2017
Implementation Risk Summary
Risk Assessment Key
Complexity Assessment based on the number of actions required to implement the opportunity and the breadth of stakeholder buy-in needed
Investments Assessment based on amount of technological, financial, personnel, and/or “soft” investments needed to implement the opportunity
Stakeholder Impact
Assessment based on the opportunity’s impact to normal workflow as well as the perceived impact of the opportunity to stakeholders
Implementation Risk Score is an index that factors in (1) Complexity (2) Investment Required (3) Impact to Stakeholders
Low Risk – Limited risk to internal stakeholders; proceed with implementation, 1- 2
Moderate Risk – Develop and execute change management, Track and manage progress closely 3
High Risk – Develop tactical work plan, execute change management strategy, involve key leaders 4 -5
Opportunity Complexity Investments Stakeholder Impact Total Risk
1 Design Future Operating Model (Align Finance Personnel) 5 4 5 4
2 Identify Opportunities to Consolidate Activities Currently Centralized at the Campus Level (Operating Model) 4 3 4 3
3 Identify Opportunities to Consolidate Activities Currently Occurring at the College/Department Level (Operating Model) 5 5 5 5
4 Drive Broader Financial Accountability 5 5 5 5
5 Improve Business Insight Reporting and Planning Capabilities 5 4 3 4
6 Establish Finance Talent Development Strategy 3 3 3 3
Finance opportunities are tied directly to operating model changes and therefore carry a higher than average risk level
Executive Summary Summary Findings Facilities Finance Human Resources IT Sustainability and Operating Model
Implementation Timeline

OPEN – GB – INFO 5-58December 7-8, 2017
4.2 Finance Individual Opportunities Overview

OPEN – GB – INFO 5-59 December 7-8, 2017
1. Design Future Operating Model (Align Finance Personnel)
Opportunity Synopsis
Name Design Future Operating Model (Align Finance Personnel)
Description
Establish direct reporting lines through the Finance function from campus Finance to system. The direct lines will allow for the establishment of an organization that becomes leaner and more focused on industry leading practice and a smaller size of the overall function. Direct lines will allow financial leadership to simplify and reduce transactional processing effort and increase focus on delivering business insights.
System → Campus (Chancellor, Provost) → College/School/Division (Dean, Executive) → Department (Chair/Executive)Key Dependencies and Risks• Dependent on organizational cooperation• Leadership support throughout the organization• Alignment and support of academic leadership to maintain campus partnering
relationships(Average departmental attrition rate* – 10%)
Stakeholders• Finance leadership at System and campus level• Chancellors, Provosts, Deans, Department Chairs• Finance Operations Team • Fiscal officers at each campus• All resources supporting Finance activities
Benchmarks • 2017 Finance Effectiveness Benchmark Report
“Soft” Benefits Achieved
• Improved line of site to campus related opportunities across the University and increased ability to standardize activities at the campus level• Improve ability of the Finance organization to partner with the campuses, colleges, schools or divisions to develop and manage against their business strategies and plans
Implementation Duration Implementation Risk
Six Months 4
Executive Summary Summary Findings Facilities Finance Human Resources IT Sustainability and Operating Model
Implementation Timeline
Spend Addressed Investment Required
Finance labor costs Investment in training, communication, team building and responding to feedback
Impact to:UM System Central Department Distributed UMKC S&T UMSL
*Three year average across UM System and Columbia Campus

OPEN – GB – INFO 5-60 December 7-8, 2017
2. Identify Opportunities to Consolidate Activities Currently Centralized at the Campus Level
Opportunity SynopsisName Identify Opportunities to Consolidate Activities Currently Centralized at the Campus Level
Description
Further expand shared service focus to include additional Finance and Supply Chain transaction processing areas that are currently centralized at the campus level. Identify Finance and Supply Chain personnel by executing a multi-function activity analysis survey. These decisions should occur as a part of the Finance operating model discussion. Potential areas of benefit include contracting, accounting, gift processing, billing, cash receipts and collections.Key Dependencies and Risks and Stakeholders as noted in Opportunity 1
Benchmarks • Finance benchmark data pulled from Finance Effectiveness Benchmark (“FEB”) database.• UM benchmark data includes core Finance FTEs and estimates on distributed FTEs and Finance support at campuses
“Soft” Benefits Achieved
• Ability to expand standardization of Finance and Supply Chain activities• Allows for further specialization of roles within the shared service center• Improved alignment and business insight support
Implementation Duration Implementation Risk
One Year 3
Executive Summary Summary Findings Facilities Finance Human Resources IT Sustainability and Operating Model
Implementation Timeline
Spend Addressed Investment Required
Finance labor costs Potential one time operating investment to reflect process changes in system(s)
Impact to:
UM System Central Department Distributed UMKC S&T UMSL

OPEN – GB – INFO 5-61 December 7-8, 2017
3. Identify Opportunities to Consolidate Activities Currently Occurring at the College/Department Level
Opportunity SynopsisName Identify Opportunities to Consolidate Activities Currently Occurring at the College/Department Level
Description
Further expand shared service focus to include additional Finance and Supply Chain transaction processing areas that are currently occurring at the college/department level. Identify Finance and Supply Chain personnel by executing a multi-function activity analysis survey. Identify areas of process waste and reduce the number of steps to complete transactions. Rationalize the location of service delivery based on a Finance operating model discussion, ensuring mission supporting activities are maintained via service level agreements and good relationships with customers.Key Dependencies and Risks and Stakeholders as noted in Opportunity 1
Benchmarks • Finance benchmark data pulled from FEB database.• UM benchmark data includes core Finance FTEs and estimates on distributed FTEs and Finance support at campuses
“Soft” Benefits Achieved
• Ability to expand standardization of Finance and Supply Chain activities• Expansion of the shared service center would ultimately allow for a reduction of “admin” roles at the campus • Allows for further specialization of roles within the shared service center• Improved alignment and business insight support
Implementation Duration Implementation Risk
Two Years 5
Executive Summary Summary Findings Facilities Finance Human Resources IT Sustainability and Operating Model
Implementation Timeline
Spend Addressed Investment Required
Finance labor costs Potential one time operating investment to reflect process changes in system(s)
Impact to:
UM System Central Department Distributed UMKC S&T UMSL

OPEN – GB – INFO 5-62 December 7-8, 2017
4. Drive Broader Financial AccountabilityOpportunity Synopsis
Name Align Finance Personnel (Operating Model)
DescriptionDrive broader accountability for financial results and budget targets including margin expectations and adopt an All Funds approach to financial management. Relate financial accountability with decision making across the institution. Add financial accountability to the formal performance appraisal process for leadership across the institution.Key Dependencies and Risks and Stakeholders as noted in Opportunity 1
Benchmarks • Finance benchmark data pulled from FEB database.• UM benchmark data includes core Finance FTEs and estimates on distributed FTEs and Finance support at campuses
“Soft” Benefits Achieved
• Improve accountability for and better alignment of budget and investments consistent with University wide and campus specific strategies• Improve ability to assess, understand and react to YTD budget variances and project YE results from the department level up
Implementation Duration Implementation Risk
One Year 5
Executive Summary Summary Findings Facilities Finance Human Resources IT Sustainability and Operating Model
Implementation Timeline
Spend Addressed Investment Required
Enabler Potential one time operating investment to reflect process changes in system(s)
Impact to:
UM System Central Department Distributed UMKC S&T UMSL

OPEN – GB – INFO 5-63 December 7-8, 2017
5. Improve Business Insight Reporting & Planning Capabilities
Opportunity Synopsis
Name Improve Business Insight Reporting & Planning Capabilities
Description
Improve Business Insight reporting and planning capabilities by defining a consistent approach to analyzing financial results across System, alignment with shorter forecasts and longer term strategic planning improvements and establishing a more robust strategic and annual planning process that includes the ability to generate periodic forecasts that focus on accuracy and a strategic planning cycle with a 3 to 5 year horizon. Promote resources in business insight roles have the skills and capabilities to support. Align data relationships across Finance,Student, and HR administrative pillars to provide better reporting data.Key Dependencies and Risks and Stakeholders as noted in Opportunity 1
Benchmarks • Finance benchmark data pulled from PwC’s Finance Effectiveness Benchmark (FEB) database• UM benchmark data includes core Finance FTEs and estimates on distributed FTEs and Finance support at campuses
“Soft” Benefits Achieved
• Ability to provide management with meaningful analysis to effectively manage the business• Standard set of KPIs to measure business performance• Improved strategic planning, budgeting and forecasting/long range planning• Clearly defined budget and forecast processes and calendar• Uniform level of data detail to allow for appropriate management reporting analysis and increased visibility
Implementation Duration Implementation Risk
One Year 4
Executive Summary Summary Findings Facilities Finance Human Resources IT Sustainability and Operating Model
Implementation Timeline
Spend Addressed Investment Required
Enabler Potential one time operating investment to reflect process changes in system(s)
Impact to:
UM System Central Department Distributed UMKC S&T UMSL

OPEN – GB – INFO 5-64 December 7-8, 2017
6. Further Development of Finance Talent Development Strategy
Opportunity Synopsis
Name Further Development of Finance Talent Development Strategy
Description
Further development of a robust Finance talent development strategy to build a network of strong Finance resources across the system. This will help promote the right people with the requisite leadership and technical skills are in the right Finance jobs to perform their respective roles. The Finance function should work to create career pathways and job rotation programs to build an internal talent base with a diverse skill set. There is an opportunity to leverage existing campus programs around Finance training to build a more comprehensive and consistent Finance knowledgebase.Key Dependencies and Risks and Stakeholders as noted in Opportunity 1
Benchmarks • Finance benchmark data pulled from FEB database.• UM benchmark data includes core Finance FTEs and estimates on distributed FTEs and Finance support at campuses
“Soft” Benefits Achieved
• More engaged Finance workforce• Consistent application of Finance activities and processes• Reduced recruitment costs and more effective talent identification and placement
Spend Addressed Investment Required
Learning and development funds Annual investment in training
Implementation Duration Implementation Risk
Two Years 3
Impact to:
UM System Central Department Distributed UMKC S&T UMSL
Executive Summary Summary Findings Facilities Finance Human Resources IT Sustainability and Operating Model
Implementation Timeline

OPEN – GB – INFO 5-65December 7-8, 2017
4.3 Supply Chain

OPEN – GB – INFO 5-66 December 7-8, 2017
Supply Chain Overview and SummaryScope & Approach • Supply Chain is a sub-department of Finance that is
responsible for managing the majority of the university’s non-labor spend
• As a centralized shared service, it provides contracting and Supply Chain services to all campuses
• This review focused on contracting practices and identification of measures to reduce non-labor spend around supplies and purchased services.
• Vendor contract review covered the following areaso Office supplies o Facilities (Elevators & Janitorial Services / Supplies)o Food Serviceso One Card
Findings• Supply Chain identified $3.7M to $4.0M in annual net savings• Vendor contract are consistent with industry leading practices
o Well defined scopeo Performance expectation clauseso Line item pricingo Volume based rebateso Clearly established remediation process
• UM would benefit by having a Supply Chain function that can better address non-labor spend through improved enforcement
• GL account code review will result in more accurate analytics that will feed improved spend management and contracting
• Department’s centralized model is in line with leading practices for Supply Chain management structure and strategy
Opportunity Implementation Duration Implementation Risk
1 Support Operating Model Redesign for Non-Labor Spend Two Year 22 Improved Enforcement of Supply Chain Controls Near-Term 23 Increase Spend Under Management Near-Term 24 Enhance Contract Review Process Near-Term 2
Totals
Executive Summary Summary Findings Facilities Finance Human Resources IT Sustainability and Operating Model
Implementation Timeline
Note: Annual savings are net of non-capital investments

OPEN – GB – INFO 5-67 December 7-8, 2017
Office Supplies
Office Supply Utilization:• As a system, University of Missouri supply
utilization is below benchmark ($163 / FTE versus benchmark of $200 / FTE).
• The majority of spend was purchased through Show-me Shop (SMS) $3.2M, with only a small amount procured through P-cards (~$100k).
Pricing & Contracting• Opportunities currently underway to continue to shift spend toward pre-negotiated contracts / Show Me Shop• Contracting is strong across supply vendors, inclusive of many leading practice terms and conditions:
o MSRP Discount (3-50% off retail) and Volume Rebateso Vendor profitability transparency (i.e., Hillyard ROS 1.5%)o Prompt Pay Discounto Capital equipment volume discountso Market basket pricing
Supply pricing is largely on contract, with competitive pricing terms and contract conditions in place. Utilization for office supplies is better than benchmark across the system.
* Excludes expenses from The Home Depot ($200k), Kaldis Coffee ($50k), Klein Surgical Systems ($2k), and 50% of spend from Sam’s Club ($175k).
$197 $184
$170 $169 $156
$116
$0
$50
$100
$150
$200
$250
ROLLA KCITY COLUM STLOU UMSYS HOSPT
Office Supply Benchmarking ($/FTE)
Benchmark Target = $200
Executive Summary Summary Findings Facilities Finance Human Resources IT Sustainability and Operating Model
Implementation Timeline

OPEN – GB – INFO 5-68 December 7-8, 2017
Commercial Card Program Expense
• University of Missouri has a strong commercial card program in place and spend in the top tier ($90M+) for qualifying rebates. The system has continually capitalized on the program, steadily shifting spend to commercial cards as appropriate.
• Commercial card expense is governed by robust policies and procedures, however there are minimal consequences if staff elects to use p-cards over pre-established forms of payment (PO, established contracts, etc.)
• This spend includes SUA, which needs to be targeted for growth (e.g. supplier payment terms, settlement options, et al)
• Future focus will be around building the SUA program as form of settlement to increase overall card program spend, as individual card spend will likely decline as more centralized contracts are developed.
Commercial Card is effectively utilized, with market competitive terms and rebates. This program includes One Card utilized for purchasing and travel, and single use account (SUA). FY17 program expense was ~$150M, qualifying for $2.5M in rebates.
Executive Summary Summary Findings Facilities Finance Human Resources IT Sustainability and Operating Model
Implementation Timeline
$1.1M $1.1M $1.1M
$1.5M $1.5M
$1.1M
$2.1M$2.3M
$2.5M
$2.8M
$2.5M
$.M
$.5M
$1.M
$1.5M
$2.M
$2.5M
$3.M
2007 2008 2009 2010 2011 2012 2013 2014 2015 2016 2017
University of Missouri Historical Rebates
• 2012: Program moved to the Higher Education Consortium contract resulting in rebate basis point increase of .32. Programmed dipped in 2012, due to the program moving from a calendar year rebate grid to a fiscal year. 2012 only reflects rebate against 6 months of spend.
• 2013: $20M decrease in card program spend from 2011 to 2013, with a rebate gain of over $600K resulting from the new contract.
• 2015: Higher Ed Consortium contract was renegotiated for an additional 5 year term. New rebates were effective in 2016. Once again, we saw a program drop in spend of $22M compared to the previous year but still had an increase in rebate of $321K
• As card spend continues to decline, the bank has now offered payment term escalators to increase rebate, with the intent of keeping our program neutral over the next year.
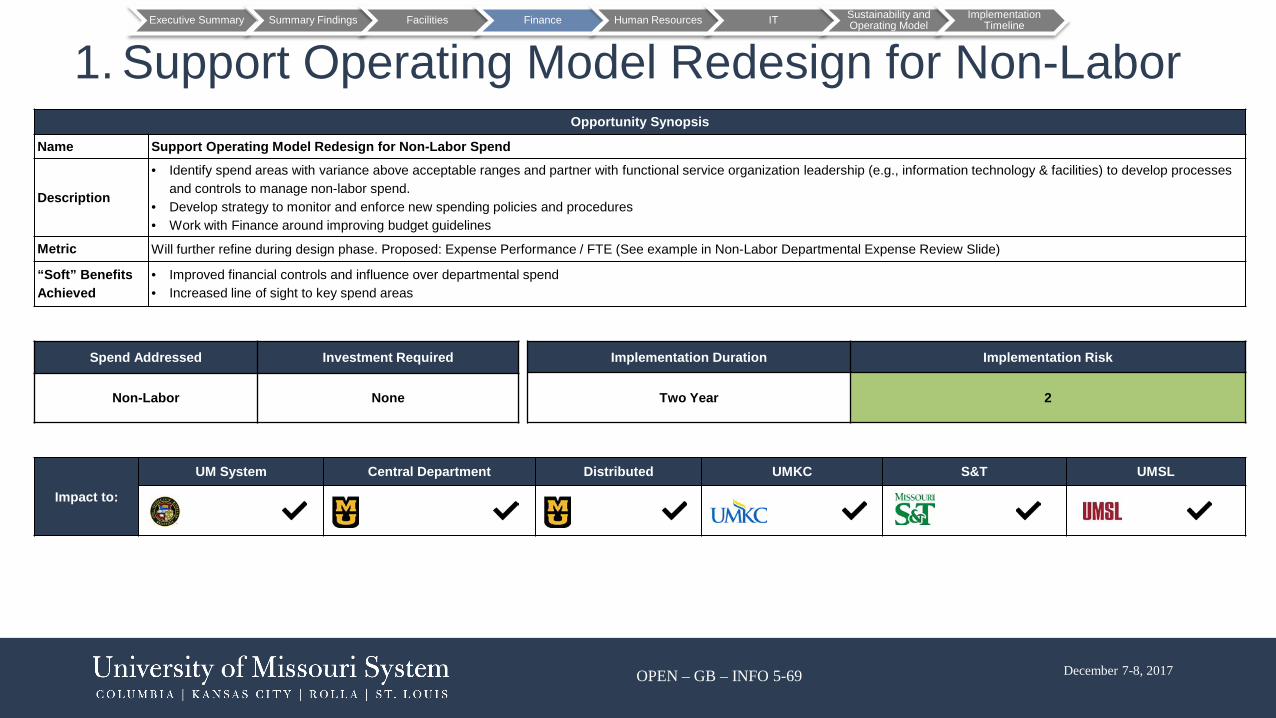
OPEN – GB – INFO 5-69 December 7-8, 2017
1. Support Operating Model Redesign for Non-LaborOpportunity Synopsis
Name Support Operating Model Redesign for Non-Labor Spend
Description
• Identify spend areas with variance above acceptable ranges and partner with functional service organization leadership (e.g., information technology & facilities) to develop processes and controls to manage non-labor spend.
• Develop strategy to monitor and enforce new spending policies and procedures• Work with Finance around improving budget guidelines
Metric Will further refine during design phase. Proposed: Expense Performance / FTE (See example in Non-Labor Departmental Expense Review Slide)
“Soft” Benefits Achieved
• Improved financial controls and influence over departmental spend• Increased line of sight to key spend areas
Spend Addressed Investment Required
Non-Labor None
Implementation Duration Implementation Risk
Two Year 2
Executive Summary Summary Findings Facilities Finance Human Resources IT Sustainability and Operating Model
Implementation Timeline
Impact to:
UM System Central Department Distributed UMKC S&T UMSL

OPEN – GB – INFO 5-70 December 7-8, 2017
2. Improve Enforcement of Supply Chain ControlsOpportunity Synopsis
Name Improve Enforcement of Supply Chain Controls
Description
Increase administrative support for Supply Chain’s enforcement of department spend that is not currently on contract.• Reduce confirming orders which comprise ~12% of total Purchase Orders (POs)• Direct all spend through approved appropriate channels Update policy language to allow Supply Chain to enforce departmental accountability
Metric Spend Under Management / Total Spend
“Soft” Benefits Achieved
• Improved line of site to on/off contract spend• Reduction in rogue / unapproved spend for non-emergent purposes• Additional checks and balances for uncontrolled spend
Executive Summary Summary Findings Facilities Finance Human Resources IT Sustainability and Operating Model
Implementation Timeline
Near-Term Opportunity
Spend Addressed Investment Required
Non-Labor None
Implementation Duration Implementation Risk
Near Term 2
Impact to:
UM System Central Department Distributed UMKC S&T UMSL

OPEN – GB – INFO 5-71 December 7-8, 2017
3. Increase Spend Under ManagementOpportunity Synopsis
Name Increase Spend Under Management
Description
Add additional suppliers/contracts to Show Me Shop (SMS). Focus initially on adding a minimum of 10 suppliers/contracts to SMS. New contracts being considered:
Review Maintenance Repair and Operations (MRO) contracts to determine viability of adding new suppliers or enhancing current contracts.Expand contract development for goods and services currently settled under non PO vouchers, confirming orders, direct reimbursements, et al
Metric Spend Under Contract / Total Spend
“Soft” Benefits Achieved
• Reduced off contract spend• Delivers consistent, defensible, and centralized contracting services • Increased spend visibility due to streamlined reporting and centralization• Increase policy compliance
Executive Summary Summary Findings Facilities Finance Human Resources IT Sustainability and Operating Model
Implementation Timeline
• Amazon Marketplace • Lowes • American Education Supply • Standard Textile• MWI Veterinary Supply • Sherwin Williams and/or PPG Paints • Staples Promotional Products
Near-Term Opportunity
Spend Addressed Investment Required
Non-Labor None
Implementation Duration Implementation Risk
Near Term 2
Impact to:
UM System Central Department Distributed UMKC S&T UMSL
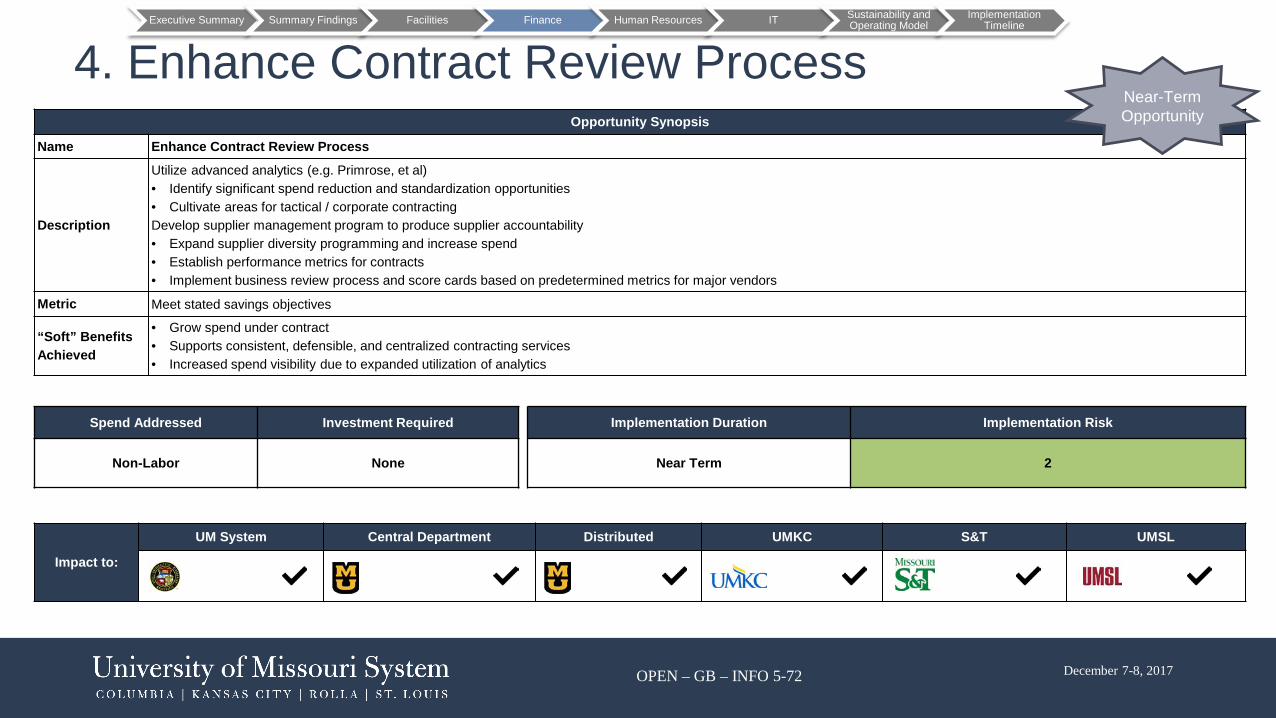
OPEN – GB – INFO 5-72 December 7-8, 2017
4. Enhance Contract Review ProcessOpportunity Synopsis
Name Enhance Contract Review Process
Description
Utilize advanced analytics (e.g. Primrose, et al)• Identify significant spend reduction and standardization opportunities• Cultivate areas for tactical / corporate contracting Develop supplier management program to produce supplier accountability• Expand supplier diversity programming and increase spend• Establish performance metrics for contracts• Implement business review process and score cards based on predetermined metrics for major vendors
Metric Meet stated savings objectives
“Soft” Benefits Achieved
• Grow spend under contract• Supports consistent, defensible, and centralized contracting services • Increased spend visibility due to expanded utilization of analytics
Executive Summary Summary Findings Facilities Finance Human Resources IT Sustainability and Operating Model
Implementation Timeline
Near-Term Opportunity
Spend Addressed Investment Required
Non-Labor None
Implementation Duration Implementation Risk
Near Term 2
Impact to:
UM System Central Department Distributed UMKC S&T UMSL

OPEN – GB – INFO 5-73December 7-8, 2017
5. Human Resources Workstream
5.1 – Human Resources Workstream Summary
5.2 – Individual Opportunity Overviews
5.3 – HR Observations

OPEN – GB – INFO 5-74 December 7-8, 2017
Workstream Approach Observations Key Recommendations
• Data used
o FY17 GL and payroll file
• Scope focused on traditional human resources and operations functions
• Met with 11 Human Resources leaders (includes 2 from Engagement Leadership category) throughout the system and Columbia campus as well as representative staff
• Lack of clear HR strategy, high turnover and capacity issues have inhibited ability to advance HR services in the organization and become a strategic business partner vs. purely transactional.
• Decentralized structure and lack of standardization of policies/processes and availability training for non-HR professionals creates inefficiencies, redundancies and legal risk.
• PeopleSoft 9.2 has been implemented, but efficiencies haven’t been realized due to lack of full integration with HR processes and lack of manager and employee self-service tools.
• HR staff are excited about new HR leadership, but historical tension between campuses and, UM System central office poor communication and lack of clear decision rights has created “culture of fear” for HR staff in recent years
• Launch a formal HR Transformation effort focused on standardizing HR processes and governance structures, optimizing the usage of HR technology and redesigning the HR service delivery model
• Invest in core HR capabilities that are currently missing or underutilized and in HR technology (e.g., self-service, case management tools) to drive efficiencies and create a seamless employee experience
• Involve campus leaders in the developing of a system-wide “people strategy” and building consensus around the role that HR plays at UM in driving the “people strategy”, business strategy and departmental workforce needs
• Redesign health benefits offerings to align to industry standards and consider adjusting salary levels to align to market levels
SummaryThe Human Resources workstream reviewed $19.3M of spend and identified two opportunities with a projected net savings of $3.3M to $4.6M and an additional $17.5M to $30.4M in projected savings from rationalizing benefits offerings
Executive Summary Summary Findings Facilities Finance Human Resources IT Sustainability and Operating Model
Implementation Timeline
Note: Annual savings are net of non-capital investments

OPEN – GB – INFO 5-75 December 7-8, 2017
1 Administrative Assistant ratios included in scope for Human Resources team since any workforce related changes would have to be coordinated through the HR function2 Benefits included in Human Resources scope, although the addressable spend for Human Resources excludes total spend on benefits
ScopeHR scope includes generally all the functions that report in to HR leadership at MU and UM System
Executive Summary Summary Findings Facilities Finance Human Resources IT Sustainability and Operating Model
Implementation Timeline
Labor Areas Non-Labor Areas Out of Scope
• HR Administration & Strategic Planning• Recruiting & Staffing• Learning & Development• Performance Management• Talent Management• Organizational Effectiveness & Culture• Employee Relations / Labor Relations • Support Services Center• Total Rewards & Compensation• CAPS (Core Administrative Processing Services)• HR Consultants / Specialists• Workforce Analytics• HRIS• Ratio of Executives Served per Administrative
Assistant1
• Operating expensesrelated to running HR functions
• Benefits Offerings (Medical, Dental, Retirement, etc.)2
• N/A – all typical HR functions are considered in scope
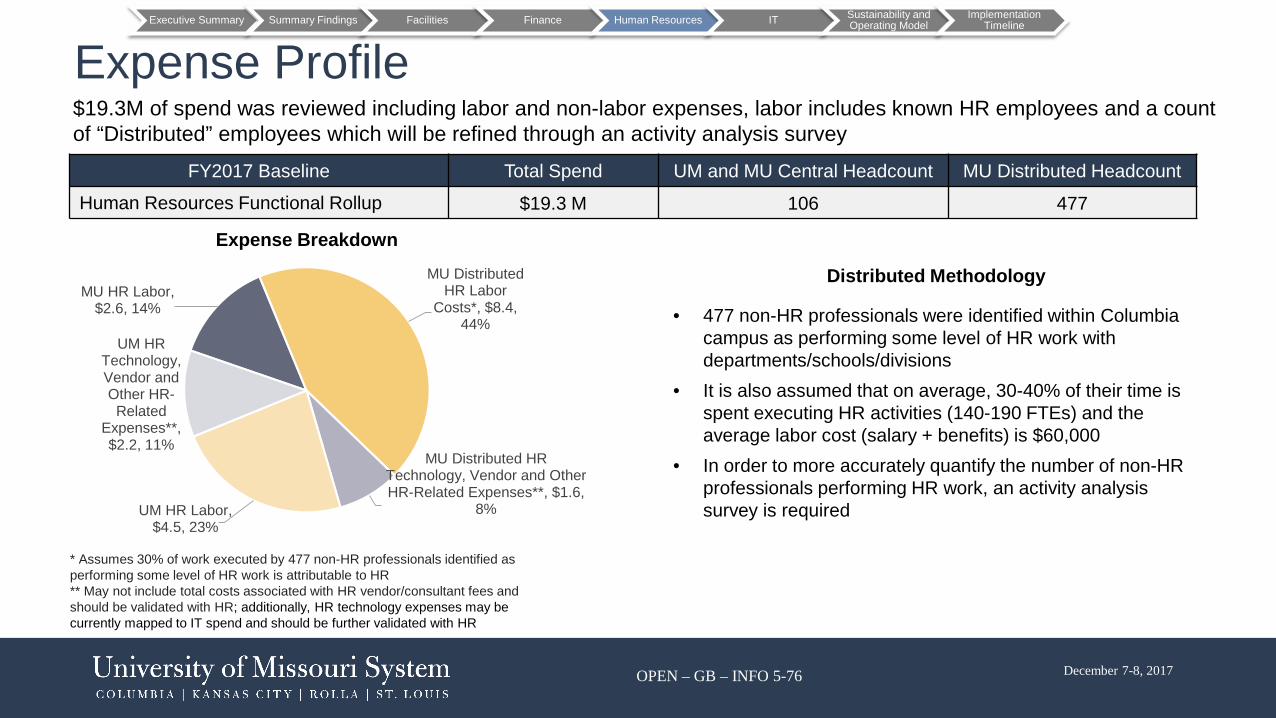
OPEN – GB – INFO 5-76 December 7-8, 2017
FY2017 Baseline Total Spend UM and MU Central Headcount MU Distributed Headcount
Human Resources Functional Rollup $19.3 M 106 477
Expense Breakdown
Expense Profile
Distributed Methodology
• 477 non-HR professionals were identified within Columbia campus as performing some level of HR work with departments/schools/divisions
• It is also assumed that on average, 30-40% of their time is spent executing HR activities (140-190 FTEs) and the average labor cost (salary + benefits) is $60,000
• In order to more accurately quantify the number of non-HR professionals performing HR work, an activity analysis survey is required
$19.3M of spend was reviewed including labor and non-labor expenses, labor includes known HR employees and a count of “Distributed” employees which will be refined through an activity analysis survey
Executive Summary Summary Findings Facilities Finance Human Resources IT Sustainability and Operating Model
Implementation Timeline
* Assumes 30% of work executed by 477 non-HR professionals identified as performing some level of HR work is attributable to HR** May not include total costs associated with HR vendor/consultant fees and should be validated with HR; additionally, HR technology expenses may be currently mapped to IT spend and should be further validated with HR
MU HR Labor, $2.6, 14%
MU Distributed HR Labor
Costs*, $8.4, 44%
MU Distributed HR Technology, Vendor and Other HR-Related Expenses**, $1.6,
8%UM HR Labor, $4.5, 23%
UM HR Technology, Vendor and Other HR-Related
Expenses**, $2.2, 11%

OPEN – GB – INFO 5-77 December 7-8, 2017
Opportunity Summary
1 Savings opportunity primarily resides in departmental spend
Executive Summary Summary Findings Facilities Finance Human Resources IT Sustainability and Operating Model
Implementation Timeline
Opportunity Implementation Duration Implementation Risk
1 HR Transformation1
Efficiencies in Distributed HR Spend Two Years 5Efficiencies in HR Spend Two Years 4Investments in Critical HR Capabilities and Roles Two Years 4Optimization of HR Technology Two Years 4
Opportunity Implementation Duration Implementation Risk
2 Total Rewards Rationalization Two Years 53 Administrative Assistant Realignment Six Months 3
Note: Annual savings are net of non-capital investments
• The Human Resources workstream identified $2.2M to $2.4M in net HR related benefits• Total Rewards savings is $17.5M to $30.4M in total savings • Administrative Assistant Realignment is an additional $1.1M to $2.2M in savings

OPEN – GB – INFO 5-78 December 7-8, 2017
Implementation Risk Summary
Risk Assessment Key
Complexity Assessment based on the number of actions required to implement the opportunity and the breadth of stakeholder buy-in needed
Investments Assessment based on amount of technological, financial, personnel, and/or “soft” investments needed to implement the opportunity
Stakeholder Impact
Assessment based on the opportunity’s impact to normal workflow as well as the perceived impact of the opportunity to stakeholders
Implementation Risk Score is an index that factors in (1) Complexity (2) Investment Required (3) Impact to Stakeholders
Low Risk – Limited risk to internal stakeholders; proceed with implementation, 1- 2
Moderate Risk – Develop and execute change management, Track and manage progress closely 3
High Risk – Develop tactical work plan, execute change management strategy, involve key leaders 4 -5
Opportunity Complexity InvestmentsStakeholder
Impact Total Risk1 HR Transformation 5 5 2 4
Opportunity Complexity InvestmentsStakeholder
Impact Total Risk2 Total Rewards Rationalization 5 4 5 5
3 Administrative Assistant Realignment 2 2 3 3
HR Transformation and Total Rewards will require a thoughtful approach due to risk scoring
Executive Summary Summary Findings Facilities Finance Human Resources IT Sustainability and Operating Model
Implementation Timeline
OPEN – GB – INFO 5-79 December 7-8, 2017
5.2 Human Resources Individual OpportunitiesOverview
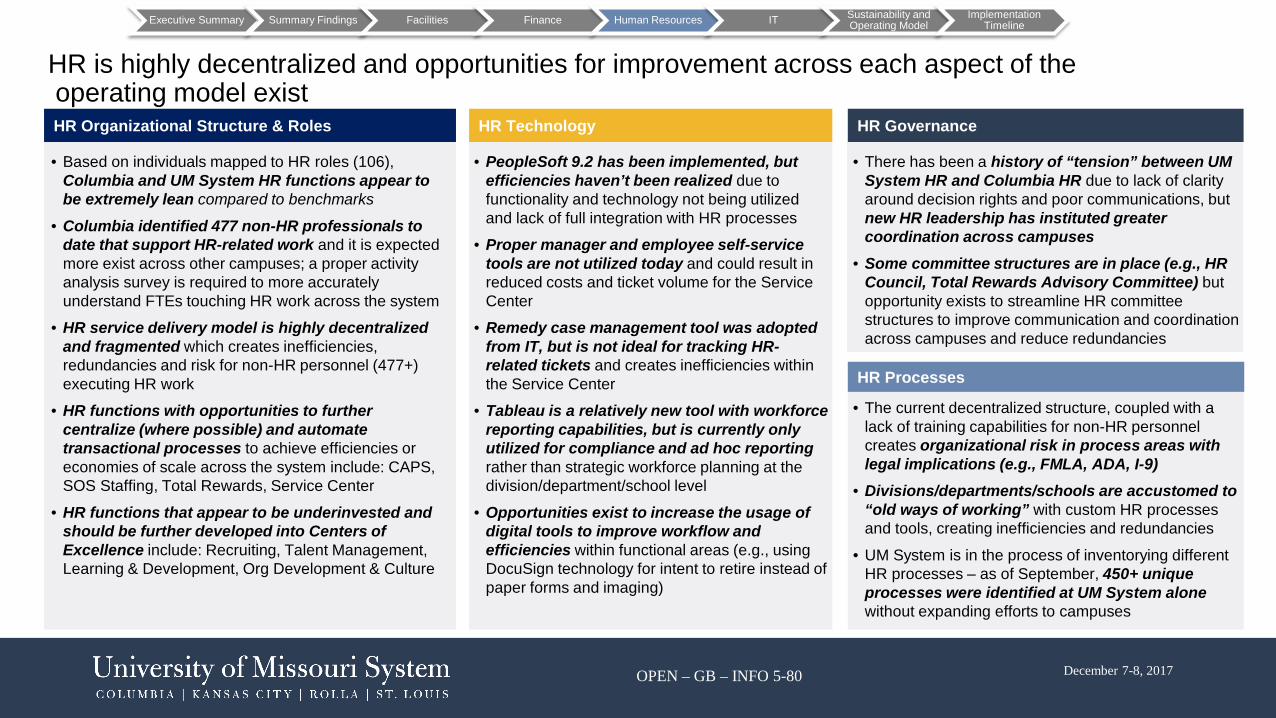
OPEN – GB – INFO 5-80 December 7-8, 2017
HR is highly decentralized and opportunities for improvement across each aspect of the operating model exist
• Based on individuals mapped to HR roles (106), Columbia and UM System HR functions appear to be extremely lean compared to benchmarks
• Columbia identified 477 non-HR professionals to date that support HR-related work and it is expected more exist across other campuses; a proper activity analysis survey is required to more accurately understand FTEs touching HR work across the system
• HR service delivery model is highly decentralized and fragmented which creates inefficiencies, redundancies and risk for non-HR personnel (477+) executing HR work
• HR functions with opportunities to further centralize (where possible) and automate transactional processes to achieve efficiencies or economies of scale across the system include: CAPS, SOS Staffing, Total Rewards, Service Center
• HR functions that appear to be underinvested and should be further developed into Centers of Excellence include: Recruiting, Talent Management, Learning & Development, Org Development & Culture
HR Organizational Structure & Roles
• PeopleSoft 9.2 has been implemented, but efficiencies haven’t been realized due to functionality and technology not being utilized and lack of full integration with HR processes
• Proper manager and employee self-service tools are not utilized today and could result in reduced costs and ticket volume for the Service Center
• Remedy case management tool was adopted from IT, but is not ideal for tracking HR-related tickets and creates inefficiencies within the Service Center
• Tableau is a relatively new tool with workforce reporting capabilities, but is currently only utilized for compliance and ad hoc reporting rather than strategic workforce planning at the division/department/school level
• Opportunities exist to increase the usage of digital tools to improve workflow and efficiencies within functional areas (e.g., using DocuSign technology for intent to retire instead of paper forms and imaging)
HR Technology
• The current decentralized structure, coupled with a lack of training capabilities for non-HR personnel creates organizational risk in process areas with legal implications (e.g., FMLA, ADA, I-9)
• Divisions/departments/schools are accustomed to “old ways of working” with custom HR processes and tools, creating inefficiencies and redundancies
• UM System is in the process of inventorying different HR processes – as of September, 450+ unique processes were identified at UM System alonewithout expanding efforts to campuses
HR Processes
• There has been a history of “tension” between UM System HR and Columbia HR due to lack of clarity around decision rights and poor communications, but new HR leadership has instituted greater coordination across campuses
• Some committee structures are in place (e.g., HR Council, Total Rewards Advisory Committee) but opportunity exists to streamline HR committee structures to improve communication and coordination across campuses and reduce redundancies
HR Governance
Executive Summary Summary Findings Facilities Finance Human Resources IT Sustainability and Operating Model
Implementation Timeline

OPEN – GB – INFO 5-81 December 7-8, 2017
There is consensus around the need to redefine and elevate the role of HR
• Recent leadership changes (University President, Interim CHRO) have resulted in an opportunity to rethink UM’s approach to becoming an “employer of choice” and the role HR plays in enabling UM’s strategy
• In recent years, strong efforts have been made to embed HR strategic opportunities into the overarching strategy (e.g., 2020 Vision for Excellence), but the strategy lacks a common definition around a “people strategy” and the role HR plays in driving it forward across all campuses
• As a result of the current fragmentation of the delivery of HR services across campuses, there are different viewpoints around the service that departments/schools/divisions expect from HR
• Historically, Total Rewards has been utilized as a primary lever for employee satisfaction, but other elements of a proper “people strategy” are missing (e.g., career laddering, mobility, recruitment, learning & development, culture) that should inform the role HR plays
• Some elements of a “people strategy” are defined, but not currently integrated with HR or are not properly being used to drive business needs/goals (e.g., diversity & inclusion, workforce analytics)
• Climate survey results were recently presented by Rankin & Associates, but no formal, annual employee engagement survey tool exists
“We are in need of a real strategy around the role of HR”
“We need greater collaboration between HR and academics”
“HR has struggled to find its place in the organization”
“Previous consulting reports called HR too ‘transactional’, but our current model, and the expectations of departments around the old ways of working, prevent us from becoming more strategic in nature”
Observations Representative Quotes
Executive Summary Summary Findings Facilities Finance Human Resources IT Sustainability and Operating Model
Implementation Timeline

OPEN – GB – INFO 5-82 December 7-8, 2017
Business Unit Total # Employees1
Total # HR Employees2
Employee : HR Ratio3 MU Distributed4 Adjusted # of
HR Employees5
Adjusted Employee : HR
Ratio6
UM System 552.0 74.0 - 74.0
Columbia 19,514.0 32.0 477.0 509.0
Total 20,066.0 106.0 189.3 477.0 583.0 34.4
Initial benchmarking indicates central HR is extremely lean; however, when distributed HR headcount is included, UM is below bottom quartile
1 Total headcount across business units2 Total HR headcount who report into HR3 HR headcount ratio measures the number of regular headcount employees supported by HR employees who report into HR4 Additional headcount embedded within business units that provide HR support; activity analysis required to validate headcount and business unit allocation5 # of Employees HR + MU Distributed HR Headcount6 Revised ratio incorporating # of Employees HR + MU Distributed7 Benchmarks from the 2016 Saratoga Institute
Benchmarking of current HR
headcount indicates UM and MU are
above top quartile
However, when MU’s 477 distributed, non-
HR personnel are included, UM and MU
are below bottom quartile
Top Quartile7
Median7
Bottom Quartile7
583
159
Total HR Staff
248
340
106
An additional 50 FTEs would be
required to move within the Median-Top Quartile range
126
81
59
HR Ratio
34.4
189.3
In order to accurately assess total FTEs performing HR activities across campuses, it is recommended an activity analysis is performed in order to properly validate opportunities to achieve efficiencies and/or areas of investment.
Executive Summary Summary Findings Facilities Finance Human Resources IT Sustainability and Operating Model
Implementation Timeline

OPEN – GB – INFO 5-83 December 7-8, 2017
There are two primary opportunities to drive efficiencies and elevate the role of HR in the current organizational structure
UM System
Columbia UM Healthcare Kansas City St. Louis Rolla
Excluded from assessment
74 FTEs
32 FTEs
Total Rewards
Support Services Center
477 individualsFTEs unknown at this time
Unknown at this time
CompensationWorkforce Analytics
Organizational Effectiveness &
CultureHRIS
Talent Acquisition
(Staff)
Talent Acquisition
(Faculty)Performance Management
Learning & Development
Talent Acquisition(UM System)
HR Strategic Planning
New Employee
RegistrationTemporary
Staffing
HR Website
Learning & Development
Unknown at this time
Unknown at this time
Unknown at this time
Performance Management
Employee & Labor
Relations / HR Business
Partners
Div
isio
n /
Scho
ol /
Dep
t
Function supports all locations
Function supports UM System
Function supports Columbia campus
Opportunity #2:Redesign HR delivery
model between campus HR and
divisions/schools/depts. to (a) mitigate risks of non-HR personnel executing specialized HR work and (b) drive greater value by properly managing and fulfilling the workforce
needs within each division/school/dept.
Opportunity #1:Realign existing HR
resources and organizational structure to align to leading practices to (a) better support UM’s
“people strategy”, (b) create economies of scale across campuses and (c) drive consistency in the delivery of HR services
Cam
pus
HR
UM
Sy
stem
HR
Talent Acquisition (Executives)
Employee & Labor Relations
Executive Summary Summary Findings Facilities Finance Human Resources IT Sustainability and Operating Model
Implementation Timeline
Payroll Processing /
CAPS
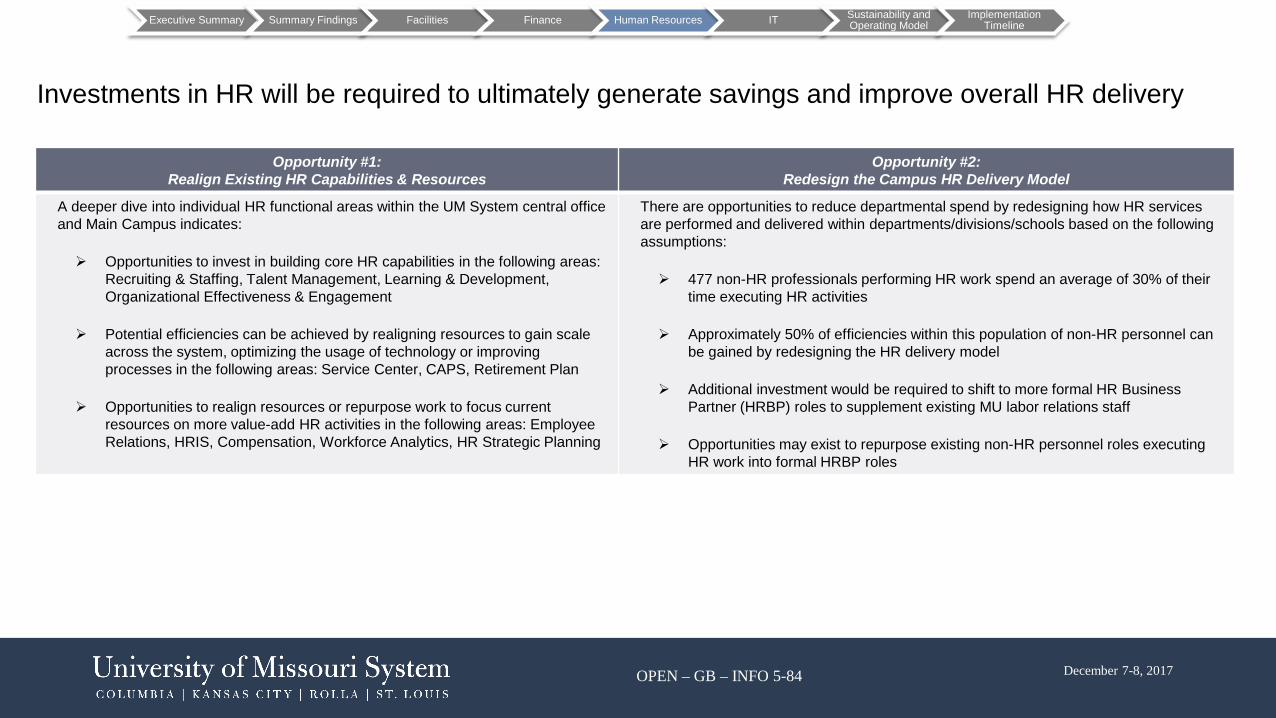
OPEN – GB – INFO 5-84 December 7-8, 2017
Investments in HR will be required to ultimately generate savings and improve overall HR delivery
Executive Summary Summary Findings Facilities Finance Human Resources IT Sustainability and Operating Model
Implementation Timeline
Opportunity #1:Realign Existing HR Capabilities & Resources
Opportunity #2: Redesign the Campus HR Delivery Model
A deeper dive into individual HR functional areas within the UM System central office and Main Campus indicates:
Opportunities to invest in building core HR capabilities in the following areas: Recruiting & Staffing, Talent Management, Learning & Development,Organizational Effectiveness & Engagement
Potential efficiencies can be achieved by realigning resources to gain scale across the system, optimizing the usage of technology or improving processes in the following areas: Service Center, CAPS, Retirement Plan
Opportunities to realign resources or repurpose work to focus current resources on more value-add HR activities in the following areas: Employee Relations, HRIS, Compensation, Workforce Analytics, HR Strategic Planning
There are opportunities to reduce departmental spend by redesigning how HR services are performed and delivered within departments/divisions/schools based on the following assumptions:
477 non-HR professionals performing HR work spend an average of 30% of their time executing HR activities
Approximately 50% of efficiencies within this population of non-HR personnel can be gained by redesigning the HR delivery model
Additional investment would be required to shift to more formal HR Business Partner (HRBP) roles to supplement existing MU labor relations staff
Opportunities may exist to repurpose existing non-HR personnel roles executing HR work into formal HRBP roles

OPEN – GB – INFO 5-85 December 7-8, 2017
In order to drive efficiencies and create a seamless employee experience, the portfolio of HR technology should be more closely assessed and coordinated with IT to develop a proper business case outlining specific investment needs and resource requirements
PeopleSoft 9.2 HCM Self-Service Case Management Tableau Other HR Technologies
Opportunities to reassess usage of HRtechnology
• Assess opportunities within current platform to enable functionality that will result in increased efficiencies and visibility into HR activities (e.g., applicant tracking, candidate communication, absence management, benefits administration)
• Implement manager and employee self-service tools (e.g., Oracle) to provide all managers and employees with a single point of entry for HR information and processes, empower managers and improve HR workflow across campuses and UM System.
• Optimize, upgrade or replacecurrent case management tool (Remedy) with another HR case management tool to drive efficiencies within the Service Center and improve customer satisfaction
• Explore usage of Tableau functionality and identify opportunities to access and/or automate reporting for divisions / departments / schools to support recruiting and workforce planning needs
• Assess effectiveness and opportunities to enhance UM and MU employee web portals to align to delivery model
• Assess opportunities to increase the usage of digital tools to improve efficiencies infunctional areas (e.g., DocuSign for intent to retire forms)
• Assess ability to integrate phone tree capabilities for all Shared Service functions (e.g., IT, HR, Payroll)
An integrated HR technology strategy should be developed to support the long-term HR service delivery model and evolving needs of UM
By optimizing the usage of technology and embracing a cloud-based, employee-centric view, organizations can see structural benefits that lie beyond technology advantages. This digital model makes it possible to connect various HR opportunities and technology across the enterprise. It integrates
design, user experience, and the nature of service delivery to create a consistent, user-friendly and impactful environment - making HR more effective.
Executive Summary Summary Findings Facilities Finance Human Resources IT Sustainability and Operating Model
Implementation Timeline

OPEN – GB – INFO 5-86 December 7-8, 2017
The following framework can be used as a guideline for redesigning the HR delivery model
Strategic Business Partners(Local Delivery)
• Focused on talent delivery and outcomes
• Drives local delivery and execution of system-wide strategies
• Balances unique business unit needs with enterprise
• Integral partner with the business to review results, develop and execute future workforce plans to achieve business targets
Shared Service Center(Transactions and Administration)
• Shared service center to manage requests and administrative activities
• Dedicated customer service center for call intake and basic to intermediate issue resolution
Centers of Excellence(System, Process and Policy)
• Development and execution of HR strategy, policies and procedures
• Delivers guidance and policy to Shared Service Center and receives feedback to adjust policies
• Proactive business focus to drive continuous improvementH
R C
apab
ilitie
s
Aligning HR service and business direction
solving employee’s HR issues strategic planning for the year
Tier 1 – 50%Initial routing to
specialist in requested topic area; team will be skilled in multiple
disciplines
Tier 3 – 20%Subject Matter Experts
Tier 2 – 30%Specialist in specific
topic areaEmployees
Strategic Business PartnersInstitutional Leaders
Tier 0 – Self Service If resolution can occur via self service, greater % would be solved at tier 0 prior to going to
tier 1HR
Ser
vice
Del
iver
yHR Conceptual Organizational Structure
Executive Summary Summary Findings Facilities Finance Human Resources IT Sustainability and Operating Model
Implementation Timeline

OPEN – GB – INFO 5-87 December 7-8, 2017
As proper investments are made in HR’s capabilities, delivery model and technology, UM can align more closely to a leading practice HR service delivery model
HR Leadership – Sets Strategy
“High Touch”Filter
“Resolution”Filter
Planning & Policy Resolution
TechnologyFilter
Institutional Leaders
Managers
Current employees
Applicants
Former employees
Schools
Divisions
HR Customers
• Develop and interpret policy• Decide on exception requests• Resolve referred questions and
complex issues requiring expert knowledge• Provide information on policies and
procedures • Support self- service issues• Create service requests which require
specialist handling
HR Support:• Recruiting • Learning Admin • Performance Mgmt.• Data Management• HR Analytics/Reporting(standard & ad-hoc)• Compensation & Benefits Admin
Contact CenterHR Shard ServiceSupport
Tier 2
Tier 1
Tier 3
Center of Excellence HRBP
Self – service
Tier 0• Information• Transactions• Online Inquiries
Departments
HR Service Delivery Model
Executive Summary Summary Findings Facilities Finance Human Resources IT Sustainability and Operating Model
Implementation Timeline

OPEN – GB – INFO 5-88 December 7-8, 2017
Gaining alignment around a “people strategy” is at the core of shifting HR to a more strategic function…
People Processes Technology
HR’s RoleEnables execution of
strategic prioritiesthroughout the organization
Business Strategy Sets direction and
priorities for the organization
People Strategy Determines people programs,
plans, and opportunities to deliver business goals
Drives
Prioritizes Supports
Executes
• Understand business strategy
• Develop and drive execution of aligned talent strategies
• Equip and enable business leaders and managers with the tools to effectively manage talent
• Manage its own HR costs and measure HR’s impact on financial performance
• Measure the return on human capital and ROI of talent programs
HR must have the capabilities to:
Measurement (SAMPLE)
Develop High Potential Leaders
Engage Employees
Improve Quality of Hire
Invest in Employee Training & Development
Pay Employees Appropriately
Develop Culture
Develop a nimble, talented workforce
Become an “employer of choice” and improve employer reputation
Bench Strength
Employee Engagement Scores
Quality Hire Rate
Training Cost Factor
Compa-Ratio
Average Tenure, Voluntary Separation
Expand and strengthen programs that improve the lives of citizens of Missouri, the nation and the world
Build the Mizzou Advantage to capitalize on existing strengths and bring new international distinction to MU
Goal #1
Goal #2
Retain High Performers
Increase Workforce Productivity
Enable a Diverse & Inclusive Workforce
Develop a sustainable workforce
Retention Rate
Enrollment per FTE, HR Cost per Employee
Diverse Hires
Promote MU has the infrastructure and human/ financial resources to support innovation and excellence
Goal #3
Business Strategies
People Strategies
People Drivers
Outcome Measures
Alignment of HR’s Role in the Organization
Executive Summary Summary Findings Facilities Finance Human Resources IT Sustainability and Operating Model
Implementation Timeline

OPEN – GB – INFO 5-89 December 7-8, 2017
… and involves defining UM’s desired Employee Value Proposition and the role HR plays in enabling the “EVP”
Instilling a sense of pride in where you work: • Create a sense of community and belonging• Recognition of hard work, new ideas, and driving employee desire to
stay in face of competing offers• Strong employer brand recognition• Creating an environment that you would recommend to friends /
familyCreating an environment where employees feel heard / valued:• Creating a “family feel” where employees can build relationships and
friendships with colleagues• Teamwork is valued, everyone matters, and “we’re all in it together”• Competitive pay and benefits commensurate with value addBuilding a platform for continuous employee development:• Working with talented colleagues who challenge one another and drive
excellence• Learning and development opportunities that enable to staff to grow,
adapt and learn• Opportunities for long term career trajectories (vertically and
horizontally)Providing transparency on inner workings of the organization• Frequent communication on job stability and changing workplace
dynamics• Ability to develop meaningful relationships with supervisors and
leaders
Being an “employer of choice” means…
$UM
EVP
Culture & Well-being
Career Development & Opportunities
Total Rewards
Brand and
Promise
• Work life balance• Physical / virtual workspace • Organizational norms
- Transparency- Camaraderie & teamwork - Trust, respect, fairness, pride
• Purpose and mission • Vision and values • Opportunity to make a
difference• Internal & external reputation • Ability to positively contribute
to the community (social responsibility)
• Career ladder – vertical and horizontal mobility • Learning & growth opportunities • Real-time feedback (including upward and 360)• Ability to develop new or valuable skillsets
• Competitive base compensation
• Variable / performance based incentives
• Non-monetary rewards and recognition
• Health & wellness benefits
The Employee Value Proposition (“EVP”) articulates why people want to work for UM
Executive Summary Summary Findings Facilities Finance Human Resources IT Sustainability and Operating Model
Implementation Timeline

OPEN – GB – INFO 5-90 December 7-8, 2017
UM will require a structured approach to align organizational priorities, obtain stakeholder buy-in and sequence HR redesign activities appropriately
People & HR Strategy• Revise FY18 annual HR goals to
incorporate achievable HR Transformation goals for the remainder of the FY
• Conduct voice of the customer interviews / focus groups to inform strategy development
• Define People Strategy and Employee Value Proposition
• Define HR capabilities needs to support strategy and evaluate gaps
HR Governance• Redefine HR governance
needs/structure across campuses• Define and agree on decision
rights and interaction model between UM System HR, Campus HR and Depts.
HR Operating Model• Deploy activity analysis survey• Evaluate FTEs against
benchmarks for all HR activities• Design future state HR service
delivery model• Evaluate current and future talent
needs• Develop transition plans• Transition to future state HR
operating model
HR Process Standardization• Collect and evaluate all current
state HR processes and activities across campuses and UM System
• Prioritize and re-design key process areas to improve service delivery and reduce administrative work
• Implement process improvement opportunities
HR Technology• Conduct assessment of HR
technology portfolio• Determine near-term opportunities• Determine gaps and explore
technology enhancements• Develop business case(s) to define
investment needs and resource requirements
• Issue RFPs and engage vendors, as needed
• Implement new technology solutions to align to service delivery model
Transition Management Office
Change Management & Communications
Proposed workstreams for HR Transformation effort
A number of key dependencies that should be considered as part of the transformation efforts include:• Inclusion of faculty and staff members in the definition of a people strategy, HR vision, role and strategic objectives• Capacity of HR to drive to target state while continuing to support the needs of the organization • HR’s role in managing change and supporting the transition of other potential workforce changes resulting from the Administrative Review
process
Executive Summary Summary Findings Facilities Finance Human Resources IT Sustainability and Operating Model
Implementation Timeline

OPEN – GB – INFO 5-91 December 7-8, 2017
1. HR TransformationOpportunity Synopsis
Name HR Transformation
Description
Launch a formal HR Transformation effort that will elevate the role of HR to support talent/workforce needs of the organization, drive efficiencies throughout the system and is focused on the following areas:
a. People & HR Strategy – Engage campus, school, department and UM System HR leaders to align on a consistent definition on the role HR plays in (1) partnering with institutional leaders to deliver on organizational goals and (2) enabling an employee experience that positions UM as an employer of choice.
b. HR Process Standardization – Evaluate variation in policies and process across campuses and standardize and launch formal training and communication efforts to minimize risk inkey process areas (e.g., FMLA, ADA, I-9 processing)
c. HR Governance – Clarify accountabilities between divisions/schools/departments, campus HR and UM System HR and increase the degree of formal cross-campus, cross-functional HR committees to improve collaboration within HR
d. HR Technology Enablement – Launch effort to evaluate and deploy new technologies and/or enhancements to existing technologies to improve automation of manual processes andimprove access to HR services for employees (e.g., optimizing PeopleSoft 9.2, deploying manager and employee self-service tools, implementing a new case management tool)
e. HR Operating Model – Redesign the HR delivery model and organization structure to shift transactional activities into a shared services model, build centers of excellence focused on system-wide strategy/policy and enhance the local delivery model to departments, divisions and schools by redefining the role of HR business partners across campuses)
(Average departmental attrition rate* – 10%)
Benchmarks
• 106 individuals were mapped to UM System and main campus (Columbia) HR functions, with another 477 non-HR individuals identified on main campus that execute some degree of HR work activities
• Although a proper activity analysis is required to accurately estimate opportunities for efficiencies, additional investments may be required to achieve efficiencies in distributed HR staff to support the new delivery model.
“Soft” Benefits Achieved
• Improved communication and coordination across campuses• Reduced organizational risk in process areas with legal implications (e.g., FMLA, ADA, I-9)
Spend Addressed Investment Required
Departmental labor cost savings, HR labor costs (savings and investment), HR technology
Investment in critical HR capabilities; Cost to launch and support new HR tech
Implementation Duration Implementation Risk
Two Years 4
Executive Summary Summary Findings Facilities Finance Human Resources IT Sustainability and Operating Model
Implementation Timeline
Impact to:UM System Central Department Distributed UMKC S&T UMSL
*Three year average across UM System and Columbia Campus

OPEN – GB – INFO 5-92 December 7-8, 2017
2. Total Rewards RationalizationOpportunity Synopsis
Name Total Rewards Rationalization
Description
The Total Rewards Advisory Committee (“TRAC”) should work with HR leadership to further evaluate potential adjustments to health and wellness benefit offerings. Any adjustments to health and wellness benefits should be coordinated with any planned changes to retirement benefits and increases in compensation as part of a holistic Total Rewards strategy for UM faculty and staff. A proper communication strategy and plan is critical for impacted employees to understand the net impact to their compensation levels and deductions.
Benchmarks 2017 PwC Health and Well-Being Touchstone Survey of PPO, CNP, and HSA plans, as well as ancillary benefits, in Higher Education.
“Soft” Benefits Achieved
Wellness program will promote health and wellness, preventative care, etc. for UM employees and staff
Spend Addressed Investment Required
Health and wellness benefit offeringsAdjustments to faculty and staff benefits to align with market
compensation benchmarks
Implementation Duration Implementation Risk
Two Years 5
Executive Summary Summary Findings Facilities Finance Human Resources IT Sustainability and Operating Model
Implementation Timeline
Impact to:
UM System Central Department Distributed UMKC S&T UMSL

OPEN – GB – INFO 5-93 December 7-8, 2017
While benchmarks indicate an opportunity to reduce health benefits, any adjustments to health benefit offerings should be done as part of a holistic, comprehensive approach to evaluate UM’s total rewards strategy (including aligning compensation to market levels) and should not come at the expense of losing key contributors towards the institutional mission. TRAC should help evaluate any changes.
Executive Summary Summary Findings Facilities Finance Human Resources IT Sustainability and Operating Model
Implementation Timeline
Elements of Total Rewards
Total Rewards Advisory Committee (“TRAC”)Charter: The Total Rewards Advisory Committee serves in an advisory capacity in matters related to benefits programs and in the treatment of pay and benefits as interrelated parts of the University’s overall Total Rewards
Membership: VP of HR or designee (1), Faculty member from each campus (4), Staff member from each campus (4), Hospital representative (1), Retiree representative as appointed by the VPof Human Resources from nomination from campuses, retiree associations and self-nominations (1), Additional at large committee members (at discretion of VP of HR)
Total Rewards
Goals of Rationalizing Total Rewards
• Optimize the usage of total rewards to align to the organizational strategy, employee preferences and budgetary goals
• Design a core set of benefits (health & welfare, retirement) that is both market competitive and cost effective
• Evaluate compensation levels to ensure market competitiveness and internal equity
• Institute a set of performance-based rewards (monetary and non-monetary) to recognize performance and motivate employees
Change Management Considerations
• Ensure proper buy-in from representative faculty and staff members prior to any changes
• Rollout changes to total rewards as a comprehensive approach rather than an incremental set of changes
• Provide transparency into the net financial impact to employees and how total benefits and compensation levels compare to others in the market
• Ensure appropriate lead-time in order to address areas of complexity and rollout proper communication plans

OPEN – GB – INFO 5-94 December 7-8, 2017
3. Administrative Assistant RealignmentOpportunity Synopsis
Name Administrative Assistant Realignment
Description Increase the ratio of executives per administrative assistant from 1.25:1 to 3:1 across UM System and Columbia campus
Benchmarks
Leading practice for creating efficiencies in the utilization of administrative assistant positions is a 3:1 ratio of executives per administrative assistant. The current average ratio system-wide is 1.25.
Currently, administrative assistants are used inconsistently across departments/divisions/schools and many have broader facility or functional support responsibilities than traditional administrative staff roles. As a result, an activity analysis should be utilized to better understand the distribution of administrative assistant responsibilities and more accurately assess the opportunity to optimize administrative assistant roles.
An activity analysis survey will be required in order to better identify administrative workload
“Soft” Benefits Achieved Standardization of executive support across the system
Spend Addressed Investment Required
Administrative Assistant Labor Costs None
Implementation Duration Implementation Risk
Six Months 3
Impact to:
UM System Central Department Distributed UMKC S&T UMSL
Executive Summary Summary Findings Facilities Finance Human Resources IT Sustainability and Operating Model
Implementation Timeline

OPEN – GB – INFO 5-95 December 7-8, 2017
5.3 HR Observations
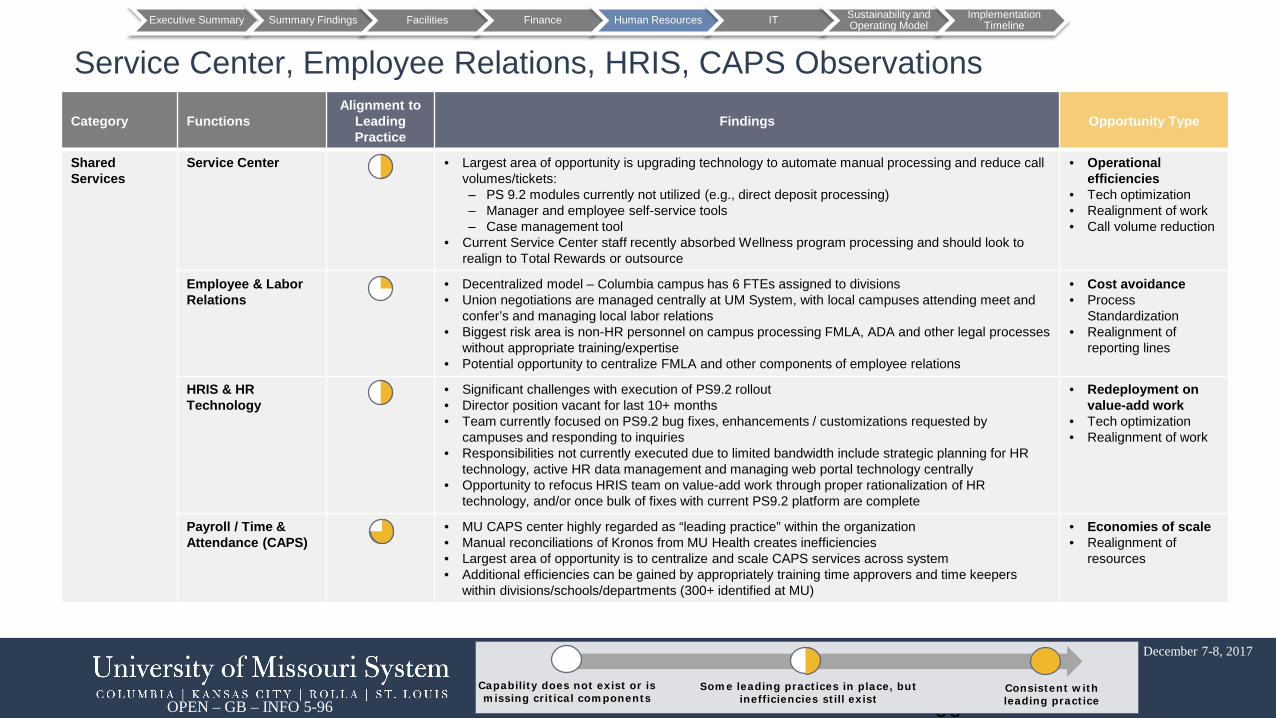
OPEN – GB – INFO 5-96
December 7-8, 2017
Service Center, Employee Relations, HRIS, CAPS ObservationsCategory Functions
Alignment to Leading Practice
Findings Opportunity Type
Shared Services
Service Center • Largest area of opportunity is upgrading technology to automate manual processing and reduce call volumes/tickets:‒ PS 9.2 modules currently not utilized (e.g., direct deposit processing)‒ Manager and employee self-service tools‒ Case management tool
• Current Service Center staff recently absorbed Wellness program processing and should look to realign to Total Rewards or outsource
• Operational efficiencies
• Tech optimization• Realignment of work• Call volume reduction
Employee & Labor Relations
• Decentralized model – Columbia campus has 6 FTEs assigned to divisions • Union negotiations are managed centrally at UM System, with local campuses attending meet and
confer’s and managing local labor relations• Biggest risk area is non-HR personnel on campus processing FMLA, ADA and other legal processes
without appropriate training/expertise• Potential opportunity to centralize FMLA and other components of employee relations
• Cost avoidance• Process
Standardization• Realignment of
reporting lines
HRIS & HR Technology
• Significant challenges with execution of PS9.2 rollout• Director position vacant for last 10+ months• Team currently focused on PS9.2 bug fixes, enhancements / customizations requested by
campuses and responding to inquiries• Responsibilities not currently executed due to limited bandwidth include strategic planning for HR
technology, active HR data management and managing web portal technology centrally• Opportunity to refocus HRIS team on value-add work through proper rationalization of HR
technology, and/or once bulk of fixes with current PS9.2 platform are complete
• Redeployment on value-add work
• Tech optimization• Realignment of work
Payroll / Time & Attendance (CAPS)
• MU CAPS center highly regarded as “leading practice” within the organization• Manual reconciliations of Kronos from MU Health creates inefficiencies• Largest area of opportunity is to centralize and scale CAPS services across system• Additional efficiencies can be gained by appropriately training time approvers and time keepers
within divisions/schools/departments (300+ identified at MU)
• Economies of scale• Realignment of
resources
96Consistent with leading practice
Capability does not exist or is missing critical components
Some leading practices in place, but inefficiencies still exist
Executive Summary Summary Findings Facilities Finance Human Resources IT Sustainability and Operating Model
Implementation Timeline

OPEN – GB – INFO 5-97
December 7-8, 2017
Category FunctionsAlignment to
Leading Practice
Findings Opportunity Type
Total Rewards Compensation • New staff compensation model and titling scheme rolled out within last two years• Change management raised as concern with rollout which has caused high volume of JFIs
(Justification For Increases) and PCQs (job reclassifications) • Current Compensation team spends majority of time processing JFIs/PCQs, maintaining
compensation and title structure and consulting campuses on JFI/PCQ requests (700+ PCQs processed within last year for Columbia campus)
• Currently, all academic compensation and job titling is handled by schools• Potential opportunity to realign Compensation function with Total Rewards function and to consult
schools and monitor academic comp and titling centrally
• Realignment of resources
Benefits (Health, Retirement,Wellness)
• Health plan administration and design is conducted in-house• Identified operational improvements for administration of retirement plan include:
‒ Migrating retirement data (e.g., contributions) to a single platform to improve calculation efficiencies (1,000+ completed annually) and reduce risk
‒ Establishing standards and improving training/communication to divisions/schools/departments on reporting retirement eligibility and employee information at time of retirement (currently, 50% of information provided is incorrect)
‒ Seeking opportunities to shift from manual processing of “intent to retire” forms to an automated tool such as DocuSign
• 6 FTEs processing Wellness benefits recently terminated; responsibilities absorbed by existing Total Rewards and Service Center staff
• While currently some Total Rewards administration is outsourced (e.g., portion of pension calculations), additional efficiencies can possibly be gained by fully outsourcing health, retirement and wellness administration functions, however, outsourcing these functions is not recommended until a broader HR service delivery model is determined
• Savings potential• Realignment of
resources• Process improvement
Total Rewards Observations
97Consistent with leading practice
Capability does not exist or is missing critical components
Some leading practices in place, but inefficiencies still exist
Executive Summary Summary Findings Facilities Finance Human Resources IT Sustainability and Operating Model
Implementation Timeline
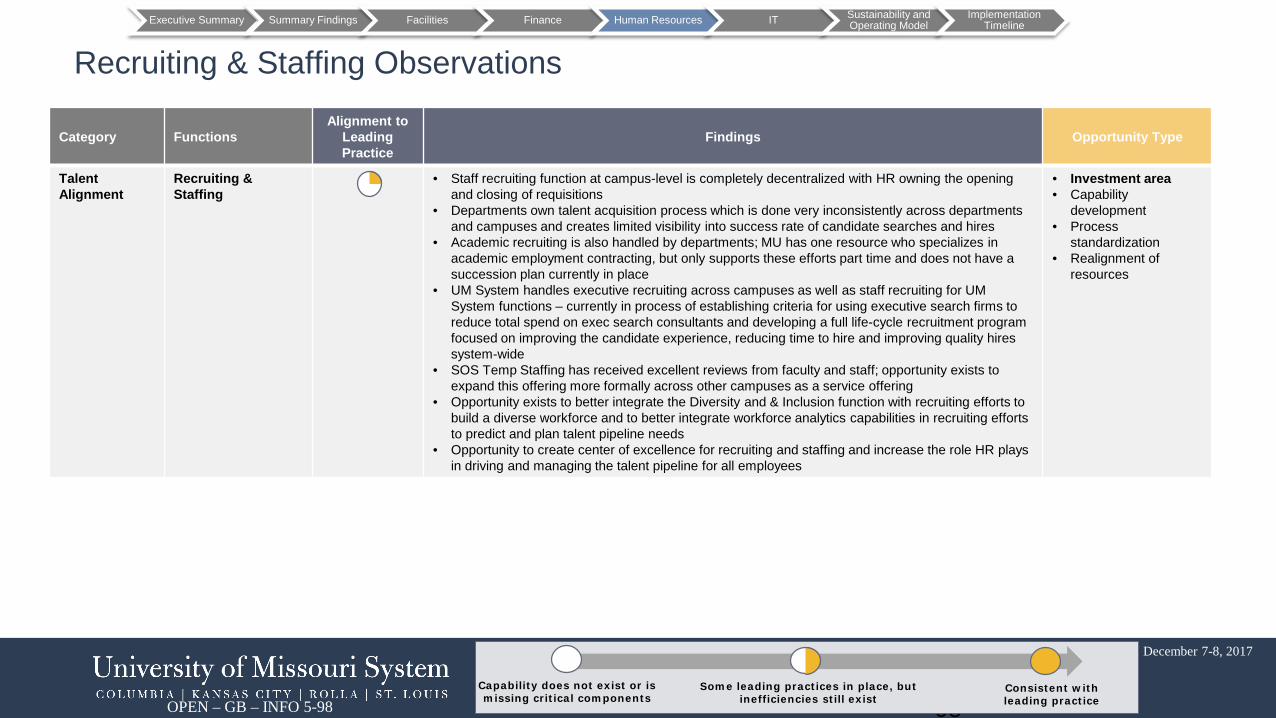
OPEN – GB – INFO 5-98
December 7-8, 2017
Category FunctionsAlignment to
Leading Practice
Findings Opportunity Type
Talent Alignment
Recruiting & Staffing
• Staff recruiting function at campus-level is completely decentralized with HR owning the opening and closing of requisitions
• Departments own talent acquisition process which is done very inconsistently across departments and campuses and creates limited visibility into success rate of candidate searches and hires
• Academic recruiting is also handled by departments; MU has one resource who specializes in academic employment contracting, but only supports these efforts part time and does not have a succession plan currently in place
• UM System handles executive recruiting across campuses as well as staff recruiting for UM System functions – currently in process of establishing criteria for using executive search firms to reduce total spend on exec search consultants and developing a full life-cycle recruitment program focused on improving the candidate experience, reducing time to hire and improving quality hires system-wide
• SOS Temp Staffing has received excellent reviews from faculty and staff; opportunity exists to expand this offering more formally across other campuses as a service offering
• Opportunity exists to better integrate the Diversity and & Inclusion function with recruiting efforts to build a diverse workforce and to better integrate workforce analytics capabilities in recruiting efforts to predict and plan talent pipeline needs
• Opportunity to create center of excellence for recruiting and staffing and increase the role HR plays in driving and managing the talent pipeline for all employees
• Investment area• Capability
development• Process
standardization• Realignment of
resources
Recruiting & Staffing Observations
98Consistent with leading practice
Capability does not exist or is missing critical components
Some leading practices in place, but inefficiencies still exist
Executive Summary Summary Findings Facilities Finance Human Resources IT Sustainability and Operating Model
Implementation Timeline

OPEN – GB – INFO 5-99
December 7-8, 2017
Category FunctionsAlignment to
Leading Practice
Findings Opportunity Type
Talent Alignment
Talent Management • “My Performance” opportunity launched within last year; majority of departments/divisions/schoolsare using common performance management tool
• Currently, UM System is responsible for oversight of PM tool and process• Mobility across departments/schools/divisions is a common practice, but there is no standard
process in place for supporting employees through the transition process• Interim leader assigned to oversee Careers and Culture function, but focus is primarily around
leadership development training and there is an opportunity to further define and establish plans around career laddering, career trajectory, coaching and mentoring, mobility, performance management and succession planning
• Investment area• Capability
development
Learning & Development
• Central L&D team focuses primarily on leadership development training, however there is opportunity to increase levels of technical training or training for non-HR personnel executing HR work within divisions/departments/schools
• Minimal L&D staff exist at campus level and focus is primarily on large training events (2-3 per year) rather than ongoing, continuous learning and development needs of campus staff and faculty
• Opportunity exists to further evaluate L&D needs, staffing requirements and ability to expand the UM System L&D function into a Center of Excellence model to develop and drive a broader L&D strategy across campuses
• Learning Management System, SkillSoft, currently used for eLearnings; opportunity exists to expand online training to support employee onboarding, orientation, timekeeping, ePAFs, eRecruit and other critical HR processes that are decentralized
• Investment area• Capability
development• Technology
optimization• Process
standardization
Talent Management, Learning & Development Observations
99Consistent with leading practice
Capability does not exist or is missing critical components
Some leading practices in place, but inefficiencies still exist
Executive Summary Summary Findings Facilities Finance Human Resources IT Sustainability and Operating Model
Implementation Timeline

OPEN – GB – INFO 5-100
December 7-8, 2017
Category FunctionsAlignment to
Leading Practice
Findings Opportunity Type
Workforce Strategy
Workforce Intelligence & Analytics
• Workforce analytics team recently formed – utilizes Tableau to support compliance and ad hoc reporting needs (e.g., span of control, demographics)
• Team has coordinated with Total Rewards function to support retirement eligibility analytics for retirement plan administration
• Opportunity exists to expand scope of responsibilities to provide campuses, divisions, departments and schools with analytics to support workforce planning needs (e.g., diversity hiring goals, retirement eligibility/succession planning needs, training needs, etc.)
• Capability development
HR Strategic Planning
• UM System leader of HR Operations currently oversees HR strategic planning and system-wide labor relations
• Currently in process of inventorying HR processes across the UM System central office• As the “people strategy” and HR role are further defined, opportunity exists to formalize HR
Operations role to program manage all HR strategic opportunities
• Process Improvement
Org Effectiveness,Culture & Engagement
• Climate survey recently conducted by Rankin & Associates; there currently is no annual employee engagement or workplace survey administered by HR
• Careers and Culture function has historically focused on leadership development training; opportunity exists to expand change management, org effectiveness, employee engagement and employee experience capabilities
• Investment area• Capability
development
Workforce Strategy Observations
100Consistent with leading practice
Capability does not exist or is missing critical components
Some leading practices in place, but inefficiencies still exist
Executive Summary Summary Findings Facilities Finance Human Resources IT Sustainability and Operating Model
Implementation Timeline

OPEN – GB – INFO 5-101December 7-8, 2017
6. IT Workstream6.1 - IT Workstream Summary
6.2 - Individual Opportunity Overviews

OPEN – GB – INFO 5-102December 7-8, 2017
6.1 IT Workstream Summary
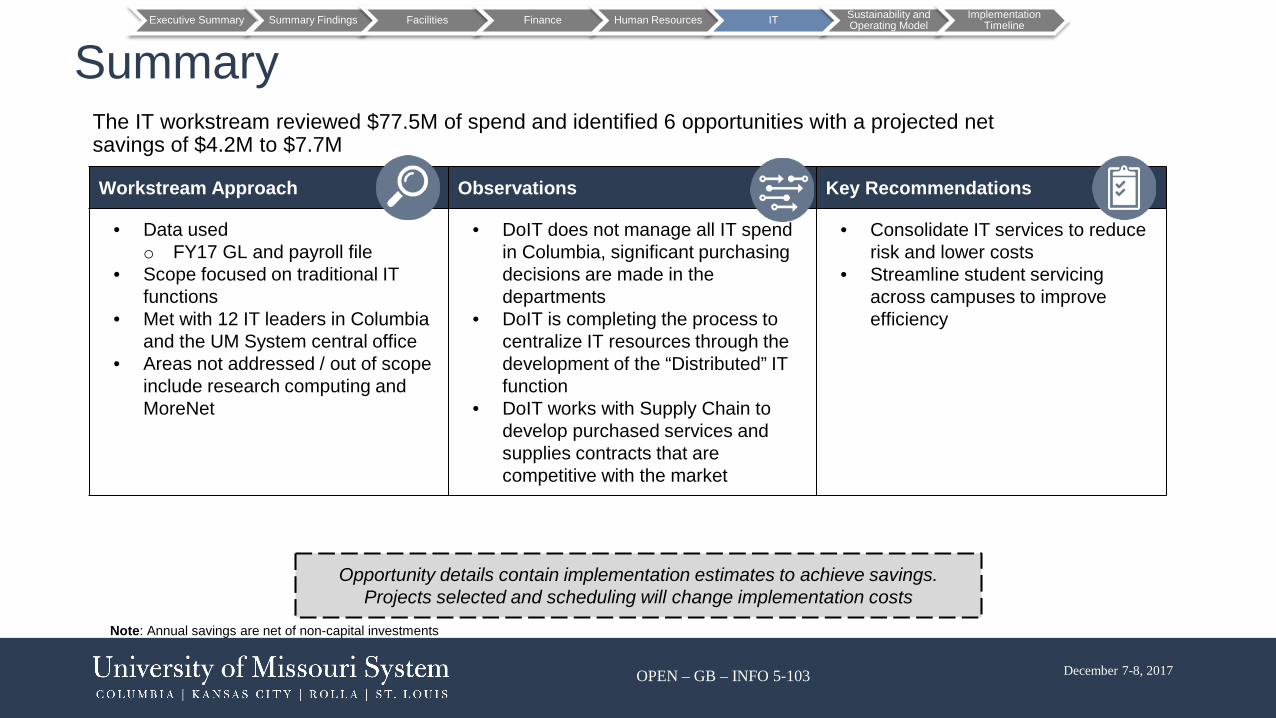
OPEN – GB – INFO 5-103 December 7-8, 2017
SummaryThe IT workstream reviewed $77.5M of spend and identified 6 opportunities with a projected net savings of $4.2M to $7.7M
Workstream Approach Observations Key Recommendations
• Data usedo FY17 GL and payroll file
• Scope focused on traditional IT functions
• Met with 12 IT leaders in Columbia and the UM System central office
• Areas not addressed / out of scope include research computing and MoreNet
• DoIT does not manage all IT spend in Columbia, significant purchasing decisions are made in the departments
• DoIT is completing the process to centralize IT resources through the development of the “Distributed” IT function
• DoIT works with Supply Chain to develop purchased services and supplies contracts that are competitive with the market
• Consolidate IT services to reduce risk and lower costs
• Streamline student servicing across campuses to improve efficiency
Opportunity details contain implementation estimates to achieve savings. Projects selected and scheduling will change implementation costs
Executive Summary Summary Findings Facilities Finance Human Resources IT Sustainability and Operating Model
Implementation Timeline
Note: Annual savings are net of non-capital investments

OPEN – GB – INFO 5-104 December 7-8, 2017
IT Functional Area Current StateThe Department of IT is focused on reducing cost where they have direct control. The 25% of IT spending controlled by departments can be reduced by changing governance of IT spend and IT delivery models. In order to drive down costs that are currently in distributed department budgets, IT will need to increase it’s ability to impact these budgets.
Executive Summary Summary Findings Facilities Finance Human Resources IT Sustainability and Operating Model
Implementation Timeline
75% of all IT-related spend is managed by the central IT department. IT does not have a line of sight to or lacks control over a quarter of total IT spend.
Academic and functional leaders will need to drive the changes that create IT cost savings.
IT leaders have started consolidation and efficiency projects.• Consolidated IT technicians, rebalanced work and labor cost• Department supported servers are identified with some work
underway to move them to DoIT support.IT competes with commercial providers, and frequently benchmarks itself to prove its value proposition to the university.• IT services are compared to Amazon Web Services pricing on
a quarterly basisProcess changes across campuses and changes in IT delivery models offer the best opportunity for substantial cost reduction.• 7,500 people using over 400 applications perform student
servicing in different ways at the four campuses. Shared services and simplification can produce significant benefit.
• A shift from desk side PC support to remote support can double the number of people a technician can support.
25%

OPEN – GB – INFO 5-105 December 7-8, 2017
Additional Observations▪ The chargeback system for IT services is a leading practice to help business self regulate demand▪ IT chargeback rates are compared to commercial services on a regular basis▪ Currently there is no formal financial evaluation process for IT application development project requests.
Especially in a time of resource constraint, a more formal business case assessment process that determines the cost and benefit of these projects (with participation by Finance) is warranted. A minimum hurdle rate for project return on investment is advised as a part of this.
▪ IT infrastructure services (servers, storage, network) are commodities that can scale at a relatively small incremental cost. Sequestering of IT systems by distributed organization units adds cost to the operation without bringing competitive advantage. Failure to fully leverage economies of scales raises costs for the University of Missouri.
▪ The Columbia IT helpdesk serves 20% to 200% more users per agent than the other campuses▪ The use of IT Service Pros embedded in the business units is an expensive service model compared to remote
support model common in IT organizations
Executive Summary Summary Findings Facilities Finance Human Resources IT Sustainability and Operating Model
Implementation Timeline

OPEN – GB – INFO 5-106 December 7-8, 2017
ScopeThe IT Workstream includes the provision of services and supplies related to technology and telecommunications
Executive Summary Summary Findings Facilities Finance Human Resources IT Sustainability and Operating Model
Implementation Timeline
Labor Areas Non-Labor Areas Out of Scope
• IAT Systems Admin• IT Systems Support• Security• Systems & Operations Support• Telecommunications• UM Information and Computing
Services• VP of IS• Distributed IT within academic
or other departments
• Software / licenses• Cloud computing• Storage• Hardware• Purchased services• 3rd party labor
• Research computing• MOREnet• IT services and supplies
related to research (e.g. sponsored programs & institutional research)

OPEN – GB – INFO 5-107 December 7-8, 2017
Salaries and Wages, $26.0, 34%
Staff Benefits, $8.8, 11%
Distributed Salaries and Wages, $0.5,
1%
Distributed Benefits, $0.1, 0%
UM & MU Non-Labor Expenses, $22.1,
28%
Distributed Non-Labor Expenses,
$20.0, 26%
FY2017 Baseline Total Spend UM and MU Central Headcount MU Distributed Headcount
Information Technology Functional Rollup $77.5 M 427 67
Expense Breakdown*
Expense Profile
Distributed Methodology• Gleaned from stakeholder interviews that employees with
information technology function responsibilities existthroughout the University
• Executed keyword search for IT job titles in employee list for Columbia and UM System
• Identified employees with same job titles as available in Central IT which were not part of the IT orgs (including: System Admin, Network Engineer, User Support Analyst, System Support Analyst, Support System Admin, DB Programmer Analyst, DB Administrator and Programmer Analyst)
• Applied a percent effort to estimate the dollar value (salaries, wages, and benefits) of the distributed headcount
• Activity analysis survey will be performed to more precisely identify distributed activities
$77.5M of spend was reviewed including labor and non-labor expenses, labor includes known IT employees and a count of “Distributed” employees which will be refined through an activity analysis survey
Executive Summary Summary Findings Facilities Finance Human Resources IT Sustainability and Operating Model
Implementation Timeline
* Includes $20M of distributed non-labor IT expenses, not managed by Centralized departments, does not include depreciation

OPEN – GB – INFO 5-108 December 7-8, 2017
Expense and Operational Benchmarking
Metric Benchmark UM Performance Calculation Interpretation
Total revenue per IT FTE $167,613 $84,706Red
Lower revenue than benchmark
$1,373M Columbia and UMSYS revenue / 16,214
FTE
Indicates overall staffing level at UM is higher than peers with similar revenue.
IT spend at UMSYS and Columbia as a percentage of UMSYS and Columbia revenue
5.70% 5.64%Green
Lower spend than benchmark
$77.5M / $1,373M Revenue
Overall, IT spending is slightly lower than peers.
IT spend per employee (UMSYS and Columbia) per FTE (UMSYS and Columbia)
$8,200 $4,780Green
Lower spend than benchmark
$77.5M / 16,214 FTESpend per employee is lower than peers.
IT staff as a percentage of Columbia and UMSYS Staff
4.80% 2.63%Green
Lower ratio than benchmark
427 IT staff / 16,214 FTEThe low ratio of IT staff to employees correlates with the other metrics. These show the system has a higher number of employees than typical for the revenue level.
The number of supported users per IT technician 333:1 178:1Red
Higher ratio than benchmark
18,826 People supported / 105.75 FTE
UM uses a high touch desk-side IT support model. This is more labor intensive and costly than the remote support model which is widely used in industry.
Decisions made throughout the organization have impacted the staffing model and cost structure within IT
Executive Summary Summary Findings Facilities Finance Human Resources IT Sustainability and Operating Model
Implementation Timeline
Activity Analysis is key to the true determination of IT activity and related FTEs beyond the benchmarks above

OPEN – GB – INFO 5-109 December 7-8, 2017
Opportunity SummaryThe IT Workstream identified six opportunities with a net savings of $4.2M to $7.7M
Executive Summary Summary Findings Facilities Finance Human Resources IT Sustainability and Operating Model
Implementation Timeline
Opportunity Implementation Duration
Implementation Risk
1 Governance and Operating Model Three Year 5
2 IT Spend Governance One Year 3
3 Rationalize Distributed IT Desktop / Support Services One Year 3
4 Consolidate Web Hosting Platforms One Year 2
5 Increase App Development/Support ROI Requirements One Year 3
6 Reduce Innotas Licensing Two Year 1
Note: Annual benefits are net of non-capital investment in capabilities needed

OPEN – GB – INFO 5-110 December 7-8, 2017
Implementation Risk Summary
Risk Assessment Key
Complexity Assessment based on the number of actions required to implement the opportunity and the breadth of stakeholder buy-in needed
Investments Assessment based on amount of technological, financial, personnel, and/or “soft” investments needed to implement the opportunity
Stakeholder Impact
Assessment based on the opportunity’s impact to normal workflow as well as the perceived impact of the opportunity to stakeholders
Implementation Risk Score is an index that factors in (1) Complexity (2) Investment Required (3) Impact to Stakeholders
Low Risk – Limited risk to internal stakeholders; proceed with implementation, 1- 2
Moderate Risk – Develop and execute change management, Track and manage progress closely 3
High Risk – Develop tactical work plan, execute change management strategy, involve key leaders 4 -5
Relative to other Workstreams many IT opportunities carry a lower risk score
Executive Summary Summary Findings Facilities Finance Human Resources IT Sustainability and Operating Model
Implementation Timeline
Opportunity Complexity Investments Stakeholder Impact Total Risk
1 Governance and Operating Model 5 5 4 5
2 IT Spend Governance 4 2 4 3
3 Rationalize Distributed IT Desktop / Support Services 3 3 3 3
4 Consolidate Web Hosting Platforms 3 2 2 2
5 Consolidate Web Hosting Platforms 3 2 2 2
6 Reduce Innotas Licensing 1 1 1 1

OPEN – GB – INFO 5-111December 7-8, 2017
6.2 IT Individual OpportunitiesOverview

OPEN – GB – INFO 5-112 December 7-8, 2017
Spend Addressed Investment Required
IT and Functional Area OPEX
Transfer of FTE to Central IT. Labor to transition servers and helpdesk, to create and manage IT governance and project selection processes, and to consolidate student servicing processes, applications and
PeopleSoft instances
1. Governance and Operating ModelOpportunity Synopsis
Name Governance and Operating Model
Description
The University of Missouri operates as four businesses with four different IT organizations. This operating and governance model has produced duplication in IT services and cost. There are multiple opportunities to consolidate back office processes that are not adding competitive advantage. These opportunities include: Consolidation of hosting and management of servers, consolidation of Help Desk services, creating common student servicing processes and consolidating the 400+ applications and 4 PeopleSoft instances that support today's constellation of processesA high level of autonomy and decision making exists within the campuses and departments around IT. Central IT is not positioned to lead and enforce functional decisions. This leads to a technology landscape that meets or exceeds end user wants and needs, but comes at a significant cost. The University needs to undertake a process to rationalize whether this model is in the best interest of the business units.
(Average departmental attrition rate* – 10%)
Benchmarks
• 750 servers to consolidate across campuses and within Columbia. $4.2M difference between current equipment and labor and DoIT server rates.• Helpdesk calculated by applying Columbia campus/DoIT HD staff ratio to other campuses. Staff change is $.1M-$.6M reduction.• Combining student servicing processes and moving to one PeopleSoft image reduces IT hardware by $.5M (DoIT estimate).• There are 7,500 active student service functional users, 400 applications and 4 versions of the same PeopleSoft platform to provide the same services to the four campuses. There is
a significant opportunity to simplify this environment and reduce costs.
“Soft” Benefits Achieved
Improved risk posture, lower physical security risk, reduction in people with system administrator access, reduction in system complexity which reduces cost and time to maintain and upgrade systems, and reduced complexity makes it easier to adopt new technology
Executive Summary Summary Findings Facilities Finance Human Resources IT Sustainability and Operating Model
Implementation Timeline
Implementation Duration Implementation Risk
Three Year 5
Impact to:
UM System Central Department Distributed UMKC S&T UMSL
*Three year average across UM System and Columbia Campus
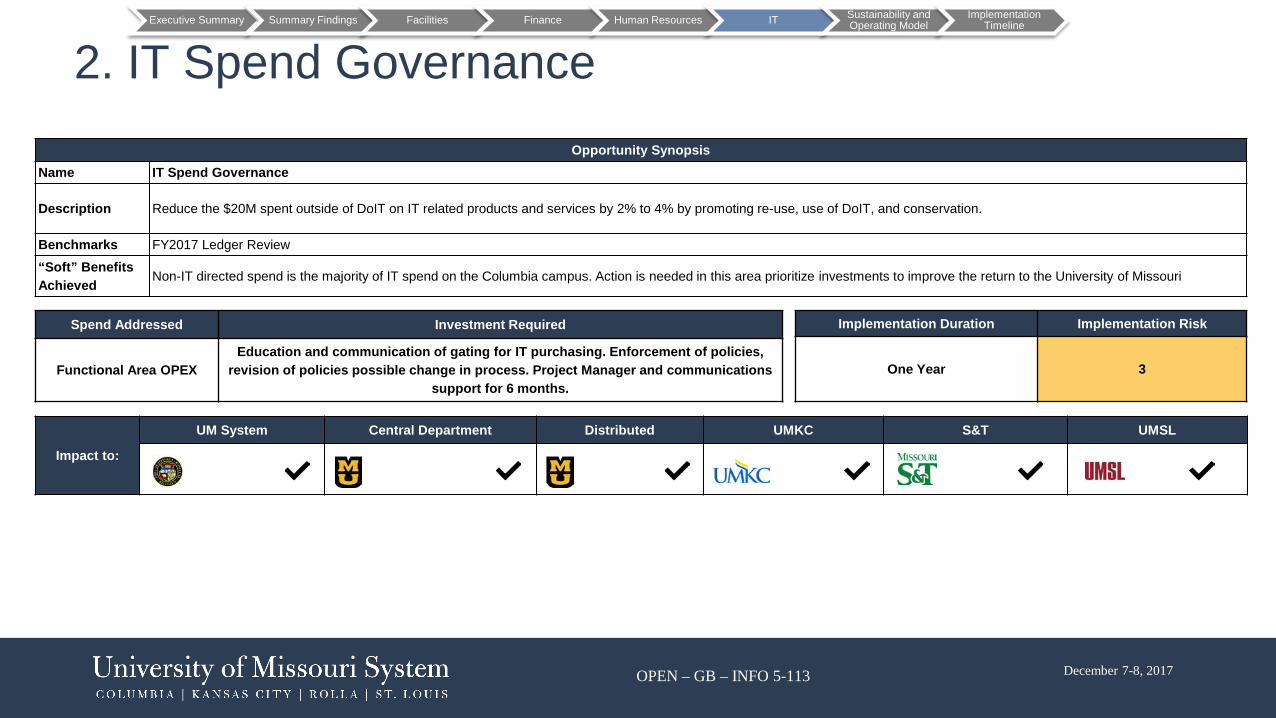
OPEN – GB – INFO 5-113 December 7-8, 2017
2. IT Spend GovernanceOpportunity Synopsis
Name IT Spend Governance
Description Reduce the $20M spent outside of DoIT on IT related products and services by 2% to 4% by promoting re-use, use of DoIT, and conservation.
Benchmarks FY2017 Ledger Review
“Soft” Benefits Achieved Non-IT directed spend is the majority of IT spend on the Columbia campus. Action is needed in this area prioritize investments to improve the return to the University of Missouri
Executive Summary Summary Findings Facilities Finance Human Resources IT Sustainability and Operating Model
Implementation Timeline
Implementation Duration Implementation Risk
One Year 3
Spend Addressed Investment Required
Functional Area OPEXEducation and communication of gating for IT purchasing. Enforcement of policies,
revision of policies possible change in process. Project Manager and communications support for 6 months.
Impact to:
UM System Central Department Distributed UMKC S&T UMSL

OPEN – GB – INFO 5-114 December 7-8, 2017
3. Rationalize Distributed IT Desktop / Support ServicesOpportunity Synopsis
Name Rationalize Distributed IT Desktop / Support Services
Description
Continue ongoing negotiations with departments to yield savings of 3-5 FTE over the next year. This will be in addition to the 30 FTEs that have already been reduced as a result of the formation of the Distributed IT organization in 2016. IT is building a second level desktop support capacity that is being piloted in the School of Arts and Sciences. This support model is similar to industry where 333 FTEs/technicians is the median compared to 178 FTEs/technicians in the university.
The staff changes will result in longer waits for service, a change to remote support, less 1 on 1 support. It is expected that departments will complain that IT has reduced services as a result.
Benchmarks PCs or Desktop per support staff members for midsize organizations range between 232 to 541 with a median of 333
“Soft” Benefits Achieved As remote support matures problem resolution time decreases.
Executive Summary Summary Findings Facilities Finance Human Resources IT Sustainability and Operating Model
Implementation Timeline
Implementation Duration Implementation Risk
One Year 3
Spend Addressed Investment Required
IT and Functional area Labor
IT management time and change in service expectation (move from on site support to more mobile support).
Impact to:
UM System Central Department Distributed UMKC S&T UMSL

OPEN – GB – INFO 5-115 December 7-8, 2017
4. Consolidate Web Hosting PlatformsOpportunity Synopsis
Name Consolidate Web Hosting Platforms
Description Implement a single centralized web management platform to meet the university's marketing and communications needs by contracting with a provider to support both WordPress and Drupal. This consolidation, especially of the department level websites, will reduce risk and provide the university with significant cost savings. (In Process)
Benchmarks The MU Digital Presence Business Case provided by DoIT
“Soft” Benefits Achieved Better control of the University of Missouri brand. Risk reduction through fewer independently managed websites
Executive Summary Summary Findings Facilities Finance Human Resources IT Sustainability and Operating Model
Implementation Timeline
Implementation Duration Implementation Risk
One Year 2
Spend Addressed Investment Required
IT and Functional OPEX In Plan
Impact to:
UM System Central Department Distributed UMKC S&T UMSL

OPEN – GB – INFO 5-116 December 7-8, 2017
5. Increase App Development/Support ROI Requirements
Opportunity SynopsisName Increase App Development/Support ROI Requirements
Description Raise the expectations for return on investment for IT projects. Create a governance process for IT project initiation. Set and communicate a hurdle rate for acceptance of new application development projects. The higher hurdle rate will control the demand for development resources.
Benchmarks The reduction in requests for new development can reduce up to 20% of total FTE capacity in the custom application group
“Soft” Benefits Achieved Increases the return on investment for IT development projects. Helps ensure the right projects are funded and expedited.
Executive Summary Summary Findings Facilities Finance Human Resources IT Sustainability and Operating Model
Implementation Timeline
Implementation Duration Implementation Risk
One Year 3
Spend Addressed Investment Required
IT Labor None
Impact to:
UM System Central Department Distributed UMKC S&T UMSL

OPEN – GB – INFO 5-117 December 7-8, 2017
6. Reduce Innotas Licensing
Opportunity SynopsisName Reduce Innotas Licensing
Description Reduce the licensing for Innotas Project Management tools from $75K to $35K. Continue to use as the project management tool until the planned adoption of Office 365 is complete. (In Process)
Benchmarks Innotas license count reduction
“Soft” Benefits Achieved Continuity of project management toolset
Executive Summary Summary Findings Facilities Finance Human Resources IT Sustainability and Operating Model
Implementation Timeline
Implementation Duration Implementation Risk
Two Year 1
Spend Addressed Investment Required
IT Operating Expense None
Impact to:
UM System Central Department Distributed UMKC S&T UMSL

OPEN – GB – INFO 5-118December 7-8, 2017
7. Sustainability and Operating Model
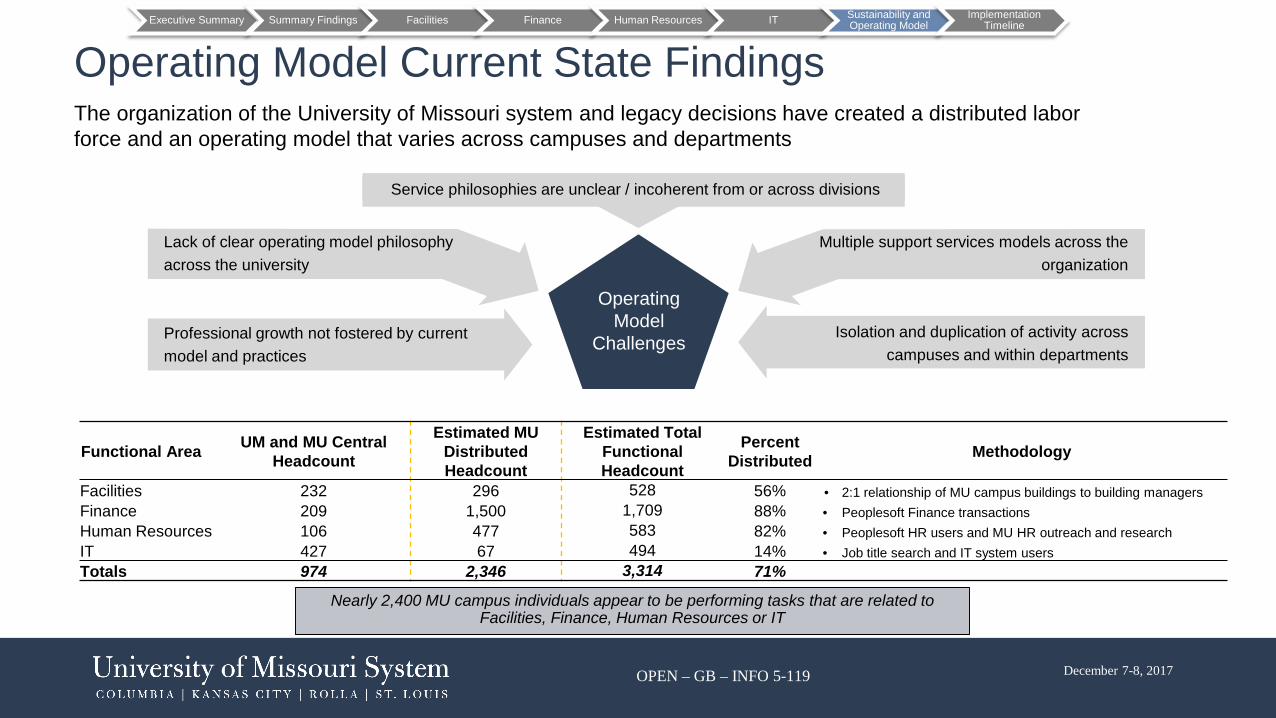
OPEN – GB – INFO 5-119 December 7-8, 2017
Operating Model Current State FindingsThe organization of the University of Missouri system and legacy decisions have created a distributed labor force and an operating model that varies across campuses and departments
Functional Area UM and MU Central Headcount
Estimated MU Distributed Headcount
Estimated Total Functional Headcount
Percent Distributed Methodology
Facilities 232 296 528 56% • 2:1 relationship of MU campus buildings to building managersFinance 209 1,500 1,709 88% • Peoplesoft Finance transactionsHuman Resources 106 477 583 82% • Peoplesoft HR users and MU HR outreach and researchIT 427 67 494 14% • Job title search and IT system usersTotals 974 2,346 3,314 71%
Lack of clear operating model philosophy across the university
Professional growth not fostered by current model and practices
Isolation and duplication of activity across campuses and within departments
Multiple support services models across the organization
Service philosophies are unclear / incoherent from or across divisions
Nearly 2,400 MU campus individuals appear to be performing tasks that are related to Facilities, Finance, Human Resources or IT
Operating Model
Challenges
Executive Summary Summary Findings Facilities Finance Human Resources IT Sustainability and Operating Model
Implementation Timeline

OPEN – GB – INFO 5-120 December 7-8, 2017
UM System Role
II. Strategic Management Model
• Small core with management taking a pragmatic and strategic approach
• Campuses are largely self-contained and viable, but have inter-dependencies
• Decision-making is based on campus performance and accountability
• Performance of employees is managed through clear KPIs and incentives
III. Core Management Model
• Larger core with management actively involved in campus-level decisions and operations
• Core management has the depth of knowledge to make trade-offs between competing campus priorities
• Campuses have significant inter-dependencies
• Decision-making trades off individual employee performance and overall strategy
• Performance is incentivized, measured and monitored jointly by the UM System and campuses
Increasing Level Of Hands-On Management From UM System
In order to achieve the operational efficiencies noted, the University must determine the role of the UM System central office and its functional relationship with the campuses
Executive Summary Summary Findings Facilities Finance Human Resources IT Sustainability and Operating Model
Implementation Timeline
T
Desired future model
I. Holding Company
Model
IV. Operationally Involved Model

OPEN – GB – INFO 5-121 December 7-8, 2017
Administrative Services Delivery Decision ProcessDetermining the appropriate operating model requires a series of decisions relative to function, desired service level and location needs as seen in the illustrative model below
N
Demonstrates economies of scale or scope?
Support Service at Campus Level
Y
Y
UM System central office
N Shared Service / Outsource
Common requirements across campuses?
Decision Tree Function Responsibility
Y
N
Allocation at campus-level essential to campus
research and teaching performance?
N
Y Support Service at Campus and
Academic Level
University wide policy, planning or strategy
function?
Common requirements across campus/division?
N
Y
Activity Types
• ‘Direction setting’ activities for the university• University-wide strategy, planning, policy• University governance• University budgeting, planning and capital
• Activities which exhibit economies of scale as activities are routinized, standardized, transactional
• Activities which exhibit economies of scope, which may: – Require common knowledge base to consistently deliver service– Be unaffordable within other campuses/divisions– Address similar business problems across campuses/divisions,– Share and enhance leading practice to strengthen service quality
• Faculty-unique activities• Proximity-critical activities (due to responsiveness or effectiveness)• Activities with a location-based competitive advantage• Activities more cost effective when locally delivered
• Activities unique to the division• Activities which are essential to research and teaching performance, i.e., direct impact
on research output
Executive Summary Summary Findings Facilities Finance Human Resources IT Sustainability and Operating Model
Implementation Timeline
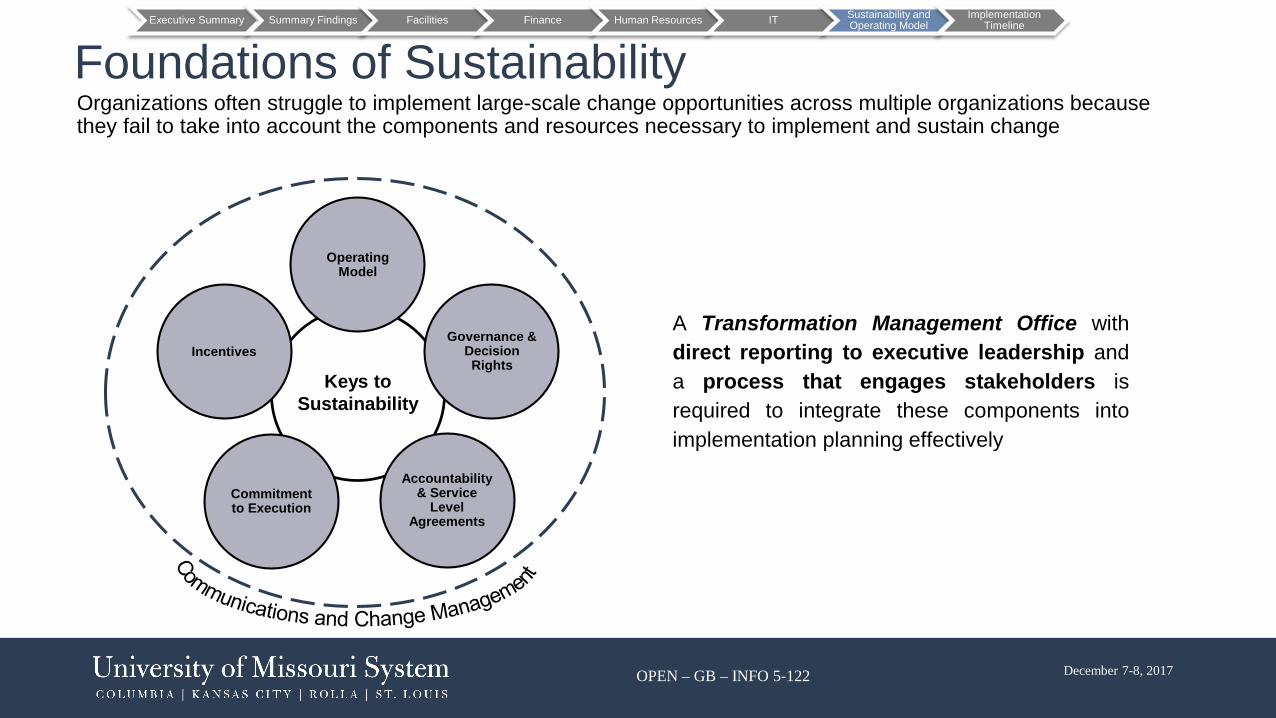
OPEN – GB – INFO 5-122 December 7-8, 2017
Foundations of Sustainability Organizations often struggle to implement large-scale change opportunities across multiple organizations because they fail to take into account the components and resources necessary to implement and sustain change
A Transformation Management Office withdirect reporting to executive leadership anda process that engages stakeholders isrequired to integrate these components intoimplementation planning effectively
Operating Model
Keys to Sustainability
Governance & Decision Rights
Accountability & Service
Level Agreements
Commitment to Execution
Incentives
Executive Summary Summary Findings Facilities Finance Human Resources IT Sustainability and Operating Model
Implementation Timeline

OPEN – GB – INFO 5-123 December 7-8, 2017
• Build Performance Improvement into the culture to continually look for means to become more efficient
• As processes change, develop user and super-user training on new ways of doing business
• Embed performance benchmarking mentality in all functions / at all levels as part of the daily routine
• Deploy operational performance scorecards at all levels and operational dashboards that provide direction for daily management of processes
• Cultivate “source of truth” data and common definitions across the system to aid in internal benchmarking
A dedicated TMO is necessary for successful implementation of large-scale, high-complex transformations. TMO should be housed with an existing executive and built with existing resources
Leadership Alignment
TMODedicated
Leader& Staff
Change Management &
Communications
Campus-Level Integration
Methodology & Tools
• Leadership engagement and alignment• Encourage leadership by example• Eliminate “opt-outs”
• Develop and execute holistic communications plan• Create stakeholder outreach to minimize anxiety and
disruption• Serve as central clearinghouse for feedback to
process
• Develop common methodologies, approach to promote consistency across opportunities
• Build repository of analytics tools to support tracking of progress
• Embed with entity resources to build lines of communication between Workstreams and campuses
• Develop tactics to address unique needs of entity leaders/functions
• Encourage “change agents” for system-wide solutions
Training & Education
Business Intelligence & Analytics
Transformation Management OfficeExecutive Summary Summary Findings Facilities Finance Human Resources IT Sustainability and
Operating ModelImplementation
Timeline

OPEN – GB – INFO 5-124December 7-8, 2017
8. Implementation Timelines
8.1 – High Level Implementation Approach
8.2 – Opportunity Implementation PlansA) Facilities Implementation Workplan
B) Finance and Supply Chain Implementation Workplans
C) Human Resources Implementation Workplan
D) IT Implementation Workplan

OPEN – GB – INFO 5-125December 7-8, 2017
8.1 High Level Implementation Approach• This section includes preliminary workplan timelines
• These will be used to help guide the sequencing of activities during the design phase
• Timing is dependent on if/when the university decides to move forward with certain activities

OPEN – GB – INFO 5-126 December 7-8, 2017
High Level Implementation TimelineMobilization for the Activity Analysis Survey and Campus Assessment is currently underway, this will enable UM to achieve operational improvements in FY19
- Integrate campuses into design process- Implement near term opportunities
- Streamline distributed / duplicated functions- Optimize functional processes
- Integrate campuses into design process- Implement near term opportunities
- Design in/outsourcing strategy- Execute bid strategy
- Design TMO- Engage campus stakeholders
- Secure resources and budget- Execute change management and communications
Near-term opportunities realized
Op Model Implementation
TMO Operational
Full Savings Run Rate Achieved
- Engage functional stakeholders
- Develop and track Service Level Agreements and Key Performance Indicators
- Develop and execute AA survey
- Assess operations for additional underutilized resources
- Execute demand management strategies
- Understand current state each campus
- Identify FTEs workload by function - Inform operating model decisions
- Identify potential third-party partnership candidates- Understand feasibility and impact of P3
- Solicit P3 proposals from selected candidates- Select P3 partner(s) and measure impact
- Bring all campuses into engagement
Quarterly board updates
Executive Summary Summary Findings Facilities Finance Human Resources IT Sustainability and Operating Model
Implementation Timeline

OPEN – GB – INFO 5-127 December 7-8, 2017
Implementation Roadmap – Campus Assessment and IntegrationExecutive Summary Summary Findings Facilities Finance Human Resources IT Sustainability and
Operating ModelImplementation
Timeline
Calendar Year2018
Jan – Mar Apr – Jun Jul – Sep Oct – Dec
Activity Analysis
Campus Assessment
Identify and interview key stakeholders to understand current state
Gather data and assess functional operations
Integrate campus and System/Columbia analyses
Review and refine functional opportunities across UM system
Integrate campuses into opportunity workstreams
Engage functional leads at campus level to begin operating model discussions
Develop communication plan for functional assessment across all campuses
Identify leading practices at campuses
Distribute AA survey system wide
Analyze survey results

OPEN – GB – INFO 5-128 December 7-8, 2017
Implementation Roadmap – Operating ModelExecutive Summary Summary Findings Facilities Finance Human Resources IT Sustainability and
Operating ModelImplementation
Timeline
DesignConstruct
ImplementOperate & Review
Develop and execute stakeholder engagement plan
Review and document functional structures and resources across all campuses
Review of current state similarities and differences across the system
Review and determine operating model options and strategy
Implement new operating modelsOperate , measure, improve, and capture additional savings
Develop detailed implementation plan
Develop and implement pilot models
Implement activity analysis findings and implications
Address staff implications of reconfiguration (e.g. move, retrain)
Rework incentives, governance, and service level agreements
Incorporate learnings from pilot
Distribute AA survey system-wide
Analyze survey results
Campus Assessment
Calendar Year2018 2019 2020
Jan - Mar Apr – Jun Jul – Sep Oct – Dec Jan – Mar Apr – Jun Jul – Sep Oct – Dec
Activity Analysis
Operating Model

OPEN – GB – INFO 5-129 December 7-8, 2017
Implementation Roadmap – Operational EfficienciesExecutive Summary Summary Findings Facilities Finance Human Resources IT Sustainability and
Operating ModelImplementation
Timeline
DesignConstruct
ImplementOperate & Review
Identify Distributed FTEs
Review and document functional structures and resources across all campuses
Campus Assessment
Calendar Year2018 2019 2020
Jan – Mar Apr – Jun Jul – Sep Oct – Dec Jan – Mar Apr – Jun Jul – Sep Oct – Dec
Activity Analysis
Operational Efficiencies
Identify stakeholders and develop outreach planning
Pilot and test updated processes
Develop detailed implementation plan
Operate, measure, improve
Define reporting and develop service level agreements / KPIs
Identify non-MU campus opportunities and integrate into overall planning
Execute training plan on new processes and technologies
Implement near term opportunities
Design operational changes (non near term opportunities)
Incorporate learning from pilot

OPEN – GB – INFO 5-130 December 7-8, 2017
Implementation Roadmap – Revenue EnhancementExecutive Summary Summary Findings Facilities Finance Human Resources IT Sustainability and
Operating ModelImplementation
Timeline
DesignConstruct
ImplementOperate & ReviewCalendar Year
2018 2019 2020Jan – Mar Apr – Jun Jul – Sep Oct – Dec Jan – Mar Apr – Jun Jul – Sep Oct – Dec Jan – Mar Apr – Jun Jul – Sep Oct – Dec
Revenue Enhancement
Identify facilities/real estate assets across campus(es)
Prioritize and sequence opportunities based off return on investment
Identify 3rd party partnerships
Develop detailed implementation plan
Transition and implement according to negotiated plan
Monitor and adjust for continuous improvement
Negotiate and finalize opportunities
Assess implications of P3 on operations, Finance, and strategy
Review and document functional structures and resources across all campuses
Campus Assessment

OPEN – GB – INFO 5-131December 7-8, 2017
8.2 Implementation Timelines

OPEN – GB – INFO 5-132December 7-8, 2017
8.2A Facilities Implementation Workplan

OPEN – GB – INFO 5-133 December 7-8, 2017
Facilities Implementation Plan
Design Phase Implement Phase Operate and Review Phase
Calendar Year
Construct Phase
Opportunities identified as part of preliminary analysis
Additional opportunities to be evaluated Calendar Year
• Timelines are preliminary and will be refined during Design phase, certain investments may be required in order to achieve these milestones
Executive Summary Summary Findings Facilities Finance Human Resources IT Sustainability and Operating Model
Implementation Timeline
2018 2019 2020
Jan – Mar Apr – Jun Jul – Sep Oct – Dec Jan – Mar Apr – Jun Jul – Sep Oct – Dec Jan – Mar Apr – Jun Jul – Sep Oct – Dec
Real Property Operating Model RealignmentReal Property RationalizationRationalize Landscaping Scope
2018 2019 2020
Jan – Mar Apr – Jun Jul – Sep Oct – Dec Jan – Mar Apr – Jun Jul – Sep Oct – Dec Jan – Mar Apr – Jun Jul – Sep Oct – Dec
Monetize Excess and/or Underutilized Real PropertyIdentify Public-PrivatePartnership OpportunitiesReview Staffing ModelEfficiency

OPEN – GB – INFO 5-134 December 7-8, 2017
Facilities Savings Ramp Up
2017 2018
Full savings ramp up anticipated to achieve 100% by CY 2021 Q1
Calendar Year
Mill
ions
Over half of the Facilities Workstream savings will be captured by the middle of 2020
Executive Summary Summary Findings Facilities Finance Human Resources IT Sustainability and Operating Model
Implementation Timeline
2019 2020 2021
Legend:
New Savings Existing Savings
$6.8M
Note: Annual benefits are net of non-capital investment in capabilities needed, Savings of initial opportunity realized in 2018, additional savings realized in perpetuity

OPEN – GB – INFO 5-135 December 7-8, 2017
1. Real Property Operating Model RealignmentFY18 Q3 - FY18 Q41. Perform an activity analysis across campuses and System to identify and map current resources with real property responsibilities (informed by the proposed framework)2. Gather stakeholder initial reactions to the conceptual roadmap and re-evaluate the impact of suggestions to the proposed framework3. Perform a deep dive analysis around each function built into the framework and the cost-benefit associated with centralizing vs. decentralizing each function4. Perform an activity analysis to identify what each individual within the department is doing and who within the University is performing related functions (e.g. work order management, leasing)5. Identify potential service providers for areas of highest spend (e.g. maintenance, landscaping, construction, custodial, etc.)6. Assess the impact of the proposed realignment against the current model. Adjust and simplify the various processes to the extent possible, and layer in an updated framework to complement the operating structure
FY19 Q1 - FY19 Q21. Using industry leading practice models and the University of Missouri's requirements, map proposed FTE counts against framework.2. Develop a change management framework to guide the implementation process.3. Obtain vendor quotes for each of the highest spend areas identified4. Analyze internal costs (all-inclusive) compared to vendor quotes with level-set of service-levels5. Identify the capital investment required to execute the proposed plan.6. Highlight estimated cost savings as a result of FTE realignment and measure against the capital investment required.7. Consolidate the framework into a multi-phase project plan outlining the detailed action steps required to execute the transformation. Gain plan approval from stakeholders.
FY19 Q3 - FY20 Q41. Develop the policies, processes, and procedures that serve as the governing documents guiding the reporting hierarchy (establishing the governance structure).2. Execute the action plan, using change management protocols to guide the transformation process and limit disruption to on-going operations.3. Benchmark progress to pre-determined objectives and milestones. Adjust plan action steps where necessary and maintain flexibility to realign the approach to on-going developments.
Ongoing1. Maintain and review change management protocols to mitigate business disruption risks2. Encourage recurring check-ins to evaluate and adjust the structure as needed (more frequent check-ins at the onset)3. Review University "needs" on an annual basis to assess and address skill-gaps, opportunities for technological investment, and performance.
Design Construct Implement Operate and Review
Facilities Opportunities Identified – Implementation Plan (1 of 4)An implementation plan based on four clearly defined phases will help guide the path forward
Executive Summary Summary Findings Facilities Finance Human Resources IT Sustainability and Operating Model
Implementation Timeline
Timelines are preliminary and will be refined during Design phase, certain investments may be required in order to achieve these milestones

OPEN – GB – INFO 5-136 December 7-8, 2017
2. Real Property Rationalization (Owned & Leased Space)FY18 Q3 - FY 18 Q41. Consider existing plans to reduce 500,000 square feet and achieve operating reductions of $1.4 M anticipated2. Conduct accurate space utilization study using physical inspection and presence detection technology3. Assess 5 year staff, faculty and student growth projections4. Create mapping of current use by person / department and align with future projections5. Assess space use (density) and design requirements against industry standards and adjust as needed6. Define goals and objectives of space redesign / moving people around campuses7. Identify facilities that could be structurally redesigned to allow more stakeholder usage and variety8. Identify use of each leased space9. Stratify leases as needed vs desired10. Focus on leases that expire by 12/31/2018 first, then the remainder11. Define a standard leasing process that includes, for example, approvals needed, required consult with the Real Estate department, rental rate thresholds, use of brokers, etc.
FY19 Q1 - FY19 Q21. Map out multi-year relocation plan across campuses to meet goals and objectives (classify plan into “near term opportunities" and longer term)2. Classify buildings into categories for demolition, retrofitting, new build, etc.3. Identify capital needs to effect the relocation plan4. Identify public-private partnerships, monetization, bond/financing, or other sources of capital to effect the plan5. Define design standards, Furniture, fixtures, and equipment needs, etc. by department6. Achieve stakeholder buy-in for relocation plan, redesign standards, funding, etc.7. Consider remote options / hoteling systems in redesign plans and space rationalization analysis8. Identify leases that could be terminated 9. Obtain stakeholder buy-in for those impacted by a move
FY 19 Q3 - FY 21 Q31. Execute on near term opportunities2. Monetize assets that are underutilized / liquid / high value assets (see public-private partnerships and Monetization opportunities for more details)3. Demolish, refurbish, build as needed and execute relocations / multi-purpose redesign4. Roll out hoteling on select areas5. Determine specific roles / employees to start working remotely and effect that change6. Hold discussions with landlords to terminate leases7. Establish a business case for each remaining leased location
FY 21 Q3 - Ongoing1. Maintain and review change management protocols to mitigate business disruption risks2. Implement bi-annual utilization assessment to assess changes needed3. Review real estate holdings annually for monetization opportunities4. Regularly review multi-purpose space to analyze if intended uses are effective5. Monitor use of technology / remote working and employee / student satisfaction6. Maintain and review change management protocols to mitigate business disruption risks7. Establish a standard leasing process
Design Construct Implement Operate and Review
Facilities Opportunities Identified – Implementation Plan (2 of 4)An implementation plan based on four clearly defined phases will help guide the path forward
Executive Summary Summary Findings Facilities Finance Human Resources IT Sustainability and Operating Model
Implementation Timeline
Timelines are preliminary and will be refined during Design phase, certain investments may be required in order to achieve these milestones

OPEN – GB – INFO 5-137 December 7-8, 2017
Design Construct Implement Operate and Review3. Rationalize Landscaping ScopeFY 18 Q31. Consider needs based on known $265,000 in cuts planned for FY18 under budget reductions2. Identify campus zones and map individuals / costs to coverage areas3. Determine areas for service reduction based on 3 service tiers (annual mow n blow, monthly maintenance, botanical garden classification)
FY 18 Q31. Obtain stakeholder buy-in for reduction in service plan2. Determine cost savings and additional effort needed from those remaining on staff3. Consider 3rd party services for lower-maintenance needs (annual and monthly needs) - follow process noted in other opportunity
FY 18 Q3 - FY 18 Q41. Effect cost savings through staff reductions2. Execute contracts with vendors3. Identify in-house or 3rd party vendor to quality-check vendors and in-house staff against Service Level Agreements and leading practices
FY 19 Q1 - Ongoing1. Perform quarterly reviews of vendor performance against Service Level Agreements2. Obtain annual survey reports from stakeholders to promote satisfaction with vendor / in-house performance
Facilities Opportunities Identified – Implementation Plan (3 of 4)An implementation plan based on four clearly defined phases will help guide the path forward
Executive Summary Summary Findings Facilities Finance Human Resources IT Sustainability and Operating Model
Implementation Timeline
Design Construct Implement Operate and Review
4. Monetize Excess and/or Underutilized Real Property AssetsFY 18 Q2 - FY18 Q41. Identify use of all owned land parcels and buildings owned by the System and all campuses2. Stratify portfolio between (a) currently used (b) planned for future use (c) not in use3. Achieve stakeholder buy-in on how funds from sales will be utilized (e.g., fund space rationalization xx%, research efforts yy%, etc.)
FY 19 Q11. Stratify not in use holdings by potential sale date (considering ease of sale, market interest, and potential sales revenue)2. Obtain appraisals of holdings planned for sale within 9 months (a continual process of appraisal within 9 months of planned sale to avoid stale valuation estimates)3. Identify potential buyers4. Create plan for real estate gifts received (e.g. immediate sale, income generating opportunities, incorporate into campus use, etc.)
FY 19 Q4 – FY 21 Q11. Obtain appraisals as needed prior to sales2. Engage potential buyers in discussions3. Execute sales4. Fund space rationalization efforts and others as defined in Design stage
FY 21 Q1 - Ongoing1. Review real estate holdings annually for monetization opportunities2. Perform look-back testing as sales occur to assess accuracy of appraisers
Timelines are preliminary and will be refined during Design phase, certain investments may be required in order to achieve these milestones

OPEN – GB – INFO 5-138 December 7-8, 2017
Design Construct Implement Operate and Review5. Identify Public-Private Partnership OpportunitiesFY 18 Q3 - FY18 Q41. Define public-private partnership opportunities that are of interest to the University by campus (e.g., student housing, parking, dining facilities, retail)2. Determine which structuring opportunities are allowed under the University's known legal restrictions and obtain General Counsel buy-in3. promote public-private partnership opportunities are aligned with the portfolio's right sizing plan and University's Master Plans4. Prepare models to quantify annual and capital opportunities through various public-private partnership options and substantiate with market information
FY 19 Q1 – FY 19 Q31. Identify public-private partnership partners by opportunity2. Request proposals from partners and promote RFP process is aligned with University's broader plans / needs3. Achieve stakeholder buy-in for identified opportunities
FY 19 Q4 – FY 20 Q41. Sign contracts with public-private partnership partners and commence design / construction work2. Implement service level checks using an outside vendor or in-house staff to promote quality of public-private partnership partner work3. Market public-private partnership opportunities to the public in alignment with the University's other changes
Ongoing1. Maintain and review change management protocols to mitigate business disruption risks2. Implement quarterly Service Level Agreement assessment to promote public-private partnership partner execution3. Align departmental job descriptions / compensation with public-private partnerships execution to promote quality
6. Review Staffing Model EfficiencyFY 18 Q31. Identify accurate FTE count and student employee count2. Perform an activity analysis3. Identify FTE functions that could be performed by students4. Identify student employee functions that could be performed by 3rd party vendors (e.g., custodial), smart technology systems (e.g., parking tickets), or a shared service center (e.g., administrative)
FY 18 Q41. Analyze potential 3rd party alternatives (see opportunity on 3rd party vendors for process)2. Analyze break-even of an FTE to student resources to determine viability of fewer FTEs with more student resources3. Analyze potential of shared service center in connection with broader shared service center considerations
FY 19 Q1 - FY 19 Q21. Implement changes to staffing model based on results of analyses
FY 19 Q3 - Ongoing1. Annually, assess model and potential for additional efficiencies
Facilities Opportunities Identified – Implementation Plan (4 of 4)An implementation plan based on four clearly defined phases will help guide the path forward
Executive Summary Summary Findings Facilities Finance Human Resources IT Sustainability and Operating Model
Implementation Timeline
Timelines are preliminary and will be refined during Design phase, certain investments may be required in order to achieve these milestones

OPEN – GB – INFO 5-139December 7-8, 2017
8.2B Finance and Supply Chain Implementation Workplans

OPEN – GB – INFO 5-140 December 7-8, 2017
CY2017 CY2018 CY2019
Nov Dec Jan Feb Mar Apr May Jun Jul Aug Sep Oct Nov Dec Jan Feb Mar Apr May Jun Jul Aug Sep Oct Nov Dec
(1) Align Finance Personnel (Operating Model)
Note: This includes a high-level summary of the opportunities timing and prioritization. Additional details to be defined as a part of the mobilization stage.
(2) Consolidate Activities Currently Centralized at the Campus Level (Operating Model)
(5) Improve Business Insight Reporting & Planning Capabilities (Phase 1)
(2&3) Operating Model – Execute Activity Analysis
survey
(3) Identify Opportunities to Consolidate Activities Currently Occurring at the College/Department Level (Operating Model)
(5) Improve Business Insight Reporting & Planning Capabilities (Phase 2)
(6) Further Development of Finance Talent Development Strategy Continue as organizational changes are made
(4) Drive Broader Financial Accountability
Continue with adjustments to staffing levels in alignment with (3) below
Finance Opportunity Roll-outThe following implementation plan will be used to guide our path forward
Executive Summary Summary Findings Facilities Finance Human Resources IT Sustainability and Operating Model
Implementation Timeline

OPEN – GB – INFO 5-141 December 7-8, 2017
2017 2018 2019 2020
Full savings ramp up anticipated to achieve 100% by CY 2019 Q3
Calendar Year
The majority of Finance savings will be implemented by early 2019 (excludes Supply Chain opportunities)
Mill
ions
Legend:
New Savings Existing Savings
$8.8M
Note: Annual benefits are net of non-capital investment in capabilities needed
Executive Summary Summary Findings Facilities Finance Human Resources IT Sustainability and Operating Model
Implementation Timeline
Finance Savings Ramp Up

OPEN – GB – INFO 5-142 December 7-8, 2017
Finance Implementation Plan (1 of 6)
Design Construct Implement Operate and Review1. Align Finance Personnel (Operating Model)• Determine and initiate process to engage stakeholders throughout
opportunity execution• Review and document Finance structures and resources across all
campuses, including reporting lines for existing dedicated Finance resources (e.g., System, campus centralized and college and division fiscal officers) and known resources with Finance accountability (e.g., the Finance leads)
• Analyze alternative options for aligning Finance personnel while maintaining the balance between accountability at the System to the campuses, colleges, etc.
• Determine future state reporting lines through the Finance function from campus Finance to System
• Develop and socialize changes to organizational model which will require alignment and support of academic leadership to maintain campus partnering relationship
• Develop detailing implementation plan – phase 1 – alignment of existing dedicated resources.
• Develop implementation plan – phase 2 – alignment of ‘distributed’ resources – must be done in conjunction with alignment of other functional accountabilities (e.g., HR)
• Execute phase 1 implementation plan
• Execute phase 2 implementation plan
• Solicit feedback on operating model changes
An implementation plan based on four clearly defined phases will help guide the path forward
Executive Summary Summary Findings Facilities Finance Human Resources IT Sustainability and Operating Model
Implementation Timeline

OPEN – GB – INFO 5-143 December 7-8, 2017
Finance Implementation Plan (2 of 6)Design Construct Implement Operate and Review
2. Identify Opportunities to Consolidate Activities Currently Centralized at the Campus Level (Operating Model)• Determine and initiate process to engage stakeholders
throughout opportunity execution• Define survey participant population, including key
demographic information for each participant• Design a multi-function activity analysis survey to
determine functional support across the organization
• Execute activity analysis survey• Analyze activity analysis survey results to identify all resources that are
supporting Finance and Supply Chain activities• Evaluate opportunity to consolidate existing campus services across the
University- Accounting Services- Business Services, Contracting- Spans, layers and organizational rationalization within centralized Finance services (e.g., Card process, PO processing, Supplier Registration Process)
- Other transactional processes included as part of sponsored research, student services and advancement/giving should be considered concurrently
• UMAPSS & Supply Chain already a shared service supporting all campuses• Design process and organizational support for transaction processes (cash
disbursements, accounts receivable / debt collection, credit management, customer billing, general accounting, financial and external reporting, management reporting), decision support processes (tax planning, strategy and planning, budgeting and forecasting, business analysis and performance improvement) and specialty services (treasury, internal audit, process controls and compliance and tax accounting and compliance)
• Determine best alignment of consolidated and/or shared service capabilities and evaluate the need for new or modified SLAs
• Develop a implementation plan for each shared service and Finance and Supply Chain change
• Execute implementation plan • Solicit feedback on operating model changes
An implementation plan based on four clearly defined phases will help guide the path forward
Executive Summary Summary Findings Facilities Finance Human Resources IT Sustainability and Operating Model
Implementation Timeline

OPEN – GB – INFO 5-144 December 7-8, 2017
Finance Implementation Plan (3 of 6)Design Construct Implement Operate and Review
3. Consolidate Activities Currently Occurring at the College/Department Level (Operating Model)• Determine and initiate process to engage stakeholders
throughout opportunity execution• Define survey participant population, including key
demographic information for each participant• Design a multi-function activity analysis survey to
determine functional support across the organization
• Execute activity analysis survey• Analyze activity analysis survey results to identify all resources that are supporting
Finance and Supply Chain activities• Evaluate opportunity to move additional transaction processes to a shared service
center (e.g., accounting services and processes such as T&E which are done at department level). Evaluate in conjunction with appropriate segregation of dutiesand necessary service level.
• Determine best alignment of consolidated and/or shared service capabilities. All activities performed at the department level should be evaluated to determine if those activities can be performed more effectively and efficiently through another approach (e.g., arranging travel)
• Design process and organizational support for transaction processes (cash disbursements, accounts receivable / debt collection, credit management, customer billing, general accounting, financial and external reporting, management reporting), decision support processes (tax planning, strategy and planning, budgeting and forecasting, business analysis and performance improvement) and specialty services (treasury, internal audit, process controls and compliance and tax accounting and compliance)
• Assess opportunity to align Finance resources within the new operating model by campus to improve quality and consistency of business insight and other capabilities, enable a reduction of FTEs and align more consistently with size and complexity of College / School / Division (e.g. 21 fiscal officers at MU)
• Evaluate the need for new or modified service level agreements• Develop a implementation plan for each shared service and Finance and Supply
Chain change
• Execute implementation plan
• Solicit feedback on operating model changes
An implementation plan based on four clearly defined phases will help guide the path forward
Executive Summary Summary Findings Facilities Finance Human Resources IT Sustainability and Operating Model
Implementation Timeline

OPEN – GB – INFO 5-145 December 7-8, 2017
Finance Implementation Plan (4 of 6)
Design Construct Implement Operate and Review4. Drive Broader Financial Accountability• Determine and initiate process to engage stakeholders
throughout opportunity execution• Determine appropriate responsibility center management
approach for the University to include not only spend (including appropriate indirect costs) but revenue (including key metrics/drivers) and margin expectations down to college/school/division level
• Determine appropriate approach at the department and faculty level
• Formalize all funds budgeting approach principles as well as reporting (operating, research, endowment and other specific purpose use funds)
• Develop implementation plan including the revamped budgeting approach
• Execute implementation plan • Solicit feedback on all funds budgeting approach and identify ways to further educate and inform the organization on the new approach and reports
An implementation plan based on four clearly defined phases will help guide the path forward
Executive Summary Summary Findings Facilities Finance Human Resources IT Sustainability and Operating Model
Implementation Timeline

OPEN – GB – INFO 5-146 December 7-8, 2017
Finance Implementation Plan (5 of 6)
Design Construct Implement Operate and Review5. Improve Business Insight Reporting and Planning Capabilities• Determine and initiate process to engage stakeholders
throughout opportunity execution• Understand and catalog current state business insight reporting
tools, reports inventory and processes• Understand current state strategic, budget and forecast
capabilities through workshops and/or interviews• Evaluate current state reports and processes against better
practice and identify gaps• Assess current state strategic, budget and forecast capabilities
against better practice to determine gaps and identify issues and opportunities for improvement across process, organization, and supporting technology areas
• Conduct report standardization workshops to define and validate report content requirements and validate that existing reporting tools support
• Conduct workshops with key business stakeholders to define and achieve consensus on future state planning capabilities. This would need to prioritize System spend and campus investments and also support an operational understanding of financial results. These short and longer term capabilities would need to include Academic, Research and Other
• Create reporting standards, including: formatting, defined source systems, frequency, ownership / distribution, and archiving
• Develop and finalize standardized reports• Establish processes and technology to sustain report
standardization and rationalization improvements• Communicate and conduct training to roll out business insight
approach and reports to the organization• As a part of the talent development strategy, work to improve the
skills and capabilities of resources supporting business insight roles at the campus level which may result in fewer, higher paid partnering resources
• Develop implementation plan (which will likely include a multi-phase approach to meet near and longer term goals)
• Execute implementation plan • Solicit feedback on processes and technology supporting business insight reporting capabilities
• Monitor Key PerformanceIndicators related to business insight reporting capabilities (e.g. days to forecast, etc.)
An implementation plan based on four clearly defined phases will help guide the path forward
Executive Summary Summary Findings Facilities Finance Human Resources IT Sustainability and Operating Model
Implementation Timeline
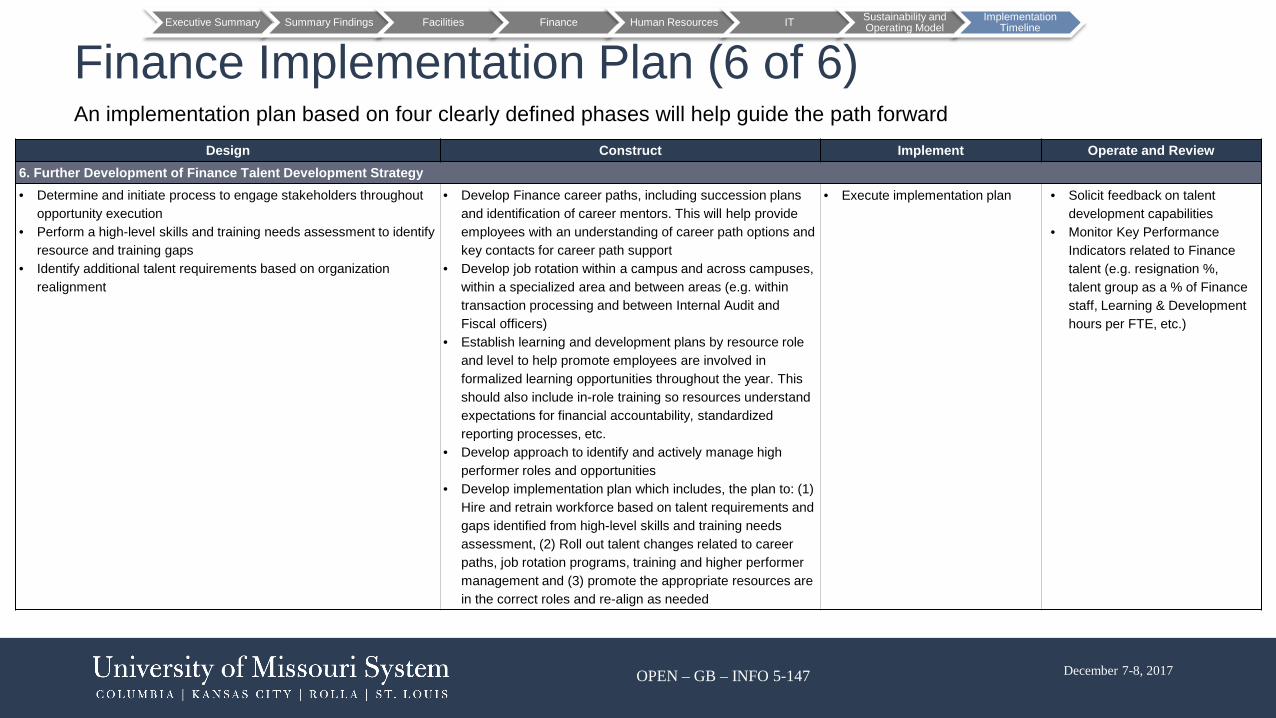
OPEN – GB – INFO 5-147 December 7-8, 2017
Finance Implementation Plan (6 of 6)Design Construct Implement Operate and Review
6. Further Development of Finance Talent Development Strategy• Determine and initiate process to engage stakeholders throughout
opportunity execution• Perform a high-level skills and training needs assessment to identify
resource and training gaps• Identify additional talent requirements based on organization
realignment
• Develop Finance career paths, including succession plans and identification of career mentors. This will help provide employees with an understanding of career path options and key contacts for career path support
• Develop job rotation within a campus and across campuses, within a specialized area and between areas (e.g. within transaction processing and between Internal Audit and Fiscal officers)
• Establish learning and development plans by resource role and level to help promote employees are involved in formalized learning opportunities throughout the year. This should also include in-role training so resources understand expectations for financial accountability, standardized reporting processes, etc.
• Develop approach to identify and actively manage high performer roles and opportunities
• Develop implementation plan which includes, the plan to: (1) Hire and retrain workforce based on talent requirements and gaps identified from high-level skills and training needs assessment, (2) Roll out talent changes related to career paths, job rotation programs, training and higher performer management and (3) promote the appropriate resources are in the correct roles and re-align as needed
• Execute implementation plan • Solicit feedback on talent development capabilities
• Monitor Key PerformanceIndicators related to Finance talent (e.g. resignation %, talent group as a % of Finance staff, Learning & Development hours per FTE, etc.)
An implementation plan based on four clearly defined phases will help guide the path forward
Executive Summary Summary Findings Facilities Finance Human Resources IT Sustainability and Operating Model
Implementation Timeline

OPEN – GB – INFO 5-148 December 7-8, 2017
Supply Chain Implementation Plan Design Construct Implement Operate and Review
1. Support Operating Model Redesign for Non-Labor Spend
FY18 Q2• Perform spend analysis by department• Identify outliers by GL expense, & review detail within each area • Socialize findings with departments
FY18 Q3• Informed by the spend analysis, work with outlying
departments to develop targeted opportunities for spend reduction (dues and subscriptions, office supplies, etc.)
• Socialize opportunities with leadership and key stakeholders
FY18 Q4• Conduct GL training and communication roll out in
coordination with the controllers office
FY19 Q2 - Ongoing• Measure and monitor performance, utilization and services
delivered
2. Improved Enforcement of Supply Chain Controls
FY18 Q2• Perform source analysis to determine departmental compliance
with Supply Chain processes
FY18 Q3• Update policy language to allow Supply Chain to enforce
departmental accountability• Enforce existing PO policies and procedures to ensure
department compliance
FY18 Q3 – FY18 Q4• Meet with departments to review Supply Chain process
and level set expectations of PO / Supply Chainmoving forward
• Implement controls and approval thresholds to promote confirming orders are captured within normal PO processes
FY19 Q1 - Ongoing• Monitor Confirming Order % and address slippage as
needed
3. Increase Spend Under Supply Chain Management
FY18 Q2• Opportunity implementation already underway. Confirm vendors
for Show Me Shop incorporation, and identify any additional areas for consideration (ongoing)
FY18 Q3• Review Maintenance Repair and Operations (MRO)
contracts to determine viability of adding new suppliers or enhancing current contracts.
• Gain alignment on centralization of contract management for business services at S&T, UMKC, UMSL in cooperation with MU Finance
FY18 Q3 – FY18 Q4• Ongoing roll out of vendors on SMS
FY19 Q1 - Ongoing• Monitor SMS vs P-Card utilization for further insights into
key vendors for potential onboarding
4. Enhance Contract Review Process
FY18 Q2• Create performance metric standards
FY18 Q3• Utilize advanced analytics (e.g. Primrose, et al) to identify
significant spend reduction opportunities• Identify areas for tactical / corporate contracting • Establish performance metrics for contracts
FY18 Q4• Implement business review process and score cards
based on predetermined metrics for major vendors
FY19 Q1 - Ongoing• Continue to identify areas for strategic contracts and
contract collaboration that meet department needs, provide cost savings and bring forth value.
An implementation plan based on four clearly defined phases will help guide the path forward
Executive Summary Summary Findings Facilities Finance Human Resources IT Sustainability and Operating Model
Implementation Timeline

OPEN – GB – INFO 5-149December 7-8, 2017
8.2C Human Resources Implementation Workplan

OPEN – GB – INFO 5-150 December 7-8, 2017
Typically, an HR Transformation can take two to three years; the journey begins with aligning institutional leaders on UM’s “people strategy” and a common delivery model for HR services
HR Transformation Journey
1
2
3
Establish HR strategy and build the foundation• Obtain buy-in from institutional leaders on people strategy• Employment Value Proposition (“EVP”) and human capital
opportunities• Gain alignment on HR scope of services and service delivery model
(re-align and re-allocate resources as needed) • Standardize HR processes to enable an effective service delivery
model and drive efficiencies, where possible• Establish strategy for optimizing usage of HR technology (e.g., HRIS,
digital, cloud, automation, etc.)• Clarify HR roles & responsibilities / refine HR processes• Define and deploy employee engagement strategies and tools (e.g.,
annual survey)
Optimize HR to drive people-oriented culture• Redesign HR reporting lines, roles and responsibilities• Develop and implement strategic workforce planning
capability and talent acquisition / onboarding process that promotes the right talent is in the right roles at the right time
• Implement technology solutions to drive greater efficiency / effectiveness and access to real-time, actionable data
• Establish feedback loop between the business / HR
Continuously seek and gain organizational buy-in and live the Employment Value Proposition• Strategic partnership between the
business and HR – shared accountability for talent outcomes and cultural transformation
• Utilize data to drive strategic planning and decision making
• Robust pipeline of internal / external candidates
Executive Summary Summary Findings Facilities Finance Human Resources IT Sustainability and Operating Model
Implementation Timeline

OPEN – GB – INFO 5-151 December 7-8, 2017
The bulk of the HR opportunities are achievable by the end of 2019, however more than half of the savings potential for rationalizing health benefits won’t be realized until the end of the following year
2018 2019 2020
Jan –Mar
Apr –Jun
Jul –Sep
Oct –Dec
Jan –Mar
Apr –Jun
Jul –Sep
Oct –Dec
Jan –Mar
Apr –Jun
Jul –Sep
Oct –Dec
1 HR Transformation
2 Total Rewards
3 Administrative Assistant Realignment
Total Year Savings (Low) $2.2M $20.8M $20.8M
Design Phase Implement Phase Operate and Review PhaseConstruct Phase
Executive Summary Summary Findings Facilities Finance Human Resources IT Sustainability and Operating Model
Implementation Timeline
HR Implementation Plan

OPEN – GB – INFO 5-152 December 7-8, 2017
HR Savings Ramp Up
Full savings ramp up anticipated to achieve 100% by CY 2019 Q4
2017 2018 2019 2020Calendar Year
Mill
ions
HR’s full savings will be realized in 2020 to allow for changes to employee benefits
Executive Summary Summary Findings Facilities Finance Human Resources IT Sustainability and Operating Model
Implementation Timeline
Legend:
New Savings Existing Savings
Note: Annual savings are net of non-capital investments
$20.8M
OPEN – GB – INFO 5-153December 7-8, 2017
8.2D IT Implementation Workplan

OPEN – GB – INFO 5-154 December 7-8, 2017
IT Implementation Plan
Design Phase Implement Phase Operate and Review Phase
Calendar Year
Construct Phase
After projects are approved, this plan will be revised to balance resources and adjusted for dependencies
Executive Summary Summary Findings Facilities Finance Human Resources IT Sustainability and Operating Model
Implementation Timeline

OPEN – GB – INFO 5-155 December 7-8, 2017
IT Savings Ramp Up
2017 2018 2019 2020
Full savings ramp up anticipated to achieve 100% by CY 2020 Q3
Legend:
New Savings Existing SavingsCalendar Year
Mill
ions
Executive Summary Summary Findings Facilities Finance Human Resources IT Sustainability and Operating Model
Implementation Timeline
$4.2M
Note: Annual investments are net of non-capital investments
IT’s full savings will be realized in 2020

OPEN – GB – INFO 5-156 December 7-8, 2017
IT Implementation Planning Steps (1 of 2)
Design Construct Implement Operate and Review
1. Governance and Operating Model
FY18 Q3 – FY19 Q11. Define goals for the project. Create program charter. Align incentives. Assign executives to champion the program.2. Prepare process maps, identify processes that provide competitive advantage or address a unique requirement3. Map servers to applications, identify capacity needed to host servers, plan migration groups, plan staff roles4. Inspect phone system and plan maintenance or upgrade for call volume. Plan call routing.5. Identify Level 1 and Level 2 skills, call flow and dispatch processes.
FY19 Q2 - FY20 Q11. Install target servicing image. Configure the image with common processes.2. Install common applications. Plan sunsetting of applications3. Install seed equipment for migration4. Update HD procedures, stage phone system changes
FY20 Q2 - FY20 Q41. Move new student servicing image and supporting applications into production.2. Stage cutover to new system and processes by campus.3. Migrate servers by group4. Begin call routing to central HD by campus
FY21 Q11. Use metrics and feedback to adjust processes.2. Maintain a incident database and track resolution of incidents.3. Create a problem database and start a problem management/root cause elimination quality process.
2. IT Spend Governance
FY18 Q3Devise and implement gating process and begin communicating process.
FY18 Q4Implement gating process for IT purchases.
FY19 Q1Establish purchasing review board Inject IT thought leadership and review in budgeting process
FY19 Q2Monitor transactions with IT vendors to validate effectiveness of gating process.
An implementation plan based on four clearly defined phases will help guide the path forward.
Note: Prioritization, resourcing and dependency mapping will be done before project schedules can be approvedIT Support is needed to complete opportunities from other work streams. These projects will need to be added to this list for prioritization and planning
Executive Summary Summary Findings Facilities Finance Human Resources IT Sustainability and Operating Model
Implementation Timeline

OPEN – GB – INFO 5-157 December 7-8, 2017
IT Implementation Planning Steps (2 of 2)
Design Construct Implement Operate and Review3. Rationalize Distributed IT Desktop / Support ServicesFY18 Q31. Review distributed team's workload and determine
potential rebalancing 2. Inform business units on changes in IT support 3. Identify actions to be taken
FY18 Q41. Communicate changes2. Staffing Changes
FY19 Q11. Measure and monitor performance, utilization and services being delivered through the new operating model2. Make changes if needed based on utilization and performance of teams
FY19 Q21. Measure and monitor performance, utilization and services being delivered through the new operating model2. Make changes if needed based on utilization and performance of teams
4. Consolidate Web Hosting PlatformsFY18 Q31. Get approval and buy-in for the business case to adopt a central platform for web hosting strategy2. Create and review implementation project plan with key stakeholders and align on implementation timeline and milestones
FY18 Q4Begin implementation as per project plan
FY19 Q11. Monitor progress, remediate risks and engage stakeholders regularly to remove obstacles to project plan2. Reduce roles that were previously engaged in managing different web hosting platforms across departments and campuses
FY19 Q2Continue to consolidate web platforms and reduce roles across other campuses and departments
5. Increase App Development/Support ROI RequirementsFY18 Q3Create IT intake governance process and publish to organization
FY18 Q41. Revise pipeline2. Plan staffing adjustments
FY19 Q11. Manage pipeline2. Adjust staffing
FY19 Q21. Manage pipeline2. Adjust staffing
6. Reduce Innotas LicensingCurrently Implementing N/A N/A N/A
An implementation plan based on four clearly defined phases will help guide the path forward.
Note: Prioritization, resourcing and dependency mapping will be done before project schedules can be approvedIT Support is needed to complete opportunities from other work streams. These projects will need to be added to this list for prioritization and planning
Executive Summary Summary Findings Facilities Finance Human Resources IT Sustainability and Operating Model
Implementation Timeline

OPEN – GB – INFO 5-158 December 7-8, 2017

OPEN – GB – INFO 5-159December 7-8, 2017
Appendix

OPEN – GB – INFO 5-160 December 7-8, 2017
Over seventy stakeholders have contributed to this engagement
Stakeholders Engaged in Process
• Catlynn Adkins • Mun Choi • Chrissy Kintner • David Russell • Carly Wrisinger
• Gary Allen • Marsha Fischer • Katie Lockwood • Garnett Stokes • Jerry Wyckoff
• Ashley Berg • Rhonda Gibler • Camila Manrique • Gary Ward
• Alex Cartwright • Patti Haberberger • Ryan Rapp • Kelly Wiemann
Engagement Leadership & Communication (18)
• Beth Asbury • Pete Millier
• Jeff Brown • Gerald Morgan
• John Haynes • Mike Sokoff
• Kevin Hogg • Steve Wild
Facilities (8)
Finance (10)
• Jessica Baker • Greg Nelson
• Allen Johanning • Jatha Sadowski
• Tonya Loucks • Derek Smith
• Amy McKenzie • Carol Wilson
• Mackenzie Moorefield
Human Resources (9)
• Jennifer Alexander • Kristin Meade
• Tony Hall • Heather Reed
• Marcy Maddox • Teresa Vest
Supply Chain (6)Information Technology (12)
• Kevin Bailey • Rusty Crawford • Brandon Hough • Terry Robb
• Aaron Berlin • Hala Dawood • Kirk Keller • Bryan Roesslet
• Benjamin Canlas • Megan Hartz • Jason Lockwood • Nikki Witting
• Rick Baniak • Todd Mackley
• Karla Dowd • Michelle Piranio
• Tracy Greenup • Cuba Plain
• Ed Knollmeyer • Thomas Richards
• Sharon Lindenbaum • Eric Vogelweid
Note: Many stakeholders engaged with multiple workstreams over the course of this assessment
• Melanie Barger • Mark McIntosh
• Elizabeth Beal • Sahra Sedighsarvestani
• Sean Brown • Pamela Stuerke
• David Fannin • Alan Toigo
• Jean Kirch-Holliday
Faculty and Staff Representatives (9)

OPEN – GB – INFO 5-161 December 7-8, 2017
Scoring Matrix MethodologyInputs to scoring matrix
1) Bubble Size - Overall Expected Net Benefit to the University -- This should incorporate all financial savings or increases in revenues less costs associated with implementation.
2) X-Axis - Time in Years -- Taken to achieve full savings (indicated by when the full run rate of savings has been achieved). Select between 1, 2 or 3 years to implement. Measure time in the length of time needed to achieve full implementation, not as a measure from today
3) Y-Axis - Risk to Implementation -- This measure has subcomponents that will need to be individually scored on a 1 to 5 scale. 1 carrying the lowest risk and 5 the highest. The following subcomponents should be discussed and scored independently.
“Balance Risk & Reward” “Careful consideration”
“Quick wins” “Implement over time”
Time (Years) 1 2 3
Impl
emen
tatio
n R
isk
/ Diff
icul
ty
Non-Renew LeasesMS Project
Reduction in benefits
Public Private Partnerships
<$.5M $1M+
Sample – instructive purposes only
Facilities HR
Finance IT
Operating Model Redesign
Bubble Size = Expected Benefit
Risk Quantification MethodologyLow Medium High
1 2 3 4 5
Scoring Guiding QuestionsA) ComplexityA1) How many different actions need to be taken in order to implement this opportunity?
Few, relatively simple workplan
Some, but relatively contained within functional
area
Multi-step, significant dependencies that will need to be coordinated and across different
business unitsA2) Are the decisions regarding implementation contained largely within each functional area and campus, or will buy-in from a larger stakeholder group be required, including 3rd parties?
Yes, at full discretion with the functional
area leads
Requires informed / consult from other leaders,
but limited to no involvement with 3rd
parties
Requires buy-in from multiple leaders who may have concerns over opportunity and/or involves
action steps from 3rd parties
B) InvestmentsAre there technology or other financial investments that need to be made to enable implementation and realize the full savings goal?
No, no investments will be required to
achieve opportunity
Yes, some investment, but within norms of
reasonable budget requests
Yes, significant investment required, need sponsoring
executive and Finance dept. approval
What personnel or other "soft" investments including staff time will need to be made in order to achieve the benefits of this opportunity?
No additional investments
identified
Yes, soft investments will be required, but fall within normal operating norms.
Yes, significant investment required, including the hiring of
new FTEs / positions or implementing new capabilities
C) Impact to StakeholdersWhat classification of stakeholders are being impacted?
No impact to employees or other
stakeholders
Changes to the way work is done, but not
fundamentally disruptive
Significant risk of negative impact to identified stakeholders
Is the overall perceived impact to stakeholders negative or positive?Extremely Positive Neutral Extremely Negative
Scoring matrix