administrative manual gs200.2 county of...
TRANSCRIPT

ADMINISTRATIVE MANUAL GS200.2 COUNTY OF LOS ANGELES 6/30/17
DEPARTMENT OF PUBLIC WORKS GEOTECHNICAL AND MATERIALS ENGINEERING DIVISION
P:\Gmepub\Development Review\Policy Memos\GS200.2.docx Page 1 of 17 6/30/17
GUIDELINES FOR GEOTECHNICAL INVESTIGATION AND REPORTING LOW IMPACT DEVELOPMENT STORMWATER INFILTRATION Urbanization impacts the water resources of Los Angeles County by decreasing the amount of stormwater that infiltrates into the subsurface and increasing the potential for conveyance of pollutants into watersheds and the flood control system. Low Impact Development (LID) stormwater infiltration is a strategy that is used to mitigate some of these hydrological impacts. The goal of LID stormwater infiltration is to reduce runoff from the site using stormwater quality control measures that retain runoff. The objective of these guidelines is to facilitate stormwater infiltration in areas of Los Angeles County where ground conditions are suitable. Compliance with the Los Angeles County LID Ordinance (Title 12, Section 12.84) is required before the issuance of a building or grading permit. The Department of Public Works prepared an updated LID Standards Manual in February, 2014 to compile previous documents, update standards, and assist applicants with the development process. The LID Standards Manual is available online at the following link: https://goo.gl/OaOQ0l. The procedure for calculating Stormwater Quality Design Volume (SWQDv) is provided in Section 6 of the document. The geotechnical guidelines presented herein have been incorporated into the LID Standards Manual in "Section 4: Site Assessment and Design Considerations" and on the Fact Sheets in Appendix E. They provide technical guidance and specific requirements for geotechnical investigations to evaluate ground conditions for proposed stormwater infiltration sites. All proposed stormwater quality control measure Best Management Practices (BMPs) with an infiltration component require a geotechnical report. These LID stormwater quality control measures include but are not limited to:
• Bioretention • Infiltration Trench • Permeable Pavement
• Infiltration Basin • Dry Well
Geotechnical reports prepared for stormwater infiltration BMPs must address the site requirements discussed in these guidelines. Data and analyses must be provided to substantiate the recommended infiltration rates and groundwater elevations. Geotechnical issues that must be addressed include pollutant and sewage mobilization, slope stability, static and seismic settlement, surcharge on adjacent structures, expansive soil and rock, potential impacts to offsite property, and any other geotechnical hazards. Geotechnical reports will be reviewed by the Geotechnical and Materials Engineering Division (GMED). Design infiltration rates and recommended areas of infiltration in compliance with these guidelines will be recommended for approval.

P:\Gmepub\Development Review\Policy Memos\GS200.2.docx Page 2 of 17 6/30/17
SITE REQUIREMENTS FOR STORMWATER INFILTRATION 1. Subsurface materials shall have a design infiltration rate equal to or greater than
0.3 inches per hour. Procedures for performing in-situ percolation tests and application of reduction factors are described later in these guidelines.
2. The invert of stormwater infiltration shall be at least 10 feet above the groundwater
elevation. Procedures for determining the groundwater elevation are described later in these guidelines.
3. Stormwater infiltration is not allowed in areas that pose a risk of causing pollutant mobilization, such as on sites identified on environmental regulatory databases or similar files maintained by local agencies, or on properties with other documented environmental concerns.
4. Stormwater infiltration is not allowed in areas that pose a risk of causing sewage effluent
mobilization from septic pits, seepage lines, or other sewage disposal. 5. Stormwater infiltration BMPs shall not be placed on steep slopes and shall not create
the condition or potential for slope instability. 6. Stormwater infiltration shall not increase the potential for static settlement of structures
on or adjacent to the site. Laboratory testing should be performed to evaluate the anticipated settlement and hydrocollapse potential of soils 10 feet below the proposed invert of infiltration.
7. Stormwater infiltration shall not increase the potential for seismic settlement of structures on or adjacent to the site. Liquefaction potential shall be evaluated considering the design volume of stormwater infiltration.
8. Stormwater infiltration shall not place an increased surcharge on structures or foundations on or adjacent to the site. The pore-water pressure shall not be increased on soil retaining structures on or adjacent to the site.
9. The invert of stormwater infiltration shall be set back at least 15 feet and outside a
1:1 plane drawn up from the bottom of adjacent foundations, unless otherwise recommended by the geotechnical consultant.
10. Stormwater infiltration shall not be located near utility lines where the introduction of stormwater could cause damage to utilities or settlement of trench backfill.
11. Stormwater infiltration is not allowed within 100 feet of any groundwater production wells used for drinking water.

P:\Gmepub\Development Review\Policy Memos\GS200.2.docx Page 3 of 17 6/30/17
GEOTECHNICAL INVESTIGATION A site-specific geotechnical investigation performed for proposed stormwater infiltration quality control measures shall include subsurface exploration, laboratory testing, soil type classification, groundwater investigation, and in-situ percolation testing. The investigation must be conducted by or under direct supervision of a State of California certified professional geologist, geotechnical engineer, or civil engineer experienced in geotechnical engineering. Projects proposing to infiltrate a cumulative design volume of SWQDv greater than 10,000 gallons must also include a hydrogeologic assessment and be signed by a State of California certified professional geologist. It is highly desirable that large projects also utilize the services and input of a State of California certified hydrogeologist. Subsurface Exploration Subsurface exploration shall be performed to characterize the subsurface soil or bedrock through which water will infiltrate. Explorations shall be performed to a depth of at least 10 feet below the proposed invert of infiltration. Explorations must be performed at each proposed infiltration BMP location. Continuous methods of exploration (such as cone penetration testing or continuous sampling) are preferred. If continuous methods of exploration are not feasible, enough exploration shall be performed to sufficiently characterize the soil or bedrock. Laboratory Testing Tests shall be performed on samples collected at and below the proposed invert of stormwater infiltration. Sieve analysis, hydrometer, plasticity index, density, and moisture content tests provide indicators of infiltration potential. A discussion shall be provided on how these parameters will affect the proposed stormwater quality control measure BMP. Laboratory testing should also be performed to evaluate the potential for settlement and ground subsidence to occur resulting from the operation of the proposed stormwater infiltration device. At a minimum, 10 feet of soil below the proposed invert of infiltration should be tested for consolidation and hydrocollapse. Soil Type Classification Soil type is one of the best indicators to determine if a proposed site is suitable for infiltration. Classification of soils at and below the proposed invert of infiltration shall be made in accordance with Unified Soil Classification System (USCS). The USCS is defined by the American Society for Testing and Materials (ASTM) International Standard D2487. Coefficient of Permeability The coefficient of permeability is a soil index property understood to be closely related to the infiltration potential of soils. The figure included herein presents typical coefficients of permeability for different soil type classifications. It is provided as a general reference. As shown, the required minimum design infiltration rate is 0.3 inches per hour.

P:\Gmepub\Development Review\Policy Memos\GS200.2.docx Page 4 of 17 6/30/17
Permeability and Drainage Characteristics of Soils from Terzaghi and Peck (1996)
Groundwater Investigation Historic high groundwater maps may be used to verify the seasonal high groundwater elevation is greater than 10 feet below the proposed invert of infiltration. Historic high groundwater elevations may be available in the Seismic Hazard Evaluation Open-File Reports prepared by the California Geological Survey at the following link: https://goo.gl/VlESFZ. Existing groundwater data may also be used to verify the seasonal high groundwater elevation is greater than 10 feet below the proposed invert of infiltration. Recent data from Geotracker, Envirostar, local water companies, and other resources may be used to establish a seasonal high groundwater elevation. Current groundwater data and historical publications are available online through the State’s Department of Water Resources Website (https://goo.gl/qu8JsG), the Water Replenishment District of Southern California (https://goo.gl/enVgJG), and others. Groundwater data for a given project may be used from sites that are within 1,000 feet of the proposed project and have been collected within the last 5 years. Existing groundwater data must be clearly presented in the report and will be subject to review and approval by GMED. If historic high groundwater maps and existing data are not available, site-specific exploration can be performed to establish the seasonal high groundwater elevation. At least two borings must be drilled a minimum of 10 feet below the proposed invert. The borings must be monitored for a period of at least 24 hours to verify the seasonal high groundwater elevation is greater than 10 feet below the proposed invert of infiltration. Hydrogeology Sites proposing to infiltrate a SWQDv of 10,000 gallons or more must have the geotechnical report signed and stamped by a State of California certified professional geologist. It is highly recommended that reports for large projects also be signed and stamped by a certified hydrogeologist. The consulting geologist of record should provide findings and conclusions regarding the local and regional geologic and hydrogeologic conditions and their effect on the proposed stormwater infiltration project. Features including but not limited to water tables, aquifers, past groundwater issues, confining units, stratigraphy, depth of bedrock, rock type, lithology, landslides, and faults should be discussed. Conclusions must be made regarding depth to seasonal high groundwater elevation.
0.3 inches per hour

P:\Gmepub\Development Review\Policy Memos\GS200.2.docx Page 5 of 17 6/30/17
IN-SITU PERCOLATION TESTING Percolation testing must be performed to determine a reduced infiltration rate for design of the proposed stormwater infiltration quality control measures. At least two percolation tests shall be performed at each location and elevation where stormwater infiltration is proposed for mid-scale and large scale projects. Alternative test procedures must be submitted ahead of time and will be approved on a case-by-case basis. Specific procedures and durations may be required by Building and Safety Division (BSD), Land Development Division (LDD), or GMED at any time.
Percolation Test Requirements Small Scale Mid-Scale Large Scale
Stormwater Quality Design
Volume (SWQDv)
<1,000 Gallons (<134 cubic feet)
1,000 - 10,000 Gallons (134 – 1,337 cubic feet)
>10,000 Gallons (>1,337 cubic feet)
Type of Test Any Any Large Scale Testing Procedures
Minimum Test Duration 2 hours 4 hours 6 hours
Notes:
• Percolation tests must be performed for the minimum test duration or until the entire SWQDv for that location has been infiltrated during the test.
Double-Ring Infiltrometer Test (ASTM D3385) A double-ring infiltrometer consists of two concentric metal rings. The rings are driven into the ground to preclude leakage, and then filled with water. Water in the outer ring keeps the flow in the inner ring vertical and the drop in water level in the inner ring is used to establish the vertical percolation rate. This testing procedure is useful for evaluating LID features that are proposed close to the ground surface, or can be performed at depth in a trench excavation. Procedures and example data forms for double-ring infiltrometer testing are provided in ASTM D3385. See photo below for example test setup. Field log template with example are attached on Plates 1-A, 1-B, and 1-C.
Double Ring Infiltrometer (ASTM D3385) Test Setup

P:\Gmepub\Development Review\Policy Memos\GS200.2.docx Page 6 of 17 6/30/17
Well Permeameter Test (USBR 7300-89) The well permeameter procedure consists of introducing water into the subsurface through a slotted PVC pipe inserted into a borehole. This testing procedure is useful for LID features that are proposed at depth, since slotted sections of PVC pipe can be placed at any depth in the borehole. Careful attention must be paid to isolate the depth of the test section with an impermeable cap above and below it. The annulus between the slotted PVC and native materials in the test section depths must be backfilled with well-draining sand. The borehole below the desired test section depths, and the annulus between solid PVC and native materials above the desired test section, must be backfilled with bentonite or other low-permeability material. The borehole itself cannot create a path of less resistance for the water than the in-situ materials that are being tested. Details for this test can be found in the Procedure for Performing Field Permeability Testing by the Well Permeameter Method (USBR 7300-89) attached in Appendix A. See photo below for example test setup. Field log template with example are attached on Plates 2-A, 2-B, and 2-C.
Well Permeameter (USBR 7300-89) Test Setup
Boring Percolation Test Procedure This procedure is similar to the USBR 7300-89 Well Permeameter Testing Procedure and is useful for LID features that are proposed at depth, since the depth of testing can be isolated with slotted sections of PVC pipe, surrounded by a bentonite cap, and placed at any depth in the borehole. It requires the application of a reduction factor to account for non-vertical flow. A schematic of the test setup is attached on Plate 3-A. Field log template with example are attached on Plates 3-C and 3-D. 1. Using a hollow-stem auger, advance the boring at least 12 inches below the elevation of
proposed invert of infiltration. Rotate the auger until all cuttings are removed. Care shall be taken to ensure smearing of clayey soils does not occur along augered surface as this will dramatically reduce the final calculated infiltration rate. Record the boring diameter and depth to be tested.

P:\Gmepub\Development Review\Policy Memos\GS200.2.docx Page 7 of 17 6/30/17
2. Install through the auger, a 2- to 4-inch-diameter perforated PVC casing with a solid end cap. Perforations shall be 0.02 inch slot or larger. Pour filter pack down inside of auger while withdrawing the auger such that the PVC casing is surrounded by the filter pack. The filter pack and perforated casing must have a larger hydraulic conductivity than the soil or rock that is to be tested.
3. For boreholes drilled below the proposed invert of infiltration that are being converted to
boring percolation tests, careful attention must be paid to isolate the depth of the test section with an impermeable cap above and below it. The annulus between the slotted PVC and native materials in the test section must be backfilled with well-draining sand. The borehole below the desired test section, and the annulus between solid PVC and native materials above the desired test section, must be backfilled with bentonite or similar low-permeability material. The borehole itself shall not create a path of less resistance for the water than the in-situ materials being tested.
4. Presoak the hole immediately prior to the percolation testing for at least 1 hour to ensure
the sand around the annulus of the perforated pipe is fully saturated.
5. Determine the time interval for recording the water drop between readings. Fill the excavation 12 inches above the bottom. Observe the drop in the water during the next 30 minutes and compare with the condition that applies below. This will determine the time interval for this test location.
a. If water drains in less than 10 minutes, a constant head or high flowrate test
procedures must be used to justify high recommended infiltration rates.
b. If water remains in the hole after 10 minutes but drains before 30 minutes, the time interval between readings shall be 10 minutes.
c. If water remains in the hole after 30 minutes, the time interval between readings
shall be 30 minutes.
6. Once the time interval for the test has been determined, add water to the casing for the depth of soil to be tested. The water depth must be less than or equal to the water level used to presoak the hole and a minimum depth of 12 inches above the bentonite plug. For each successive percolation test reading, the starting water level must be at this initial water depth.
7. Conduct the percolation test by taking readings of the volume and water drop from the initial water depth. Record the time, volume, and drop in water level during the time interval determined in Step 5. Fill the boring back to the initial water depth and record the time of filling for each successive percolation test reading. A sounder or piezometer may be used to determine the water level for test sections at depth. Measurements of all water levels must be taken to the nearest ⅛-inch increment.

P:\Gmepub\Development Review\Policy Memos\GS200.2.docx Page 8 of 17 6/30/17
8. Repeat the percolation test readings a minimum of eight times A stabilized rate is when the highest and lowest readings are within 10 percent of each other from three consecutive readings.
9. The raw percolation rate shall be calculated by dividing the volume of water discharged, by the surface area of the test section (including sidewalls plus the bottom of the boring, if applicable), in a given amount of time. The average of the stabilized rate over the last three consecutive readings is the measured percolation rate at the test location, expressed in inches per hour.
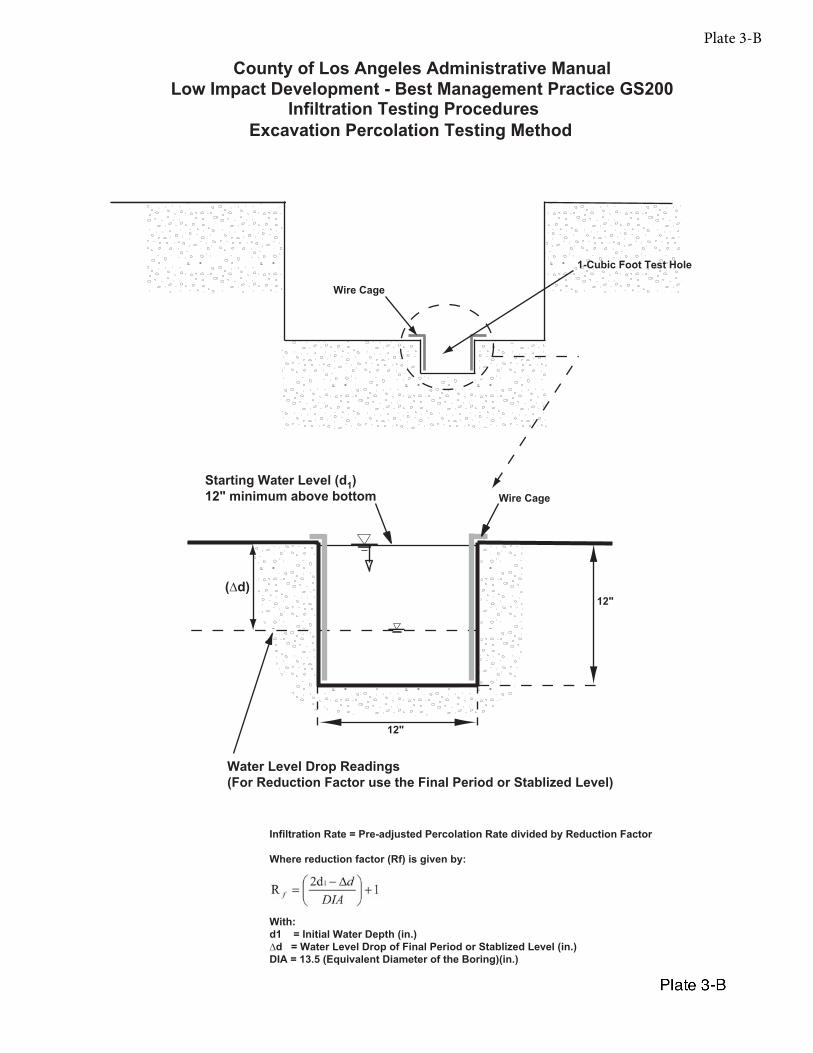
Excavation Percolation Test Procedure Similar to the double-ring infiltrometer, this testing procedure is useful for LID features that are proposed to be constructed close to the ground surface, or can be performed at depth in a trench excavation. It requires the application of a reduction factor to account for nonvertical flow. A figure is attached on Plate 3-B. Field log template with example are attached on Plates 3-C and 3-D. 1. Excavate a 1 cubic foot hole (1 foot deep x 1 foot wide x 1 foot long) at the elevation of
the proposed invert of infiltration. Insert a wire-cage to support the walls. The actual excavation depth may be deeper than 12 inches; however, during the test the water shall be limited to 12 inches in depth.
2. Presoak the hole by filling it with water immediately prior to the percolation testing. If the water seeps completely away within 30 minutes after filling the excavation two consecutive times, and the subsurface exploration has yielded permeable soils beneath the proposed invert of infiltration, presoaking can be considered complete and the testing can proceed. If the water does not completely drain within 30 minutes, presoak the excavation maintaining 12 inches of water for at least 4 hours before conducting the percolation testing. Record all water levels to the nearest ⅛-inch increment.
3. Determine the time interval for recording the water drop between readings. Fill the excavation 12 inches above the bottom. Observe the drop in the water during the next 30 minutes and compare with the condition that applies below. This will determine the time interval for this test location.
d. If water drains in less than 10 minutes, a constant head or high flowrate test
procedures must be used to justify high recommended infiltration rates.
e. If water remains in the hole after 10 minutes but drains before 30 minutes, the time interval between readings shall be 10 minutes.
f. If water remains in the hole after 30 minutes, the time interval between readings
shall be 30 minutes.

P:\Gmepub\Development Review\Policy Memos\GS200.2.docx Page 9 of 17 6/30/17
4. Once the time interval for the test has been determined, add water to 12 inches above the bottom of the excavation. For each successive percolation test reading, the starting water level must be at this initial water depth.
5. Conduct the percolation test by taking readings of the water drop from the initial water
depth. Record the time and record the drop in water level during the time interval determined in Step 3. Fill the excavation back to the initial water depth and record the time of filling.
6. Repeat the percolation test readings a minimum of eight times or until a stabilized rate
of drop is obtained, whichever occurs first. A stabilized rate is when the highest and lowest readings are within 10 percent of each other for three consecutive tests.
7. The average drop of the stabilized rate over the last three consecutive readings is the
percolation rate at the test location, expressed in inches per hour. The measured percolation rate must be reduced to account for the discharge of water from both the sides and bottom of the boring (i.e., non-vertical flow). Use the following formula to determine the infiltration rate:
Reduction Factor (Rf) = 15.13
d2R 1+
∆−
=d
f
d1 = Initial Water Depth (in.) Δd = Water Level Drop of Final Period or Stabilized Rate (in.) DIA = 13.5 (Equivalent Diameter of the boring) (in.)
High Flowrate Percolation Test Procedures
If water drains completely in less than 10 minutes and the measured rate is greater than 14 inches per hour during a boring percolation test, excavation percolation test, or any other test procedure, a modified test must be performed to determine the infiltration rate. This test may be conducted in the following manner:
1. Determine the surface area through which the water is infiltrating including sidewalls and
bottom horizontal surface area. 2. Flood test excavation area so the volume discharging into the test pit can be measured
using a flow meter.
3. Maintain a constant head of water in the hole for at least two hours. Take readings of cumulative volume of water infiltrated every ten minutes.
4. Calculate the percolation rate by dividing the total volume of water infiltrated by the total
duration of the test and dividing by the percolation surface area.
5. Apply reduction factors and recommend an infiltration rate in inches per hour.

P:\Gmepub\Development Review\Policy Memos\GS200.2.docx Page 10 of 17 6/30/17
LARGE SCALE PERCOLATION TESTING PROCEDURES These test procedures are being provided due to an increased interest in large-scale, regional, stormwater infiltration facilities. These types of facilities include infiltration basins, galleries, dry wells, and other large-scale stormwater infiltration projects. Water quality innovation and technology is encouraged; alternative designs will be reviewed on a case-by-case basis. Infiltration Basin Percolation Test – Constant Head Large scale in-situ percolation tests must be performed using the constant head test procedure described below to determine a long-term design infiltration rate for design of stormwater infiltration basins and galleries. This test requires excavation of a large area to represent the proposed size of an infiltration basin or gallery and reduces some of the scaling errors associated with small and mid-sized tests. In summary, this test requires a large excavation, uses constant head of water, takes readings in gallons every 15-30 minutes using a flowmeter, and has a 6 hour minimum duration. Procedure 1. Determine the required horizontal surface area of testing and determine the number and
sizes of tests needed to satisfy the required testing area in the table below. Test pits are typically excavated using a backhoe for shallow facilities. Testing can also be performed at deeper depths in large diameter borings; however, the combined surface area of the bottom of the borings needs to meet the total required horizontal surface area in the table below for each proposed basin.
Large Regional Projects Extra-Large Regional Projects
Stormwater Quality Design Volume (SWQDv)
10,000 - 500,000 Gallons (1,337 – 66,840 cubic feet)
>500,000 Gallons (>66,840 cubic feet)
Required Horizontal Surface Area of Testing 32 square feet 100 square feet
2. Excavate the test pits to the same elevation as the proposed invert of the infiltration.
Slopes should be laid back in accordance with CAL-OSHA safety requirements. If performing tests in a large diameter boring, a minimum 5 foot layer of gravel backfill should be placed at the bottom of borings to prevent caving and erosion of soils.
3. Document the size and geometry of test pits. Install a vertical measuring rod in the test pit marked in half-inch increments. If performing the tests in large diameter borings, insert one PVC pipe to introduce water and one slotted PVC pipe to measure and maintain the water surface elevation. The pipe being used to deliver water should be at least 4-inch-diameter, placed in the center of the boring, and have at least 5 feet of slotted section at the bottom of the hole. The water delivery PVC pipe should be embedded into at least 5 feet of gravel at the bottom of the hole to allow for unrestricted movement of water. The pipe being used to measure and maintain the water elevation may be a smaller diameter and must be slotted the entire length of the boring. A schematic of the test setup is attached on Plate 4a.

P:\Gmepub\Development Review\Policy Memos\GS200.2.docx Page 11 of 17 6/30/17
4. Use a hose with a splash plate on the bottom to convey water into the pit and reduce sidewall erosion and disturbance of the pond bottom. If performing the tests in large diameter borings, water can be introduced via a hose inserted at least 5 feet into the borehole or through the water delivery pipe described in Step 3.
5. Add water to the excavation at a rate that will maintain a constant head with the water
surface elevation approximately 1 foot above the bottom of the test pit or boring and proposed invert of infiltration. A flowmeter can be used to measure the volume and instantaneous flow rate. The water elevation during testing may not exceed the maximum depth of water anticipated in the proposed facility. For facilities serving large drainage areas and designs with multiple feet of standing water, percolation tests may be performed with more than 1 foot of standing water.
6. Record the cumulative volume in gallons, instantaneous flow rate in gallons per minute, and water surface elevation every 15-30 minutes. If performing the tests in large diameter borings, a water sounder may be used to measure the water surface elevation in the slotted PVC pipe during the test.
7. Keep adding water to the test pit until at least one hour after the flow rate in the pit has stabilized. The stabilized flow rate can be defined when the highest and lowest readings are within 10 percent of each other, for three consecutive increments. The combined pre-soak time, testing duration, and at least one hour after the flow rate has stabilized shall be no less than 6 hours. For sites where percolation occurs very quickly, the test may be stopped after the entire SWQDv has been infiltrated during the test.
8. After the test is complete, turn the water off and record the drop on the measuring rod in inches per minute until the pit is empty. Consider running this falling head phase of the test several times to estimate the dependency of infiltration rate with water head.
9. At the conclusion of testing, over-excavate the pit to see if the test water is mounded on
shallow restrictive layers or if it has continued to flow deep into the subsurface. The depth of excavation will vary depending on soil type and depth to hydraulic restricting layer, and shall be determined by the soils engineer. Mounding is an indication that a mounding analysis may be necessary. Over-excavation is not necessary if testing is performed in a large diameter boring at depth.
Data Analysis
10. Plot results of the percolation test as cumulative volume in gallons versus time in hours.
The slope of the line during steady state conditions represents the stabilized flow rate for the percolation test.
11. Convert the stabilized flow rate in gallons per hour to cubic feet per hour. Divide the stabilized flow rate by the surface area of percolation to determine the raw measured rate. The surface area of percolation is the sum of the wetted surface including the bottom horizontal surface area and the average wetted sidewall surface area.

P:\Gmepub\Development Review\Policy Memos\GS200.2.docx Page 12 of 17 6/30/17
12. When multiple percolation tests are performed, consider whether an average or lower bound of the infiltration rates is more appropriate for design. Provide justification.
13. Apply reduction factors in accordance with guidance on Page 17 to determine a site-specific long term infiltration rate that can be used for design.
DRY WELL PERCOLATION TEST There has been specific interest from Los Angeles County and the State Regional Water Quality Control Board regarding development of large scale dry well stormwater infiltration facilities. To address this interest, the following test procedure has been adapted from Los Angeles County Department of Public Health Guidelines: Percolation Testing for Seepage Pit and Gravel Packed Pit Dispersal Systems. The test requires excavation of large diameter borings to model the proposed size of infiltration dry wells and reduces some of the scale errors associated with small scale and mid-size tests. In summary, the test requires a fire hose, flowmeter, and water sounder, takes readings every 15-30 minutes, and has a 6-hour minimum test duration. Procedure 1. Excavate boring with minimum 18-inch-diameter for percolation testing. When safety
concerns exist, the boring shall be filled with gravel or other well-draining materials. If the boring is backfilled, two separate pipes must to be inserted to conduct the test. A slotted pipe should be inserted the entire length of the borehole to measure the water level during the test. A separate pipe at least 4-inch-diameter should be placed in the center of the borehole to deliver water. The lower 5 feet of the water delivery pipe should be slotted for introduction of water into the borehole without interfering with pipe setup for water level measuring equipment. Mark the pipes at the surface to avoid confusion regarding which pipe is used for water delivery and which is for measurement. A schematic of the dry well test setup is attached on Plate 4b.
2. Boreholes may only remain open if there are no safety concerns. The covering and securing of open test excavations and borings shall be performed in accordance with CAL-OSHA safety requirements.
3. Introduce clear water under constant pressure into the solid pipe in the boring through a hose with minimum 1 1/2-inch diameter size, corresponding with the water meter. If the borehole is open, insert at least 5 feet of hose into the boring before filling with water to prevent caving and erosion of side walls.
4. Monitor the water level in the slotted pipe as the boring fills with water. Record the volume of water needed to fill the borehole.
5. Record the volume of water required to maintain a constant head in the borehole for equal time increments of 15 to 30 minutes. Maintain a head that is representative of the design head of the proposed drywell system.

P:\Gmepub\Development Review\Policy Memos\GS200.2.docx Page 13 of 17 6/30/17
6. Alternatively, if a constant head cannot be maintained, a modified falling head test can be performed. For a modified falling head test, allow the water to drop for equal time increments of 15 to 30 minutes. Record the drop in the water level and volume required to fill the hole back to the cap level (top of well) for each increment.
7. Continue adding water to the boring for a minimum 6 hours and until at least 1 hour after the flow rate into the boring has stabilized. The constant flow rate is defined as when the highest and lowest readings are within 10 percent of each other for three consecutive increments.
8. In situations where percolation occurs very quickly, the test may be stopped after 2 hours and the entire SWQDv or 2,000 gallons have been infiltrated.
9. At the conclusion of the constant head percolation test, it is beneficial to observe the
drop in water level as a falling head test. The depth of water 24 hours after the conclusion of the at the test can be subtracted from the initial depth to determine a recommended height for proposed dry wells.
Data Analysis 10. Plot results of the percolation test as cumulative volume in gallons versus time in hours.
The slope of the line during steady state conditions represents the stabilized flow rate for the percolation test.
11. Convert the stabilized flow rate in gallons per hour to cubic feet per hour. Divide the stabilized flow rate by the surface area of percolation during the test to determine a raw measured rate. The surface area of percolation during the test is the sum of wetted surfaces including the bottom surface area of the boring and the wetted sidewalls.
12. When multiple percolation tests are performed, consider whether an average or lower bound of the infiltration rates is more appropriate for design. Provide justification.
13. Apply reduction factors in accordance with guidance on the following page to determine a site-specific long term infiltration rate that can be used for design.
14. Present the recommended long term design infiltration rate for proposed dry wells in
inches per hour and gallons per square foot per day. The total volume of water infiltrated during the test shall also be included.
15. Provide recommendation for the allowable depth of dry wells as the top of well at the
anticipated inlet and the bottom of well at the elevation of water 24 hours after the conclusion of the constant head test. An alternative depth of infiltration may be recommended by the geotechnical consultant based on the site-specific stratigraphy. It is preferred that the bottom of each dry well be embedded at least 5-10 feet into a well-draining sandy layer. Recommendations for the allowable dry well depth will be subject to review and approval by GMED.

P:\Gmepub\Development Review\Policy Memos\GS200.2.docx Page 14 of 17 6/30/17
REDUCTION FACTORS Measured percolation rates must be reduced to determine design values that will represent long-term performance of the proposed infiltration BMPs. It is the responsibility of the geotechnical engineer to recommend appropriate site-specific reduction factors that account for the test method, site variability, and long-term siltation. The recommended reduction factor should consider the SWQDv to be treated and the overall practicality of the project.
• Test-specific reduction factors must be applied to account for the direction of flow during the test and reliability of different test methods.
• Reduction factors for site variability, number of tests performed, and thoroughness of the subsurface investigation shall be selected by comparing the size and scope of subsurface exploration to similar projects.
• The reduction factor for siltation, plugging, and maintenance shall be selected based on the specified levels of pre-treatment and maintenance requirements.
The following table provides guidance for the range of values that may be used for each factor. All reduction factors will be subject to review and approval by the County.
Reduction Factors
Double-ring infiltrometer Well permeameter Boring percolation Excavation percolation High flow-rate percolation Infiltration Basin Percolation Test Dry Well Percolation Test
RFt = 2 RFt = 2 RFt = 2 RFt = Rf from test procedure RFt = 3 RFt = 2 RFt = 2
Site variability, number of tests, and thoroughness of subsurface investigation RFv = 1 to 3
Long-term siltation, plugging and maintenance RFs = 1 to 3
Total Reduction Factor, RF = RFt x RFv x RFs Design Infiltration Rate = Measured Percolation Rate / RF

P:\Gmepub\Development Review\Policy Memos\GS200.2.docx Page 15 of 176/30/17
REPORTING
The geotechnical report shall provide an evaluation of the proposed specific stormwaterquality control measures and their suitability for use in the project. The report mustinclude the SWQDv proposed for infiltration. The report shall address any potentialgeotechnical hazards and contain a description of the subsurface conditions with logs ofsubsurface exploration, results of laboratory testing, soil classifications, depth togroundwater, and in-situ percolation test results. There shall be a discussion on thepercolation test procedure including field data sheets, test results, and reduction factors.A recommended long term infiltration rate shall be provided for design, along with thedepth at which the recommended infiltration rate can be applied. Guidance shall beprovided to the developer that no grading or construction can disturb soils at or below theproposed invert depth of infiltration. The geotechnical consultant shall providerecommendations for underdrains and overflows, as necessary, and discuss bestpractices for operation and maintenance to maintain the effectiveness of the proposedfacility for its design life. All recommendations from the geotechnical consultant must beincorporated in the design or shown as notes on the plans.
The report must be signed and stamped by a State of California licensed engineeringgeologist, geotechnical engineer, or civil engineer experienced in soil mechanics.
DISCUSSION
Infiltration rates are understood to have a very large range by orders of magnitude fordifferent soil types. There is also substantial uncertainty associated with even the mostrigorous testing procedures. For these reasons, it is important that the recommendeddesign infiltration rate fall in the general order of magnitude for the soil type classificationsat the site. If there is discrepancy between the presented data and the recommendedinfiltration rates, the consultant shall revisit soil descriptions, soil data, percolation testingprocedure and analyses to provide a substantiated explanation for any variance.Additional testing and discussion may be necessary to verify the infiltration rates prior toacceptance by the County
Approved by:
Mitch MillerPrincipal Engineer
Greg KelleyAssistant Deputy Director

P:\Gmepub\Development Review\Policy Memos\GS200.2.docx Page 16 of 17 6/30/17
RESOURCES 1. American Standard Test Method (ASTM) Standard, Designation D 3385,
Standard Test Method for Infiltration Rate of Soils in Field Using Double-Ring Infiltrometer (latest edition). http://www.astm.org/Standards/D3385.htm
2. California Department of Conservation, Seismic Hazard Zone Reports,
Division of Mines and Geology, Los Angeles County, 1998. http://www.consrv.ca.gov/cgs/shzp/pages/index.aspx
3. California Regional Water Quality Control Board Los Angeles Region,
Waste Discharge Requirements for Municipal Separate Storm Sewer System (MS4), NPDES Permit No. CAS004001, Order No. R4-2012-0175, November 8, 2012. http://www.waterboards.ca.gov/rwqcb4/water_issues/programs/stormwater/municipal/
4. County of Los Angeles, Code of Ordinances, Title 12, Chapter 12.84, Low Impact Development Standards. https://library.municode.com/html/16274/level2/Tit12EnPr_Ch12.84loimdest.html
5. County of Los Angeles, Department of Public Health, Conventional and Non-Conventional Onsite Wastewater Treatment Systems – Requirements and Procedures, July, 2016. http://www.publichealth.lacounty.gov/eh/EP/lu/lu_owts.htm
6. County of Los Angeles, Department of Public Works, Low Impact Development Standards Manual, February 2014. http://dpw.lacounty.gov/ldd/lib/fp/Hydrology/Low Impact Development Standards Manual.pdf
7. State of California, Department of Transportation, Division of Engineering
Services, Soil and Rock Logging, Classification, Presentation Manual, 2010. http://www.dot.ca.gov/hq/esc/geotech/sr_logging_manual/srl_manual.html
8. State of California, Department of Water Resources, Groundwater Information
Center: Groundwater Level Monitoring, 2017. http://www.water.ca.gov/groundwater/data_and_monitoring/levels.cfm
9. Terzaghi, K., Peck, Ralph B., and Mesri, G., Soil Mechanics in Engineering Practice, Third Edition, 1996.

P:\Gmepub\Development Review\Policy Memos\GS200.2.docx Page 17 of 17 6/30/17
10. United States Department of the Interior, Bureau of Reclamation (USBR), Procedure for Performing Field Permeability Testing by the Well Permeameter Method, USBR 7300-89. http://www.usbr.gov/pmts/wquality_land/DrainMan.pdf
11. United States Department of Agriculture, Chapter 7: Hydrologic Soil Groups,
Natural Resources Conservation Service National Engineering Handbook, http://directives.sc.egov.usda.gov/OpenNonWebContent.aspx?content=17757.wba
12. Washington State Department of Ecology Water Quality Program, Stormwater Management Manual for Western Washington, Section 3.3.6 Design Saturated Hydraulic Conductivity – Guidelines and Criteria, Publication No. 14-10-055, December 2014, https://fortress.wa.gov/ecy/publications/parts/1410055part5.pdf
13. Water Replenishment District of Southern California, Regional Groundwater Monitoring Reports, 2017. http://www.wrd.org/content/regional-groundwater-monitoring-reports

DOUBLE-RING INFILTROMETER TEST (use ASTM D 3385)
Project: Constants Area (in2)
Depth of water (in)
Water Containers No. Volume/ΔH (in2/in)
Test Location: Inner Ring Annular Space
Water Source: pH: Tested By: Water level maintained using: Flow valve Float valve Mariotte tube Depth to water table: Penetration of rings: Inner: Outer:
Trial No.
Date
____
Time (24hr format)
hh:mm
Elapsed Time Δ/(total),
min
Flow Readings Water Temp.
°F
Incremental Infiltration
Remarks: weather conditions, etc.
Inner Ring Annular Space Inner
in/hr
Annular
in/hr Reading
in Flow in3
Readingin
Flow in3
1
Plate 1-A

DOUBLE-RING INFILTROMETER TEST (use ASTM D 3385)
Project: Practice Infiltration Testing Constants Area (in2)
Depth of water (in)
Water Containers No. Volume/ΔH (in3/in)
Test Location: 123 Drive Road, Alhambra, CA Inner Ring 109.59 1.57 1 12.17 Annular Space 326.43 1.61 2 27.39
Water Source: Potable Water pH: 7.5 Tested By: BDS, YH, & WM Water level maintained using: Flow valve Float valve X Mariotte tube Depth to water table: 17 ft Penetration of rings: Inner: 3.0 in Outer: 6.9 in
Trial No.
Date
1982
Time (24hr format)
hh:mm
Elapsed Time Δ/(total),
min
Flow Readings Water Temp.
°F
Incremental Infiltration
Remarks: weather conditions, etc.
Inner Ring Annular Space Inner
in/hr
Annular
in/hr Reading
in Flow in3
Readingin
Flow in3
1 S 10/14 10:00 15 1.18 6.96 0.87 23.74 59 0.25 0.29 Cloudy, slight windE “ ” 10:15 (15) 1.75 1.73 59
2 S “ ” 10:15 15 1.75 12.94 1.73 48.51 59 0.47 0.59 E “ ” 10:30 (30) 2.81 3.5 59 3 S “ ” 10:30 15 2.81 16.05 3.5 51.75 59 0.59 0.63 E “ ” 10:45 (45) 4.13 5.39 59 4 S “ ” 10:45 15 4.13 18.67 5.39 57.67 59 0.68 0.71 E “ ” 11:00 (60) 5.67 7.5 60 5 S “ ” 11:00 30 5.67 46.26 7.5 141.82 60 0.84 0.87 E “ ” 11:30 (90) 9.47 12.68 61 6 S “ ” 11:30 30 9.47 51.75 12.68 157.44 61 0.95 0.96 Refilled tubes
E “ ” 12:00 (120) 13.72 18.43 62 7 S “ ” 12:10 60 1.38 118.63 0.87 360.16 62 1.08 1.1 “ ”
E “ ” 13:10 (180) 11.12 14.02 63 8 S “ ” 13:20 60 0.94 114.54 1.26 347.22 64 1.04 1.06 “ ”
E “ ” 14:20 (240) 10.35 13.94 64 9 S “ ” 14:30 60 1.69 103.5 1.85 308.41 64 0.95 0.94 “ ”
E “ ” 15:30 (300) 10.2 13.11 64 10 S “ ” 15:40 60 0.87 96.78 1.77 295.48 64 0.88 0.9 “ ”
Cloudy, slight wind E “ ” 16:40 (360) 8.82 12.56 64
Plate 1-B

Graphical Representation of Data from Example
Plate 1-C

WELL PERMEAMETER TEST (reference USBR 7300-89)
Project: Boring/Test Number: r, radius of boring: ft Date:Test Location: D, boring depth below ground surface: ft Condition I:
Tu ≥ 3h h, depth of water maintained from bottom of hole: ftW, water table, or impervious layer, depth below ground surface: ft Condition II:
h ≤ Tu ≤ 3hBMP Invert: Tu, depth to water table or impervious layer from surface of water
maintained:ft Note: Tu = W - D + h
Water Source: Turbidity: Water level determined by: Flow meter Float valve Calibrated tank
Tested By: S, Anticipated Specific Yield: S ≈ 0.1 for fine grained & 0.35 for course grained.
( )
3
2min
11ln
209.2
⎪⎪
⎭
⎪⎪
⎬
⎫
⎪⎪
⎩
⎪⎪
⎨
⎧
−⎟⎠
⎞⎜⎝
⎛ ++
=
rh
rh
hSV
Example: h = 3.5 ft, r = 0.5 ft, and S = 0.15, then the minimum water volume (Vmin) needed for testing is 51 ft3 or 381 gal.
Vmax = 2.05Vmin Example: maximum water volume needed for testing, 381 gal(2.05) = 781 gal.
Trial No.
Date Time (24hr format)
hh:mm
Time Interval
min
Accumulated Time
min
Flow Meter / Tank Readings
Accumulated Flow
gallons
Water Temp.
°F
Flow Rate, Q Remarks: weather conditions, etc.
gallons Δ (gallons)
gpm ft3/min
1
2
3
4
5
6
7
8
9
10
11
12 Plate 2-A

WELL PERMEAMETER TEST (reference USBR 7300-89)
Project: Practice Infiltration Testing Boring/Test Number: r, radius of boring: 0.5 ft Date: 5/4/1990 Test Location: 123 Drive Road, Alhambra, CA D, boring depth below ground surface: 6.0 ft Condition I:
Tu ≥ 3h N33º 53' 12.1" W118º 21' 27.6" h, depth of water maintained from bottom of hole: 3.5 ftW, water table, or impervious layer, depth below ground surface: 7.0 ft Condition II:
h ≤ Tu ≤ 3h XBMP Invert: 5’ below existing ground surface Tu, depth to water table or impervious layer from surface of water
maintained:4.5 ft Note: Tu = W - D + h
Water Source: Potable Water Turbidity: Water level determined by: X Flow meter Float valve Calibrated tank
Tested By: YH & CM S, Anticipated Specific Yield: 0.15 S ≈ 0.1 for fine grained & 0.35 for course grained.
( )
3
2min
11ln
209.2
⎪⎪
⎭
⎪⎪
⎬
⎫
⎪⎪
⎩
⎪⎪
⎨
⎧
−⎟⎠
⎞⎜⎝
⎛ ++
=
rh
rh
hSV
Example: h = 3.5 ft, r = 0.5 ft, and S = 0.15, then the minimum water volume (Vmin) needed for testing is 51 ft3 or 381 gal.
Vmax = 2.05Vmin Example: maximum water volume needed for testing, 381 gal(2.05) = 781 gal.
Trial No.
Date Time (24hr format)
hh:mm
Time Interval
min
Accumulated Time
min
Flow Meter / Tank Readings
Accumulated Flow
gallons
Water Temp.
°F
Flow Rate, Q Remarks: weather conditions, etc.
gallons Δ (gallons)
gpm ft3/min
1 10/8 08:00 180 180 0 45.8 45.8 61 0.254 0.034 70’s slightly cloudy, used one 55-galdrum. Refilled before next test. “ ” 11:00 45.8
2 “ ” 11:15 180 360 0 44.6 90.4 64 0.248 0.0331 “ ” 14:15 44.66 3 “ ” 14:30 240 600 0 44.9 135.3 65 0.187 0.025 Connected 2 55-gal drums together for
trial no. 4. “ ” 18:30 44.9 4 “ ” 19:00 690 1290 0 92.8 228.1 63 0.134 0.018 10/9 06:30 92.8 5 “ ” 06:40 360 1650 0 51.0 279.1 61 0.142 0.019 “ ” 12:40 51 6 “ ” 12:55 390 2040 51 57.2 336.3 66 0.147 0.0196 disturbed some soil into hole when
observing for turbidity “ ” 19:25 108.2 7 “ ” 19:30 690 2730 0 90.5 426.8 55 0.131 0.0175 10/10 07:00 90.5 8 “ ” 07:20 360 3090 0 49.6 476.4 60 0.138 0.0184 “ ” 13:20 49.6
Plate 2-B

300.0
400.0
500.0
600.0
umulated
Flow (g
allons)
Example Time‐Discharge Curve
h = 3.5 ftr = 6 in
h/r = 7Tu = 4.5 ft
q = 140.1 gal / 1050 min = 0.133 gal/min or 0.018 ft3/minTemp = 65.3° F (18.5 C)
K20 = 0.59 in/hr
Vminimum= 381 gal
Vmaximum= 782 gal
1050 min
140.1gal
0.0
100.0
200.0
0 500 1000 1500 2000 2500 3000 3500
Accu
Time (min)
Plate 2-C

Filter Pack
2 to 4 inch PVC Perforated Pipe
(Perforations must be 0.02 inch or larger)
Percolation Rate = Volume infiltrated divided by surface area of test section, in specified time
DIA
Starting Water Level - Initial depthWater Level Drop in Readings: convert to volume of water(Δd)
Infiltration Testing ProceduresBoring Percolation Testing Method
County of Los Angeles Administrative Manual
Low Impact Development - Best Management Practice GS200
Plate 3-A
Wire Cage
1-Cubic Foot Test Hole
12"
12"
Starting Water Level (d1) 12" minimum above bottom Wire Cage
Infiltration Rate = Pre-adjusted Percolation Rate divided by Reduction Factor
Where reduction factor (Rf) is given by:
With:d1 = Initial Water Depth (in.)!d = Water Level Drop of Final Period or Stablized Level (in.)DIA = 13.5 (Equivalent Diameter of the Boring)(in.)
(!d)
Water Level Drop Readings(For Reduction Factor use the Final Period or Stablized Level)
Infiltration Testing ProceduresExcavation Percolation Testing Method
County of Los Angeles Administrative ManualLow Impact Development - Best Management Practice GS200
Plate 3-B

Excavation Percolation Testing Field Log Date ________
Project Location Boring/Test Number Earth Description Diameter of Boring Diameter of Casing Tested by Depth of Boring Liquid Description Depth to Invert of BMP Measurement Method Depth to Water Table
Depth to Initial Water Depth (d1) Time Interval Standard Start Time for Pre-Soak Water Remaining In Boring (Y/N) Start Time for Standard Standard Time Interval Between Readings
!"#$%&'()*+,"-(
.%+"(/0#-012&$(3445++6(
27#89"$(.%+"(:0%+"(3+%&96(
;#0"-(<-=8(<*-%&'(/0#&$#-$(.%+"(>&0"-?#7(:$((3%&@4"96(
A"-@=7#0%=&(!#0"(B=-(!"#$%&'((3%&14-6(
/=%7(<"9@-%80%=&1)=0"91C=++"&09((
!!
!! ! ! !
!!
!! ! !
!!
!!
! ! !!
!!
!! ! !
!!
!!
! ! !!
!!
!! ! !
!!
!!
! ! ! !
!!
!! ! !
!!!!!
!!
!! ! !
!!!!!
!!
!! ! !
!!!!
!!
! ! !!!!!!
!!
!! ! !
!!
!!
! ! !!!!!!
!!
!! ! !
!!!!!
!!
!! ! !
!!
!!
! ! !!!!!!
Plate 3-C

Excavation Percolation Testing Field Log Date _2/20/2011__
Project Location 900 S. Fremont Ave. Project Boring/Test Number Boring 2 / Test 1 Earth Description Alluvial Fan Diameter of Boring 6” Diameter of Casing 2”-4” Tested by YM Depth of Boring 6’ Liquid Description Clear Clean Tap Water Depth to Invert of BMP 5’ Measurement Method Sounder Depth to Water Table 30’
Depth to Initial Water Depth (d1) 12” Time Interval Standard Start Time for Pre-Soak 9:30am Water Remaining In Boring (Y/N) Yes Water in Boring Start Time for Standard 10:00am Standard Time Interval Between Readings 30min/10min
!"#$%&'()*+,"-(
.%+"(/0#-012&$(3445++6(
27#89"$(.%+"(:0%+"(3+%&96(
;#0"-(<-=8(<*-%&'(/0#&$#-$(.%+"(>&0"-?#7(:$((3%&@4"96(
A"-@=7#0%=&(!#0"(B=-(!"#$%&'((3%&14-6(
/=%7(<"9@-%80%=&1)=0"91C=++"&09((
!"#$%#&'!"!
!""$##&'!%#! %(##! )(##! *+,!+-!+./01,!2/341!56.78!
!""$##&'!9!
!""$%#&'!%#! 9(##! :(##!
;&1<6!6<=/22<>!<?<6@!%#!'/80!1.!'&/81&/8!/8/1/&2!7&1<6!><A14!
!""$%#&'!%!
!"9$##A'!%#! "(BC! %(##!
!!!!
!"9$##A'!:!
!"9$%#A'!%#! "(C#! %(C#!
!!!!
!"9$%#A'!C!
!"$##A'!%#! "(9C! 9(C#!
!!!!!
!"$##A'!)!
!"$%#A'!%#! "("#! 9(9#!
!!!!!
!9$##A'!B!
!9$%#A'!%#! "(##! 9(##!
*1&5/2/D<>!E&1<!FG4/<?<>!7/14!H>(E<&>/830!!),!B,!&8>!I!
!%$##A'!I!
!%$%#A'!%#! "(##! 9(##!
!!!!!
!!!
!!! ! !
!!!!!
!!!
!!! ! !
!!!!!
!!!
! ! !!!!!!
!!!
!!! ! !
!!!
!!!
! ! !!!!!!
!!!
!!! ! !
!!!!!
!!!
!!! ! !
!!!
!!!
! ! !!!!!!
Plate 3-D

Ground Surface
Plate 4a
Minimum 5-foot gravel pack
Slotted pipe to measure water level
Water elevation during test
Proposed invert of infiltration
Solid pipe for introduction of water
Large diameter boring
COUNTY OF LOS ANGELESDEPARTMENT OF PUBLIC WORKS
Geotechnical and Materials Engineering DivisionSAMPLE INFILTRATION BASINPERCOLATION TEST SETUP

Ground Surface
Plate 4b
Gravel pack
Slotted pipe to measure water level
Top of well (capping depth)Water elevation during test
Bottom of well
Solid pipe for introduction of water
Minimum 18-inch diameter boring
COUNTY OF LOS ANGELESDEPARTMENT OF PUBLIC WORKS
Geotechnical and Materials Engineering DivisionSAMPLE DRY WELL
PERCOLATION TEST SETUP

Appendix A
United States Bureau of Reclamation
Test Method 7300‐89

UNITED STATES DEPARTMENT OF THE INTERIORBUREAU OF RECLAMATION
P R O C E D U R E F O RUSBR 7300-89
PERFORMING FIELD PERMEABILITY TESTINGBY THE WELL PERMEAMETER METHOD
INTRODUCTION
This procedure is under the jurisdiction of the Geotechnical Services Branch, code D-3760, Research and Laboratory ServicesDivision, Denver Office, Denver, Colorado. The procedure is issued under the fixed designation USBR 7300. The number immediatelyfollowing the designation indicates the year of acceptance or the year of last revision.
1. Scope
1.1 This designation is used to determine the coefficientof permeability of semipervious and pervious soils. Thetypes of soil for which the test is applicable range frommixtures of sand, silt , and clay with coefficients ofpermeability greater than 1 X 10⁻⁵ cm/s to relatively cleansands or sandy gravels with coefficients of permeabilityless than 1 X 10-l cm/s. There is lack of experience withthe test in soils with coefficients of permeability outsidethese limits. The effects of capillarity on permeability testresults were not taken into account during developmentof the theoretical background.
NOTE l.-This test is similar to the “Shallow Well Pump-inTest for Hydraulic Conductivity” in the Drainage Manual [l].’However, some of the float valves allow greater waterflow fromthe water reservoir than the carburetor valve of the DrainageManual t e s t .
2. Auxiliary Tests
2.1 Soil sampling by USBR 7010 and classificationofsoil from different strata by USBR 5005 are required toidentify soil stratification and location of any water table.
3. Applicable Documents
3.1 USBR Procedures:USBR 3900 Standard Definitions of Terms and SymbolsRelating to Soil MechanicsUSBR 5005 Determining Unified Soil Classification(Visual Method)USBR 7010 Performing Disturbed Soil Sampling UsingAuger Boring Method
3.2 ASTM Standard:E 1 ASTM Thermometers
4. Summary of Method
4.1 The method consists of measuring the rate at whichwater flows out of an uncased well under a constant gravity
I N u m b e r i n b r a c k e t s r e f e r s t o t h e r e f e r e n c e .
head. The coefficient of permeability of the soil is calculatedusing (1) the relatively constant flow rate which is reachedafter a period of time, (2) the water temperature, (3) theconstant height of water in the well, and (4) the radiusof the well.
5. Significance and Use
5.1 The method is used to determine the averagecoefficient of permeability for soil in its natural condition,primarily along proposed canal alignments or at reservoirsites. The permeability results are used in appropriateequations for calculating approximate seepage rates to aidin decisions on lining requirements. Although the test isusually performed in auger holes, it can also be used intest pits.
6. Terminology
6.1 Definitions are in accordance with USBR 3900.
7. Interferences
7.1 Proper use of the test requires soil characteristicswhich allow excavation of an uncased well of reasonablyuniform dimensions with the soil sufficiently undisturbedto allow unrestricted outward flow of water from the hole.
7.2 Test results are adversely affected by using uncleanwater for the permeant.
7.3 When relatively impervious or highly pervious soillayers are present around the well, this should be consideredwhen evaluating test results.
7.4 For tests during cold weather, a shelter with heatshould be used to maintain ground and water temperaturesabove freezing.
8. Apparatus
8.1 General Apparatus:8.1.1 Augers.-Hand augers suitable for excavating
permeability test holes. Power-driven augers may be usedif it is determined that disturbance of soil around the wellis no more than for a hand auger.
1227

USBR7300
Srass weight t a p p e d f o rf - 2 0 t h r e a d s p e r Inch
‘0r?2t’ f
C O U N T E R W E I G H TBRASS - / REaUlREO
=,I
) Threads,5+” p e r Inch1 1
r- Cover
Galv ttn strtp b r a z e dt o d r u m - - -
/
‘-An i m p a c t resistanttransparent plasticlubing s u c h 0s ce l lu loseocelale bulyrale, fr’O.0
i
2 0 0 - L Reservoir(or equivalent,
I, no1 l o scale)
AdJustable brass blockset screw and chain
No 2/o Brass, nickelplated safety choln
String-
Slake-
-t”Galv iron waste-nut brazed to drum $“.Male compressvan
llttlng
I
-9-20 ThreadsF,l
per inchi
- 2 - f ’ Nuts a n dwashers
F L O A T R O DI ASSEMBLY REOUIRED
SCALE OF INCHES
Plastic disk
-Coupling
-To b eattachedwith tape
-Schedule 40PVC pipe
GALV. IRONFLOAT GUIDE
I REOUIRED
P V C F L O A TGUIDE
28 Gauge golv.iron tubing
Float may b e of n o n c o r r o s i v emetal lprelerablel, p l a s t i cor redwoodfdipped in op r e s e r v a t i v e o f walerproofing).
,
Figure 1 . - Drawing of well permeameter test apparatus (101-D-38)
1228

USBR 7300
8.1.2 Thermometer.-0 to 50 “C, 0.5 “C divisions,conforming to the requirements of ASTM E 1.
8.1.3 Hammer, surveyors’ stakes, and string fordepth measurements in the well.
8 . 2 Equipment Unique to This Procedure (see figs. 1and 2).
8.2.1 Water Reservoir.-A clean, covered, watertightreservoir of sufficient capacity which can be convenientlyrefilled at intervals to provide a continuous supply of waterduring the test. A 200.liter drum with a volume gaugetube of cellulose acetate butyrate has been found to besuitable for normal usage. Wooden blocking is requiredto raise the reservoir above the ground level.
8.2.2 K&e.-A float valve with operating arm (seefig. 3 for valve size).
8.2.3 Float.-A wooden, plastic, or metal float withbrass stem.
8.2.4 Float Guide.-A guide of galvanized iron, PVC(polyvinyl chloride) or other materials to allow the floatto move vertically.
8.2.5 Counterwe&hts.-Brass counterweights for armof float valve.
Figure 2. - Typical well permeameter test set-up.
Figure 3. - Maximum permeability coefficients measurable with typicalfloat valves commonly used on stock-watering tanks.
NOTE 2.-There may be other appropriate valve-float equip-ment available for maintaining a constant water level in thetest well.
8.2.6 Water Truck.-A water tank truck or tank trailerof sufficient capacity to provide a continuous supply ofclean water for the number of test reservoirs insimultaneous use.
9. Reagents and Materials
9.1 Density San&Clean, dry, pervious, coarse sand (orfine gravel) calibrated for density and with a coefficientof permeability at least 1 X lo2 cm/s greater than thatof the soil to be tested is to be used for backfilling thetest well. A washed sand graded between the U.S.A.Standard series No. 4 to No. 8 sizes (4.75 to 2.36 mm)or grave1 graded between the 3/8 to No. 4 (9.5 to 4.75mm) sizes is recommended. The purpose of the perviousbackfill is to (1) distribute water evenly in the well, (2)support the wall of the well and prevent sloughing duringsaturation of the soil, and (3) provide a means of indirectlydetermining the average radius of the well. The radiusof the well is required for permeability calculations and,as explained later, a standard sand calibrated for mass perunit volume (density) can serve this purpose.
9 . 2 Water.-The water for this test is to be clean. Smallamounts of suspended soil or other foreign material inthe water may become deposited in the soil around thewell and may greatly reduce the flow, causing erroneousresults. When there is sediment in the water, arrangementshould be made to remove the particles by settling orfiltration. In some instances, a chemical reaction can takeplace between water of a particular quality and the soilbeing tested, which may cause an increase or decrease insoil permeability. Therefore, water similar in quality(exclusive of suspended sediment) to that expected topermeate the soil during project operation should be usedfor the permeability test.
10. Precautions
10.1 SafetyPrecautions.- Norma1 precautions taken forany fieldwork.
10.2 Technical Pre’cautions:10.2.1 In windy areas, protection from blowing soil
may be needed to prevent interference to the operationof the valve-float mechanism and to prevent infiltrationof soil into the top of the well.
10.2.2 Test equipment must be protected fromdisturbance by animals, moving equipment, children, orother sources.
11. Calibration
11.1 Water Reservoir (fig. I).-Calibrate the volumeof the water reservoir and mark the gauge tube inconvenient increments for volume readings. For a 200-Lreservoir, mark the volume gauge tube at 5-L intervalswith the largest volume reading near the top of the tube
1227

so volume readings will decrease downward and permitvolume determination by subtracting figures.
NOTE 3.-For a volume tube of cellulose acetate butyrate (whichis recommended because it is durable for use under fieldconditions), ink with an acetate base makes a permanent markon the tube. India ink can be used for marking if the surfaceof the plastic is first roughened with emery cloth or steel wool;the tube then should be coated with clear lacquer to preservethe ink marks.
11.2 Density San&Calibrate the sand by finding thedensity obtained by pouring the sand into a pipe or cylinderwith dimensions approximately those of the test well. Thepouring height above the top of the pipe should beapproximately the same as that for the well. The calibrateddensity of sand is calculated from the mass of sand usedto fill the pipe and the volume of pipe occupied by thesand; i.e., density equals mass per volume.
12. Conditioning
12.1 Special conditioning requirements are not neededfor this procedure.
13. Procedure
13.1 Soil Logs.-Prior to performing field permeabilitytests for a seepage investigation, exploratory borings shouldbe made at appropriate intervals and logs of the boringsshould be prepared to show a representative soil profile.Soil classifications of the different strata encountered shouldbe recorded. The form shown in figure 4 can be used forthis purpose.
The minimum depth of borings below a proposed canalinvert or reservoir bottom should be to the ground-watertable, to an impervious soil layer, or to a depth about twicethe design water depth, whichever is reached first (seefig. 8). The location of soil layers that appear to beimpervious and the depth to a water table, if reached, willaffect permeability and seepage calculations. For depthsbelow a canal invert or reservoir bottom greater than twicethe water depth, the presence of a water table or soil layersof significantly different permeability than that of overlyingsoil will not influence permeability test results.
13.2 Size of Test We&For a low water table condition(see condition I, fig. 8), the depth of the well may beof any desired dimension provided the ratio of water heighth in the well to well radius is greater than 1. To fulfilltheoretical considerations in development of the equationsfor high water table conditions (conditions II and III, fig. 8),the ratio of water height h in the well to well radius shouldbe greater than 10. A practical well diameter is usually150 mm. Normally, in a canal seepage investigation, thewater surface elevation in the well and the well bottomshould correspond to the elevations of the proposed canalwater surface and canal bottom, respectively. Test resultswould then provide an average permeability for the soilsin the canal prism. For pervious soils, well size is limited
USBR 7300
by the capacity of the equipment to maintain a continuoussupply of water at the desired constant head level. Ifnecessary, more than one reservoir can be interconnectedto increase water capacity. Figure 3 shows the maximumcoefficients of permeability that can be measured in wellsof various diameters using float valves of different sizes.This is of assistance in selecting the valve size to be used,although a valve of approximately 20.mm size is oftenused for general purposes.
13.3 Soil Permeability in Test Pits.-The well per-meameter test method also can be adapted for use in testpits in a low water table condition if the ratio of waterdepth to pit radius is greater than 1, and sand or gravelbackfill is used to prevent soil in the sides of the pit fromsloughing. In this case, calibration of backfill is not necessarysince dimensions of a test pit of regular shape can be foundby averaging linear measurements. If a rectangular pit isused, the effective cylindrical radius for use in permeabilitycalculations can be determined from the pit dimensions(see fig. 5).
13.4 Excavation of the Test We&Wells for permea-bility tests should be prepared carefully to cause as littledisturbance to surrounding soil as possible. Where moisturecontent of the soil is high, the wall of the hole can becomesmeared and outward flow of water restricted. In this case,the well should be excavated using two hand augers, onehaving a diameter at least 25 mm smaller than the other.First, auger a pilot hole with the smaller auger and followthis with the larger auger. This causes less disturbanceto the wall of the well than if a single auger is used. Ifit is still apparent that the wall of the well is smeared,the walls should be scraped or scratched with improvisedtools to remove the smeared surface. Remove any loosesoil from the bottom of the well.
13.5 Depth of the Well (figs. 1 and 4).-Depthmeasurements in the well should be measured (andrecorded) from a common base line. A convenient methodis to measure from a horizontal string line stretchedbetween two stakes driven firmly into the ground onopposite sides of the well (fig. 1). When the bottom ofthe well extends below ground-water level, insert a casingduring excavation to prevent the wall from caving. Carefullypull the casing as the well is backfilled with sand throughthe casing.
NCTE 4.-For a very high ground-water condition, a “pumpout” test for saturated soils is often more satisfactory than thewell permeameter test or other “‘pump in” types of tests.
13.6 Backfilling the Test Well.-Pour calibrated sandinto the well in the same manner as during calibrationof the sand for density. The top of the sand should beabout 150 mm below the water level to be maintained.After completion of pouring, determine the remainingmass of sand and subtract from the original mass to findthe mass of sand in the well. Measure and record the depthto the top of the sand and calculate the height of sandin the well. From the density of the calibrated sand andthe mass and height of sand in the well, calculate the
1230

USBR7300
WELL PERMEAMETER METHOD7- 1429 (5-89)3ureau of Reclamation (SOIL CLASSIFICATIONS AND WELL DIMENSIONS) Des,gnatm U S B R 7 3 0 0 - *’
EST ra. 22PROJECT FEATURE
Example Example
EST LOCATIONTEST LIMITS:
STATION TO STATIONStation 257+94 257+25 258+62
ROLM E L E V A T I O N SIDE SLOPES B O T T O M W I D T H122.6 CANAL DATA:
WATER DEPTH
21 I 7 . 9 m I .890 m
ESTED BY DATE COMPUTED BY DATE CHECKED BY DATE
Iam Oft
STRATA DEPTHFROM T O
0 0 .45~ ___
0 4 5A I 77L
~ ~I 77b 3 8 7L~ ~
O B S E R V A T I O N H O L E
S O I L CLASSIFICATIW
SILTY CLAY r approx. 85% fines with medium plasticity,slow dilatancv, medium drv strenath, medium touahness;opprox. 15% fine sand; maximum size, fine sand, moist,dark gray; easy to auqer; some roots present; noreaction with HCI (CL-ML).
CLAYEY SILT 1 approx. 95% fines with low plasticity,-slow dilalancy, low dry strenqfh, low toughness;
approx. 5% fine sand; maximum size, fine sand; wet,brown; easy to auqer; no reaction with HCI (ML-CL).
S I L T Y SAND’ approx . 60% f ine to coarse , hard ,angular sand; approx. 20% non-plastic fines; approx.20% predominantly fine, hard, anqular lo subanqular
~ ___ qravel; maximum size, 30mm; moist, brown; moderatelyhard to auger; sliqht reaction to HCI (SM).
(1) DEPTH TO WATER TABLE (FROM GROUND SURFACE) 3.75 m m q ftW E L L DlMENSlONS ( D E P T H S F R O M S T R I N G B A S E L I N E )
(2) 0.213 q m q ft
(3) 1.222 q m q ft
(4) SAND 0 . 3 7 5 m m q ft_ _ _(5) (3) - (4) 0 . 8 4 7 m m q ft_ _ --6) D E P T H T O W A T E R S U R F A C E I N W E L L 0 . 2 8 0 m m q ft_.
(7) HEIGHT OF WATER IN WELL h = (3) - 6) 0.942 q m q ftD E T E R M I N A T I O N O F W E L L R A D I U S
(8) DENSITY OF STANDARD SAND I 4 0 0_ _ q kg/m3 [7 lbmlft 3
(9) M A S S O F S A N D + C O N T A I N E R B E F O R E F I L L I N G W E L L 3 4 . 0 2 q kg q Itfm
(IO) MASS OF SAM3 + C O N T A I N E R A F T E R F I L L I N G W E L L 2 . 8 6 q kg cl h
(11) (9) - (IO) 3 1 . 1 6 q kg q 1kfl-l
(12) (I l)/(8) 0.0223 q m3 0 tt3
(13) r = ,/(12)/o 0 . 0 9 2 ITl]m q ft__ _.
Figure 4. - Well permeameter method (soil classifications and well dimensions) - example
1 2 3 1

USBR 7300
b7
H O R I Z O N T A L S E C T I O NTHRU T E S T P I T
Figure 5. - Effective cylindrical radius of rectangular test pits.(fig. 44 of ref. 2)
equivalent radius of the well (fig. 4). Development of theequation for determining the radius is:
v, = j-r r,” h, = m,PS
2-Arw - n-h,
(1)where:
V. = volume of sandps = density of sandh, = height of sandm = mass of sandrw = equivalent radius of well
1 3 . 7 Test Equipment Set Up.-Place the float guide,with the float inside, on top of the sand in the well. Holdthe float guide in place vertically and pour sand aroundit. When a test is to be conducted with the water levelmore than an arm’s length below the ground surface, lowerthe float guide by the chain and drop sand around theguide to hold it in place during the test. The rubber slip
washer on the float stem is to prevent particles of sandfrom becoming lodged between the float stem and thefloat guide. The mass of sand around the guide need notbe known because it is not used in computations for wellradius. Set up the water reservoir and valve-floatarrangement with the flexible tube from the float valveto well and the chain attached to the float stem as shownon figures 1 and 2. The reservoir should be set on a firmplatform or cribbing at a convenient height.
13.8 Performing the Test:13.8.1 Open the valve on the reservoir and gradually
fill the well with water.13.8.2 After the water enters the float casing,
readjust the counterbalance on the operating arm of thevalve and the chain length as necessary to maintain thedesired water level in the well.
13.8.3 After the water level in the well has stabilized,begin reading the volume gauge on the reservoir and recordthe gauge readings at convenient time intervals using theform as shown on figure 6. The well must be keptcontinuously full of water until the test is completed. Ingeneral, dry soil at the start of the test absorbs water ata comparatively high rate. However, as the moisturecontent of the soil increases around the well, the rategenerally decreases and usually stabilizes. It is this constantrate after stabilization that is used to compute permeability.
13.8.4 As records of water discharge from thereservoir and time are made, plot a curve of accumulativeflow versus time as shown on figure 7.
14. Test Duration
14.1 Minimum duration for the test is the theoreticaltime required to discharge the minimim volume of waterinto the soil to form a saturated envelope of hemisphericalshape with a radius B (see fig. 1).
The minimum volume of water is determined by theequation:
(2)
where: I&in = minimum volume
S = specific yield of the soilh = height of water in wellr = well radius
NOTE 5.-The quantity in brackets is the theoreticaldetermination for radius B (fig. 1).
For soils in which this test would most likely be used,the specific yield varies from about 0.1 for fine-grainedsoils to 0.35 for coarse-grained soils. When the specificyield of the soil is unknown, the value of 0.35 should beused to give a conservative value for minimum volumeand to ensure that the test duration is sufficient. Thus,
1232

USBR 7300
TEMPERATURE
8150 5 0 127 7 4 124 8 0 154 154 19 2 5
9 ’ 4 0 100 8 0 4 7 7 4 5 0 9 7 251 19 - -
10’30 150 4 2 3 6 3 4 4 0 7 6 3 2 9 19 - -
I I’20 200 8 3 4 I 3 3 6 7 3 9 6 2 0 2 6
II’30 2 1 0 2 0 2 - - 201 - - _- - - - - - - -
12, IO 2 5 0 179 2 3 179 2 2 4 5 441 2 0 - -
13:oo 3 0 0 153 2 6 I53 2 6 5 2 4 9 3 21 - -
13’50 3 5 0 I24 2 9 125 2 8 5 7 5 5 0 21 2 7I 1 I I I I I I I
14’40 4 0 0 9 7 2 7 9 8 2 7 5 4 6 0 4 2 2 - -
1 5 ’ 3 0 4 5 0 71 2 6 7 0 2 8 5 4 6 5 8 2 2 - -I I I I , I
16120 500 4 6 2 5 4 4 2 6 51 7 0 9 21 - -
I I I I I I I I I171 IO 5 5 0 19 2 7 19 2 5 5 2 761 2 0 - -
I I I I I /
17120 5 6 0 2 0 4 - - 2 0 2 __ - - - - - - - - -
18~00 6 0 0 I81 2 3 I81 21 4 4 8 0 5 2 0 2 7/ I I I
18'50 6 5 0 154 2 7 154 2 7 5 4 8 5 9 2 0 - -
1 9 ’ 4 0 7 0 0 127 2 7 127 2 7 5 4 9 1 3 I9 - -
2 0 ’ 3 0 7 5 0 100 2 7 9 9 26 5 5 9 6 0 19 -..I I I I I
2 1 ’ 2 0 600 7 4 2 6 7 3 2 6 5 2 I020 I8 2 5
I I I I I I I I I23100 9 0 0 3 5 3 9 3 3 4 0 7 9 I099 I7 - -
I I I I I I I I I2 4 ’ 4 0 IO00 5 3 0 3 3 0 6 0 I I59 I5 - -
Figure 6. - Well permeameter method (time and volume measurements) - example.
1233

USBR 7300
Figure 7. - Time-discharge curve for well permeameter test - lowwater table example.
with a known or assumed specific yield for the soil andwith the dimensions of the well, the minimum volumecan be computed and the test discontinued when theminimum volume has been discharged through the well.In pervious soils, it may appear that the volume-time curvehas reached a uniform slope after several hours when pointsare plotted over short time intervals. However, in orderto avoid discontinuing a test prematurely, it must becontinued for at least 6 hours from the starting time sothe slope can be determined over a period of 2 to 3 hours.The first straight portion of the curve should be used fordetermining the rate of discharge (fig. 7). The test mustbe conducted continuously without allowing the reservoirto run dry until the test has been completed.
14.2 Maximum Time.-If the test is continued for along period, a water mound may build up around the welland render the test results inaccurate. The maximum timefor test duration is the time necessary to discharge throughthe test well the maximum volume of water as determinedusing equation (2), substituting 15.0 for 2.09 and in thiscase, using an assumed minimum value (when the truevalue is unknown) of 0.1 for specific yield.
Vmax = 2.05 Vmin (3)
15. Calculations
15.1 Computing Coefficient of Permeability.-Equa-tions (4), (5), or (6) are provided for calculating coefficientof permeability, for the well permeameter test. Thepresence or absence of a water table or impervious soillayer within a distance of less than three times that ofthe water depth in the well (measured from the watersurface) will enable the water table to be classified ascondition I, II, or III, as illustrated on figure 8.
15.1.1 Low Wafer Table.-When the distance fromthe water surface in the test well to the ground-water table,or to an impervious soil layer which is considered for testpurposes to be equivalent to a water table, is greater thanthree times the depth of water in the well, a low water
table condition exists as illustrated by condition I (fig. 8).For determination of the coefficient of permeability undersuch a condition, equation (4) given in subparagraph 15.2should be used.
15.1.2 High Water Table.-When the distance fromthe water surface in the test well to the ground-water table,or to an impervious layer, is less than three times thedepth of water in the well, a high water table conditionexists as illustrated by condition II or III. Condition II showsa high water table with the water table below the wellbottom, and for this condition equation (5) should be used.Condition III shows a high water table with the watertable above the well bottom. For this condition, equation(6) should be used.
15.2 Equations:
Condition I:
k
-r
Condition II:
ho = -!dL2rrh2
Condition III:
(4)
(5)
&Jo = -!fc2.rrh2
I
(6)
where:kzo = coefficient of permeability at 20 “C
h = height of water in the wellr = radius of welly = discharge rate of water from the well for steady-
state condition (determined experimentally,see example, fig. 7)
v = pz viscosity of water at temp. T (see fig. 9)pzo, viscosity of water at 20 “C
T, = unsaturated distance between the water surfacein the well and the water table
15.3 The preferred metric unit for coefficient ofpermeability is cm/s (centimeters per second). The valueof 1 X lo-” centimeters per second is approximately thesame as the inch-pound unit of 1 foot per year.
1234

USBR7300
I& sur-\ ~
>Wo+er surface in well1,
Ii
Ii = Height of water int e s t w e l l ( f t . )
.a-
+r = Effective radiusof we l l ( f t )
Woter table
Water tablkimpervious layer
h
Tu = Unsaturated strata C O N D I T I O N II: CONDITION IIIhIT,53h T, < h
Water table or impervious
C O N D I T I O N I
Note : For condition I h/r can be a minimumof I. For conditions II and III,h/r should be greater than IO r.
T, > 3 h
Figure 8. Relatimd~ip between depth of water in test well and distance to wafer table in well pertneameter test.
16. Report
1 6 . 1 The report is to consist of the following completedand checked forms:
“Well Permeameter Method (Soil Classifications andWell Dimensions)” (fig. 4).“Well Permeameter Method (Time and VolumeMeasurements)” (fig. 6).Time-Discharge Curve (example on fig. 7).Calculation of coefficient of permeability from equations(4), (5), or (6).1 6 . 2 All calculations are to show a checkmark and all
plotting must be checked.
17. References
111 Drainage Manual, 1st ed., Bureau of Reclamation, U.S.Government Printing Office, Washington, D.C., 1984.
[2] Zanger, Carl Z., Theory and Problems of WaterPercolation, Engineering Monograph No. 8, (app. B “Flowfrom a Test Hole Located Above Groundwater Level,”development by R. E. Glover) Bureau of Reclamation,Denver, Colorado, April 1953.
[3] Ribbens, R. W. “Exact Solution for Flow From a TestHole Located Above the Water Table,” (unpublishedtechnical memorandum), Bureau of Reclamation, Denver,Colorado, 1981.
1 2 3 5

USBR 7300
IiWiiiiiiiiiiiiiililliiii
0Faaz
z ’>0FaIii2
I
.2
I .,I I I I I I II I I 1 I I I
T E M P E R A T U R E I N D E G R E E S C E N T I G R A D E , T
1236