aditya birla group -overview - ultratech cement cement...a leading player in life insurance and...
TRANSCRIPT

INDIA'S LARGEST CEMENT
COMPANY
CORPORATE PRESENTATION
APRIL’2015
Stock code: BSE: 532538 NSE: ULTRACEMCO Reuters: UTCL.NS Bloomberg: UTCEM IS / UTCEM LX

Contents
2
ADITYA BIRLAGROUP-OVERVIEW
ECONOMIC ENVIRONENT
INDIAN CEMENT SECTOR
Note 1: The financial figures in this presentation have been rounded off to the nearest ` 1 cr Note 2 : USD:INR = 62.50
GLOSSARY
Mnt – Million Metric tons Lmt – Lakhs Metric tons mtpa – Million Tons Per Annum Q3 – October-December Q4 – January-March LY – Corresponding Period last Year FY – Financial Year (April-March) ROCE – Return on Average Capital Employed NROCE – Net Return on Average Capital Employed MW – Mega Watts ICU – Integrated Unit GU – Grinding Unit
OPERATIONAL AND FINANCIALPERFORMANCE
ULTRATECH LANDSCAPE
ADITYA BIRLA GROUP - OVERVIEW

A global metal powerhouse – 3rd biggest producers of primary aluminum in Asia.No. 1 in viscose staple fibre in the world.No. 1 in carbon black in the world. Amongst the top global cement players.Globally 4th largest producer of insulators and acrylic fibre.Positioning in India:
Largest capacity in cement.Top fashion and lifestyle player.2nd largest player in viscose filament yarn.Among the top 3 mobile telephone companies.A leading player in life insurance and asset management.
Among the top 2 supermarket chains in retail.
US$ ~40 billion CorporationIn the League of Fortune 500Operating in 36 countries with over 50% Group revenues from overseasAnchored by about 120000 employees from 42 nationalitiesRanked 4th in global top companies for leaders and 1st in Asia Pacific
(Source: Aon Hewitt, Fortune & RBL - 2011)
Aditya Birla GroupPremium global conglomerate
4
Our Values Integrity Commitment Passion Seamlessness Speed

UltraTech CementIndia’s largest cement company
5
India’s Largest Cement Selling Brand
No. 1 RMC player in India with about 100
plants
Different Products to provide complete Building Solutions
No.1 Player of White Cement & Cement
based Putty
Market Cap of ~US$ 13 Bn
FY15 Consolidated Revenue ~US$ 4.0 Bn
About 1,000 million bags are sold
> 42,000 Direct & Indirect Employment

UltraTech Journey
6
Acquisition ofL&T Cement
Business
- Focus on Cost Leadership between 2005-2009
- Synergy of Cement Business of ABG under one roof;
- Investments in TPPs –80% power self-sufficient
- Organic Capacity
addition:15 mtpa
- Group Cement business
under one roof
- Became India’s Largest
Cement Company
- Acquisition of Star
Cement: 3 MTPA
- Acquisition in progress: 4.9 MTPA
- Acquisition completed:
4.8 MTPA
- Commissioned brownfield projects - 6.6 MTPA
- Capacity under commissioning: 6.7 MTPA2004
Mkt Cap –US$ :1 Bn
2008Mkt Cap –US$ :2 Bn
2011Mkt Cap –US$ :7 Bn
Current Mkt Cap –US$:13‐14 Bn
UTCLInception
Reaching greater heights

Governance
7
Non-Executive Chairman
Independent Directors
Executive / Non- Executive Directors
Mr. K M Birla
Board of Directors
Mr. R C Bhargava Mrs. Rajashree Birla
Mr. S Rajgopal Mr. O P Puranmalka - MD
Mr. G M Dave Mr. Dilip Gaur - DMD
Mr. S B Mathur Mr. Rajiv Dube
Mr. Arun Adhikari Mr. Adesh Gupta
Mrs. Renuka Ramnath Mr. D D Rathi
Mrs. Sukanya Kripalu

Governance (contd..)
8
UltraTech is committed to create value for all its stakeholders
PLANNING
COMPLIANCE
INTEGRITY
OPERATIONS
STRONG PROCESS
TALENT
REPORTING
STRATEGY
RISK GOVERNANCE
STRONG GOVERNANCE
Audit Committee: All members - Independent Directors Nomination & Remuneration: Majority members – Independent DirectorsStakeholders Committee: Majority members – Independent DirectorsFinance Committee: Majority members – Independent DirectorsRisk Management Committee: Non-independent DirectorsCSR Committee: Majority Non-independent Directors

Economic Environment

Macro Indicators … taking towards good growth cycle
10
Government- Continuous Focus on improving business sentiments
GST from 01.04.16 - simplification of tax structuresRelaxation in FDI policies, GAAR prospective from 2017“Make In India” “Skill India” and “Digital India” a boost to GDP
Improving Macro Indicators
GDP estimated @ 7.4% v/s 6.9% for last yearIMF forecast – India GDP to grow higher than ChinaIIP @ 2.8% v/s No growth in last yearInflation under control - Interest rate correctionFiscal Deficit targeted at 4.1% of GDP

Indian Cement Sector

12
Indian cement industryOverview
Second largest market Globally with capacity of ~ 390 mtpa after China (~ 2400 MTPA).
2nd fastest-growing cement market globally: Compounded Average Growth: 8% (Last decade)
GLOBAL CEMENT CONSUMPTION
8%6%
3%
5%
9%
5%
4%5%
55%
India
Middle East
Africa
C&E Europe
Western Europe
South & Central America
North America
S Asia & Australia
China
Source: Cement Consumption US, GS Jan 13 ; Population IMF *2010
Market Composition:North - 35%, East - 15%, West - 14%, South - 36%

Indian cement industryOverview (contd…)
13
Consolidation in industry at regular intervals
Entry of new players (non-cement)
PER CAPITA CEMENT COSNUMPTION (KG)
1580
800720
520450
350250 195
ChinaTurkey
VietnamWorld
JapanBrazilUSA
India
Source: Cement Consumption US, GS Jan 13 ; Population IMF *2010
Fragmented Market:No of plants ~ 165, owned by ~ 50 playersTop 6 players holds ~ 50% of capacity
Per Capita Cement Consumption at 195 kg lowest among the developing countries; World average ~ 520 Kg

Indian cement industryGDP growth v/s cement demand growth
14
Cement volume growth has been weak in past 3-4 years, led by a slowdown in infra, commercial and housing
However, …sustained cement consumption growth ~ 8% in last 14 years (2001 onwards)
Demand likely to reach it’s normal level with improved focus on infrastructure and housing
Long-term average cement demand growth: 1.2x of GDP

Indian cement industryDemand-supply trend
15
Source: Company estimates & DIPP data.
In % FY08 FY09 FY10 FY11 FY12 FY13 FY14 FY15E
Growth 9.8 8.5 12.1 5.7 7.1 5.2 2.6% 3.3%
FY08 FY09 FY10 FY11 FY12 FY13 FY14 FY15E
198216
276304 319
353 364390
164 178203 214 229 241 247 256
Cament Capacity Cement Demant
In MnT
Around 70 million tonnes capacity added in last 3 years
Though demand remained low in last 3 years
Surplus capacity in the sector c 120 million tonnes
Industry capacity doubled in last decade
Demand – supply balance to improve gradually in next 3 years with slower pace of capacity addition and likely improvement in demand

Demand growth drivers
16
Source: 1.Mckinsey Urbanisation Report 2.Working Group Report, Govt. of India m 3. Consultation paper , Planning Commission of India
Rapid Urbanisation (28.7% in 2005 to 40% in 2030)Number of Cities(population of 1Mn.+) to grow from 33(2005) to 68(2030)Five year plan, housing requirement of 74 Million unitsRural demand rising, additional boost from urban housing on softening of interest rates
Strong demand from IT / ITES, historically south – like Chennai, Bangalore & HyderabadEmerging Growth from Resource Based Industries from Eastern India Likely large corporate capex driven by higher Infrastructure spending and future potential growth
Infrastructure investment of USD 1 Trillion the XIIth Plan(GOI) periodInvestment projected across sectors with power, roads, railways, irrigation and telecom constituting the major component Recent renewed focus of new govt. on infrastructure – E.g. New state formation like Telangana
Housing (~60- ~65%)
Commercial & Industrial Investments (~20%)
Infrastructure ( ~15-20%)

Sector guidance
17
Demand to improve with government focusing on investment & infrastructure revival and various reforms:
New Government plan by 2022 –
Housing for all: 200 ml Houses for urban areas and 400 ml in Rural areas
24*7 power, clean drinking water, a toilet and road connectivity – for every one
Electrification of remaining 20000 villages
Roads (concrete) - another 1,00,000 kms in addition to 1,00,000 kms road which is already in process
Western and Eastern dedicated freight corridor (~$ 13 bln)
100 smart cities ( ~ $ 1.1 bln)
Swatchh Bharat Mission – government intent to construct 110 mln toilets in next 5 years (~ $ 32 bln)
Metro rail project coming up in tier-II cities like Lucknow, Kochi, Jaipur, Ahmedabad, Chandigarh, Nagpur, Kanpur, Patna, Surat and Pune (~ $ 17Bn)
5 new Mega Power Projects each of 4000 MW in the Plug-and-Play mode ( ~ $ 16 bln)
Target of 175,000 MW renewable energy by 2022.
30% higher allocation for Infrastructure ( ~$ 48 bln)
Industry to witness strong demand growth ahead …in line with average historical multiple of GDP

Sector guidance … (contd…)
18
Capacity addition pace slowing down…. Leading towards improvement in utilization
Expected capacity addition: FY16 – FY18 ~ 40 million tonnes Incremental demand: FY16- FY18 ~ 60 million tonnes
Setting up new Cement Capacity becoming more challenging due to :
Tougher land acquisition process High capital cost Increased gestation period Regulatory clearances Availability of new limestone mines
Surplus capacity to reduce around 100 million tones by FY18, with south region continue to having 50% share in surplus capacity

UltraTech Landscape

UltraTech - A snapshot
20
Particulars UOM Mar,15
Capacity
Grey Cement - Domestic Mtpa 60.2
- Overseas Mtpa 3.0
White Cement Mtpa 0.6
Wall Care Putty Mtpa 0.8
RMC Mn. Cub. Mtr 12.3
Captive Power Plants In MW 717
WHRS + Wind Mill + Solar In MW 37
Plants & Terminals
Grey Cement (Composite Plant) Nos. 12
Clinkerisation Plant (Overseas) Nos. 1
Grinding Units (Overseas- 4) Nos. 16
White Cement & Putty Nos. 2
RMC Plants Nos. 98
Bulk Terminals Nos. 6
GrowthDomestic Capacity increased by 10 fold since FY98 to 60.2 Mtpa. Total Capacity 63.2 Mtpa
Proven Capabilities to Grow Organically 35 Mtpaand Inorganically 25 Mtpa.
Market Leadership“UltraTech” -Premium national brand
Leadership in key consuming markets
Strong nationwide distribution network
Cost Leadership Large Size kiln – Economy of scale
Latest Technology Plant
80% Power Self Sufficiency thru CPP
Hub and Spoke Model through Split GUs/ Terminals near market & Efficient Logistics

UltraTech Footprint A Pan India Player
21
12 Integrated Units
12 Grinding Units
2 White Cement & Putty Units
5 Jetties
2 ICU Under Acquisition
4 GU In-Progress
RDCW
ARCW
Cochin
APCW
Hyderabad
Mangalore
GICW
Bangalore
RC
RTN
Mum
Hotgi
ACW
MGDGCW, JFD
VC
AC
KCW
PanipatBhatinda
JCW
WBCW
Bulk TerminalGrinding UnitIntegrated Unit
Under progress
Dankuni
RawanHCW
Patliputra
Dadri
Wanakbori
Aligarh
Jhajjar
Sewagram
AC3
Nagpur
Under acquisition
Sidhi
Bela
BW
BW
White Cement & Putty UnitsJetty
Zones Zonal Capacity (mtpa)
Current Capacity Share By 2016* Capacity
Share
North 16.8 28% 24.6 35%
East 8.2 14% 11.4 16%
West 19.8 33% 19.8 28%
South 15.5 25% 15.5 22%
All India 60.2 100% 71.2 100%
Overseas 3.0 3.6
Total 63.2 74.8
*ADDITIONS: Aditya Cement – 2.9, Pataliputra – 1.6,
DANKUNI 1.6 Acquisition (Bela + Sidhi) – 4.9

Operational and Financial Performance

Macro and Sector HighlightsQ4 2014-15
23
Macro Environment
Macro Environment
Sector Performance
Sector Performance
Strong GDP growth nos. for first nine months: 7.4% (new data series)
Though …. manufacturing growth still remain below normal level:
Industrial Production (IIP) till Feb’15 : 2.8% (Nil in LY)
Interest rate cuts
Commodity prices continue to remain soft
Muted Cement Demand in Q4 Low infrastructure spending and subdued housing demand continuously
affecting the industry
Improved volumes over Q3
Sector capacity utilisation for the quarter estimated c 67% Annual demand c 255-260 million tonnes v/s capacity: around 390 mtpa….
resulted into surplus capacity of c 120 mtpa

Commissioned …. 6000 TPD Clinkerisation line at Aditya Cement, Rajasthan
WHRS: 10 MW at Aditya Cement, Rajasthan and 6 MW at Rajashree Cement, Karnataka
Benefits to accrue from FY16 onwards
Awarded Bicharpur Coal mines in Madhya Pradesh under coal block auction process Total Reserve: c29 million tonnes
Started process of taking possession of the mines
Rajasthan High Court order in favour of the Company for taking back possession of it’s Gotan Limestone mines
Allotted land by Mumbai Port Trust for setting-up cement terminal
Increased petcoke consumption to 64% (excluding acquired plants 70%)
Key milestones Q4 2014-15
24

Key highlights FY 2014-15
Company’s cement capacity in India expanded to 60.2 mtpa Completed acquisition of Gujarat Units – 4.8 mtpa Commissioned remaining cement capacity of Rajashree IV – 1.4 mtpa
Thermal Power Plant capacity augmented to 717 MW, WHRS to 33 MW and Solar & Wind Mill 4 MW
Completed Brand transition for acquired Gujarat plants Other integration and operational efficiency programme moving on as per target
Acquisition of two cement plants with a capacity of 4.9 mtpa in Madhya Pradesh Proposed acquisition on track…likely to complete in Q3 FY16
Safety Priority - Achieved Zero Harm Mission
25

Key highlights FY 2014-15(Contd…)
Operating performance Capacity utilisation at 75% v/s Industry c 68% Volume grew by 8% … major growth driven by eastern region and on account of
acquired Gujarat plants
Net sales up 13%
EBIDTA improved 10% …with consistent operating margin of 20%
Dividend Payout : ~ 15% of Net Profit
Consolidated Net debt increase on acquisition and on-going capacity expansion programme (+ ` 2,700 Crs)
Strong financial position Net Debt : Equity : 0.27 Net Debt / EBIDTA : 1.09
26

Performance Q4 2014-15
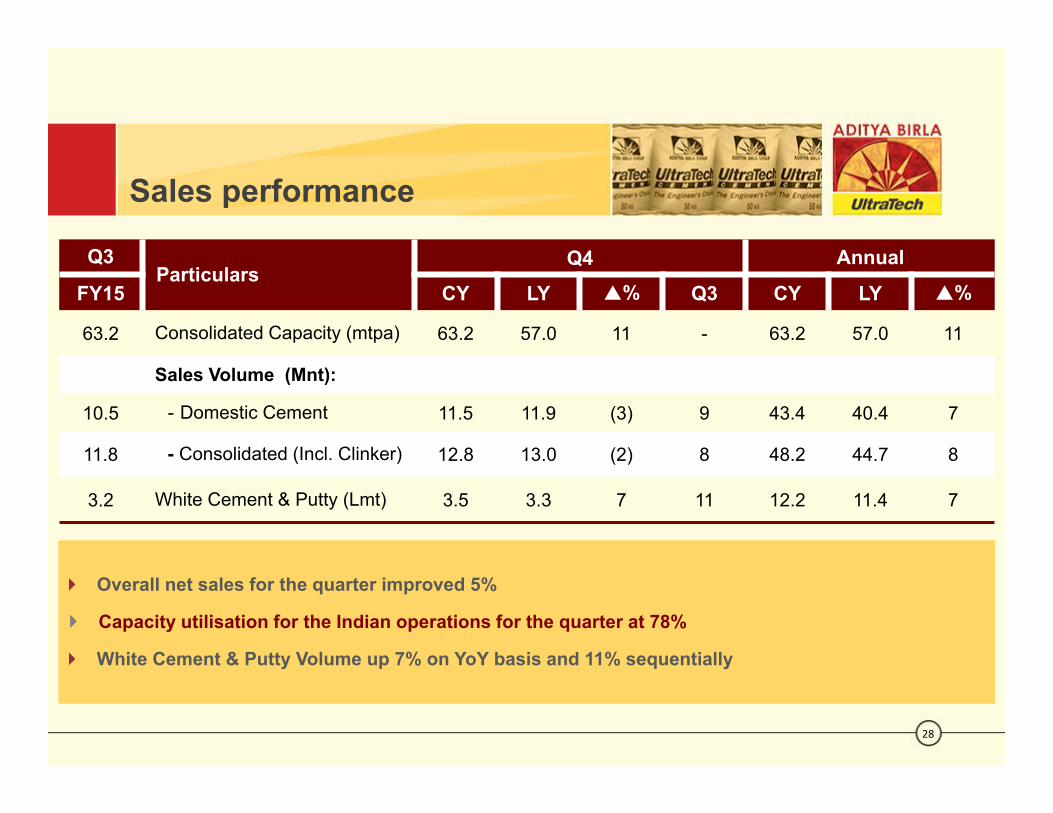
Overall net sales for the quarter improved 5%
Capacity utilisation for the Indian operations for the quarter at 78%
White Cement & Putty Volume up 7% on YoY basis and 11% sequentially
Sales performance
28
Q3Particulars
Q4 Annual
FY15 CY LY % Q3 CY LY %
63.2 Consolidated Capacity (mtpa) 63.2 57.0 11 - 63.2 57.0 11
Sales Volume (Mnt):
10.5 - Domestic Cement 11.5 11.9 (3) 9 43.4 40.4 7
11.8 - Consolidated (Incl. Clinker) 12.8 13.0 (2) 8 48.2 44.7 8
3.2 White Cement & Putty (Lmt) 3.5 3.3 7 11 12.2 11.4 7

Operational Performance Cost composition (Grey Cement)
29
Logistics cost increased by 9% at ` 1095/t
Benefit of diesel prices reduction in road freight negated with increased in railway freight and change in market mix & sales pattern
Energy costs remained flat at ` 940/t
Raw materials cost higher at ` 443/t (5% increase) due to hike in limestone royalty & additional levies under MMDR Act
Higher retiral provisions
33%
31%
14%
5%3% 14%Q4 14
33%
29%
13%
4%3%
18%Q4 15 Logistic Cost
Energy Cost
Raw Materials
Packing
Maintenance &OthersOverheads

Logistics cost trends(Indian Operations)
30
Logistics cost remained in line with Q3, however increased over LY by 9%
Saving in road freight on account of reduction in diesel prices negated by:
Increase in railway freight (` 38/t)
Change in sales pattern from ex-works to FOR (` 25/t)
Change in Plant/ Market mix (` 35/t)
Non-availability of rakes increased the dependence on road movement
Mode Mix Q4 14 Q3 15 Q4 15
Rail 37% 26% 28%
Road 60% 70% 68%
Sea 3% 4% 4%
1002
1093
997
38
25
35
Q4 14 Q3 15 Q4 15
Logistic Cost `/t1095
9%
Railway Freight
Sales Pattern
Market Mix

Energy costs trends(Indian Operations)
31
5%
Energy costs declined by 5% over Q3
Increasing share of TPP and Petcokeconsumption; WHRS share in total powerabout 2%
Increased domestic coal prices and higherfreight partially set off the gain in importedcoal prices
Kiln Fuel Mix % Q4 14 Q3 15 Q4 15
Petcoke 52% 51% 64%
Imported Coal 22% 29% 19%
Indigenous Coal and Others 26% 20% 17%
Power Mix % Q4 14 Q3 15 Q4 15
TPP + WHRS 83% 86% 85%
945
994
940
Q4 14 Q3 15 Q4 15
Energy Cost `/t

Income statement (Standalone)
32
` crsQ4FY15
Particulars AnnualCY LY % CY LY %
6135 5832 5 Revenue 22656 20078 13
1364 1329 3 EBIDTA 4569 4147 1022% 23% (1) Margin (%) 20% 21% 1
150 74 Finance Costs 547 319 (72)
290 278 (4) Depreciation 1135 1052 (8)
924 976 (5) PBT 2886 2776 4
309 138 - Tax Expenses* 872 631 (38)
615 838 (27) PAT 2015 2144 (6)
665 742 (10) Normalised PAT* 2065 2049 1
22.4 30.6 (27) EPS (`) 73.4 78.2 (6)
*CY: Deferred tax incidence of ` 50 crs due to increase in surcharge on Income-tax &LY: Reversal of tax provisions related to earlier years - ` 96 crs

EBIDTA pmt
33
CY Q4: EBDITA pmt improved 28% over Q3 and 6% over LY Q4
Q4FY14 FY14 Q1FY15 Q2FY15 Q3FY15 Q4FY15 FY15
1062
973
1056
893876
1121
992

Income statement (Consolidated)
34
` crs
Q4FY15Particulars Annual
CY LY % CY LY %6518 6186 5 Revenue 24065 21443 121437 1389 3 EBIDTA 4777 4358 1022% 22% - Margin (%) 20% 20% -160 85 (87) Finance Costs 587 361 (62)
308 301 (2) Depreciation 1205 1139 (6)
969 1002 (3) PBT 2986 2858 4
312 140 - Tax Expenses* 884 645 (37)
- -3 Minority Interest 4 7 (44)
657 865 (24) PAT 2098 2206 (5)
707 769 (8) Normalised PAT* 2148 2110 224.0 31.5 (24) EPS (`) 76.5 80.5 (5)
*CY: Deferred tax incidence of ` 50 crs due to increase in surcharge on Income-tax &LY: Reversal of tax provisions related to earlier years - ` 96 crs

Annual Performance 2014-15

Cement production(Million tonnes)
Clinker production(Million tonnes)
36
Production trends(Consolidated)
FY 12 FY 13 FY 14 FY 15
33.6934.17 34.01
38.31
FY 12 FY 13 FY 14 FY 15
42.1142.59
43.60
46.71
14% 11%

Raw Material Cost(`/Mt)
FY 12 FY 13 FY 14 FY 15
348
399419
444
Grey cement cost trends (Indian Operations)
37
Input material prices hardening
Logistics Cost (`/Mt)
FY 12 FY 13 FY 14 FY 15
819
925976
1075
Mix FY12 FY13 FY14 FY15
Rail 36% 34% 34% 29%
Road 61% 63% 62% 67%
Sea 3% 3% 3% 4%

Grey cement cost trends(Contd..)(Indian Operations)
38
Fuel Mix - Kiln FY12 FY13 FY14 FY15
Imported Coal 44% 35% 26% 26%
Petcoke 26% 38% 48% 52%
Ind. Coal & Others 30% 27% 26% 22%
Energy Cost(`/Mt)
2012 2013 2014 2015
1006
989
951
979
Energy cost - Range bound

Revenue (` Cr)
EBIDTA(` Cr)
2012 2013 2014 2015
19077
21161 21443
24065
Financial performance trends(Consolidated)
39
26%
2012 2013 2014 2015
4565
5143
4358
4777

Financial Position
40
` crs
StandaloneParticulars
Consolidated
31.03.15 31.03.14 31.03.15 31.03.1418858 17098 Shareholders Funds 19041 17182
- - Minority Interest 18 177414 5199 Loans (Incl. Current Maturities) 9829 73322792 2296 Deferred Tax Liabilities 2786 2290
29064 24593 Sources of Fund 31674 26821
23632 18650 Net Block (Incl. Capital Advances) 25186 20090- - Goodwill on Consolidation 1053 967
Investments:4479 4841 Liquid Investments 4634 4841730 551 Long-term Investments 21 21223 551 Net Working Capital 780 902
29064 24593 Total Application of Funds 31674 26821

Financial Indicators
41
IndicatorsStandalone Consolidated
31.03.15 31.03.14 31.03.15 31.03.14
Shareholders fund (` crs ) 18858 17098 19041 17182
Borrowings (` crs ) 7414 5199 9829 7332
Cash Equivalents (` crs ) 4479 4841 4634 4841
Financial Indicators
Net Debt: Equity 0.16 0.02 0.27 0.14
Net Debt / EBIDTA 0.64 0.09 1.09 0.57
Interest Cover (PBIT/Gross Interest) 5.8 7.8 5.7 7.3
ROCE 12.0% 13.1% 11.5% 12.5%
NROCE 8.9% 10.5% 8.6% 10.0%
Book Value (`/Share) 687 623 694 627
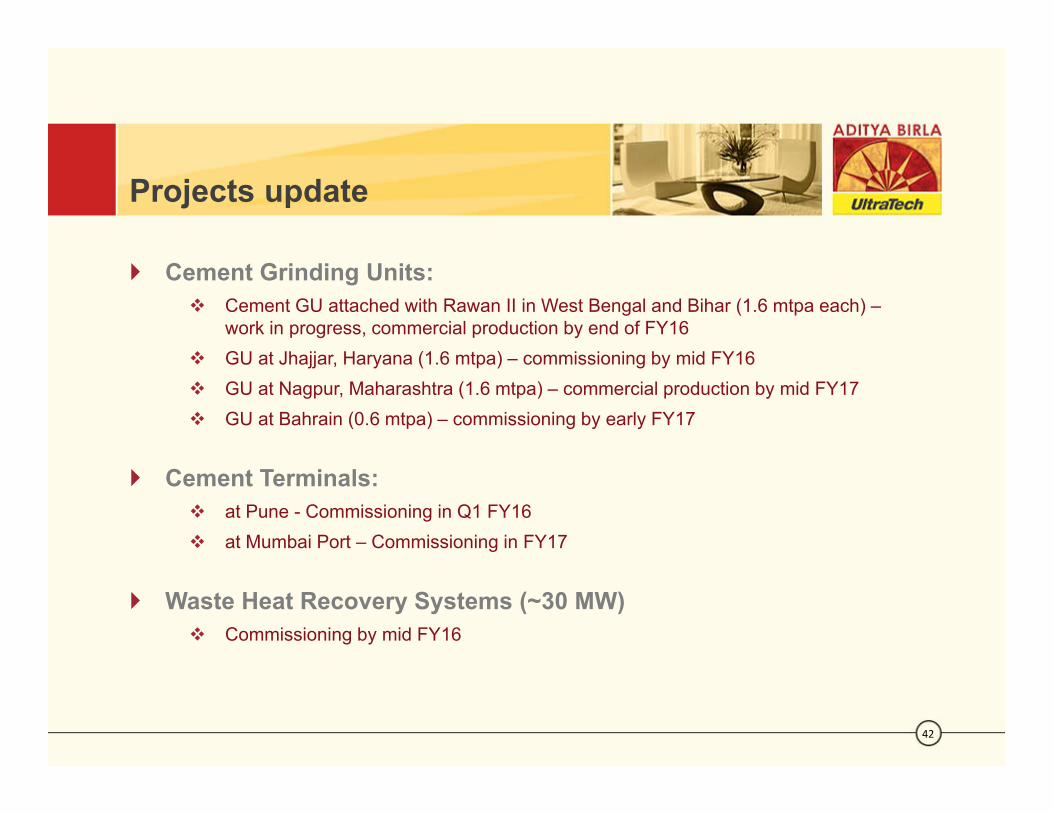
Projects update
Cement Grinding Units: Cement GU attached with Rawan II in West Bengal and Bihar (1.6 mtpa each) –
work in progress, commercial production by end of FY16 GU at Jhajjar, Haryana (1.6 mtpa) – commissioning by mid FY16 GU at Nagpur, Maharashtra (1.6 mtpa) – commercial production by mid FY17 GU at Bahrain (0.6 mtpa) – commissioning by early FY17
Cement Terminals: at Pune - Commissioning in Q1 FY16 at Mumbai Port – Commissioning in FY17
Waste Heat Recovery Systems (~30 MW) Commissioning by mid FY16
42

Statements in this “Presentation” describing the Company’s objectives, estimates, expectationsor predictions may be “forward looking statements” within the meaning of applicable securitieslaws and regulations. Actual results could differ materially from those expressed or implied.Important factors that could make a difference to the Company’s operations include global andIndian demand supply conditions, finished goods prices, feedstock availability and prices,cyclical demand and pricing in the Company’s principal markets, changes in Governmentregulations, tax regimes, economic developments within India and the countries within which theCompany conducts business and other factors such as litigation and labour negotiations. TheCompany assumes no responsibility to publicly amend, modify or revise any forward lookingstatement, on the basis of any subsequent development, information or events, or otherwise.
UltraTech Cement LimitedRegd. Office: 2nd Floor, ‘B’ Wing, Ahura Centre, MIDC, Andheri (E), Mumbai – 400 093
[Corporate Identity Number L26940MH2000PLC128420]91‐22 66917800 www.ultratechcement.com or www.adityabirla.com
Disclaimer
43
