adiabatic sorption of ammonia-water system and … sorption of ammonia-water system and ... diagrams...
TRANSCRIPT
Adiabatic Sorption of Ammonia-Water System and Depicting in p-T-x Diagram
J. POSPISIL, Z. SKALA
Faculty of Mechanical Engineering Brno University of Technology
Technicka 2, Brno 61669 CZECH REPUBLIC
Abstract: - Absorption cycles designers often utilize p-t-x diagrams of working mixtures for first suggestion of new absorption cycles. The p-t-x diagrams enable fast correct determination of saturate states of liquid (and gaseous) mixtures of refrigerants and absorbents. The working mixture isn’t only at saturated state during a real working cycle. If we know pressure and temperature of an unsaturated mixture, exact position determination is possible in the p-t-x diagrams too. But there are still processes uneasy to draw in the p-t-x diagrams, namely adiabatic sorption. The adiabatic sorption is very interesting phenomenon that occurs when vapor of refrigerant is in contact with unsaturated liquid absorbent-refrigerant mixture and exchange of heat is forbid between the system and an environment. This contribution introduces new auxiliary lines that enable correct position determination of the adiabatic sorption process in the p-T-x diagram of ammonia-water system. The presented auxiliary lines were obtained from common functions for fast calculation of water-ammonia system properties. Key-Words: - adiabatic sorption, auxiliary lines, p-t-x diagram, ammonia-water system 1 Introduction This paper presents the new auxiliary lines for
improving of this situation. The auxiliary lines base from common functions for fast calculation of water-ammonia system properties. The new auxiliary lines enable correct position determination of the adiabatic sorption process in the p-t-x diagram of an ammonia-water system.
Absorption cycles represent thermally driven cycles for wide variety of utilizing. Intensive development of the absorption cycles has led to significant increasing of the coefficient of performance (COP) in last 20 years. The most important way of COP increasing is based on reutilizing of sensitive heat of working mixtures. Another possible way for increasing of COP is based on reutilization of absorption heat generated during absorption of refrigerant vapor in unsaturated mixture. The generator-absorber heat exchange (GAX) cycles utilize this phenomenon. Heat generated during an absorption process is used for a desorption process in a generator.
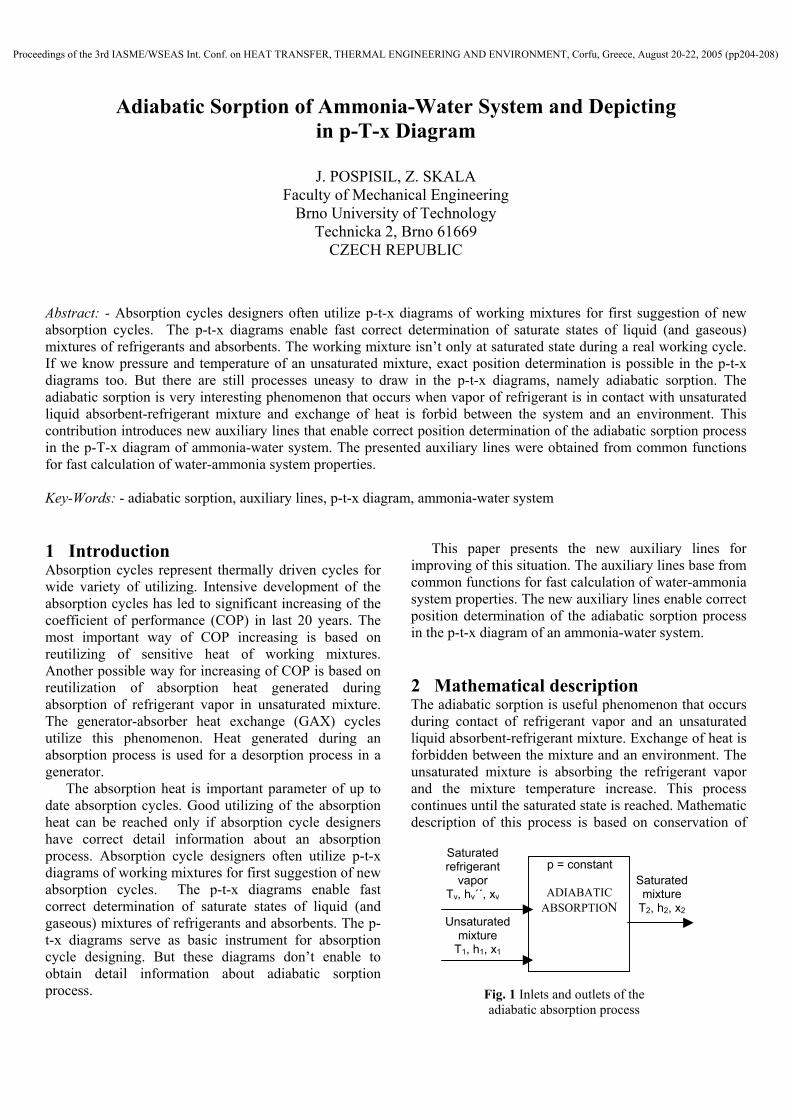
2 Mathematical description The adiabatic sorption is useful phenomenon that occurs during contact of refrigerant vapor and an unsaturated liquid absorbent-refrigerant mixture. Exchange of heat is forbidden between the mixture and an environment. The unsaturated mixture is absorbing the refrigerant vapor and the mixture temperature increase. This process continues until the saturated state is reached. Mathematic description of this process is based on conservation of
The absorption heat is important parameter of up to date absorption cycles. Good utilizing of the absorption heat can be reached only if absorption cycle designers have correct detail information about an absorption process. Absorption cycle designers often utilize p-t-x diagrams of working mixtures for first suggestion of new absorption cycles. The p-t-x diagrams enable fast correct determination of saturate states of liquid (and gaseous) mixtures of refrigerants and absorbents. The p-t-x diagrams serve as basic instrument for absorption cycle designing. But these diagrams don’t enable to obtain detail information about adiabatic sorption process.
Saturated refrigerant
vapor Tv, hv´´, xv
Unsaturated mixture
T1, h1, x1
Fig. 1 Inlets and outlets of the adiabatic absorption process
p = constant
ADIABATIC ABSORPTION
Saturated mixture
T2, h2, x2
Proceedings of the 3rd IASME/WSEAS Int. Conf. on HEAT TRANSFER, THERMAL ENGINEERING AND ENVIRONMENT, Corfu, Greece, August 20-22, 2005 (pp204-208)

( 11111 TTchh p −′⋅′ )−′= (1) energy. That is realized by utilizing of conservation of enthalpy during isobaric absorption. The schema at fig. 1 shows considered inlets and outlet of the process.
Where superscript ' denotes saturated state of liquid mixture and subscript 1 denotes liquid mixture with mole fraction of NH3 equal to mole fraction of the original liquid unsaturated mixture. Pressure is assumed at constant level.
Where T, h, x mean temperature, enthalpy and mole fraction of NH3. Subscripts v, 1, 2 identify properties of saturated refrigerant vapor, unsaturated mixture and saturated mixture. Mole fraction of NH3 in saturated refrigerant vapor is equal to 100%. Corresponding enthalpy and temperature is calculated from equations obtained from [1]. Saturated mixture parameters were calculated with utilizing of the functions for fast calculation of water-ammonia system properties [1] [2] [3].
Equations for calculation of the saturated mixture specific thermal capacity, temperature of the saturated mixture and the saturated mixture specific enthalpy are depended only on actual pressure and NH3 mass concentration.
T1´ = f (p, x1) (2) Mole concentration and temperature of unsaturated
mixture is required together with absorption pressure as input parameters. The functions for fast calculation of mixture properties provide information only for saturated state of the mixture. So, we must use an appropriate approach for determination of unsaturated mixture specific enthalpy. At this paper we used knowledge of specific thermal capacity of the saturated mixture and temperature of the saturated mixture. Unsaturated liquid mixture enthalpy h1 was calculated with utilizing of equation (1).
h1´ = f (T1', x1) (3) cp1´ = f (T1', x1) (4)
After calculation of the mentioned equations, we compare value of enthalpy of the unsaturated liquid mixture and the saturated liquid mixture with same mole fraction of NH3. If enthalpy of the unsaturated mixture is below enthalpy value of the saturated one, the absorption of NH3 vapor continues. Mass concentration of NH3 is slightly increased in following step and calculation starts with this increased concentration of NH3. Calculation becomes repetitive. It is useful to engage iterative calculation process, see fig.2.
Fig. 2 Iterativ calculation of adiabatic sorption saturate state
x2 = x h2´ = h´ T2´ = f (p, x2)
h´– h < ε
∆x = k (h´-h)/ hv´´
x = (x + ∆x) / (1 + ∆x) h = (h + ∆x . hv
´´) / (1 + ∆x) h´ = f (T, x)
hv´´
= f (p) T1´ = f (p, x1) cp1´ = f (x1, T) h1´ = f (T, x1) h1 = h1´ - cp1´( T1´-T1) x = x1; h = h1; h´ = h1´
T1, p, x1
+
-
Variables without subscript correspond to state of the liquid mixture during the saturation process. During this process, temperature, enthalpy and mass fraction of NH3 increase until a terminal saturated state denoted by subscript 2. The iterative calculation is stopped in the instance when a difference between enthalpy of the saturated mixture and enthalpy of the unsaturated mixture is smaller then a convergence criterion ε.
The used equations and appropriate parameters are mentioned in the following section. First, the equation for calculation of saturated liquid mixture temperature is written as function of pressure and mole fraction of NH3 [1]:
( )in
i
imi
ppxaTT ∑
−=′ 0
0 ln1 (5)
i mi ni ai
1 0 0 0,322302 x 101
2 0 1 -0,384206 x 100
3 0 2 0,460965 x 10⁻¹
4 0 3 -0,378945 x 10⁻²
5 0 4 0,135610 x 10⁻³
6 1 0 0,487 755 x 100
7 1 1 -0,120108 x 100
8 1 2 0,106154 x 10⁻¹
9 2 3 -0,533589 x 10⁻³
10 4 0 0,785041 x 101
11 5 0 -0,115941 x 10²
12 5 1 -0,523150 x 10⁻¹
13 6 0 0,489596 x 101
14 13 1 0,421059 x 10⁻¹
T0 = 100 K p0 = 2 MPa Table 1 List of parameters for equitation (5)
Proceedings of the 3rd IASME/WSEAS Int. Conf. on HEAT TRANSFER, THERMAL ENGINEERING AND ENVIRONMENT, Corfu, Greece, August 20-22, 2005 (pp204-208)

Enthalpy of the saturated liquid mixture was calculated from equation [1]:
inim
ii x
TTahh ∑
−= 1´
00 (6)
i mi ni ai
1 0 1 -0,761080 x 101
2 0 4 0,256905 x 10²
3 0 8 -0,247092 x 10³
4 0 9 +0,325952 x 10³ 5 0 12 -0,158854 x 10³
6 0 14 0,619084 x 10²
7 1 0 0,114314 x 10²
8 1 1 0,118157 x 101
9 2 1 0,284179 x 101
10 3 3 0,741609 x 101
11 5 3 0,891844 x 10³
12 5 4 -0,161309 x 10⁴
13 5 5 0,622106 x 10³
14 6 2 -0,207588 x 10³
15 6 4 -0,687393 x 101
16 8 0 0,350716 x 101
h0 = 100 kJ/kg T0 = 273,16 K Table 2 List of parameters for equitation (6)
Specific thermal capacity [2] of the saturated liquid mixture was calculated with utilizing of following equations:
( ) OHpNHpp cxcxc 23 1 ′⋅−+′⋅=′ (7) 1−⋅+=′ τcpcpip BAc (8)
critTT ′
−≡ 1τ (9)
Acp Bcp NH3 3,875648 0,242125 H2O 3,665785 0,236312
Table 3 List of parameters for equitation (8) The solution critical temperature [3] was calculated with utilizing of equation:
∑=i
iicrit xaT (10)
i ai
0 647,14 1 -199,822371 2 109,035522 3 -239,626217 4 88,689691 Table 4 List of parameters for equitation (10)
3 Auxiliary lines forming Now we can start to draw the adiabatic absorption process in the p-t-x diagram. The unsaturated mixture is labeled as position 1 in fig.3. We assume the isobaric absorption process so saturating solution locations must stay on a horizontal line. Concentration of NH3 and temperature of the solution rise during the absorption
process. The terminal state of the solution is shifted in right hand direction from the initial position.
The final mixture parameters are easy to calculate with the equations mentioned above. Very useful is to have opportunity of obtaining the parameters directly from the p-t-x diagram. This is useful for time saving during designing of new cycles.
When we have been looking for new adiabatic absorption auxiliary lines, we summarized what parameters are required for determination of the saturate state position. Necessary input parameters are mole fraction of NH3, temperature of the unsaturated state and corresponding pressure. The pressure and the temperature serve for determination of the initial state
position in the p-t-x diagram. Since, concentration lines are drawn only for saturated states in the p-t-x diagram, position of the unsaturated solution is always located on left hand side from the saturated solution concentration line drawn for same mole fraction of NH3 as the unsaturated solution mole fraction. This saturated solution concentration line enables to estimate how far is the unsaturated solution from its saturated state.
2 1
T
50% 100% H2O100% NH3 p
Fig.3 Adiabatic absorption process in p-t-x diagram
Two basic points define an adiabatic absorption auxiliary line in p-T diagram. First point corresponds to position of the unsaturated mixture - point 1. Second point lies on corresponding saturated mixture concentration line bellow position of the terminal saturated state of mixture - point 2 (obtained from calculation), see fig.4.
The adiabatic absorption auxiliary lines show linear character in p-t diagram of ammonia - water system. This character was verified by series of calculations. All adiabatic absorption auxiliary lines are parallel in p-T diagram. A schema of p-t-x diagram with an adiabatic absorption auxiliary line is shown in fig.4. The auxiliary line utilizes the position of an intersection with the saturate solution concentration line for determination of a terminal saturated solution position.
Proceedings of the 3rd IASME/WSEAS Int. Conf. on HEAT TRANSFER, THERMAL ENGINEERING AND ENVIRONMENT, Corfu, Greece, August 20-22, 2005 (pp204-208)

3. concentration as concentration of the initial unsaturated solution.
p 100% NH3 100% H2O50%
T
1 2 T2,x2
T1 x1=50%
adiabatic absorption auxiliary line 4. Draw a vertical line upward from the
intersection. 5. The terminal saturated solution is located in an
intersection of the vertical line and a corresponding isobaric line (pressure of initial unsaturated solution).
A final p-t-x diagram of ammonia-water system with four adiabatic absorption auxiliary lines is shown in fig.5. An example of using of the adiabatic absorption auxiliary lines is drawn in this figure too. The auxiliary lines are linear for mole fraction of NH3 from 100% till 10%. Under 10% the auxiliary lines divert from linear character. The auxiliary lines are not drawn for mole fractions under 10% in the fig.5. Because it is not clear if this behavior results from mixture physical parameters or inaccuracy of the used equations. Detail analysis of this behavior will provide following research.
Fig.4 Adiabatic absorption auxiliary line in p-t-x diagram
Position of the saturated liquid can be obtained in four following steps with utilizing of an adiabatic absorption auxiliary line:
1. Draw the adiabatic absorption auxiliary line crossing the initial unsaturated solution (known p, T, x).
2. Determine an intersecting position of the adiabatic absorption auxiliary line and the saturate solution concentration line for same
Fig.5 p-t-x diagram with the adiabatic absorption auxiliary lines
Proceedings of the 3rd IASME/WSEAS Int. Conf. on HEAT TRANSFER, THERMAL ENGINEERING AND ENVIRONMENT, Corfu, Greece, August 20-22, 2005 (pp204-208)

4 Conclusions This paper introduces the new adiabatic absorption auxiliary lines in the p-t-x diagram of ammonia-water system. These lines serve for fast determination of the saturated state of mixture only with knowledge of the unsaturated mixture parameters. The auxiliary lines assume absorption of refrigerant saturated vapor at constant pressure.
The paper introduces forming of the adiabatic absorption auxiliary lines with utilizing of equations for fast calculation of ammonia-water mixture properties. Iterative calculation process was used for determination of saturated state.
The new auxiliary lines help to estimate absorption temperatures during first suggestions of an absorption cycles. Correct determination of the absorption temperatures lead to designing of cycles with better absorption heat utilizing. The paper shows practical utilizing of the new auxiliary lines too. Acknowledgements: This work is part of research supported by the Ministry of Education of the Czech Republic under the grant MSM 1350003 and Ministry of Industry and Trade of the Czech Republic under grant FF-P2/050.
References: [1] J.Patek, J. Klomfar, 1995, Simple functions for fast
calculations of selected thermodynamic properties of the ammonia-water system, Int. J. Refrigeration, 18(4), 228-234
[2] Tillner-Roth, R.,D. G. Friend, 1998, Survey and Assessment of Available Measurements on Thermodynamic Properties of the Mixtures, J. Phys. Chem. Ref. Data, 27(1), 45-61
[3] Sassen, C. L., R.A.C. van Kwartel, H.J. van der Kooi, J. de Swan Arons, 1990, Vapor - Liquid Equilibria for the System Ammonia + Water up to the Critical Region, j. Chem. Eng. Data, 35, 140-144
Proceedings of the 3rd IASME/WSEAS Int. Conf. on HEAT TRANSFER, THERMAL ENGINEERING AND ENVIRONMENT, Corfu, Greece, August 20-22, 2005 (pp204-208)