aden forecast - the gold report - gold stock coverage from
TRANSCRIPT
1Copyright Aden Research April 5, 2006
INSIDE
U.S. & Other Stock Markets .......... 3Selectively strong, but for long?
U.S. Interest Rates & Bonds ........... 5Bearish bonds at nearly two year low
Currencies ........................................ 7U.S. dollar: Lifeless
Metals & Natural Resources ......... 8Up, up and away
APRIL, 2006
The evergrowing bull market in the metalsin our 25th year!
Copyright Aden ResearchApril 5, 2006 Volume 25 Number 4
FORECASTMONEY • METALS • MARKETS
ADENTHE
Did you notice something’s miss-ing this month? Yes, it’s our overallportfolio recommendation box,which we usually put on this page.
CHANGING FOR THE BETTERThis month, we’re making a
change and if you like it, we’ll makeit permanent. Basically, what we’vedone is move all of our market rec-ommendations to page 12. All of thestocks and funds we’re recommend-ing are listed there too. The idea isto make this page a one stop, bot-tom line summary with everythingin one place.
We think this will make it easierfor you to use it as a reference. Butwe also know that sometimeschanges don’t work out as planned.That’s why we look forward to yourcomments and we’d appreciate anote sent to [email protected] you and we’ll let you knowthe outcome next time.
Meanwhile on the market front,things were moving along prettymuch as expected, until recently.Gold, for instance, was resisting itsdownward correction we call D. It
was holding firm but gold thenpunched up to new bull markethighs, following the strong silverrise. Does that mean a renewed riseis now underway? It looks like it isand if so, then gold’s bull market issuper strong and the parabolic risecontinues.
SILVER: The starSilver has been in a league of
its own. It’s been soaring as de-velopments move forward on thenew silver ETF. Some of the othermetals and oil have been verystrong too. Gold shares are mov-ing up as well and so are the en-ergy and natural resource shares.And even though some of the lead-ing indicators aren’t yet confirm-ing this renewed rise, based onthe price action, we’re going withit and buying new positions.
The stock market has been show-ing renewed strength, but the bondmarket remains weak. The U.S. dol-lar is also showing signs of weak-ness, which will make the curren-cies more attractive.
So what’s driving these markets?As you know, it’s a combination offinancial and geopolitical factors,which you won’t usually find in thenews in any meaningful way. It’sunfortunate but that’s the reality,especially in recent years in the U.S.
We’re sure you’ve noticed that thenews is barely news anymore andsince most people get their newsfrom TV, the average U.S. viewer isbecoming increasingly isolated. Theyrarely see the war as it really is, orhear views from the rest of the world.
NEWS IS NOT REAL NEWSInstead, viewers are bombarded
with consumer and human inter-est stories, trivial tidbits, localcrimes and never ending celebritynews. Years ago a friend of ours,who was a top executive at a majornetwork, called it the dumbingdown of America and it’s only got-ten worse. The networks are con-cerned about ratings and if theviewers want to hear more aboutBrad and Angelina than what’s hap-pening in the world, then that’swhat they’re going to get.
This means you have to lookhard for the real news. Publicationslike The Economist, National Geo-graphic, scientific journals, the for-eign press, CNN International, BBC,newsletters and so on provide uswith a lot of info that’s behind themoves in the markets.
This could be anything fromnews out of China, details on U.S.and international finances, theworld oil picture, politics and inter-national affairs, what’s happeningin the Middle East from a local per-spective, world tensions, globalwarming and so on. Of course, wealso rely a great deal on our techni-cal charts because they tend to tellus where the markets are headed,but since they don’t tell us why,that’s where these other sourcescome in.
Here’s just a couple of examplesof what we mean… our flora andfauna is currently being destroyed1000 times faster than the histori-cal norm and the most since the last
2 Copyright Aden ResearchApril 5, 2006
great extinction 65 million years agowhen the dinosaurs disappeared.Glaciers are melting, sea levels arerising, weather is changing and ex-perts are predicting more and stron-ger natural disasters this year.Aside from the obvious results, thiswill also affect the markets, espe-cially commodities. Look no furtherthan last year’s Hurricane Katrinaand the record high oil price as onesad example.
One of our favorite writers whoknows Middle Eastern history, Ri-chard Maybury, points out a coupleof reasons why resentment of theWest remains so strong in the Mus-lim world. Bush, forinstance, has saidhe plans to democra-tize the Arab worldbecause democra-cies don’t make war.The facts, however,contradict this.
Of the 57 Islamiccountries existingtoday, 49 of these, or86%, were eitherconquered, attackedor dominated byWestern democra-cies. For centuries,millions of peoplewere killed and theseresentments still fes-ter. That’s why mil-lions of Muslims donot want peace or democracy, theywant revenge.
Further, let’s look at the num-bers… the population of the GreaterMiddle East is more than double theU.S. population. In the U.S., peopleare turning off to the war with 66%now saying it was a mistake. In Iraq,thousands of young men are join-ing the fight, which is one reasonwhy the war is intensifying. Bushhas warned the war is going to belong and based on what’s happen-ing, it’s indeed unlikely to end soon.Again, this is going to affect themarkets, especially gold and oil.
THE MEGA COMMODITY CYCLEInterestingly, these and other
factors are coinciding with the megaupmove in tangible assets we’ve of-ten mentioned in the past.
Our friend Marc Faber writes a
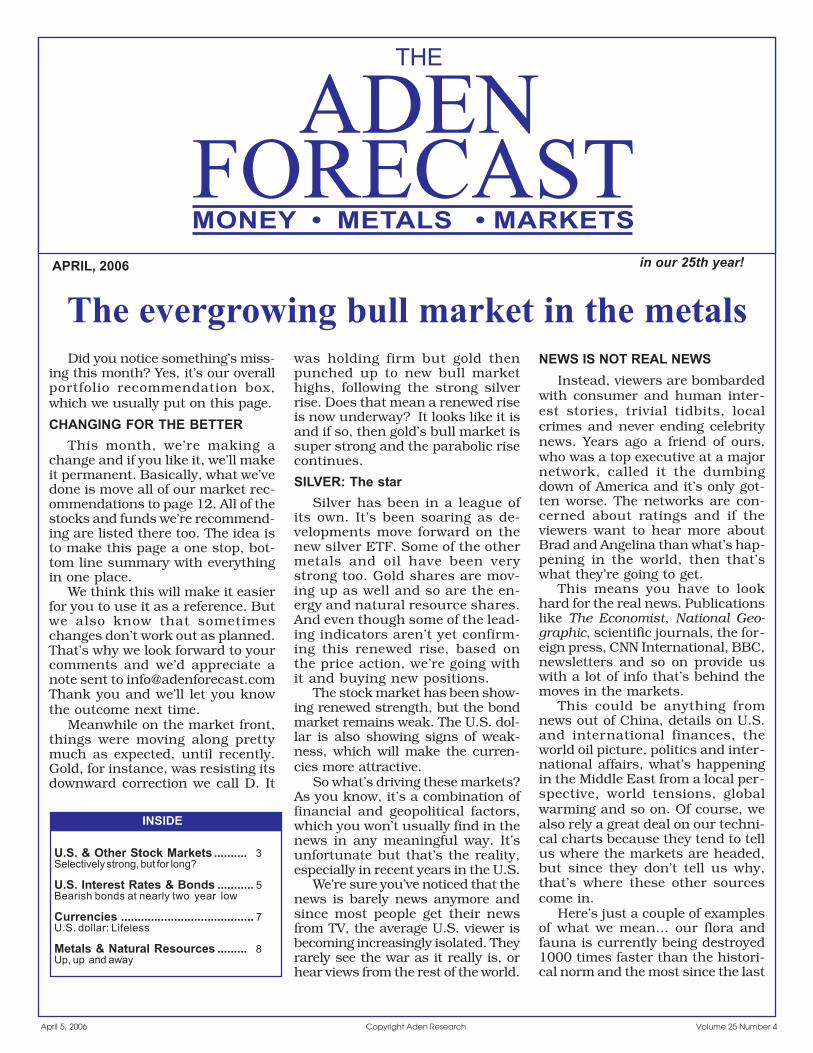
U.S. war of Independence, FrenchRevolution, Napoleonic wars,Austro-Hungary Revolution, U.S.Civil war, Spanish-American war,Chinese Revolution, World War I,Russian Revolution, World War IIand the Vietnam war.
WHERE ARE WE NOW?These mega Kondratieff upmoves
normally last around 22 years ormore and since we’re only six yearsinto this mega upmove, it still hasmany years to go. This means com-modity prices will likely be rising forthe next 15 years or so. This tellsus that you’ll want to keep a large
portion of your as-sets in tangibleassets like gold,other metals andcommodities, andnot in paper as-sets like stocksand bonds.
Gold’s megauptrend since2001 is reinforc-ing this. Thebooming rise inoil and the ongo-ing demand inthe face of dimin-ishing suppliesin the yearsahead is yet an-other reinforce-ment of this
emerging mega uptrend.Those who recognize this will
profit handsomely. But those whofollow the mainstream and keep alarge portion of their savings incommon stocks, especially thoseapproaching retirement age, will bedisappointed. And while we cer-tainly don’t have a crystal ball, themarkets and history are also tell-ing us we’re going to be in for a pe-riod of wars and social unrest in theupcoming years. In other words,what we’ve seen in recent years isgoing to continue and it’ll probablyintensify. This too will provide anunderlying boost for gold becauseit tends to rise along with global ten-sion. And considering that gold hitover $2000 an ounce in 1980 at thelast Kondratieff peak, adjusted forinflation, it still has a long way togo in the years ahead before it evenapproaches that previous high.
CHART 1
COMMODITY PRICES, 1804-2004
Source: Barry Bannister & Marc Faber Ltdwww.gloomboomdoom.com
All CommoditiesFuels & Energy
Metals and metal productsAgricultural products
1804 14 24 34 44 54 64 74 84 94 1904 14 24 34 44 54 64 74 84 94 2004
20%
16%
12%
8%
4%
0
-4%
-8%
-12%
Pricechange
great, always informative newslet-ter and he discusses these cyclesin depth, which were studied by theRussian economist, NikolaiKondratieff and are, therefore, re-ferred to as the Kondratieff waves(see Chart 1). These waves last be-tween 45 to 60 years from peak topeak and the rising waves are char-acterized by rising commodityprices, new innovations, social up-heaval, global economic powershifts and wars.
Briefly, new innovations, whichtend to occur during the precedingcost cutting down wave, result innew countries competing on the
world stage. This increases globaltension because the new competi-tors (like China today) erode the oldeconomic powerhouse’s share ofworld markets. It also createswealth imbalances at home, lead-ing to possible social unrest, andwars abroad. This recurring patternhas happened throughout history.It’s been documented going back to1780 and it’s now happening again.
Previous Kondratieff upmoves, forexample, coincided with the follow-ing innovations: in the first one therewas road, canal and bridge construc-tion; in the second it was railroads;third was electricity, radio, telephoneand autos; in the fourth it was elec-tronics and aerospace and now in thefifth upswing it’s telecommunica-tions and internet.
These rising waves also coin-cided with the following wars andrevolutions, to name but a few: the
War of1812
CivilWar
WWIWWIIKorea
ColdWar
South AsiaCommodity
Demand
3Copyright Aden Research April 5, 2006
8000
9000
10000
11000
12000
1400013000
U.S. & OTHER STOCK MARKETSSelectively strong, but for long?
Published monthly by Aden Research. Also includes access to a weekly update $195 per year. Send all customerservice or market related questions to Aden Research, Dept. SJO 874, P.O. Box 025216, Miami, Florida 33102-5216or E-mail [email protected] Questions will be answered in future issues. Copyright Aden Research 2006. Allrights reserved. The Editors may have a position in the securities recommended and may change such positionswithout notice. This publication's sole intended purpose is to provide investment-related information andopinions to subscribers. •FREE WEEKLY UPDATE every Wednesday at 8 P.M. (Eastern time). You can access itthrough our website, http://www.adenforecast.com or call (303) 664-9327. •To receive the market update byfax every week (52 weeks) $120 per year for U.S. subscribers and $200 for subscribers outside the U.S. •FASTERNEWSLETTER DELIVERY OPTIONS: Downloading from the website, no extra charge. Fax only, $65 more per yearfor U.S. subscribers and $170 more outside the U.S. Air Mail and Fax, $90 more per year for U.S. subscribers and$220 more outside the U.S. Make checks payable to Aden Research, S.A.
The Aden ForecastP.O. Box 790260
St. Louis, MO 63179-99271-866-301 2933
In Costa Rica:Ph: 506-271-2293Fax: 506-272-6261
(from the U.S. dial 011 first,otherwise dial 00 first)
Editors:Mary Anne AdenPamela Aden
www.adenforecast.com
CHART 2
- - - 40 Week Moving Average
1300
1600
2000
1800
2200
2400
3000
2500
3500
4500
4000
AT 1245
1300
1000
18001600
AT 2200 AT 1725
NASDAQ COMPOSITE S&P 500 DOW JONES AMEX COMPOSITE WILSHIRE 5000TRANSPORTATIONAVERAGE
AT 4000
STOCKS REMAIN BULLISH
CHART 3
DOW JONES INDUSTRIALS TO GOLD RATIO SINCE 1901
The stock mar-ket again movedhigher this monthand its renewedstrength contin-ues. The DowTransportationshit another all timehigh while the DowI n d u s t r i a l sreached a two yearhigh. The market islooking good and itcould go higher.
IGNORING BADNEWS
This alone isimpressive actionconsidering inter-est rates and the oil price are ris-ing, the housing boom is slowing,geopolitical tensions are brewing,the yield curve is essentially flat,which usually means the economyis going to slow, and the worrisomeU.S. debt and deficits situation.
Plus, the general stock market isstill lower than it was when Bushtook office over five years ago. AsBloomberg reported, that’s the worst
performance during the same stageof any two year administration inthe past half century except for theNixon years.
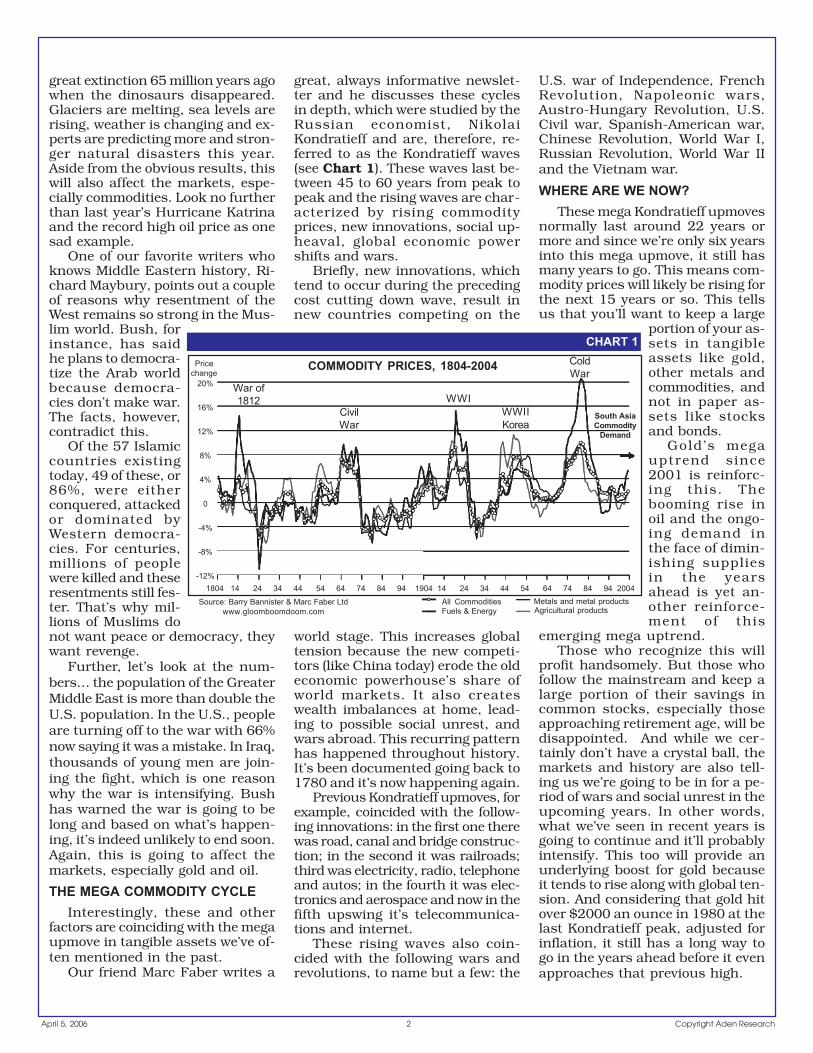
But that doesn’t seem to mat-ter… consumer confidence recentlyreached a nearly four year high, re-flecting optimism in the economyand this optimism is spilling overto stocks. As long as this contin-ues, the stock indices will likely re-
main bullishabove their mov-ing averages (seeChart 2). So whyaren’t we recom-mending com-mon stocks?
BETTER IN-VESTMENTSELSEWHERE
We hate to beparty poopers butas we’ve men-tioned before,there are two im-portant reasonswhy. One, stockshave not donewell over the past
six years and the precious metalsmarkets have been far stronger. Theprofits have been greater and that’swhere our focus remains. This yearhas not been an exception.
Despite the rise in the Dow In-dustrials, it ended the first quarterup only 2.42%. In comparison, goldhas risen 9.63%, nearly four timesthe gains in the Dow, while silverhas soared 26.33%. That’s nearly
4.9
2.1
3.2
5.8
18.2
2.0
2.6
5.6
9.3
3.1
1.0
3.6
27.8
43.7
RESISTANCE
900
1100
1300
1000
1200
AT 12500
RESISTANCE
RESISTANCE
RESISTANCE
2003 2004 2005 06 2003 2004 2005 06 2003 2004 2005 06 2003 2004 2005 06 2003 2004 2005 06
10
5
20
3
2
30
40
STO
CKS
BETT
ER T
HAN
GO
LD
4 Copyright Aden ResearchApril 5, 2006
-2
-1
0
1
CHART 4
8000
9000
1000010500
1150011000
DOW JONES INDUSTRIAL AVERAGELOOKS GOOD
B LEADING INDICATOR (MEDIUM-TERM)Room to rise further
A
2002 2003 2004 2005 06
40 Week MovingAverage at 10730
-3
-2
-1
0
1
2
CHART 5
200
250
300
350
400
450
DOW JONES UTILITIES AVERAGEBelow 40 week moving average,first time since 2003!
TURNING BEARISH
TEMPORARILY OVERBOUGHT AREA
B LEADING INDICATOR (MEDIUM-TERM)Declining from overbought area &room to decline further
A
00 01 02 03 04 05 06
40 Week MovingAverage at 405,bearish below
TEMPORARILY OVERSOLD AREA
CHART 6
- - - 65 Week Moving Average
8000
10000
14000
12000
16000
9000
11000
13000
15000
6000
8000
10000
15000
19000
AT 14600700
90010001100
800
12001300
AT 13200 AT 15300
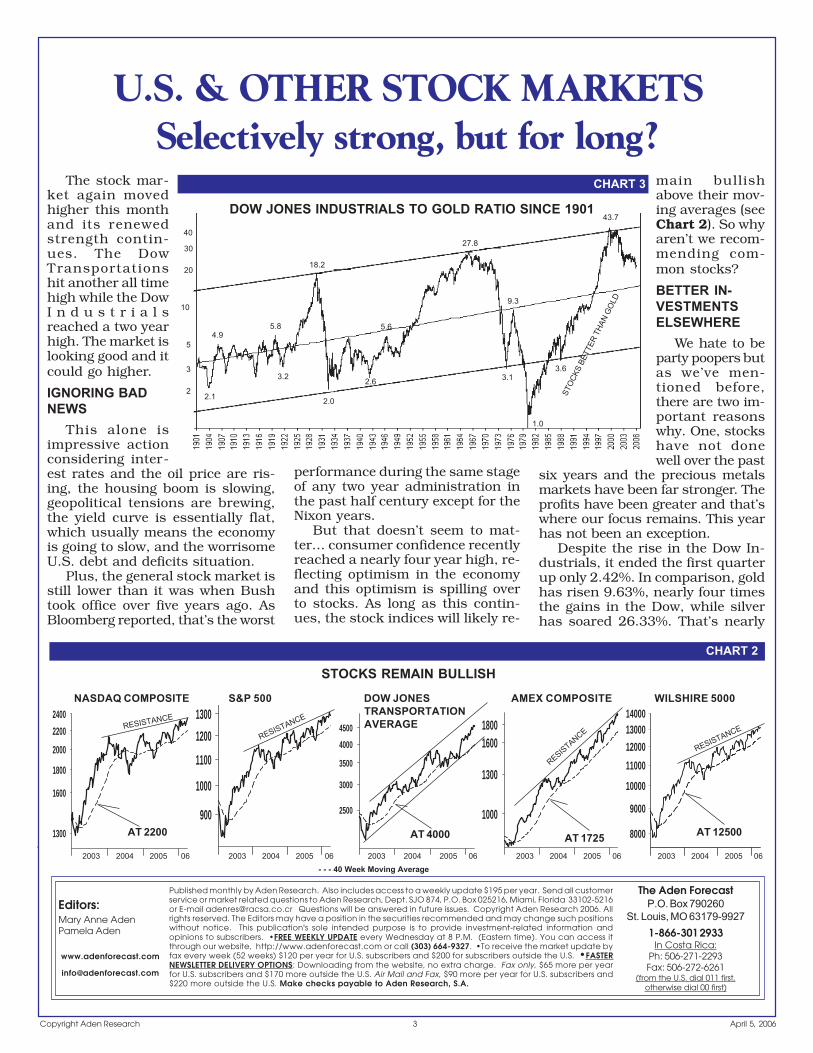
years, they don’t change often, andwhen the trend is down like it isnow, it means gold is going higherand stocks are headed lower in theyears ahead.
In fact, the ratio hit an extremehigh in 2000 at 43.7 but it recentlyreached a nine year low. Since it’sstill at extremely high levels, how-ever, it has a lot further to go onthe downside before it reaches thelow levels.
Note that at previous major lows,the ratio dropped to between 1 and3. What would that mean if it hap-pens again this time around? Theseare guesstimates, but let’s say theDow were to eventually drop to 6000,which would be a 46% drop fromcurrent levels. A ratio of 3 means goldwould reach $2000 (6000÷2000=3).If the ratio were to decline to 4 ½,the lower uptrend line, that couldmean the Dow eventually reaches8000 and gold goes to $1800.
The point is, we don’t know wherethe numbers will end up but thischart is telling us that gold will behigher and the Dow will be lowerwhenever this ratio eventually hitsbottom.
This is important because manyinvestors believe stocks are good forthe long-term. While that’s gener-ally true, you can see there are pe-riods when they are not, and thesecan last for up to 15 years. And ifyou don’t have 15 years to waste,why bother?
As our dear friend Richard Russellsays… primary bull markets tend toend in upside madness. Primary bearmarkets tend to end in fear and feel-ings of hopelessness. Both of theseopposites lie ahead for the bear mar-ket in stocks and the bull market ingold… and we agree.
11 times better than the Dow’s per-formance and triple the gains in thestronger Transportations.
The second reason why we’re notrecommending traditional stocks isbecause the trend favors superiorstrength in the metals, whereas thestock market’s strength is limited.Chart 3 shows the big picture of theDow Industrials compared to goldgoing back to 1901 and it illustrateswhy.
GOLD BETTER THAN STOCKSWhen this ratio rises, the Dow
is stronger than gold, and that wascertainly the case in the 1980s-90s.But when it declines, the Dow isweaker than gold. As you can see,these mega moves tend to last for
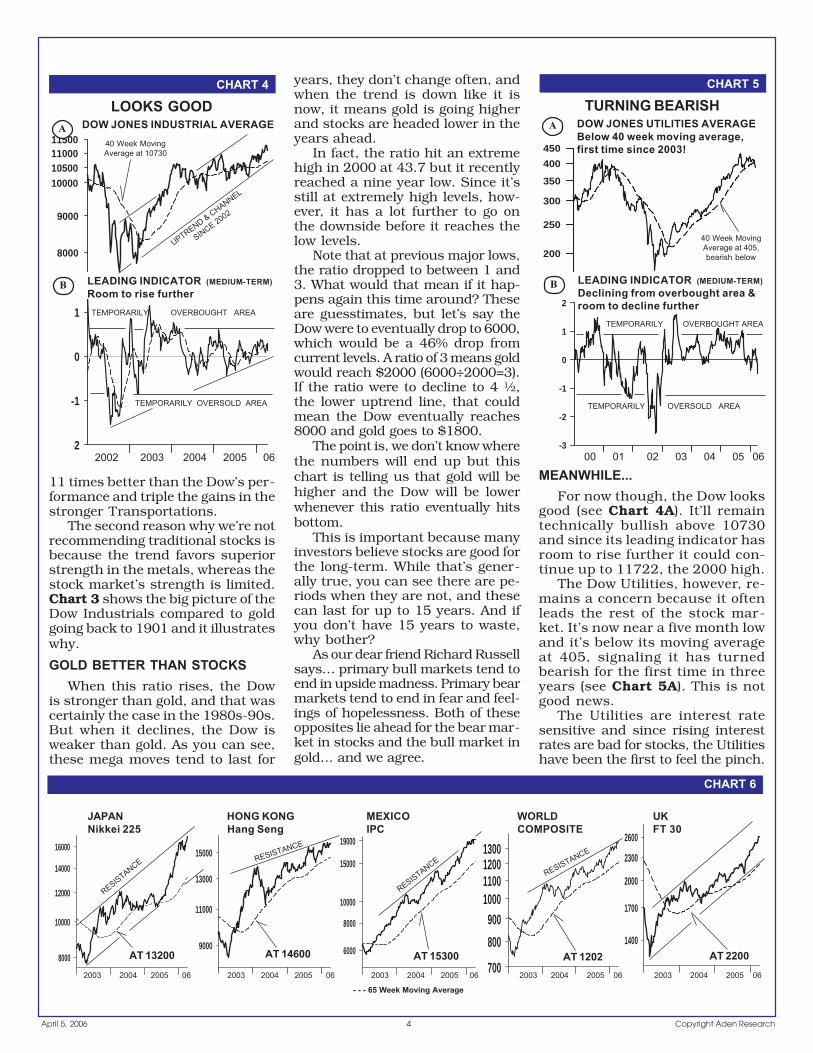
MEANWHILE...For now though, the Dow looks
good (see Chart 4A). It’ll remaintechnically bullish above 10730and since its leading indicator hasroom to rise further it could con-tinue up to 11722, the 2000 high.
The Dow Utilities, however, re-mains a concern because it oftenleads the rest of the stock mar-ket. It’s now near a five month lowand it’s below its moving averageat 405, signaling it has turnedbearish for the first time in threeyears (see Chart 5A). This is notgood news.
The Utilities are interest ratesensitive and since rising interestrates are bad for stocks, the Utilitieshave been the first to feel the pinch.
UPTREND & CHANNEL
SINCE 2002
TEMPORARILY OVERBOUGHT AREA
TEMPORARILY OVERSOLD AREA
RESISTANCE
AT 1202
RESISTANCE
RESISTANCE
2000
1400
1700
2300
2600
AT 2200
2003 2004 2005 06 2003 2004 2005 06 2003 2004 2005 06 2003 2004 2005 06 2003 2004 2005 06
JAPAN HONG KONG MEXICO WORLD UKNikkei 225 Hang Seng IPC COMPOSITE FT 30
RESISTANCE
5Copyright Aden Research April 5, 2006
U.S. INTEREST RATES AND BONDSBearish bonds at nearly two year low
2
4
6
3
10
7
5
12
8
14
CHART 7
30 35 40 45 50 55 60 65 70 75 80 85 90 95 00 05
30 YEAR YIELDSINCE 1930
80 Month MovingAverage at 5.24%
1932
1981
80 MONTH MA IS THEMEGA TREND IDENTIFIER
SUPPORT1960
MEGA TRENDIS DOWN...
...BUT HOLDING ATMEGA SUPPORT
%
This also reinforces what the bondmarket’s telling us and with the Utili-ties now poised to decline further,this is a warning for other stocks,despite the market’s recent strength.So caution is still warranted.
IT’S A GLOBAL THINGThat goes for the foreign stock
markets too. Even though thesemarkets have been stronger than
the U.S. market and they’ve beenattracting investors, if the U.S.market heads down, these mar-kets will too (see Chart 6).
As we’ve said many times, theinternational stock markets gen-erally move together. Some of theemerging stock markets, whichhad been the strongest, have re-cently declined significantly. Theydon’t like rising U.S. interest rates
The Fed raised interest rates forthe 15th time at Bernanke’s firstmeeting as the new Fed head. Healso indicated more rate hikes arecoming.
There’s a lot of debate whetherthis will be good or bad for theeconomy. And since the economyis showing mixed signals, there’sgood reason for this debate. Timewill tell but this rate hike pushedbond prices down, reinforcing thenew bearish trend which has so farresulted in the biggest quarterlydecline in almost two years. Wecontinue to recommend avoidingbonds as long as they are bearish
because they’re headedeven lower.
BIG PICTUREAs we’ve said before,
the only exception wouldbe for long-term bondholders who are planningto hold their bonds untilmaturity. But there’s anexception to this case too.It’s important, we’ve dis-cussed it before and itstill warrants close atten-tion. Even though ithasn’t happened yet, it could and ifit does, all bond investors wouldwant to be out of the market. Here’swhy…
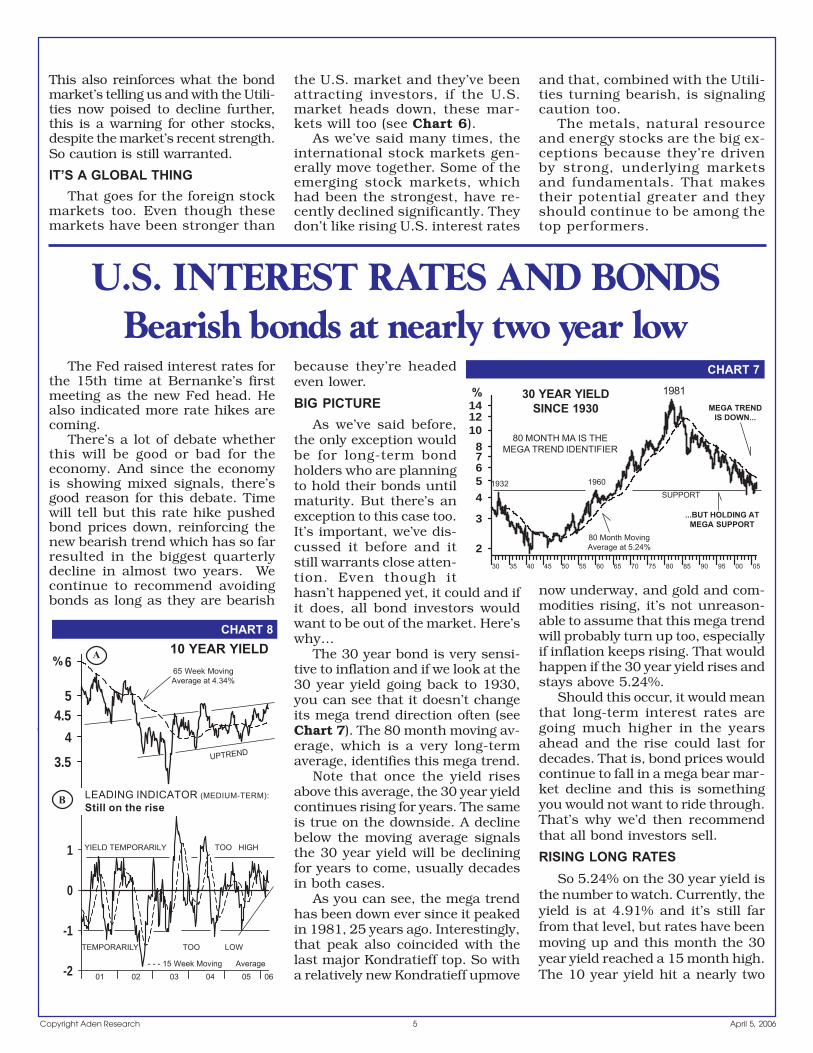
The 30 year bond is very sensi-tive to inflation and if we look at the30 year yield going back to 1930,you can see that it doesn’t changeits mega trend direction often (seeChart 7). The 80 month moving av-erage, which is a very long-termaverage, identifies this mega trend.
Note that once the yield risesabove this average, the 30 year yieldcontinues rising for years. The sameis true on the downside. A declinebelow the moving average signalsthe 30 year yield will be decliningfor years to come, usually decadesin both cases.
As you can see, the mega trendhas been down ever since it peakedin 1981, 25 years ago. Interestingly,that peak also coincided with thelast major Kondratieff top. So witha relatively new Kondratieff upmove
now underway, and gold and com-modities rising, it’s not unreason-able to assume that this mega trendwill probably turn up too, especiallyif inflation keeps rising. That wouldhappen if the 30 year yield rises andstays above 5.24%.
Should this occur, it would meanthat long-term interest rates aregoing much higher in the yearsahead and the rise could last fordecades. That is, bond prices wouldcontinue to fall in a mega bear mar-ket decline and this is somethingyou would not want to ride through.That’s why we’d then recommendthat all bond investors sell.
RISING LONG RATESSo 5.24% on the 30 year yield is
the number to watch. Currently, theyield is at 4.91% and it’s still farfrom that level, but rates have beenmoving up and this month the 30year yield reached a 15 month high.The 10 year yield hit a nearly two
4
5
6
3.5
4.5
A65 Week MovingAverage at 4.34%
CHART 8
B
-2
-1
0
1
- - - 15 Week Moving Average
TEMPORARILY TOO LOW
YIELD TEMPORARILY TOO HIGH
10 YEAR YIELD
LEADING INDICATOR (MEDIUM-TERM):Still on the rise
01 02 03 04 05 06
%
UPTREND
and that, combined with the Utili-ties turning bearish, is signalingcaution too.
The metals, natural resourceand energy stocks are the big ex-ceptions because they’re drivenby strong, underlying marketsand fundamentals. That makestheir potential greater and theyshould continue to be among thetop performers.
6 Copyright Aden ResearchApril 5, 2006
0.13
0.16
0.18
0.2
0.23
U.S. BONDS30 YEAR YIELDINVERTED TO SEE PRICEMOVEMENT
A
-0.6
-0.4
-0.2
0.0
0.2
0.4
0.6
0.8
93 95 00 05
CHART 9
B LEADING INDICATOR (LONG-TERM):Bearish below moving average
MAJOR HIGH AREA
MAJOR LOW AREA
- - - 65 WeekMoving Average
MAJOR UPTREND & CHANNEL
SINCE 1995
TRENDING DOWNRESISTANCE
1
2
3
10
5
13
7
4
CHART 10
80 85 90 95 00 05
AT MAJOR RESISTANCE%
TREASURY BILLS90 DAY
DOWNTREND SINCE 1980 AT 4.40%
- - - 65 Week MovingAverage at 3.40%
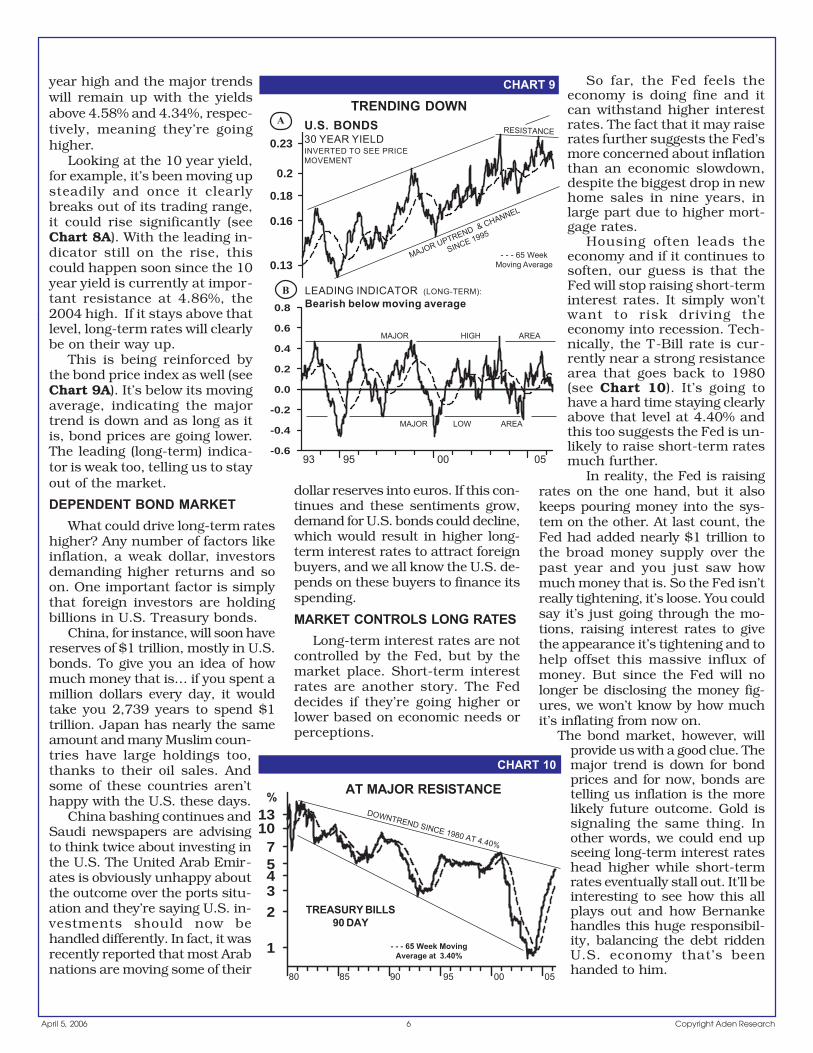
year high and the major trendswill remain up with the yieldsabove 4.58% and 4.34%, respec-tively, meaning they’re goinghigher.
Looking at the 10 year yield,for example, it’s been moving upsteadily and once it clearlybreaks out of its trading range,it could rise significantly (seeChart 8A). With the leading in-dicator still on the rise, thiscould happen soon since the 10year yield is currently at impor-tant resistance at 4.86%, the2004 high. If it stays above thatlevel, long-term rates will clearlybe on their way up.
This is being reinforced bythe bond price index as well (seeChart 9A). It’s below its movingaverage, indicating the majortrend is down and as long as itis, bond prices are going lower.The leading (long-term) indica-tor is weak too, telling us to stayout of the market.
DEPENDENT BOND MARKETWhat could drive long-term rates
higher? Any number of factors likeinflation, a weak dollar, investorsdemanding higher returns and soon. One important factor is simplythat foreign investors are holdingbillions in U.S. Treasury bonds.
China, for instance, will soon havereserves of $1 trillion, mostly in U.S.bonds. To give you an idea of howmuch money that is… if you spent amillion dollars every day, it wouldtake you 2,739 years to spend $1trillion. Japan has nearly the sameamount and many Muslim coun-tries have large holdings too,thanks to their oil sales. Andsome of these countries aren’thappy with the U.S. these days.
China bashing continues andSaudi newspapers are advisingto think twice about investing inthe U.S. The United Arab Emir-ates is obviously unhappy aboutthe outcome over the ports situ-ation and they’re saying U.S. in-vestments should now behandled differently. In fact, it wasrecently reported that most Arabnations are moving some of their
dollar reserves into euros. If this con-tinues and these sentiments grow,demand for U.S. bonds could decline,which would result in higher long-term interest rates to attract foreignbuyers, and we all know the U.S. de-pends on these buyers to finance itsspending.
MARKET CONTROLS LONG RATESLong-term interest rates are not
controlled by the Fed, but by themarket place. Short-term interestrates are another story. The Feddecides if they’re going higher orlower based on economic needs orperceptions.
So far, the Fed feels theeconomy is doing fine and itcan withstand higher interestrates. The fact that it may raiserates further suggests the Fed’smore concerned about inflationthan an economic slowdown,despite the biggest drop in newhome sales in nine years, inlarge part due to higher mort-gage rates.
Housing often leads theeconomy and if it continues tosoften, our guess is that theFed will stop raising short-terminterest rates. It simply won’twant to risk driving theeconomy into recession. Tech-nically, the T-Bill rate is cur-rently near a strong resistancearea that goes back to 1980(see Chart 10). It’s going tohave a hard time staying clearlyabove that level at 4.40% andthis too suggests the Fed is un-likely to raise short-term ratesmuch further.
In reality, the Fed is raisingrates on the one hand, but it alsokeeps pouring money into the sys-tem on the other. At last count, theFed had added nearly $1 trillion tothe broad money supply over thepast year and you just saw howmuch money that is. So the Fed isn’treally tightening, it’s loose. You couldsay it’s just going through the mo-tions, raising interest rates to givethe appearance it’s tightening and tohelp offset this massive influx ofmoney. But since the Fed will nolonger be disclosing the money fig-ures, we won’t know by how muchit’s inflating from now on.
The bond market, however, willprovide us with a good clue. Themajor trend is down for bondprices and for now, bonds aretelling us inflation is the morelikely future outcome. Gold issignaling the same thing. Inother words, we could end upseeing long-term interest rateshead higher while short-termrates eventually stall out. It’ll beinteresting to see how this allplays out and how Bernankehandles this huge responsibil-ity, balancing the debt riddenU.S. economy that’s beenhanded to him.
7Copyright Aden Research April 5, 2006
0.7
0.5
0.6
0.65
0.75
0.55
CURRENCIESU.S. dollar: Lifeless
CHART 13
0.65
0.70
0.75
0.80
0.85
0.90
1.56
1.64
1.72
1.8
1.9
0.70
0.80
0.90
.83400.0080
0.0085
0.0090
0.0095
0.60
0.70
0.80
0.75
1.8050.8960
.7950
- - - 65 Week Moving Average
.7575
CANADIAN BRITISH SWISS FRANC JAPANESE AUSTRALIAN NEW ZEALANDDOLLAR POUND YEN DOLLAR DOLLAR
2003 2004 2005 06 2003 2004 2005 06 2003 2004 2005 06 2003 2004 2005 06 2003 2004 2005 06 2003 2004 2005 06
CHART 11
% of GDP
Current account (LHS)
Net overseas assets (RHS)
82 84 86 88 90 92 94 96 98 00 02 04Source: ABN AMRO estimates, EcoWin, BEACourtesy: Overnight Report www.au.abnamro.com
U.S. current account &net overseas assets
.6960
-1.0-0.8-0.6-0.4-0.20.00.20.40.6
CHART 12
85
90
95
100
AU.S. DOLLAR INDEX
U.S.DOLLAR IN A SIDEWAYSBAND; TURNING DOWN
TEMPORARILY OVERSOLD AREA
TEMPORARILY OVERBOUGHT AREA
B LEADING INDICATOR (MEDIUM-TERM)On the decline, leading the way
2003 2004 2005 06
RESISTANCE
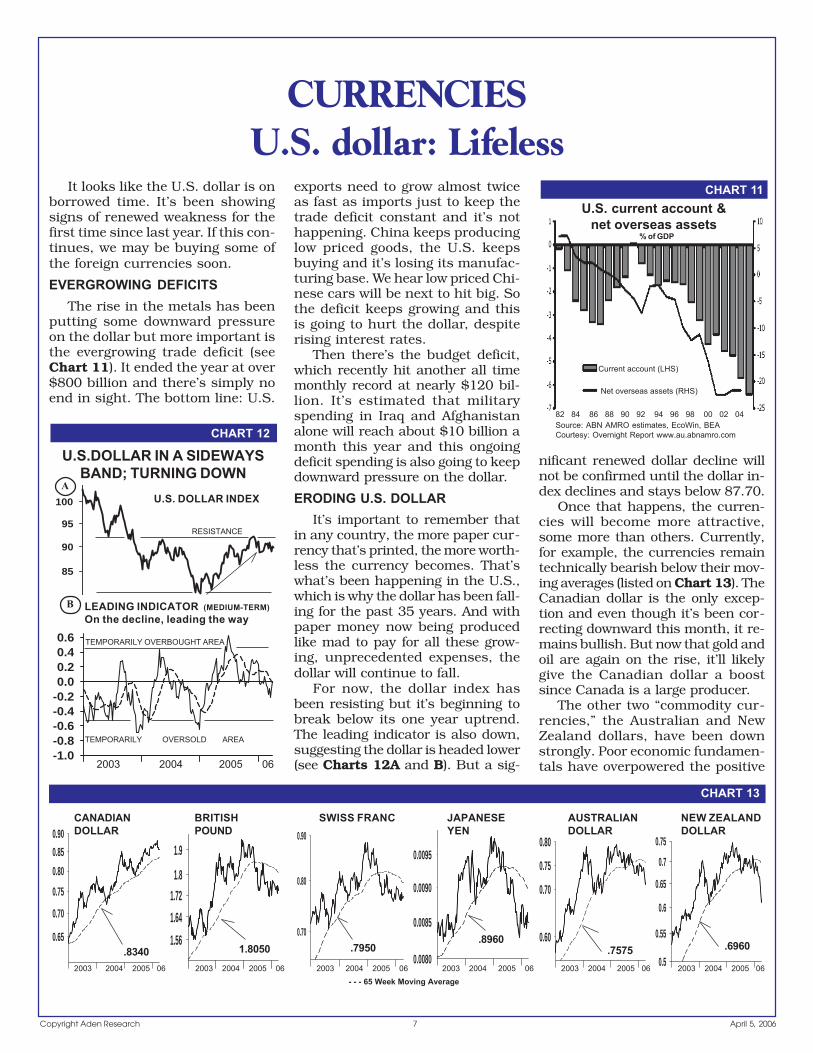
It looks like the U.S. dollar is onborrowed time. It’s been showingsigns of renewed weakness for thefirst time since last year. If this con-tinues, we may be buying some ofthe foreign currencies soon.
EVERGROWING DEFICITSThe rise in the metals has been
putting some downward pressureon the dollar but more important isthe evergrowing trade deficit (seeChart 11). It ended the year at over$800 billion and there’s simply noend in sight. The bottom line: U.S.
exports need to grow almost twiceas fast as imports just to keep thetrade deficit constant and it’s nothappening. China keeps producinglow priced goods, the U.S. keepsbuying and it’s losing its manufac-turing base. We hear low priced Chi-nese cars will be next to hit big. Sothe deficit keeps growing and thisis going to hurt the dollar, despiterising interest rates.
Then there’s the budget deficit,which recently hit another all timemonthly record at nearly $120 bil-lion. It’s estimated that militaryspending in Iraq and Afghanistanalone will reach about $10 billion amonth this year and this ongoingdeficit spending is also going to keepdownward pressure on the dollar.
ERODING U.S. DOLLARIt’s important to remember that
in any country, the more paper cur-rency that’s printed, the more worth-less the currency becomes. That’swhat’s been happening in the U.S.,which is why the dollar has been fall-ing for the past 35 years. And withpaper money now being producedlike mad to pay for all these grow-ing, unprecedented expenses, thedollar will continue to fall.
For now, the dollar index hasbeen resisting but it’s beginning tobreak below its one year uptrend.The leading indicator is also down,suggesting the dollar is headed lower(see Charts 12A and B). But a sig-
nificant renewed dollar decline willnot be confirmed until the dollar in-dex declines and stays below 87.70.
Once that happens, the curren-cies will become more attractive,some more than others. Currently,for example, the currencies remaintechnically bearish below their mov-ing averages (listed on Chart 13). TheCanadian dollar is the only excep-tion and even though it’s been cor-recting downward this month, it re-mains bullish. But now that gold andoil are again on the rise, it’ll likelygive the Canadian dollar a boostsince Canada is a large producer.
The other two “commodity cur-rencies,” the Australian and NewZealand dollars, have been downstrongly. Poor economic fundamen-tals have overpowered the positive
8 Copyright Aden ResearchApril 5, 2006
METALS, NATURAL RESOURCES & ENERGYUp, up and away
-0.5
0.0
0.5
1.0
CHART 15
0.9
1.0
1.1
1.21.3A EURO
BOTTOMING
TEMPORARILY OVERSOLD AREA
TEMPORARILY OVERBOUGHT AREA
B LEADING INDICATOR (MEDIUM-TERM)On the rise, leading euro
2001 2002 2003 2004 2005 06
- - - 65 Week MovingAverage at 1.2360UPTREND & CHANNEL SINCE 2001
- - - 15 Week Moving Average
200
300
400
600
900
500
700800
CHART 16
2
19833
19871
31996
1
3
1
24
1985
41993
42001
2
1=1980
BIG PICTURE: Gold steps on track
THIRDSTEP
SECONDSTEP
1990
FOURTHSTEP
79 80 85 90 95 00 05
Cheap moneyThe yen, real trade-weightedexchange rate, 2000=100
82 85 90 95 00 06Source: JP Morgan ChaseCourtesy: The Economistwww.economist.com
CHART 14commodity rises andthey’ve now become theweakest currencies.
YEN POTENTIALOne currency we’re
currently watching isthe Japanese yen be-cause it has good po-tential. After years ofdeflation, Japan islooking up and it’s cur-rently the fastest grow-ing rich countryeconomy. Plus, the yenis very undervalued,the most since 1982 ona real trade weightedbasis (see Chart 14). The yenwould turn bullish above .8960and if it does, we’ll probably rec-ommend buying it.
We also like the euro for upcom-ing potential (see Chart 15A). It’sbeen holding at a five year uptrend,
its leading indicatoris rising, suggestingthe euro is goinghigher, and if it risesand stays above1.2360 it’ll turn bull-ish. At that point,we’ll also likely buy.
The euro is in-creasingly becomingthe offset currencyto the U.S. dollarand it should do wellin the years ahead.But let’s see how itgoes. Until the cur-rencies rise and stay
above their moving averages,they’re still technically bearish andit’s best to wait. Once that changes,we’ll buy into the strongest ones.In the meantime, continue to keepmost of your cash in U.S. dollarssince it remains technically bullish.
But we don’t expect that to be thecase for long.
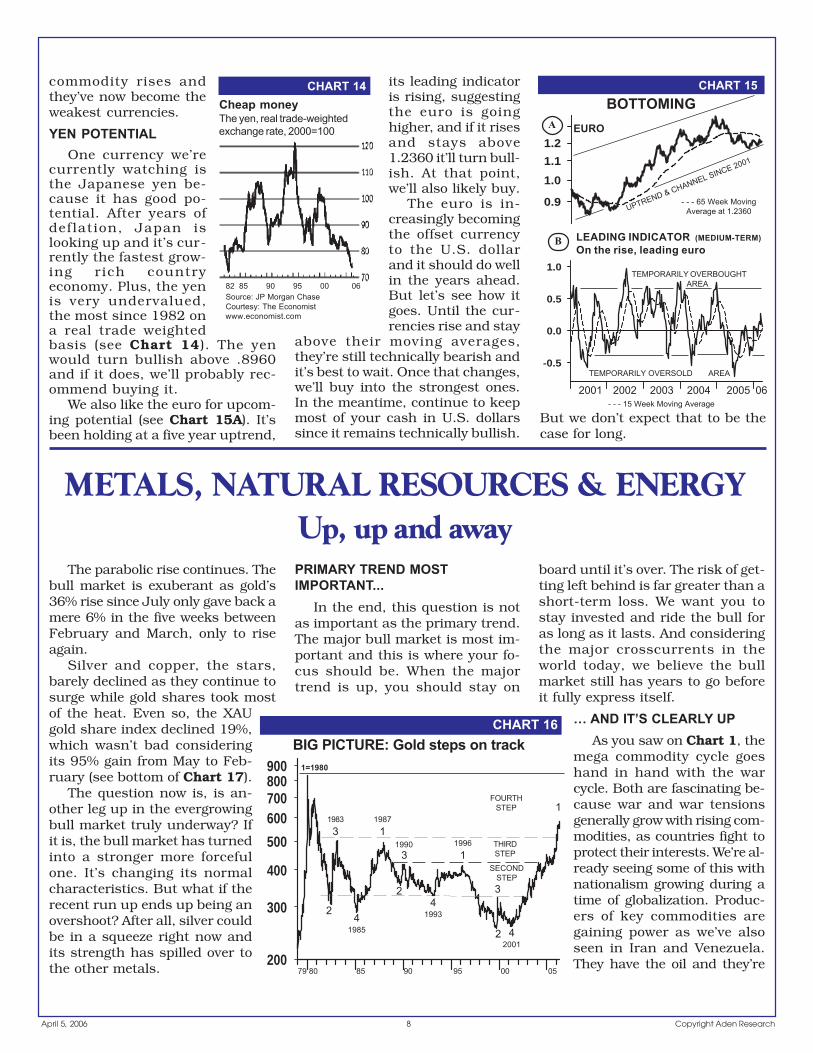
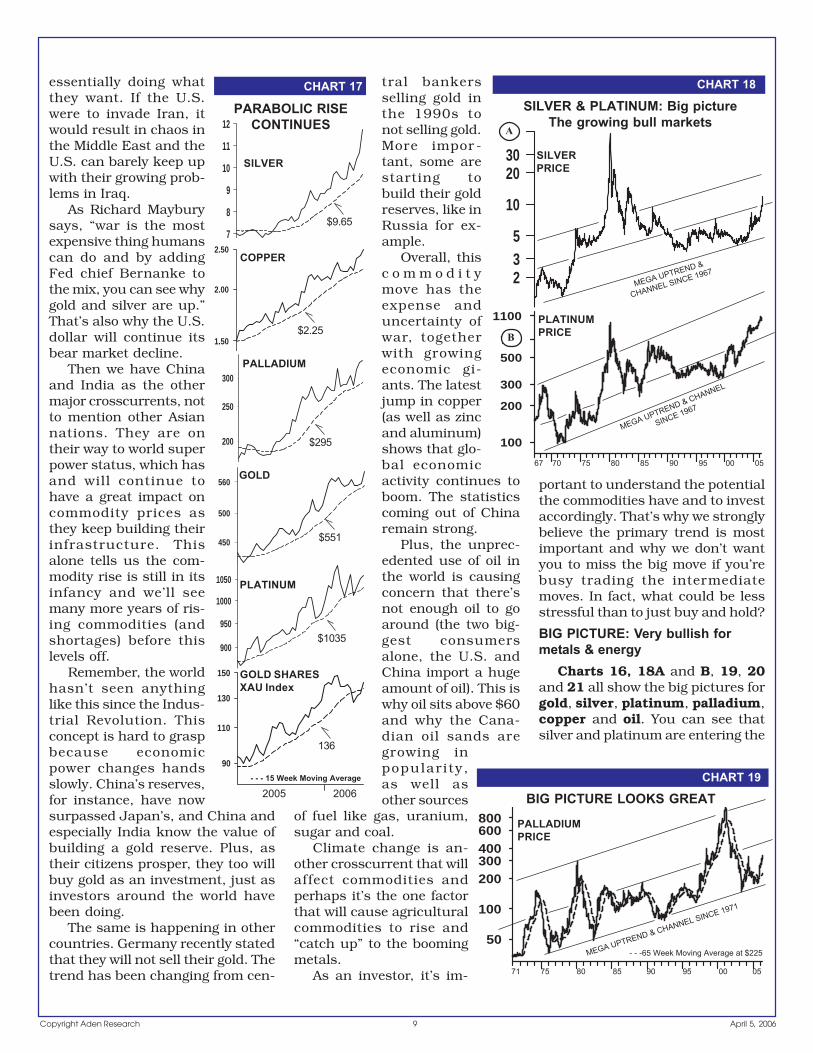
The parabolic rise continues. Thebull market is exuberant as gold’s36% rise since July only gave back amere 6% in the five weeks betweenFebruary and March, only to riseagain.
Silver and copper, the stars,barely declined as they continue tosurge while gold shares took mostof the heat. Even so, the XAUgold share index declined 19%,which wasn’t bad consideringits 95% gain from May to Feb-ruary (see bottom of Chart 17).
The question now is, is an-other leg up in the evergrowingbull market truly underway? Ifit is, the bull market has turnedinto a stronger more forcefulone. It’s changing its normalcharacteristics. But what if therecent run up ends up being anovershoot? After all, silver couldbe in a squeeze right now andits strength has spilled over tothe other metals.
PRIMARY TREND MOST ------IMPORTANT...
In the end, this question is notas important as the primary trend.The major bull market is most im-portant and this is where your fo-cus should be. When the majortrend is up, you should stay on
board until it’s over. The risk of get-ting left behind is far greater than ashort-term loss. We want you tostay invested and ride the bull foras long as it lasts. And consideringthe major crosscurrents in theworld today, we believe the bullmarket still has years to go beforeit fully express itself.
… AND IT’S CLEARLY UPAs you saw on Chart 1, the
mega commodity cycle goeshand in hand with the warcycle. Both are fascinating be-cause war and war tensionsgenerally grow with rising com-modities, as countries fight toprotect their interests. We’re al-ready seeing some of this withnationalism growing during atime of globalization. Produc-ers of key commodities aregaining power as we’ve alsoseen in Iran and Venezuela.They have the oil and they’re
9Copyright Aden Research April 5, 2006
235
10
203050
CHART 18
SILVER & PLATINUM: Big pictureThe growing bull markets
SILVERPRICE
100
200
300
500
700
1100
67 70 75 80 85 90 95 00 05
PLATINUMPRICE
MEGA UPTREND &
CHANNEL SINCE 1967
MEGA UPTREND & CHANNEL
SINCE 1967
500
450
560
300
200
250
2.50
2.00
1.50
CHART 17
7
8
9
11
12
10
PARABOLIC RISECONTINUES
900
1000
950
1050
90
110
130
150
SILVER
GOLD
PALLADIUM
COPPER
PLATINUM
2005 2006
GOLD SHARESXAU Index
400600800
300
100
50
200
71 75 80 85 90 95 00 05
CHART 19
BIG PICTURE LOOKS GREAT
- - -65 Week Moving Average at $225
PALLADIUMPRICE
MEGA UPTREND & CHANNEL SINCE 1971
essentially doing whatthey want. If the U.S.were to invade Iran, itwould result in chaos inthe Middle East and theU.S. can barely keep upwith their growing prob-lems in Iraq.
As Richard Mayburysays, “war is the mostexpensive thing humanscan do and by addingFed chief Bernanke tothe mix, you can see whygold and silver are up.”That’s also why the U.S.dollar will continue itsbear market decline.
Then we have Chinaand India as the othermajor crosscurrents, notto mention other Asiannations. They are ontheir way to world superpower status, which hasand will continue tohave a great impact oncommodity prices asthey keep building theirinfrastructure. Thisalone tells us the com-modity rise is still in itsinfancy and we’ll seemany more years of ris-ing commodities (andshortages) before thislevels off.
Remember, the worldhasn’t seen anythinglike this since the Indus-trial Revolution. Thisconcept is hard to graspbecause economicpower changes handsslowly. China’s reserves,for instance, have nowsurpassed Japan’s, and China andespecially India know the value ofbuilding a gold reserve. Plus, astheir citizens prosper, they too willbuy gold as an investment, just asinvestors around the world havebeen doing.
The same is happening in othercountries. Germany recently statedthat they will not sell their gold. Thetrend has been changing from cen-
tral bankersselling gold inthe 1990s tonot selling gold.More impor -tant, some arestarting tobuild their goldreserves, like inRussia for ex-ample.
Overall, thisc o m m o d i t ymove has theexpense anduncertainty ofwar, togetherwith growingeconomic gi-ants. The latestjump in copper(as well as zincand aluminum)shows that glo-bal economicactivity continues toboom. The statisticscoming out of Chinaremain strong.
Plus, the unprec-edented use of oil inthe world is causingconcern that there’snot enough oil to goaround (the two big-gest consumersalone, the U.S. andChina import a hugeamount of oil). This iswhy oil sits above $60and why the Cana-dian oil sands aregrowing inpopularity,as well asother sources
of fuel like gas, uranium,sugar and coal.
Climate change is an-other crosscurrent that willaffect commodities andperhaps it’s the one factorthat will cause agriculturalcommodities to rise and“catch up” to the boomingmetals.
As an investor, it’s im-
portant to understand the potentialthe commodities have and to investaccordingly. That’s why we stronglybelieve the primary trend is mostimportant and why we don’t wantyou to miss the big move if you’rebusy trading the intermediatemoves. In fact, what could be lessstressful than to just buy and hold?
BIG PICTURE: Very bullish formetals & energy
Charts 16, 18A and B, 19, 20and 21 all show the big pictures forgold, silver, platinum, palladium,copper and oil. You can see thatsilver and platinum are entering the
- - - 15 Week Moving Average
$9.65
$2.25
$295
$551
$1035
136
A
B

10 Copyright Aden ResearchApril 5, 2006
80
100
250
200
150
78 80 85 90 95 00 05
CHART 20
BIG PICTURE SUPER STRONG
COPPERPRICE
GOLD IN U.S. DOLLARSadjusted for inflation by CPI all
items 1969-2006
thechartstore.com
SUPER STRONG AREA
1980
1988
2170.89
1974747.52
19831033.59 1987
860.49
358.28
607.88532.83
179.44
451.23
1993556.58
287.492001
MAR 06584.00
2400
2200
2000
1800
1600
1400
1200
1000
800
600
400
200
069 71 73 75 77 79 81 83 85 87 89 91 93 95 97 99 01 02 05
CHART 22
10
20
5
40
80
3
146 50 60 70 80 90 00 05
CHART 21
CRUDE OILSINCE 1946
strong side of their megaupchannels, while palladium is justgetting started, yet copper is at itstop side (see Charts 18A and B, 19and 20). So some of the metals haveled, some have lagged, but they’reall showing great strength.
Gold entered its fourth step ofthe current bull market last Decem-ber when it punched above $500(see Chart 16). Gold’s been show-ing exceptional strength since thenbecause it has not gone back to test$500 again. This means the fourthstep is alive and well. Gold is strongin the bull market above $500 and
its next big stop is to test the 1980highs. When this will happen is an-other story. This just says the po-tential is there. Looking at gold ad-justed for inflation on Chart 22,however, you can see that gold hasstill a long way to rise. It’s essen-tially still forming a base.
The oil price on Chart 21 is fas-cinating. As you can see, it’s beenin a massive upchannel since 1946!And oil is now in the upper sideof the channel. Technically, thismeans $80 oil will eventually bereached, the top of the megachannel. If oil overshoots it likeit did in 1980, then $100+ oil ispossible.
Oil is strong above $63 andit would be very strong above$68.50. If oil closes at a newrecord high above $69.80, theseupside targets could be attained.We’ve been recommending newenergy positions this pastmonth. They look great and oil’s
major support is at $58.10.
GOLD’S INTERMEDIATEMOVES
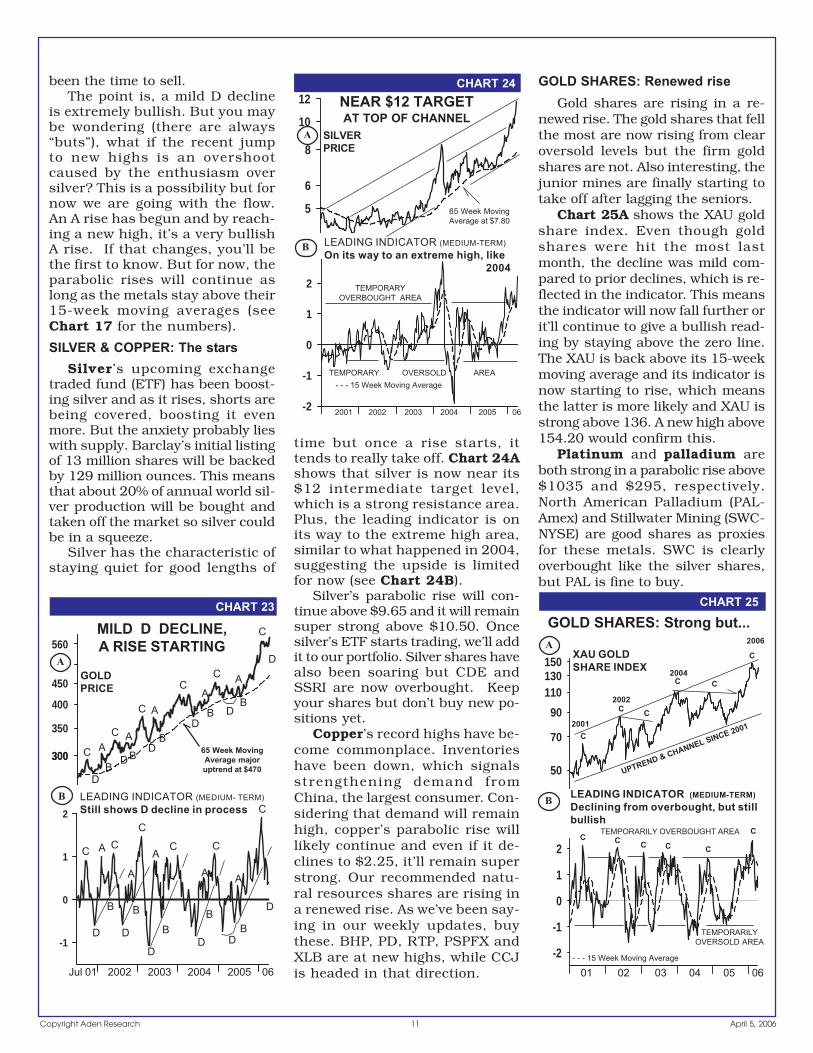
Gold’s mega uptrendhas power. Granted, the in-termediate rises (legs up)are what make the bullmarket and intermediatedeclines are basically in-significant when comparedto the major trend. Theirbest use is for buying newpositions (see Chart 23A).
Many of our subscriberswant us to tell them when an inter-mediate top or bottom is at hand,
which we try to do, but attimes it isn’t clear. As thebull market heats up, sofar the rises have beenstronger and the declineshave been milder. For ex-ample, the peak last Feb-ruary was fairly clear butthe mild decline lastmonth was the first in thisbull market. Since 2001,all the D declines havebeen sharp until now.
What does this mean?The strong C rise that
ended in February was by far thebest in this bull market and the Ddecline was the mildest. This meansthe bull market is getting stronger,its parabolic rise since last July hastaken over and as long as gold staysabove its 15-week moving average,now at $551, this will continue.
On the face of it, that is what themarket action is saying. Keep inmind, the A through D pattern ongold is a guide. In a bull market,
the C rises reach new bull markethighs and the D decline lows arehigher than the previous low, whilegold stays above its 65-week mov-ing average. This is the basic prin-cipal of a bull market. When A risesalso reach new highs and the D de-clines are moderate, then the bullmarket is heating up. Gold’s recentnew high is telling us this and wehave to go with it, even though theleading indicator has not yet con-firmed this new A rise (see Chart23B).
This illustrates how a heatingbull market can leave you behind ifyou wait for a steeper decline to buynew positions. To give you an ex-ample, back in 1979, gold had beenrising for a couple of years (since1976) and the As and Cs werereaching new highs leading up to1979. The two D declines in 1979were mild while gold was reachingthese highs. Toward the end of1979, gold’s D decline was so mildthat the indicator started shootingup to its famous 1980 peak when itwas still near a high area. The D
decline didn’t break down in itsnormal fashion and if you hadwaited for a steeper decline atthe time, you would’ve been leftbehind in the most spectacu-lar rise of gold’s bull market.
It wasn’t until gold’s secondpeak in 1980, when that C risefailed to reach a new high forthe first time since 1976… thefirst sign of THE peak at thetime. Gold then turned bearishbefore 1980 was over as asharper D decline caused goldto break below its 65-weekmoving average. That would’ve
- - - 65 Week Moving Average
1980
1999
1947 1973
THE LONG ROAD UP
MEGA UPTREND
& CHANNEL
IMPRESSIVE RISE!
11Copyright Aden Research April 5, 2006
-2
-1
0
1
2
CHART 25
50
70
90
110130150
XAU GOLDSHARE INDEX
GOLD SHARES: Strong but...
TEMPORARILYOVERSOLD AREA
TEMPORARILY OVERBOUGHT AREA
B LEADING INDICATOR (MEDIUM-TERM)Declining from overbought, but stillbullish
C
C C
C C
C
2004
UPTREND & CHANNEL SINCE 2001
2002
C
A 2006
C
CC
C C
01 02 03 04 05 06
2001
- - - 15 Week Moving Average
400
500
300300
450
560
350
GOLDPRICE
A
-1
0
1
2
LEADING INDICATOR (MEDIUM- TERM)Still shows D decline in process
B
Jul 01 2002 2003 2004 2005 06
65 Week MovingAverage majoruptrend at $470
CHART 23
MILD D DECLINE,A RISE STARTING
A
A
A
A
A
A
A
B
BB
B
B B BB
C
C
C
CC
C CC
C C
D
DD
D
DD
DD
D
D
A
A
B
B
C
C
A
D
D
5
6
10
8
12 NEAR $12 TARGETAT TOP OF CHANNEL
65 Week MovingAverage at $7.80
CHART 24
SILVERPRICE
-2
-1
0
1
2
LEADING INDICATOR (MEDIUM-TERM)On its way to an extreme high, like
2004
B
TEMPORARYOVERBOUGHT AREA
TEMPORARY OVERSOLD AREA- - - 15 Week Moving Average
A
2001 2002 2003 2004 2005 06
been the time to sell.The point is, a mild D decline
is extremely bullish. But you maybe wondering (there are always“buts”), what if the recent jumpto new highs is an overshootcaused by the enthusiasm oversilver? This is a possibility but fornow we are going with the flow.An A rise has begun and by reach-ing a new high, it’s a very bullishA rise. If that changes, you’ll bethe first to know. But for now, theparabolic rises will continue aslong as the metals stay above their15-week moving averages (seeChart 17 for the numbers).
SILVER & COPPER: The starsSilver’s upcoming exchange
traded fund (ETF) has been boost-ing silver and as it rises, shorts arebeing covered, boosting it evenmore. But the anxiety probably lieswith supply. Barclay’s initial listingof 13 million shares will be backedby 129 million ounces. This meansthat about 20% of annual world sil-ver production will be bought andtaken off the market so silver couldbe in a squeeze.
Silver has the characteristic ofstaying quiet for good lengths of
time but once a rise starts, ittends to really take off. Chart 24Ashows that silver is now near its$12 intermediate target level,which is a strong resistance area.Plus, the leading indicator is onits way to the extreme high area,similar to what happened in 2004,suggesting the upside is limitedfor now (see Chart 24B).
Silver’s parabolic rise will con-tinue above $9.65 and it will remainsuper strong above $10.50. Oncesilver’s ETF starts trading, we’ll addit to our portfolio. Silver shares havealso been soaring but CDE andSSRI are now overbought. Keepyour shares but don’t buy new po-sitions yet.
Copper’s record highs have be-come commonplace. Inventorieshave been down, which signalsstrengthening demand fromChina, the largest consumer. Con-sidering that demand will remainhigh, copper’s parabolic rise willlikely continue and even if it de-clines to $2.25, it’ll remain superstrong. Our recommended natu-ral resources shares are rising ina renewed rise. As we’ve been say-ing in our weekly updates, buythese. BHP, PD, RTP, PSPFX andXLB are at new highs, while CCJis headed in that direction.
GOLD SHARES: Renewed riseGold shares are rising in a re-
newed rise. The gold shares that fellthe most are now rising from clearoversold levels but the firm goldshares are not. Also interesting, thejunior mines are finally starting totake off after lagging the seniors.
Chart 25A shows the XAU goldshare index. Even though goldshares were hit the most lastmonth, the decline was mild com-pared to prior declines, which is re-flected in the indicator. This meansthe indicator will now fall further orit’ll continue to give a bullish read-ing by staying above the zero line.The XAU is back above its 15-weekmoving average and its indicator isnow starting to rise, which meansthe latter is more likely and XAU isstrong above 136. A new high above154.20 would confirm this.
Platinum and palladium areboth strong in a parabolic rise above$1035 and $295, respectively.North American Palladium (PAL-Amex) and Stillwater Mining (SWC-NYSE) are good shares as proxiesfor these metals. SWC is clearlyoverbought like the silver shares,but PAL is fine to buy.
12 Copyright Aden ResearchApril 5, 2006
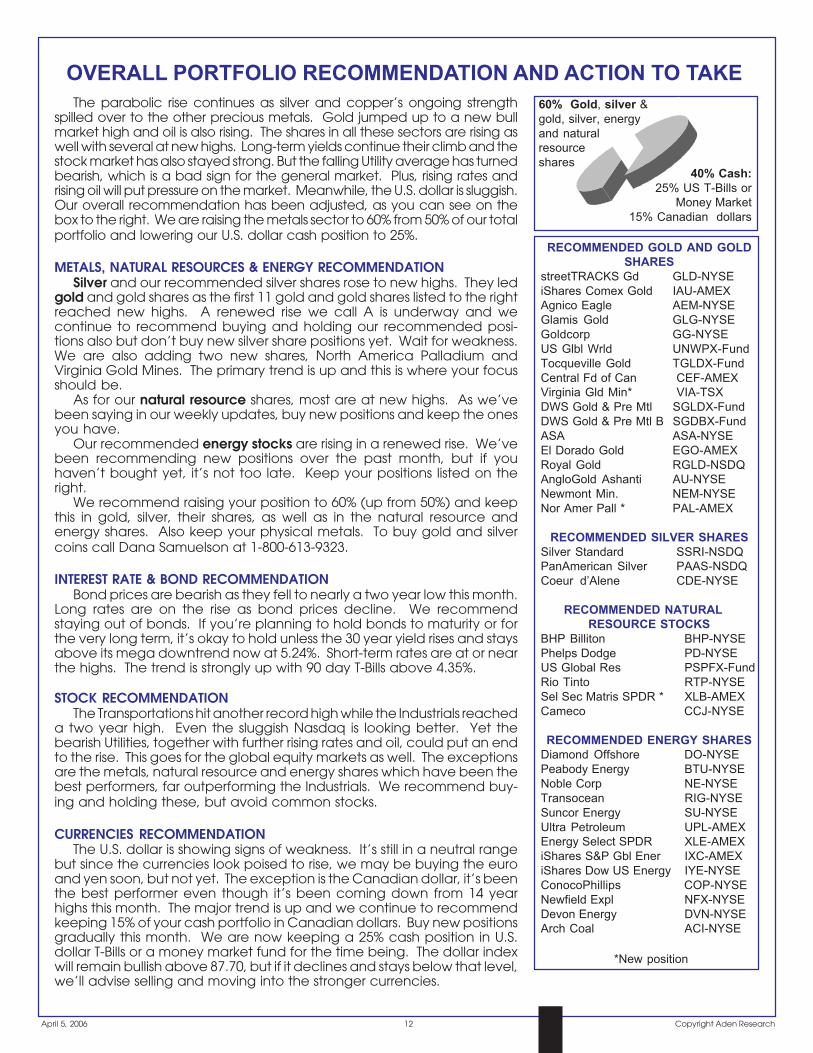
OVERALL PORTFOLIO RECOMMENDATION AND ACTION TO TAKEThe parabolic rise continues as silver and copper’s ongoing strength
spilled over to the other precious metals. Gold jumped up to a new bullmarket high and oil is also rising. The shares in all these sectors are rising aswell with several at new highs. Long-term yields continue their climb and thestock market has also stayed strong. But the falling Utility average has turnedbearish, which is a bad sign for the general market. Plus, rising rates andrising oil will put pressure on the market. Meanwhile, the U.S. dollar is sluggish.Our overall recommendation has been adjusted, as you can see on thebox to the right. We are raising the metals sector to 60% from 50% of our totalportfolio and lowering our U.S. dollar cash position to 25%.
METALS, NATURAL RESOURCES & ENERGY RECOMMENDATIONSilver and our recommended silver shares rose to new highs. They led
gold and gold shares as the first 11 gold and gold shares listed to the rightreached new highs. A renewed rise we call A is underway and wecontinue to recommend buying and holding our recommended posi-tions also but don’t buy new silver share positions yet. Wait for weakness.We are also adding two new shares, North America Palladium andVirginia Gold Mines. The primary trend is up and this is where your focusshould be.
As for our natural resource shares, most are at new highs. As we’vebeen saying in our weekly updates, buy new positions and keep the onesyou have.
Our recommended energy stocks are rising in a renewed rise. We’vebeen recommending new positions over the past month, but if youhaven’t bought yet, it’s not too late. Keep your positions listed on theright.
We recommend raising your position to 60% (up from 50%) and keepthis in gold, silver, their shares, as well as in the natural resource andenergy shares. Also keep your physical metals. To buy gold and silvercoins call Dana Samuelson at 1-800-613-9323.
INTEREST RATE & BOND RECOMMENDATIONBond prices are bearish as they fell to nearly a two year low this month.
Long rates are on the rise as bond prices decline. We recommendstaying out of bonds. If you’re planning to hold bonds to maturity or forthe very long term, it’s okay to hold unless the 30 year yield rises and staysabove its mega downtrend now at 5.24%. Short-term rates are at or nearthe highs. The trend is strongly up with 90 day T-Bills above 4.35%.
STOCK RECOMMENDATIONThe Transportations hit another record high while the Industrials reached
a two year high. Even the sluggish Nasdaq is looking better. Yet thebearish Utilities, together with further rising rates and oil, could put an endto the rise. This goes for the global equity markets as well. The exceptionsare the metals, natural resource and energy shares which have been thebest performers, far outperforming the Industrials. We recommend buy-ing and holding these, but avoid common stocks.
CURRENCIES RECOMMENDATIONThe U.S. dollar is showing signs of weakness. It’s still in a neutral range
but since the currencies look poised to rise, we may be buying the euroand yen soon, but not yet. The exception is the Canadian dollar, it’s beenthe best performer even though it’s been coming down from 14 yearhighs this month. The major trend is up and we continue to recommendkeeping 15% of your cash portfolio in Canadian dollars. Buy new positionsgradually this month. We are now keeping a 25% cash position in U.S.dollar T-Bills or a money market fund for the time being. The dollar indexwill remain bullish above 87.70, but if it declines and stays below that level,we’ll advise selling and moving into the stronger currencies.
RECOMMENDED GOLD AND GOLDSHARES
streetTRACKS Gd GLD-NYSEiShares Comex Gold IAU-AMEXAgnico Eagle AEM-NYSEGlamis Gold GLG-NYSEGoldcorp GG-NYSEUS Glbl Wrld UNWPX-FundTocqueville Gold TGLDX-FundCentral Fd of Can CEF-AMEXVirginia Gld Min* VIA-TSXDWS Gold & Pre Mtl SGLDX-FundDWS Gold & Pre Mtl B SGDBX-FundASA ASA-NYSEEl Dorado Gold EGO-AMEXRoyal Gold RGLD-NSDQAngloGold Ashanti AU-NYSENewmont Min. NEM-NYSENor Amer Pall * PAL-AMEX
RECOMMENDED SILVER SHARESSilver Standard SSRI-NSDQPanAmerican Silver PAAS-NSDQCoeur d’Alene CDE-NYSE
RECOMMENDED NATURAL --RESOURCE STOCKS
BHP Billiton BHP-NYSEPhelps Dodge PD-NYSEUS Global Res PSPFX-FundRio Tinto RTP-NYSESel Sec Matris SPDR * XLB-AMEXCameco CCJ-NYSE
RECOMMENDED ENERGY SHARESDiamond Offshore DO-NYSEPeabody Energy BTU-NYSENoble Corp NE-NYSETransocean RIG-NYSESuncor Energy SU-NYSEUltra Petroleum UPL-AMEXEnergy Select SPDR XLE-AMEXiShares S&P Gbl Ener IXC-AMEXiShares Dow US Energy IYE-NYSEConocoPhillips COP-NYSENewfield Expl NFX-NYSEDevon Energy DVN-NYSEArch Coal ACI-NYSE
40% Cash:25% US T-Bills or
Money Market15% Canadian dollars
60% Gold, silver &gold, silver, energyand naturalresourceshares
*New position