adelaide brighton cement - acoustic consultancy · adelaide brighton cement - acoustic consultancy...
TRANSCRIPT

Adelaide Brighton Cement - Acoustic Consultancy
Ground Vibration Monitoring Survey
Report Date: Tuesday, 12 July 16
Reference: A15623RP3, Revision C

Adelaide Brighton Cement Ground Vibration Monitoring Survey A15623RP3 Revision C
Document Information
Project Adelaide Brighton Cement - Acoustic Consultancy
Client Adelaide Brighton Cement
Report title Ground Vibration Monitoring Survey
Project Number A15623
Author Andrew Leonard
Senior Acoustic Engineer
p+61 8 8155 5888
m+61 415 742 328
Reviewed by Darren Jurevicius
Revision Table
Report revision Date Comments
0 10 June 2016 Initial release
A 23 June 2016 Clarifications and additional
graphs
B 1 July 2016 Graph title changes
C 12 July 2016 Revised post correspondence
with EPA

Adelaide Brighton Cement Ground Vibration Monitoring Survey A15623RP3 Revision C
Executive Summary Ground vibration monitoring was undertaken in and around the Adelaide Brighton Cement (ABC)
Birkenhead plant whilst the plant was fully operational and whilst plant was shut down to determine the
impact and extent of ground vibrations caused by the plant (if any). Monitoring was undertaken from the 7th
March until the 4th May 2016 at four different locations for a minimum period of 1 week during both the
shut-down and fully operational plant conditions.
Measured ground-borne peak particle velocity (PPV) in and surrounding the ABC Birkenhead plant whilst
the plant was fully operational and during shut-down periods show that there is a small increase in the
background vibration level when comparing both sets of measurement data. However, these background
PPV levels are low, and vibrations from traffic on nearby roads and other activities are generally higher
than the vibrations likely attributable to ABC. Vibration levels of these transient events, such as traffic etc.
are likely to have a higher impact when they occur than the baseline vibration levels which are attributable
to ABC plant. These transient vibrations typically occur on weekdays during the day time. This indicates
that activities independent of the ABC plant have a potential to have a greater impact on nearby
residences than the plant itself. Additionally, it is likely that vibration levels within residences are lower than
the measured levels due to coupling losses between the ground and the house foundations.
Further investigation is therefore warranted within a selection of nearby residential properties to determine
the full extent and impact from vibrations in the area, especially during early morning or late evening
periods. We expect that the vibration levels within nearby residential buildings to be below whole body
vibration standards (such as AS2670), however it is recommended that this be confirmed with further
detailed investigation.

Adelaide Brighton Cement Ground Vibration Monitoring Survey A15623RP3 Revision C
Glossary Peak Particle Velocity The peak (or highest amplitude) speed a mass reaches during its vibratory
(PPV) cycle. Typically measured in mm/s.
RMS Meaning root mean square is the square root of the arithmetic mean of the
squares of a set of numbers. Typically, this gives an average value for
energy of vibrations which oscillate in both a positive and negative direction
(where a standard arithmetic average will give a result of zero, or near
zero).
Frequency (Hz) The number of times a vibrating object oscillates (moves back and forth) in
one second. Fast movements produce high frequency sound (high
pitch/tone), but slow movements mean the frequency (pitch/tone) is low. 1
Hz is equal to 1 cycle per second.
Triaxial geophone A set of three velocity transducers arranged orthogonally from each other to
measure vibration velocity in three axes (vertical, transverse and
longitudinal)

Adelaide Brighton Cement Ground Vibration Monitoring Survey A15623RP3 Revision C
Table of Contents 1 Introduction..............................................................................................................................................1
2 Criteria.....................................................................................................................................................3
3 Instrumentation........................................................................................................................................5
4 Results ....................................................................................................................................................6
5 Conclusion.............................................................................................................................................11
Adelaide Brighton Cement Ground Vibration Monitoring Survey A15623RP3 Revision C
1 Introduction Ground vibration monitoring in and around the Adelaide Brighton Cement (ABC) Birkenhead plant whilst
the plant was fully operational and whilst plant was shut down to determine the impact and extent of
ground vibrations caused by the plant (if any).
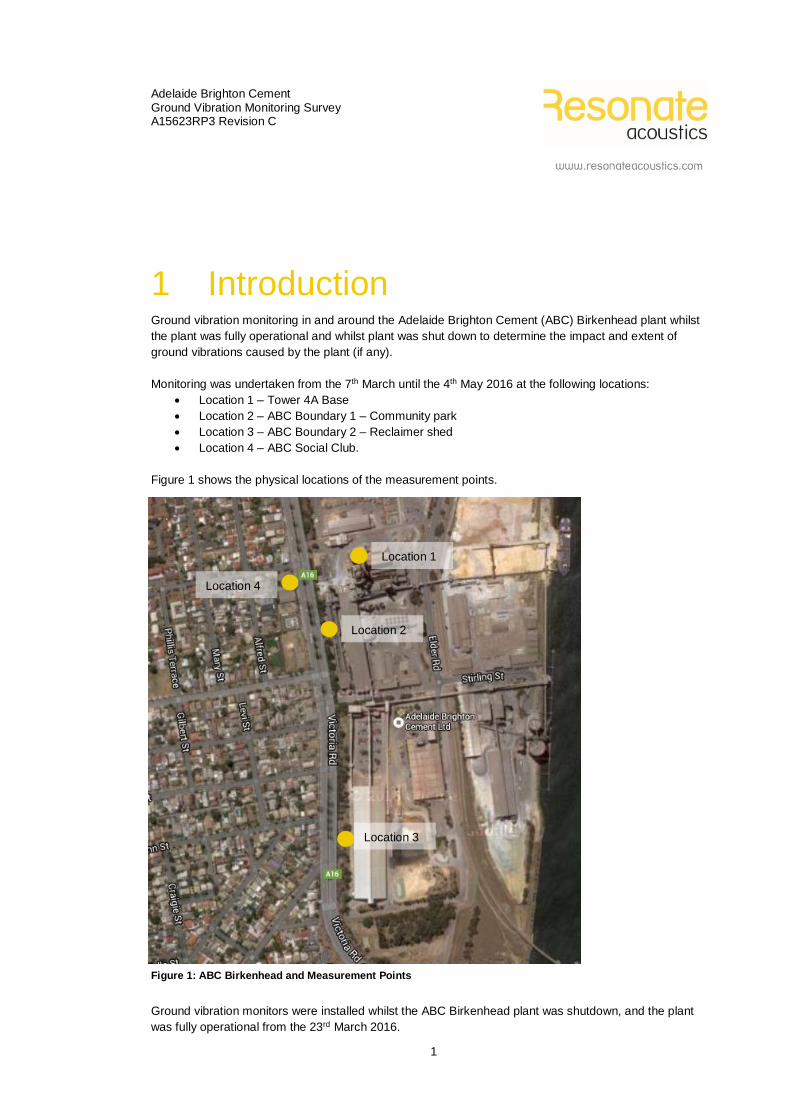
Monitoring was undertaken from the 7th March until the 4th May 2016 at the following locations:
Location 1 – Tower 4A Base
Location 2 – ABC Boundary 1 – Community park
Location 3 – ABC Boundary 2 – Reclaimer shed
Location 4 – ABC Social Club.
Figure 1 shows the physical locations of the measurement points.
Location 1
Location 2
Location 4
Location 3
Figure 1: ABC Birkenhead and Measurement Points
Ground vibration monitors were installed whilst the ABC Birkenhead plant was shutdown, and the plant
was fully operational from the 23rd March 2016.
1

Adelaide Brighton Cement Ground Vibration Monitoring Survey A15623RP3 Revision C
The triaxial geophones were installed either directly into the ground via ground spikes, or where there was
no friable ground present, the sensor was attached via beeswax, with a sandbag on top of the sensor to
ensure good coupling between the ground and the sensor.
Where the instruments were moved between shutdown and operational measurements, the sensors were
placed in the same general location (± 1m). The same instrument and sensor was used for both before
and after measurements for each location to ensure a direct comparison of data.
2

Adelaide Brighton Cement Ground Vibration Monitoring Survey A15623RP3 Revision C
2 Criteria AS2670.2-1990 outlines criteria and limits for the evaluation of human exposure to whole-body vibration
from continuous and shock-induced vibration in buildings. It gives guidelines as to thresholds of human
comfort, and if thresholds are exceeded, likely annoyance and/or complaints about vibration inducing
activities. The vibration limits are provided in both acceleration and velocity RMS levels, and vary with the
vibration frequency. Table 1 outlines these RMS Velocity vibration levels, taken from AS2670.
Table 1 RMS vibration velocity criteria for human comfort
Human comfort RMS Vibration Limits (mm/s)
Third octave band
center frequency (Hz) Z-Axis X and Y Axis
Variable orientation of
human occupants
1 1.59 0.57 0.57
1.25 1.13 0.458 0.45
1.6 0.796 0.358 0.35
2 0.557 0.287 0.28
2.5 0.401 0.287 0.23
3.15 0.288 0.287 0.195
4 0.199 0.287 0.162
5 0.159 0.287 0.136
6.3 0.126 0.287 0.116
8 0.0995 0.287 0.0995
10 0.0995 0.287 0.0995
12.5 0.0995 0.287 0.0995
16 0.0995 0.287 0.0995
20 0.0995 0.287 0.0995
25 0.0995 0.287 0.0995
31.5 0.0995 0.287 0.0995
40 0.0995 0.287 0.0995
50 0.0995 0.287 0.0995
63 0.0995 0.287 0.0995
80 0.0995 0.287 0.0995
Additionally, AS2670.2 outlines that for residential properties, these criteria are to have a multiplication
factor of 2 to 4 for residential areas in the day-time, and 1.4 during night time periods.
3

Adelaide Brighton Cement Ground Vibration Monitoring Survey A15623RP3 Revision C
The initial ground vibration survey undertaken in and around the ABC Birkenhead plant used ground
vibration logging equipment, which broadly measured peak particle velocity (PPV) with no frequency, and
not RMS velocity levels. However, a conservative estimation of the PPV from the RMS velocity is to
multiply by 1.414 (√2).
Therefore, a worst-case criterion within a residential zone at night time, will have an RMS vibration criterion
of 0.14mm/s (0.0995 x 1.4), which gives an approximate PPV criterion of 0.19mm/s (0.14 x 1.414).
4

Adelaide Brighton Cement Ground Vibration Monitoring Survey A15623RP3 Revision C
3 Instrumentation The noise measurements were taken with calibrated AvaTrace M1 Ground vibration loggers, with triaxial
geophones (velocity transducers). The installation of the measuring instrumentation is outlined in Table 2
below. Copies of the calibration certificates are available on request. Peak particle velocities were
measured in three axes (vertical, transverse and longitudinal).
Table 2: Instrument Placement Details
Location
Measurement Dates AvaTrace
Serial
number
Location 1 – Tower 4A Shutdown 16/03/2016 – 23/03/2016 8867
Base Plant Fully Operational 23/03/2016 – 11/04/2016
Location 2 – ABC
Boundary in line with
Community Park
Shutdown 7/03/2016 – 16/03/2016
8875
Plant Fully Operational 26/04/2016 – 04/05/2016
Location 3 – ABC Shutdown N/A 8875
Boundary Reclaimer Plant Fully Operational 11/04/2016 – 26/04/2016
Location 4 – ABC Social Shutdown 7/03/2016 – 23/03/2016 8875
Club Plant Fully Operational 23/03/2016 – 04/05/2016
5

Adelaide Brighton Cement Ground Vibration Monitoring Survey A15623RP3 Revision C
4 Results Where there were data for both the plant operating and whilst shut down, a histogram of the measured
data during each period has been generated. Figures 2, 3 and 4 show histograms of the measured peak
particle velocity (PPV) in the vertical axis for three measurement locations before and after the shutdown
period. We have shown the vertical axis as we consider that this is the most significant in this case.
Figure 2: Location 2 vibration level histogram during and after plant shutdown
6

Adelaide Brighton Cement Ground Vibration Monitoring Survey A15623RP3 Revision C
Figure 3: Location 4 ABC Social Club vibration level histogram during and after plant shutdown
Figure 4: 4A Location 1 Tower vibration level histogram during and after plant shutdown
7

Adelaide Brighton Cement Ground Vibration Monitoring Survey A15623RP3 Revision C
The histogram plots show that there is a general increase in the background peak particle velocity vibration
level when the plant is turned on compared to whilst it was shut down. The measurements taken at the
ABC Social club (shown in Figure 3) were also taken back-to-back, where the sensor was not moved or
measurements stopped between the plant being shut-down and fully operational.
Vibrations from the ABC plant are present and detectable within the nearby community.
The majority/mode of the measured peak particle velocities measured at the boundary and the social club
were in the order of 0.15 mm/s and 0.2 mm/s respectively, which are considered to be very low in regards
to ground-borne vibrations. We note however that for a large proportion of the time, these vibration levels
were measured during quiet night time periods. Typically, on weekdays during the day-time, vibration
levels were higher than these background levels, which are likely due to increased traffic movements along
Victoria Road, or other activities. These increased levels are both present when the plant was offline as
well as online, indicating that it is likely not due to ABC operations. See Figure 5, which outlines this
occurrence on a typical weekday during and after the shutdown. The results show that whether the plant is
shut down or running, vibration levels during the day are typically much higher than the baseline levels and
independent of plant activity. This indicates that the measured background vibration levels, which are likely
caused by the ABC plant, are much lower than other transient vibration events such as vehicle traffic on
Victoria Road, train movement and other activities. This means that activities independent of the ABC plant
have the potential to be of greater impact on nearby residences than the plant itself.
8

Adelaide Brighton Cement Ground Vibration Monitoring Survey A15623RP3 Revision C
Similar vibration levels
throughout day
regardless of shutdown
Background vibration level
comparison during (red)
and after shutdown (blue)
status
Figure 5: Vibration levels throughout typical week day at Location 4 during and after shutdown
We would expect that vibrations from the ground into residential foundations/properties would generally
experience some coupling loss, therefore the measured vibration on the ground directly is likely to be lower
than when measured within a residential building. Currently, the vibration levels measured are on the
threshold of the human comfort criterion given by AS2670.2. However, our conversion of the RMS criterion
to a PPV criterion level is conservative. Furthermore, we have also adopted the most stringent frequency
specific criterion, given that spectral measurements have not been undertaken at this stage. Therefore
from our conservative assessment approach, combined with the expected coupling losses between the
ground and building foundations (and also between furniture and building floors), we expect the vibration
levels from the ABC plant to be below the AS2670.2 guidelines.
Further detailed investigation is therefore warranted within a selection of nearby residential properties to
confirm the measured vibration levels and foundation coupling loss.
Figure 6, below shows the peak particle velocity histogram for the measurements taken at the reclaimer.
We note that measurements couldn’t be taken at the reclaimer during the shutdown period and therefore
no direct comparison can be made to determine if the measured vibrations are operational or not.
However, the majority of the measured vibration levels are at the noise floor of the measurement
instrument (0.1 mm/s) and therefore show that there is minimal vibration levels present from the plant at
this location.
9

Adelaide Brighton Cement Ground Vibration Monitoring Survey A15623RP3 Revision C
Figure 6: Reclaimer (Location 6) boundary vibration level histogram during and after plant shutdown
10

Adelaide Brighton Cement Ground Vibration Monitoring Survey A15623RP3 Revision C
5 Conclusion Measured ground-borne peak particle velocity (PPV) in and surrounding the ABC Birkenhead plant whilst
the plant was fully operational and during shut-down periods show that there is a small increase in the
background vibration level when comparing the two sets of measurement data. However, these
background PPV levels are low, and vibrations from traffic on nearby roads and other activities are
generally higher than the vibrations likely attributable to ABC. Vibration levels of these transient events,
such as traffic etc. are likely to have a higher impact when they occur than the baseline vibration levels
which are attributable to ABC plant. These transient vibrations typically occur on weekdays during the day
time.
It is concluded from this study that activities independent of the ABC plant have the potential to be of
greater impact on nearby residences than the plant itself. Additionally it is likely that vibration levels within
residences are lower than the measured levels due to coupling losses between the ground and the house
foundations. Further investigation is therefore warranted within a selection of nearby residential properties
to confirm the measured vibration levels and foundation coupling loss. However, we expect that the
vibration levels within nearby residential buildings to be below whole body vibration standards (such as
AS2670).
11