adea snapshot of dental education - college of dentistry · adea snapshot of dental education...
TRANSCRIPT

ADEASnapshotof DentalEducation
ADEASnapshotof DentalEducation
2016-2017AMERICAN DENTAL EDUCATION ASSOCIATIONadea.org/snapshot
THE VOICE OFDENTAL EDUCATION

ADEASnapshotof DentalEducation2016-2017
ADEASnapshotof DentalEducation2016-2017
IntroductionThe American Dental Education Association (ADEA)
is The Voice of Dental Education. Its members includeall 76 U.S. and Canadian dental schools, over 800 allied and
advanced dental education programs, 66 corporations and more than 20,000 individuals. The mission of ADEA is to lead
institutions and individuals in the dental education communityto address contemporary issues influencing education, research
and the delivery of oral health care for the overallhealth and safety of the public.
ADEA is committed to conducting research into contemporary
and emerging issues that are likely to impact decisions in the dental education and policy-making communities. Each year, ADEA collects data on topics of particular interest to dental school deans, program
directors, faculty, students, residents and fellows. The resultingADEA Snapshot of Dental Education presents findings on discrete
subject areas to help the ADEA membership and relatedstakeholders better understand the academic dental profession
and its role in health and health care.
The information in this report is taken from data compiled by ADEA, the American Dental Association and other sources. The
associated online resources are updated regularly and areavailable for download at: adea.org/snapshot.
ORDERSAdditional copies are available from:
American Dental Education Association 655 K Street, NW, Suite 800
Washington, DC 20001 202-289-7201
Copyright ©2016 American Dental Education Association

1
2
3
5
6
4
TABLE OF CONTENTSCarnegie ClassificationTM of U.S. Dental Schools' Parent Institutions
Total Educational Debt, 2016 Graduating Class
Where Do They Go From Here?
Gender Diversity in Dental School Faculty
Number of Applications and First-Year Enrollment for Advanced Dental Education Programs
Full-Time Faculty: Where They Come From and Where They Go
7
8
9
10
11
Graduates of Accredited Dental and Allied Dental Education Programs
First-Year Enrollment in Accredited Allied Dental Education Programs
Dental School Enrollees by Race and Ethnicity
Distribution of Dental Schools in North America
The Pathways to Licensure Are Widening: Increased Portability
ADEASnapshotof DentalEducation2016-2017
ADEASnapshotof DentalEducation2016-2017
ADEASnapshotof DentalEducation2016-2017
ADEASnapshotof DentalEducation2016-2017
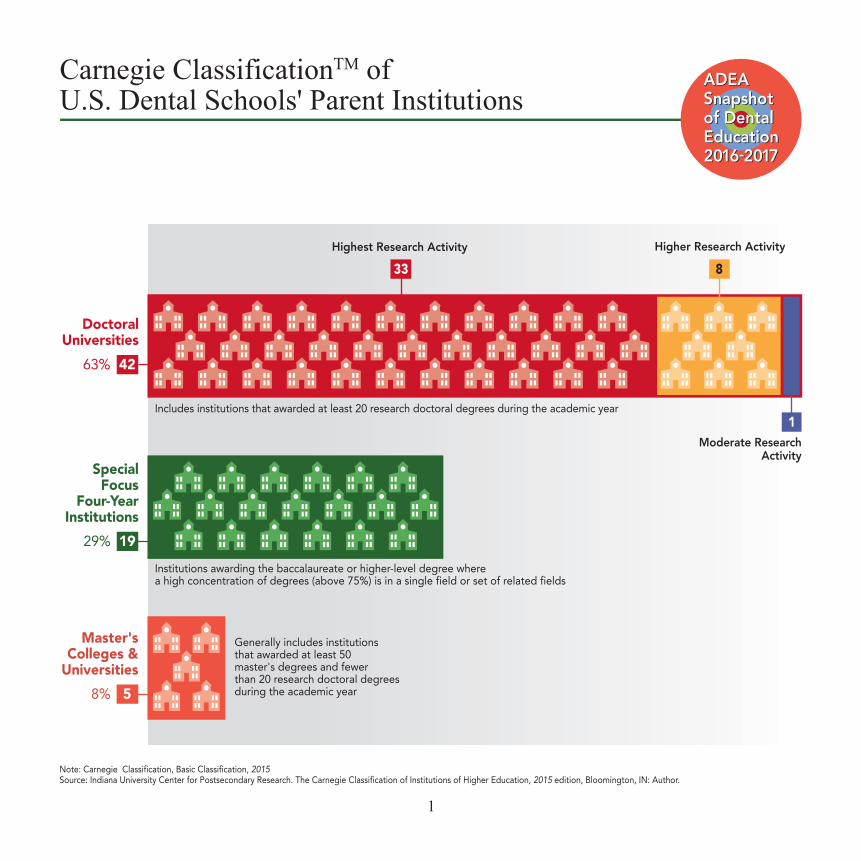
Note: Carnegie Classification, Basic Classification, 2015Source: Indiana University Center for Postsecondary Research. The Carnegie Classification of Institutions of Higher Education, 2015 edition, Bloomington, IN: Author.
Highest Research Activity
DoctoralUniversities
Includes institutions that awarded at least 20 research doctoral degrees during the academic year
Institutions awarding the baccalaureate or higher-level degree wherea high concentration of degrees (above 75%) is in a single field or set of related fields
Generally includes institutionsthat awarded at least 50master's degrees and fewerthan 20 research doctoral degreesduring the academic year
33
4263%
SpecialFocus
Four-YearInstitutions
1929%
8%
Master'sColleges &
Universities
5
8
1
Higher Research Activity
Moderate ResearchActivity
1
Carnegie ClassificationTM ofU.S. Dental Schools' Parent Institutions

Total Educational Debt, 2016 Graduating Class
16%
Average 2016Educational Debt
Students With Debt$262,119
All Students,Including Those With
No Debt$219,463
More than $300,000 $200,000 to $300,000 Less than $200,000 NO DEBT
Total educational debt is the sum of educational debt incurred before and during dental school.
2
ADEASnapshotof DentalEducation2016-2017
ADEASnapshotof DentalEducation2016-2017Sample monthly payment
$3,976
Sample monthly payment$3,289
Sample monthly payment$2,602
Assumptions for sample monthly payments: Sample payments based on amounts of $300,000, $250,000 and $200,000 on a Standard 10 year loan (120 level payments) $162,000 direct unsubsidized, remainder direct PLUS (Grad PLUS) Six-month “window” period (grace period for direct unsubsidized loans, post-enrollment deferment for direct PLUS) after graduation No voluntary or aggressive payments, and loans “held to term” (entire repayment period used) Appropriate interest rates based on academic year loans disbursed Repayment numbers run with AAMC/ADEA Dental LoanOrganizer and Calculator
Note: The repayment amounts under this basic repayment plan are not based on income, they are straight amortization schedules based solely on amount borrowed, interest rate and repayment term.There are a number of income-driven repayment plans designed to help borrowers who cannot initially afford repayment under this and other plans, and whose repayment amounts are based on income and family size.
Source: American Dental Education Association, Survey of Dental School Seniors, 2016 Graduating Class
Standard 10 year (120 level payments)
34%
28%
22%

Where Do They Go From Here?
3
Note: Percentages may not add up to 100% due to rounding.Source: American Dental Education Association, Survey of Dental School Seniors, 2016 Graduating Class
* In 2015, the question structure regarding employment in acorporate-owned group practice changed from “Select All That
Apply” to“Select Only One.” As such, results prior to 2015cannot be compared with results in 2015 and later.
Intended Primary Professional Activity for New Dental School Graduates
50.5%
33.8%
4.8%
0.7%
0.7%
0.7%
0.6%
0.5%
<0.01%
1.3%
0.9%
Percent
Private Practice Dentist
USPHSCommissioned Corps
Faculty/Staff Memberat a Dental School
Uniformed ServicesDentist
State or LocalGovernment Employee
Other Federal Service(e.g., VA)
Other Type of Student
Unsure
Other PositionRelated to Dentistry
Other PositionNot Related to Dentistry
1.9%
Dental Graduate Student/Resident/Intern
Other
Establish a newprivate practice
Employed as an independentcontractor in a private practice
Purchase an existing privatepractice as a partner
Purchase an existing privatepractice as the sole proprietor
Employed in a group practicethat has a single location 6.6%
*Employed in a corporate-owned group practice 14.5%
Employed in a group practicethat has multiple locations 16.5%
Intended professional activities and practice options, 2016 dental school graduating class
Employed as an associatedentist in an existing private
practice with a sole proprietor42%
Percent
Intended Private Practice Type for New Dental School Graduates
0.8%
4.5%
4.5%
5.0%
5.6%
Other Nonprofit Clinic
Federally QualifiedHealth Center 3.6%
ADEASnapshotof DentalEducation2016-2017
ADEASnapshotof DentalEducation2016-2017

4
*All General Dentistry includes General Practice Residency, Advanced Education in General Dentistry, Dental Anesthesiology, Oral Medicine, and Orofacial Pain.Source: American Dental Association, Health Policy Institute, 2015-16 Survey of Advanced Dental Education
Type ofProgram
Number of Programs
Number of Applications and First-Year Enrollmentfor Advanced Dental Education Programs2015-16 academic year. Application figures represent the total number of applications submitted to all programs, and counts applicants more than once if they applied to multiple programs.
2,222154
2,457181
10,716
10,748
146
17
17
132
36
96Oral andMaxillofacial
Pathology
Oral andMaxillofacial
Radiology
DentalPublic Health
Oral andMaxillofacial
Surgery
PediatricDentistry
All GeneralDentistry*
Prosthodontics
Periodontics
Endodontics
Orthodontics
10,246257
218
375
3,570
448
17,8131,947
301
67
77
101
56
57
47
15
8
16
Applications
First-Year Enrollment
ADEASnapshotof DentalEducation2016-2017
ADEASnapshotof DentalEducation2016-2017

5
Gender Diversity in Dental School Faculty
Under 30 yrs 30-39 40-49 50-59 Over 60
Total all ages - 10,541
99(67%)
49(33%)
885
(52%)
3,570 Women
(34%)
807
(48%)
899
(45%)
1,086
(55%)
6,971 Men
(66%)
Men
Women
1,489
(62%)
3,540
(82%)
3,150(63%) 67
(75%)
22(25%)
1,830(37%)
908
(38%)779
(18%)
Gender Distribution ofCurrent Full-Time Faculty
Gender Distributionof Retirees From
Full-Time Positions
Note: Faculty included are full time or part time unless otherwise indicated; voluntary faculty are not included.Source: American Dental Education Association, Survey of Dental School Faculty, 2014-15
Full-time and part-time faculty by age and gender, 2014-15 academic year
ADEASnapshotof DentalEducation2016-2017
ADEASnapshotof DentalEducation2016-2017

6
Note: Percentages may add up to more than 100% due to rounding.Source: American Dental Education Association, Survey of Dental School Faculty, 2014-15
Full-Time Faculty: Where They Come Fromand Where They Go
Percent
From Private Practice
From Another Dental School To Another Dental School
Graduating From anAdvanced
Education Program
To a Hospital or Advanced Education Program
Entering Immediately After GraduationFinished Fixed-TermAppointment
From Another Hospital
From the Uniformed Services
Other
32%
19%
Deceased
24%
14%
4%
4%
8%
Retired 29%
To Private Practice
Other
19%
5%
3%
1%
Percent
DE
NTA
L SC
HO
OLS
32%
LEAVING DENTAL SCHOOLS
9%
2014-15 academic year
ADEASnapshotof DentalEducation2016-2017
ADEASnapshotof DentalEducation2016-2017
INTO DENTAL SCHOOLS

Graduates of Accredited Dentaland Allied Dental Education Programs
7
2005 2006 2007 2008 2009 2010 2011 2012 2013 2014 20150
311301 301265 269 234 239 245 276 297
Dental Hygiene
Dental Assisting
Dentistry
GR
AD
UA
TES
Dental LaboratoryTechnology
Source: American Dental Association, Health Policy Institute, Surveys of Dental Hygiene Education Programs, Surveys of Dental Assisting Education Programs, and Surveys of Dental Laboratory Technology Education Programs, and Surveys of Dental Education.
6,126
4,478
4,5154,714 4,816 4,892
5,0205,267
5,106 5,390
5,950 5,9516,097 6,110
6,501
6,3335,773 5,755
6,2736,273
6,652 6,723 6,7777,000 6,929
7,294 7,2437,097
7,277 7,298
7,000
5,000
6,000
4,000
3,000
2,000
1,000
2005 to 2015 graduate years
5,530
245
5,467
7,323
5,811
ADEASnapshotof DentalEducation2016-2017
ADEASnapshotof DentalEducation2016-2017

First-Year Enrollment in Accredited Allied Dental Education Programs
8
Dental AssistingDental HygieneDental LaboratoryTechnology
Source: American Dental Association, Health Policy Institute, Surveys of Dental Hygiene Education Programs, Surveys of Dental Assisting Education Programs, and Surveys of Dental Laboratory Technology Education Programs.
5,891
5,419
908
1990-1991
6,1506,486
444
2000-2001
10,390
8,007
431
2010-2011
6,875
8,279
303
2015-2016
ADEASnapshotof DentalEducation2016-2017
ADEASnapshotof DentalEducation2016-2017

Note: ADEA adheres to the revised federal guidelines for collecting and reporting race and ethnicity. Nonresident alien data was not collected prior to 2011.Percentages may add up to more than 100% due to rounding. Source: American Dental Education Association, U.S. Dental School Applicants and Enrollees, 2010 and 2015 Entering Classes
9
Dental School Enrollees by Race and Ethnicity2010 and 2015 entering classes
2010 Enrollees by Race and Ethnicity 2015 Enrollees by Race and Ethnicity
FIRST-YEAR ENROLLEES 2010 4,947 FIRST-YEAR ENROLLEES 2015 5,943
3.3%DO NOT WISH
TO REPORTOR UNKNOWN
2.5%DO NOTWISH TO
REPORT ORUNKNOWN
3.8%NONRESIDENT
ALIEN
7.2%HISPANIC
OR LATINO
9.1%HISPANIC
OR LATINO
23.0%ASIAN
23.0%ASIAN
5.4%BLACK OR
AFRICANAMERICAN
5.1%BLACK OR AFRICAN
AMERICAN
58.4%WHITE
53.1%WHITE
2.4%TWO OR
MORERACES
3.1%TWO OR
MORERACES
0.2%AMERICANINDIAN ORALASKANATIVE
0.1%NATIVEHAWAIIANOR PACIFICISLANDER
0.1%NATIVEHAWAIIANOR PACIFICISLANDER
0.2%AMERICANINDIAN ORALASKA NATIVE
ADEASnapshotof DentalEducation2016-2017
ADEASnapshotof DentalEducation2016-2017

Source: American Dental Education Association, 2016
10
Canada
Puerto Rico
Public - 40Private - 22Private State-related - 4 Canada - 10
Distribution of Dental Schools in North America ADEASnapshotof DentalEducation2016-2017
ADEASnapshotof DentalEducation2016-2017

11
MI
IL IN
PA
WV VA
NC
SC
GA
FL
ALMS
LA
HI
KY
TN
MENH
VT
MA
RI
NJDE
MDDC
PR
VI
CT
NY
OH
WI
MN
ND
SD
NE
KS
IA
MO
AR
WY
MT
WA
OR
CAUT
AZNM
TX
CO
OK
AK
ID
NV
The Pathways to Licensure Are Widening:Increasing PortabilitySimilar to the climate change issue, after years if not decades of discussion but little movement, the reality of the need to address the issue of portability of initial licensure and licensure by credentials has hit.
Note: Data cited were current as of August 2016.Source: American Dental Association, Health Policy Institute.

WREB, Other exam, PGY1 optional
CDCA, CITA, WREB
12
CDCA, CITA, CRDTS, SRTA, WREB,PGY1 optional
CDCA, CITA, CRDTS, SRTA, WREB,Canadian NDEB
CDCA, CITA, CRDTS, SRTA, WREB,PGY1 optional, Canadian NDEB/OSCE
PGY1 required
CDCA, CITA
WREB
CRDTS
CRDTS, WREB
Other exam, PGY1 required
CDCA, CITA, SRTA
CDCA, CRDTS, SRTA, WREB,PGY1 optional
ADEA strongly supports continued efforts to increase the portability of licensureand to promote the adoption of alternative pathways to licensure
that eliminate the patient-based component of the traditional high-stakes licensure exam.
ADEASnapshotof DentalEducation2016-2017
ADEASnapshotof DentalEducation2016-2017
*Includes all 50 states, the District of Columbia, Puerto Rico and the U.S. Virgin Islands.
CDCA, CITA, CRDTS, SRTA, WREB,Canadian NDEB/OSCE, Other exam,PGY1 optional
CDCA, CITA, CRDTS, SRTA
CDCA, CITA, CRDTS, WREB
CDCA, CITA, SRTA, WREB
CDCA, CITA, CRDTS, SRTA, WREB
CDCA, CITA, Other exam
Dentists in our society are becoming more mobile, for both professional and personal reasons, increasing the urgency of the issue of portability of licensure.
Consider this: between 2011 and 2016, about 1 in 18 dentists moved to a different state; and about 1 in 8 dentists aged 40 and younger moved across state lines.
In recognition of these trends, more states are accepting more clinical exams and other pathways to licensure that protect the safety of the public while enabling professional mobility for dentists.
55% of the 53 different licensing agencies* accept either all clinical exams without restrictions or in conjunction with additional specified components.
17% accept at least one alternative licensure pathway (PGY-1, OSCE, or Hybrid Portfolio).

2016-2017
adea.org/snapshot
THE VOICE OFDENTAL EDUCATION
655 K Street, NW, Suite 800Washington, DC 20001
202-289-7201
ADEASnapshotof DentalEducation