addressing uncertainty in watershed management - us · pdf fileaddressing uncertainty in...
TRANSCRIPT
Addressing Uncertainty in Addressing Uncertainty in Watershed Management
Thomas E. Davenport, USEPA Region 5 Steven A Dressing Tetra Tech IncSteven A. Dressing, Tetra Tech, Inc. Donald W. Meals, Tetra Tech, Inc.
UncertaintyUncertainty A lack of compp lete knowledgg e
Prediction error resulting from limitations in data and models
I iImportant in: •Assessment •Planning•Planning •Implementation •Progress assessment g
TMDLTMDL
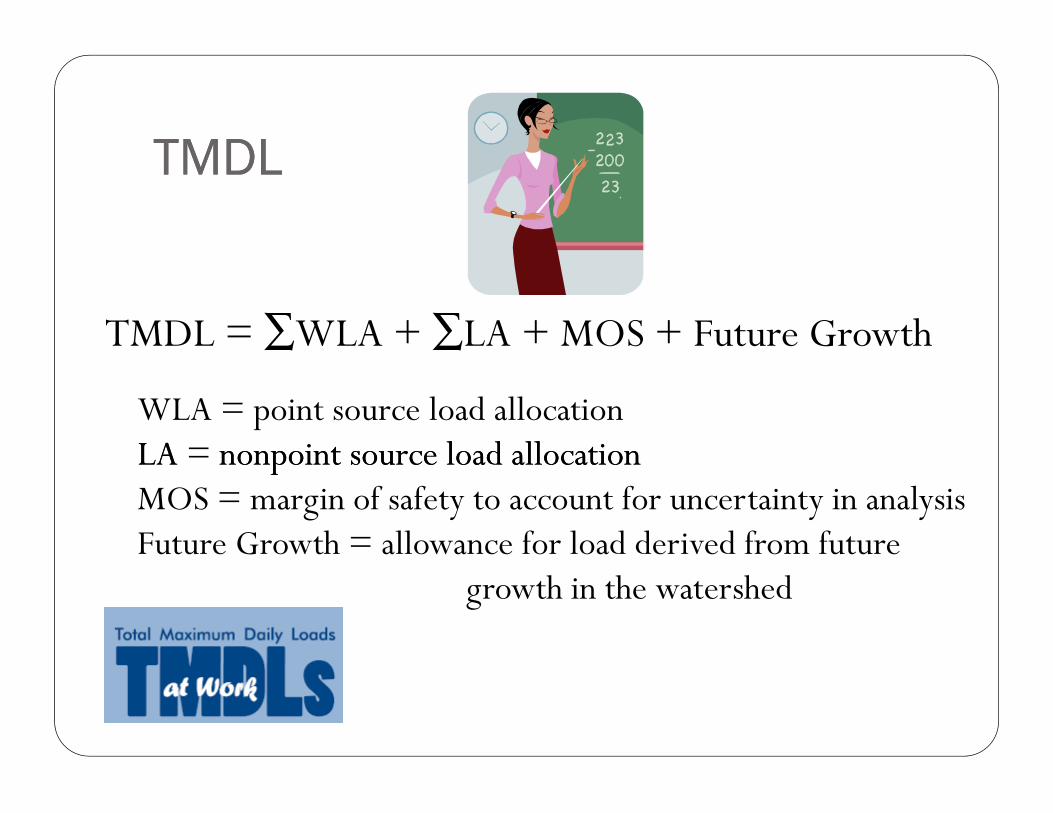
TMDL = ∑WLA + ∑LA + MOS + Future Growth
WLA = point source load allocation LA = nonpoint source load allocation LA nonpoint source load allocation MOS = margin of safety to account for uncertainty in analysis Future Growth = allowance for load derived from future
growth in the watershed
Margin of Safety (MOS)Margin of Safety (MOS) MOS is included in the TMDL to account for uncertainty
in the analysis The inclusion of an MOS term acknowledges our ignorance regarding both th e wat li di b h h er quality bl d h l i probl em and the solution to the problem
Fortunately, some uncertainty can be quantified with Fortunately some uncertainty can be quantified with reasonable success Weather pp redictions,, flow estimates,, concentrations,, loads
Unfortunately, some uncertainty cannot be quantified Land use changes, social forces, economic forces
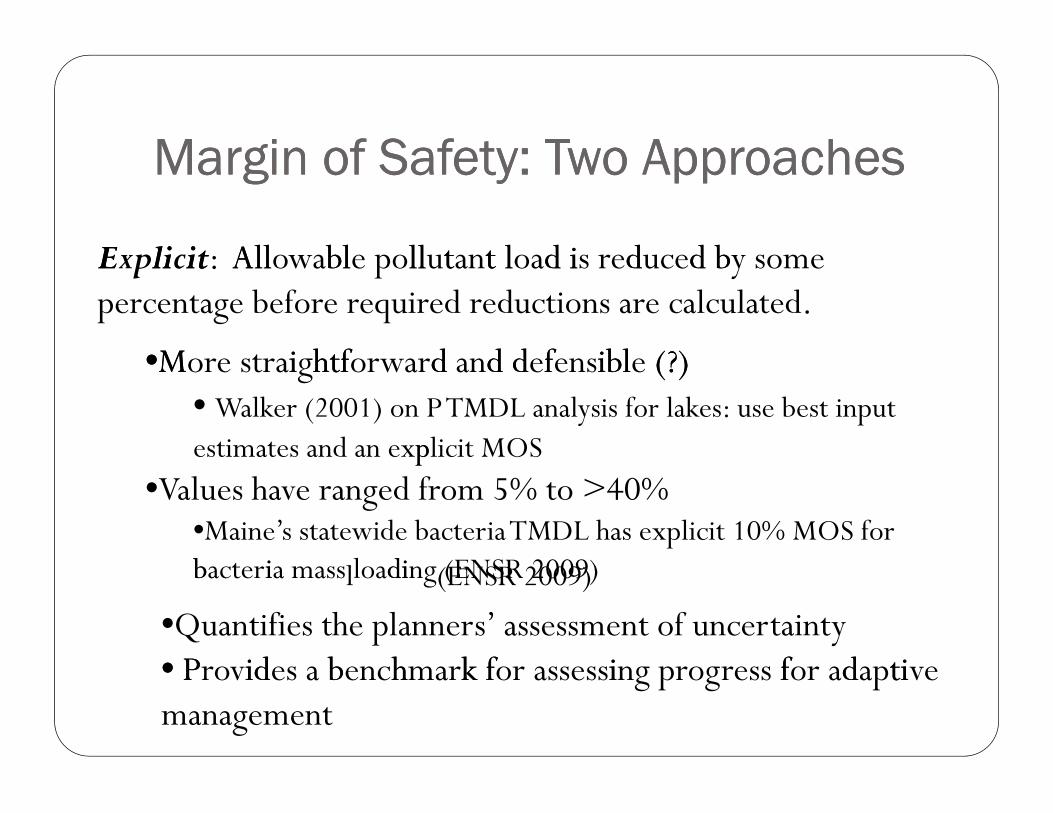
Margin of Safety: Two ApproachesMargin of Safety: Two Approaches
xp cE li ti : Allowabl e pollutant l oad i s reduced b E li it All bl ll t t l d i d d by some percentage before required reductions are calculated.
•More s raightforward d d f ibl (?) •M t i htf d and defensible (?)• Walker (2001) on P TMDL analysis for lakes: use best input estimates and an exp
•plicit MOS
Values have ranged from 5% to >40% •Maine’s statewide bacteria TMDL has explicit 10% MOS for b i bacteria massl di loading(ENSR 2009) (ENSR 2009)
•Quantifies the planner s’ assessment of uncertainty • roP vid es a bench k f i f d ti • P id b hmark for assessing progress for adaptive management
t

Margin of Safety: Two ApproachesMargin of Safety: Two Approaches
Imp cli it:C onserva ve t assump on si at b( ) i t lI li it C ti ti ( ) out tl b t pollutant reductions are made at various steps in the process.
• Common practice to incorporate one or two conservative • Common practice to incorporate one or two conservative assumptions into an implicit MOS
• Malibu Creek CA bacteria: used wet-year scenario for target loads as a “worst case” loading scenario (CRWQCB 2004) •Lower Pocomoke MD/VA bacteria: used reduced die-off rate coefficient to calculate targget loads ((MDE & VDEQQ 2009)) •Buzzards Bay MA pathogens: implicit MOS assuming no bacteria die-off or dilution in receiving waters (MA DEP 2009)
• Can be taken to extremes: too many unquantified assumptions • Can be taken to extremes: too many unquantified assumptions
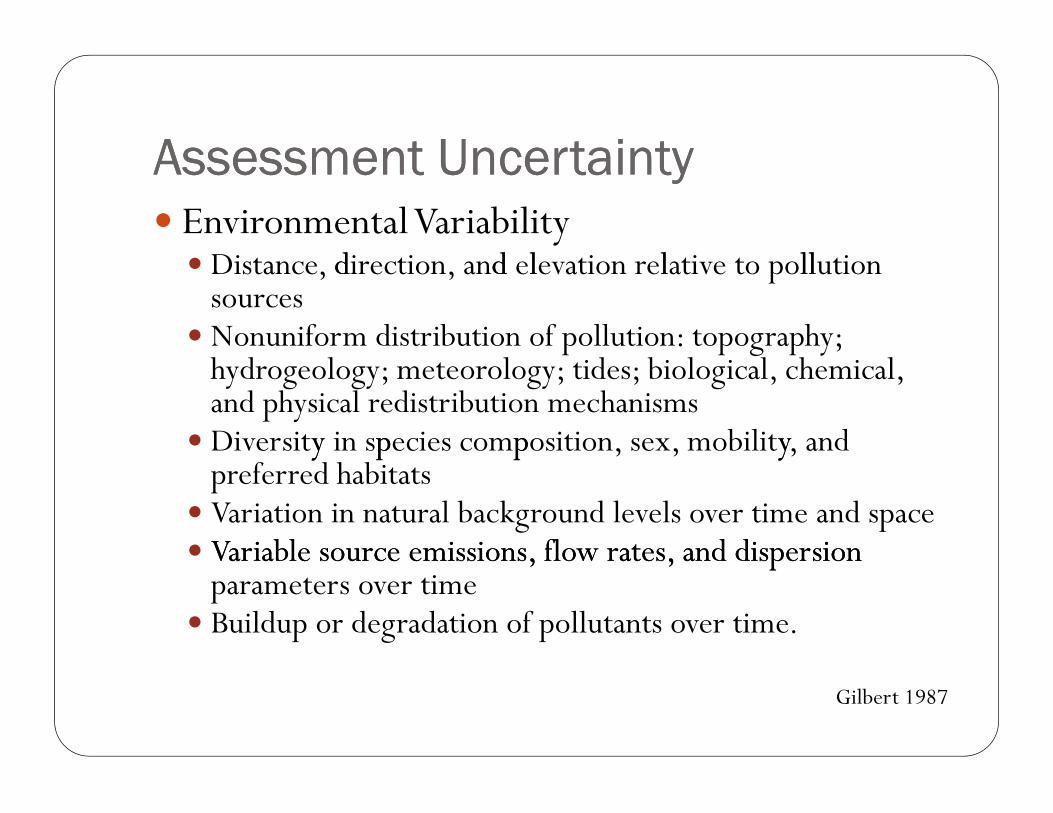
Assessment UncertaintyAssessment Uncertainty Environmental Variability Distance , direction, and elevad tion relative to pd olll ution ll l
sources Nonuniform distribution of pollution: topo
drogeology; ggraphyy;
hy meteorology; tides; biological, ch emical, and physical redistribution mechanisms Diversityy in spp ecies compp osition, sex, mobility,y and
preferred habitats Variation in natural background levels over time and space Variable source emissions, flow rates, and dispersion Variab
parameters over time le source emissions, flow rates, and dispersion
Buildup or degradation of pollutants over time.
Gilbert 1987
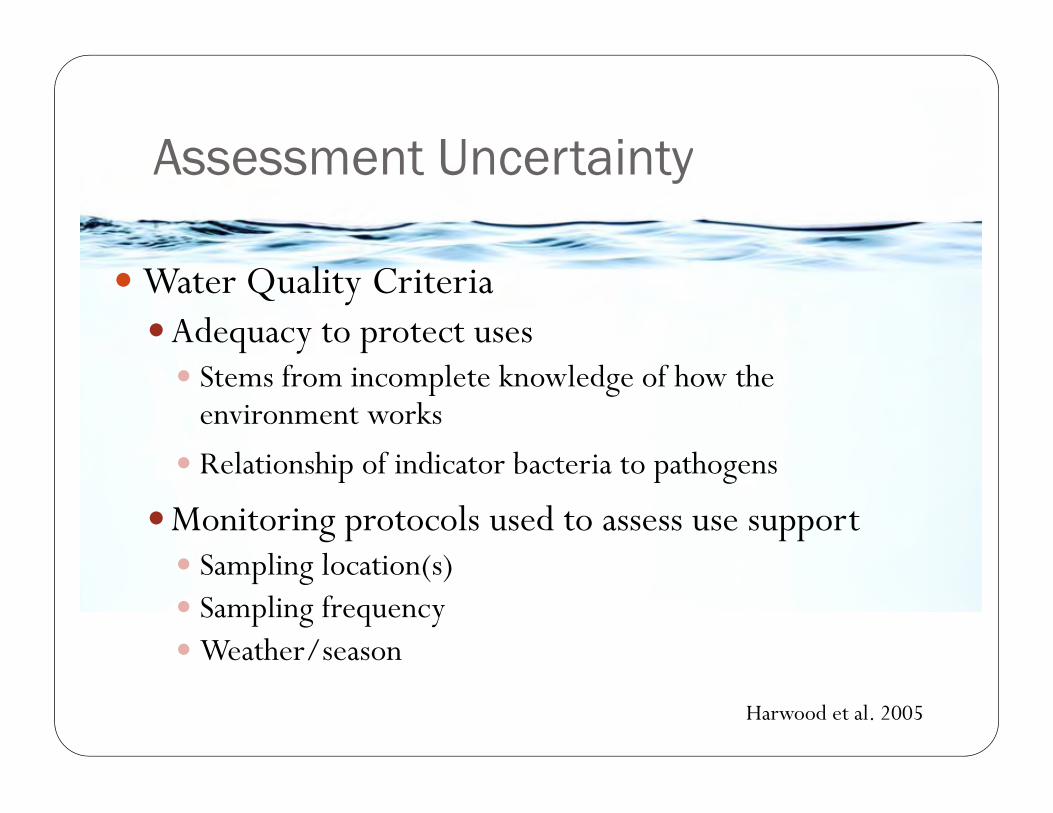
Assessment UncertaintyAssessment Uncertainty
Water Quality Criteria Adequacy to protect uses Stems from incomplete knowledge of how the
environment works
R l ti hi f i di t b t i t th
Monitoring protocols used to assess use support S li l ti ( )
Relationship of indicator bacteria to pathogens
Sampling location(s) Sampling frequency Weather/season
Harwood et al. 2005
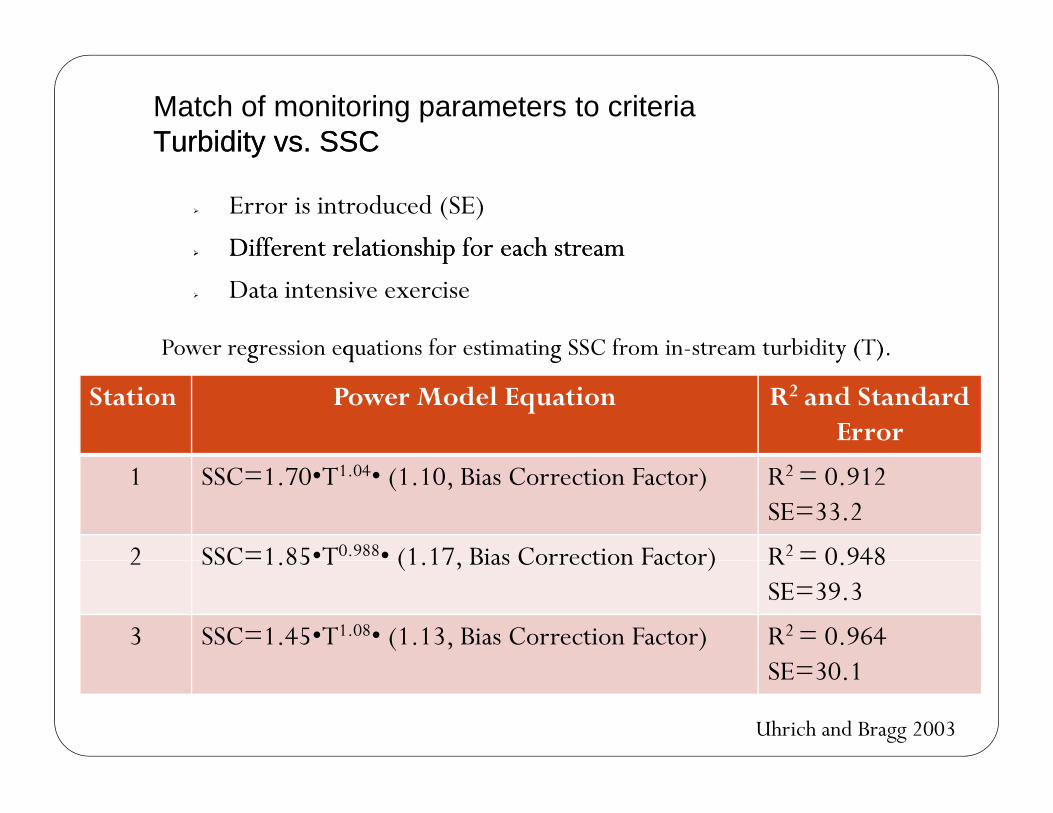
Match of monitoring parameters to criteria Turbidity Turbidity vs. SSCvs. SSC
Error is introduced (SE)
Different relationship for each stream Different relationship for each stream
Data intensive exercise
Power regression eqg q uations for estimatin g SSC from in-stream turbidity (T)g y ( .)
Station Power Model Equation R2 and Standard Error
1 SSC=1.70•T1.04• (1.10, Bias Correction Factor) R2 = 0.912 SE=33.2
2 SSC=1 85•T0.988• (1 17 Bias Correction Factor) R2 = 0 948 2 SSC 1.85 T (1.17, Bias Correction Factor) R 0.948 SE=39.3
3 SSC=1.45•T1.08• (1.13, Bias Correction Factor) R2 = 0.964 SE 30 1SE=30.1
Uhrich and Bragg 2003
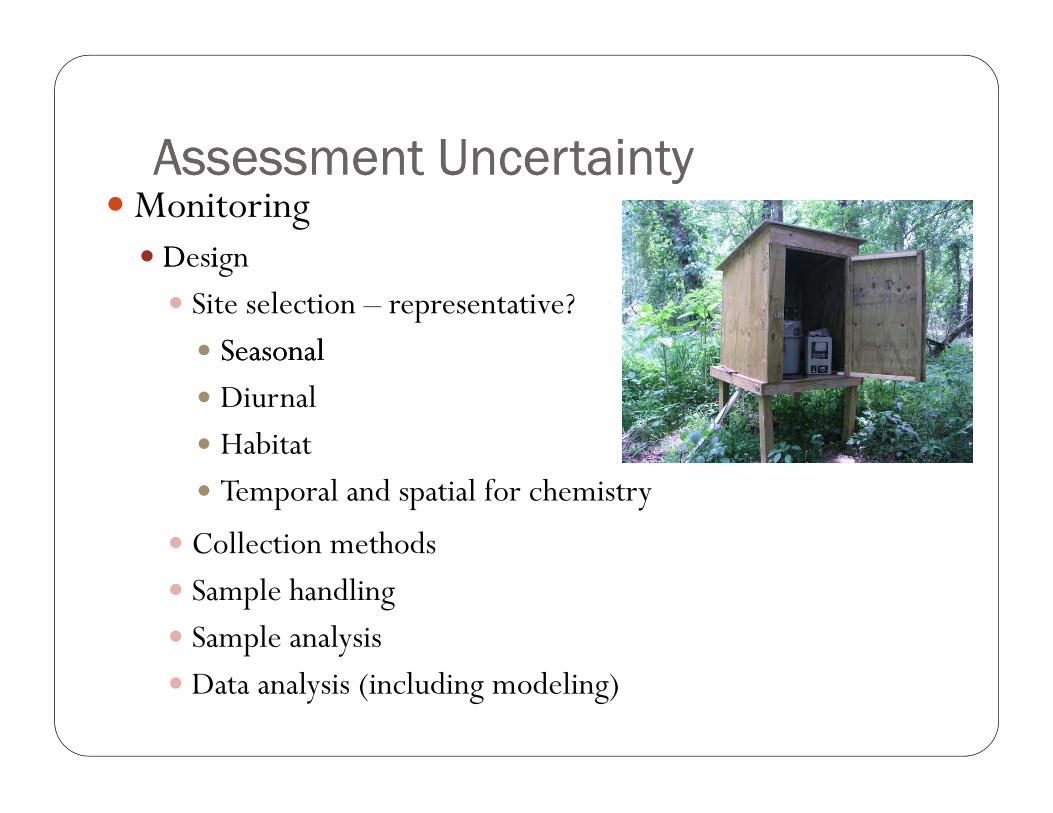
Assessment UncertaintyAssessment Uncertainty Monitoring esD iD ign Site selection – representative? SeasonalSeasonal Diurnal Habitat Temporal and spatial for chemistry
Collection methods Sample handling Sample analysis Data analysis (including modeling)
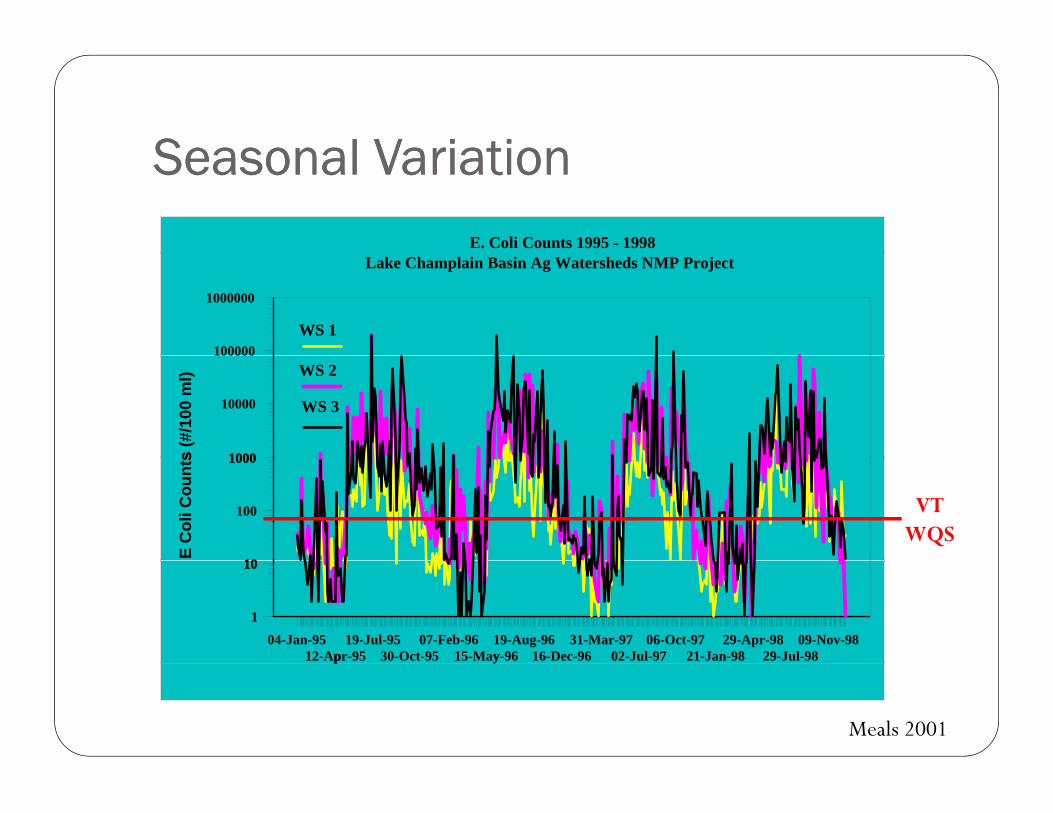
Seasonal VariationSeasonal Variation
00000
E. Coli Counts 1995 - 1998 Lake Champlain Basin Ag Watersheds NMP Project
1000000
WS 1 100000
10000
s (#
/100
ml) WS 2
WS 3
1000 s E
Col
i Cou
nt
1000
100 VT WQS
10 10
1
04-Jan-95 19-Jul-95 07-Feb-96 19-Aug-96 31-Mar-97 06-Oct-97 29-Apr-98 09-Nov-98 12-App r-95 30-Oct-95 15-Mayy -96 16-Dec-96 02-Jul-97 21-Jan-98 29-Jul-98
Meals 2001

Assessment UncertaintyAssessment Uncertainty Source Identification P llllutant pathway h s un d d? Po derstood? Garvin Brook, MN: 15 wells drilled for baseline monitoring
later found to yield water from 30 years earlier and not reflect current or near -term land management a(W reflect current or near term land management (W ll et all t l 1992) l 1992)
False assumptions? e.g.,g , Oak Creek , , AZ: ID’d recreation as source of bacteria
contamination, finding later that wildlife was the source (NCSU 2009) e.g.,
septi RI
f TMDLs:
il Septic systems ID’d as source of bacteria, but
a ure rate <3% ic system f il <3% and h d many homes on waterbodies have been on sewers for more than a decade (RI DEM 2008)
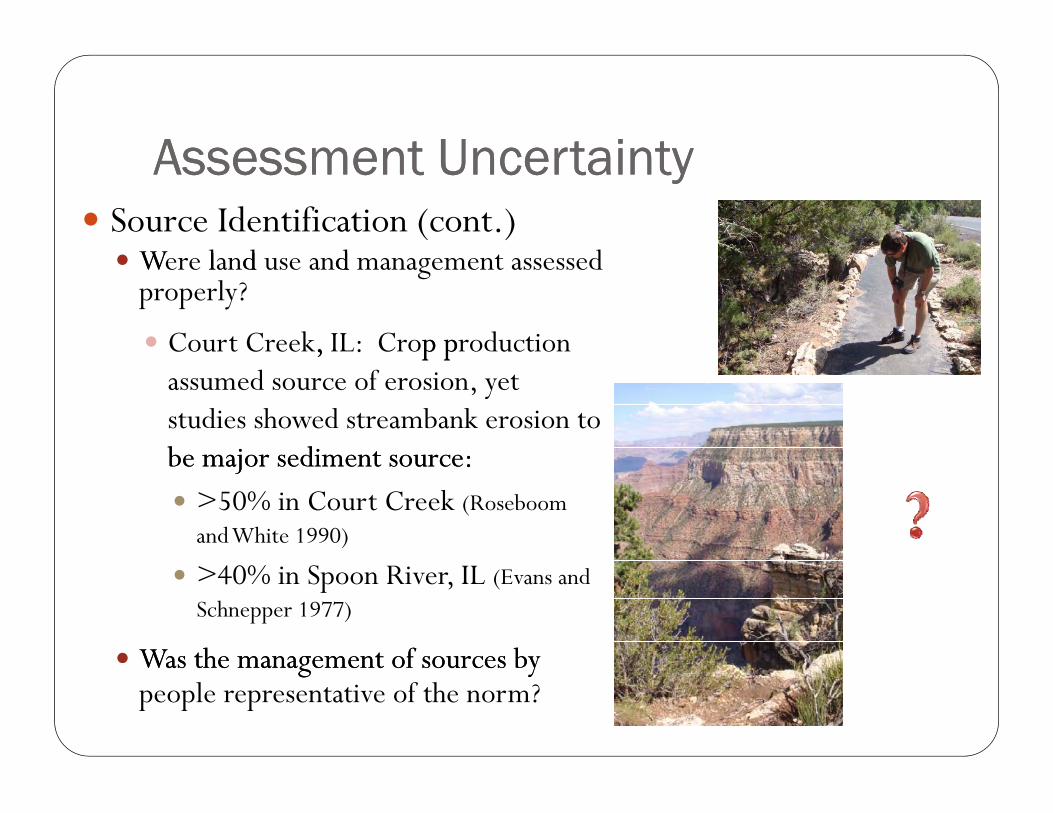
Assessment UncertaintyAssessment Uncertainty Source Identification (cont.)
W l d d dproperly?
Court Creek, IL: Cro p pr, oduction p p
Were land use and management assessed
assumed source of erosion, yet studies showed streambank erosion to be major sediment source:be major sediment source: >50% in Court Creek (Roseboom
and White 1990)
>40% in Spoon River, IL (Evans and Schnepper 1977)
Was the management of sources by Was the management of sources by people representative of the norm?
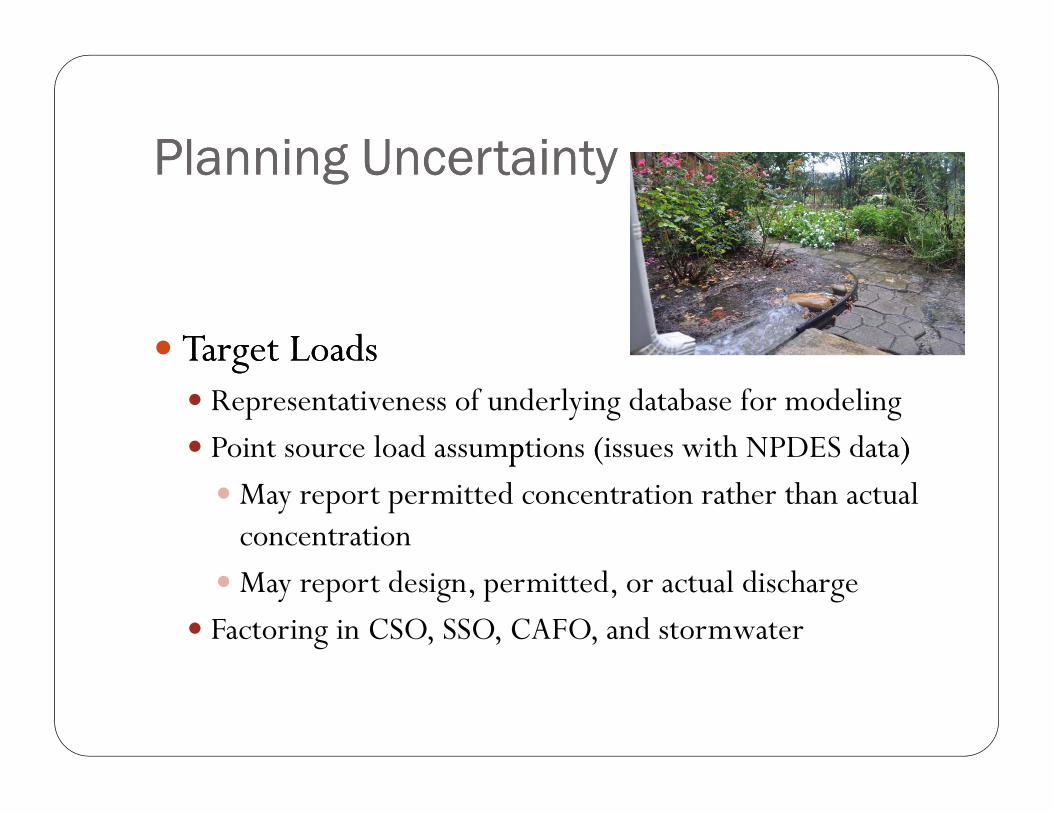
Planning UncertaintyPlanning Uncertainty
Target LoadsTarget Loads Representativeness of underlying database for modeling
Point source load assumptions (issues with NPDES data)p ( )
May report permitted concentration rather than actual concentration May report design, perm itted, or actual discharge
Factoring in CSO, SSO, CAFO, and stormwater
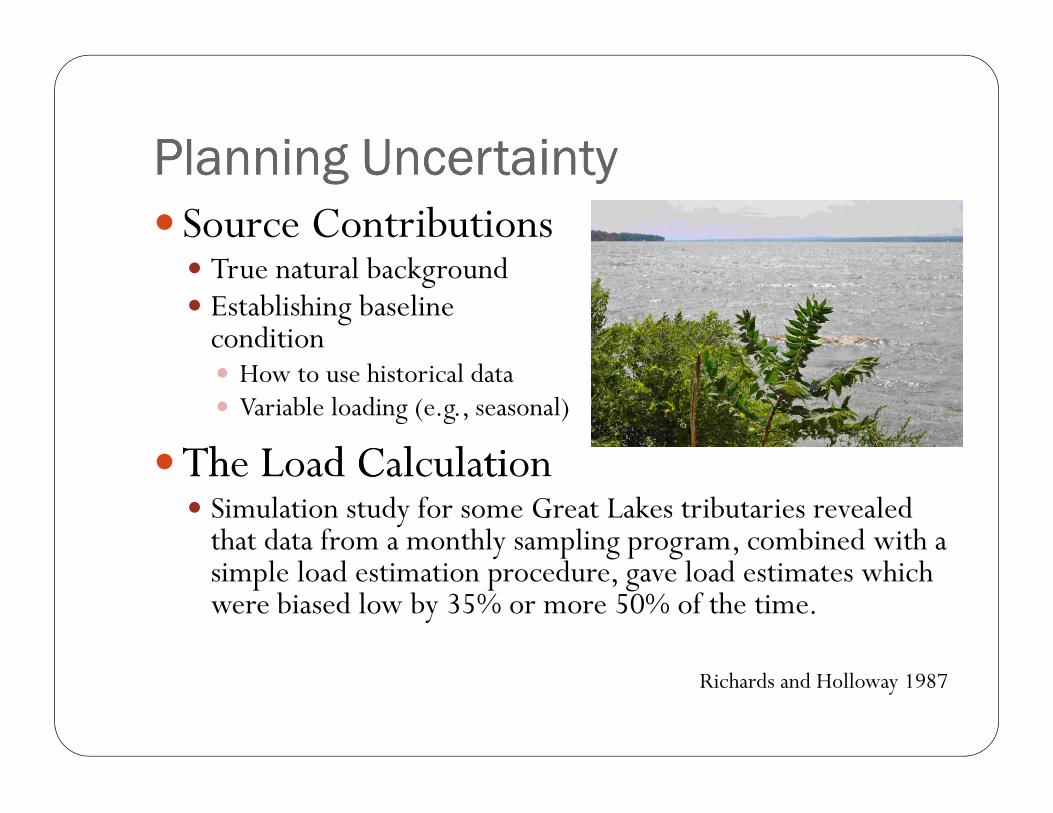
Planning UncertaintyPlanning Uncertainty Source Contributions True natural background Establishing baseline
condition How to use historical data Variable loading (e.g., seasonal)
TThhe L d C l l ti Load Calculation Simulation study for some Great Lakes tributaries revealed
that da ogram, combined with a simple ll l
ta from a monthly sampling proadd estimation proceddure, gav e lloadd estimates which h h
wer e biased low by 35% or more 50% of the time.
Richards and Holloway 1987
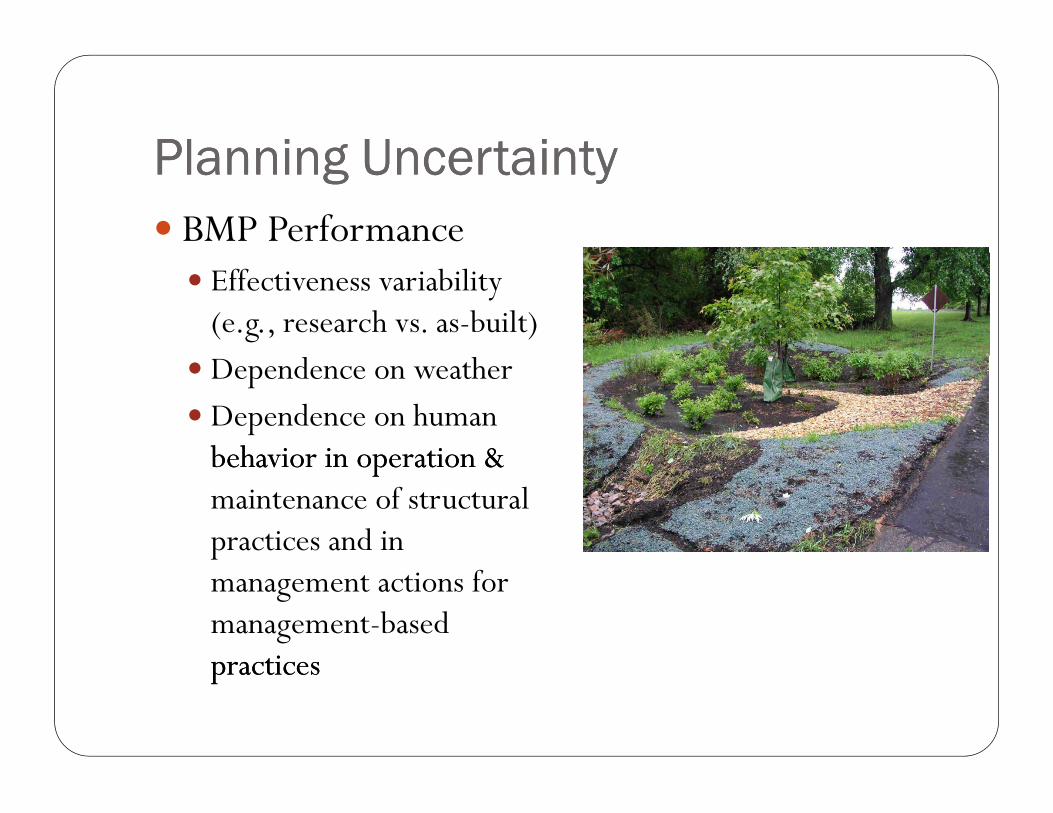
Planning UncertaintyPlanning Uncertainty BMP Performance Effectiveness variability
(e.g., researc h vs. as-built) Dependence on weather De
bbeema
pendence on human havior in operation & havior in operation & intenance of structural
practices and in management actions for management-based practicespractices
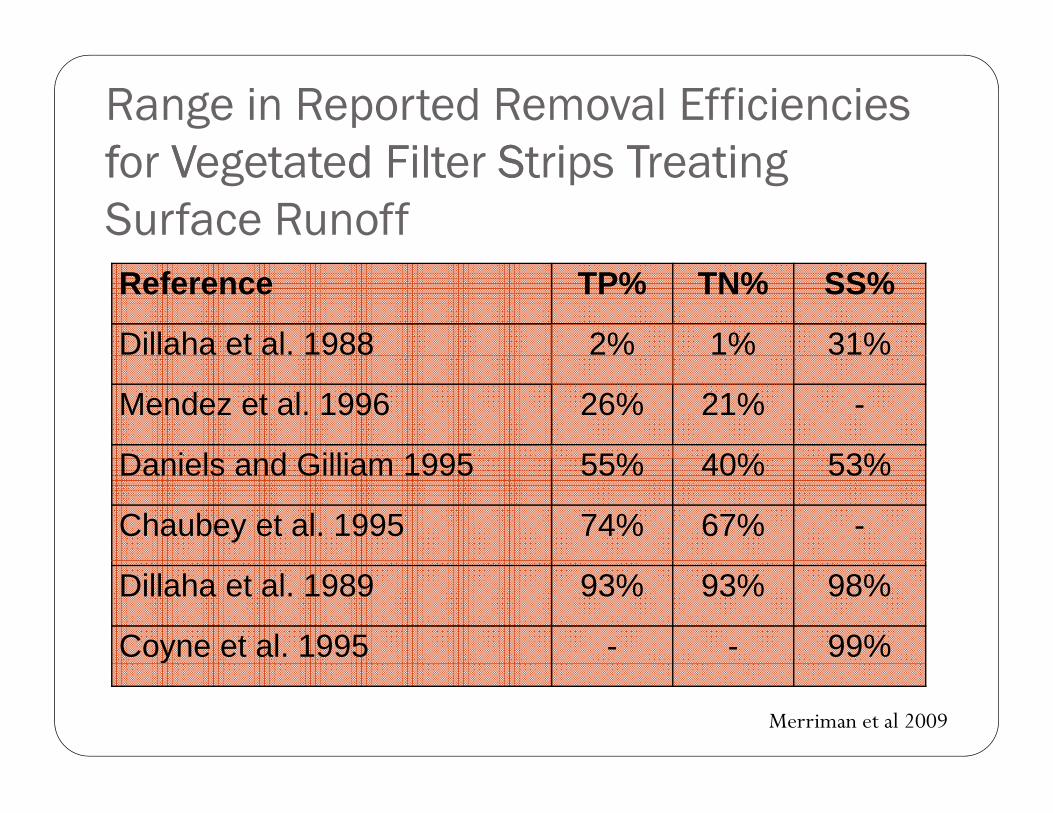
Range in Reported Removal Efficiencies f V g t t d Filt St i T ti g for Vegetated Filter Strips Treating Surface Runoff Reference TP% TN% SS%
Dillaha et al. 1988 2% 1% 31%
Mendez et al. 1996 26% 21% -
D i l d Gilli 1995Daniels and Gilliam 1995 55%55% 40%40% 53%53%
Chaubey et al. 1995 74% 67% -
Dillaha et al. 1989 93% 93% 98%
Coyy ne et al. 1995 - - 99%
Merriman et al 2009

Planning UncertaintyPlanning Uncertainty
BMP PerformanceBMP Performance Application of expected performance depends on knowledge of
prff e-BMP conditions
d dand the conditions under which BMP
effectiveness was determined
MacatawaWatershed Project, MI: (MACC 1999)
P redd uction strategy bb asedd on modd ell ing assuming cropll and d conventionally tilled Review found 65% of croppland was under residue
management system. Sediment and P from cropland overestimated in baseline. Incorrectly focused much of 80% reduction of P on increased Incorrectly focused much of 80% reduction of P on increased
residue management on cr opland.
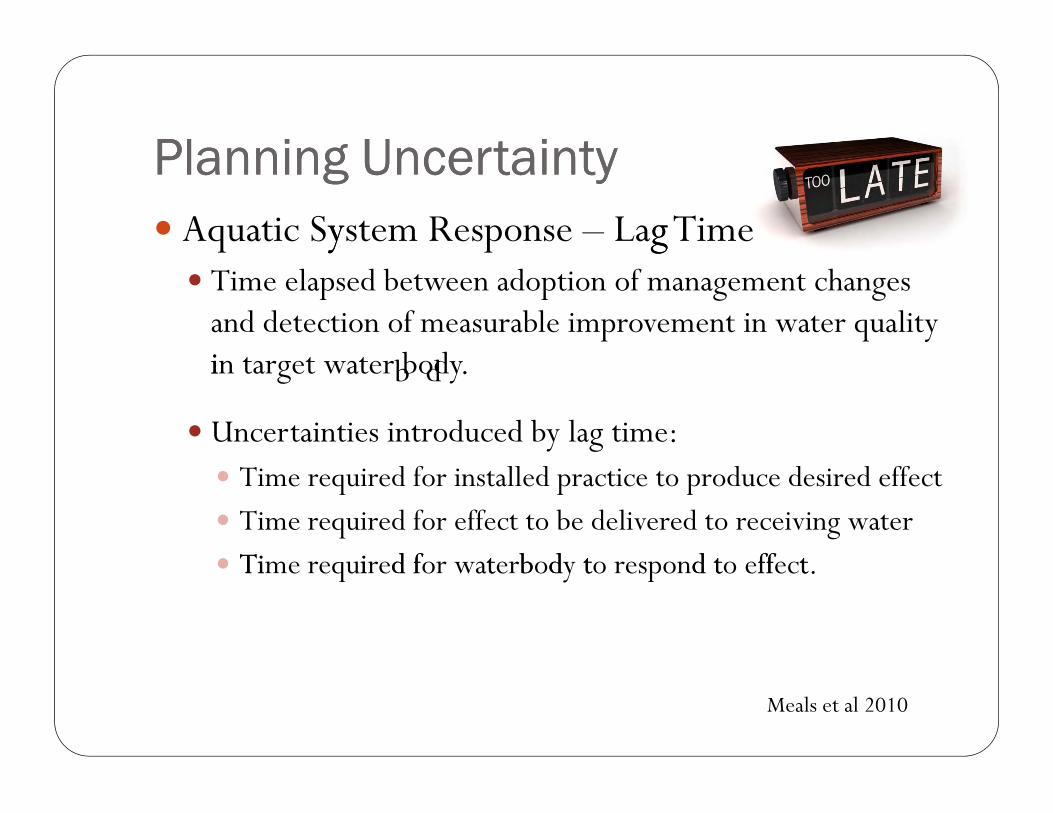
Planning UncertaintyPlanning Uncertainty Aquatic Syy stem Response – Lagg Time Time elapsed between adoption of management changes
and detection of measurable improvement in water quality i i n target water bodb d y.
Uncertainties introduced by lag time: Time required for installed practice to produce desired effect
Time required for effect to be delivered to receiving water Ti Ti me requi d f t b d t d t ff t ired for waterbody t o respond t o effect.
Meals et al 2010
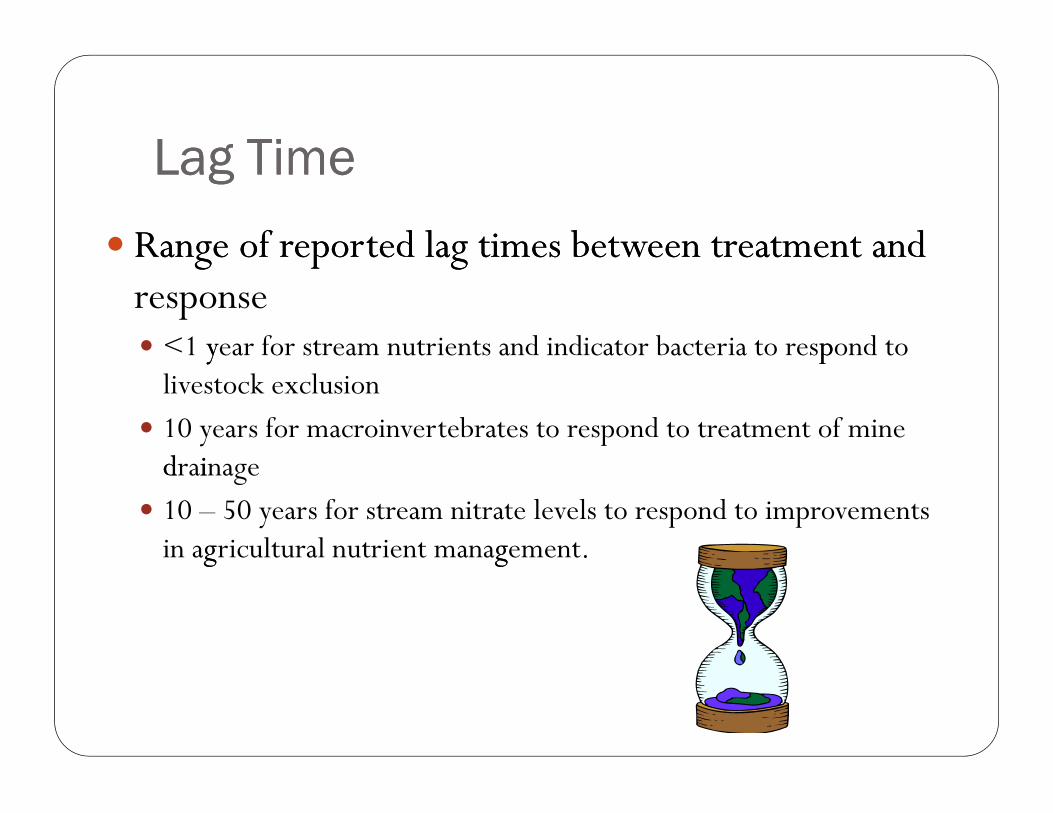
Lag TimeLag Time
RRange of reported lag times between treatment and e of reported lag times between treatment and nse
angrespo <1 yyear for stream nutrients and indicator bacteria to resppond to
livestock exclusion 10 years for macroinvertebrates to respond to treatment of mine d idrainage
10 – 50 years for stream nitrate levels to respond to improvements in agg ricultural nutrient managg ement.
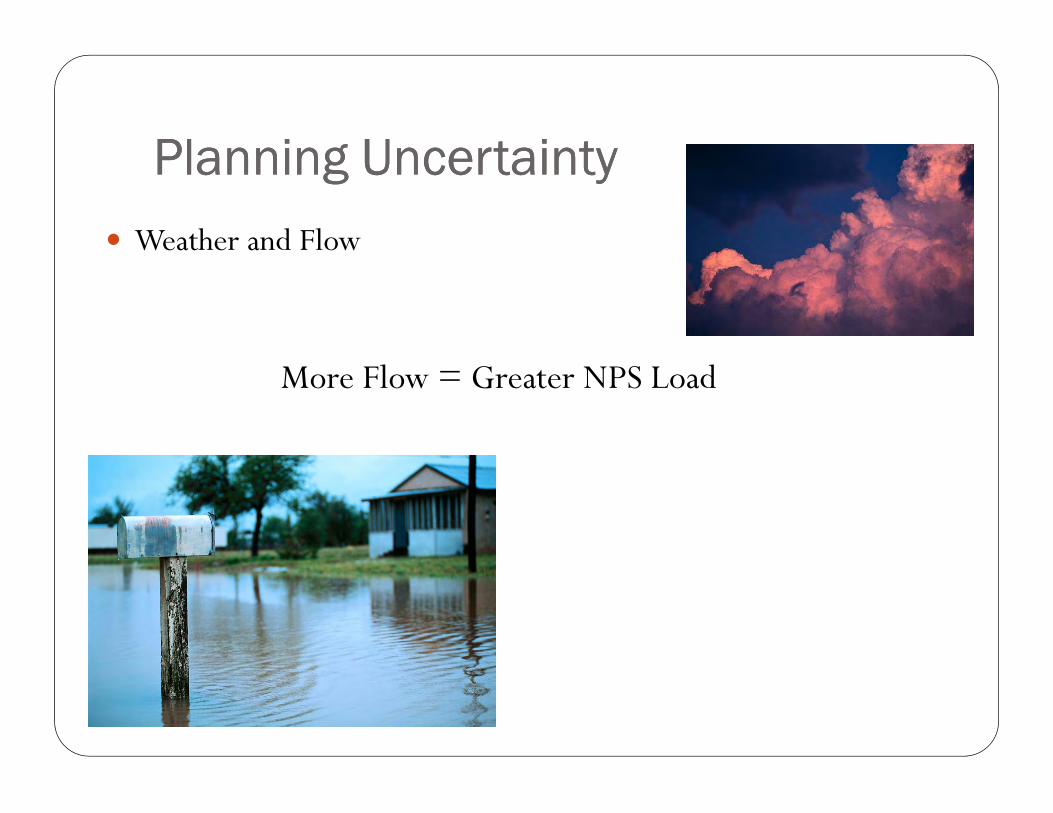
Planning UncertaintyPlanning Uncertainty Weather and Flow
More Flow = Greater NPS Load
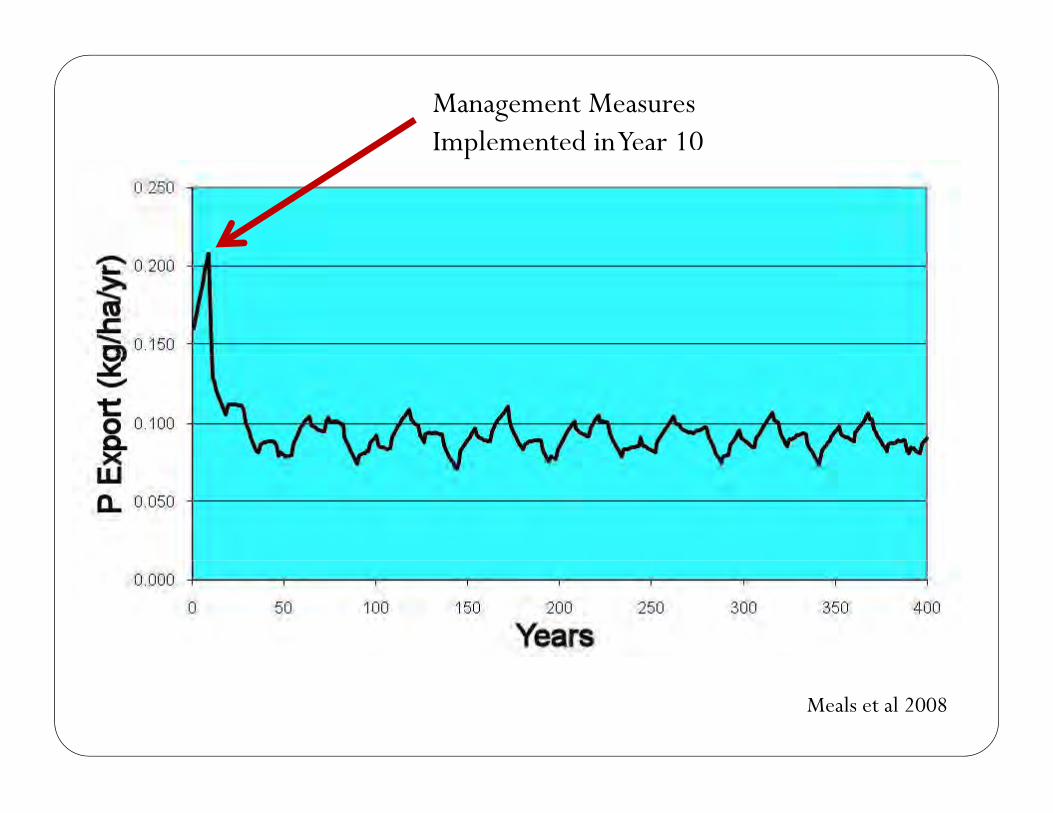
e e te ea 0 Management Measures Implemented inYear 10p
Meals et al 2008
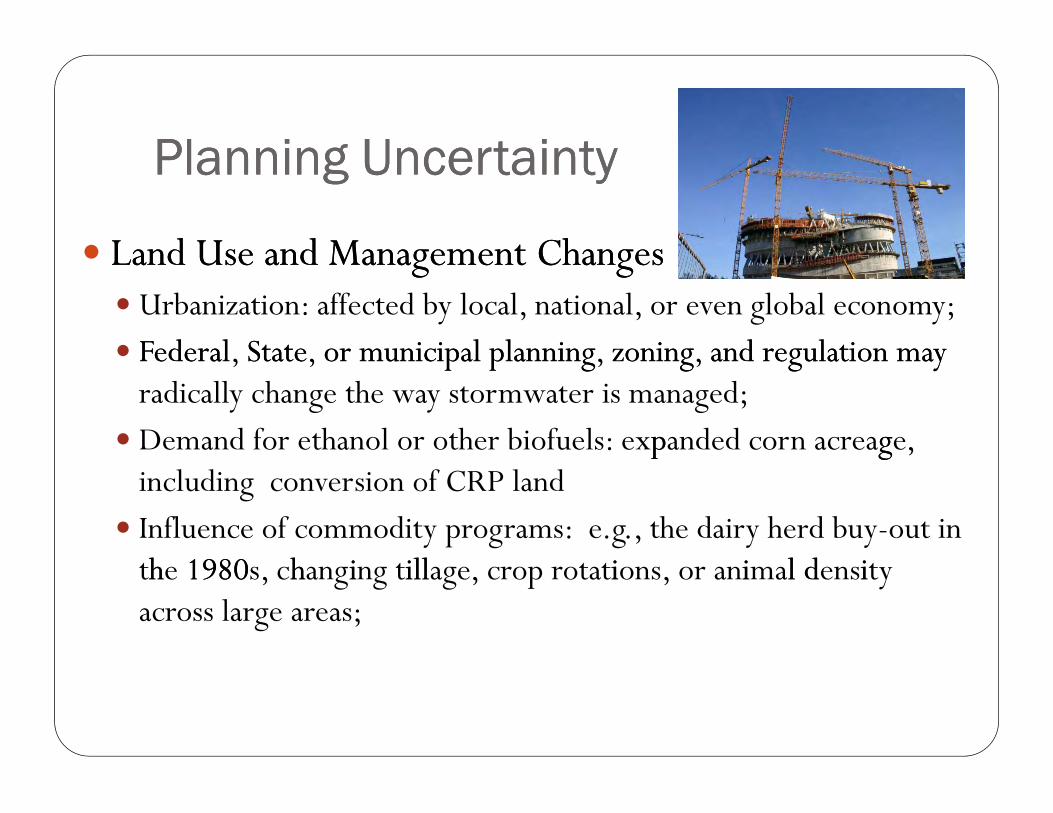
Planning UncertaintyPlanning Uncertainty
Land Use and Management ChangesLand Use and Management Changes
Urbaniza tion: affected by local, national, or even global economy; Federal , State, or municipal planning, zoning, and regulation may Federal State or municipal planning zoning and regulation may radically change the way stormwater is managed; Demand for ethanol or other biofuels: expp anded corn acreagg e, including conversion of CRP land Influence of commodity programs: e.g., the dairy herd buy-out in th i l d i he 1980 h i ill i 1980 s, changing tillage , cr op rotati ons, or animal density across large areas;
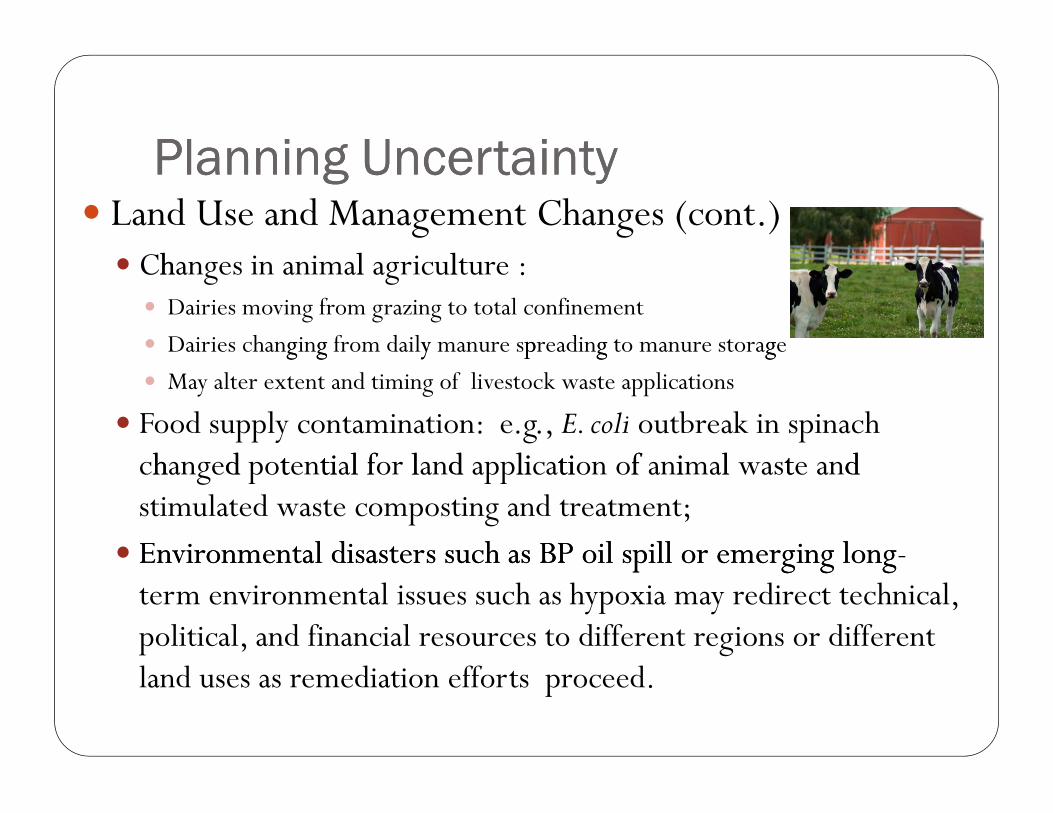
Planning UncertaintyPlanning Uncertainty .) Land Use and Management Changes (cont
h l l Changes in animal agriculture : Dairies moving from grazing to total confinement
Dairies changingg g from dailyy manure spp readingg to manure storagg e
May alter extent and timing of livestock waste applications
Food supply contamination: e.g. , E. coli outbreak in spinach ch anged po en at t l i orf anl appd l cati on oi f an ma i wasl e t dh d t ti l f l d li ti f i l t and stimulated waste composting and trea tment; Environmental disasters such as BP oil spill or emerging longEnvironmental disasters such as BP oil spill or emerging long -
term environmental issues such as hypoxia may redirect tech nical, political, and financial resources to different regions or different land uses as remediation efforts proceed.
Planning UncertaintyPlanning Uncertainty
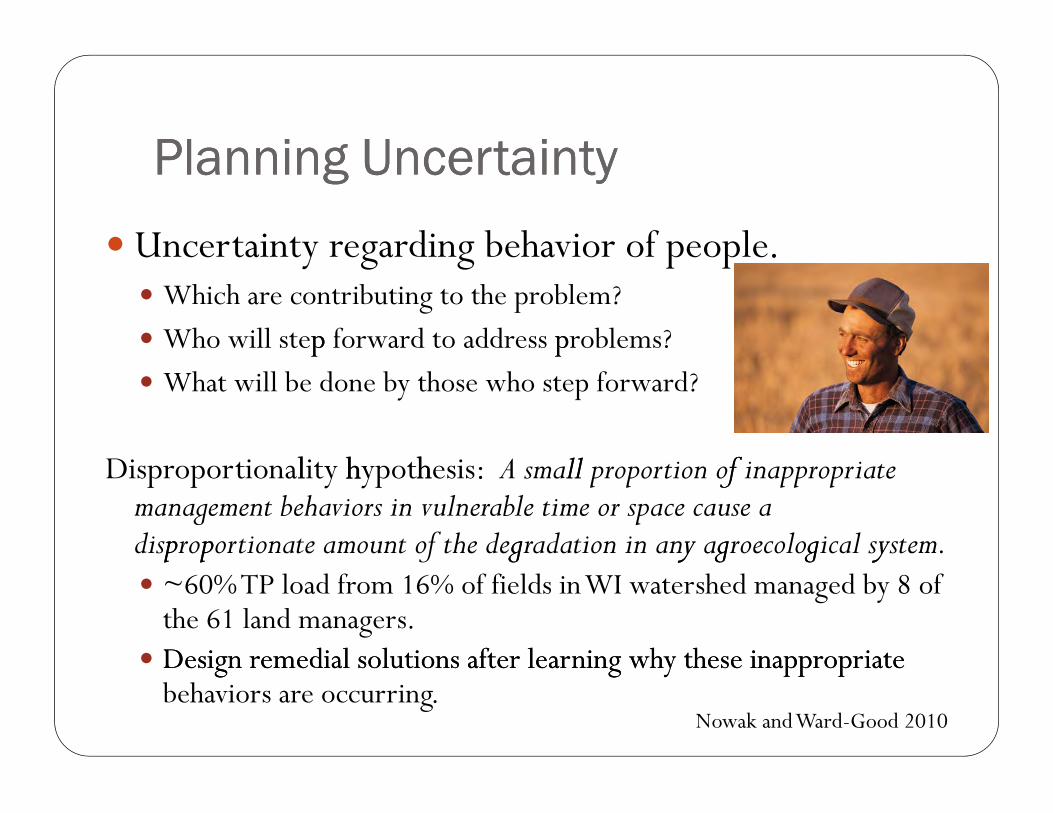
Uncertainty regarding behavior of people
Disproportionality hl h ypothh esis: A small ll proportion of f inappropriate management behaviors in vulnerable time or space cause a disproporp p tionate amount off the deggradation in any aggy roecologgical syystem.
Uncertainty regarding behavior of people. Which are contributing to the problem? Who will stepp forward to address pp roblems? What will be done by those who step forward?
~60% TP load from 16% of fields in WI watershed managed by 8 of the 61 land managers . Design remedial solutions after learning why these inappropriate Design remedial solutions after learning why these inappropriate behaviors are occurring.
Nowak and Ward-Good 2010
Implementation UncertaintyImplementation Uncertainty Planned BMPs may be superseded by improved
practices or shown to be ineffective or worse , e.g., Conservati i f i C ion l d ifi till age mayl ead to stratification of nutrients
or pesticides in upper soil layers, leaving them mor e vulnerable to runoff losses; Riparian buffers without the capacity to ensure sheet flow
may be short-circuited by concentrated overland flow; Tile and ditch drainage now shown to have deleterious Tile and ditch drainage now shown to have deleterious
effect; new conservation drainage practices are under development.
ill
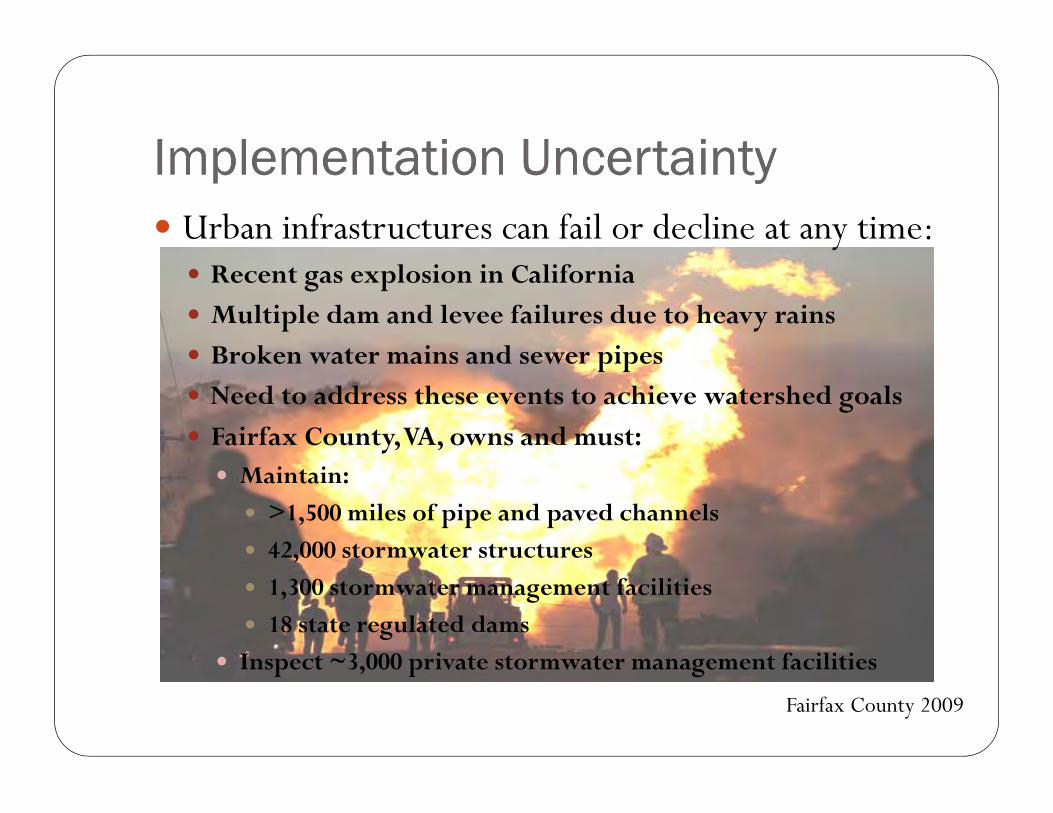
Implementation UncertaintyImplementation Uncertainty Urban infrastructures can fail or decline at any time: Recent gas explosion in California Multiple dam and levee failures due to heavy rains Broken water mains and sewer pipes Broken water mains and sewer pipes Need to address these events to achieve watershed goals Fairfax County, VA , owns and must: Maintain: >1,500 miles of pipe and paved channels 42,000 stormwater structures , 1,300 stormwater management facilities 18 state regulated dams
Inspect ~3 000 private stormwater management facilities
Fairfax County 2009
Inspect 3,000 private stormwater management facilities
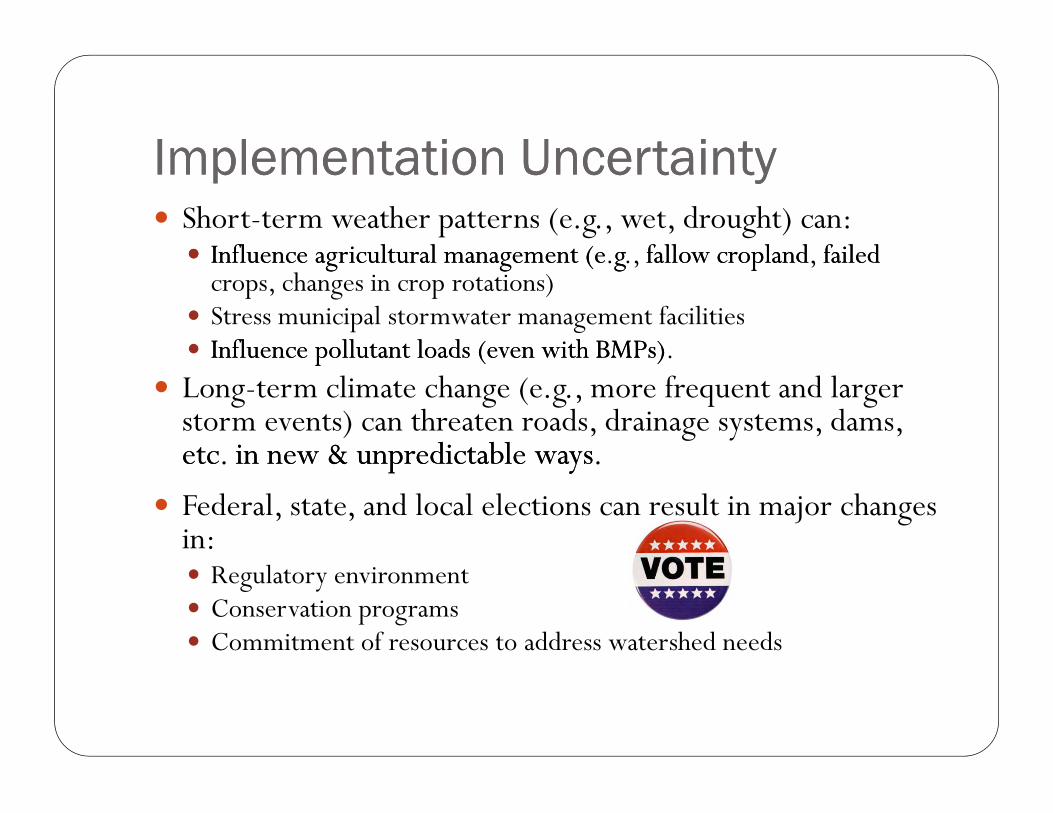
Implementation UncertaintyImplementation Uncertainty Short-term weather patterns (e.g., wet, drought) can: Influence agricultural management (e g fallow cropland failed Influence agricultural management (e.g., fallow cropland, failed
crops, changes in crop rotations) Stress municipal stormwater management facilities Influence pollutant loads (even with BMPs)Influence pollutant loads (even with BMPs).
Long-term climate change (e.g., more frequent and larger storm events) can threaten roads, drainage systems, dams, etc. in new & unpredictable ways etc in new & unpredictable ways.
Federal, state, and local elections can result in major changes in: Regulatory environment
Conservation programs Commitment of resources to
address watershed needs
Implementation UncertaintyImplementation Uncertainty Economic pressures, corporate lobbying, public I&E
campai igns, and d sociial mo can b l vementts b roa y id l dl i nfl fl uence human behavior and change management of land and activities associated with pollutant loads .
When “being gr een” Agrichemical manufacturer’s disputing claims of leaching problems
may derail efforts to change pesticide use (e.g ., MO CEAP) Major reductions in milk or crop prices can decrease producer s’
abilityy and willingg ness to adopp t conservation pp racticesc downturns leading to budget cuts can cause delays in g stormwater or wastewater infrastructure.
Economiupgradin
Progress Assessment UncertaintyProgress Assessment Uncertainty
Same uncertainty issues as for assessment BUTBUT
Change detection requires greater sensitivity
Applies to both monitoring and modeling
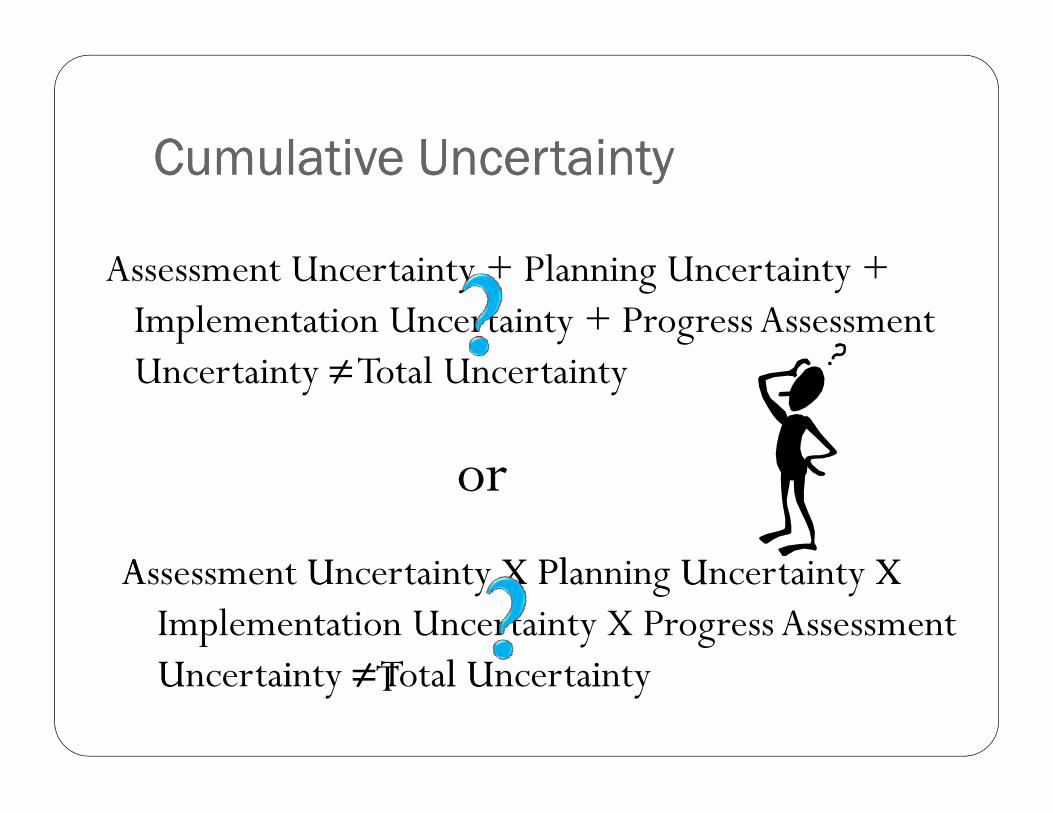
Cumulative UncertaintyCumulative Uncertainty
Assessment Uncertainty + Planning Uncertainty + Implementation Uncertainty + Progress Assessment Uncertainty ≠ Total Uncertainty
or
ssessment A U X Pl U X A Uncertainty X Planning Uncertainty X Implementation Uncertainty X Progress Assessment U i ≠ T l U iUncertai nty ≠Total Uncertainty
Cumulative UncertaintyCumulative Uncertainty
So what IS the cumulative uncertainty?
We are uncertain, but • Should consider how these uncertainties might inter-relate
(i.e., combine and propagate through system)
• Seems unlikely tha t source ID uncertainty and lag time uncertainty would cancel?
• Assessment and implementation uncertainty are probably at least additive?
• Hence , the Margin of Safety (MOS) in TMDLs…
Cumulative UncertaintyCumulative Uncertainty Can’t quantify all terms of uncertainty Potential land use change
Social forces
Can quantify some sources Predictions of weather, flow, pollutant measur ements,
load calculations
RecommendationsRecommendations Acknowledge it. Be clear with the public and other
stakeholders that uncertainty exists and results may not be exactly as hoped or flat-line stable
Prepare for it In the assessment phase conduct effective Prepare for it. In the assessment phase, conduct effective investigations of the causes and sources of the water quality impairment before beginning an implementation effort.
Quantify it. Use existing data to quantify and understand variability in natural world, pollutant generation, BMP performance The Data Uncertainty Estimation Tool for Hydrology performance The Data Uncertainty Estimation Tool for Hydrology and Water Quality (UDET-H/WQ) (Harmel et al 2009)
RecommendationsRecommendations Model it. Acknowledge uncertainty in modeling
procedures and results and use appropriate procedures (e.g ., Monte Carlo) to estimate the effects of uncertainty. Physical based modeling should include the human Physical-based modeling should include the human
dimensions of land management (e.g., the influence of human behavior on BMP effectiveness) to adequately consider uncertainty in outcomes.
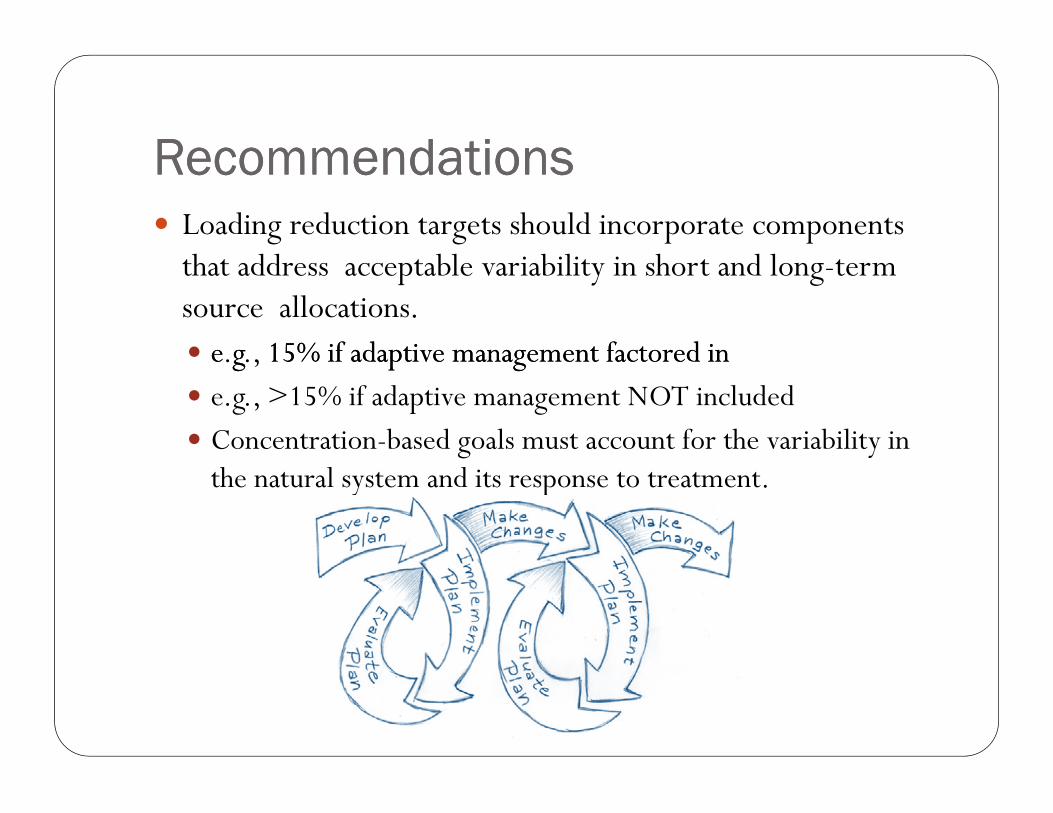
RecommendationsRecommendations Loading reduction targets should incorporate components
that address acceptable variability in short and long-term source allocations . e g 15% if adaptive management factored in e.g., 15% if adaptive management factored in
e.g., >15% if adaptive management NOT included Concentration-based ggoals must account for the variabilityy in
the natural system and its response to treatment.
RecommendationsRecommendations Track it. Effective water quality and land use monitoring
tells you where you are and allows for mid-course corrections. Use minimum detectable change (MDC) to estimate the Use minimum detectable change (MDC) to estimate the
monitoring frequency needed to detect: The load reduction required b y the TMDL
d
Interim red uctions h that tr igger a ddaptiv e management actions

RecommendationsRecommendations Accommodate it. Use the best available scientific principles and data Use MDC and other techniques to guide monitoring and
evaluation programsevaluation programs Use reasonable – but not excessive – MOS
Wait for it. Acceppt the notion of lagg time and adjust expectations accordingly.
Adappt to it. Use a nimble and flexible planning and implementation process
so that the inevitable surprises do not derail the program Use a dapti ve management principl es, suppor d b dU d i i i l ted by good
information
os s C t of o N t Add ress ni g U t i tC t f N t Add i g Uncertainty
Errors in pp roblem assessment
Errors in planning
Impp lementation of wrongg BMPs
Excessive costs to achieve goals
nger A C f i d f t ti A , Confusion and frustration Those who need to implement controls
Those who would benefitThose who would benefit
Failure to achieve water quality objectives
Decreased funding suppg p ortp
References California Regional Water Quality Control Board. 2004. Total maximum daily loads for
bacteria Malibu Creek Water shed. RWQCB, Los Angeles, CA. httpp ://www.epp a.gg ov/waters/tmdldocs/MalibuBacti%20TMDL%20Staff%20Repp ort.pp dfENSR. 2009. Maine statewide bacteria TMDL. Report # DEPLW -1002. Report prepared for Maine Department of Environmental Pr otection. http://www.maine.gov/dep/blwq/docmonitoring/TMDL/2009/report.pdf Evans R E and D H Schnepper 1977 Sources of suspended sediment: Spoon River Illinois Evans, R.E. and D.H . Schnepper. 1977 . Sources of suspended sediment: Spoon River, Illinois .. Proceedings of the North-Central Section of the Geological Society of America, Peoria, IL, pp.592-593 Fairfax County. 2009. Fairfax County stormwater service distri ct, http://www.fairfaxcounty.gov/dpwes/publications/stormwater/servicedistrict.pdf(retrievhttp://www.fairf
ed October 19, axcounty.go
2010). v/dpwes/publications/stormwater/servicedistrict.pdf
Gilber t, R.O. 1987. Statistical methods for environmental pollution monitoring, Van Nostrand Reihnhold Company , Inc. , New York, 320 pp. Harmel, R .D., . D R. Smith, K .W. King, and R .M. Slade. 2009. Estimating storm discharge and Harmel R D D R Smith K W King and R M Slade 2009 Estimating storm discharge and water quality data uncer tainty: A software tool for monitoring and modeling applicat ions, Environmental Modelling & Software 24: 832–842. Harwood, V.J. , A.D . Levine, T. M. Scott, V . Chiv ukula, J. Lukasik, S.R. Farrah , and J.B. Rose . 2005 Validity of the indicator organism paradigm for pathogen reduction in reclaimed water 2005. Validity of the indicator organism paradigm for pathogen reduction in reclaimed water and public health protection. Appl. Environ. Microbiol. 71(6):3163-3170.
References MACC . 1999. The Macatawa watershed project: nonpoint source phosphorus reduction plan
for the Macatawa waters hed 1999-2009, Macatawa Area Coordinating Council , Holland, MI, pp85 . ttp:h / www.t/ h e-macc.org/ wp-content/ upl oad s/2009/04/M W / at h h / l er d85 h // d /2009/04/Macatawa-W shed-
Phosphorus-Reduction-Implementation-Plan1.pdf
MA DEP , ENSR, and USEPA Region I. 2009. Final pathogen TMDL for the Buzzards Bay watershed, March 2009 CN: 251 .1 watershed March 2009 CN: 251 1
MDE.2010. Listing methodology for identifying waters impaired by bacteria in Maryland’s integrated report, Maryland Department of Envir onment, http://www.mde.state.md.us/assets/document/Bacterial_Listing_Methodology_2010.pdfy p g g p (retriev ed October 13, 2010).
MDE and VDEQ. 2009. Final total maximum daily loads of fecal coliform for the restricted shellfish harvesting/growing areas of the Pocomoke River in the Lower Pocomoke River Basin and Pocomoke Sound Basin in Somerset and Worcester counties, Maryland and Accomac k County, Virg inia. Maryland Dept. of Environment and Virg inia Dept. Environmental Quality, Approved Apri l, 2009. http://www.mde.maryland.gov/assets/document/TMDL _Pocomoke _River 032409 final. http://www.mde.maryland.gov/assets/document/TMDL Pocomoke River_032409_final. pdf
Meals, D.W. 2001. Lake Champlain Basin agricultural watersheds Section 319 national monitoring program pr oject, final project report: May, 1994-September, 2000. Vermont D f E l C W b VT 227 D ept. of Environmental Conservation,Waterbury,VT, 227 p.
Meals, D.W., E.A. Cassell, D. Hughell, L. Wood, W.E. Joke la, and R. Parsons . 2008. Dynamic spatially explicit mass-balance modeling for targeted watershed phosphorus management, II. Model application Agriculture Ecosystems and Environment 127:223 233Model application. Agriculture, Ecosystems and Environment 127:223–233.
Meals, D.W., S.A. Dressing, and T. E. Davenport. 2009. Lag time in water quality response to best management practices: A review , Journal of Environmental Quality , 39(1): 85-96.
Merriman K R M W Gitau and I Chaubey 2009 Tool for estimating best management Merriman, K.R., M.W . Gitau, and I . Chaubey. 2009.Tool for estimating best management practice effectiveness in Arkansas . Applied Engineering in Agriculture 25(2):199–213.
NCSU . 2009. Section 319 national monitoring program projects 2009 summary repor t, NCSU Water Quality GrQ oup,y p Raleigh,, NC g , . http://www.bae.ncsu.edu/programs/extension/wqg/319monitoring/09rept319/index.ht m
NCSU . 2010. Waukegan River Illinois national nonpoint source monitoring program pro ject, NWQEP Notes No. 133:1-18, NCSU Water Quality Group, Raleigh, NC . http://www.bae.ncsu.edu/programs/extension/wqg/issues/notes133_waukegan.pdf
References
References Nowak, P. and L. Wa rd-Good. 2010. Testing the disproportionality hypothesis in the Pleasant
Valley Watershed, Managing Agricultural Landscape for Environmental Quality II, Soil and r WateW C Conservation S Society,A pri A l 8 2 30l 28- D 30, 2010 2010, Denver, C l do. Colorad
http://www.swcs.org/documents/filelibrary/malii/MAL_II_Final_ProgramAbstract_Book wC_7E7AEC87CD111.pdf
Rhode Island Department of Environmental Management 2008 Total maximum daily load Rhode Island Department of Environmental Management. 2008.Total maximum daily load for Point Judith Pond waters: pathogen/bacteria impairments, Office of Wa ter Resources, RIDEM, Providence, RI.
Richards,, R.P. and JJ. Hollowayy . 1987. Monte Carlo studies of sampp lingg strategg ies forestimating tributary loads. Water Resources Research 23:1939-1948.
Roseboom, D. P. and W. White. 1990. The Court Creek restoration project, Proceedings of Conference XXI, International Erosion Control Association, Erosion Control: Technology in Transition. Washington, DC , February 14-17, 1990. 25-49.
Spooner, J., C.J. Jamieson, R.P. Mass, and M.D. Smolen. 1987. Determining statistically significant changes in water pollutant concentrations. Lake and Reserv oir Management, 3 195 2013:195-201.
References Uhrich, M.A. and H.M. Bragg. 2003. Monitoring instream turbidity to estimate continuous
suspended-sediment loads and yields and clay-water volumes in the Upper North Santiam River B asin, Oregon, 1998 –2000, W ater- esources nR I O epor R t R 3 0 4098 R B 1998 2000 W R I vestigations 03–4098, USDOI USDOI ,
USGS.
USFDA. Guide for the control of Molluscan shellfish 2007, US Food and Drug Administration http://www fda gov/Food/FoodSafety/Product Administration, http://www.fda.gov/Food/FoodSafety/Product-SpecificInformation/Seafood/FederalStatePrograms/NationalShellfishSanitationProgram/uc m046353.htm (retrieved October 13, 2010).
Walker,, W.W . 2001. QQ uantifyy ingg uncertaintyy in pp hospp horus TMDL’s for lakes. New Engg land Interstate Water Pollution Control Commission and U. S. Environmental Protection Agency Region 1, Lowe ll, MA.
Wa ll, D.B., M.G. Evenson, C.P. Regan, J. A. Magner , and W.P . Anders on. 1992. Understanding the groundwater system: the Garvin Brook experience , IN: Seminar Publication –The national Rural Clean Water Program Symposium, EP A/625/R-92/006, U.S.EP A, pp. 59-70.