addressing reliability requirements in the enfield network
TRANSCRIPT

For Official Use Only
Addressing reliability requirements in the Enfield network
area
Draft Project Assessment Report
22 December 2017
DPAR Addressing reliability requirements in the Enfield network area 2
Disclaimer
Ausgrid is registered as both a Distribution Network Service Provider and a Transmission Network Service Provider. This
Draft Project Assessment Report has been prepared and published by Ausgrid under clause 5.17 of the National
Electricity Rules to notify Registered Participants and Interested Parties of the results of the regulatory investment test for
distribution and should only be used for those purposes.
This document does not purport to contain all of the information that a prospective investor or participant or potential
participant in the National Electricity Market, or any other person or interested parties may require. In preparing this
document it is not possible nor is it intended for Ausgrid to have regard to the investment objectives, financial situation
and particular needs of each person who reads or uses this document.
This document, and the information it contains, may change as new information becomes available or if circumstances
change. Anyone proposing to rely on or use the information in this document should independently verify and check the
accuracy, completeness, reliability and suitability of that information for their own purposes.
Accordingly, Ausgrid makes no representations or warranty as to the accuracy, reliability, completeness or suitability for
particular purposes of the information in this document. Persons reading or utilising this document acknowledge that
Ausgrid and their employees, agents and consultants shall have no liability (including liability to any person by reason of
negligence or negligent misstatement) for any statements, opinions, information or matters (expressed or implied) arising
out of, contained in or derived from, or for any omissions from, the information contained in this document, except insofar
as liability raised under New South Wales and Commonwealth legislation.
DPAR Addressing reliability requirements in the Enfield network area 3
Addressing reliability requirements in the Enfield
network area Draft Project Assessment Report – 22 December 2017
Contents
DISCLAIMER ........................................................................................................................................................ 2
GLOSSARY OF TERMS ....................................................................................................................................... 4
EXECUTIVE SUMMARY ...................................................................................................................................... 5
1 INTRODUCTION ...................................................................................................................................... 9 1.1 Role of this draft report .................................................................................................. 9 1.2 Making a submission and next steps ........................................................................... 10
2 DESCRIPTION OF THE IDENTIFIED NEED ......................................................................................... 11 2.1 Overview of the Canterbury-Bankstown network area ................................................. 11 2.2 Overview of Ausgrid’s relevant distribution reliability standards .................................. 12 2.3 Key assumptions underpinning the identified need...................................................... 14
3 TWO CREDIBLE OPTIONS HAVE BEEN ASSESSED ......................................................................... 17 3.1 Option 1 – New Strathfield South zone substation....................................................... 17 3.2 Option 2 – Refurbish the existing Enfield substation .................................................... 18 3.3 Options considered but not progressed ....................................................................... 18
4 HOW THE OPTIONS HAVE BEEN ASSESSED .................................................................................... 20 4.1 General overview of the assessment framework ......................................................... 20 4.2 Ausgrid’s approach to estimating project costs ............................................................ 20 4.3 Benefits are expected from both reduced involuntary load shedding, as well as
lower operating costs .................................................................................................. 21 4.4 Three different ‘scenarios’ have been modelled to address uncertainity ..................... 22
5 ASSESSMENT OF CREDIBLE OPTIONS ............................................................................................. 24 5.1 Gross market benefits estimated for each credible option ........................................... 24 5.2 Estimated costs for each credible option ..................................................................... 25 5.3 Net present value assessment outcomes .................................................................... 26 5.4 A range of sensitivity tests have also been undertaken on key assumptions .............. 26
6 PROPOSED PREFERRED OPTION ..................................................................................................... 30
APPENDIX A – CHECKLIST OF COMPLIANCE CLAUSES .............................................................................. 31
APPENDIX B – PROCESS FOR IMPLEMENTING THE RIT-D ................................................... 32
APPENDIX C – MARKET BENEFIT CLASSES CONSIDERED NOT RELEVENT ............................................ 33
APPENDIX D – ADDITIONAL DETAIL ON THE ASSESSMENT METHODOLOGY .......................................... 34

DPAR Addressing reliability requirements in the Enfield network area 4
Glossary of Terms
Term Description
AEMO Australian Energy Market Operator
AER Australian Energy Regulator
DNSP Distribution Network Service Provider
DPAR Draft Project Assessment Report
FPAR Final Project Assessment Report
IPART Independent Pricing and Regulatory Tribunal
NPV Net Present Value
NER National Electricity Rules
POE Probability of Exceedance
RIT-D Regulatory Investment Test for Distribution
SAIDI System Average Interruption Duration Index
SAIFI System Average Interruption Frequency Index
USE Unserved Energy
VCR Value of Customer Reliability
DPAR Addressing reliability requirements in the Enfield network area 5
Executive Summary
This report investigates the most economic option for replacing assets at the Enfield zone substation that were installed in the 1960s
This Draft Project Assessment Report (DPAR) has been prepared by Ausgrid and represents the first step in the
application of the Regulatory Investment Test for Distribution (RIT-D) to network and non-network options for ensuring
reliable electricity supply to the Enfield network area going forward.
In particular, the Enfield zone substation was installed in the 1960s by an Ausgrid predecessor, the, then, Sydney County
Council, and its assets are now reaching the end of their service lives and are in poor condition. These assets have
already led to network asset failures and involuntary load shedding in the area and are forecast to continue to do so, with
increasing frequency and magnitude, going forward. This exposes Ausgrid’s customers in the Enfield area to a level of
involuntary load shedding that exceed allowable levels under reliability standards applicable to Ausgrid.
Many assets installed around this period in time that help supply the wider Canterbury-Bankstown area have, in recent
years, reached, or exceeded, the end of their expected service lives. Planning for a solution to address deteriorating and
aging assets in this region began in 2012, with an overall staged replacement plan being formulated for these assets. As
part of this wider plan, Ausgrid has recently commenced construction of a new zone substation at Summer Hill, which
was identified as the most efficient option for replacing ageing assets at the Dulwich Hill zone substation, which is also in
the Canterbury-Bankstown area.
Ausgrid has prepared this report in response to recent Rules changes requiring the RIT-D to be applied to replacement expenditure
Changes to the National Electricity Rules (NER) in July 2017 have meant that later stages of the wider replacement plan
for ageing assets in the Canterbury-Bankstown area are now subject to the Regulatory Investment Test for Distribution
(RIT-D). These changes allowed businesses, like Ausgrid, a grace period to transition to his new requirement and
exempts replacement projects that are committed to by 30 January 2018 from the RIT-D process.
Ausgrid’s planning for the ageing asset, and consequent reliability, issues at the Enfield zone substation began in 2010
and, in 2015-16, it was determined that the most efficient solution was retiring the existing substation and replacing it with
a new zone substation at Strathfield South. While Ausgrid is now well advanced in the planning, approvals and
procurement processes for this new substation, it is not yet ‘committed’ (and will not be by 30 January 2018).
Accordingly, Ausgrid has initiated this RIT-D for replacing ageing assets at the Enfield zone substation project in order to
identify a preferred option that ensures Ausgrid is able to satisfy its reliability and performance standards.
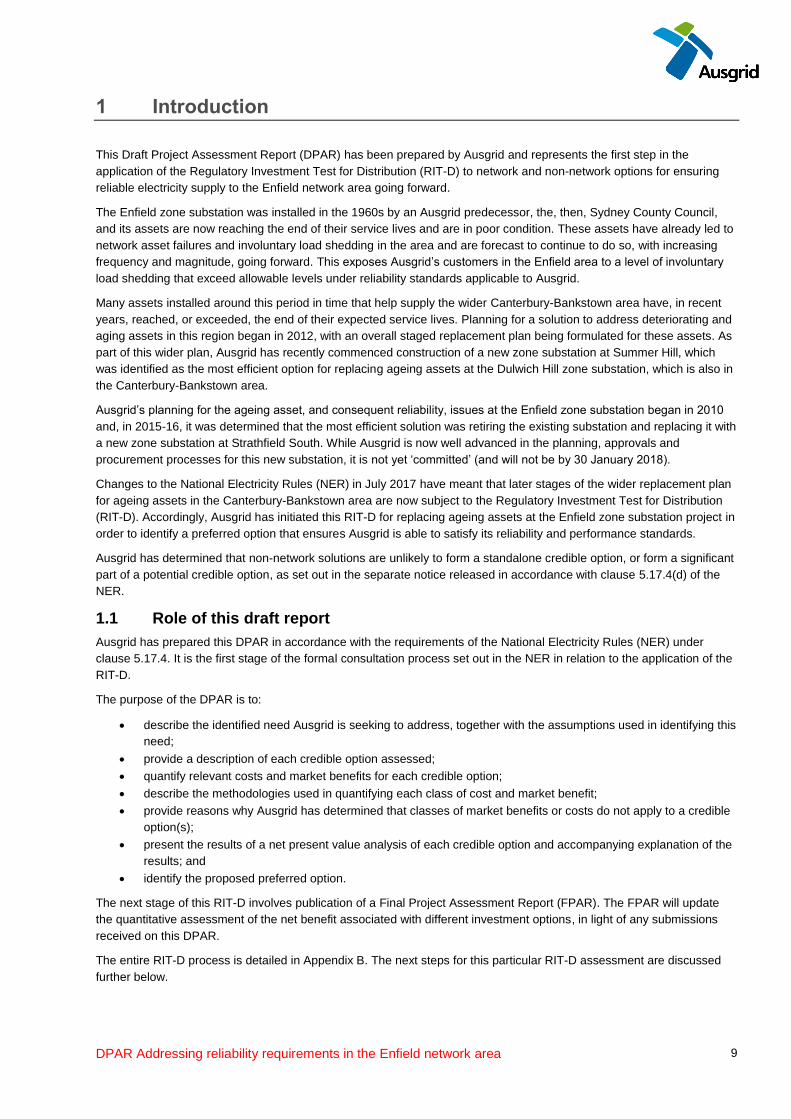
Two credible network options have been assessed to address reliability concerns
The two credible options that have been assessed to address future reliability concerns are summarised in the table
below.
Table 1 – Summary of the credible options considered
Network option description Key components Capacity Estimated capital cost,
$2017/18
Option 1 – Build a new Strathfield
South substation to replace the
existing Enfield substation
Enfield 33/11kV replaced with
Strathfield South 132/11 kV
65 MVA $28 million
Option 2 – Refurbish the existing
Enfield substation
Switchgear and feeder
replacement at the existing Enfield
substation
50 MVA $43 million
Ausgrid also considered decommissioning the existing Enfield zone substation entirely and transferring load to elsewhere
in the network. However, the costs associated with this option are considered to be significantly greater than for the
above options and this option is not expected to deliver commensurate additional market benefits. The option of
decommissioning has therefore not been progressed.

DPAR Addressing reliability requirements in the Enfield network area 6
Non-network options are not considered viable for this RIT-D
Ausgrid has also considered the ability of any non-network solutions to assist in meeting the identified need. A demand
management assessment into reducing the risk of unserved energy from the 33 kV feeders and 11 kV switchgear
showed that non-network alternatives cannot cost-effectively address the risk, compared to the two network options
outlined above. This result is driven primarily by the significant amount of expected unserved energy that each network
option allows to be avoided, compared to base case, and is detailed further in the separate notice released in
accordance with clause 5.17.4(d) of the NER.
If during the course of this RIT-D process, a cost-effective non-network solution emerges, then it will be assessed
alongside the other options.
Three different ‘scenarios’ have been modelled to deal with uncertainity
Ausgrid has elected to assess three alternative future scenarios – namely:
• Low benefit scenario – Ausgrid has adopted a number of assumptions that give rise to a lower bound NPV
estimate for each credible option, in order to represent a conservative future state of the world with respect to
potential market benefits that could be realised under each credible option;
• Baseline scenario – the baseline scenario consists of assumptions that reflect Ausgrid’s central set of variable
estimates, which, in Ausgrid’s opinion, provides the most likely scenario; and
• High benefit scenario – this scenario reflects an optimistic set of assumptions, which have been selected to
investigate an upper bound on reasonably expected potential market benefits.
Table 2 – Summary of the three scenarios investigated
Variable Scenario 1 – low benefits Scenario 2 – baseline Scenario 3 – high benefits
Demand POE90 POE50 POE10
VCR $28/kWh
(30 per cent lower than the
central, AEMO-derived
estimate)
$40/kWh
(Derived from the AEMO
VCR estimates)
$90/kWh
(Consistent with the recent
IPART review of
transmission reliability
standards for this area)
Commercial discount rate 8.07 per cent 6.13 per cent 4.19 per cent
Option 1 has the highest expected net market benefits, under all scenarios
Expected benefits are driven primarily by the value of involuntary load shedding avoided under each option (and is very
similar for both options, since they both avoid the escalating USE associated with keeping ageing Enfield zone substation
assets in service). Additional benefits are expected from avoided operating cost benefits (ie, reduced planned routine
maintenance and refurbishment of ageing assets, reduced unplanned corrective maintenance when assets fail and
reduced operating costs associated with safety and environmental costs). Overall, Option 1 has slightly higher benefits
overall on account of it being able to be commissioned earlier than Option 2.

DPAR Addressing reliability requirements in the Enfield network area 7
Figure 1 – Breakdown of gross economic benefits of each credible option relative to the base case
0
50
100
150
200
250
Option 1 Option 2 Option 1 Option 2 Option 1 Option 2
Scenario 1 Scenario 2 Scenario 3
NP
V, $
mill
ion
s 2
01
7/1
8
Involuntary load shedding Planned routine maintenance and refurbishment
Unplanned corrective maintenance Safety risk costs
The figure below provides a breakdown of costs relating to each credible option. The significantly greater cost associated
with Option 2 are largely due to the replacement of the 33 kV gas pressure feeders associated with the existing
substation, each of which is approximately 5.4km long, totalling 16.3 km. Decommissioning costs are slightly greater for
Option 1, as the entire Enfield substation is decommissioned (as opposed to just the existing 11kV switchgear at Enfield
zone substation and associated 33 kV gas pressure feeders under Option 2).
Figure 2 – Breakdown of gross costs of each credible option relative to the base case
-30
-25
-20
-15
-10
-5
0
Option 1 Option 2 Option 1 Option 2 Option 1 Option 2
Scenario 1 Scenario 2 Scenario 3
NP
V, $
mill
ion
s 2
01
7/1
8
Capital cost Decommissioning cost
The table below summarises the net market benefit in NPV terms for each credible option under each scenario.
The table shows that corresponding ranking of each option, for each scenario with the options ranked in order of
descending net benefits. Option 1 is shown to be preferred over Option 2, which is driven primarily by the significantly
lower costs it involves.
Table 3 – Present value of expected economic benefits of credible options relative to the base case,
$m 2017/18
Option Scenario 1 Scenario 2 Scenario 3 Weighted Option ranking
Option 1 24.7 55.5 181.7 79.3 1
Option 2 16.6 46.3 169.7 69.7 2

DPAR Addressing reliability requirements in the Enfield network area 8
Option 1 is the preferred option at this draft stage
Option 1 has been found to be the preferred option, which satisfies the RIT-D. It involves decommissioning the Enfield
zone substation and replacing it with a new Strathfield South zone substation. Ausgrid is the proponent for Option 1.
In addition, Option 1 offers the following benefits:
• it has a significantly lower costs than Option 2 (eg, it involves $28 million of capital cost compared to $43
million);
• it provides greater network capacity than Option 2 (ie, 65 MVA compared to 50 MVA);
• it avoids upstream investment at the Canterbury sub-transmission substation, otherwise required; and
• it addresses condition issues at Enfield zone substation and also facilitates addressing future asset condition
and capacity issues identified at Campsie zone substation.
The scope of Option 1 includes:
• construction of a 132/11 kV zone substation on a greenfield site to accommodate two 50MVA power
transformers, 132kV and 11kV switchgear and associated control and protection equipment;
• installation of 132kV connections to overhead 132kV feeder 911 that passes in close proximity to the new site;
• transfer of 11kV load from the existing Enfield zone substation to the new site; and
• decommissioning of the existing Enfield zone substation and associated 33 kV gas pressure cables.
A new Strathfield South zone substation will be looped into the existing 132 kV overhead feeder 911, which runs near to
the proposed site at Dunlop Street. Feeder 911 will be split at an appropriate location, and each end brought into the site
via new underground cable sections. This will create one feeder between TransGrid’s Sydney South Bulk Supply Point
and Strathfield South, and one feeder between Strathfield South and Canterbury Sub-Transmission Substation.
It is anticipated that the sections connecting the two ends of the split feeder 911 with the zone substation will be
underground, due to difficulties associated with an overhead connection in terms of complexities in the layout design,
building setback changes, clearances and community issues.
The estimated capital cost of Option 1 is $28 million. Annual operating costs associated with this new capex are
estimated to be around $140,000 per annum (assumed to be 0.5 per cent of the capital cost).
Ausgrid estimates that the environmental approval and construction timeline for Option 1 is 30 months, with assumed
commissioning during 2020/21. The decommissioning of the existing Enfield zone substation and associated 33 kV
feeders is expected to be completed by 2021/22. Ausgrid intends to commence work on delivering Option 1 in 2018 (in
particular, we intend to award the design and construction contract in February 2018, have environmental approvals
finalised in June 2018 and to commence construction in September 2018).
Overall, this finding confirms the earlier planning assessment exercises undertaken by Ausgrid in 2015 that concluded
that a new Strathfield South substation is the most efficient option for replacing the assets at the Enfield zone substation.
How to make a submission and next steps
Ausgrid welcomes written submissions on this DPAR. Submissions are due on or before 2 February 2018.
Submissions and queries should be addressed to:
Matthew Webb
Head of Asset Investment
Ausgrid
GPO Box 4009
Sydney 2001
Or
email to: [email protected]
DPAR Addressing reliability requirements in the Enfield network area 9
1 Introduction
This Draft Project Assessment Report (DPAR) has been prepared by Ausgrid and represents the first step in the
application of the Regulatory Investment Test for Distribution (RIT-D) to network and non-network options for ensuring
reliable electricity supply to the Enfield network area going forward.
The Enfield zone substation was installed in the 1960s by an Ausgrid predecessor, the, then, Sydney County Council,
and its assets are now reaching the end of their service lives and are in poor condition. These assets have already led to
network asset failures and involuntary load shedding in the area and are forecast to continue to do so, with increasing
frequency and magnitude, going forward. This exposes Ausgrid’s customers in the Enfield area to a level of involuntary
load shedding that exceed allowable levels under reliability standards applicable to Ausgrid.
Many assets installed around this period in time that help supply the wider Canterbury-Bankstown area have, in recent
years, reached, or exceeded, the end of their expected service lives. Planning for a solution to address deteriorating and
aging assets in this region began in 2012, with an overall staged replacement plan being formulated for these assets. As
part of this wider plan, Ausgrid has recently commenced construction of a new zone substation at Summer Hill, which
was identified as the most efficient option for replacing ageing assets at the Dulwich Hill zone substation, which is also in
the Canterbury-Bankstown area.
Ausgrid’s planning for the ageing asset, and consequent reliability, issues at the Enfield zone substation began in 2010
and, in 2015-16, it was determined that the most efficient solution was retiring the existing substation and replacing it with
a new zone substation at Strathfield South. While Ausgrid is now well advanced in the planning, approvals and
procurement processes for this new substation, it is not yet ‘committed’ (and will not be by 30 January 2018).
Changes to the National Electricity Rules (NER) in July 2017 have meant that later stages of the wider replacement plan
for ageing assets in the Canterbury-Bankstown area are now subject to the Regulatory Investment Test for Distribution
(RIT-D). Accordingly, Ausgrid has initiated this RIT-D for replacing ageing assets at the Enfield zone substation project in
order to identify a preferred option that ensures Ausgrid is able to satisfy its reliability and performance standards.
Ausgrid has determined that non-network solutions are unlikely to form a standalone credible option, or form a significant
part of a potential credible option, as set out in the separate notice released in accordance with clause 5.17.4(d) of the
NER.
1.1 Role of this draft report
Ausgrid has prepared this DPAR in accordance with the requirements of the National Electricity Rules (NER) under
clause 5.17.4. It is the first stage of the formal consultation process set out in the NER in relation to the application of the
RIT-D.
The purpose of the DPAR is to:
• describe the identified need Ausgrid is seeking to address, together with the assumptions used in identifying this
need;
• provide a description of each credible option assessed;
• quantify relevant costs and market benefits for each credible option;
• describe the methodologies used in quantifying each class of cost and market benefit;
• provide reasons why Ausgrid has determined that classes of market benefits or costs do not apply to a credible
option(s);
• present the results of a net present value analysis of each credible option and accompanying explanation of the
results; and
• identify the proposed preferred option.
The next stage of this RIT-D involves publication of a Final Project Assessment Report (FPAR). The FPAR will update
the quantitative assessment of the net benefit associated with different investment options, in light of any submissions
received on this DPAR.
The entire RIT-D process is detailed in Appendix B. The next steps for this particular RIT-D assessment are discussed
further below.

DPAR Addressing reliability requirements in the Enfield network area 10
1.2 Making a submission and next steps
Ausgrid welcomes written submissions on this DPAR. Submissions are due on or before 2 February 2018.
Submissions and queries should be addressed to:
Matthew Webb
Head of Asset Investment
Ausgrid
GPO Box 4009
Sydney 2001
Or
email to: [email protected]
Submissions will be published on the Ausgrid website. If you do not want your submission to be publicly available please
clearly stipulate this at the time of lodgement.
DPAR Addressing reliability requirements in the Enfield network area 11
2 Description of the identified need
This section provides a description of the network area and the ‘identified need’ for this RIT-D, before presenting a
number of key assumptions underlying the identified need.
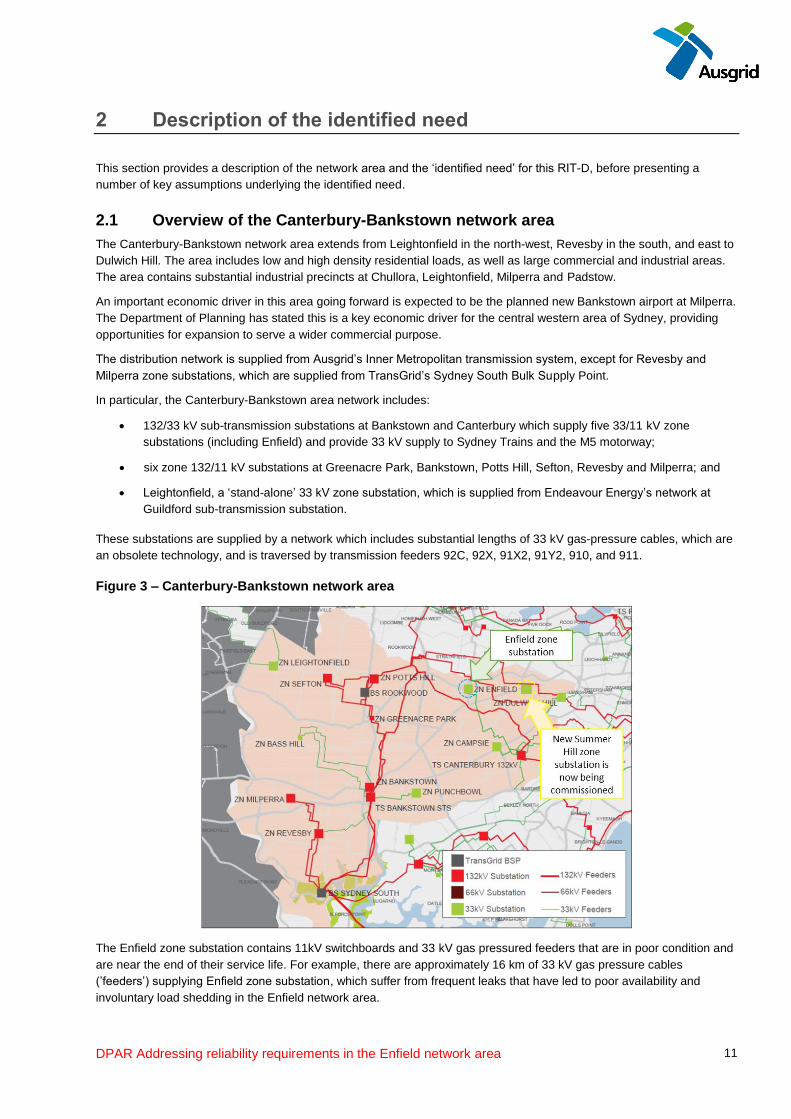
2.1 Overview of the Canterbury-Bankstown network area
The Canterbury-Bankstown network area extends from Leightonfield in the north-west, Revesby in the south, and east to
Dulwich Hill. The area includes low and high density residential loads, as well as large commercial and industrial areas.
The area contains substantial industrial precincts at Chullora, Leightonfield, Milperra and Padstow.
An important economic driver in this area going forward is expected to be the planned new Bankstown airport at Milperra.
The Department of Planning has stated this is a key economic driver for the central western area of Sydney, providing
opportunities for expansion to serve a wider commercial purpose.
The distribution network is supplied from Ausgrid’s Inner Metropolitan transmission system, except for Revesby and
Milperra zone substations, which are supplied from TransGrid’s Sydney South Bulk Supply Point.
In particular, the Canterbury-Bankstown area network includes:
• 132/33 kV sub-transmission substations at Bankstown and Canterbury which supply five 33/11 kV zone
substations (including Enfield) and provide 33 kV supply to Sydney Trains and the M5 motorway;
• six zone 132/11 kV substations at Greenacre Park, Bankstown, Potts Hill, Sefton, Revesby and Milperra; and
• Leightonfield, a ‘stand-alone’ 33 kV zone substation, which is supplied from Endeavour Energy’s network at
Guildford sub-transmission substation.
These substations are supplied by a network which includes substantial lengths of 33 kV gas-pressure cables, which are
an obsolete technology, and is traversed by transmission feeders 92C, 92X, 91X2, 91Y2, 910, and 911.
Figure 3 – Canterbury-Bankstown network area
The Enfield zone substation contains 11kV switchboards and 33 kV gas pressured feeders that are in poor condition and
are near the end of their service life. For example, there are approximately 16 km of 33 kV gas pressure cables
(’feeders’) supplying Enfield zone substation, which suffer from frequent leaks that have led to poor availability and
involuntary load shedding in the Enfield network area.

DPAR Addressing reliability requirements in the Enfield network area 12
Originally installed in the early 1960s, these substation assets are experiencing a heightened level of failure and poor
availability, which exposes Ausgrid’s customers in the Enfield area to a level of involuntary load shedding that exceeds
allowable levels under the reliability standards applicable to Ausgrid.
Consequently, Ausgrid has identified a need to undertake reliability corrective action to address issues at the Enfield
zone substation in order to maintain reliable network services to customers in this network area.
Ausgrid considers that the 11kV switchboards and 33 kV feeders at the Enfield zone substation are assets that require
priority replacement. While a one-for-one replacement of problematic network assets at the Enfield zone substation is
possible, Ausgrid has also explored the option of constructing a new greenfield substation to replace Enfield, which it
considers can potentially resolve reliability issues at a lower net cost.
It is important to note that these aging assets have already led to asset failures and involuntary load shedding in the area
and are forecast to continue to do so, with increasing frequency and magnitude, going forward, unless action is taken.
Ausgrid embarked on a wider network-wide replacement plan at the beginning of the 2009-14 regulatory period to
remove approximately 250 km of obsolete gas cables by the end of FY19. This strategy has since been superseded by
the probabilistic planning approach now used for Area Plan modelling but has, to-date, retired approximately:
• 80 km of gas cable during the 2009-14 period; and
• a further 63 km during the current period.
At the beginning of FY18 there was approximately 108km of gas cable remaining on the network and Ausgrid
determined, based on the Area Plan modelling completed in August 2017, that all gas cables will be retired by the end of
FY29. Approximately 83km (77 per cent), including those supplying the Enfield zone substation, are planned to be retired
by the end of FY21. The figure below illustrates how replacing the 33 kV gas cables supplying Enfield are part of a wider,
network-wide, replacement of these cables.
Figure 4 – Planned remaining km of 33 kV gas cables across the Ausgrid network
2.2 Overview of Ausgrid’s relevant distribution reliability standards
All New South Wales electricity distribution businesses, including Ausgrid, are obliged to comply with reliability and
performance standards as part of their distributor’s license.1 These standards are determined by the New South Wales
Government.
At a high-level, the reliability and performance standards are specified in terms of both:
• the average frequency of interruptions a customer may face each year; and
• the average time those outages may last.
Specifically, under the current Ausgrid license, reliability and performance standards are expressed in two measures –
namely:
1 Granted by the Minster for Industry, Resources and Energy under the Electricity Supply Act 1995 (NSW).

DPAR Addressing reliability requirements in the Enfield network area 13
• the System Average Interruption Frequency Index – ‘SAIFI’ – which measures the number of times on average
that customers have their electricity interrupted over the year;2 and
• the System Average Interruption Duration Index – ‘SAIDI’ – which measures the total length of time (in minutes)
that, on average, a customer would have their electricity supply interrupted over a given period.3
These two reliability measures capture two key sources of inconvenience to electricity customers from supply disruptions,
ie, how long their electricity supply is off for as well as how often their electricity supply is off. Customers experience less
inconvenience (ie, a better level of supply reliability), the lower each of these measures. Reliability standards applied to
distribution networks typically set minimum requirements in relation to each of these two measures.
The current reliability standards applying to the Enfield network area (classified as an ‘urban’ feeder type) are shown in
the table below.
Table 4 – Current distribution reliability standards applying to Ausgrid4
Feeder type Network Overall Reliability Standards Individual Feeder Reliability Standard
SAIDI
(Minutes per
customer)
SAIFI
(Number per
customer)
SAIDI
(Minutes per
customer)
SAIFI
(Number per
customer)
Urban 80 1.2 350 4
2 SAIFI is calculated as the total number of interruptions that have occurred during the relevant period, divided by the number of
customers. Momentary interruptions (which in NSW are currently defined as interruptions less than one minute) are typically not
included. 3 SAIDI is calculated as the sum of the duration of all customer interruptions over the period divided by the number of customers.
Momentary interruptions (ie, those of less than one minute) are typically not included. 4 The Hon. Anthony Roberts MP Minister for Industry, Resources & Energy, Reliability and Performance Licence Conditions for
Electricity Distributors, 1 December 2016, pp. 18-19 - available at:
https://www.ipart.nsw.gov.au/files/sharedassets/website/shared-files/licensing-administrative-electricity-network-operations-proposed-
new-licence-conditions/ausgrid-ministerial-licence-conditions-1-december-2016.pdf

DPAR Addressing reliability requirements in the Enfield network area 14
2.3 Key assumptions underpinning the identified need
The need to undertake reliability corrective action is predicated on the deteriorating condition of assets at the Enfield
zone substation, and the characteristics of any resultant outages.
2.3.1 Ageing assets at the Enfield zone substation are expected to increase the risk of involuntary load shedding going forward
The Enfield zone substation was commissioned in 1962 and is supplied by three 33 kV gas pressure cables (feeders
639, 640 and 641) that originate from Canterbury sub-transmission station. Among these feeders, feeder 640 has been
identified as having the highest leakage rate and second worst availability of all gas pressured cables in Ausgrid’s
network, while feeder 641 has the tenth highest leakage rate in Ausgrid’s network and the worst availability. Feeder 639
is also among the lower performing feeders in Ausgrid’s network.
The poor performance of the Enfield feeders has already caused significant involuntary load shedding. In February 2011
for example:
• feeder 640 failed while feeder 639 was out for service due to a gas leak;
• before feeder 639 could be returned to service, feeder 641 also failed; and
• the consequence of these coincident failures meant that a significant number of customers experienced
involuntary load shedding over a period of four days, which peaked on 2 February when approximately 17,400
customers had their supply interrupted.
The additional cost of emergency restoration incurred by Ausgrid as a result of this outage was $1.5 million, which
included the costs of procuring and providing 25 emergency mobile generators as well as a temporary emergency
33/11 kV substation connected to a RailCorp 33 kV feeder. This $1.5 million cost is in addition to the value of customer
load not supplied during the period of interruption.
The 2011 incident serves to demonstrate the heightened supply risk arising from the long repair times of gas pressure
cables that are in poor condition in urban regions.
The 11 kV switchgear at the Enfield zone substation are also problematic given their age. 11 kV compound insulated
switchboards were first commissioned in 1962 at the Enfield zone substation. This type of switchgear uses bituminous
compound insulation busbars and oil-filled circuit breakers. The presence of both oil and insulating compound creates a
heightened fire risk in the event of failure. This equipment is now considered beyond its design life, as manufacturers no
longer support compound insulated technology.
Network asset failure probabilities and asset unavailability have a significant effect on the expected level of involuntary
load shedding.
2.3.2 The probability of assets failing increases with age
Ausgrid has adopted well-accepted models for each major class of network asset to estimate the probability of failure. In
general, the probability of failure increases with asset age. The figures below describe the escalating unavailability for
switchboards and underground cables over time – being the two key asset types for the substation in question.
Figure 5 shows base estimates for the level of unavailability of 11 kV switchboards and includes upper and lower bound
estimates that reflect subtracting or adding ten years from the age of each switchboard. It also maps to these curves the
age of the current 11 kV switchboards at the Enfield zone substation and illustrates how these assets are now 5 years
past their ‘standard’ assets lives (and will be 8-9 years past by the time one of the credible options is commissioned).
The current method used to prioritise switchboard replacements across the Ausgrid network is based on estimating the
parameters for a Weibull distribution that best matches the total observed switchboard failure pattern. The Weibull
parameters are adapted for a specific switchboard based on its condition prior to being used as the input into Sub-
transmission probabilistic model to prioritise replacement. Ausgrid consider this to be consistent with industry practice.

DPAR Addressing reliability requirements in the Enfield network area 15
Figure 5 – Unavailability of 11 kV switchboards
Figure 6 below shows unavailability plotted, on a logarithmic scale, for a representative 10km stretch of cables aged zero
to one hundred years. It also maps to these curves the age of the current underground gas pressure cables at the Enfield
zone substation and, in doing so, illustrates how these cables are now 10 years past the ‘standard’ asset life for such
cables (and will be 13-14 years past by the time one of the credible options is commissioned).
While the figure below plots a range of underground cable technologies, it is only ‘gas pressure’ cables that are relevant
for the Enfield zone substation, ie, the blue line.
Figure 6 – Unavailability of underground cables
This model is also based on the assumption that the condition of a cable is dependent upon its age. The Crow-AMSAA
model shows that the availability of gas pressure cables is expected to decline if the cables are retained past an age of
50 years. Ausgrid considers this methodology is consistent with industry practice. A detailed discussion of the probability
of failure and asset availability is provided in Appendix A.

DPAR Addressing reliability requirements in the Enfield network area 16
2.3.3 Supply restoration takes time but load transfers are possible
The level of cost expected from any involuntary load shedding is dependent on underlying assumptions relating to supply
restoration times.
Ausgrid considers that the time required for restoration after a cable failure or switchboard of the type in the Enfield
substation can vary between 10.5 and 24.5 days depending on the type of failure and the asset that failed. Detailed
restoration assumptions are set out in Appendix D. Ausgrid notes that the February 2011 outage lasted for four days.
As part of restoring supply after an outage, the Enfield zone substation has load transfer capabilities that can mitigate the
severity of involuntary load shedding. In particular, the Enfield zone substation has a 11 kV interconnection with
Burwood, Campsie, Potts Hill, Greenacre Park, and Dulwich Hill.
In the event of a total loss of supply to Enfield zone substation, approximately 60 per cent of the load can be recovered
within days via the 11 kV load transfer capacity of the existing network.
These load transfers can help mitigate any consequent unserved energy to customers following failures of assets at the
Enfield zone substation. Ausgrid has factored the ability to transfer load into its assessment of the identified need, and
the credible options and, in particular, forecasts of unserved energy.
Whilst many customers can be restored through switching operations in the 11kV network combined with the use of
mobile generation sets, the incident recovery process (ie, cable and/or substation equipment repairs) can take several
weeks.

DPAR Addressing reliability requirements in the Enfield network area 17
3 Two credible options have been assessed
This section provides descriptions of the credible options Ausgrid identified as part of its network planning activities to
date. In particular, Ausgrid has identified two network options that involve the replacement of critical network assets,
either by replacing the existing Enfield substation, or refurbishing it.
The two credible options are summarised in the table below. All costs in this section are in $2017/18, unless otherwise
stated.
Table 5 – Summary of the credible options considered
Network option description Key components Capacity Estimated capital cost
Option 1 – Build a new Strathfield
South substation to replace the
existing Enfield substation
Enfield 33/11 kV replaced with
Strathfield South 132/11 kV
65 MVA $28 million
Option 2 – Refurbish the existing
Enfield substation
Switchgear and feeder
replacement at the existing
Enfield substation
50 MVA $43 million
Ausgrid also considered decommissioning the existing Enfield zone substation entirely and transferring load to elsewhere
in the network. However, the costs associated with this option are considered to be significantly greater than for the
above options and this option is not expected to deliver commensurate additional market benefits. The option of
decommissioning has therefore not been progressed, as outlined in section 3.3 below.
Ausgrid has also determined that non-network solutions are unlikely to form a standalone credible option, or form a
significant part of a potential credible option, as set out in the separate notice released in accordance with clause
5.17.4(d) of the NER. A summary of Ausgrid’s consideration of non-network options is provided in section 3.3 below.
3.1 Option 1 – New Strathfield South zone substation
Option 1 involves the replacement of Enfield zone substation with a new zone substation at Strathfield South.
In particular, this option involves the following key components:
• construction of a 132/11 kV zone substation on a greenfield site to accommodate two 50MVA power
transformers, 132 kV and 11 kV switchgear and associated control and protection equipment;
• installation of 132 kV connections to overhead 132kV feeder 911 that passes in close proximity to the new site;
• transfer of 11 kV load from the existing Enfield zone substation to the new site; and
• decommissioning of the existing Enfield zone substation and associated 33 kV gas pressure cables.
A new Strathfield South zone substation will be looped into the existing 132 kV overhead feeder 911, which runs near to
the proposed site at Dunlop Street. Feeder 911 will be split at an appropriate location, and each end brought into the site
via new underground cable sections. This will create one feeder between TransGrid’s Sydney South Bulk Supply Point
and Strathfield South, and one feeder between Strathfield South and Canterbury Sub-Transmission Substation.
It is anticipated that the sections connecting the two ends of the split feeder 911 with the zone substation will be
underground, due to difficulties associated with an overhead connection in terms of complexities in the layout design,
building setback changes, clearances and community issues.
The estimated capital cost of Option 1 is $28 million. Annual operating costs associated with this new capex are
estimated to be about 0.5 per cent of the capital cost.
Ausgrid estimates that the environmental approval and construction timeline for Option 1 is 30 months, with assumed
commissioning in 2020/21.5 The decommissioning of the existing Enfield zone substation and associated 33 kV feeders
is expected to be completed in 2021/22.
5 Refer to section 5.4.1 for a discussion of the ‘trigger year’ assessment for Option 1.

DPAR Addressing reliability requirements in the Enfield network area 18
3.2 Option 2 – Refurbish the existing Enfield substation
Option 2 involves 11 kV switchgear and 33 kV feeder replacement to retain the existing Enfield zone substation in
service.
In particular, this option involves the following key components:
• staged replacement of the 11kV switchgear and associated control and protection systems in situ;
• transfer 11kV load to neighbouring zone substations (ie, Campsie) to facilitate replacement of first stage of 11kV
panels;
• replacement of the existing 33 kV gas pressure feeders 639, 640 and 641 originating from Canterbury sub-
transmission substation to Enfield zone substation with modern equivalent technology;
• decommissioning the existing 11kV switchgear at Enfield zone substation and associated 33 kV gas pressure
feeders; and
• uprating of at least two power transformers at Canterbury sub-transmission substation from 60MVA to 120MVA.
The estimated capital cost of Option 2 is $43 million. Annual operating costs associated with this new capex are
estimated to be about 0.5 per cent of the capital cost.
It is worth noting that approximately half of the costs for this option are associated to the replacement of the 33kV gas
pressure feeders, each of which is approximately 5.4km long (totalling 16.3 km). The new cables will have at least the
same length because they will also be originated from Canterbury sub-transmission substation, which in turn requires an
increase of its rating capacity to meet future 33 kV supply requirements.
Ausgrid estimates that the environmental approval and construction timeline for Option 2 is approximately three and a
half years, with assumed commissioning in 2022/23.6 The upstream augmentation at Canterbury sub-transmission
substation is required by 2023/24.
3.3 Options considered but not progressed
In Ausgrid’s view, the nature of the identified need (ie, to address reliability concerns going forward on account of ageing
assets at the existing Enfield zone substation), means that there are essentially only two types of credible options
available – namely, to decommission the existing substation and replace it with a new substation at Strathfield South, or
to refurbish the assets in question and retain the Enfield substation.
In arriving at this view, Ausgrid also considered the option of decommissioning the existing Enfield zone substation and
transferring load to elsewhere in the network. However, preliminary investigations undertaken by Ausgrid determined
that, while this option was found to have equivalent expected costs to Option 1:
• extensive 11 kV work would be required to connect all 11 kV feeders to a new point of supply if Enfield were
decommissioned, considering the location and characteristics of loads in the area – Ausgrid notes that 11 kV
works often vary greatly as a result of issues encountered during the construction phase compared to pre-
project estimates;
• there is no spare capacity available in a single zone substation to accommodate the entire load, and while
Enfield zone substation has 11kV interconnections with several zone substations such as Burwood, Campsie,
Potts Hill, Greenacre Park and Dulwich Hill, some of these sites are undergoing significant replacement works
and cannot be used to absorb some of the 11kV load from Enfield zone substation; and
• decommissioning the existing Enfield zone substation would mean that load could not be transferred from the
Campsie zone substation to either Strathfield South or Enfield (as is assumed under option 1 and 2,
respectively) to enable the planned switchgear replacement at Campsie.
Consideration of a decommissioning option was therefore discontinued in light of the relatively high degree of uncertainty
regarding the total cost of this option, relative to Option 1.
Ausgrid has also considered the ability of any non-network solutions to assist in meeting the identified need. A demand
management assessment into reducing the risk of unserved energy from the 33 kV feeders showed that non-network
alternatives cannot cost-effectively address the risk, compared to the two network options outlined above. This result is
6 Refer to section 5.4.1 for a discussion of the ‘trigger year’ assessment for Option 2.

DPAR Addressing reliability requirements in the Enfield network area 19
driven primarily by the significant amount of unserved energy that each network option allows to be avoided, compared to
base case, and is detailed further in the separate notice released in accordance with clause 5.17.4(d) of the NER.
If during the course of this RIT-D process, a cost-effective non-network solution emerges, then it will be assessed
alongside the other options.
DPAR Addressing reliability requirements in the Enfield network area 20
4 How the options have been assessed
This section outlines the methodology that Ausgrid has applied in assessing market benefits and costs associated with
each of the credible options considered in this RIT-D.
4.1 General overview of the assessment framework
All costs and benefits for each credible option have been measured against a ‘business as usual’ base case. Under this
base case, Ausgrid is assumed to undertake escalating regular and reactive maintenance activates as the probability of
failure and outages increases over time in the absence of an asset replacement program.
The RIT-D analysis has been undertaken over a 20-year period, from 2018 to 2037. Ausgrid considers that a 20-year
period takes into account the size, complexity and expected life of the relevant credible options to provide a reasonable
indication of the market benefits and costs of the options. While the capital components of the credible options have
asset lives greater than 20 years, Ausgrid has taken a terminal value approach to incorporating capital costs in the
assessment, which ensures that the capital cost of long-lived options is appropriately captured in the 20-year assessment
period.
Ausgrid has adopted a central real, pre-tax discount rate of 6.13 per cent as the central assumption for the NPV analysis
presented in this report. Ausgrid considers that this is a reasonable contemporary approximation of a ‘commercial’
discount rate (a different concept to a regulatory WACC), consistent with the RIT-D.7
Ausgrid has also tested the sensitivity of the results to changes in this discount rate assumption, and specifically to the
adoption of a lower bound real, pre-tax discount rate of 4.19 per cent (equal to the latest AER Final Decision for a
DNSP’s regulatory proposal at the time of preparing this DPAR8), and an upper bound discount rate of 8.07 per cent (i.e.,
a symmetrical upwards adjustment).
4.2 Ausgrid’s approach to estimating project costs
Ausgrid has estimated capital costs by considering the scope of works necessary under each credible option together
with costing experience from previous projects of a similar nature. Where possible, Ausgrid has also estimated capital
costs for each credible option using supplier quotes or other pricing information.
Operating and maintenance costs have been determined for each option by comparing the operating and maintenance
costs with the option in place to the operating and maintenance costs without the option in place. These costs are
included for each year in the planning period. If operating and maintenance costs are reduced with an option in place, the
cost savings are effectively treated as a benefit in the assessment.
Operating costs have been estimated for each credible option and the base case by taking into account:
• the probability and expected level of network asset faults, which translates to the level of corrective
maintenance costs; and
• the level of regular maintenance required to maintain network assets in good working order, including planned
refurbishment costs.
A table of more common equipment outage costs used in the cost benefit analysis are set out below. These costs cover
the corrective capital expenditure required when an asset fails.
7 Ausgrid notes that it has been sourced from the discount rate recently independently estimated as part of the Powering Sydney’s
Future RIT-T. See: TransGrid and Ausgrid, Project Assessment Conclusions Report, Powering Sydney’s Future, November 2017, p. 62
– available at: https://www.transgrid.com.au/news-views/lets-connect/consultations/current-
consultations/Documents/Powering%20Sydney%27s%20Future%20-%20PACR.pdf 8 See TasNetworks’ PTRM for the 2017-19 period, available at: https://www.aer.gov.au/networks-pipelines/determinations-access-
arrangements/tasnetworks-determination-2017-2019/final-decision

DPAR Addressing reliability requirements in the Enfield network area 21
Table 6 – Direct costs of equipment outages
Equipment outage Direct costs
Switchboard failure $5 million (mobile switch room deployment)
Gas cable corrective action $22,331
HSL cable corrective action $9,862
XLPE 33 kV cable corrective action $18,969
XLPE 132 kV corrective action $8,070
All options reduce the incidence of asset failures relative to the base case, and hence the expected operating and
maintenance costs associated with restoring supply.
Ausgrid has also included the financial costs associated with safety and environmental outcomes that are assumed to be
avoided under each of the options, relative to the base case. These costs have been estimated using internal Ausgrid
estimates, and are found to be immaterial in the analysis, both in terms of absolute values as well as being the same
across the two options, as illustrated in section 5.1.
4.3 Benefits are expected from both reduced involuntary load shedding, as well as lower operating costs
Ausgrid considers that the only relevant category of market benefits prescribed under the NER for this RIT-D relate to
changes in involuntary load shedding.
Involuntary load shedding is where a customer’s load is interrupted from the network without their agreement or prior
warning. Ausgrid has forecast load over the assessment period and has quantified the expected unserved energy by
comparing forecast load to network capabilities under system normal and network outage conditions. A reduction in
involuntary load shedding expected from an option, relative to the base case, results in a positive contribution to market
benefits of the credible option being assessed.
Involuntary load shedding of a credible option is derived by the quantity in MWh of involuntary load shedding required
assuming the credible option is completed multiplied by the Value of Customer Reliability (VCR). The VCR is measured
in dollars per MWh and is used as proxy to evaluate the economic impact of unserved energy on customers under the
RIT-D.
Ausgrid has applied a central VCR estimate of $40/kWh, which has been derived from the 2014 AEMO VCR estimates.9
In particular, Ausgrid has escalated the AEMO estimate to dollars of the day and weighted the AEMO estimates
according to the make-up of the specific load considered.
We have also investigated the effect of assuming both a lower and higher underlying VCR estimate. The lower sensitivity
has derived by reducing the AEMO-derived estimate by 30 per cent, consistent with the AEMO-stated level of confidence
in its estimates, and results in an estimate of $28/kWh.10 The higher sensitivity involves applying a VCR of $90/kWh,
consistent with the recent Independent Pricing and Regulatory Tribunal (IPART) review of the transmission reliability
standards for Inner Sydney (a region that includes the Enfield network area), as well as the recently finalised Powering
Sydney’s Future RIT-T.11
In addition, while load forecasts are not a determinant of the identified need (since the reliability standards expected to be
breached relate to the duration and frequency of supply interruptions – neither of which are affected by underlying load),
Ausgrid has investigated how assuming different load forecasts going forward changes the expected net market benefits
under the options. In particular, we have investigated three future load forecasts for the area in question – namely a
9 AEMO, Value of Customer Reliability Review, September 2014, Final Report. 10 AEMO, Value of Customer Reliability Review, September 2014, Final Report, p. 31. 11 TransGrid and Ausgrid, Project Assessment Conclusions Report, Powering Sydney’s Future, November 2017 – available at:
https://www.transgrid.com.au/news-views/lets-connect/consultations/current-
consultations/Documents/Powering%20Sydney%27s%20Future%20-%20PACR.pdf
DPAR Addressing reliability requirements in the Enfield network area 22
central forecast using our 50 per cent probability of exceedance (‘POE50’) forecasts, as well as a low forecast using the
POE90 forecasts and a high forecast using the POE10 forecasts.
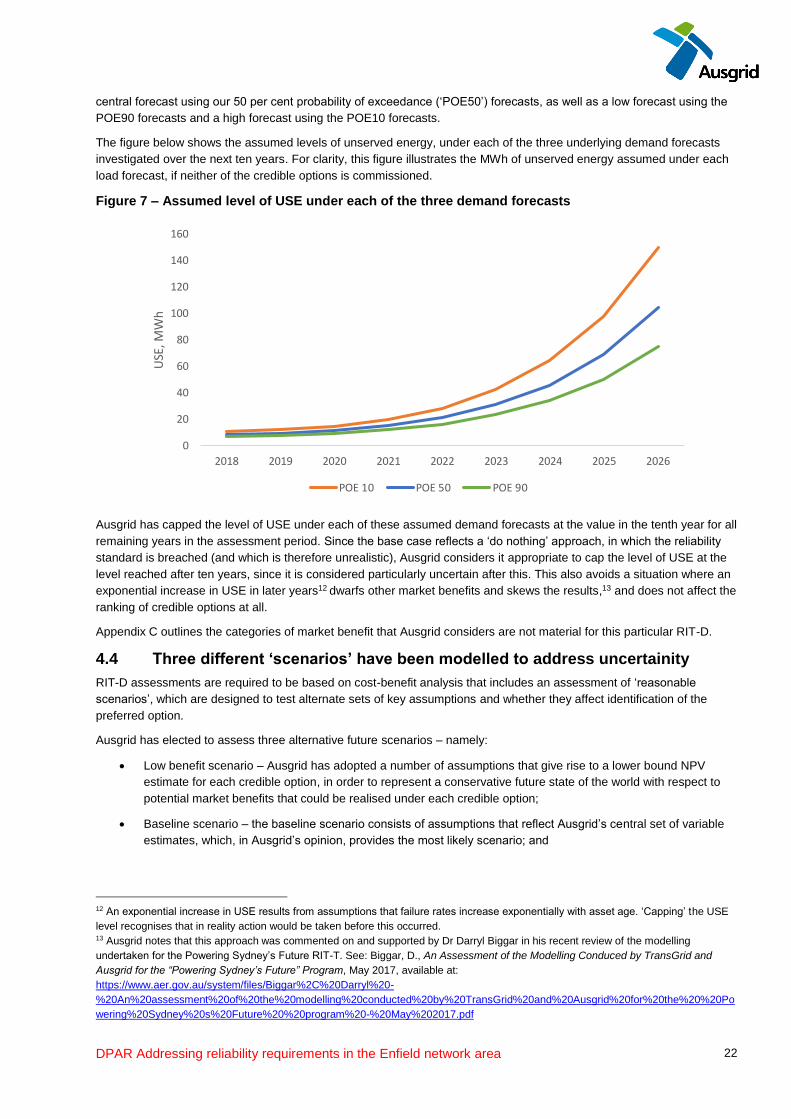
The figure below shows the assumed levels of unserved energy, under each of the three underlying demand forecasts
investigated over the next ten years. For clarity, this figure illustrates the MWh of unserved energy assumed under each
load forecast, if neither of the credible options is commissioned.
Figure 7 – Assumed level of USE under each of the three demand forecasts
0
20
40
60
80
100
120
140
160
2018 2019 2020 2021 2022 2023 2024 2025 2026
USE
, MW
h
POE 10 POE 50 POE 90
Ausgrid has capped the level of USE under each of these assumed demand forecasts at the value in the tenth year for all
remaining years in the assessment period. Since the base case reflects a ‘do nothing’ approach, in which the reliability
standard is breached (and which is therefore unrealistic), Ausgrid considers it appropriate to cap the level of USE at the
level reached after ten years, since it is considered particularly uncertain after this. This also avoids a situation where an
exponential increase in USE in later years12 dwarfs other market benefits and skews the results,13 and does not affect the
ranking of credible options at all.
Appendix C outlines the categories of market benefit that Ausgrid considers are not material for this particular RIT-D.
4.4 Three different ‘scenarios’ have been modelled to address uncertainity
RIT-D assessments are required to be based on cost-benefit analysis that includes an assessment of ‘reasonable
scenarios’, which are designed to test alternate sets of key assumptions and whether they affect identification of the
preferred option.
Ausgrid has elected to assess three alternative future scenarios – namely:
• Low benefit scenario – Ausgrid has adopted a number of assumptions that give rise to a lower bound NPV
estimate for each credible option, in order to represent a conservative future state of the world with respect to
potential market benefits that could be realised under each credible option;
• Baseline scenario – the baseline scenario consists of assumptions that reflect Ausgrid’s central set of variable
estimates, which, in Ausgrid’s opinion, provides the most likely scenario; and
12 An exponential increase in USE results from assumptions that failure rates increase exponentially with asset age. ‘Capping’ the USE
level recognises that in reality action would be taken before this occurred. 13 Ausgrid notes that this approach was commented on and supported by Dr Darryl Biggar in his recent review of the modelling
undertaken for the Powering Sydney’s Future RIT-T. See: Biggar, D., An Assessment of the Modelling Conduced by TransGrid and
Ausgrid for the “Powering Sydney’s Future” Program, May 2017, available at:
https://www.aer.gov.au/system/files/Biggar%2C%20Darryl%20-
%20An%20assessment%20of%20the%20modelling%20conducted%20by%20TransGrid%20and%20Ausgrid%20for%20the%20%20Po
wering%20Sydney%20s%20Future%20%20program%20-%20May%202017.pdf

DPAR Addressing reliability requirements in the Enfield network area 23
• High benefit scenario – this scenario reflects an optimistic set of assumptions, which have been selected to
investigate an upper bound on reasonably expected potential market benefits.
Table 7 – Summary of the three scenarios investigated
Variable Scenario 1 – low benefits Scenario 2 – baseline Scenario 3 – high benefits
Demand POE90 POE50 POE10
VCR $28/kWh
(30 per cent lower than the
central, AEMO-derived
estimate)
$40/kWh
(Derived from the AEMO
VCR estimates)
$90/kWh
(Consistent with the recent
IPART review of
transmission reliability
standards for this area)
Commercial discount rate 8.07 per cent 6.13 per cent 4.19 per cent
Ausgrid considers that the baseline scenario is the most likely, since it based primarily on a set of expected/central
assumptions. Ausgrid has therefore assigned this scenario a weighting of 50 per cent, with the other two scenarios being
weighted equally with 25 per cent each. However, Ausgrid notes that the identification of the preferred option is the same
across all three scenarios, ie, the result is insensitive to the assumed scenario weights.

DPAR Addressing reliability requirements in the Enfield network area 24
5 Assessment of credible options
This section summarises the results of the NPV analysis, including the sensitivity analysis undertaken. All credible
options assessed as part of this RIT-D have been compared against a ‘business as usual’ base case.
5.1 Gross market benefits estimated for each credible option
Table 8 below summarises the gross benefit of each credible option relative to the base case in present value terms. As
outlined above, the gross market benefits are solely attributable to reduced involuntary load shedding. The gross market
benefit for each option has been calculated for each of the three reasonable scenarios outlined in the section above.
The value of involuntary load shedding avoided under each option is very similar for both options, since they both avoid
the escalating USE associated with keeping ageing Enfield zone substation assets in service. Option 1 has slightly higher
benefits on account of it being able to be commissioned earlier than Option 2.
Table 8 – Present value of gross market benefits for each credible option relative to the base case,
$m 2017/18
Option Scenario 1 Scenario 2 Scenario 3 Weighted gross benefits
Scenario weighting 25% 50% 25% –
Option 1 44.1 74.6 199.8 98.3
Option 2 41.2 70.9 193.4 94.1
Figure 8 provides a breakdown of all benefits relating to each credible option. For clarity, we have combined in this chart
the one category of ‘market benefit’ (ie, reduced involuntary load shedding) with avoided operating cost benefits (ie,
reduced planned routine maintenance and refurbishment of ageing assets, reduced unplanned corrective maintenance
when assets fail and reduced operating costs associated with safety and environmental costs).
Figure 8 – Breakdown of gross economic benefits of each credible option relative to the base case
0
50
100
150
200
250
Option 1 Option 2 Option 1 Option 2 Option 1 Option 2
Scenario 1 Scenario 2 Scenario 3
NP
V, $
mill
ion
s 2
01
7/1
8
Involuntary load shedding Planned routine maintenance and refurbishment
Unplanned corrective maintenance Safety risk costs

DPAR Addressing reliability requirements in the Enfield network area 25
5.2 Estimated costs for each credible option
The table below summarises the gross costs of each credible option relative to the base case in present value terms. The
gross cost is the sum of the project capital costs and decommissioning costs.
The gross cost of each option has been calculated for each of the three reasonable scenarios, in accordance with the
approaches set out in Section 4.
Table 9 – Present value of gross costs of each credible option relative to the base case, $m 2017/18
Option Scenario 1 Scenario 2 Scenario 3 Weighted costs
Scenario weighting 25% 50% 25% –
Option 1 19.4 19.1 18.1 18.9
Option 2 24.6 24.7 23.7 24.4
The figure below provides a breakdown of costs relating to each credible option. The significantly greater cost associated
with Option 2 are largely due to the replacement of the 33 kV gas pressure feeders associated with the existing
substation, each of which is approximately 5.4km long, totalling 16.3 km. Decommissioning costs are slightly greater for
Option 1, as the entire Enfield substation is decommissioned (as opposed to just the existing 11kV switchgear at Enfield
zone substation and associated 33 kV gas pressure feeders under Option 2).
Figure 9 – Breakdown of gross costs of each credible option relative to the base case
-30
-25
-20
-15
-10
-5
0
Option 1 Option 2 Option 1 Option 2 Option 1 Option 2
Scenario 1 Scenario 2 Scenario 3
NP
V, $
mill
ion
s 2
01
7/1
8
Capital cost Decommissioning cost

DPAR Addressing reliability requirements in the Enfield network area 26
5.3 Net present value assessment outcomes
Table 10 summaries the net market benefit in NPV terms for each credible option under each scenario. The net market
benefit is the gross benefit (as set out in Table 8) minus the cost of each option (as outlined in Table 7), all in present
value terms.
The table shows the corresponding ranking of each option for each scenario, with the options ranked in order of
descending net benefits. Option 1 is shown to be preferred over Option 2, which is driven primarily by the significantly
lower costs involved.
Table 10 – Present value of expected economic benefits of credible options relative to the base case,
$m 2017/18
Option Scenario 1 Scenario 2 Scenario 3 Weighted Option ranking
Option 1 24.7 55.5 181.7 79.3 1
Option 2 16.6 46.3 169.7 69.7 2
5.4 A range of sensitivity tests have also been undertaken on key assumptions
Ausgrid has undertaken a through sensitivity testing exercise to understand the robustness of the RIT-D assessment to
underlying assumptions about key variables.
In particular, we have undertaken two tranches of sensitivity testing – namely:
• Step 1 – testing the sensitivity of the optimal timing of the project (‘trigger year’) to different assumptions in
relation to key variables; and
• Step 2 – once a trigger year has been determined, testing the sensitivity of the total NPV benefit associated with
the investment proceeding in that year, in the event that actual circumstances turn out to be different.
That is, Ausgrid has undertaken sensitivity analysis to first determine the optimal timing of the project, to conclude that a
particular year represents the ‘most likely’ date at which the project will be needed.
Having assumed to have committed to the project by this date, Ausgrid has also looked at the consequences of ‘getting it
wrong’ under Step 2 of the sensitivity testing. That is, if demand turns out to be lower than expected, for example, what
would be the impact on the net market benefit associated with the project continuing to go ahead on that date.
We outline how each of these two steps have been applied to test the sensitivity of the key findings.
5.4.1 Step 1 – Sensitivity testing of the assumed optimal timing for each option
Ausgrid has estimated the optimal timing for each option based on the year in which the annualised cost of the project
falls below the expected market benefit from commissioning the project that year. This process was undertaken for both
the baseline set of assumptions and also a range of alternate assumptions for key variables.
This section outlines the sensitivity on the identification of the trigger year to changes in the underlying assumptions. In
particular, the optimal timing of the options is found to be largely invariant to assumptions of:
• a 25 per cent increase/decrease in the assumed network capital costs;
• alternate forecasts of maximum demand growth, based on POE10 (high) and POE90 (low);
• a lower VCR ($28/kWh) and higher VCR value ($90/kWh); and
• a lower discount rate of 4.19 per cent as well as a higher rate of 8.07 per cent.
The figures below outline the impact on the optimal trigger year for each option, under a range of alternate assumptions.
They illustrates that the optimal commissioning date for Option 1 is found to be 2020/21, while for Option 2 it is found to
be 2022/23.14
14 2022/23 has been selected as the optimal commissioning year for Option 2 on account of it being the median of the distribution.

DPAR Addressing reliability requirements in the Enfield network area 27
Figure 10 – Distribution of project need years under each sensitivity investigated – Option 1
2019/20 2020/21 2021/22 2022/23 2023/24 2024/25
High capex
High discount rate
Low VCR
Low demand
High VCR
Low discount rate
High demand
Low capex
Scenario 2
Figure 11 – Distribution of project need years under each sensitivity investigated – Option 2
2019/20 2020/21 2021/22 2022/23 2023/24 2024/25
Low demand
Low VCR
High discount rate
High capex
Low discount rate
Low capex
High demand
High VCR
Scenario 2
On balance, Ausgrid considers that the identification of the central trigger years for all options has been robustly
determined and tested.
5.4.2 Step 2 – Sensitivity testing of the overall net market benefit
Ausgrid has also conducted sensitivity analysis on the overall NPV of the net market benefit, based on the assumed
option timing.
Specifically, Ausgrid has investigated the same sensitivities under this second step as the first step, ie:
• a 25 per cent increase/decrease in the assumed network capital costs;
• alternate forecasts of maximum demand growth, based on POE10 (high) and POE90 (low);
• a lower VCR ($28/kWh) and higher VCR value ($90/kWh);
• a lower discount rate of 4.19 per cent as well as a higher rate of 8.07 per cent.
All these sensitivities investigate the consequences of ‘getting it wrong’ having committed to a certain investment
decision.

DPAR Addressing reliability requirements in the Enfield network area 28
The table on the next page presents the results of these sensitivity tests. The analysis reaffirms the finding that Option 1
is found to be the preferred credible option, and has a positive net market benefit.

DPAR Addressing reliability requirements in the Enfield network area 29
Table 11 – Sensitivity results net present value ($m, 2017/18)
Sensitivity Option 1 Option 2
Central estimate 55.5 46.3
Low capex 60.0 52.2
High capex 50.9 40.3
Low demand 45.1 36.1
High demand 71.3 61.7
Low VCR 44.5 35.6
High VCR 101.3 90.7
Low discount rate 77.9 68.2
High discount rate 39.1 30.6

DPAR Addressing reliability requirements in the Enfield network area 30
6 Proposed preferred option
Option 1 has been found to be the preferred option, which satisfies the RIT-D. It involves decommissioning the Enfield
zone substation and replacing it with a new Strathfield South zone substation. Ausgrid is the proponent for Option 1.
In addition, Option 1 offers the following benefits:
• it has a significantly lower costs than Option 2 (eg, it involves $28 million of capital cost compared to $43
million);
• it provides greater network capacity than Option 2 (ie, 65 MVA compared to 50 MVA);
• it avoids upstream investment at the Canterbury sub-transmission substation, otherwise required; and
• it addresses condition issues at Enfield zone substation and also facilitates addressing future asset condition
and capacity issues identified at Campsie zone substation.
The scope of Option 1 includes:
• construction of a 132/11 kV zone substation on a greenfield site to accommodate two 50MVA power
transformers, 132 kV and 11 kV switchgear and associated control and protection equipment;
• installation of 132 kV connections to overhead 132 kV feeder 911 that passes in close proximity to the new site;
• transfer of 11 kV load from the existing Enfield zone substation to the new site; and
• decommissioning of the existing Enfield zone substation and associated 33 kV gas pressure cables.
A new Strathfield South zone substation will be looped into the existing 132 kV overhead feeder 911, which runs near to
the proposed site at Dunlop Street. Feeder 911 will be split at an appropriate location, and each end brought into the site
via new underground cable sections. This will create one feeder between TransGrid’s Sydney South Bulk Supply Point
and Strathfield South, and one feeder between Strathfield South and Canterbury Sub-Transmission Substation.
It is anticipated that the sections connecting the two ends of the split feeder 911 with the zone substation will be
underground, due to difficulties associated with an overhead connection in terms of complexities in the layout design,
building setback changes, clearances and community issues.
The estimated capital cost of Option 1 is $28 million. Annual operating costs associated with this new capex are
estimated to be around $140,000 per annum (assumed to be 0.5 per cent of the capital cost).
Ausgrid estimates that the environmental approval and construction timeline for Option 1 is 30 months, with assumed
commissioning during 2020/21. The decommissioning of the existing Enfield zone substation and associated 33 kV
feeders is expected to be completed by 2021/22. Ausgrid intends to commence work on delivering Option 1 in 2018 (in
particular, we intend to award the design and construction contract in February 2018, have environmental approvals
finalised in June 2018 and to commence construction in September 2018).

DPAR Addressing reliability requirements in the Enfield network area 31
Appendix A – Checklist of compliance clauses
This section sets out a compliance checklist that demonstrates the compliance of this DPAR with the requirements of
clause 5.17.4(j) of the National Electricity Rules version 103.
Rules
clause
Summary of requirements Relevant sections
in the DPAR
5.17.4(j) (1) a description of the identified need for the investment Sections 2.1 and 2.2
(2) the assumptions used in identifying the identified need Section 2.3
(3) if applicable, a summary of, and commentary on, the submissions on the non-
network options report
NA
(4) a description of each credible option assessed Section 3
(5) where a DNSP has quantified market benefits, a quantification of each
applicable market benefit for each credible option;
Section 5.1
(6) a quantification of each applicable cost for each credible option, including a
breakdown of operating and capital expenditure
Section 5.2
(7) a detailed description of the methodologies used in quantifying each class of
cost and market benefit
Section 4
(8) where relevant, the reasons why the RIT-D proponent has determined that a
class or classes of market benefits or costs do not apply to a credible option
Appendix C
(9) The results of a net present value analysis of each of credible option and
accompanying explanatory statements regarding the results
Section 5
(10) the identification of the proposed preferred option Section 6
(11) for the proposed preferred option, the RIT-D proponent must provide:
(i) details of technical characteristics;
(ii) the estimated construction timetable and commissioning date (where relevant);
(iii) the indicative capital and operating cost (where relevant);
(iv) a statement and accompanying detailed analysis that the proposed preferred
option satisfies the regulatory investment test for distribution; and
(v) if the proposed preferred option is for reliability corrective action and that option
has a proponent, the name of the proponent
Section 6
(12) Contact details for a suitably qualified staff member of the RIT-D proponent to
whom queries on the draft report may be directed.
Section 1

DPAR Addressing reliability requirements in the Enfield network area 32
Appendix B – Process for implementing the RIT-D
For the purposes of applying the RIT-D, the NER establishes a three stage process: (1) the Non-Network
Options Report (or notice circumventing this step); (2) the DPAR; and (3) the FPAR. This process is
summarised in the figure below.

DPAR Addressing reliability requirements in the Enfield network area 33
Appendix C – Market benefit classes considered not relevent
The market benefits that Ausgrid considers will not materially affect the outcome of this RIT-D assessment include:
• changes in voluntary load curtailment;
• costs to other parties;
• load transfer capability and embedded generators;
• option value; and
• electrical energy losses.
The reasons why Ausgrid considers that each of these categories of market benefit is not expected to be material for this
RIT-D are outlined in the table below.
Table 12 – Market benefit categories under the RIT-D not expected to be material
Market benefits Reason for excluding from this RIT-D
Changes in
voluntary load
curtailment
Ausgrid notes that the level of voluntary load curtailment currently present in the NEM is limited.
Where the implementation of a credible option affects pool price outcomes, and in particular
results in pool prices reaching higher levels on some occasions than in the base case, this may
have an impact on the extent of voluntary load curtailment.
Ausgrid notes that none of the options are expected to affect the pool price and so there is not
expected to be any changes in voluntary load curtailment.
Costs to other
parties
This category of market benefit typically relates to impacts on generation investment from the
options. Ausgrid notes that none of the options will affect the wholesale market and so we have
not estimated this category of market benefit.
Changes in the
timing of
unrelated
expenditure
Ausgrid considers that neither of the two options considered will affect the timing of any network
expenditure unrelated to the identified need. The option of decommissioning the existing Enfield
zone substation would have meant that load could not be transferred from the Campsie zone
substation to either Strathfield South or Enfield (as it is assumed to do under option 1 and 2,
respectively), which may have affected the timing of switchgear replacement at Campsie.
However, as outlined in section 3.3, this decommissioning option has been considered but not
progressed on account of it costing significantly more than options 1 and 2, without providing
commensurate market benefits.
Changes in load
transfer capacity
and embedded
generators
Load transfer capacity between substations is predominantly limited by the high voltage feeders
that connect substations. Credible options under consideration do not affect high voltage feeders
and therefore are unlikely to materially change load transfer capacity. Further, credible options are
unlikely to enable embedded generators in Ausgrid’s network to be able to take up load given the
size and profile of the load serviced by network assets currently considered for replacement.
Consequently, Ausgrid has not attempted to estimate any benefits from changes in load transfer
capacity and embedded generators.
Option value Option values arise where there is uncertainty regarding future outcomes, the information that is
available in the future is likely to change, and the credible options considered have sufficiently
flexible to respond to that change. Ausgrid notes that none of the credible options assessed
involve stages or any other flexibility and so we do not consider that option value is relevant.
Changes in
electrical energy
losses
Ausgrid does not expect that any of the credible options considered would lead to significant
changes in network losses and so have not estimated this category of market benefits.
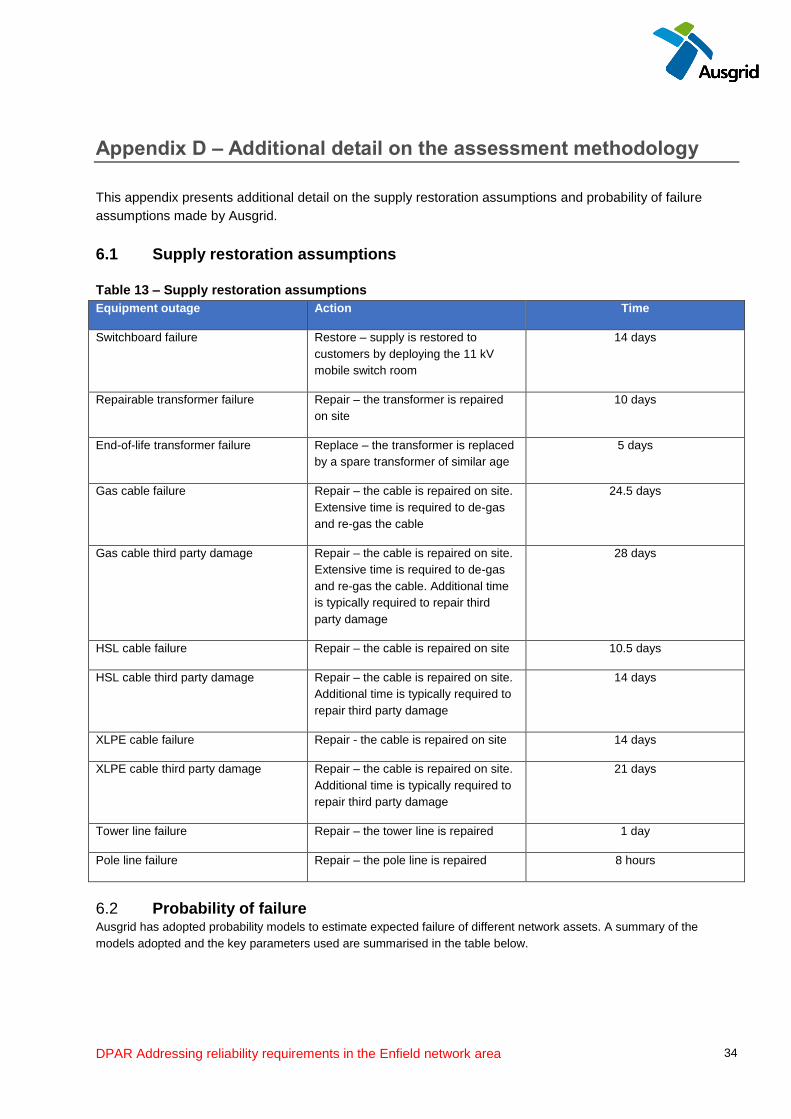
DPAR Addressing reliability requirements in the Enfield network area 34
Appendix D – Additional detail on the assessment methodology
This appendix presents additional detail on the supply restoration assumptions and probability of failure
assumptions made by Ausgrid.
6.1 Supply restoration assumptions
Table 13 – Supply restoration assumptions
Equipment outage Action Time
Switchboard failure Restore – supply is restored to
customers by deploying the 11 kV
mobile switch room
14 days
Repairable transformer failure Repair – the transformer is repaired
on site
10 days
End-of-life transformer failure Replace – the transformer is replaced
by a spare transformer of similar age
5 days
Gas cable failure Repair – the cable is repaired on site.
Extensive time is required to de-gas
and re-gas the cable
24.5 days
Gas cable third party damage Repair – the cable is repaired on site.
Extensive time is required to de-gas
and re-gas the cable. Additional time
is typically required to repair third
party damage
28 days
HSL cable failure Repair – the cable is repaired on site 10.5 days
HSL cable third party damage Repair – the cable is repaired on site.
Additional time is typically required to
repair third party damage
14 days
XLPE cable failure Repair - the cable is repaired on site 14 days
XLPE cable third party damage Repair – the cable is repaired on site.
Additional time is typically required to
repair third party damage
21 days
Tower line failure Repair – the tower line is repaired 1 day
Pole line failure Repair – the pole line is repaired 8 hours
6.2 Probability of failure Ausgrid has adopted probability models to estimate expected failure of different network assets. A summary of the
models adopted and the key parameters used are summarised in the table below.

DPAR Addressing reliability requirements in the Enfield network area 35
Table 14 – Summary of failure probability models used to estimate failure probability
Network asset type Failure probability model Key parameters
Switchboards Weibull analysis Age of switchboard
Age of functional failure of failed
switchboard
Age of retirement for switchboard that
were retired before the point of failure
Underground cables Crow-AMSAA model Cumulative number of failures per km
Age of cable at failure in years
Measure of the failure rate
Switchboards
Failures of 11kV compound insulated switchboards are assumed to be non-repairable because typically the board is no
longer functional following a failure (and hence is replaced or removed from service). Weibull analysis is used to derive a
probability distribution function for the asset’s age at time of failure. This function is denoted as f(t), where t is expressed
in years.
The parameters of the function are derived by considering the following information:
• the age of Ausgrid’s in service 11kV switchboards
• the age of functional failure for Ausgrid’s failed switchboards
• the age of retirement for Ausgrid’s switchboards that were retired before the point of functional failure
The resultant Weibull parameters are given in Table 15 below.
Table 15 – Switchboard parameters
Equipment Shape Scale Restore time
11 kV switchboards 4.19 62.51 14 days
The concept of conditional probability is used to evaluate the probability of failure (Pf) for each year in the planning
period. The probability a switchboard failure occurring within the next year after having survived for t years is calculated
by applying the Equation 1:
Equation 1
Unavailability is calculated by using a restore time, so the unavailability represents the percentage of time that a
particular busbar is not available to supply load. The unavailability (U) of a switchboard is calculated for each year by
applying Equation 2:
Equation 2
Table 16 shows the details of the switchboards included in this study.

DPAR Addressing reliability requirements in the Enfield network area 36
Table 16 – 11 kV switchboard details
Substation Date commissioned Number of switch boards
Enfield 22 August 1962 2
This model is based on the assumption that the condition of a switchboard is dependent upon its age. In order to explore
the possibility that each board is in better or worse condition than the population average, lower and upper bounds for U
are calculated by either adding or subtracting ten years from the age of each board. The resultant upper and lower
bounds for U are shown in Figure 5 on page 15 shows unavailability when the above equations are applied to
switchboards aged 0 – 100 years.
Underground cables
The Crow-AMSAA model is used to determine the probability of failure and unavailability for underground cables. Crow-
AMSAA models are fitted for gas pressure, HSL and XLPE cables.
The Crow-AMSAA model can be used to evaluate probability of failure for repairable systems. As a result, it can be used
to model a cable segment that has failed and has been repaired multiple times over its lifetime. The model is also
capable of handling a mixture of failure modes. Events affecting Ausgrid’s underground sub-transmission cables are
classified as corrective action, failure or third-party damage.
An analysis is undertaken of failure data to ascertain the age of the cable at the time of each event. A log-log plot of
cumulative failures (per km) versus cumulative time (i.e. age in years) is produced and a line of best fit determined. The
resulting log-log plot is linear and the line of best fit can be described by Equation 3.
Equation 3
where:
n(t) is the cumulative number of failures (per km)
t is the cumulative time (i.e. age of the cable at failure, in years)
η is a measure of the failure rate
λ is a scale parameter
The above process is carried out for corrective actions, failures and third party damage for gas pressure, HSL and XLPE cables. Table 17 shows the modelled Cow-AMSAA parameters for each cable type.
Table 17 – Underground cable parameters
Cable type Corrective action Failure Third party damage
η λ Repair time η Λ Repair time η λ Repair time
Gas pressure 1.1 2 × 10⁻² - 11.1 2.2 × 10⁻²⁰ 24.5 days 1.0 7 × 10⁻³ 28 days
HSL 6.0 8.2 × 10⁻¹³ - 4.6 2.6 × 10⁻¹⁰ 10.5 days 3.0 7 × 10⁻⁸ 14 days
XLPE 33 kV 0.5 3.5 × 10⁻² - 0.9 6.6 × 10⁻³ 14 days 1.0 1.4 × 10⁻³ 21 days
XLPE 132 kV 1.7 8.6 × 10⁻⁴ - 0.2 2.1 × 10⁻² 14 days N/A N/A N/A
The frequency of corrective action, failure or third party damage can then be determined by applying Equation 4 to each cable segment.
Equation 4

DPAR Addressing reliability requirements in the Enfield network area 37
Where:
L is the length of the cable segment (km)
t1 is the age of the cable segment at the start of the year (years)
t2 is the age of the cable segment at the end of the year (years)
Failures and third party damage result in cables being taken out of service. Corrective actions do not typically result in
cables being taken out of service. Equation 5 shows how the frequency is used to calculate unavailability for failures or
third party damage.
Equation 5
The total cable segment unavailability is calculated taking the union of the failure and third-party damage unavailabilities as shown in Equation 6. If a feeder consists of multiple cable segments, the feeder unavailability is calculated by taking the union all the respective segment unavailabilities.
Equation 6
Figure 6 on page 15 shows unavailability plotted on a logarithmic scale when the above equations are applied to 10km cables aged 0 – 100 years. This model is also based on the assumption that the condition of a cable is dependent upon its age. The Crow-AMSAA model shows that the availability of gas pressure cables is expected to decline if the cables are retained past an age of 50.