addressing food loss and waste: a global problem with
TRANSCRIPT

Addressing Food Loss and Waste: A Global Problem with Local Solutions
Pub
lic D
iscl
osur
e A
utho
rized
Pub
lic D
iscl
osur
e A
utho
rized
Pub
lic D
iscl
osur
e A
utho
rized
Pub
lic D
iscl
osur
e A
utho
rized

2

i
Acknowledgements
This report has been prepared and published thanks to the efforts of many dedicated professionals. It was an initiative led by the World Bank in collaboration with Cornell University and WRAP.
The core team, led by Geeta Sethi, included the following colleagues from the World Bank: Lucia Patricia Avila Bedregal, Emilie Cassou, Luis Constantino, Xiaoyue Hou, Simmy Jain, Fiona Messent, Xenia Zia Morales, Iftikhar Mostafa, Jan Carlo Garcia Pascual, Flore Martinant de Preneuf, Dipti Thapa, Rosalie Quong Trinidad, Ramon Yndriago, and Farbod Youssefi.
The team at Cornell University was led by Harry de Gorter and included Dusan Drabik (Wageningen University) and Christina Korting (University of Delaware).
The Team at WRAP was led by Richard Swannell and included WRAP’s CEO Marcus Gover, Christian Reynolds, Mike Falconer Hall, Tom Quested, Andrew Parry and Claire Kneller.
This report would not have been possible without the guidance and feedback from the following members of the Advisory Panel: Richard Damania (World Bank), Shanta Devarajan (Georgetown University), Jane Ebinger (World Bank), Madhur Gautam (World Bank), Dan Gustafson (Food and Agriculture Organization), Craig Hanson (World Resources Institute), Hans Hoovegeen (Government of the Netherlands), Rachel Kyte (Tufts University), Steven Schonberger (World Bank), Richard Swannell (WRAP), and Rob Townsend (World Bank).
Additional thanks to the following World Bank colleagues who provided helpful comments and feedback on the report: Diego Arias Carballo, Ousmane Dione, and Yasser El-Gammal.
Special acknowledgements go to the following organizations who supported this work through continued partnership: Cornell University, Food and Agriculture Organization, Government of the Netherlands, Rockefeller Foundation, World Resources Institute, World Wildlife Fund, and WRAP.
Overall support and guidance at the World Bank was provided by Juergen Voegele and Martien van Nieuwkoop. A special thanks to Máximo Torero for very valuable guidance provided when he was Executive Director on the World Bank Board of Directors.
The combined efforts of these individuals and organizations have helped deliver a document we hope will support food loss and waste reduction efforts around the world for years to come.
This report has been generously funded by the Rockefeller Foundation.
The authors thank Jean Waterman for copyediting services and Jay Groff and Tanaquil Baker for publication layout and design.

ii
FOREWORD
Foreword
Today, despite our extraordinary success in augmenting the world’s food supply and making food more accessible, affordable and safe, about 9% of the world’s population — 687 million people — go hungry each day. About 25% suffer from malnutrition, affecting their wellbeing and productivity while placing unnecessary pressures on our health systems. With the world’s population estimated to increase by 3 billion people within the next 30 years, current global food inequities are on course to worsen.
This dire and growing situation exists in the face of an international commitment to end hunger altogether without further damaging our planet. In 2015, all UN Member States adopted the Sustainable Development Goals (SDGs), prioritizing the goal of a world without hunger as the second (SDG-2) of its 17 goals.
Towards this end, SDG-2 acknowledged from the start that simply increasing food production according to our existing food systems is not sustainable. Today’s food systems are major drivers of deforestation, biodiversity loss, excess water consumption, loss of soil fertility, nitrification of soils and water, and pollution. In fact, the entire food industry, from farm to fork to landfill, ranks fourth (24%) among industries in greenhouse gases.
Food systems transformation is essential if we are to avert disaster. SDG-2 targeted reducing food loss and waste by half as a key strategy for achieving this transformation and ending hunger. Currently, 30% of the world’s food supply is lost or wasted, especially in developing countries.

iii
The good news is that reducing food loss and waste actually can make a profound difference across the multiple, related challenges we face; that is, helping to end hunger, produce healthy economies, and preserve our planet. This one strategy of reducing food loss and waste by half may reduce environmental impacts by up to one-sixth, and concurrently achieve progress in combatting hunger; support sustainable food production, diets and consumption; and ultimately impact climate change, given that food losses and waste generate 8% of annual greenhouse gas emissions.
Several global initiatives have brought attention to the importance of reducing food loss and waste. Specifically, the Sustainable Development Goal on Food Loss and Waste (SDG Target 12.3) aims to “by 2030, halve per capita global food waste at the retail and consumer levels and reduce food losses along production and supply chains, including post-harvest losses.” Supporting this objective is Champions 12.3, a powerful group of leaders of governments, private sector, NGOs, civil society, and international organizations established after the international conference “No More Food to Waste” (The Hague, Netherlands, 2015). In 2018, the G20 meeting in Buenos Aires reiterated Champions 12.3’s urgent call for No More Food Waste.
Additionally, the number of seminal reports and myriad initiatives from governments, international organizations, think tanks, the private sector, and non-governmental organizations aimed at reducing food loss and waste indicate that the world is finally focusing on this issue.
This report from the World Bank, as well as its Country Diagnostics for Rwanda, Vietnam, Nigeria and Guatemala, provides us with new and important insights into this subject. The report brings rigor and depth to the economic analysis of food loss and waste; it identifies drivers of food loss and waste; and it reveals why reducing food loss and waste is important in different countries and contexts. It also underscores the complexity of the challenge, and the trade-offs countries will face in pursuing a food loss and waste reduction agenda.
As in every other systems transformation initiative, there will be winners and losers. Each country must be clear about its policy goals in deciding how best to pursue this agenda, and priorities and strategies will need to be chosen for each country’s specific contexts and goals. Nevertheless, the report highlights the promise of food loss and waste reduction for food security and environmental conservation.
We compliment the World Bank for this pioneering framework. It provides a foundation for concerted action and innovative endeavors. It will, for example, help advance joint public and private investments on the ground, as we make full use of each other’s expertise and solve issues such as first losses for private sector investments. It also will facilitate our co-inventing, co-managing, and co-implementing the food systems transformation our world so urgently requires.
We look forward now to the mobilization of financing to support this important development agenda and to the operationalization of these goals in future World Bank programs. We count on the World Bank’s global leadership.
Dr. Hans Hoogeveen JD MPAAmbassador/Permanent Representativeto the UN Organizations in Rome,Co-Chair of the Champions 12.3
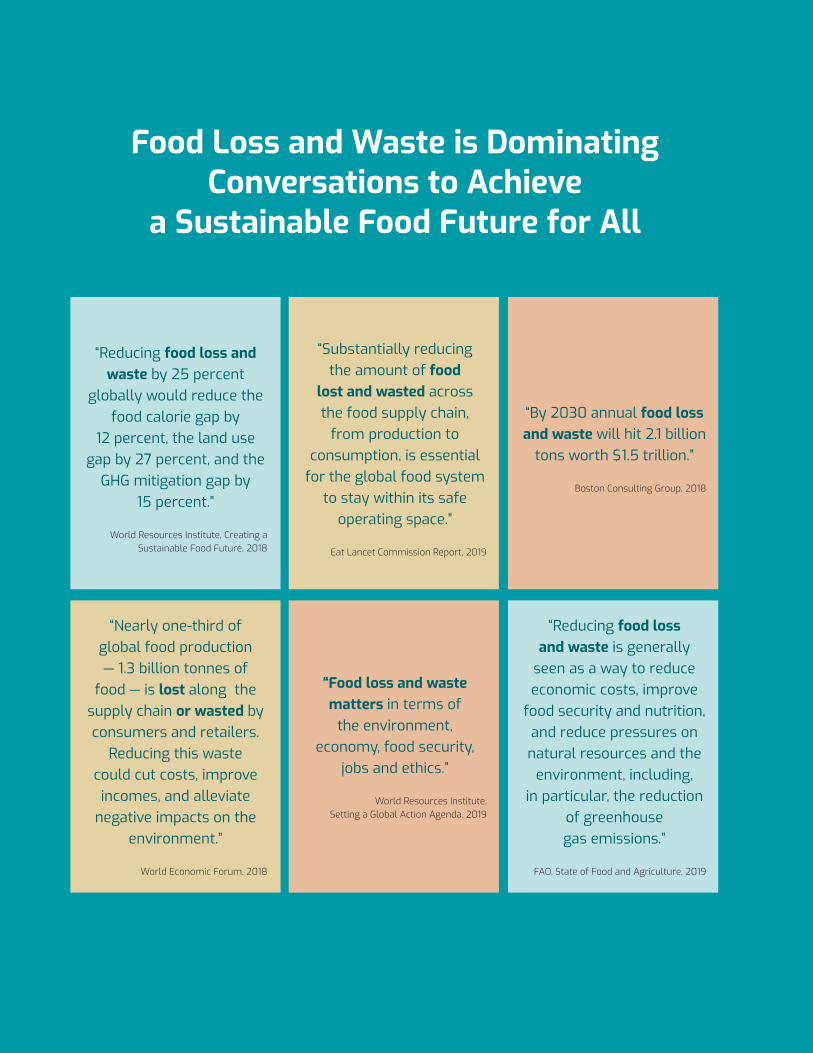
Food Loss and Waste is Dominating Conversations to Achieve
a Sustainable Food Future for All
“Reducing food loss and waste by 25 percent
globally would reduce the food calorie gap by
12 percent, the land use gap by 27 percent, and the
GHG mitigation gap by 15 percent.”
World Resources Institute, Creating a Sustainable Food Future, 2018
“Substantially reducing the amount of food
lost and wasted across the food supply chain,
from production to consumption, is essential
for the global food system to stay within its safe
operating space.”
Eat Lancet Commission Report, 2019
“By 2030 annual food loss and waste will hit 2.1 billion
tons worth $1.5 trillion.”
Boston Consulting Group, 2018
“Nearly one-third of global food production — 1.3 billion tonnes of
food — is lost along the supply chain or wasted by consumers and retailers.
Reducing this waste could cut costs, improve incomes, and alleviate
negative impacts on the environment.”
World Economic Forum, 2018
“Food loss and waste matters in terms of
the environment, economy, food security,
jobs and ethics.”
World Resources Institute, Setting a Global Action Agenda, 2019
“Reducing food loss and waste is generally
seen as a way to reduce economic costs, improve
food security and nutrition, and reduce pressures on natural resources and the
environment, including, in particular, the reduction
of greenhouse gas emissions.”
FAO, State of Food and Agriculture, 2019

v
Contents
Acronyms and Abbreviations . . . . . . . . . . . . . . . . . . . . . . . . . . . . . . . . . . . . . . . . . . . . . . . . . . . . . . . . . . . . viii
Executive Summary . . . . . . . . . . . . . . . . . . . . . . . . . . . . . . . . . . . . . . . . . . . . . . . . . . . . . . . . . . . . . . . . . . . . . . .ix
I . The Food Loss and Waste (FLW) Challenge in the Face of Planetary Boundaries . . . . . . . . . . . . . 1
II . There is Growing Momentum in Global and National Strategic Discourse . . . . . . . . . . . . . . . . . 5
III . What is Food Loss and Waste and Why is It Seen as an Issue? . . . . . . . . . . . . . . . . . . . . . . . . . . . . 7
IV . Is Food Loss and Waste an Economic Problem? . . . . . . . . . . . . . . . . . . . . . . . . . . . . . . . . . . . . . . . . . 12
V . A Conceptual Framework . . . . . . . . . . . . . . . . . . . . . . . . . . . . . . . . . . . . . . . . . . . . . . . . . . . . . . . . . . . . . . . 17
A. The Economic Model . . . . . . . . . . . . . . . . . . . . . . . . . . . . . . . . . . . . . . . . . . . . . . . . . . . . . . . . . . . . 17
B. Four commodities in the UK. . . . . . . . . . . . . . . . . . . . . . . . . . . . . . . . . . . . . . . . . . . . . . . . . . . . . 22
C. Three questions . . . . . . . . . . . . . . . . . . . . . . . . . . . . . . . . . . . . . . . . . . . . . . . . . . . . . . . . . . . . . . . . 26
VI . The Case for Reducing Food Loss and Waste . . . . . . . . . . . . . . . . . . . . . . . . . . . . . . . . . . . . . . . . . . .28
A. Question1:Wouldhigherfoodpricesreflectingenvironmental values reduce FLW? . . . . . . . . . . . . . . . . . . . . . . . . . . . . . . . . . . . . . . . . . . . . . . . . . . . . . . . . . . 28
B. Question 2: Would less FLW reduce the environmental footprint of food systems and improve food security? . . . . . . . . . . . . . . . . . . . . . . . . . . . . . . . . . . 35
C. Question 3: At which stage of the food supply chain would reducing FLWbemosteffective? . . . . . . . . . . . . . . . . . . . . . . . . . . . . . . . . . . . . . . . . . . . . . . . . . . . . . . . 43
VII . Facilitating Change . . . . . . . . . . . . . . . . . . . . . . . . . . . . . . . . . . . . . . . . . . . . . . . . . . . . . . . . . . . . . . . . . . .67
A. Knowledge, innovation and technology . . . . . . . . . . . . . . . . . . . . . . . . . . . . . . . . . . . . . . . . . 67
B. Financing . . . . . . . . . . . . . . . . . . . . . . . . . . . . . . . . . . . . . . . . . . . . . . . . . . . . . . . . . . . . . . . . . . . . . 70
VIII . Takeaways from the Study . . . . . . . . . . . . . . . . . . . . . . . . . . . . . . . . . . . . . . . . . . . . . . . . . . . . . . . . . . .75
Annex A . Suggested FLW Interventions . . . . . . . . . . . . . . . . . . . . . . . . . . . . . . . . . . . . . . . . . . . . . . . . . . .80
Annex B . Model Simulation Results . . . . . . . . . . . . . . . . . . . . . . . . . . . . . . . . . . . . . . . . . . . . . . . . . . . . . . . 91
Annex C . Variables and Notations . . . . . . . . . . . . . . . . . . . . . . . . . . . . . . . . . . . . . . . . . . . . . . . . . . . . . . . . .97
Annex D . The Theoretical And Numerical Model . . . . . . . . . . . . . . . . . . . . . . . . . . . . . . . . . . . . . . . . . . . 101
To be provided upon request.
References . . . . . . . . . . . . . . . . . . . . . . . . . . . . . . . . . . . . . . . . . . . . . . . . . . . . . . . . . . . . . . . . . . . . . . . . . . . . . 101
Endnotes . . . . . . . . . . . . . . . . . . . . . . . . . . . . . . . . . . . . . . . . . . . . . . . . . . . . . . . . . . . . . . . . . . . . . . . . . . . . . . . 106

vi
CONTENTS CONTINUED
FIGURES
1. 1961-2017 comparison: The food system and impact on health and the biosphere
2. Food losses from post-harvest to distribution in 2016 (%)
3. Rising number of undernourished people since 2015
4. Food loss and waste throughout the value chain per region
5. Nutrition-rich foods are disproportionately susceptible to both loss and waste
6. Food loss and waste will increase further with diet shifts and increased incomes | Projected growth in per capita calories wasted: 2006 versus 2050
7. Economic approach to total welfare in relation to food wastage quantities
8. Contributions of the main food groups to overall FLW and their carbon, blue-water and land footprints
9. FLW contributes to climate change with varying impacts along the food supply chain
10. Food supply chain and policy interventions
11. Analyzing FLW — food supply chain, policy interventions and policy outcomes
12. The food supply chain — Conceptual Framework
13. Quantity and value of food loss and waste by product in the UK
14. Rates of loss and waste at each stage of the supply chain — UK, Rwanda, Vietnam - Percentage (%) of production
15. Higher consumer food prices lead to less FLW in a closed economy
16. Total household food waste in the UK, 2007-2015, split by edibility, million tons
17. Effects of a 20% consumption tax for UK chicken — increase of consumer prices and reduction of FLW
18. Effects of a 20% production tax for UK chicken — reduction of farm prices and FLW
19. Higher food prices reduce farm welfare and food security (chicken)
20. Less consumer waste augments and decreases production
21. Less consumer waste improves food consumption
22. Less farm loss increases and reduces production
23. Less farm loss improves food consumption
24. Consumer waste and food system GHGEs
25. Producer loss and food system GHGEs
26. The cascading effect is additive
27. Cutting consumer waste dominates where consumer waste is much larger than producer waste, the case with developed countries
28. Greenhouse gas emissions (million tons CO2eq) associated with production, waste and dispositions treatment (UK 2012). Impacts separated to lifecycle stage (where emissions occur, not where food loss and waste occurs)
29. Greenhouse gas emissions through the two accounting methods
30. Greenhouse gas emissions (million tons CO2eq) associated with FLW, linked to where the emissions occur in the food system (A), or where the FLW occurs in the food system (B)
31. Marginal food waste abatement cost curve — value of policies to reduce food waste
32. Three models for chicken on farm production, farm welfare and food consumption
33. Waste at each stage — four commodities
34. Effect on GHGEs of a 1% intended reduction of FLW (shown in percent changes) — four commodities
35. Differences in investment between the agriculture and healthcare sectors
36. IEA Energy R&D Expenditures
37. A Spectrum of Capital

vii
TABLES
1. Important characteristics of the UK products studied (ratio)
2. Levels and distribution of waste, margins and GHGEs
3. Impacts of price and cost changes on food loss and waste - Summary of results: percent change in total FLW - chicken
4. Impacts of production and consumption taxes on total food FLW in the food system (low abatement elasticity scenario)
5. Chicken: Impacts of a 20% production and consumption tax on each stage of the food supply chain (high abatement elasticity scenario, closed UK)
6. Impacts of food prices and costs on waste in a closed economy — UK
7. Impacts on policy goals of environmental taxes versus a reduction of food loss and waste (closed economy, fixed rates of loss and waste)
8. Impact of waste on sales, purchases and FLW through the supply chain
9. Direct versus indirect effects of reduction in rates of FLW on quantities and losses and waste
10. Direct versus indirect (cascading) effects of reducing rates of FLW: UK chicken (closed economy)
11. Direct versus indirect (cascading) effects of reductions in rates of FLW: UK chicken (closed economy)
12. Greenhouse gas emissions (kg CO2eq per kg of product) coefficients, and total greenhouse gas emissions (million tons CO2eq/kg of product), associated with UK lifecycle stages of bread, fruit, chicken and milk
13. Greenhouse gas emissions (million tons CO2eq) associated with UK lifecycle stages, and leakage volumes of bread, fruit, chicken and milk
14. Results for chicken in the UK assuming a closed economy and inelastic demand
15. The scale of system-allocated GHGEs FLW compared to total GHGE system-wide at each level of the food supply chain, per food category
16. Impacts of alternative policy measures on the food system
17. Impacts of a cut of 0.01187 million tons of chicken at each stage of the supply chain for chicken in a closed economy (percentage change)
18. Interventions by type of food loss and waste
BOXES
1. Food systems’ contribution to human-induced transgression of planetary boundaries
2. Local authorities have been mobilizing to reduce food loss and waste
3. Definitions
4. Impact of Food Loss and Waste on Fertilizer and GHG
5. The Conceptual Framework
6. Effects of an environmental pricing strategy and a food loss and waste reduction strategy
7. The cascading effects of food loss and waste
8. The elasticity of the trade curve of a country versus facing a country
9. Adoption of renewable energies
10. The transformative carbon asset facility model

viii
ACRONYMS AND ABBREVIATIONS
ACRONYMS AND ABBREVIATIONS
CIF Climate Investment Fund
FAO Food and Agriculture Organization
FCV Fragility, conflict and violence
FLW Food loss and waste
FOLU Food and Land Use Coalition
GHG Greenhouse Gases
GHGEs Greenhouse Gas Emissions
GPG Global Public Goods
HRI Hotels, Restaurants and Institutions
IBRD International Bank for Reconstruction and Development
IDB Inter-American Development Bank
IEA International Energy Agency
IFPRI International Food Policy and Research Institute
IPCC Intergovernmental Panel on Climate Change
MDGs Millennium Development Goals
NDCs Nationally Determined Contributions
NGOs Non-governmental organizations
PIK Potsdam Institute for Climate Impact Research
R&D Research and Development
SDGs Sustainable Development Goals
UNEP United Nations Environment Programme
UNFCCC United Nations Framework Convention on Climate Change
UK United Kingdom
WEF World Economic Forum
WRAP Waste and Resources Action Programme
WRI World Resources Institute
WWF World Wildlife Fund

ix
Executive Summary
This report focuses on the role that food loss and waste (FLW) could play in reducing the environmental footprint of food systems while attempting to meet the caloric and nutrient needs of a population expected to increase by 3 billion people in the next 30 years.
1. The performance of the global food system over the last century has been extraordinary. From a global population of 1.6 billion people in 1900 to nearly 8 billion in 2020, the agri-food sector has risen to the challenge of providing global caloric sufficiency, mainly by increasing yields of a few principal staple crops. However, this path is no longer sustainable.
THE CURRENT SITUATION
2. The success of food systems has not been without costs. Notwithstanding the extraordinary success during the past century in making food more accessible, affordable and safe, food systems have contributed to unsustainable land use practices, depletion of fresh water, pollution from chemicals, disruption of nitrogen and phosphorus cycles, biodiversity loss, and climate change. The world is transgressing key planetary boundaries, in part due to food systems that are endangering the environment while still failing to fulfill the caloric and nutrient needs of a large population. Approximately 678 million people around the world (FAO et al. 2020) still go hungry every day, and one in three is malnourished.
3. The pressures will continue to increase. In the next three decades, we will need a 30-70 percent increase in food availability to meet the demand for food by an increasingly large, urbanized and affluent population. However, the evidence is clear that today’s global food and land use system is already failing on multiple fronts, from persistent undernourishment and hunger in certain pockets of the world to the global depletion of natural resources and immense carbon dioxide emissions, all while a large number of poor farmers are excluded from the wealth created by food systems. Business as usual will not be good enough. Only a transformation of the global food system will ensure that the world is not worse off in the future.
4. While food systems generate an unsustainable environmental footprint, the amount of food lost or wasted is, according to some estimates, about 30 percent of the total world food supply. Advocates of food systems transformation increasingly see reducing FLW as a promising strategy for helping feed the planet while reducing the associated environmental footprint. From the G20 to many national governments, local governments and international agencies such as the World Bank, IDB, UNEP and FAO, along with think tanks and NGOs, there are many analyses, recommendations and a myriad of initiatives offering numerous solutions for reducing FLW. The private sector is also increasingly adopting measures to reduce FLW, viewing FLW successes as both a business opportunity and key to meeting corporate social responsibility objectives.
5. The COVID-19 pandemic exemplifies the risks inherent in our current food systems and offers an opportunity to rebuild in better ways. The disease is of zoonotic origin and may have crossed over to infect humans at a wet market where vendors, buyers, and live and slaughtered animals interact in proximity. The widespread illness and death as a result of COVID-19 have brought tragedy and massive economic disruption. Food supply chains are particularly interrupted; necessary efforts to slow the spread of the disease through movement restrictions and business closures have ruptured traditional links along value chains and revealed rigidities that impede rechanneling of supply. Domestic food has replaced away-from-home consumption as social distancing and
x
EXECUTIVE SUMMARY CONTINUED
lockdowns have shut down much of the hospitality industry. However, the switch from hospitality to home-oriented supply chains has not been easy. Consumers face shortages while unsellable products swamp suppliers, and losses and waste mount. The global recession or depression that will follow the disruptions of 2020 will exacerbate poverty and increase food insecurity. Despite the huge social and economic costs of the pandemic, the crisis creates the space to tackle head-on necessary food systems reforms.
THE CHALLENGE
6. Food systems need to be transformed to enhance their resilience, sustainability and contribution to the health of people, economies, and our planet. They need to meet the multi-dimensional challenge of generating safe, affordable and nutritious diets, while avoiding zoonotic diseases; reversing the degradation and overuse of land, water and minerals; reducing greenhouse gas emissions (GHGEs); and increasing productivity, generating jobs and strengthening trade flows.
7. Reducing FLW is key to making food systems significantly more sustainable. The magnitude of current and projected FLW is undeniable. If we maintain business as usual, the amount of FLW will grow from today’s 1.3 billion tons per year (FAO 2011) to 2.1 billion tons by 2030 (Hegnsholt et al. 2018) and even more by 2050 (Searchinger et al. 2018). One estimate argues that if we could halve FLW globally, environmental impacts could be reduced by up to one-sixth (16 percent). Multiple global goals would be advanced, such as combatting hunger, supporting sustainable food production, and ultimately climate change, given that FLW generates 8 percent of annual global GHGEs.
8. In this report, we investigate the economic rationale for reducing FLW and options for doing so. Some amount of FLW will always exist because it does not pay for producers or consumers to incur the costs of eliminating all FLW. So, is there a way of determining if current levels of FLW are too much and should be reduced? In principle, markets will allocate resources, including FLW, in ways that maximize social welfare. However, markets often fail to achieve this goal due to market or policy failures. We use a market and policy failure lens to assess if current levels of FLW may be too high and if interventions to reduce them are warranted.
9. A key market failure is the perceived disconnect between FLW and GHGEs generated by FLW. FLW is responsible for about 8 percent of global GHGEs. If FLW were a country, it would be the world’s third largest emitter of GHGEs. As long as producers and consumers are not paying for the impact of these emissions on global warming, levels of FLW will be too high.
10. However, other than its role in generating GHGEs, FLW is not a cause of other environmental problems. While land, water and other resources are consumed in the production of food that may ultimately be lost or wasted, FLW is at most a symptom of environmental degradation and not the principal cause of it.
11. A basic market failure is the failure to account for environmental impacts associated with the use of land, water and chemicals for food production. Since farmers do not fully pay for lost environmental values that result from farming, they may farm too much land, use technologies that waste natural resources, contribute to pollution, and ultimately generate more FLW. The direct approach for addressing environmental externalities would be to make producers and consumers pay for the lost values when these resources are used for food production, as well as for the external costs of GHGEs. Under this approach, less land and water would be farmed, and since food would become more costly, FLW would most likely decline as well, a double dividend. Food would be seen as scarcer, justifying an increased effort to reduce FLW. But this “polluters pay” approach is
xi
not practical or politically feasible in most situations. To compound the problem, food production and consumption are often subsidized, leading to lower food production and consumption costs, the associated overuse of natural resources, and more FLW.
12. Could there be a case for reducing FLW to lessen social welfare losses from environmental externalities related to the use of land, water and chemicals? Addressing the underpricing of environmental externalities to maximize social welfare is a complicated challenge. The full range of environmental benefits accruing from forests and wildlands, biodiversity, water and reduced pollution is only partially understood. Even more challenging is putting a value to these benefits or creating markets for them. Moreover, there are many episodes of open rebellion against higher food, water or energy prices, a likely outcome of more balanced resource pricing. Given that implicit food subsidies and natural resource underpricing may be politically needed and will likely continue, could strategies to reduce FLW lessen pressure on the environment by helping to save land, water and energy while supplying food to a burgeoning population? Although FLW is not the cause of environmental degradation, except for GHGEs and other pollution, could reducing FLW improve the environmental footprint of food systems? Reducing FLW is essentially a demand-side solution, since it would reduce the demand for food thanks to reduced losses and more waste recovery in the supply chain. This contrasts with pricing of natural resources, a supply-side solution, which would reduce the supply of food by making it more expensive to produce. In this report we investigate the role that FLW could play in reducing the environmental footprint of food systems.
13. In addition to improving social welfare through better use of natural resources, societies are also interested in distributional outcomes, especially food security, farmers’ incomes, and trade. Most countries have policies for improving access to and affordability of food to improve food security for poor people. Many also give priority to improving farmers’ incomes as part of addressing rural poverty. Small open economies may also be interested in increasing exports or reducing imports for macroeconomic or structural development reasons, and may consider the food system as an instrument to do so. The bottom line is that policy goals often comprise a complex mix of trade-offs and tough decisions. In this report, we also investigate the extent to which reducing FLW can contribute to key distributional goals — food security, farmers’ incomes and value of trade — as is often claimed in FLW literature.
THIS ANALYSIS
14. While the assertion that reducing FLW can lessen environmental degradation while helping meet food needs is appealing, it demands empirical confirmation. Surprisingly and despite substantial literature on FLW, there is a lack of studies into the relationship between changes in FLW and the behavior of food systems. This report looks at the food supply chain to analyze in greater depth what drives FLW, how reducing FLW would reverberate through the food system, and how it would contribute to policy goals of economic efficiency, food security, farmers’ incomes, and trade.
15. This analysis captures the complexity of the food supply chain and interdependence between its various stages (Figure below). We consider a food supply chain comprised of seven stages from farm to fork to landfill. These include post-harvest at the farm level, transportation, handling and storage (THS), processing, food services (restaurants, hotels and institutions), retailing, and away-from-home consumption, and at-home consumption. After the consumption stage there are three dispositions for waste: waste can be recovered as food, recovered as non-food for other uses, or

xii
EXECUTIVE SUMMARY CONTINUED
sent to a landfill or incinerated. This analysis acknowledges that any shock to the system, for example, through reduced FLW at the consumer level. will have direct and indirect effects as prices change, and in turn trigger more changes in food supplies and demands throughout the supply chain. This analysis attempts to quantify the impacts of external shocks through their direct and indirect effects.
FIGURE: The food supply chain, policy objectives and policy inputs
Reduce stress
on land, water and chemicals
Reduce GHGEs
Improve food security
Improve farm welfare
Increase value of trade
Policy Inputs
Policy ObjectivesMARKET FAILURES DISTRIBUTIONAL GOALS
Ecotax or reduce
production or consumption
subsidies
Technologies to reduce
FLW in production or consumption
Tax waste or subsidize
recoveryBan FLW in landfills
FLW FLW FLW FLW
FLW FLW FLW FLWFLW
FLW
Quan
tity
of fo
od p
rodu
ced
Qua
ntity
of f
ood
cons
umed
Landfill/Incineration
Recovery/Reuse
Pro-duction(farm)
Trans-port,
handling +storage
Processing
HRIHotels,
Restaurants,Institutions
Retailer
Away from home
Home

xiii
16. We base our analysis on a simulation model of the food supply chain. Unfortunately, there is a dearth of data and empirical economic studies that would allow us to understand the phenomenon of FLW and its impacts through empirical analysis with real-world data. We therefore use a simulation model of the food supply chain to run “experiments” on how shocks to the system affect food production, consumption, prices, levels of FLW, and key policy goals including environmental impacts, food security, farmers’ incomes, and trade. The model is then applied to four commodities in the UK — chicken, bread, fruit and milk — since the UK is the only country for which a comprehensive data set could be obtained. More recent simulations with reduced data sets for Rwanda covered maize, rice and tomatoes; for Vietnam rice and catfish; and for Nigeria maize, tomatoes and catfish.
INSIGHTS AND CONSIDERATIONS
17. The first insight of the analysis is that the large amount of FLW is probably caused by food prices that are too low. If food prices, or equivalently food production and consumption costs, reflected the opportunity costs of natural resources consumed or of GHGEs, the amounts of FLW would be considerably lower, both from less production and consumption, as well as reductions in the rates of FLW (percentage of food that is lost or wasted). This is because food would be more expensive and seen as scarcer, incentivizing greater conservation of food, and encouraging lower production, consumption and waste levels.
18. A related result is that policies that lower food prices or costs, such as production and consumption subsidies, are also drivers of FLW. Food prices and costs are low because producers and consumers do not pay for the environmental costs that food systems generate. To exacerbate the problem, societies often subsidize consumption in developing countries and production in developed countries. They also subsidize inputs such as energy and water. These subsidies have the same effect as lower food prices. They contribute to increasing the production and consumption of food and the levels of FLW by reducing incentives to save food.
19. The second insight is that reducing FLW would indeed help reduce the environmental footprint and GHGEs of food systems, while at the same time improving food security. Different strategies to reduce the environmental footprint of food systems have different social welfare implications. A strategy of pricing environmental externalities and future scarcity correctly would result in higher production and consumption costs. While it would decrease production and thus save natural resources and reduce the environmental footprint of food systems, it would also worsen food security, since food would become more costly. In contrast, a strategy of reducing FLW would also decrease the environmental footprint of food systems, but it would improve food security. This is because demand for food would decline since more is obtained from saved waste, and although production could also decline, food supply could increase since more sales would be generated by reducing food losses. Less demand and more supply would make food cheaper for consumers, without the need to subsidize production or consumption. However, a decline in FLW would not necessarily substitute for an equivalent amount of food. One ton of saved waste does not automatically replace one ton of food produced. The relationship depends on the commodity, the nature of exogenous shocks, and assumptions regarding demand (elasticities) and openness of the economy.

xiv
EXECUTIVE SUMMARY CONTINUED
20. The third insight is that the best stage of the supply chain for policy to reduce FLW depends on the specific circumstances of the country. Should policy focus on the farmer, consumer, processor, or any of the other stages of the supply chain? There are five important factors to consider: the cascading effect, whom to hold responsible for GHGEs from FLW, the policy objective, the commodity, and the trade situation of the country.
21. The first consideration, the cascading effect, would suggest prioritizing FLW at the consumer level, but this is not always ideal. A one-ton reduction of FLW at the farm level increases the amount of food in the supply chain and therefore increases FLW at all stages of the supply chain. It has a positive, cascading effect throughout the supply chain, which works in opposite direction to the initial FLW reduction at the farm level. A one-ton reduction of FLW at the consumer level decreases the amount of food in the supply chain, and therefore decreases FLW at all stages of the supply chain. It has a negative cascading effect back through the supply chain. This would suggest the consumer level as the first candidate to reduce FLW. This implication might not be valid, however, in developing countries, where most loss and waste are generated at the farm level. Here it would be easier to achieve a larger reduction at the farm level, possibly more than compensating for the increases in FLW triggered downstream.
22. The second consideration, whom to hold responsible for GHGEs from FLW (“wasted emissions”), would suggest attributing responsibility to those emitting GHGEs. The challenge for policy arises from the fact that emitters of GHGEs generated by FLW are not the same as the wasters. The question becomes whether to enact policies, such as a carbon tax, targeting the emitter level or the waster level. One ton of waste at the consumer level can generate GHGEs at the landfill, but also generate GHGEs at the farming, transport, processor and retailing levels where food that will later become consumer waste is produced. The best approach would be to introduce a carbon tax (or other measures) at the emitter level, covering not only emissions from loss and waste but across the entire production system. This could, however, be politically unpalatable. Wasters, such as consumers, could be seen as tricking producers, such as farmers, into producing food that consumers later decide to discard. The carbon tax at the waster level might be more easily accepted, although it would have a higher probability of missing the desired outcome. The same considerations apply to the use of natural resources such as land and water in producing food that is wasted downstream.
23. The third consideration is the trade-offs in policy goals when choosing where to intervene along the loss and waste supply chain. The question is at which of the seven stages of the food supply chain would interventions lead to the highest desired impact. The answer varies. For example, in the case of chicken in a closed economy, if the policy goal is to decrease farm production to reduce stress on natural resources, intervention at the processor level would be best. However, this would have the worst effect on farm welfare and only the second best effect reducing GHGEs. To improve farm welfare, on the other hand, the best option would be to intervene at the away-from-home consumption stage and the worst at the processor level. To improve food affordability, an element of food security, the best option would be to intervene at the retail level, although this would lessen reduction of GHGEs.

xv
24. The fourth consideration is the trade characteristics of the country — closed, small open, or large open economy. Returning to the example of chicken, if the goal is to reduce farm production to lower the stress on natural resources, the best course of action would be to reduce FLW at the processor level in a closed economy, and at the food services level in both a large open economy and a small-open economy. When considering GHGEs, the best choice for all economies would be to reduce FLW of chicken at the processor stage, followed by food services and at-home consumption for a closed economy, but at the processor stage followed by transport/handling/storage (THS) and farm levels in a small open economy.
25. The fifth consideration is the specific commodity in question, or fruit, bread, milk and chicken in the case of the UK. Consider as an example only one policy objective: reducing GHGEs. To maximize the impact on GHGEs of reducing FLW, the best course of action would be to intervene at the THS stage followed by at-home consumption for fruit, at the processor stage followed by food services for chicken; at the at-home consumption stage followed by away-from-home consumption for bread; and at the at-home consumption stage followed by retailer for milk.
POLICY CONSIDERATIONS
26. How can a reduction in FLW be achieved? There are two main approaches to FLW policy. One approach is to target food systems as a whole to lead them towards policy goals, including, but not limited to, less FLW. A tax on farming or on consumption, for example, would fall into this category. Better information systems to reduce weather risks would also fall into this category. The other approach is to target FLW directly, as a subset of the larger food system. Within these options are two types of interventions: those directed at preventing or abating loss and waste, such as financing storage systems or cold chains; and those aimed at bringing waste back into the supply chain, whether as edible food for purposes such as donations for charities, or for altogether different functions, such as biogas, compost or animal feed.
27. Policies could include taxes, subsidies, regulatory support to waste markets, and regulations. These policies could work by reducing overall production or consumption or reducing the rate of waste, thereby decreasing FLW, decreasing the costs of FLW abatement, increasing the costs of sending FLW to a landfill, or increasing the market value of waste sold (or donated) as food, or recovered as non-food. This report highlighted how the various stages of the food supply chain are deeply interlinked and an intervention at one level would resonate at other levels. Policies that affect the three main dispositions (donations or use in secondary markets, waste sent to a landfill or incineration, and recovered and recycled food waste) can have important impacts on the vertical food supply chain. The fact is, no one policy intervention is best suited to all situations; rather, each intervention needs to be chosen depending on the policy goal, commodity, and other factors outlined above.
28. Trade effects in open economies can be relevant for some policy actions. In general, interventions that make production more costly, such as environmental pricing, make exports more expensive and reduce trade competitiveness. In addition, increasing imports shifts a country’s food deficit elsewhere in the world, “exporting” its natural resources stresses and GHGEs. These strategies should therefore be pursued in a coordinated fashion at the global level, balancing the various possible impacts of reducing FLW, such as improving the value of trade (exports minus imports), reducing the environmental footprint of large economies, and improving food security elsewhere.

xvi
EXECUTIVE SUMMARY CONTINUED
29. Finally, reducing FLW needs to be but one element of a strategy to improve food systems, and should not be pursued in isolation. While reducing FLW can improve GHGEs, the environmental footprint of food systems, food security, farm welfare, and trade while improving diets through less loss and waste (for example, of healthy fruits and vegetables), this policy goal needs to be considered in the context of broader strategies. Countries need to pursue other mechanisms to address environment depletion, food security, and farm welfare, and view FLW as a complementary approach that can bring additional co-benefits. Reducing FLW should be part of any strategy to transform food systems to achieve healthier people, a healthier planet, and prosperity, given the many win-wins it can generate.
30. Research will play a key role; it is necessary that research agendas consider the entire food supply chain and explore ways to reduce FLW. Research tends to be split institutionally, and focus on specific areas of the food supply chain missing, opportunities for a more holistic approach that will have a greater impact. As has been identified in many FLW reports, there is a critical need for a food supply chain approach to prioritizing research agendas.
31. Better information and distribution networks are likely to be key, not only for reducing food losses, but also for recovering waste as food or non-food. New technologies including “disruptive” technologies have the potential to help reduce FLW, in particular in the areas of information and distribution. However, food systems seem to be lagging in the creation, adoption and use of new technologies. The key sector in food systems is agriculture, where food is created. But despite being one of the largest employers and a key contributor to developing countries GDP, agriculture pales with other sectors (for example the health sector) in number of related start-ups and level of investment.
32. The level of financing needed to address FLW on a significant global scale is large and requires both significant public financing, internationally and nationally, and private capital. The history of public financing for climate initiatives offers a parallel model that could be adopted for a global FLW reduction strategy. In climate finance, an initial seed fund, the Climate Investment Fund, signaled to financiers both the importance of a climate change mitigation and adaptation agenda and the opportunities and need for public financial support. In parallel, the capital markets can be tapped, given the magnitude of financing needed, perhaps appealing to investors’ growing interest in including social returns in their investment profiles.
SUMMARY
33. Research. Reducing FLW should be an important component of any strategy for feeding the planet and reducing the environmental footprint of food systems. However, there are critical policy goal trade-offs between various strategies, and there is ambiguity on the best course of action to take. These questions need to be resolved through empirical investigation of the circumstances. The global framework of this study can be a useful approach for addressing these issues at the country level. These efforts should be complemented by performing detailed cost/benefit economic analyses of alternative strategies and by raising necessary public and private financing to create appropriate incentives and to fund necessary investments. The cost/benefit financial and economic analyses of the various options should identify the level of public support (justified by the extent of externalities and public good elements) and the related roles of private versus public financing.
xvii
34. Action. Key elements for action when developing a country-level FLW strategy might include:
• Conduct country diagnostics to identify priority commodities, hot spots (of high rates of FLW) and stages of intervention for reducing FLW. The model developed for this analysis is designed to be applicable to a wide range of diverse situations, and could be used for the initial analysis, as was done for Rwanda, Vietnam, Nigeria and Guatemala.
• Develop FLW databases to support more detailed behavioral investigations and to monitor progress. The work of Waste & Resources Action Programme (WRAP) in the UK shows ways to develop the information needed.
• Develop a menu of potential interventions that are technically and politically feasible, and include financial and economic analyses of the interventions. A list of interventions suggested by the literature is in Annex A of this report.
• Define roles of the public and private sectors, as well as the roles of horizontal and vertical levels of Government.
• Define the complementary role of FLW reduction in the context of strategies that address other policy goals, such as improving the environmental footprint of food systems, addressing food security, or improving farm welfare.
• Consider the need to rely on safety nets, including unconditional and conditional cash transfers, to support some of the policy goals of reducing FLW or potential negative impacts that may result from them.
• Develop coalitions to support reform efforts.
• Develop a plan to promote FLW reduction start-ups and innovation.
• Develop sources of financing and financial instruments to support private and public FLW reduction action, including support for research and knowledge-based organizations.
• Include FLW reduction in nationally determined contributions (NDCs) for climate mitigation, and in sources of climate mitigation financing.
• Consider instruments to sustain financial support for FLW reduction, including taxes on waste or non-recovery.
xviii
XXXXXXXXXX CONTINUED
Addressing Food Loss and Waste: A Global Problem with Local Solutions
1
I. The Food Loss and Waste (FLW) Challenge in the Face of Planetary Boundaries
1. There is growing recognition globally that our food systems are dysfunctional and creating a bankrupt planet, while 678 million people around the world (FAO et al. 2020) go hungry every day and one in three is malnourished (IPCC 2019). One of the greatest challenges facing humanity is to create nutritious, sustainable food systems that can feed a global population expected to grow to nearly 10 billion people by the year 2050, while helping to reduce poverty, foster economic development, and reduce the food system’s impact on the environment, including global greenhouse gas emissions (GHGEs).
2. The performance of the global food system over the last century has been extraordinary in many respects. The agri-food sector has fed a global population that increased from 1.6 billion people in 1900 to nearly 7.6 billion in 2020, while real food prices fell. Over that time period, all four dimensions of food security — availability, access, reliability, and nutrient adequacy — improved. Calories significantly improved triggered by increased yields. In particular, cereal yields roughly doubled globally in the second half of the 20th century. Advances in labor productivity in agriculture released workers to service and manufacturing sectors, thereby fueling growth, economic diversification, and poverty reduction. Improved transport, storage and processing reduced the prevalence of pathogens. Food became more affordable and safer.
3. These successes were not universally shared, however, and carried high environmental, health and economic costs. Global growth in agricultural yields has been accompanied by land degradation, depleting aquifers, increasing pollution, and GHGEs, raising questions about the sustainability of the global food production system. The depletion of our natural resource base suggests a decline in longer-term productivity, i.e., short-term productivity gains at the expense of long-term productivity gains. We have largely ignored the fact that it may become increasingly difficult and costly to maintain current levels of productivity in the face of deteriorating natural resources and the effects of climate change.
4. Significant transformation is needed at a global scale to more sustainable food systems that foster a healthy planet, healthy people, and healthy economies. The planetary boundaries framework identifies nine boundaries that represent key processes and systems that regulate the stability and resilience of the earth system. This framework, first published in 2009, was developed by a global community of scholars with participation of the Potsdam Institute for Climate Impact Research (PIK), first published in 2009. It covers the interactions of land, ocean, atmosphere and life that together provide conditions upon which our societies depend. Jointly, these boundaries define a safe operating space for humanity beyond which we would incur unacceptable human-induced environmental change that negatively and irreversibly would impact the world’s fauna and flora. To-date, four of the nine planetary boundaries have been transgressed: (i) climate change; (ii) loss of biosphere integrity; (iii) land-system change; and (iv) altered biogeochemical cycles. Meeting the food and nutrition needs of an expanding global population at a sustainable level of resource use without transgressing planetary boundaries necessitates readjusting global priorities at a fundamental level to reverse our current trajectory towards a destabilized earth system.

2
THE FLW CHALLENGE CONTINUED
5. The need to feed a global population projected to reach 9.8 billion people by 2050 will put new demands on food systems. The global food system is currently the single largest driver of environmental change, contributing 24 percent of GHGEs, consuming 70 percent of blue water, and causing the loss of 60 percent of vertebrate biodiversity since the 1970s (Herrero et al. 2019). Moreover, hunger has grown absolutely even as poverty has gone down, with more than 678 million people at risk of hunger in 2018 (FAO et al. 2020), up from 653 million in 2015. According to a new measure developed by FAO, about 2 billion people lacked consistent access to food even before the coronavirus pandemic, and economic recession, supply chain disruptions, and production shocks will increase the number (FAO et al. 2019). Almost 2 billion people suffer from micronutrient deficiencies, although data on this type of malnutrition are incomplete (FOLU 2019). One in five children under the age of five are stunted, with lifelong lost potential. More affordable food has contributed to over-consumption of starch, sugars, fats and salt, leading to a rise in diseases of dietary origin — which in turn compromises resistance to new diseases such as COVID-19.
6. Food systems substantially contribute to human-induced transgression of some planetary boundaries (Figure 1). In 1961, humanity already had entered the zone of uncertainty for the biodiversity boundary, largely due to food systems. By 2015, both biogeochemical flows and biodiversity boundaries had been pushed beyond the zone of uncertainty. In fact, around one million animal and plant species are now threatened with extinction, many within decades, posing a serious threat to global food security as well (Díaz et al. 2019).1 In addition, land system changes and climate change have been pushed to the zone of uncertainty. While in the past the world emerged victorious from alarms on the depletion of natural resources (Limits to Growth 1972), even as output increased four times thanks in part to innovation and technology, there are reasons to fear that this time the risks are higher. This is because climate change has cascading impacts on planetary boundaries of land and oceans that reinforce each other.
FIGURE 1: 1961-2017 comparison: The food system and impact on health and the biosphere
For each sub-system, negative impacts are illustrated as a contrasting color radiating outward. Health and food systems have grown due to a larger population (health) and overall volume of food produced (food
system).Source: Gordon, L. et al. (2017)

3
7. The COVID-19 pandemic exemplifies the risks inherent in our current food systems and offers an opportunity to rebuild in better ways. The disease is of zoonotic origin and may have crossed over to infect humans at a wet market where vendors, buyers, and live and slaughtered animals interact in close proximity. The widespread illness and death as a result of COVID-19 (as of May 2, 3.39 million confirmed cases and 239,000 deaths globally) has brought tragedy and massive economic disruption. Food supply chains are particularly interrupted; necessary efforts to slow the spread of the disease through movement restrictions and business closures have ruptured traditional links along value chains and revealed rigidities that impede rechanneling of supply. Domestic food has replaced away-from-home consumption as social distancing, and lockdowns have shut down much of the hospitality industry. Consumers face shortages while unsellable products swamp suppliers, and losses and waste mount. Demand for public food assistance has skyrocketed, and supply chains have not redirected rapidly enough to meet the need. Vulnerable people are going hungry.
Box 1: Food systems contribution to human-induced transgression of planetary boundaries
PLANETARY BOUNDARY 1 — Altered biogeochemical flows: About 96 percent of phosphate production is used to make fertilizer for agriculture, most of which pollutes the soil. With the expected increase in food demand by 2050 and the current status of food systems, it is estimated that the demand for phosphate could increase by 50-100 percent. This increase will have significant ramifications for the biogeochemical planetary boundary. Similarly, human activities now convert more nitrogen from the atmosphere into reactive forms than all of the Earth’s terrestrial processes combined. Fertilizer used to enhance food production is the chief driver of new reactive nitrogen. However, most of the reactive nitrogen ends up in the environment rather than in food consumption. This not only pollutes soil, air and oceans but also propels biodiversity loss. While in the absence of significant changes in food production and waste-to-food ratios, input increases will be needed to meet food security objectives, a reduction in food waste, a change of planetary diets, and increased input use efficiency could reduce total nitrogen in 2030 by 8 percent over 2000.
PLANETARY BOUNDARY 2 — Land-system change: Agricultural production is the primary form of land use on the planet. In 2005, it was reported that 40 percent of land surface was occupied by croplands and pastures. Over the past 40-50 years, the conversion of ecosystems such as forests has occurred at an average rate of 0.8 percent each year. In addition, emissions of methane and nitrous oxide from the agricultural sector lead to crop yield reductions, which further exacer-bate land use. Land that produced FLW occupied almost 30 percent of the world’s agricultural land area, translating into 1.4 billion hectares of land being used for food never eaten. Transformation of food production systems towards less food waste will reduce land conversion for agriculture, limiting further transgression of planetary boundaries.
PLANETARY BOUNDARY 3 — Climate change: Agricultural emissions increased by 8 percent between 1990 and 2010 and are projected to increase by an additional 15 percent. By 2011, the agriculture sector was already the world’s sec-ond-largest emitter after the energy sector, with approximately 13 percent of total emissions emitted by farms. Carbon emissions from the agricultural sector are largely driven by dietary preferences and population growth in developing economies. However around 24 percent of all calories produced for human consumption are lost or wasted in the sup-ply chain, and food that is produced but not eaten is estimated to produce 3.3 billion tons of GHGEs. If food waste were a country, it would rank as the third highest GHGE emitter after the US and China. A transformation of the food system, particularly FLW as well as dietary preferences, is needed for a significant reduction in global GHGEs.
PLANETARY BOUNDARY 4 — Loss of biosphere: Agricultural expansion converts natural habitats, releases pollutants, and results in large volumes of GHGEs, all of which destroy biodiversity. It has been reported that by 2005 land-use change caused a decrease of 13.6 percent in the average number of species found in local ecosystems. A change in dietary patterns and a reduction in food loss and waste would reduce the demand for land conversion needed for agricultural expansion, which in turn could protect biodiversity from further transgression of planetary boundaries.
4
THE FLW CHALLENGE CONTINUED
Low-wage workers who remain on the job to keep supplies moving face the risk of illness, often without adequate protective equipment. The global recession or depression that will follow the disruptions of 2020 will exacerbate poverty and increase food insecurity. A recent report from the International Food Policy Research Institute (IFPRI) estimates that 140 million additional people could fall into extreme poverty in 2020, including 80 million in Africa and 42 million in South Asia (Laborde et al. 2020). Food insecurity will rise along with poverty.
8. We need a sustainable global food system by 2050, one that delivers improved livelihoods and affordable, safe and nutritious diets for all. To meet this future challenge, food systems need to make more and better food available to consumers, and to do so sustainably while giving due consideration to the co-benefits of improved health, environment and economic opportunity. The transition from the Millennium Development Goals (MDGs) to the Sustainable Development Goals (SDGs) signaled the need to address food systems in their entirety, in contrast to the earlier and narrower attention to food security. This shift in focus is welcome, appropriate and challenging. It requires new instruments and approaches that concurrently address nutrition, climate, the environment, jobs and economic growth. We need a fuller understanding of how food systems, nutrition and environmental issues interact; smart indicators to capture these interactions; databases to quantify impacts; and analyses of options and trade-offs. Thinking differently about food systems can also open opportunities for low- and middle-income countries to leapfrog over pitfalls that their higher-income counterparts failed to avoid. Current events, including the COVID-19 pandemic, show that costs can cascade far beyond the sector of origin, and argue that crises should be managed for prevention rather than after-the-fact cleanup.
9. Among the host of immediate actions that could help make food systems more sustainable, significantly reducing FLW is a key candidate. The magnitude of FLW is undeniable. If we resort to business as usual, the amount of FLW will grow from today’s 1.3 billion tons per year (FAO 2011) to 2.1 billion tons by 2030 (Hegnsholt et al. 2018) and even more by 2050 (Searchinger et al. 2018). It is argued that if we could halve FLW globally, environmental impacts such as those that have been highlighted could be reduced by up to one sixth (16 percent). Reductions in FLW could deliver dividends across multiple agendas, including combatting hunger; supporting sustainable food production, diets and consumption; and ultimately addressing climate change, given that losses and waste generate 8 percent of annual GHGEs. The EAT-Lancet Commission Report (2019) recently singled out reductions in FLW as crucial to achieving healthy diets and a sustainable food system. Similarly, the World Resources Institute Report on Creating a Sustainable Food Future (2018) identified reducing the loss and waste of food intended for human consumption as an important demand-side solution to achieving a sustainable food future.
10. In this report, we investigate the extent to which reducing FLW could indeed help move food systems towards sustainability through less degradation of the environment, and at the same time increase food supply, preserve affordability, and improve food security. Reducing FLW could contribute to healthier people, a healthier planet, and a healthier economy through different pathways. For example, reducing FLW of nutritious food such as fruits and vegetables would make them relatively less expensive than less nutritious food such as cereals and tubers. By decreasing the demand for food, it could help reduce GHGEs from the sector and help conserve land and water. And increasing the productivity within the food supply chain could sustain higher incomes for both farmers and workers. The assertion that reducing FLW can contribute to less environmental degradation while helping to meet food needs is appealing, but demands empirical confirmation. We base our arguments on an economic and conceptual framework that helps us better understand the phenomenon of food loss and waste — i.e., what it is and what triggers or drives it — along with a model to help define the various policy levers that can promote FLW action.

5
II. There is Growing Momentum in Global and National Strategic Discourse
11. FLW has reached the spotlight in current global strategic discourse, and there are numerous initiatives seeking to address this challenge. FLW has been elevated in the international agenda through the G20 under current and past presidencies.2 At the G20 Meeting of Agriculture Ministers in Buenos Aires, Argentina in July 2018 FLW reduction was highlighted as a “triple win” of (i) increasing food security; (ii) alleviating pressure on climate, water and land resources; and (iii) improving income for farmers, agri-food businesses, and the household economy. The members reaffirmed that to attain this “triple win,” a comprehensive food systems approach, covering all levels of the agri-food value chain, is needed. The most recent G20 meeting (2020) reemphasized the urgency of the FLW challenge. Recognizing the importance of tackling this challenge, the 2030 Agenda for Sustainable Development considers reductions in FLW crucial for the Global Goals, with SDG12 including a specific target to halve food waste and reduce food losses by 2030.3 The Paris Climate Agreement also has brought FLW into the climate agenda, including in the preamble to the Agreement the commitment of “Safeguarding food security and ending hunger, and the particular vulnerabilities of food production systems to the adverse impacts of climate change.” In addition, Article 2.1 mentions the importance of protecting food production while reducing emissions. Parties to the UN Framework Convention on Climate Change (UNFCCC) in their Intended Nationally Determined Contributions (INDCs) have highlighted sustainable agriculture among the top three adaptation priorities,4 along with food production and food security, all of which are key to the FLW agenda.
12. Recognizing the potential of tackling FLW and faced with a public that is increasingly demanding action on this challenge, governments have started to act. The United Arab Emirates launched a comprehensive food diversification program, with a strong component on prevention and reduction of food loss. Italy approved a law in 2016 to fight food waste and enhance collaboration, educate the public, encourage food donations, and promote reusable and recyclable packaging. Denmark reduced household food waste by 24 percent per person between 2013 and 2017 by raising awareness with the help of activists and suppliers, encouraging actions that include
FIGURE 2: Food losses from post-harvest to distribution in 2016 (%)
Western Asia and Northern Africa 10.8
Sub-Saharan Africa 14
Oceania (excluding Australia and New Zealand) 8.9
Northern America and Europe 15.7
Latin America and the Caribbean 11.6
Eastern and South-eastern Asia 7.8
Central and Southern Asia 20.7
Australia and New Zealand 5.8
Percentage (%)
Source: FAO (2019)

6
GROWING MOMENTUM CONTINUED
reducing the portions of items sold, encouraging people to take home their leftovers from restaurants, and reducing discounts that cause people to overbuy (The Local 2018). In June 2016, the Danish Ministry of Environment and Food launched a subsidy scheme to combat food waste after conducting campaigns to educate consumers about the best-before and use-by labels. In 2016, France became the first country to ban supermarkets from throwing away or destroying unsold food, requiring leftover food to be donated to charities and food banks. In 2017, Tanzania started work on a post-harvest management strategy to better manage produce and prevent food loss. And Uganda requested WFP to design a program to prevent food loss among 2.5 million rural households by 2025. Local governments also are acting. In 2009, San Francisco passed an ordinance requiring all residents and tourists to compost food waste. In several cities in Sweden, biogas is produced from food waste to power vehicles and generate heat. Civil society and non-government organizations, particularly in urban settings, have been increasingly engaged in FLW reduction initiatives, including food banks, food waste recovery, and advocacy.
13. Large corporations are also looking into ways to reduce FLW in production chains. Sixty percent of the world’s largest food companies have food loss and waste reduction targets. In 2017, Unilever had a 37 percent reduction in food waste per ton of food produced as compared to 2016, from 156 food manufacturing operations. One of Unilever’s initiatives is with its Hellman’s ketchup brand, which in addition to red tomatoes now also uses green tomatoes, which were previously, typically discarded. Similarly, Tesco has committed itself to halving food waste in its operations by 2030. It
has rolled out a combination of UV light treatment and improved packaging of its avocados, extending the avocados’ shelf life by two days (WRI 2019).
14. Development agencies also are building programs to support public and private sectors that want to reduce FLW. In 2013, UNEP and FAO launched the Think.Eat.Save. campaign focusing on food waste from consumers, retailers and the hospitality industry, and creating collaboration between organizations with experience in changing wasteful practices. In close collaboration with FAO, Messe Düsseldorf intends to fight against global food losses with the launch of the SAVE FOOD initiative, which aims to encourage dialogue between industry, research, politics and civil society on food losses. IDB launched a platform to fight FLW (#sindesperdicio). The platform connects diverse companies and organizations to facilitate and promotes coordinated action on FLW through projects, private and public policy, knowledge generation, and responsible consumer habits.
Box 2: Local authorities have been mobilizing to reduce food loss and waste
116 cities across the world signed the Milan Urban Food Policy Pact in October 2015. The Pact, supported by an Action Plan, aims to (i) promote policy coherence by convening food system actors to assess and monitor food loss and waste reduction at all stag-es of the city region food supply chain; (ii) raise awareness of food loss and waste; (iii) collaborate with the private sector, along with research, educational and community-based organizations, to develop and review, as ap-propriate, municipal policies and regulations; and (iv) save food by facilitating recovery and redistribution for human consumption of safe and nutritious foods, if applicable, that are at risk of being lost, discarded or wasted from production, manufacturing, retail, catering, wholesale and hospitality.
7
15. A large literature has emerged on the various facets of FLW, both the causes behind it, the problems it causes, and a myriad of proposals on how to handle it. Since 2011, there have been 9,268 new studies on post-harvest losses for 60 plant-based food crops in 30 countries across Africa, Latin America and South Asia. According to Google Scholar there have been 1,800 publications since 2018 related to “food loss” and 14,200 publications related to “food waste.” The 2019 State of Food and Agriculture, one of FAO’s major annual flagship publications, is on Food Loss and Waste. FLW is now also finding its way into research agendas. The International Food Policy Research Institute (IFPRI) is conducting state-of-the-art research to measure FLW at all stages — from production and post-production to processing, distribution and consumption — at the local, regional and global levels. Likewise, in 2016, the Rockefeller Foundation created Further with Food, an online knowledge hub for research, case studies and tools related to food waste.
III. What is Food Loss and Waste and Why is It Seen as an Issue?
16. The concern about FLW largely revolves around two issues — increasing food insecurity in the face of finite resources and a growing population, and adverse environmental impacts of food systems, including climate change. For a planet with finite resources and a global population projected to increase by one third in the next 30 years, where will the extra food come from? Will there be enough land, water and energy to produce the additional and more nutrient-dense food that will be needed, and at what cost? Is it safe to hope that innovation and technological change alone will be enough to augment food supply to the required levels? Food that is lost or wasted, on the other hand, already has expended scarce resources — including land, energy and water. If this loss and waste could be reduced and/or recovered, the food scarcity threat could be made less severe, helping the world cope with a growing population amid finite resources
17. The first issue, food insecurity, is already a challenge in parts of today’s world. Today, there are more than enough food and calories to feed the world, but not everywhere. More than 670 million people (FAO et al. 2020), and one in three is malnourished (World Bank Group 2017), consuming a low-quality diet that causes micronutrient deficiencies and contributes to a rising incidence of diet-related non-communicable diseases (EAT 2019). The global prevalence of undernourishment has been increasing (FAO et al.2020), especially in almost all subregions of Africa, Latin America and Western Asia (FAO et al. 2020). One challenge is the cost of redistributing food between deficit and surplus regions, which, coupled with poverty, makes a healthy food diet unaffordable for many.
18. Today, COVID-19 has exposed further supply chain vulnerabilities, focusing even more attention on the FLW challenge. Global and domestic food supply chains revealed their rigidity and inability to respond to a rapidly evolving pandemic. Farmers and producers were submerged in products they could not sell, creating loss and waste. Consumers were unable to acquire the food they needed, creating food insecurity. As consumers shifted consumption from restaurants to home, supply chains were unable to react quickly, leading to losses in the hospitality industry and shortages in consumer food stores. From farm to fork, global and local supply chains are very long, comprising many stages, each with its own vulnerabilities. When one of these stages fails, food supply suffers, and losses and waste increase.

8
WHAT IS FOOD LOSS CONTINUED
FIGURE 3: Rising number of undernourished people since 2015
FIGURE 4: Food loss and waste throughout the value chain per region
Number of undernourishment (millions) Prevalence of undernourshiment (percentage)
20% 1000
15%
825 .6
750
628 .9 678 .1
687 .8
841 .4
10% 12.6% 8 .6%
8 .9% 8 .9% 9 .8%
500
5% 250
0% 0
2005 2006 2007 2008 2009 2010 2011 2012 2013 2014 2015 2016 2017 2018 2019* ... 2030**Years
Projections to 2030 do not consider the potential impact of the COVID-19 pandemic.Source: FAO et al. (2020)
Mill
ions
Perc
enta
ge
n Production n Handling and Storage n Processing n Distribution and Market n Consumption
58
42 35 24
19
11
5
9
10
15 19 16
21
16
6
5 2 9
9
3
7
6
10 20 20
23
33
36
21 33 29 29 33 32 36
North America Europe Industrialized North Africa, Latin America South and Sub-saharan and Oceania asia West and Southeat Africa Central Asia Asia
35% 34% 34% 36% 34% 26% 36%
Source: Flanagan et al. (2019)
Perc
ent

9
19. In the future, food insecurity could get worse. Demand for more — and more nutritious — food is projected to rise by at least 20 percent globally by 2030. This demand is expected to grow the most in Sub-Saharan Africa and South Asia, which face a projected two-thirds increase in population and already face a relatively extreme food deficit (FAO 2017). A case study in South Africa suggests higher levels of losses and waste for nutritious rich foods (Figure 5). Feeding 10 billion people sustainably by 2050 will require closing an estimated 56 percent food gap between crop calories produced in 2010 and those needed in 2050 under “business as usual” growth (Figure 6), and closing a 593 million-hectare land gap (equaling about 25 percent of the world’s tropical rain forests) between global agricultural land area in 2010 and expected agricultural expansion by 2050 (Searchinger et al. 2018). Despite this large potential global food deficit, one-third of all food produced globally each year — 1.3 billion tons — is either lost or wasted, food that, many argue, could very well serve those who are food insecure (FAO 2011).
FIGURE 5: Nutrition-rich foods are disproportionately susceptible to both loss and waste: Case study of cost of FLW in South Africa
20. Nutrient-rich foods — particularly fruits, vegetables, dairy, meats, fish and seafood — are often highly perishable, and prone to pests and diseases, making them disproportionately susceptible to FLW (Global Panel 2018). Around one quarter of this food group supply (614 kcal/cap/day) is lost within the food supply chain (FSC). The production of these lost and wasted food crops accounts for 24 percent of total freshwater resources used in food crop production (27 m3/cap/year), 23 percent of total global cropland area (31×10—3 ha/cap/yr.), and 23 percent of total global fertilizer use (4.3 kg/cap/year). However, addressing loss and waste in nutrient-dense foods presents a special challenge. Many nutritious foods are also more water- and heat-sensitive than staple grains or tubers, making them particularly vulnerable to threats including those posed by climate change. In other words, the very foods that are critical components of healthy diets are at the highest risk of loss and waste. These losses fundamentally affect the availability and affordability of nutritious foods and represent a major food system dysfunction.
n Agricultural production n Post-harvest handling/storage n Transformation and packaging n Distribution/retail level n Consumer level waste
876543210
Fruits & Meat Fish and Milk Cereals Roots and Oilweeds and Vegetables Seafood Tubers Pulses
* 1 ZAR is approximately 0.059 USDSource: Nahman and Lange (2013)
Cost
in b
illio
n So
uth
Afri
can
Rand
(ZA
R)*

10
21. The second issue is the adverse environmental impact of our food systems. These impacts include not only the emission of greenhouse gases and contamination through the use of pesticides, fertilizers and soil erosion, but also the adverse impacts associated with the expansion of the agriculture frontier at the cost of forests and wildlands, and the trapping of water and lowering of water quality in irrigation systems. Strong evidence indicates that food production is among the largest drivers of global environmental degradation by contributing to climate change, biodiversity loss, freshwater use, land system change, interference with the global nitrogen and phosphorus cycles, and chemical pollution (EAT 2019). Food that is either lost or wasted generates significant greenhouse gases — 8 percent of global GHGEs — with varying impacts along the food supply chain (FAO 2014). By addressing FLW, one would address these impacts, particularly GHGEs. GHGEs occur through both decomposing organic matter and the process of producing food not consumed. Following the FAO methodology on full-cost accounting and using the estimate of the social cost of carbon (FAO 2014), the cost of GHGEs from global food wastage is significant — estimated at $411 billion annually (FAO 2013).
22. However, there is some confusion over what exactly “food loss and waste” means (see Box 3). Often the concepts of food loss and food waste are used interchangeability. Here, the distinction between edible or potentially edible food loss and non-edible organic waste becomes important. Also important is the fact that some food is lost or wasted on purpose while other food waste is involuntary, indicating that a zero food-wastage world may not be socially or economically optimal. (See Figure 7) FLW occurs along the entire supply chain from farm to fork to landfill, but the patterns of loss and waste differ markedly by commodity, stage of the supply chain, degree of urbanization, and level of development. In developed countries, most waste is generated at the consumer level, while in developing countries it occurs at the farm level.
WHAT IS FOOD LOSS CONTINUED
FIGURE 6: Food loss and waste will increase further with diet shifts and increased incomes | Projected growth in per capita calories wasted: 2006 versus 2050
n 2006 n 2050
1200
1000
800
600
400
200
0
Source: Purdue University, projections built on Hertel and Baldos (2016)
Cana
da, U
S
EU
M
iddl
e Ea
st
Ea
ster
n Eu
rope
Ja
pan,
Kor
ea
Aust
ralia
, Ne
w Z
eala
nd
Ce
ntra
l Am
eric
a
Ch
ina,
M
ongo
lia
So
uth
Amer
ica
So
uth
Afric
a
No
rth
Afric
a
Ce
ntra
l Asi
a
RO
AFR
So
uth
East
As
ia
So
uth
Asia
Per
capi
ta c
alor
ies
was
ted
11
Box 3: Definitions
Food loss: refers to a decrease in quantity or quality (appearance, flavor, texture and nutritional value) of food intended for human consumption. These losses tend to occur “upstream” in the food value chain, and are mainly caused by ineffi-ciencies in agricultural production, harvesting, post-harvest handling, transportation, and storage of crops. They also occur in the midstream segments of the food value chain — during transport to markets, food transformation, and the whole-sale marketing process.
Food waste: refers to the discarding of food appropriate for human consumption downstream in the value chain, particu-larly at the retail and consumer levels. For example, one cause for discarding is excessive grading and sorting of produce to ensure a food item’s aesthetic quality. Other causes include spoilage (actual or perceived) linked to inefficiencies in transportation, storage, refrigeration, packaging of food, over-buying of perishable foods, and consumer habits. Consumer waste in high-income countries is typically linked to purchasing and storage of large quantities of food at the household level and post-meal disposal. This is not the case in many low- and middle-income countries where relatively small quan-tities of perishable foods are stored in the household.
Source: FAO (2013)
Box 4: Impact of Food Loss and Waste on Fertilizer and GHGEs
Food loss and waste (FLW) represents needless use of fertilizers, some of which are scarce; unnecessary greenhouse gas emissions (GHGEs); and wasted water and land. More efficient use of food would reduce the need for land conversion for additional food production and slow the rate of increase in fertilizer applications (Searchinger et al. 2018; Willett et al. 2019).
An estimated 1300 million pounds of food produced annually are not consumed globally by humans due to FLW, of which 670 million pounds are in industrialized countries and 630 million pounds are in developing countries (L. Shcherbak, N. Millar and P.G. Robertson 2014).
FLW is associated with approximately 173 billion cubic meters of water consumption per year, which represents 24 percent of all water used for agriculture. The amount of cropland used to grow this lost and wasted food is 1.4 billion hectares per year. Furthermore, 28 million tons of fertilizer are used annually to grow this lost and wasted food (Lipinski et al. 2013, FAO 2019).
Food ultimately lost or wasted accounts for 23 percent of total global fertilizer use. This is an issue because fertilizers (a) contain nitrogen that is converted into nitrous oxide, which is the third most potent greenhouse gas following carbon dioxide and methane, depleting stratospheric ozone; (b) consume finite natural resources (e.g., phosphorous); and (c) can have a negative impact on water quality (Kummu at al. 2012).
The usage rate of nitrogen fertilizer is the best single predictor of nitrous oxide emissions from agricultural soils, which are responsible for about 50 percent of the total global anthropogenic flux. Accumulating evidence suggests that the emission response to increased application of nitrogen fertilizer is exponential rather than linear. The use of nitrogen fertilizer in soils to produce food that is ultimately lost or wasted generates significant nitrous oxide. Research shows that 1.75-5 kilograms of GHGEs are produced for every 100 kilograms of fertilizer application in soils (Shcherbak et al. 2014). Hence, FLW not only results in wasting fertilizers and scarce phosphorous, but also generates GHGEs and wastes scarce water.
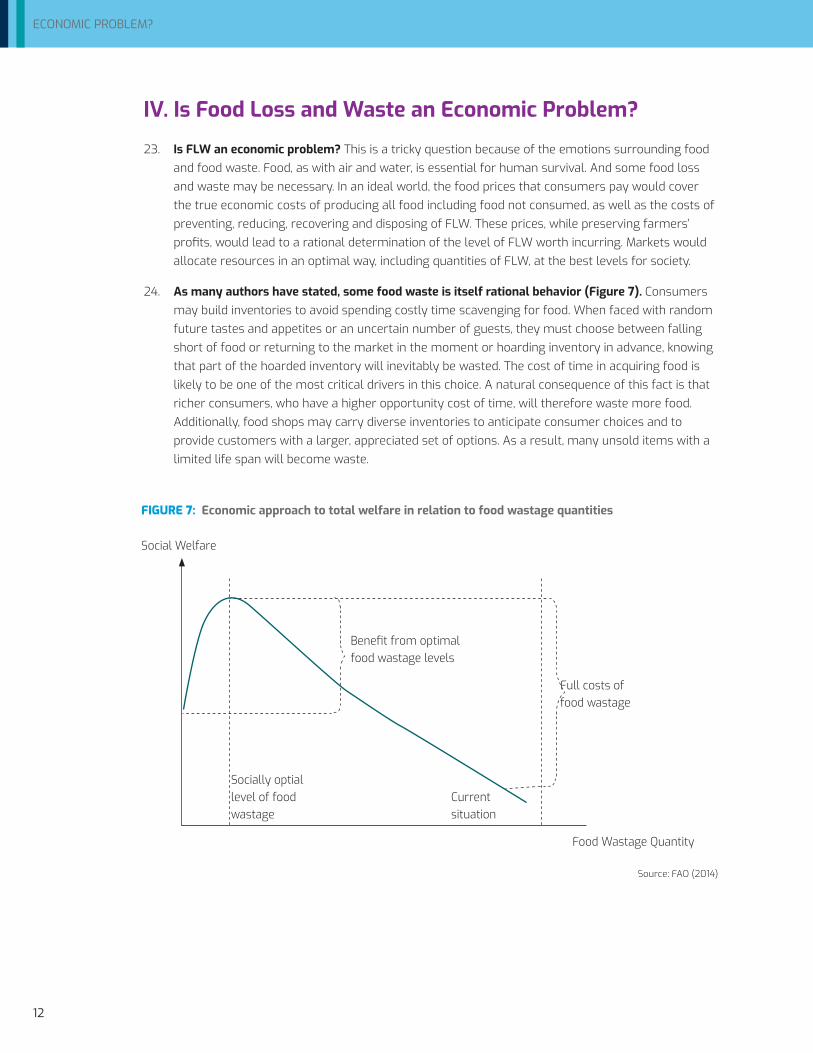
12
ECONOMIC PROBLEM?
IV. Is Food Loss and Waste an Economic Problem?
23. Is FLW an economic problem? This is a tricky question because of the emotions surrounding food and food waste. Food, as with air and water, is essential for human survival. And some food loss and waste may be necessary. In an ideal world, the food prices that consumers pay would cover the true economic costs of producing all food including food not consumed, as well as the costs of preventing, reducing, recovering and disposing of FLW. These prices, while preserving farmers’ profits, would lead to a rational determination of the level of FLW worth incurring. Markets would allocate resources in an optimal way, including quantities of FLW, at the best levels for society.
24. As many authors have stated, some food waste is itself rational behavior (Figure 7). Consumers may build inventories to avoid spending costly time scavenging for food. When faced with random future tastes and appetites or an uncertain number of guests, they must choose between falling short of food or returning to the market in the moment or hoarding inventory in advance, knowing that part of the hoarded inventory will inevitably be wasted. The cost of time in acquiring food is likely to be one of the most critical drivers in this choice. A natural consequence of this fact is that richer consumers, who have a higher opportunity cost of time, will therefore waste more food. Additionally, food shops may carry diverse inventories to anticipate consumer choices and to provide customers with a larger, appreciated set of options. As a result, many unsold items with a limited life span will become waste.
FIGURE 7: Economic approach to total welfare in relation to food wastage quantities
Social Welfare
Benefit from optimal food wastage levels
Full costs of food wastage
Socially optial level of food Current wastage situation
Food Wastage Quantity
Source: FAO (2014)
13
25. Farmers also face incentives to plant and harvest more than they sell, thus creating some waste. Some food waste is the result of technology, and is involuntary. For example, mechanical harvesters of many commodity foods lead to more waste than manual labor. Waste may also be a voluntary decision. Farmers may expect to lose a certain percentage of their crop to pests or rodents, and thus overplant to cover these potential losses. Similarly, they may overplant to hedge against weather events, other unexpected crop failures or price volatility. If these natural events do not occur and farmers are faced with an unexpected surplus, they may face higher harvesting costs or lower prices at sale, rendering harvesting of the surplus crops not worth the effort. The surplus will be wasted.
26. However, markets often fail to allocate resources optimally. There may be policy interventions that prevent the market from performing its role, or societies may be seeking policy goals beyond efficient allocation of resources. One way to assess if FLW waste is too much (or too little) from a society’s point of view is to apply a market and policy failure filter to their decision-making. Markets often fail to reach optimal levels of inputs and outputs due to market failures and imperfections or due to misguided policies. In using a market failure lens, it is important to distinguish when FLW is a cause of the market failure and when it is a consequence. When it is a cause, there would be a strong case to reduce FLW. But when it is a consequence of the market failure, addressing the market failure directly might lead to a reduction in FLW or perhaps even an increase, although both would be a good outcome in terms of social welfare.
27. Abundant literature speculates that market failures and imperfections that may lead to avoidable food waste justify public intervention. Better use of information systems, for example, would help farmers, particularly subsistence farmers, incorporate weather information into their planting decisions, making their decisions more accurate and reducing crop losses. Weather information could specifically help contract farmers, who, concerned about falling short of commitments due to unknown weather events, may overplant. A better understanding of and access to practical agriculture and storage practices also could lead to less waste. In this regard, dysfunctional credit markets could be addressed, as they limit farmers’ and small producers’ access to investments in improved technologies, such as cooling systems, refrigeration, and other improved storage that reduce waste.
28. Markets may fail to lead to socially optimum levels of FLW due to policy failures. Insufficient or poor infrastructure is an often-mentioned cause of waste. Governments may not account for the costs of lost food and waste in their expenditure decisions, thus leading to under-investment. For example, a substantial proportion of the Indian vegetable and food crop is lost at the transportation stage due to unpredictable roads. Intermediaries may transport more than they intend to sell because they know some will be lost. When energy is subsidized, lowering transportation costs, intermediaries may be willing to travel longer distances, even though this risks deterioration of the food commodity. Public extension services that are intended to assist poor farmers with the adoption of technologies that could reduce loss and waste may be under-budgeted and fall short of meeting farmers’ needs. On the trade side, farmers may not be aware of quality standard systems or the systems themselves may be dysfunctional, resulting in a crop not suitable for exports or consumption. At the farm level, weak or non-enforced property rights could result in under-investment in technologies such as storage, thereby generating more FLW. These policy deficiencies increase uncertainty and risk for both producers and consumers, leading to the build-up of excess inventories or reserves as a hedge against the a multitude of risks. These inventories may not be sold due to market conditions or to spoilage, generating waste.

14
ECONOMIC PROBLEM? CONTINUED
29. Addressing market and policy imperfections that appear to trigger FLW could lead to an increase in FLW. Helping producers and consumers manage risks by facilitating access to credit and improving infrastructure are interventions that deserve merit on their own and where the public sector has an important role to play, especially in developing countries. If the issue is poor weather information, addressing this is more effective than addressing welfare losses produced by reducing FLW. And better transportation may convince farmers to produce vegetables instead of cereals, leading to a higher rate of waste; or it may reduce marketing costs, creating incentives for production and sales, also leading to a net result of more waste. In general, since eliminating some market imperfections could lower costs for producers or consumers, the result could well be an increase in production or consumption, and therefore more FLW along the supply chain. The bottom line is that addressing food waste should not be the end in itself. Rather, the end goal is feeding the planet efficiently while conserving the environment and scarce natural resources, and reducing greenhouse gases and other pollution.
30. The critical market failure likely to be leading to excess FLW is the lack of or underpricing of environmental externalities of the food system, which result in undesired levels of environmental impacts. Land and water are used to produce food, but land and water are often not priced or are priced below their economic value. Some land and water are used to produce food that is wasted or lost. For example, forests are high-value keepers of carbon, which otherwise would be released into the atmosphere. This value is lost when forestland is converted for food systems. More concerning is that a portion of this forestland is not generating any benefits because it is used to produce food that is wasted. Similarly, in water-scarce regions, trapping water in irrigation systems may reduce water availability for use elsewhere; some of the water will be used to produce waste.
31. Low food prices drive generation of food waste. If producers had to pay for lost environmental values when forests are converted to farming or for the costs of reducing water supply elsewhere when that water is used to irrigate food production, more land and water would be saved. Food would be more expensive, and producers and consumers alike would most likely respond to higher prices (that reflect increased scarcity) by conserving food, producing less, and wasting less. Because global consumption of food is likely to be inelastic, with the population requiring a certain calorie intake, there is not much scope to reduce global food consumption through higher food prices. Production and consumption systems can become more wasteful if the opportunity costs of wasted food are lower; that is, food overall has less market value.
32. Misguided government intervention, including food subsidies, is likely to compound the problem. In addition to failures in addressing some of the market imperfections described above, governments often intervene in the food market by subsiding consumption or production of food. These subsidies can take many different forms, such as price floors or ceilings, direct cash payment to consumers and producers, and subsidizing inputs. Subsidies also can be reflected in the underpricing of water or of land conversions. In general, consumption subsidies are more prevalent in developing countries, and production subsidies are more prevalent in developed countries. However, decreasing the cost of producing and consuming food is likely to generate more waste along the entire supply chain, as producers incur lower costs and consumers view food as less scarce.

15
33. FLW is associated with one market failure: the emission of greenhouse gases and other pollution from the decomposition of waste, justifying interventions. From a market failure perspective, this is the strongest rationale for reducing FLW by bringing more of it back into the food supply chain, or processing waste into a form that reduces GHGEs (Figure 9), for example by transforming waste into biogas. GHGEs and pollution from food waste are a different issue compared with the use of natural resources (Figure 8), because here food waste is the cause of the problem. That is, even if production and consumption systems were such that prices along the food supply chain reflected environmental values, the “pollution” from food waste would continue to be a problem because it is directly generated by waste. By addressing food waste, one can address the externalities associated with it. While there may be other cost-effective approaches for reducing GHGEs outside the food system, it is difficult to visualize a climate solution that does not include the food system. FLW, which accounts for 8 percent of global emissions, is a key target.
34. From an economic point of view, the first and best approach to food systems would be to insist that all resources used in production be valued according to their opportunity costs. Wasting food generated by scarce natural resources is not the problem. It is at most, one symptom of the problem of underpriced resources and subsidized production and consumption. Food systems should pay for the value of natural resources for alternative environmental uses such as biodiversity or carbon sinks or more clean water available for urban areas, or for the consumption of resources that could be saved for future use. Along the same lines, food systems should also pay for the economic losses from pollution such as GHGEs and nitrification of soils and water, including pollution generated by food waste. Better pricing of land, water and energy or less subsidies will not, however, automatically lead to food systems that produce less waste. For example, if better resource pricing leads to substitution along the supply chain of perishables for staples, food loss could be higher — although this outcome could be better in terms of human welfare overall.
FIGURE 8: Contributions of the main food groups to overall FLW and their carbon, blue-water and land footprints
n Cereal and pulses n Fruits and vegetables n Roots, tubers and oil bearing crops n Meat and animal products
100%
80%
60%
40%
20%
0
Food loss and waste Carbon footprint Bluewater footprint Land footprint
Source: FAO (2019)

16
ECONOMIC PROBLEM? CONTINUED
35. Since correct resource pricing would most likely be unfeasible, could reducing FLW offer another solution, even if partial, to the environmental challenge? Addressing the underpricing of environmental externalities is a rather complicated challenge. The full range of environmental benefits accruing from forests and wildlands, biodiversity, water or reduced pollution are only partially understood, and putting a value to these benefits is even more challenging. Moreover, there are many episodes of open rebellion against higher food, water or energy prices, a likely outcome with improved resource pricing. Given that implicit food subsidies and natural resource underpricing may be politically needed and will likely continue, could strategies to reduce food waste reduce pressure on the environment, saving land, water and energy while producing food for a burgeoning population? Although FLW is not the cause of environmental degradation, except for GHGEs and other pollution, could it be one of the solutions? In other words, could reducing food waste lead to an outcome that parallels improved pricing of natural resources?
36. Societies may also be interested in policy goals other than efficient use of natural resources, food production and consumption; in particular, distributional outcome goals, such as food security for vulnerable populations. The problem of food security is one of food affordability, which could be addressed either by keeping food prices low, which is the usual approach, or by raising incomes of poor people, for example through cash transfers. Reducing food waste is also presented in the literature as a means to address food security, where prices are too high or incomes too low for people to acquire the necessary calories and nutrients. Could reducing FLW offer yet another even partial solution to the food security and affordability challenge? Would a reduction in food waste result in more food available for consumption? And would this action lower food prices, thus making food more accessible to poorer households?
37. Another distributional goal is to increase farmers’ incomes, especially subsistence farmers, to reduce rural poverty. This could be achieved through food or input price supports or through cash transfers. But could reducing FLW also play a role in increasing farmers’ incomes, as much of the
FIGURE 9: FLW contributes to climate change with varying impacts along the food supply chain
n Food wastage n Carbon footprint
40% 37%
35% 32%
30%
25% 23% 22%
20% 17% 17%
15% 14% 14%
10% 12% 12%
5%
0
Agricultural Post-harvest Processing Distribution Consumption Production Handling and Storage
Source: FAO (2013)
% o
f tot
al
17
literature argues? Lower losses at the harvest and post-harvest stages would increase sales and thus farmer incomes from the same amount of land. Along these lines, development agencies have targeted improved storage systems that reduce post-harvest waste as a high-return investment for poor farmers. Although better storage would reduce costs, it could also increase food supply as well as FLW along later stages of the food value chain. Even so, this could be a desirable outcome.
38. Reducing food waste may be one of the strongest candidates for achieving the twin goals of addressing the food challenge (globally or locally) and reducing GHGEs (WRI 2019). One way of handling scarcity — such as limited available land for expansion — is to increase yields of land already under farming, as opposed to farming extra land that currently may be producing carbon storage and biodiversity services. In this case, the concept of yield applies to food consumed (at the end of the supply chain) per unit of scarce natural resource, such as farmed land. This increased yield can be achieved by increasing crop yields and/or reducing food waste. Reducing food waste enhances the productivity of all scarce natural resources — land, water, fisheries and minerals for fertilizing. More food will be consumed per unit of natural resource used. In a sense, this concept is akin to Total Factor Productivity. It augments output from the same amount of inputs, if one does not take into account the labor and capital effort needed for reducing waste. This may not be true for higher yield cropping (tones/ha) which may, for example, demand more water or fertilizers.
39. These are fundamental questions that demand empirical research, as the ability to better manage FLW and save natural resources is far from straightforward. We need to understand what drives FLW and how reducing it could address the often-conflicting objectives of conserving natural resources, reducing greenhouse gases, improving food security, and increasing the incomes of the rural poor. We also need to understand how FLW can contribute to these goals when compared with a more direct and benchmarked approach of increasing food costs to reflect environmental externalities. To address these questions, we develop a framework to investigate how reduction of FLW will resonate along the food supply chain. This is discussed in the next section.
V. A Conceptual Framework
A. THE ECONOMIC MODEL
40. We are interested in understanding (i) the key drivers of FLW, (ii) if reducing FLW could indeed save natural resources and reduce GHGEs, while improving food security and farmers welfare, and (iii) what might be the impacts of policy interventions to reduce FLW. Despite widespread calls to reduce FLW, there is much controversy concerning the extent of the problem, why there is FLW, and how to reduce FLW across the food supply chain. More importantly, there exists no foundational economic model of FLW for consumers, processors, intermediaries and farmers based on first principles. Such a model must initially distinguish between purchases and sales for each intermediary, purchases and consumption for consumers, and gross production versus sales for farmers (de Gorter 2014). This is because each stage in the food value chain incurs its own rate of loss or waste, defined over a cost function: cost to reduce loss or waste and cost to dispose of the waste. Without such a model, it is difficult to make accurate predictions of how interventions designed to reduce FLW influence behavior directly at the stage of the food value chain where the intervention takes place, and hence their impact on equilibrium prices, quantities, and FLW.
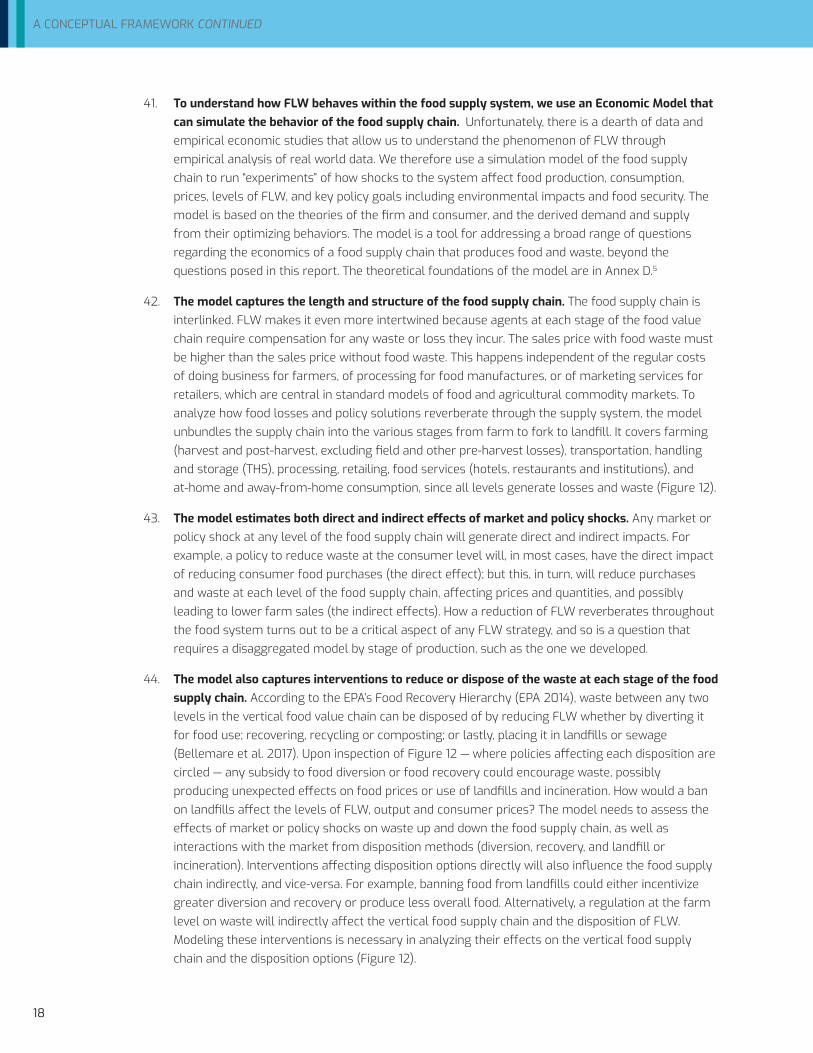
18
A CONCEPTUAL FRAMEWORK CONTINUED
41. To understand how FLW behaves within the food supply system, we use an Economic Model that can simulate the behavior of the food supply chain. Unfortunately, there is a dearth of data and empirical economic studies that allow us to understand the phenomenon of FLW through empirical analysis of real world data. We therefore use a simulation model of the food supply chain to run “experiments” of how shocks to the system affect food production, consumption, prices, levels of FLW, and key policy goals including environmental impacts and food security. The model is based on the theories of the firm and consumer, and the derived demand and supply from their optimizing behaviors. The model is a tool for addressing a broad range of questions regarding the economics of a food supply chain that produces food and waste, beyond the questions posed in this report. The theoretical foundations of the model are in Annex D.5
42. The model captures the length and structure of the food supply chain. The food supply chain is interlinked. FLW makes it even more intertwined because agents at each stage of the food value chain require compensation for any waste or loss they incur. The sales price with food waste must be higher than the sales price without food waste. This happens independent of the regular costs of doing business for farmers, of processing for food manufactures, or of marketing services for retailers, which are central in standard models of food and agricultural commodity markets. To analyze how food losses and policy solutions reverberate through the supply system, the model unbundles the supply chain into the various stages from farm to fork to landfill. It covers farming (harvest and post-harvest, excluding field and other pre-harvest losses), transportation, handling and storage (THS), processing, retailing, food services (hotels, restaurants and institutions), and at-home and away-from-home consumption, since all levels generate losses and waste (Figure 12).
43. The model estimates both direct and indirect effects of market and policy shocks. Any market or policy shock at any level of the food supply chain will generate direct and indirect impacts. For example, a policy to reduce waste at the consumer level will, in most cases, have the direct impact of reducing consumer food purchases (the direct effect); but this, in turn, will reduce purchases and waste at each level of the food supply chain, affecting prices and quantities, and possibly leading to lower farm sales (the indirect effects). How a reduction of FLW reverberates throughout the food system turns out to be a critical aspect of any FLW strategy, and so is a question that requires a disaggregated model by stage of production, such as the one we developed.
44. The model also captures interventions to reduce or dispose of the waste at each stage of the food supply chain. According to the EPA’s Food Recovery Hierarchy (EPA 2014), waste between any two levels in the vertical food value chain can be disposed of by reducing FLW whether by diverting it for food use; recovering, recycling or composting; or lastly, placing it in landfills or sewage (Bellemare et al. 2017). Upon inspection of Figure 12 — where policies affecting each disposition are circled — any subsidy to food diversion or food recovery could encourage waste, possibly producing unexpected effects on food prices or use of landfills and incineration. How would a ban on landfills affect the levels of FLW, output and consumer prices? The model needs to assess the effects of market or policy shocks on waste up and down the food supply chain, as well as interactions with the market from disposition methods (diversion, recovery, and landfill or incineration). Interventions affecting disposition options directly will also influence the food supply chain indirectly, and vice-versa. For example, banning food from landfills could either incentivize greater diversion and recovery or produce less overall food. Alternatively, a regulation at the farm level on waste will indirectly affect the vertical food supply chain and the disposition of FLW. Modeling these interventions is necessary in analyzing their effects on the vertical food supply chain and the disposition options (Figure 12).
19
45. The model allows for alternative economic parameters. These include (i) elasticities of supply and demand, and cross-elasticities between at-home and away-from-home food consumption; (ii) marginal costs of supply of services for each intermediary; (iii) marginal costs of abatement and disposition of waste either as food recovered, donated or sent to a landfill; and (iv) openness to trade ranging from a closed economy to a small open economy, and to a large open economy with elasticities of export supply and import demand.6, 7
46. The model reports on relevant policy goals and the trade-offs between them. Societies, both at a planetary or local scale, are likely to be concerned with overuse of scarce natural resources, namely land and water, pollution, emissions of greenhouse gases, consumer food security, farmers’ welfare where rural poverty is a concern, and trade in the case of some small open developing economies or economies with market power. Therefore, the model describes how market shocks affecting food systems and waste would in turn impact the following policy goals:
• Improve food security and affordability by reducing effective prices borne by consumers8 and increasing final consumption quantities.
• Improve farm welfare to improve rural livelihoods and decrease rural poverty.
• Reduce farm production to reduce stress on natural resources such as land and water.
• Reduce greenhouse gas emissions (GHGEs).
• Increase the value of trade, which is relevant for some developing countries with trade imbalances and for tracking how domestic FLW could affect trading partners.
47. The quantity of FLW is never a policy goal per se, but it will have important impacts on policy goals. A reduction in the quantity of total loss and waste will sometimes help one policy goal while hindering another. A cut in food waste rates can have opposite effects on farm welfare and consumer prices. Reducing waste that reduces GHGEs can in some cases increase food prices (impacting food security) and reduce farm welfare. In some cases, farm production reductions can occur without sacrificing the goal of reducing GHGEs or improving food security. However, conflicting goals can exist for food security and GHGE reductions when the goal is to increase the value of international trade. The outcome depends on the intervention or market shock, where along the supply chain it occurs, and the structure of the market. The goal of this analysis is to isolate the key factors contributing to policy goals, and to describe under what conditions they really matter and why.

20
A CONCEPTUAL FRAMEWORK CONTINUED
Box 5: The Conceptual Framework
Our conceptual framework for analyzing FLW has three parts. The first part describes how the food system including FLW reacts to exogenous market shocks or policy interventions. It captures the complexity of the food supply chain with seven stages. Each stage optimizes production, sales and purchases, and FLW, considering also the costs of reducing loss and waste and of disposing of the waste. Quantities, prices and FLW are endogenous to the system and are determined by changes in economic behavior in the face of the external shocks or interventions. Interventions (public policies or private initiatives) designed to reduce FLW have direct effects over the economic agents’ behavior directly at the stage of the value chain where the intervention takes place, and hence ultimately affects the pre-existing equilibrium. In addition, interventions will generate indirect effects cascading up and down the value chain, as all market participants are interconnected. The impacts will vary from commodity to commodity and differ between countries, depending on supply and demand elasticities, degree of openness to international trade, and the rates of FLW at each stage of the value chain. (Figure 10)
FIGURE 10: Food supply chain and policy interventions
The second part considers that the observed levels of FLW from the first component may not be optimal, despite the optimizing behavior of economic agents. This is due to the existence of market or policy failures that cause food losses and waste to be too much or too little. The critical market failures are the environmental externalities of the food system. FLW is both a cause of a problem in releasing GHGEs and a symptom of a problem — low food prices that lead to higher levels of loss and waste. Prices are low because food is not paying for the negative environmental externalities it generates: losses of biodiversity, forests, over-use of water, GHGEs and other pollution. Critical policy failures are explicit or implicit subsidies to food production and consump-tion, and distortions in the market for inputs such as water and energy that also lower food prices. Correcting market and policy failures, prices and quantities would change at all stages of the food supply chain. FLW would most likely decline, and social welfare would perhaps also improve as FLW levels decrease (Figure 11).
UPSTREAM (TOTAL FOOD)
DOWNSTREAM (TOTAL FOOD)
FOOD LOSS AND WASTE PREVENTION POLICIES
FOOD LOSS AND WASTE OCCURRING THROUGHOUT THE VALUE CHAIN
Diversion policies Tax or regulations on other uses Recover/recycle policies
Diverted for food use
Non-recoverable uses
• Land/sewage• Landfill/
incineration
Recovered for use in:
• Feed/fertilizer• Pet food• Energy, etc.• Composting and
oils/grease for biodiesel
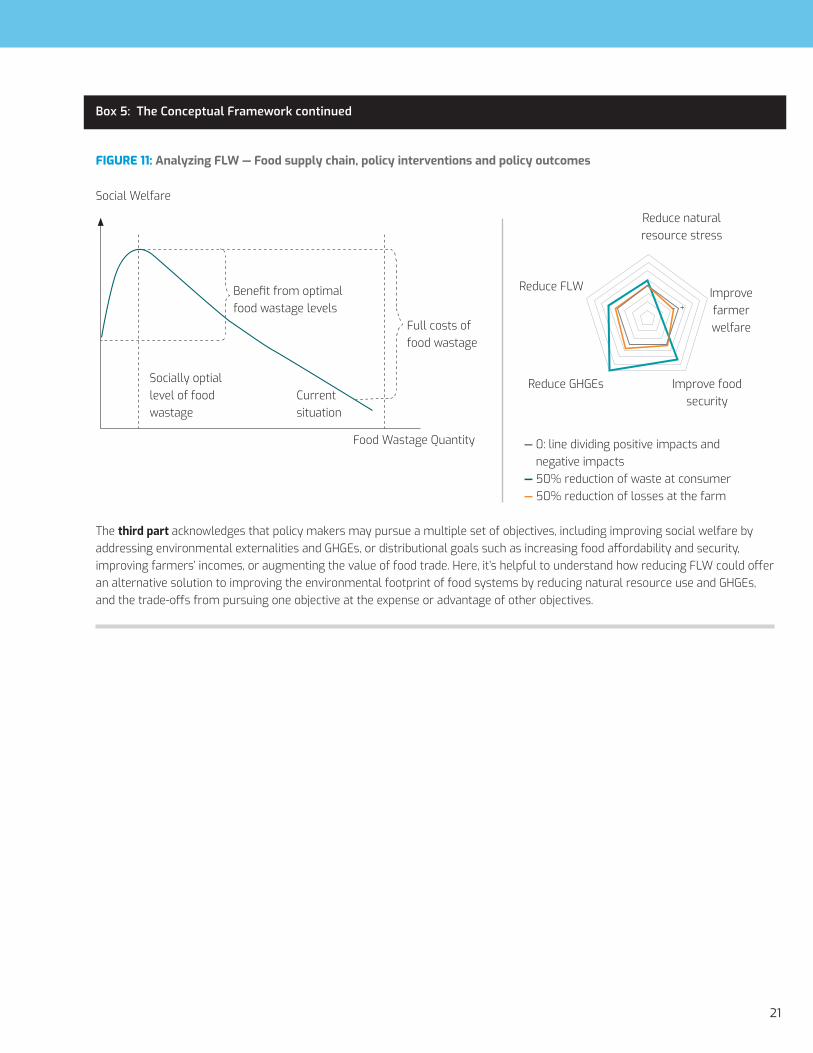
21
Box 5: The Conceptual Framework continued
The third part acknowledges that policy makers may pursue a multiple set of objectives, including improving social welfare by addressing environmental externalities and GHGEs, or distributional goals such as increasing food affordability and security, improving farmers’ incomes, or augmenting the value of food trade. Here, it’s helpful to understand how reducing FLW could offer an alternative solution to improving the environmental footprint of food systems by reducing natural resource use and GHGEs, and the trade-offs from pursuing one objective at the expense or advantage of other objectives.
FIGURE 11: Analyzing FLW — Food supply chain, policy interventions and policy outcomes
Social Welfare
Benefit from optimal food wastage levels
Full costs of food wastage
Socially optial level of food Current wastage situation
Food Wastage Quantity
Reduce natural resource stress
Reduce FLW Improve farmer welfare
Improve food security
Reduce GHGEs
— 0: line dividing positive impacts and negative impacts
— 50% reduction of waste at consumer— 50% reduction of losses at the farm
- +

22
A CONCEPTUAL FRAMEWORK CONTINUED
FIGURE I2: The food supply chain, policy objectives and policy inputs
B. FOUR COMMODITIES IN THE UK
48. We use UK data to calibrate the model and to investigate how the food supply chain responds to FLW. This is because UK data is the only data set available on a comprehensive basis. In 2005, Waste and Resources Action Program (WRAP) launched a major research effort to quantify the nature, scale, origin and causes of food waste in the UK (Quested et al. 2013). Since then, data sets on waste at the consumer, retail, processing and food services levels were developed. We used additional sources to complete the WRAP data sets (see Annex D for the data).
49. For the UK, we consider four commodities — chicken, bread, fruit and milk. These illustrate commodity types that belong to different food groups, and have different manufacturing methods, import/export relationships, prices, quantities, complements, substitutes and waste generation. We model both inelastic and elastic demand curves for the four commodities. Our findings and the literature indicate that some of the impacts of reducing waste are very sensitive to assumptions regarding elasticities to the point of reversing the directions of change; hence we investigate both inelastic and elastic demands and supplies. We model both a closed and a trade economy to compare how significantly trade could impact the indirect effects of food waste. And we approach a developing country situation by assuming, in some analyses, that most waste is at the producer
Reduce stress
on land, water and chemicals
Reduce GHGEs
Improve food security
Improve farm welfare
Increase value of trade
Policy Inputs
Policy ObjectivesMARKET FAILURES DISTRIBUTIONAL GOALS
Ecotax or reduce
production or consumption
subsidies
Technologies to reduce
FLW in production or consumption
Tax waste or subsidize
recoveryBan FLW in landfills
Pro-duction
Trans-port,
handling +storage
Processing
FLW FLW FLW FLW
FLW FLW FLW FLW
HRIHotels,
Restaurants,Institutions
RetailerFLW
FLW Away from home
Home
Quan
tity
of fo
od p
rodu
ced
Qua
ntity
of f
ood
cons
umed
Landfill/Incineration
Recovery/Reuse

23
level, in contrast with the UK data, which, typical of developed countries, puts most waste at the consumer level. While we also have analyzed FLW for the specific situation of Rwanda, Vietnam, Nigeria and Guatemala, those results are not discussed here and are available in separate reports entitled Country Diagnostics.
50. Economic indicators differ markedly between the four commodities, a fact that enriches our results. Table 1 shows four key indicators of the four UK products studied, with each having varying importance in the analysis of reducing food waste. The first row shows the share of domestic production imported. The shares are quite low (the UK is a net exporter of milk) except for fruit. As a result, the impacts of reduction in waste rates and price shocks will differ markedly for fruit compared to the other three commodities.9 The second row in Table 1 shows the farm share of the final consumer dollar, ranging from a low of 11 percent for milk to a high of 57 percent for fruit. This share matters, but not as much as other factors. The third row in Table 1 shows the share of at-home food consumption that will influence the outcome, depending on whether rates of waste are reduced for at-home versus away-from-home, and the cross-price elasticity of substitution. For all commodities, these shares are quite high, ranging from a low of 0.65 for chicken to a high of 0.93 for milk.
TABLE 1: Important characteristics of the UK products studied (ratio)
Chicken Fruit Bread Milk
Share of:Production imported 0.33 6.95 0.04 -0.02
Consumer $ to farmer 0.24 0.57 0.11 0.47 At-home purchases 0.65 0.83 0.74 0.93 Production wasted 0.42 0.49 0.36 0.20
51. In some of the analysis of GHGEs we assume that all imports are produced domestically, and all exports are produced externally. We base all GHGE calculations as if all consumption were produced in the UK. We increase domestic food production by the implied production of imports (and hence down for exports).10 This allows one to capture emissions from production, from producing waste, and from waste directly generated in the production of imported commodities. We do this so that comparisons across commodities (and between open and closed economies) are consistent when we do policy simulations, as trade shares vary widely, as the first row of Table 1 indicates. Assigning GHGEs to the importing country provides a more complete description of the GHGEs triggered by its food system, emissions that can occur both in the exporting and importing country. For example, suppose Spain exports fruit to the UK, the GHGEs from farming fruit in Spain that is exported to the UK will be accounted as UK emissions. (GHGEs can be assigned to either the importing country, the case in this report, or to the exporting country. This affects GHGE accounting, but not the results of the simulations to be reported later.)

24
A CONCEPTUAL FRAMEWORK CONTINUED
TABLE 2: Levels and distribution of waste, margins and GHGEs
Chicken Fruit Bread MilkRates of waste:
Farm production 0.043 0.143 0.020 0.029THS 0.010 0.045 0.014 0.042Processor 0.225 0.053 0.050 0.011Retail 0.076 0.070 0.140 0.060HRI 0.045 0.084 0.117 0.009Away-consumption 0.023 0.043 0.060 0.005At-home consumption 0.382 0.373 0.293 0.091
Margins (£ sterling per kg or per liter): THS 0.003 0.127 0.273 0.103Processor 0.964 0.190 0.559 0.087Retail 1.850 0.296 0.799 0.071HRI 2.384 0.466 1.040 0.163
GHGEs per unit product (kg of CO2 eq/kg of product): Farm production 7.5 0.174 0.57 1.8THS 0.013 0.013 0.006 0.013Processor 0.625 0.25 0.625 0.625Retail/HRI 0.25 0.25 0.25 0.25Consumption 0.753 0.003 0.75 0.003
52. Consumers contribute the most and farmers the least to the lost value of waste. Figure 13 summarizes the quantity and value of food waste at the farm, intermediary (aggregate), and consumption (at-home and away-from-home) levels. Note first that the value of waste increases as one moves from upstream (the farm) to downstream (the consumer). This is because the downstream stages embody the value incorporated into waste by the upstream stages. Quantities of waste are highest at the intermediary stage for chicken, bread and milk, but not for fruit, as most fruit FLW is generated by consumers.
FIGURE 13: Quantity and value of food loss and waste by product in the UK
n Farm Production n Intermediaries n Consumption
Quantity Value
3.5 5 3 4 2.5 2 3
1.5 2 1 0.5 1
0 0 Chicken Fruit Bread Milk Chicen Fruit Bread Milk
Commodities Commodities
Mill
ions
of t
ons
Poun
d St
erlin
g pe
r KG

25
PRODUCTIONTRANSPORT, HANDLING, AND STORAGE
PROCESSING WHOLESALE AND RETAIL CONSUMERS
UNITED KINGDOM
CHICKEN 58% 4 .3% 1% 22 .5% 7 .6% 38% Total Loss Rate
FRUIT 55% 14 .3% 4 .5% 5 .3% 8 .4% 37% Total Loss Rate
BREAD 44% 2% 1 .4% 5% 14% 29% Total Loss Rate
MILK 22% 2 .9% 4 .2% 1% 6% 9 .6% Total Loss Rate
RWANDA
TOMATOES 49% 21% 11 .5% 0% 23 .6% 5% Total Loss Rate
MAIZE 25% 6 .4% 11 .9% 5% 2 .7% 2% Total Loss Rate
RICE 18% 4 .4% 8 .6% 1 .5% 2 .7% 2% Total Loss Rate
VIETNAM
RICE 21% 2 .5% 7 .7% 3% 5% 5% Total Loss Rate
CATFISH 32% 9% 2 .8% 10% 7% 7 .7% Total Loss Rate
FIGURE 14: Rates of loss and waste at each stage of the supply chain — UK, Rwanda, Vietnam

26
A CONCEPTUAL FRAMEWORK CONTINUED
53. The outcomes of interventions or market shocks on FLW will depend critically on the level and distribution of rates of waste, margins for intermediaries, and GHGEs per unit of product. Generally and for all commodities, loss and waste are highest for at-home consumption (Table 2) and much larger for chicken (38 percent) than for milk (9 percent). Margins increase as food moves downstream. GHGEs per unit product are highest at the farm level for chicken and milk, and lowest at the THS level. Emissions for chicken at the farm level are exceedingly high compared with the other commodities, with rates of waste higher at the consumption level.
54. Data on waste for two developing countries highlight the key structural differences between developed and developing country. Figure 14 shows the stages of the supply chain with highest levels of FLW for UK, Vietnam and Rwanda. Vietnam is a low middle-income country and a large open economy from a trade perspective. Rwanda is a low-income country and a small open economy, a price-taker in international markets. Figure 14 confirms that in a developed country, the higher rates of waste are at the consumer level for all commodities, while in Rwanda and Vietnam consumers are in most cases the less wasteful level. While the model was initially calibrated with UK data, some key parameters were changed to capture the characteristics of a developing country, namely rates of waste, margins for intermediaries, and coefficients of CO2 emissions. Depending on the developing country and commodity, the degree of openness to trade also was considered in the simulations. Finally, the simulations may not capture the specifics of a fragile, conflict- and violence-affected country (FCV). This remains an area for future work.
C. THREE QUESTIONS
55. The overarching objective of this report is to assess the economic case for reducing food loss and waste. As discussed previously, some FLW is normal and desirable. In a food economy in which inputs and outputs are at their optimum levels, it may not be worthwhile to incur the costs of reducing or recovering part of that FLW.
56. The strongest rationale for reducing FLW is to address market failures. As discussed above, a key market failure is the failure to account for environmental values lost through food systems. Consider two types of environmental market failures. The first type is directly associated with FLW, namely GHGEs or emissions of other pollution from the decomposition of food waste. FLW should be reduced to reduce the GHGEs and other pollution emanating from waste decomposition. The second type of market failure concerns other problematic aspects of the food system not intrinsic to FLW, such as over-consumption of water, conversion of forestland, biodiversity losses, and excess nitrification of soils and water. Whether reducing FLW could help lessen welfare and distributional impacts of these externalities, as is suggested in the literature, is a key question of this report.
57. The direct approach for addressing environmental market failures not intrinsic to loss and waste would be to issue policies to bring other GHGEs, water consumption, deforestation or chemical pollution to acceptable levels. Fresh-water consumption, land conversions to farming, and GHGEs all lead to negative environmental externalities; that is, costs borne by society but not captured in market prices. If these values were accounted for in market decisions, food prices would most likely be higher and FLW lower. Thus, our hypothesis is that a key driver of FLW are food prices that are too low because they do not reflect the environmental opportunity cost of resources consumed in food production. Our first question then is whether higher food prices and costs reflecting environmental values would reduce food loss and waste.

27
QUESTION 1: Would higher food prices and costs reflecting environmental values reduce food loss and waste?
58. The first-best policy response to address environmental market failure would be to price externalities. We call this approach an environmental pricing strategy. Pricing externalities through, for example, taxes would in principle reduce the environmental footprint of food systems through less deforestation and wildland conversion, water consumption, chemical pollution or GHGEs, but it could also increase or decrease food prices throughout the supply chain. And while this approach has conceptual appeal, it could be daunting to implement. First, other than for the carbon footprint of food systems, it might be difficult to price environmental externalities such as deforestation, water consumption or chemical flows. Second, there may be serious political impediments to a pricing strategy. Examples abound of open revolt against higher food, energy or water costs. Third, societies may seek a complex set of policy and welfare goals, often facing trade-offs between them; while overall economic welfare could increase, other policy goals may be made worse.
59. Possibly, though, there might be a case for reducing FLW as a second-best policy candidate, absent progress in correcting market failures through environmental pricing, markets or regulations. We call this approach a “food loss and waste reduction strategy.” The food that is lost or wasted already has expended scarce resources; therefore, if it could be brought back into the food system, more food would be available without adding to environmental pressures. This argument is popular in the literature, but so far has been subject to limited analysis. Reducing FLW through interventions specifically designed for this purpose might be easier to implement than environmental pricing and politically more acceptable, and would strengthen the case for reducing FLW. Considering this possibility is one of the central objectives of this study.
QUESTION 2: Would reducing FLW help reduce the environmental footprint of food systems and have co-benefits for other policy goals, in particular food security.
60. We address this second question by comparing an FLW reduction strategy with the benchmark environmental pricing strategy. The environmental pricing strategy would address the market failure directly. We capture this strategy in our simulation model by taxing production and consumption. While these are not environmental taxes, their effects would correlate, for example, with the effects of a charge for water consumption, land conversions or GHGEs, since all would increase food production costs within the supply chain. In a sense, this is a solution that focuses on the supply side, impacting production, in particular at the farm level. The alternative strategy is to reduce FLW, which in a sense is a demand-side solution. Putting lost food and waste back into the food system would reduce demand for farming, which is where most environmental externalities occur. We examine what would happen if FLW were reduced at each of the levels of the supply chain. In some simulations we treat these rates as costless exogenous shocks, while in other simulations we specify a loss and waste abatement cost curve.
61. We compare the two strategies through their impacts on five policy goals. As highlighted earlier, in most countries, especially in developing countries, policy makers are torn between conflicting objectives. On the one hand, they may want to address the environmental externalities from natural resource use and be genuinely alarmed with the rapidly dwindling availability of land and water. Countries committed to the Paris Climate Agreement in particular may recognize the high level of GHGEs generated by food waste. On the other hand, they may want to improve food security for poor consumers by making food more accessible and affordable. To reduce rural poverty, they may also want to increase farmers’ incomes through more sales at higher prices. Some small open developing economies that face trade or current account imbalances and

28
A CONCEPTUAL FRAMEWORK CONTINUED
currency shortages may want more value of exports and lower value of imports. In summary, the policy goals might be:
• Reducing the environmental footprint of the food system
• Reducing GHGEs
• Improving food security (increasing consumption and reducing food prices)
• Improving farm welfare
• Improving the trade balance
QUESTION 3: At which stage(s) of the food supply chain — farming, intermediaries, or consumers — should a food waste reduction strategy be deployed to be most effective in achieving each of the five policy goals?
62. Most likely there would be trade-offs between policy objectives. Also, the most effective approach might differ between commodities and depend on the economic context, namely food demand and trade characteristics, of the country. Therefore, we use the model to compare the impacts of interventions at different stages of the supply chain on policy goals and under different assumptions regarding the characteristics of the food economy.
63. This is far from being a complete analysis of the economics of FLW. However, the model is a powerful tool that can be used to address a wide range of questions and hypotheses other than the ones raised in this report for different country situations and market structures. One topic requiring further work concerns the costs of abating or disposing of FLW. While we considered these scenarios in some simulations, assumptions were based on scant data. Better data sets on the costs of reducing FLW are needed. This remains an area for future work, better pursued at the country level.
VI. The Case for Reducing Food Loss and Waste
A. QUESTION 1: WOULD HIGHER FOOD PRICES REFLECTING ENVIRONMENTAL VALUES REDUCE FLW?
64. Hypothetically, food prices that reflect environmental values will generate less FLW. Suppose there were a tax on farming to reflect the environmental values of natural resources consumed (land and water). Higher farming costs due to the tax could have two effects. First and foremost, with higher costs, food production and consumption would decline, resulting in a decline in FLW throughout the supply chain. Second, the tax could trigger higher prices throughout the supply chain, which could lower rates of loss and waste (that is, the proportion of food that is lost) by incentivizing producers and consumers to make the extra effort to reduce waste or by making even partial waste recovery more worthwhile. Some may even argue that with correct pricing there is no need to worry about future food supply. As demand for food increases due to population and incomes, and with supply constrained by finite resources, the upward pressure on prices will be sufficient to trigger the necessary response from food systems, including a reduction in FLW, preempting the need for public intervention. There is, therefore, value in assessing the extent to which the food system may itself automatically trigger less food waste and other adjustments because of potentially higher prices from demographics and supply constraints.

29
65. More difficult to determine is the kind of adjustments that higher prices would trigger in the food supply chain. While higher prices would create incentives to reduce FLW, the outcome could also well be expanded production or consumption, which would lead to more FLW, once both direct and indirect (price) effects are accounted for. The response of the food system to higher prices (food costs) would depend on elasticities of supply and demand, and consumers’ ability to adjust caloric intake, substitute commodities, or become more open to imports. Hamilton and Richards (2019) have argued that where consumer demand is price-elastic, higher food prices could lead to more waste. Also important is the mechanism affecting food prices. Higher costs of farming from a tax on production would likely trickle down differently from a tax on consumption for GHGEs. A tax on consumption, for example, could reduce demand for food and trigger lower prices upstream in the supply chain. Finally, higher food prices in an open economy could lead to a loss of trade competitiveness if other countries do not follow similar strategies. Clearly, there are many moving pieces in the food economy, which makes predicting how one variable affects another based solely on first principles difficult. These become empirical questions that we address in this Section.
66. Higher food prices would indeed reduce FLW throughout the supply chain. The simulation results show that an increase in food prices triggered by higher costs at the retail (consumer), processor or farm levels not only would reduce waste at the consumer level, but because of the indirect effects, would reduce waste over the entire supply chain (Figure 15).
FIGURE 15: Higher consumer food prices lead to less FLW in a closed economy
— Consumer waste — Total waste
2.0
1.5
1.0
0.5
0 1.29 2.07 2.86 3.65 4.45 5.25 6.07 6.90 7.73 8.58
Prices paid by consumers (pound sterling)
Mill
ions
of t
ons

30
THE CASE FOR REDUCING WASTE CONTINUED
TABLE 3: Impacts of price and cost changes on food loss and waste Summary of results: percent change in total FLW – UK chicken
Model 1a Model 1b Model 1c Model 1d UK elastic UK small UK closed UK inelastic trade curves open economy economy trade curves
50% ↑ PR -32 -26 -20 -29
50% ↑ PP -17 -26 -20 -18
50% ↑ PF -12 N.A. -13 -18
20% qF sub 4 4 3 4
20% qC sub 11 10 7 11
↓ all α’s by 50% -53 -52 -55 -52
↓ αF 50% -2 -2 -4 -3
↓ αP 50% -15 -22 -16
↓ αR 50% -4 -4 -4
↓ αC 50% -26 -27 -23 -25
α: rates of loss or waste at different levels of the value chain 50% ↑ PP: Increase of the margin for retailer by 50% of baseline PR50% ↑ PF: Shift of Sc such that farm sales price increases 50%20% qF sub: Setting a production subsidy equal to 20% of baseline farm sales price20% qC sub: Setting a consumption subsidy equal to 20% of baseline consumer purchase price retail
67. The inverse relationship between food prices and food waste holds under different trade and demand elasticity assumptions. In a large open economy higher food prices reduce consumer waste both under elastic and inelastic demand curves. The same result holds for a small open economy as a price-taker in world markets.
68. For the four commodities under consideration — chicken, fruit, bread and milk — levels of food waste continually decline with higher prices. An increase in the price of food facing at-home consumers due to exogenous shocks or policy interventions leads to a decline in food waste. Both at-home food purchases and consumption decline, regardless of the demand price elasticity. Away-from-home food purchases and consumption increase, as does away-from-home food waste, as consumers shift consumption to restaurants and other food services. However, since the direct influence of an increase in at-home prices always dominates the indirect effects that increase away-from-home consumption and waste,11 total food consumption declines as does total consumer food waste.
69. The real-world UK price increases between 2007 and 2012 further illustrate the role of food prices as drivers of food waste. Between 2007 and 2012, a 15 percent reduction in the UK household food waste occurred (with a 21 percent reduction in avoidable household food waste, see Figure 16). This was due in part to economic conditions during this period that were conducive to household food waste prevention. Food prices were increasing and wages (in real terms) were decreasing. However, during 2014 and 2015, this picture changed as food prices entered a period of deflation and real incomes starting to increase. These trends are likely to have increased upward pressure on household food waste, consistent with our simulations of the impacts of food prices.

31
FIGURE 16: Total household food waste in the UK, 2007-2015, split by edibility, millions tons
Source: WRAP (2018), pg. 33
70. Farming and consumer subsidies also generate FLW. Governments often subsidize production, particularly in developed economies, and consumption, especially in developing economies. Both subsidies increase food waste from chicken, as well as from the other commodities. In a developed closed economy, a 20 percent farming subsidy increases total waste in the supply chain by 3 percent. A consumption subsidy increases waste by 7 percent. For a small open economy, these figures would be 4 percent and 10 percent respectively.
TABLE 4: Impacts of production and consumption taxes on total food FLW in the food system
Commodity 20% CONSUMPTION TAX 20% PRODUCTION TAX Low elasticity High elasticity Low elasticity High elasticity
Chicken -2.5% -5.5% -4.6% -3.7%
Fruit -3.2% -4.9% -4.2% -4.7%
Bread -4.3% -7% -1.9% -1.7%
Milk -2.1% -3.3% -3.6% -3.2%
71. However, the relationship between production and consumption taxes, food prices, and FLW is more complicated than it appears. The results above treat the rate of loss and waste as fixed (Table 3). To assess the effects of taxes on the food system, it is important to use a model that captures both the changes in production and consumption and the changes in rates of waste. This is done by including an abatement cost curve that relates costs of abatement (or of reducing loss and waste) to the proportion of food preserved. This makes the rate of waste endogenous to the model. That is, consumers and producers choose how much food to save (i.e., not waste) based on the costs of saving the food, in addition to how much food to produce and consume. While the abatement cost version is more realistic, we have not yet developed sufficient data for a precise specification of the abatement cost function, and so we consider two scenarios, a more elastic and a less elastic abatement cost function. The more elastic means reducing FLW is more costly. In later simulations we return to a specification with exogenous rates of loss and waste, as it leads to similar conclusions.
n Wasted food n Inedible parts
10
8
6
4
2
0 2007 2012 2015
Mill
ions
of t
ons

32
THE CASE FOR REDUCING WASTE CONTINUED
72. With a loss and waste abatement cost function, taxes on consumption and production would also lead to less total loss and waste in the food system. A 20 percent tax on consumption, for example, to reduce GHGEs, would reduce total loss and waste of chicken by 2.5 percent and 5.5 percent respectively for the less elastic and more elastic abatement cost curve. A 20 percent tax on production would reduce total food loss and waste by 4.6 percent and 3.7 percent respectively in the less elastic and more elastic abatement cost curve cases. Introducing taxes in production or consumption would indeed lead to less food and waste, even with increasing costs of loss and waste abatement.
73. The relationship between food prices and FLW is also evident at each stage of the food supply chain. The fact is, a tax would trigger adjustments in prices, production, sales, purchases and consumption. A consumption tax of 20 percent would reduce prices throughout the supply chain due to a cascading effect (to be discussed in detail at a later section), but its effects would be different at the consumer level and upstream levels in the supply chain. Consumer prices would increase by 11.4 percent and consumer waste would decline by 7.5 percent both from less consumption and a lower rate of waste (-0.3 percent) because food is more expensive. But since consumers faced with higher after-tax prices would lower consumption and purchases, each stage of the food supply chain would also decrease production and sales, leading to a drop in prices at each stage. Farm prices would decline by 31 percent and THS prices by 15 percent. Lower prices would increase rates of waste at these stages of the supply chain as producers would move to lower the cost of abatement. Farmers, for example, would increase rate of waste by 3.7 percent. Still, the net result would be a decline in total waste.

33
TABLE 5: Chicken: Impacts of a 20% production and consumption tax on each stage of the food supply chain (high abatement elasticity scenario, closed economy UK)
20% PRODUCTION TAX
Price (with tax) Waste Rate of waste Sales/consumption
Farm -6.6% -1.7% 1.8% -3.4%
THS - -5% -1.6% -3.4%
Processor 8.8% -4.7% -1.3% -3.1%
Retailer 4.5% -3.6% -0.7% -2.8%
HRI 3.7% -4.1% -0.7% -3.4%
Home consumption 4.4% -2.9% -3% -2.7%
Away from home 3.7% -0.4% -0.1% -3.5%
20% CONSUMPTION TAX
Price (with tax) Waste Rate of waste Sales/consumption
Farm -30.9% -3.7% 3.7% -7.3%
THS - -3.7% 3.9% -7.4%
Processor -9.4% -4.5% 3.1% -8.2%
Retailer 11.7% -4.4% 2.8% -7.2%
HRI -7.4 -7.3% 3.5% 10.5%
Home consumption 11.4% -7.5% -0.3% -7%
Away from home -7.3% -5.4% 5.7% -10.6%
74. These results highlight the two consequences of a change in prices which may either reinforce each other or operate in different directions: a change in levels of production and consumption and a change in rates of waste. At each stage of the supply chain there are two forces at play: the amount of waste per unit of production (wastage rate) and the level of waste with the rate held constant. Each is affected differently by policy. Consider first the consumer tax (Figure 17). Consumers decrease both demand (purchases) and rate of waste, both reinforcing each other in reducing consumer waste. With lower prices due to a consumer tax and lower demand, farmers reduce production by 7.2 percent and increase the rate of loss and waste by 3.8 percent. Here, the two effects work in opposite directions: less production leads to less waste, but lower prices lead to higher rates of waste, with net results of a decline of 3.7 percent in farm total waste. Consider now the production tax. A production tax operates differently. Farmers now produce less since they are paid a lower after-tax price. Reduced supply triggers price increases downstream. Because there is less production there is also less loss and waste. Additionally, with higher prices, producers reduce the rate of waste throughout, further decreasing FLW. In this case, the production effect and the rate effect reinforce each other. These results confirm this section’s hypothesis that prices and rate of loss and waste (which depends on effort put into reducing loss and waste) are inversely correlated — higher prices trigger lower rate of waste, and lower prices trigger higher rate of waste.
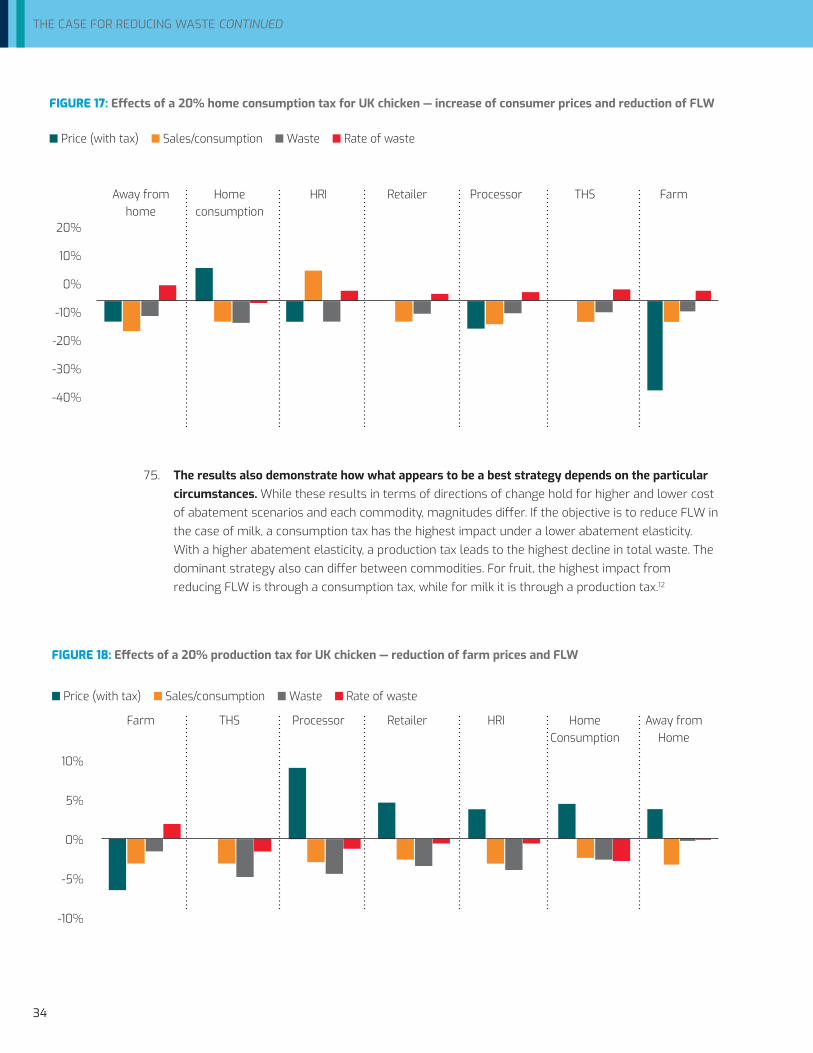
34
75. The results also demonstrate how what appears to be a best strategy depends on the particular circumstances. While these results in terms of directions of change hold for higher and lower cost of abatement scenarios and each commodity, magnitudes differ. If the objective is to reduce FLW in the case of milk, a consumption tax has the highest impact under a lower abatement elasticity. With a higher abatement elasticity, a production tax leads to the highest decline in total waste. The dominant strategy also can differ between commodities. For fruit, the highest impact from reducing FLW is through a consumption tax, while for milk it is through a production tax.12
FIGURE 18: Effects of a 20% production tax for UK chicken — reduction of farm prices and FLW
n Price (with tax) n Sales/consumption n Waste n Rate of waste
10%
5%
0%
-5%
-10%
FIGURE 17: Effects of a 20% home consumption tax for UK chicken — increase of consumer prices and reduction of FLW
n Price (with tax) n Sales/consumption n Waste n Rate of waste
20%
10%
0%
-10%
-20%
-30%
-40%
THE CASE FOR REDUCING WASTE CONTINUED
Away from home
Home consumption
HRI Retailer Processor THS Farm
Farm THS Processor Retailer HRI Home Consumption
Away from Home
35
76. In this analysis, we interpret production and consumption taxes as an imperfect measure of the costs of the environmental externality. This is a strong assumption. An environmental tax should price the costs of the environmental externality. But while this could possibly be done for carbon, for example by introducing a tax of $70 per unit of CO2 equivalent of production or consumption (thought to approach the social costs of GHGEs), pricing the costs for other natural resources would be very situation-specific. We therefore use a percentage tax on sales price for producers or purchase price for consumers to reflect environmental opportunity costs. While the results would be different from a tax on inputs, for example land or water, in terms of magnitudes, the direction of change triggered in quantities and prices in the food system would be the same. In future studies at the country level, a reformulation of the model to permit a finer analysis of policy instruments including taxes, quotas, technology and other regulations, as well as land set-asides and policies on the level of farming inputs, should be considered where appropriate.
77. These results answer our first question regarding food prices and FLW (paragraph 55-57). They offer some evidence that two key drivers of food waste are farming and food costs and prices, and farming and consumption subsidies, and that if prices reflected environmental values, FLW would be less. Corrections of the environment market failures and policy distortions from food subsidies would reduce FLW.
B. QUESTION 2: WOULD LESS FLW REDUCE THE ENVIRONMENTAL FOOTPRINT OF FOOD SYSTEMS AND IMPROVE FOOD SECURITY?
78. One of the strongest rationales for reducing FLW is to reduce the negative environmental impacts of food systems on natural resources and GHGEs. Absent progress in addressing environmental externalities directly, reducing FLW might help reduce the welfare losses from environmental externalities. This is the hypothesis underlying much of the literature, although there is little evidence of it being so. We use the economic model to address this question by comparing the FLW reduction strategy with the benchmark environmental pricing strategy in terms of the impacts on natural resource usage and GHGEs.
79. The other rationale for addressing FLW is to improve food security. In reality, policymakers are usually interested in distributional outcomes, in addition to improving welfare by addressing externalities. Key among policy approaches is to reduce FLW to improve food security, as reflected in access and affordability. Policymakers may also be interested in improving farmers’ incomes to address rural poverty or in increasing the international competitiveness of the food economy by increasing exports or substituting for food imports.
80. We look first at how higher prices affect farm production, which in our model is an indicator of natural resources stress from farming.13 In a closed economy, 50 percent higher farming costs would reduce farm production by 14 percent. In an open economy, farm production would decline by 5 percent. Higher retail or processing costs would also reduce farm production and sales. This suggests that taxing (or not subsidizing) farming, consumption or intermediary stages would contribute to the environmental objective of conserving land and water and reducing pollution from chemicals.

36
THE CASE FOR REDUCING WASTE CONTINUED
TABLE 6: Impacts of food prices and costs on waste in a closed UK
Model 1c: UK closed economy 50% 50% 50% 20% 20% ↑PR ↑PP ↑PF ↑qF sub ↑qC sub
Baseline Percent (%) changes
1 Farm production qF 2.434 -18 -21 -14 3 6
2 Farm sales qTS 2.330 -18 -21 -14 3 6
3 Processor sales qP 1.787 -18 -21 -14 3 6
4 At home consumption purchases qR 1.074 -33 -19 -12 3 11
5 At-home consumption qC 0.664 -33 -19 -12 3 11
6 Away from home purchases qH 0.597 10 -25 -16 4 -4
7 Away-from-home consumption qA 0.583 10 -25 -16 4 -4
8 Net exports 0.0000
9 Effective farm production price PEF 1.048 -32 -37 52 7 12
10 Farm sales price PF 1.095 -32 -37 52 -13 12
11 Processor sales price PP 2.425 -19 48 31 -8 7
12 Retail price = at-home purchase price PR = PU 4.483 49 28 18 -5 4
13 HRI price = away-home purchase price PH 4.929 -10 25 16 -4 4
14 Effective at-home consumption price PC 7.251 49 28 18 -5 -16
15 Effective away-home consumption price PA 5.047 -10 25 16 -4 4
16 Farm loss KF 0.105 -18 -21 -14 3 6
17 Consumer waste KC 0.410 -33 -19 -12 3 11
18 Total FLW KT 1.187 -23 -20 -13 3 7
19 Farm welfare WEF 1.701 -44 -50 32 11 18
20 Effective consumption costs CE 7.756 -0.2 0.0 1.2 -1.0 -4
21 Net value exports VNX 0.000
22 GHGEs prod cons 21.43 -18 -21 -14 3 6
23 GHGEs disposition 2.04 -23 -20 -13 3 7
24 Total GHGEs 23.47 -18 -21 -14 3 6
Total FLW elasticity w.r.t.:
25 Gross farm production %∆qF / %∆KT 0.77 1.04 1.04 0.11 0.23
26 Total farm welfare %∆WEF / %∆KT 1.93 2.51 -2.44 3.22 2.42
27 Effective consumption costs %∆CE / %∆KT 0.01 0.00 -0.10 -0.32 -0.59
28 Value of net exports %∆VNX / %∆KT
Levels
29 Units cons per unit of FLW qC+A / KT 1.050 1.19 1.03 1.04 1.05 1.02
30 ∆ farm production / ∆ FLW ∆qF / ∆KT 1.58 2.13 2.13 2.13 1.56
50% ↑ PR: Increase of the margin for retailer by 50% of baselines PR50% ↑ PP: Increase of the margin for processor by 50% of baselines Pp

37
81. Higher food prices also would help reduce GHGEs. A 50 percent increase in farming sales prices would reduce GHGEs by 14 percent. Reducing consumption food subsidies would lower emissions by 6 percent. Reducing farming subsidies would reduce emissions by 3 percent. For an open economy, these figures are 14 percent and 2 percent respectively.
82. And farm welfare? Although environmental pricing of food would help reduce the environmental footprint of food systems, it could have important negative welfare impacts. As shown in Figure 19, farm welfare declines with higher consumer food prices. An environmental tax on production would also lead to lower farm welfare.14
83. Higher food prices also do not augur well for food security. Higher food prices would result in less food consumption (Figure 19). For example, an increase in farming prices of 50 percent would increase consumer prices by 18 percent. Home food consumption would decline by 33 percent.
84. Higher food prices also could make the food economy less competitive in global markets. For open economies, the value of net exports also would decline with higher consumer and producer costs and prices, as consumers shift towards cheaper food imports and producers lose competitiveness in export markets. These trade effects can be important because they also could be seen as the export of the environmental footprint of the domestic food system. While stress of natural resources could decline at home, as imports increase and trigger increases in farm production of the trading partner, the stress on natural resources of the exporting country would also increase.
FIGURE 19: Higher food costs reduce farm production and welfare and food security (chicken)
— Farm production — Farm welfare
4.0
3.0
2.0
1.0
0.0 1.29 2.07 2.86 3.65 4.45 5.25 6.07 6.90 7.73 8.58
Prices paid by consumers
— Effective consumer price — Consumption (RHS axis)
15
10
5
0.0 1.29 2.07 2.86 3.65 4.45 5.25 6.07 6.90 7.73 8.58
Prices paid by consumers
Poun
ds (₤
) per
Kg
Poun
ds (₤
) per
Kg
Mill
ions
of t
ons1.2
1.00.80.60.40.20
38
THE CASE FOR REDUCING WASTE CONTINUED
85. In summary, higher food prices reflecting environmental externalities could lead to several undesired outcomes. As discussed, food security and farm welfare could decline. And production could be shifted elsewhere through trade mechanisms, creating incentives for deforestation and water use or increasing GHGEs in jurisdictions not pursuing similar strategies. This highlights the fact that addressing environmental externalities needs to be pursued by every country simultaneously to avoid “exporting” externalities from environment degradation.
86. We now consider the alternative option to environmental pricing, which is to reduce the quantity of FLW. We are interested in seeing if a strategy to reduce the quantity of FLW could be an alternative candidate to a strategy of pricing environmental externalities, which as we argued above could have undesired consequences for food security. Such a strategy could be based on introducing new technologies that reduce FLW, such as improved storage or cooling systems. Will more food in the system from reduced FLW replace an equivalent amount of food production? Would less waste contribute to the dual environmental dividends of reduced natural resource stress and GHGEs? And how would reducing waste fare amid policy makers’ multiple objectives?
87. In general, when waste substitutes for food, food waste replaces less than an equivalent amount of food. Much of the food waste literature seems based on the premise that each unit of food waste saved can replace one unit of food in the supply chain. This is not necessarily so. In our simulation results for a closed economy case with inelastic domestic supply and demand, the ratio is about 0.50. In other words, if waste declines one ton, production declines by 0.5 tons. For the open economy case, a cut in farm loss has the ratio close to one, but for a cut in the rate of consumer waste, the ratio is also around 0.50. If domestic demand is price elastic, then this ratio drops substantially
88. Reducing FLW can in most situations reduce the environmental footprint of food systems; however this depends on the particular circumstances. We use food production as a rough indicator of natural resource stress in farming. Consider Figures 20 and 22, which show that at high levels of loss and waste (a large alpha represents a high proportion of food lost), reducing farm loss or consumer waste increases production so long as rates of farm loss or consumer waste are greater than 50 percent. On the other hand, at lower rates of loss and waste, reducing loss and waste leads to a decrease in farm production. Loss and waste are typically less than 50 percent, the case of the UK. Here, a 50 percent reduction in waste at all stages of the food supply chain would reduce farm production and sales by 15 percent. In fact, most countries are likely to be on the right side of the graph where FLW is 50 percent of production or lower. In addition to the decline in production from reduced food waste, there also would be lower emissions from GHGEs in the food chain. For the UK parameters, a reduction in waste by 50 percent at all stages of the supply chain would reduce total GHGEs by 3 percent, with most of the decline associated with reduced output in farming and transportation sectors. However, we need to emphasize again that the relationship is not one-to-one; that is, a one percent decline in food waste does not translate into a one percent decline in farm production. And at higher rates of waste, greater than 60 percent (left hand side of the x-axis), further declines in waste could actually augment GHGEs (Figures 24 and 25). Nonetheless, we can conclude that environmental gains from reducing FLW are positive.

39
89. Moreover, a food waste strategy might have some advantages over an externality pricing strategy because it improves food security, while the latter lowers it. Both strategies lead to an improved environmental footprint but a decline in farm welfare (under most assumptions). However, an environmental pricing strategy would also harm food security, while a food waste-based strategy would improve food security by increasing consumption and lowering consumer food prices (Figure 23). This is intuitive, since an environmental pricing strategy would work primarily by reducing supply, which would increase food prices, while a loss and waste reduction strategy would work primarily by reducing demand for food and therefore reducing food prices. Under a food waste strategy, farm welfare declines from lower sales and prices, but consumer welfare increases from lower consumption costs.
90. The impacts on trade are ambiguous. IIn trade economies, the impacts on policy goals are still positive but smaller, except for trade where they are ambiguous. Reduced food waste could lead to declines or increases in the value of trade, with less or more exports and imports depending on trade parameters (elasticities) and the stage at which the FLW is reduced.
91. The above results hold for the four commodities and under different assumptions for the openness of the economy and demand elasticities. Although the consequences of changing rates of waste can differ markedly in magnitude between poultry, fruits, bread and milk, and for more open or closed economies, and for more or less elastic demands, the directions of change are the same. The initial conditions for a country’s rate of waste (as indicated by x-axis values in Figures 19 through 25) are critical, with some variables, such as production, farm welfare, and GHGEs, increasing at high initial rates of waste and decreasing as rates of waste decline. We would expect, though, that most countries if not all will be in that portion of the graph where production and GHGEs decline with less food waste.
92. The overarching conclusion of this section is that reducing FLW could in fact reduce the negative environmental footprint of food systems and deliver the co-benefit of improving food security. Introducing taxes or other forms of payment to reflect negative environmental externalities would be, at least in theory, a superior strategy for internalizing the costs of environment degradation. Reducing FLW, on the other hand, would help reduce environment externalities but not necessarily bring them to a desirable level. In addition, reducing FLW would deliver the important co-benefit of improving food security (by increasing consumption, and reducing the costs of food), while taxes or other pecuniary penalties for the loss of environmental services would worsen food security. There are, however, approaches to environmental policy other than taxes, such as quotas, regulations, and development of markets, and these could trickle down through the food system differently from taxes. For example, while farmers’ welfare declines both with taxes and with a reduction of FLW, it could increase under some levels of demand elasticity and trade assumptions with shifts in farming supply due to the setting aside of lands for conservation. (See Table 6, line 19, where farmers’ welfare increases 32 percent with a reduction in supply that would push farm prices up by 50 percent). This is because farmers would capture the windfall benefits from higher prices, not the case with production taxes.

40
THE CASE FOR REDUCING WASTE CONTINUED
FIGURE 20: Less consumer waste augments and decreases production
— Farm production — Farm welfare
3.0 2.5 2.0 1.5 1.0 0.5 0.0
0.22 0.32 0.42 0.52 0.62 0.72 0.82 0.92More Less waste (1 - αc) waste
FIGURE 24: Less consumer waste increases and reduces GHGEs
— Total GHGEs excluding landfill — Total GHGEs — GHGEs from landfill (RHS axis)
30 3.0
25 2.5
20 2.0
15 1.5
10 1.0
5 0.5
0 0.0 0.22 0.32 0.42 0.52 0.62 0.72 0.82 0.92More Less waste (1 - αc) waste
FIGURE 25: Less producer loss increases and reduces GHGEs
— Total GHGEs excluding landfill — Total GHGEs — GHGEs from landfill
30 4.5 25 4.0 3.5 20 3.0 2.5 15 2.0 10 1.5 1.0 5 0.5 0 0.0
0.16 0.26 0.36 0.46 0.56 0.66 0.76 0.86 0.96More Less waste (1 - αc) waste
FIGURE 22: Less farm loss increases and reduces production
— Farm production — Farm welfare
3.0
2.0
1.0
0.0 0.06 0.16 0.26 0.36 0.46 0.56 0.66 0.76 0.86 0.96More Less waste (1 - αc) waste
FIGURE 21: Less consumer waste improves food consumption
— Effective consumer price — Consumption (RHS axis)
20 1.0
15 0.8
0.6
10
0.4
5 0.2
0 0.0 0.22 0.32 0.42 0.52 0.62 0.72 0.82 0.92More Less waste (1 - αc) waste
FIGURE 23: Less farm loss improves food consumption
— Effective consumer price — Consumption (RHS axis)
20 0.8 15 0.6 10 0.4 5 0.2 0 0.0
0.06 0.16 0.26 0.36 0.46 0.56 0.66 0.76 0.86 0.96More Less waste (1 - αc) waste
Mill
ions
of t
ons
kg o
f CO2
eq
kg o
f CO2
eq
kg o
f CO2
eq
kg o
f CO2
eq
Mill
ions
of t
ons
Poun
ds p
er K
gPo
unds
per
Kg
Mill
ions
of t
ons
Mill
ions
of t
ons

41
93. In summary, reducing FLW appears to be a good candidate to be part of a strategy for improving the environmental footprint of food systems, and would deliver the co-benefit of improving food security. Table 7 below summarizes the results for the four commodities.
• First, a reduction of FLW at the consumer level leads to a much larger overall reduction in total waste than a reduction at the farm level, due to negative cascading effects (discussed in detail in a following section).
• Second, both environmental taxes and reducing FLW contribute to the environmental goals of reducing stress on natural resources and GHGEs.
• Third, both strategies reduce farm welfare. Also, a consumption tax or reduction of FLW at the consumer level is worse for farm welfare than a production tax or reduction at the producer level.
• Fourth, for all commodities, production and consumer taxes reduce food security as reflected in lower consumption and higher consumer prices, while reduction of FLW improves food security by increasing food consumption and reducing consumer food prices. Consumer taxes are worse for food security than production taxes. Conversely, a reduction of FLW at the consumer level is better than at the producer level in terms of food security. The magnitude of results also differs across commodities.
Box 6: Effects of an environmental pricing strategy through production and consumption taxes and a food loss and waste reduction strategy
With an environmental pricing strategy:• Food loss and waste would decline to optimum levels.• The environmental footprint of the food system would be smaller and welfare maximizing.• GHGEs would decline to optimum levels.• Farm welfare could also decline, but not always.• And food security would worsen.• Value of trade would deteriorate if other countries did not pursue similar strategies.
With a food loss and waste reduction strategy• Food loss and waste would decline.• The environmental footprint of the food system would be smaller. • GHGEs would decline.• Farm welfare could also decline, but not always.• Food security would improve.• Value of trade is ambiguous; in some cases, the food system could become more competitive.

42
THE CASE FOR REDUCING WASTE CONTINUED
TABLE 7: Impacts on policy goals of environmental taxes versus a reduction of food loss and waste strategy (closed economy, fixed rates of loss and waste)
POLICY OBJECTIVE: 20% TAXES 50% FOOD LOSS AND WASTE REDUCTION Tax at Tax at Tax on farm At the At the At the farm farm consumer and consumer farm consumer and consumer
CHICKEN (percent change)
Farm production -4.03 -9.87 -13.18 -1.03 -3.68 -4.74
Farm welfare -11.62 -26.79 -34.57 -3.07 -10.64 -13.57
Food consumption -4.03 -9.87 -13.18 1.19 12.14 13.40
Consumer food price 5.21 12.24 17.61 -1.45 -2.49 -3.88
Total GHGs -4.03 -9.87 -13.18 -1.01 -5.59 -6.65
Total Quantity of FLW -4.03 -9.87 -13.18 -3.37 -20.30 -23.80
FRUIT (percent change)
Farm production -7.17 -8.67 -15.08 -2.12 -2.57 -4.69
Farm welfare -15.41 -18.46 -30.77 -4.71 -5.69 -10.24
Food consumption -7.17 -8.67 -15.08 6.05 19.52 26.68
Consumer food price 9.35 11.35 21.54 -6.82 -2.15 -8.79
Total GHGs -7.17 -8.67 -15.08 -4.76 -15.69 -21.16
Total Quantity FLW -7.17 -8.67 -15.08 -10.0 -23.90 -34.97
BREAD (percent change)
Farm production -1.44 -7.79 -8.97 -0.32 -0.34 -0.66
Farm welfare -4.27 -21.59 -24.56 -0.97 -1.01 -1.97
Food consumption -1.44 -7.79 -8.97 0.07 0.30 0.37
Consumer food price 3.00 17.48 20.60 -0.15 -0.09 -0.24
Total GHGs -1.44 -7.79 -8.97 -0.18 -0.49 -0.67
Total Quantity FLW -1.44 -7.79 -8.97 -0.95 -1.33 -2.28
MILK (percent change)
Farm production -5.22 -8.07 -12.68 -0.43 -0.36 -0.79
Farm welfare -14.87 -22.32 -33.42 -1.29 -1.06 -2.34
Food consumption -5.22 -8.07 -12.68 1.06 4.23 5.33
Consumer food price 6.44 10.26 17.05 -1.21 -0.37 -1.58
Total GHGs -5.22 -8.07 -12.68 -0.39 -1.57 -1.98
Total Quantity FLW -5.22 -8.07 -12.68 -6.18 -18.11 -24.46

43
C. QUESTION 3: AT WHICH STAGE OF THE FOOD SUPPLY CHAIN WOULD REDUCING FLW BE MOST EFFECTIVE?
I. THE CASCADING EFFECT IN THE FLW SUPPLY CHAIN
94. Our third and last question concerns which stage of the food supply chain a loss and waste reduction strategy would be most effective and the policy goal trade-offs between alternative options. To answer this last question regarding policy options we need first to dwell on how the food supply system reacts to FLW. This study simulates the effects of a reduction in the rate of loss and waste at various stages of the supply chain for chicken and fruit. Key insights can be garnered by considering three different economic structures: a closed economy, a small open economy, and a large importer facing an elastic versus inelastic export supply curve. Although the full supply chain is modeled, we focus on rates of waste at three stages: the farmer, the processor and the at-home consumer.
95. One way to understand the central, critical concept of cascading is to consider an FLW supply chain as a subset of the larger food supply chain. If consumers reduce FLW by using more of it as food, their food purchases decline; that is, FLW replaces purchases. As a result, upstream retailers and food services reduce food sales to consumers and in turn purchase less from processors. Their FLW declines because they are handling less food. Now it is the processors’ turn. Faced with lower sales to retailers and food services, processors buy less from transportation, handling and storage (THS), lowering their own FLW because they are processing less food. THS is now selling less to processors and therefore buying less from farmers; and since they are moving less food, they also produce less FLW. Finally, farmers, faced with lesser sales, reduce production, and so generate less pre-harvest and post-harvest FLW. A reduction of FLW downstream, in this case at the consumer level, has a negative or decreasing cascading effect upstream, negative in the sense of triggering ever-smaller amounts of FLW at each upstream stage of the food supply chain. These FLW savings are additive; in the end, total FLW savings could be much larger than the initial consumer reduction in FLW. This effect is illustrated in Figure 26 where a 50 percent reduction in consumer FLW triggers declines of about 25 percent in FLW at the farm, THS, processor, and retail levels.
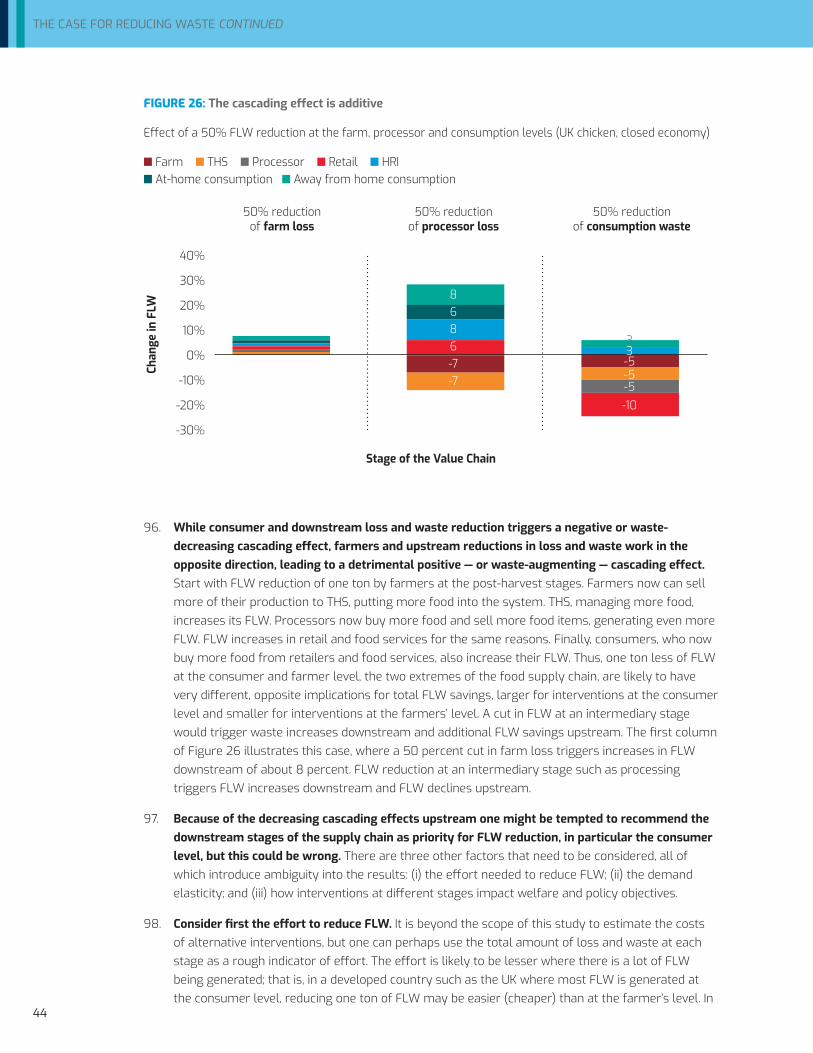
44
THE CASE FOR REDUCING WASTE CONTINUED
FIGURE 26: The cascading effect is additive
Effect of a 50% FLW reduction at the farm, processor and consumption levels (UK chicken, closed economy)
n Farm n THS n Processor n Retail n HRI n At-home consumption n Away from home consumption
50% reduction 50% reduction 50% reduction of farm loss of processor loss of consumption waste
40%
30%
20%
10%
0%
-10%
-20%
-30%
Stage of the Value Chain
96. While consumer and downstream loss and waste reduction triggers a negative or waste-decreasing cascading effect, farmers and upstream reductions in loss and waste work in the opposite direction, leading to a detrimental positive — or waste-augmenting — cascading effect. Start with FLW reduction of one ton by farmers at the post-harvest stages. Farmers now can sell more of their production to THS, putting more food into the system. THS, managing more food, increases its FLW. Processors now buy more food and sell more food items, generating even more FLW. FLW increases in retail and food services for the same reasons. Finally, consumers, who now buy more food from retailers and food services, also increase their FLW. Thus, one ton less of FLW at the consumer and farmer level, the two extremes of the food supply chain, are likely to have very different, opposite implications for total FLW savings, larger for interventions at the consumer level and smaller for interventions at the farmers’ level. A cut in FLW at an intermediary stage would trigger waste increases downstream and additional FLW savings upstream. The first column of Figure 26 illustrates this case, where a 50 percent cut in farm loss triggers increases in FLW downstream of about 8 percent. FLW reduction at an intermediary stage such as processing triggers FLW increases downstream and FLW declines upstream.
97. Because of the decreasing cascading effects upstream one might be tempted to recommend the downstream stages of the supply chain as priority for FLW reduction, in particular the consumer level, but this could be wrong. There are three other factors that need to be considered, all of which introduce ambiguity into the results: (i) the effort needed to reduce FLW; (ii) the demand elasticity; and (iii) how interventions at different stages impact welfare and policy objectives.
98. Consider first the effort to reduce FLW. It is beyond the scope of this study to estimate the costs of alternative interventions, but one can perhaps use the total amount of loss and waste at each stage as a rough indicator of effort. The effort is likely to be lesser where there is a lot of FLW being generated; that is, in a developed country such as the UK where most FLW is generated at the consumer level, reducing one ton of FLW may be easier (cheaper) than at the farmer’s level. In
Chan
ge in
FLW
8686-7-7
33-5-5-5-10
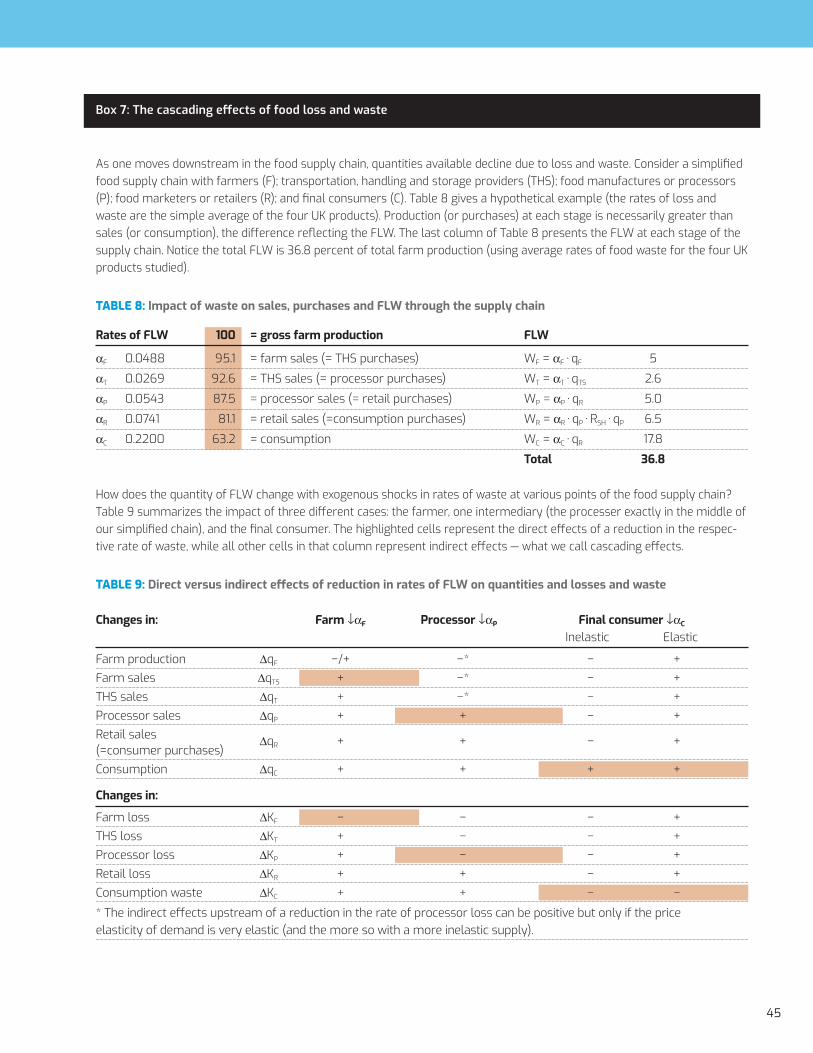
45
Box 7: The cascading effects of food loss and waste
As one moves downstream in the food supply chain, quantities available decline due to loss and waste. Consider a simplified food supply chain with farmers (F); transportation, handling and storage providers (THS); food manufactures or processors (P); food marketers or retailers (R); and final consumers (C). Table 8 gives a hypothetical example (the rates of loss and waste are the simple average of the four UK products). Production (or purchases) at each stage is necessarily greater than sales (or consumption), the difference reflecting the FLW. The last column of Table 8 presents the FLW at each stage of the supply chain. Notice the total FLW is 36.8 percent of total farm production (using average rates of food waste for the four UK products studied).
TABLE 8: Impact of waste on sales, purchases and FLW through the supply chain
Rates of FLW 100 = gross farm production FLW
αF 0.0488 95.1 = farm sales (= THS purchases) WF = αF∙qF 5αT 0.0269 92.6 = THS sales (= processor purchases) WT = αT∙qTS 2.6αP 0.0543 87.5 = processor sales (= retail purchases) WP = αP∙qR 5.0αR 0.0741 81.1 = retail sales (=consumption purchases) WR = αR∙qP∙RSH∙qP 6.5αC 0.2200 63.2 = consumption WC = αC∙qR 17.8 Total 36.8
How does the quantity of FLW change with exogenous shocks in rates of waste at various points of the food supply chain? Table 9 summarizes the impact of three different cases: the farmer, one intermediary (the processer exactly in the middle of our simplified chain), and the final consumer. The highlighted cells represent the direct effects of a reduction in the respec-tive rate of waste, while all other cells in that column represent indirect effects — what we call cascading effects.
TABLE 9: Direct versus indirect effects of reduction in rates of FLW on quantities and losses and waste
Changes in: Farm ↓αF Processor ↓αP Final consumer ↓αC Inelastic Elastic
Farm production ∆qF −/+ −* − +Farm sales ∆qTS + −* − +THS sales ∆qT + −* − +Processor sales ∆qP + + − +Retail sales (=consumer purchases)
∆qR + + − +
Consumption ∆qC + + + +
Changes in:
Farm loss ∆KF − − − +THS loss ∆KT + − − +Processor loss ∆KP + − − +Retail loss ∆KR + + − +Consumption waste ∆KC + + − −* The indirect effects upstream of a reduction in the rate of processor loss can be positive but only if the price elasticity of demand is very elastic (and the more so with a more inelastic supply).

46
THE CASE FOR REDUCING WASTE CONTINUED
Box 7: The cascading effects of food loss and waste (continued)
The cascading effect of a cut in farm loss is non-beneficial in that the quantity of waste downstream increases. A reduction in farm loss and waste increases production, and therefore loss and waste in the rest of the downstream supply chain. The first column of Table 9 describes the impact of a reduction in the rate of farm loss αF. The direct effect is that farm sales always increase, regardless of all the market parameters such as elasticities. With farm loss, the individual farmer needs a higher sales price to compensate. If that is not possible, farmers reduce farm production. Nevertheless, with farmers facing a downward sloping demand curve, the aggregate effect of farm loss is to increase the sales price, so farm production does not fall as much; in some cases, farm production increases because of farm loss. Going downstream with a decrease in αF and an increase in farm sales, quantities at each stage are now higher (with lower prices) as are the quantities of loss and waste (referred to as waste in the second half of Table 6). Farm waste always goes down with a cut in αF, whether farm production increases or decreases.
The cascading effect of a cut in FLW of an intermediary, such as the processor, always increases sales by the processor and quantities downstream, but since processor purchases decline, quantities decline upstream in most cases. The second column in Table 9 shows the impact of a cut in the rate of waste by processors. The direct effect is to always increase sales by processors, thereby increasing quantities (and reducing prices) downstream. This means the volume of waste down-stream increases. However, processor purchases decline in most cases, causing lower quantities and prices upstream. Under very elastic demand conditions, there is the possibility that processor purchases increase with a cut in αP, in which case farm production will increase. As shown in the second half of Table 9, the direct effect of a cut in αP is for processor waste to decline, as does waste at each stage upstream from the processor; but as in the case of the farmer, waste increases down-stream from the processor.
The cascading effect of a cut in consumer waste is ambiguous, reducing FLW quantities in all stages upstream under inelastic demand and increasing FLW quantities under elastic demand assumptions. The final column of Table 9 shows the case of a cut in the rate of consumer waste. As we show in Annex D, with price-inelastic demand curves, consumer purchases decline with a cut in the rate of consumer waste. With a decline in consumer purchases, all quantities (and prices) are lower upstream, as are all quantities of waste. However, the reverse occurs under sufficiently price-elastic demand conditions. Regardless of the price elasticity of demand, however, two outcomes are unambiguous: consumption always increases and consumer waste always declines with a decrease in the consumer rate of waste. Notice in the case of a sufficiently price-elastic demand curve, farm production increases with a cut in αP. (A cut in αF has a much more nuanced impact on farm production, as we described above, with demand elasticity being important; but an elastic demand is not sufficient for farm production to decline.)
The basic truth is that reducing rates of waste always reduces waste at the stage where the cut occurs, but there are cas-cading effects upstream and downstream that sometimes reinforce and sometimes offset the beneficial direct impact of the waste cut. The role of price elasticity of demand is critical. An inelastic demand curve reverses the upstream effects of a cut in consumer rates of waste compared to an elastic demand. An elastic demand plays an important role in determining if a cut in the rate of farm loss increases farm production or not, but the outcome also depends on other parameters. Finally, a cut in the rate of processing waste can result in higher purchases by processors, but only if the demand elasticity is extremely elastic (such as, being a small-country trader). The supply elasticity at the farm level plays a less important role, but works in the opposite direction to the price-elasticity of demand. For example, a more price-elastic demand curve results in higher consumer purchases (or a lower cut in purchases if demand is inelastic), while a more inelastic farm supply curve reinforces that effect.

47
contrast, in a developing country, where most FLW is generated by farmers, the effort needed for reducing one ton of FLW may be much smaller at the farmer level than at the consumer level. To capture these effects, instead of reducing waste by one ton, we can cut, for example, waste rates by half. Those stages that are producing more FLW will see bigger reductions in the quantity of FLW (tons) than those with little FLW. Consider a developing country where most FLW is generated by farming and where consumers are more frugal on how they handle food. Cutting FLW in half at the consumer level would still have a positive cascading effect. However, a cut by half in farming FLW, since it is a much larger quantity, might generate a larger decline in total waste, even with the positive cascading effects. This is because the cut in farming FLW could be large enough to over-compensate for increases in FLW associated with the cascading effect. In fact, the downstream FLW strategy only dominates if the rate of FLW is sufficiently higher at the consumer than at the farm level.
99. The best stages to intervene also depend on the elasticity of demand. The relative importance of specific stages of the supply chain for FLW reduction is also affected by prices and corresponding indirect effects. Line 7 in Table 11 shows direct versus indirect effects. A 50 percent cut in consumer FLW under an inelastic demand curve produces a ratio of direct to indirect effects greater than one; the direct effect in reducing food waste is reinforced by the indirect effects. Not so for an elastic demand curve where indirect effects lead to FLW increases upstream with a cut in consumer FLW. Hence the results are ambiguous and will depend on the specific demand parameters of the country and commodity (see box 7).
100. Finally, consider how a reduction of FLW at each stage impacts welfare and policy objectives. The best strategy also depends on the goals that societies are pursuing, such as reducing environmental footprint and GHGEs, lowering consumer food prices or improving farm welfare. This is discussed in more detail in a later Section on policy.
FIGURE 27: Cutting consumer waste dominates where consumer waste is much larger than producer waste, as is the case with developed countries. UK chicken)
Effect of a 50% FLW reduction at different stages of the value chain, on total amount of FLW
50% reduction of 50% reduction of 50% reduction of farm loss processor loss consumption waste
0%
-5%
-10%
-15%
-20%
-25%
Stage of the Value Chain
Tota
l red
uctio
n of
FLW
(mill
ion
tons
)
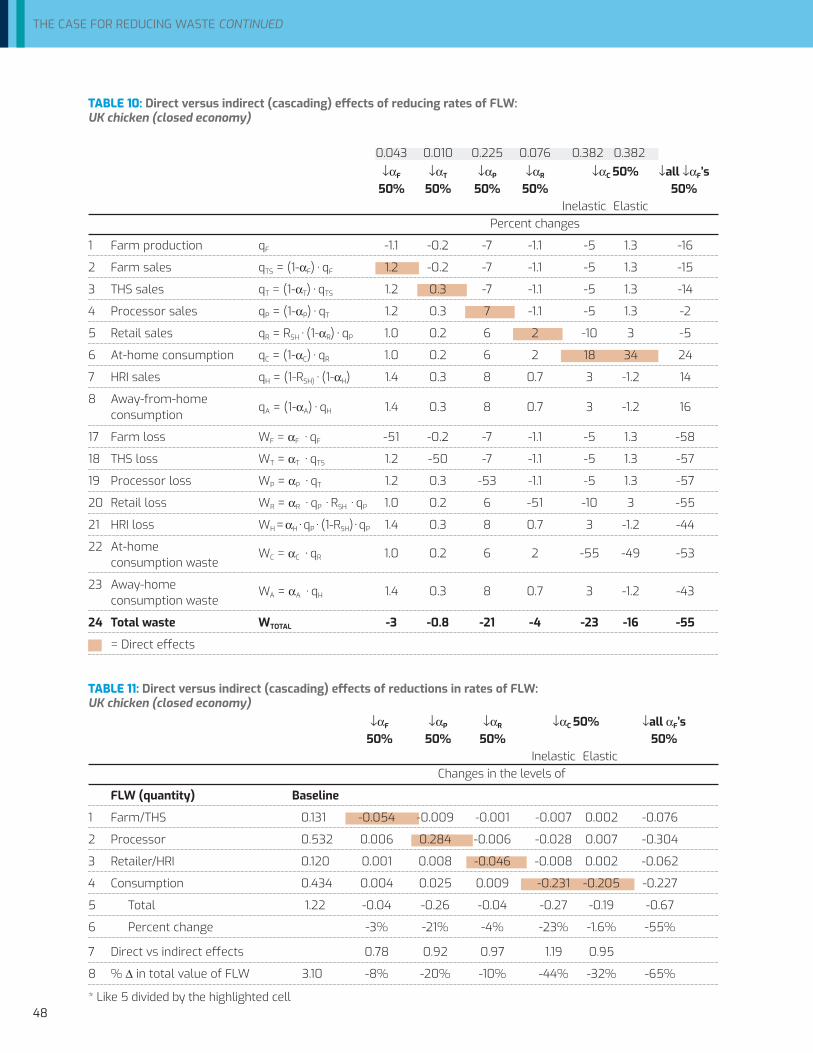
48
THE CASE FOR REDUCING WASTE CONTINUED
TABLE 10: Direct versus indirect (cascading) effects of reducing rates of FLW: UK chicken (closed economy)
0.043 0.010 0.225 0.076 0.382 0.382 ↓αF ↓αT ↓αP ↓αR ↓αC 50% ↓all ↓αF’s
50% 50% 50% 50% 50% Inelastic Elastic Percent changes
1 Farm production qF -1.1 -0.2 -7 -1.1 -5 1.3 -16
2 Farm sales qTS = (1-αF)∙qF 1.2 -0.2 -7 -1.1 -5 1.3 -15
3 THS sales qT = (1-αT)∙qTS 1.2 0.3 -7 -1.1 -5 1.3 -14
4 Processor sales qP = (1-αP)∙qT 1.2 0.3 7 -1.1 -5 1.3 -2
5 Retail sales qR = RSH∙(1-αR)∙qP 1.0 0.2 6 2 -10 3 -5
6 At-home consumption qC = (1-αC)∙qR 1.0 0.2 6 2 18 34 24
7 HRI sales qH = (1-RSH)∙(1-αH) 1.4 0.3 8 0.7 3 -1.2 14
8 Away-from-home consumption qA = (1-αA)∙qH 1.4 0.3 8 0.7 3 -1.2 16
17 Farm loss WF = αF ∙qF -51 -0.2 -7 -1.1 -5 1.3 -58
18 THS loss WT = αT ∙qTS 1.2 -50 -7 -1.1 -5 1.3 -57
19 Processor loss WP = αP ∙qT 1.2 0.3 -53 -1.1 -5 1.3 -57
20 Retail loss WR = αR ∙qP ∙RSH ∙qP 1.0 0.2 6 -51 -10 3 -55
21 HRI loss WH = αH∙qP∙(1-RSH)∙qP 1.4 0.3 8 0.7 3 -1.2 -44
22 At-home consumption waste
WC = αC ∙qR 1.0 0.2 6 2 -55 -49 -53
23 Away-home consumption waste
WA = αA ∙qH 1.4 0.3 8 0.7 3 -1.2 -43
24 Total waste WTOTAL -3 -0.8 -21 -4 -23 -16 -55
= Direct effects
TABLE 11: Direct versus indirect (cascading) effects of reductions in rates of FLW: UK chicken (closed economy)
↓αF ↓αP ↓αR ↓αC 50% ↓all αF’s 50% 50% 50% 50%
Inelastic Elastic Changes in the levels of
FLW (quantity) Baseline
1 Farm/THS 0.131 -0.054 -0.009 -0.001 -0.007 0.002 -0.076
2 Processor 0.532 0.006 0.284 -0.006 -0.028 0.007 -0.304
3 Retailer/HRI 0.120 0.001 0.008 -0.046 -0.008 0.002 -0.062
4 Consumption 0.434 0.004 0.025 0.009 -0.231 -0.205 -0.227
5 Total 1.22 -0.04 -0.26 -0.04 -0.27 -0.19 -0.67
6 Percent change -3% -21% -4% -23% -1.6% -55%
7 Direct vs indirect effects 0.78 0.92 0.97 1.19 0.95
8 % ∆ in total value of FLW 3.10 -8% -20% -10% -44% -32% -65%
* Like 5 divided by the highlighted cell

49
II. WHO IS GUILTY OF WASTING GREENHOUSE GAS EMISSIONS? WASTERS OR EMITTERS?
101. Reduction of FLW further up in the waste supply chain is important in the global context of greenhouse gas emissions (GHGEs). Global FLW annually generates 4.4 GtCO2eq, or about 8 percent of total anthropogenic GHGEs. GHGE footprints associated with food wastage (per capita) in high-income countries are more than double those of low-income countries. This disparity is due to wasteful food distribution and consumption patterns in high-income countries. Global population and economic growth coupled with changing patterns of consumption and wastage may intensify this trend.
102. GHGEs associated with different farm-to-fork-to-landfill stages of food vary substantially. Row 1 of Table 12 provides the GHGEs associated with the agricultural stage (EF) in kg CO2eq/kg of product. For instance, the primary production of a kilogram of chicken is associated to the emission of 7.5kg of CO2eq. The production of a kilogram of fruit, on the other hand, is associated with the emission of only 0.174kg of CO2eq. Row 2 provides the GHGEs associated with post-harvest handling and storage (ET); row 3 the GHGE associated with processing and packaging (EP); row 4 the GHGEs associated with Distribution (ER); and row 5 the GHGEs associated with Consumption (EA). Row 6 is the total GHGEs per kilogram of product (ETotal). Rows 7-11 of Table 12 show the shares of GHGEs by stage in the food value chain. For bread and fruit, processing and packing yield most emissions, while for chicken and milk, maximum emissions are at the farm level.
103. The food items that generate the most waste are not necessarily those that generate the most emissions. The commodity with the largest waste rate is fruit (2 million tons), which is related to 6.22 million tons of CO2eq. In comparison, the waste of chicken is 0.9 million tons, which is related to 16.64 million tons of CO2eq. A waste reduction in chicken will result in a larger GHGEs reduction than a similar FLW reduction in fruit.

50
THE CASE FOR REDUCING WASTE CONTINUED
TABLE 12: Greenhouse gas emissions (kg CO2eq per kg of product), and total greenhouse gas emissions (million tons CO2eq/kg of product), associated with UK lifecycle stages of bread, fruit, chicken and milk
GHG emissions (kg CO2eq/kg of product) Chicken Fruit Bread Milk
1 Agricultural impact 7.50 0.17 0.57 1.80
2 Post-harvest handling and storage 0.01 0.01 0.01 0.01
3 Processing and packaging 0.63 0.25 0.63 0.63
4 Distribution 0.25 0.25 0.25 0.25
5 Consumption 0.75 0.00 0.75 0.00
6 Total 9.14 0.69 2.20 2.69
Share of stage in GHG emissions
7 Agricultural impact 0.82 0.25 0.26 0.67
8 Post-harvest handling and storage 0.00 0.02 0.00 0.00
9 Processing and packaging 0.07 0.36 0.28 0.23
10 Distribution 0.03 0.36 0.11 0.09
11 Consumption 0.08 0.00 0.34 0.00
Total GHGEs production and consumption system wide (million tonnes CO2e)
12 Agricultural impact 12.6 0.1 1.6 13.3
13 Post-harvest handling and storage 0.02 0.01 0.02 0.09
14 Processing and packaging 1.00 0.13 1.69 4.29
15 Retail 0.29 0.93 0.50 1.55
16 Out of home (preparation) 0.16 0.19 0.17 0.11
17 Out of home (consumption) 0.45 0.00 0.46 0.00
18 Consumption at home 0.81 0.01 1.28 0.02
19 Total 15.3 1.4 5.7 19.3
Share of GHGE in each stage of total GHGEs
20 Agricultural impact 0.82 0.08 0.28 0.69
21 Post-harvest handling and storage 0.00 0.00 0.00 0.00
22 Processing and packaging 0.06 0.09 0.30 0.22
23 Retail 0.02 0.68 0.09 0.08
24 Out of home (preparation) 0.01 0.14 0.03 0.01
25 Out of home (consumption) 0.03 0.00 0.08 0.00
26 Consumption at home 0.05 0.01 0.22 0.00

51
104. Analysis of GHGEs should consider three types of emissions. First, there are the emissions generated at the stage of the food supply chain in which food that is eventually consumed is produced. Second, there are the emissions generated at that stage of the food supply chain in which food eventually lost or wasted downstream is produced. These are the “wasted emissions” because they do not produce food that is consumed. And third, there are the emissions generated by decomposition of waste occurring during that stage of the food supply chain, called waste or disposition emissions. These waste or disposition emissions depend on how waste is handled, whether sent to a landfill or recovered as food or non-food. FLW also is responsible for some emissions associated with its production; with wasted emissions, the second type; and in addition to those emanating from it, the disposition emissions, the third type. For example, one ton of waste at the consumer level is produced with inputs from farming, transportation, processing, and all other stages of the food supply chain. The contributions of production at each and all of these stages to consumer waste also generate GHGEs.
FIGURE 28: Greenhouse gas emissions (million tons CO2eq) associated with production, waste and dispositions treatment (UK 2012). Impacts separated to lifecycle stage (where emissions occur, not where food loss and waste occurs).
n Agricultural impact n Post-harvest handling and storage n Processing and packaging n Retail n Out of home (preparation) n Out of home (consumption) n Consumption at home n Waste treatment/dispositions
25.0
20.0
15.0
10.0
5.0
0.0
Bread Bread loss Fruit Fruit loss Chicken Chicken loss Milk Milk loss and waste and waste and waste and waste
105. The question becomes to whom wasted emissions (emissions produced by food that is eventually wasted) should be attributed — emitters upstream or wasters downstream? This question creates two different approaches to accounting, depending on which stage is held responsible for the “wasted emissions.” We can compare in two different ways the total GHGEs associated with production and consumption system-wide given in rows 11-18 in Table 12 with GHGEs associated with food loss and waste in Table 13. The first, a ‘local’ accounting method (lines 1-8 of Table 13) attributes wasted emissions to the wasters. The second, a “system allocated” accounting method (lines 9-16 of Table 13) attributes wasted emissions to the emitters. Total emissions are the same in the two accounting methods.
Mill
ion
tons
of C
O 2eq

52
THE CASE FOR REDUCING WASTE CONTINUED
106. The “local” accounting method attributes the wasted emissions to the wasters up through the point in the supply chain where FLW occurs (Table 13). For example, FLW on the farm is multiplied by on-farm emissions per unit of product, while FLW in at-home consumption is multiplied by the sum of all the emissions per unit of product throughout the product’s supply chain. (Full model notations and formulae can be found in Annex C.) That is, GHGEs at the consumer level include the GHGEs from the consumer waste plus all emissions upstream in the supply chain released in the production of that waste — farm, THS, processing, retailing, and food services. All of these stages contribute to the wasted emissions. To be clear, the values reported in lines 1-8 represent only the GHGEs attributable to the FLW generated at that part of the supply chain, and not necessarily where the emissions occur. These are the wasted emissions up to that point. For example, 3.876 million tons of CO2eq are the wasted emissions attributable to the chicken FLW that occurs at the processing and packaging stage of the food supply chain (line 3), and 3.438 million tons the wasted emissions attributable to the waste generated by home consumption (line 7). This accounting method attributes the wasted emissions to the wasters.
107. The “system-wide” accounting method attributes the wasted emissions to the emitters where the emissions occur along the supply chain. Lines 9-16 of Table 13 provide the GHGEs associated with the tons of loss and waste using a “system allocated” accounting method. This accounting method takes the same amount of emissions related to waste but apportions them to where the emissions occur in the supply chain (rather than where the waste occurs). In other words, the farm releases GHGEs in the production of food that will become FLW at each stage downstream — THS, processing, retailing, food services and consumption. The farm’s wasted emissions are calculated on the basis of the food waste it generates at each of these downstream stages of the supply chain. For example, in line 9 of Table 13 (which represents the farm), the system-allocated waste (total waste in the entire supply chain) is multiplied by on-farm emissions per unit of product, while the system-allocated waste related to consumption at home (home waste) is multiplied only by the emissions per unit of product at the consumption level of the supply chain. In the case of chicken, from a system-allocated perspective, most of the emissions are linked to farm production (8.173 million tons CO2eq, line 9), even though the waste occurs mostly in consumption at home and in processing and packaging (lines 3 and 7). This accounting method attributes the wasted emissions to the emitters.

53
Emissions at each stage used to produce waste at consumer level (in million tons of C02eq)
CHICKEN
4.0 3.75 3.5
2.92 3.0 2.5 2.0 1.5 1.0 0.54 0.74 0.5 0.12 0.24 0.13 0.0
FRUIT
0.8 0.747 0.7 0.6 0.5 0.4 0.3 0.2 0.121 0.15 0.1 0.035 0.092 0.038 0.018 0.0
Emissions at the farm level used to produce farm losses and downstream losses and waste (in million tons of C02eq)
CHICKEN
8 7.40 7 6 5 4 3 2 1 0.0 0.56 0.12 0.01 0.01 0.31 0
FRUIT
0.5 0 .43
0.398 0.325
0.4
0.3
0.2
0.1 0.023 0.02 0 0.003
0
Prod
uctio
n
THS
Proc
essi
ng
Reta
il
Food
ser
vice
s
Out-o
f-hom
e co
nsum
ptio
n
At h
ome
cons
umpt
ion
Prod
uctio
n
THS
Proc
essi
ng
Reta
il
Food
ser
vice
s
Out-o
f-hom
e co
nsum
ptio
n
At h
ome
cons
umpt
ion
Prod
uctio
n
THS
Proc
essi
ng
Reta
il
Food
ser
vice
s
Out-o
f-hom
e co
nsum
ptio
nAt
hom
e co
nsum
ptio
n
Prod
uctio
n
THS
Proc
essi
ng
Reta
il
Food
ser
vice
s
Out-o
f-hom
e co
nsum
ptio
n
At h
ome
cons
umpt
ion
FIGURE 29: Greenhouse gas emissions through the two accounting methods (Chicken and Fruit, UK, Closed Economy)

54
THE CASE FOR REDUCING WASTE CONTINUED
TABLE 13: Greenhouse gas emissions (million tons CO2eq) associated with UK lifecycle stages, and leakage volumes of bread, fruit, chicken, and milk
Loss and waste GHGEs, accounted for where loss or waste actually occurs in the food system (i.e. the GHGE associated with loss or waste only (locally) occurring X level, million tons CO2e) Chicken Fruit Bread Milk
1 Agricultural impact 0.54 0.02 0.03 0.39
2 Post-harvest handling and storage 0.12 0.00 0.02 0.54
3 Processing and packaging 2.92 0.11 0.15 0.17
4 Retail 0.74 0.18 0.40 1.00
5 Out of home (preparation) 0.24 0.04 0.12 0.01
6 Out of home (consumption) 0.13 0.02 0.08 0.01
7 Consumption at home 3.75 0.89 1.10 1.42
8 Total 8.43 1.27 1.91 3.54
Loss and waste GHGEs, accounted where the emissions occur in the food system (system
9 Agricultural impact 7.40 0.35 0.64 2.68
10 Post-harvest handling and storage 0.01 0.03 0.01 0.02
11 Processing and packaging 0.56 0.48 0.64 0.61
12 Retail 0.12 0.39 0.20 0.22
13 Out of home (preparation) 0.01 0.02 0.03 0.00
14 Out of home (consumption) 0.01 0.00 0.03 0.00
15 Consumption at home 0.31 0.00 0.38 0.00
16 Total 8.43 1.27 1.91 3.54
108. In both accounting methods, the total GHGEs associated with loss and waste (line 8 or 16 of Table 13) are equal; the only difference is how the GHGEs are attributed. Table 13 shows that FLW, when combining wasted emissions with emissions from waste, can contribute significant amounts of GHGEs. This tension between the total GHGEs of that product (split between place of emission) with the total GHGEs associated with that product’s loss and waste (split between place of loss and waste) is visualized in Figure 30. This visualization clearly shows the distinction between where the waste occurs, and where emissions related to that waste occur. For example, emissions related to loss and waste are predominantly agricultural; however, the largest volumes of loss and waste occur in processing and packaging, retail, and consumption. This means that, depending on the accounting method used, the reduction of loss and waste in processing and packaging, retail, and consumption may have beneficial emissions impacts further up the supply chain (i.e., at the farm level).

55
FIGURE 30: Greenhouse gas emissions (million tons CO2eq) associated with FLW, linked to where the emissions occur in the food system (A), or where the FLW occurs in the food system (B)
n Consumption at home n Out of home (consumption) n Hospitality and resaturants n Retail n Processing and packaging n Post-harvest handling and storage n Agricultural impact
A B
9 8 7 6 5 4 3 2 1 0 Chicken Fruit Bread Milk Chicken Fruit Bread Milk
Where the “wasted emissions Where the loss and waste occurs — occur — attributed to emitters attributed to wasters
109. Wasted emissions create a dilemma for policy: who should be held responsible? Consider chicken (Table 13). Chicken waste at the farm level generates 0.54 million tons of CO2 equivalent. Waste at the post-harvest transportation, handling and storage, on the other hand, generates 0.12 million tons of CO2eq. This is composed of emissions from post-harvesting waste; although part of these emissions was produced by the farm, the parties responsible for them are the wasters in the transport, handling and storage sector. The consumer, at the end of the food supply chain, is guilty of many more of the emissions along the supply chain. Waste produced by consumers not only generates emissions at the consumer level (3.8 million tones CO2eq), but also emissions from all previous stages of the supply chain effort that produce the waste: at the farm, at handling, at processing and so on. In a sense, consumers trick producers into generating emissions to produce food they ultimately discard.
110. In this example, although consumers are guilty of the waste that triggers GHGEs throughout the supply chain, the ones emitting are not the consumers. Rows 9 to 16 of Table 13 show the total emissions at each stage of the supply chain associated with loss and waste. In the case of chicken, consumers emit only 0.31 CO2 tons equivalent from their waste. Farmers, on the other hand, emit 7.4 million tons of COeq in producing the food that will be transformed into waste, due to the wasteful practices of consumers, retailers and others downstream in the supply chain.
111. The policy dilemma is that those responsible for the wasted emissions are not the same as those responsible for the waste. Which level should policy interventions target? Consider a carbon tax. Should waste or emissions be taxed? If the goal is to make wasters guilty, the tax should be charged where the waste occurs with a value that captures all the emissions upstream associated with that stage’s waste. On the other hand, if emitters are considered the guilty party, the tax should reflect the cost per ton of emissions at that level multiplied by the total waste that that level helps produce downstream in the supply chain. In the end, total carbon payments would be
Mill
ion
tons
of C
O2eq

56
THE CASE FOR REDUCING WASTE CONTINUED
the same, but they would be distributed differently between producers and consumers. Of course, taxation at different levels would trigger various direct and indirect effects that would in turn change the level of GHGEs, as well as prices, inputs and outputs along the food supply chain. These changes are not considered in this example.
112. Taxing emitters would be more efficient than taxing wasters, but possibly more politically difficult. In principle, a carbon tax should be introduced where the emissions occur, not only linked to the wasted emissions, but also to the emissions associated with food that is not wasted. That is, the tax should cover all the emissions associated with all the economic activity. In this scenario, farming would pay for the overall emissions from the farming activity, both wasted emissions in producing downstream waste and emissions from generating food that is consumed. Applied as a dollar-per-ton of CO2 based on crop characteristics and level of production, the taxation process could in principle reach its optimum level, as would the amounts of production and consumption. Not so with a tax on wasters. This is because applying a dollar-per-ton of CO2 on wasted emissions at the waster level would require information on the level of emissions generated by that waste upstream in the supply chain. Also and more importantly, taxing wasters for the cost of the emissions elsewhere would not necessarily encourage emitters to adjust their emissions in a desirable way. Note that we are dealing with up to seven different emitters representing each stage of the supply chain. How would a tax on consumers lead each stage towards an optimum level of emissions? How could such a tax avoid burdening wasters with an externality over which they have little control — since the “pollution” is occurring elsewhere? Because of these issues, reaching the optimum level of emissions at each of the emitting stages would be difficult, and the resulting after-tax distribution of emissions across stages of the supply chain less than desirable. However, policymakers might find taxing wasters more palatable than taxing emissions from a specific economic activity such as farming. This approach too would result in a reduction of emissions throughout the supply chain. A process of trial and error of the waste tax could help policymakers approach a desired target level of emissions, perhaps consistent with commitments under the Paris Climate Agreement.
113. Because GHGEs attributable to FLW and disposition are considerable, FLW could be the first focus of GHGE policy. As noted earlier, there are three types of emissions: overall emissions from the specific economic activity along the food value chain, such as farming; wasted emissions; and emissions from waste or disposition. Within the majority of stages of the food supply chain for bread, fruit and chicken, FLW can account for upwards of 30 percent of an economic activity’s GHGEs as wasted emissions and emissions from disposition. FLW impacts related to GHGEs produced at the agricultural level are between 39-50 percent of total agricultural emissions (Table 14). Further comparison of the percentage changes in GHGEs associated with FLW, disposition, or FLW and disposition is shown in Figure 30. For example, while 79 percent of fruits’ total GHGE impact are located within FLW and disposition treatment, 61 percent of fruits’ total GHGE impact is in disposition treatment. The opposite relationship occurs with chicken, in which only 11 percent of total GHGEs impact is allocated to disposition treatment, but 59 percent of GHGEs impact is allocated to FLW-related emissions. These high GHGEs associated with fruit and chicken FLW and disposition imply that a reduction in FLW will lead to a double dividend of reduced impacts from production, and reductions in disposition treatment emissions (as most dispositions are currently going to landfill).
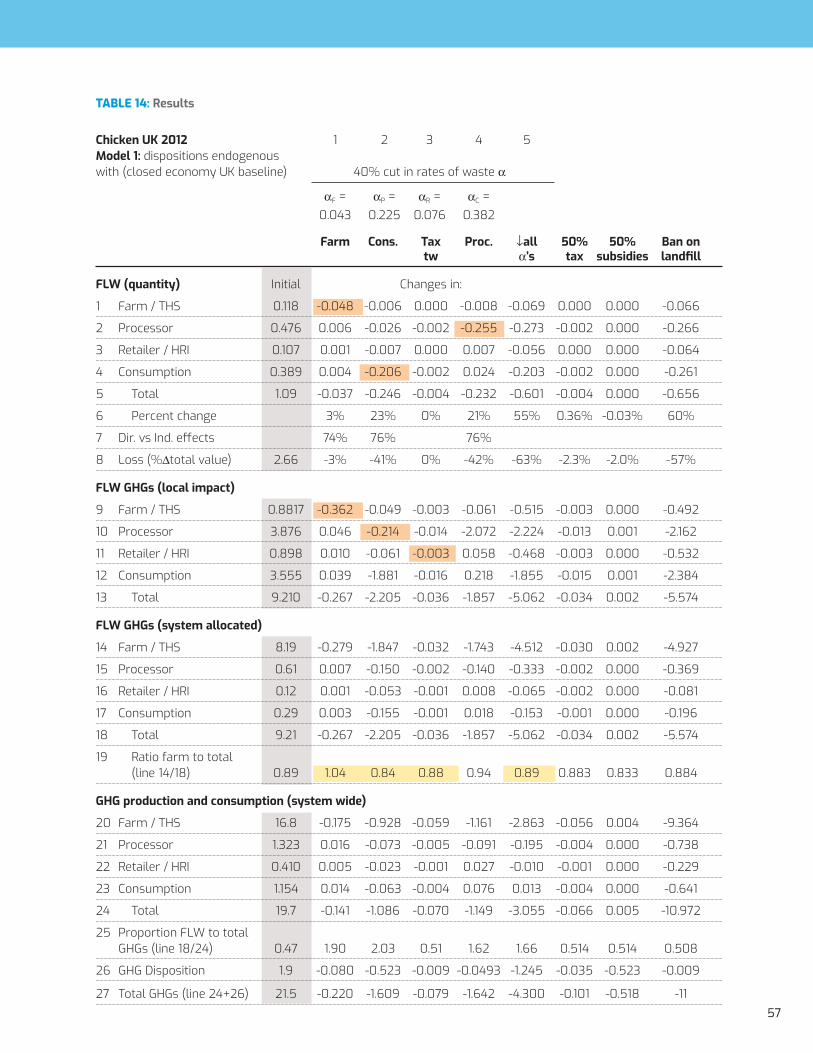
57
TABLE 14: Results
Chicken UK 2012 1 2 3 4 5Model 1: dispositions endogenous with (closed economy UK baseline) 40% cut in rates of waste α
αF = αP = αR = αC = 0.043 0.225 0.076 0.382
Farm Cons. Tax Proc. ↓all 50% 50% Ban on tw α’s tax subsidies landfill
FLW (quantity) Initial Changes in:
1 Farm / THS 0.118 -0.048 -0.006 0.000 -0.008 -0.069 0.000 0.000 -0.066
2 Processor 0.476 0.006 -0.026 -0.002 -0.255 -0.273 -0.002 0.000 -0.266
3 Retailer / HRI 0.107 0.001 -0.007 0.000 0.007 -0.056 0.000 0.000 -0.064
4 Consumption 0.389 0.004 -0.206 -0.002 0.024 -0.203 -0.002 0.000 -0.261
5 Total 1.09 -0.037 -0.246 -0.004 -0.232 -0.601 -0.004 0.000 -0.656
6 Percent change 3% 23% 0% 21% 55% 0.36% -0.03% 60%
7 Dir. vs Ind. effects 74% 76% 76%
8 Loss (%∆total value) 2.66 -3% -41% 0% -42% -63% -2.3% -2.0% -57%
FLW GHGs (local impact)
9 Farm / THS 0.8817 -0.362 -0.049 -0.003 -0.061 -0.515 -0.003 0.000 -0.492
10 Processor 3.876 0.046 -0.214 -0.014 -2.072 -2.224 -0.013 0.001 -2.162
11 Retailer / HRI 0.898 0.010 -0.061 -0.003 0.058 -0.468 -0.003 0.000 -0.532
12 Consumption 3.555 0.039 -1.881 -0.016 0.218 -1.855 -0.015 0.001 -2.384
13 Total 9.210 -0.267 -2.205 -0.036 -1.857 -5.062 -0.034 0.002 -5.574
FLW GHGs (system allocated)
14 Farm / THS 8.19 -0.279 -1.847 -0.032 -1.743 -4.512 -0.030 0.002 -4.927
15 Processor 0.61 0.007 -0.150 -0.002 -0.140 -0.333 -0.002 0.000 -0.369
16 Retailer / HRI 0.12 0.001 -0.053 -0.001 0.008 -0.065 -0.002 0.000 -0.081
17 Consumption 0.29 0.003 -0.155 -0.001 0.018 -0.153 -0.001 0.000 -0.196
18 Total 9.21 -0.267 -2.205 -0.036 -1.857 -5.062 -0.034 0.002 -5.574
19 Ratio farm to total (line 14/18) 0.89 1.04 0.84 0.88 0.94 0.89 0.883 0.833 0.884
GHG production and consumption (system wide)
20 Farm / THS 16.8 -0.175 -0.928 -0.059 -1.161 -2.863 -0.056 0.004 -9.364
21 Processor 1.323 0.016 -0.073 -0.005 -0.091 -0.195 -0.004 0.000 -0.738
22 Retailer / HRI 0.410 0.005 -0.023 -0.001 0.027 -0.010 -0.001 0.000 -0.229
23 Consumption 1.154 0.014 -0.063 -0.004 0.076 0.013 -0.004 0.000 -0.641
24 Total 19.7 -0.141 -1.086 -0.070 -1.149 -3.055 -0.066 0.005 -10.972
25 Proportion FLW to total GHGs (line 18/24) 0.47 1.90 2.03 0.51 1.62 1.66 0.514 0.514 0.508
26 GHG Disposition 1.9 -0.080 -0.523 -0.009 -0.0493 -1.245 -0.035 -0.523 -0.009
27 Total GHGs (line 24+26) 21.5 -0.220 -1.609 -0.079 -1.642 -4.300 -0.101 -0.518 -11

58
THE CASE FOR REDUCING WASTE CONTINUED
TABLE 15: The scale of system-allocated GHGEs FLW compared to total GHGE system-wide at each level of the food supply chain, per food category (ratios)
Chicken Fruit Bread Milk
1 Agricultural impact 0.587 3.289 0.400 0.202
2 Post-harvest handling and storage 0.569 3.671 0.387 0.178
3 Processing and packaging 0.564 3.795 0.378 0.142
4 Retail 0.429 0.417 0.392 0.145
5 Out of home (preparation) 0.068 0.124 0.170 0.014
6 Out of home (consumption) 0.023 0.043 0.060 0.005
7 Consumption at home 0.382 0.373 0.293 0.091
114. Cascading effects and indirect effects are two other factors that should be considered when deciding where to intervene to reduce GHGEs via an FLW tax. Cascading effects are particularly relevant. In the case of addressing GHGEs by reducing FLW, one less ton of consumer waste reduces wasted emissions in the upstream supply chain. There will be a double dividend from reducing consumer waste: less emissions from waste and less emissions from production of that waste. The opposite occurs with a one-ton reduction in farming waste. In this case, both waste and production of waste increase downstream, generating increasing GHGEs from sources in the downstream stages of the food supply chain. Possibly, however, emissions saved at the farming level will more than compensate for additional emissions generated by downstream levels. This is highlighted in rows 9 to 13 of Table 14. Cutting waste by 40 percent at the farming level reduces emissions by 41 percent at the farming level, and by 2.9 percent overall, despite cascading effects creating more waste. In contrast, cutting waste by 40 percent at the consumer level reduces emissions in the entire system by 24 percent. Waste reductions triggered upstream reinforce the initial reduction in consumer emissions. As discussed, dispositions from farm and consumer are different and will have their own additional impacts. When the volume of consumer FLW is higher and the majority of consumer FLW is sent to landfill, a decrease at the consumer level will decrease both total FLW and disposition-related GHGEs a greater amount than would occur with a similar reduction of FLW on farm.
115. Indirect effects due to price changes complicate matters. As argued throughout this report, changes in waste rates will trigger supply-and-demand adjustments and changes in prices, which ultimately will reverberate on levels of waste, and therefore on GHGEs. Rows 20-24 of Table 14 capture this effect. Here, a 40 percent decline in consumer waste results in a reduction in total GHGEs of 1.1 million tons CO2, with declines at all stages of the supply chain associated with a reduced — but still existing — cascading effect. A $70 tax on emissions would reduce the consumer tax bill by about $4 million due to GHGE savings. Farmers would see their tax bill decline by $64 million. A 40 percent decline in farming waste would reduce farming GHGEs by 0.18 million tons CO2 and total GHGEs by the smaller amount of 0.14 million tons due to the positive cascading effect. In this case, the farming GHGEs bill would decline by $12 million, and the consumer’s bill would increase by less than $1 million.

59
116. Therefore, one important overall conclusion is that indirect or rebound effects of FLW reduction can be quite large; and although they rarely overcome direct effects, they are very important to consider when ranking priorities of where to reduce waste in the food supply chain. The direction of indirect, rebound effects is more important than their magnitude. Reducing consumer food waste rates has a negative indirect rebound effect only (with price inelastic demand). A reduction in the rate of waste at, for example, the retail level will have indirect rebound effects on consumers, but negative indirect rebound effects on processors and farmers. The net effect of indirect rebound effects is ambiguous for reduction in waste rates at any point in the food value chain between farmer and final consumer. When the rate of food waste is reduced by intermediaries, farm loss declines and consumer waste increases. However, reducing waste at the consumer level can only generate negative rebound effects, while reducing rate of loss at the farm level can only generate positive rebound effects.
117. Finally one needs to emphasize that similar considerations apply to other environmental values consumed in production of waste, such as deforestation, biodiversity loss, water usage, nitrification of soils and water or others. Here also there is an issue of “wasted” resources. For example forests may be converted to agriculture land to produce food that is wasted downstream, in the process damaging biodiversity and generating additional GHGEs. The same considerations as for the above discussion on GHGEs apply whether to charge farmers or wasters downstream for the environmental damage in the production of downstream waste. In contrast with GHGEs in this case most environmental degradation would largely occur, if not only, at the farm level.
III. POLICY CHALLENGES AND TRADE-OFFS IN REDUCING FOOD LOSS AND WASTE
118. There are two main approaches to food loss and waste policy. One approach is to target food systems as a whole to lead them towards policy goals, such as less FLW. A tax on farming, for example, would fall into this category. Better information systems to reduce weather risks would also fall into this category. The other approach is to target FLW directly as a subset of the larger food system. Here, there are two types of interventions: those directed at preventing or abating loss and waste, such as financing storage systems or cold chains; and those directed at bringing waste back into the supply chain, either as edible food, such as donations for charities, or for other purposes, such as biogas, compost or animal feed.
119. Policies could include taxes, subsidies, regulatory support to waste markets, and regulations. These policies could work by reducing overall production or consumption, or by reducing the rate of waste, therefore decreasing FLW, decreasing the costs of FLW abatement, increasing the costs of sending to a landfill, or increasing the market value of waste sold (or donated) as food or recovered as non-food. This report highlighted how the various stages of the food supply chain are deeply interlinked, and how an intervention at one level would resonate at other levels. Policies that affect the three main dispositions — donations or use in secondary markets, non-recoverable food and recovered and recycled food — can have important impacts on the vertical food supply chain.
120. Three different ways of reducing FLW are a tax on food production or consumption; an exogenous reduction of FLW; or a tax, subsidy or ban on waste or disposition. These illustrate the three approaches to policy summarized in paragraph 118 above. A tax on food production or consumption would cover the entire production or consumption activity, and indirectly affect levels and rates of loss and waste. An exogenous reduction in FLW could reflect an exogenous shift in the abatement cost curve, which would make it cheaper to reduce loss and waste in production or consumption. This shift could be triggered by technological change or some of the interventions listed in Figure 31 and in Annex A. A tax on waste or non-recoverable food, a subsidy for recovery, or
60
THE CASE FOR REDUCING WASTE CONTINUED
a ban on a landfill would target waste directly. All interventions would have direct and indirect impacts affecting demands, supplies and prices, as well as policy goals such as GHGEs. One set of results for chicken in the UK assuming a closed economy and inelastic demand is presented in Table 16.
121. Consider first a tax on production or consumption. A tax on production would lead to a decline in FLW because farm production would decline, and from the cascading effect, each stage downstream would also reduce production or consumption. Prices on the other hand, would increase, creating incentives to reduce the rate of waste. A 20 percent production tax could reduce total waste by 4 percent,15 while a 20 percent tax on consumption would decrease demand for food and lower prices upstream in the supply chain, triggering less production and therefore less waste. While rates of waste might increase (due to lower prices) the decline in production would dominate, so the net effect would be a decline in total waste of 10 percent. Note that a consumption tax has larger impacts than a farming tax in reducing FLW and GHGEs. As an alternative to taxing, governments could reduce consumption and farming subsidies. With a 20 percent reduction in subsidies, waste also would decline. Here again if the objective is to reduce waste or GHGEs, cutting the consumer subsidy has a larger impact than cutting the farming subsidy.
122. Consider now a shift in the abatement cost curve, assumed to lead to a cut of 50 percent in the rates of loss and waste at farm and consumer levels. This shift in the abatement cost curve would make it cheaper to prevent loss and waste. This approach would lower the marginal cost of reducing FLW by one unit compared with the marginal cost of one unit of production, thereby moving effort from production to abatement. This could be achieved through technological change or investment made for the purpose of abatement, such as improved storage or cooling systems. In this scenario, total FLW would decline by 7 percent. All prices would decline and food consumption would increase. This would augur well for food security but less so for farm welfare, since production and sales would decline. Total GHGEs from the chicken food system would decline by 24 percent.
123. Finally, consider policies targeting waste directly, such as a tax on disposition, a tax on non-recovered waste, or a subsidy directed at recovery. The effects of a 50 percent tax on all the waste (landfill, recovered and sold/donated), a 50 percent tax on non-recovered waste, or a 50 percent subsidy on waste recovery are negligible. A subsidy directed at recovery would increase waste and GHGEs by a small amount, as now wasters could get compensated for recovering, making waste more profitable.
124. The large impact a ban on landfill would have is striking. Producers and consumers would be prohibited from discarding edible or recoverable waste, forcing all food waste to be recovered. A ban on landfill would reduce total FLW by 36 percent and farm waste by 77 percent. GHGEs in the chicken subsector would decline by 44 percent. However, the ban would also have serious negative impacts, decreasing farmers’ incomes and welfare and worsening food security. These results highlight again the inter-linkages of stages along the supply chain and the difficult trade-offs that policy makers face when addressing FLW.

61
TABLE 16: Impacts of alternative policy measures on the food system
Tax Reduce subsidy50% reduction of rates of
waste
Tax dis-position
50%Ban
landfill
50% subsidy
for recovery
50% tax on non-
recovered waste
Farm 20%
Consump-tion 20%
At the farm 20%
At the con-
sumer 20%
At the farm
At the con-
sumer
At the farm and con-
sumer
Farm production (stress on natural resources) -4.03 -9.87 -3 -6 -1.03 -3.68 -4.74 -0.4 -56 0.02 -0.30
Farm welfare -11.62 -26.79 -1 -1 -3.07 -10.64 -13.57 -0.51 -52 0.04 -0.5
Food security (consumption) -4.03 -9.87 -3 -11 1.19 12.14 13.40 -0.4 -68 0.03 -0.44
Consumer prices 5.21 12.24 5 -4 -1.45 -2.49 -3.88 0.27 45 -0.02 0.3
Waste -4.03 -9.87 -3 -7 -1.01 -5.59 -6.65 -0.39 -36 0.03 -0.39
Farm waste N.A. N.A. - -6 N.A. N.A. N.A. N.A. -77 0.00 N.A.
Consumer waste N.A. N.A. -3 -11 N.A. N.A. N.A. N.A. -36 0.00 N.A.
GHGEs (total) -4.03 -9.87 -3 -6 -3.37 -20.30 -23.80 -0.09 -44 0.62 N.A.
From production N.A. N.A. -3 -6 N.A. N.A. N.A. -0.03 -38 0.21 N.A.
From waste N.A. N.A. -3 -7 N.A. N.A. N.A. -1.4 -100 -28 N.A.

62
THE CASE FOR REDUCING WASTE CONTINUED
125. Three recent and important studies have recommended a series of policies and interventions to reduce FLW. The policy and intervention recommendations of these studies are listed in Annex A. First listed are interventions covering the entire stage of the supply chain, which among other impacts, would reduce FLW. These interventions include, for example, providing better information to farmers on weather and market risks to reduce the number of surplus crops planted to hedge against those risks. Other interventions in this first group aim to improve the transportation network, such as roads, to reduce losses during THS. The second group of interventions are those specifically aimed at abating FLW. One example is providing consumers and farmers with information and increased awareness of potential losses. Another intervention under this category is rigorous and regulated labeling of food items to decrease the amount of edible food discarded because of inaccurate quality-related labeling. Cooling systems are another example. The third category includes interventions that target waste directly after it is produced. Within this group are interventions to recover waste for other uses. These include using waste for animal feed or as compost, or creating or promoting secondary markets for food that is not consumed. Facilitating donations to charities, for example, is a popular measure in many countries. Another intervention in this group is developing secondary markets for food about to be wasted by improving information and distribution networks. The final group includes interventions directed at landfills, such as producing biogas from decomposition in landfills, also a popular measure.
126. The stage at which the intervention takes place also matters. As discussed earlier, the FLW supply chain has seven stages: (i) farming; (ii) transportation, handling, storage (THS); (iii) processing; (iv) retailing; (v) food services (e.g., restaurants); (vi) at-home consumption; (vii) away-from-home consumption. All things being equal, and because of the cascading effect, prioritizing the consumption stage to reduce FLW might seem most
Exon
omic
Val
ue p
er T
on ($
/ton
)
FIGURE 31: Marginal food waste abatement cost curve — Economic value of policies to reduce FLW (source Refed 2016)
Prevention & Recovery Solutions Recycling Solutions are the most cost-effective are the most scalable
5k n Prevention n Recovery n Recycling
4k
3k
2k
1k
0 0 2 4 6 8 10 12 13.2
Standardized Date LabelingConsumer Education Campaigns
Packaging AdjustmentsDonation Matching SoftwareStandardized Donation RegulationDonation Liability EducationValue-Added ProcessingDonation Storage & HandlingSpoilage Prevention Packaging
Donation TransportationWaste Tracking & Analytics
Trayless DiningSmaller PlatesCold Chain ManagementManufacturing Line OptimizationDonation Tax IncentivesImproved Inventory Management
Produce SpecificationsSecondary ResellersHome CompostingCommercial Greywater
WRRF with AD Centralized AD Centralized Composting Other*

63
advantageous. However, this depends on the relative costs of reducing FLW at that level, which in turn is linked to the relative amount of FLW produced at that stage. In developing countries where most FLW is at the farming level, interventions at this level could have the most impact, especially because there are many relatively easy farm-level tactics to adopt. In a developed country, of the other hand, where most waste is consumer-generated, the consumption level interventions might be best to prioritize. The point is, countries may face a diverse set of situations: high consumer waste in urban settings with mid-income levels, and high farming losses in zones of concentration of subsistence farming. Policies may need to differentiate between these situations.
127. Inevitably, trade-offs will materialize when policy makers choose between alternative stages of the waste supply chain to intervene. Using the example of chicken and a closed economy (Table 17 and Figure 32), consider how a reduction of FLW at each stage of the waste supply chain impacts welfare and policy objectives. First, see where a reduction of about 0.01 million tons of FLW would have the highest impact on total FLW, in a sense a measure of the productivity of FLW reduction. An FLW reduction of 0.01 million tons at the food services stage would contribute the largest decline in FLW across the supply chain. However, if the concern is farm production as a proxy for stress on natural resources, the best stage to intervene (that is, where 0.01 million tons reduction in FLW contributes the most to decrease farm production), would be at the processor level. If, rather, the policy maker is concerned with farm welfare, the best stage to reduce FLW would be at away-from-home consumption. And if the overarching concern is food security, which FLW reduction would reduce food prices the most? Here, intervening at the retailer level would be best; 0.01 million tons would help decrease consumer food prices by 0.8 percent. As for total GHGEs, the largest decline would result from reducing FLW at the processor stage followed by the food services stage.
128. There also is ambiguity depending on the trade characteristics of the country. Compare the results for different economies — closed, large open, and small open economies. If the goal is to reduce farm production to lower the stress on natural resources, reducing FLW at the processor level in a closed economy would be best, and at the food services level in both a large open economy and a small open economy. Consider now GHGEs. For all economies and chicken, the biggest return on investment would be to reduce FLW at the processor stage. As for the second
TABLE 17: Impacts of a cut of 0.01187 million tons of chicken loss and waste at each stage of the supply chain on policy goals (closed economy, UK, percentage change)
Reduction at:
POLICY OBJECTIVE: Farm THS Processor Retailer Food Away from At home services home consumption consumption
Farm production -0.24 -0.23 -0.30 -0.22 -0.25 0.06 -0.20
Farm welfare -0.71 -0.69 -0.88 -0.67 -0.74 0.19 -0.61
Food consumption 0.27 0.28 0.37 0.36 0.68 1.01 0.75
Consumer food price -0.34 -0.35 -0.45 -0.82 -0.17 0.04 -0.14
Total GHGs -0.23 -0.22 -0.33 -0.26 -0.32 -0.05 -0.32
Total Quantity FLW -0.77 -0.77 -0.99 -0.84 -1.22 -0.94 -1.20
Total value FLW -0.67 -0.7 -0.76 -1.17 -1.47 -1.89 -2.24
64
THE CASE FOR REDUCING WASTE CONTINUED
best stage it would be food services for a closed economy and a large open economy, but the THS stage in a small open economy (Annex B).16
129. Elasticities of demand, supply, imports, exports, and costs of reducing FLW affect results, and need to be calculated for the specific situation under analysis. Consider first the role of price elasticity of demand. An inelastic demand curve reverses the upstream effects of a cut in consumer rates of waste compared to an elastic demand. An elastic demand can determine if a cut in the rate of farm loss increases farm production or not, depending also on other parameters. A cut in the rate of processing waste can result in higher purchases by processors — but only if the demand elasticity is extremely elastic, as in the case of a small country trader. The direct and indirect effects of policy (such as taxes or reductions in FLW driven by technology) depend too on the trade situation of the country and import (Box 5). Finally, the elasticity of the food loss and abatement cost function also matters (Table 4). For a high elasticity abatement cost curve, a 20 percent consumption tax would have the largest impacts on reducing FLW, while for low elasticity, a production tax would be more effective. This makes careful estimations of the various elasticities shaping the demands and supplies of a country critically important.
130. Results also diverge across the four commodities — fruit, bread, milk and chicken. Consider only one policy objective, reducing GHGEs. Tables for the other policy objectives, trade assumptions, and commodities are in Annex B. To maximize the impact on GHGEs of reducing FLW by 0.01187 million tons, the best course would be to intervene at the THS stage followed by at-home consumption for fruit; at the processor stage followed by food services for chicken; at the at-home consumption stage followed by away-from-home consumption for bread; and at the at-home consumption stage followed by retailer for milk.
131. Finally, another important consideration is which stage has the largest amount of FLW. The stage in which the intervention is most efficient is not necessarily the stage where there is a larger volume of FLW, which, although less effective for a focus of the intervention, could have a bigger impact since the stock of FLW is much larger. Figure 33 shows the volumes of FLW available for reduction. For fruit, the highest volume is in at-home consumption followed by farm; for chicken, it is the processor stage followed by at-home consumption; and for bread and milk, it is at-home consumption followed by retailer.
132. Thus, a key conclusion of this study — and the answer to Question 3 — is that there are important trade-offs between policy goals when considering where in the food supply chain to intervene first, and what is best depends on the commodity, trade situation, and other parameters of the country. This report called attention to two characteristics of the food supply chain that merit consideration — the cascading effect and to whom GHGEs or other environmental degradation generated in producing waste should be attributed. Additionally, in highlighting the trade-offs and key variables to consider, the overarching conclusion is that there are no dominant strategies; each case needs to be analyzed on its merits. Each specific country situation needs to be investigated on its own, and it is not possible to identify overriding recommendations that would apply to every case. The framework discussed in this report can be useful for country level diagnostics.

65
FIGURE 32: Three models for chicken on farm production, farm welfare and food consumptionM
OD
EL 1:
Clo
sed
Econ
omy
n F
arm
pro
duct
ion
0.
10
0.05
0.
00
-0.0
5
-0.10
-0
.15
-0.2
0
-0.2
5
-0.3
0
-0.3
5
n F
arm
wel
fare
0.
40
0.20
0.
00
-0.2
0
-0.4
0
-0.6
0
-0.8
0
-1.00
n F
ood
cons
umpt
ion
1.2
0
1.00
0.
80
0.60
0.
40
0.20
0.
00
Proc
es-
sor
Food
se
rvice
sFa
rmTH
SRe
taile
rAt h
ome
con-
sum
p-tio
n
Away
fr
om
hom
e co
n-su
mp-
tion
Proc
es-
sor
Food
se
rvice
sFa
rmTH
SRe
taile
rAt h
ome
con-
sum
p-tio
n
Away
fr
om
hom
e co
n-su
mp-
tion
Proc
es-
sor
Food
se
rvice
sFa
rmTH
SRe
taile
rAt
hom
e co
n-su
mp-
tion
Away
fr
om
hom
e co
n-su
mp-
tion
MO
DEL
2: L
arge
Ope
n Ec
onom
y
n F
arm
pro
duct
ion
0.
10
0.05
0.
00
-0.0
5
-0.10
-0
.15
-0.2
0
-0.2
5
n F
arm
wel
fare
0.
20
0.
00
-0
.20
--0
.40
--0
.60
--0
.80
n F
ood
cons
umpt
ion
1.2
0
1.00
0.
80
0.60
0.
40
0.20
0.
00
Stag
e of
the
valu
e ch
ain
w
here
the
redu
ctio
n ta
kes
plac
e
Proc
es-
sor
Food
se
rvice
sFa
rmTH
SRe
taile
rAt
hom
e co
n-su
mp-
tion
Away
fr
om
hom
e co
n-su
mp-
tion
Proc
es-
sor
Food
se
rvice
sFa
rmTH
SRe
taile
r At h
ome
con-
sum
p-tio
n
Away
fr
om
hom
e co
n-su
mp-
tion
Proc
es-
sor
Food
se
rvice
sFa
rmTH
SRe
taile
rAt
hom
e co
n-su
mp-
tion
Away
fr
om
hom
e co
n-su
mp-
tion
MO
DEL
2: S
mal
l Ope
n Ec
onom
y
n F
arm
pro
duct
ion
0.
25
0.20
0.
15
0.10
0.
05
0.00
-0
.05
-0
.10
n F
arm
wel
fare
0.
80
0.60
-0
.40
0.
20
0.00
-0
.20
-0
.40
n F
ood
cons
umpt
ion
1.2
0
1.00
0.
80
0.60
0.
40
0.20
0.
00
Food
se
rvice
sRe
taile
rAt
hom
e co
n-su
mp-
tion
Away
fr
om
hom
e co
n-su
mp-
tion
Farm
THS
Proc
es-
sor
Food
se
rvice
sRe
taile
rAt
hom
e co
n-su
mp-
tion
Away
fr
om
hom
e co
n-su
mp-
tion
Farm
THS
Proc
es-
sor
Proc
es-
sor
Food
se
rvice
sFa
rmTH
SRe
taile
rAt
hom
e co
n-su
mp-
tion
Away
fr
om
hom
e co
n-su
mp-
tion
Percent Change
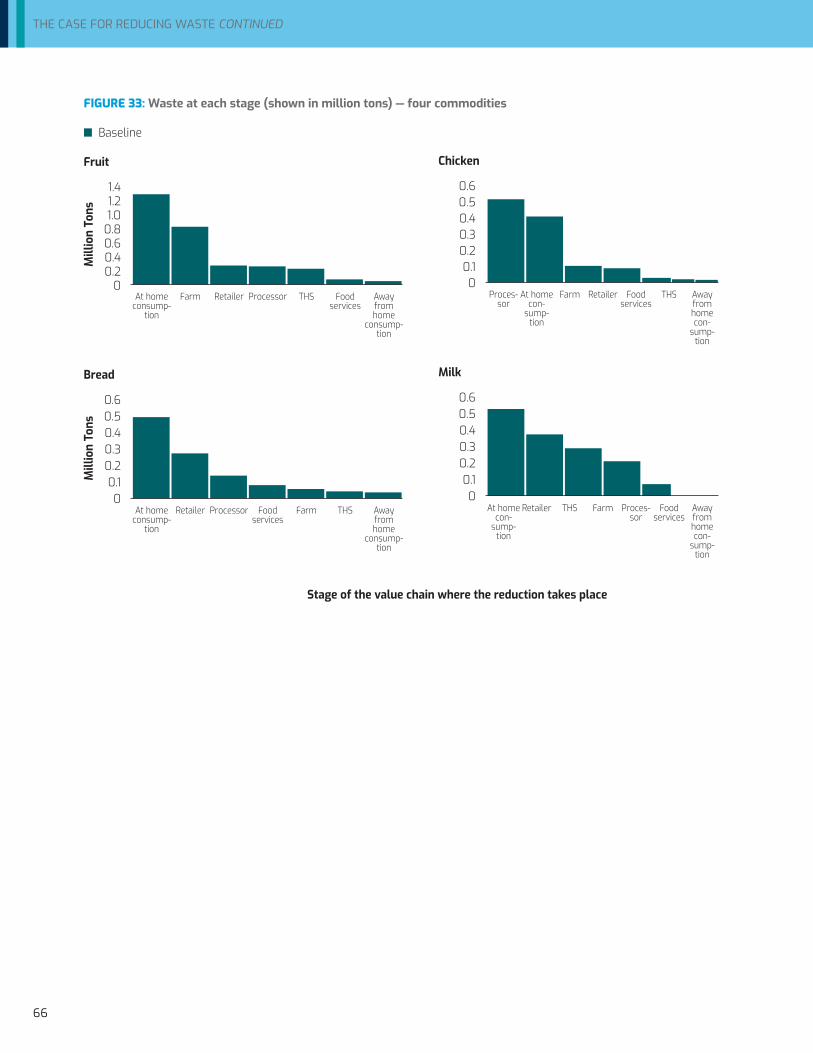
66
THE CASE FOR REDUCING WASTE CONTINUED
FIGURE 33: Waste at each stage (shown in million tons) — four commodities
n Baseline
Fruit
1.4 1.2 1.0 0.8 0.6 0.4 0.2 0
Bread
0.6 0.5 0.4 0.3 0.2 0.1 0
At home consump-
tion
Farm Retailer Processor THS Food services
Away from home
consump-tion
At home consump-
tion
Retailer Processor Food services
Farm THS Away from home
consump-tion
Mill
ion
Tons
Mill
ion
Tons
Chicken
0.6 0.5 0.4 0.3 0.2 0.1 0
Milk
0.6 0.5 0.4 0.3 0.2 0.1 0
Proces-sor
At home con-
sump-tion
Farm Retailer Food services
THS Away from home con-
sump-tion
At home con-
sump-tion
Retailer THS Farm Proces-sor
Food services
Away from home con-
sump-tion
Stage of the value chain where the reduction takes place

67
VII. Facilitating Change
A. KNOWLEDGE, INNOVATION AND TECHNOLOGY
133. While productivity (yields) has historically driven research and innovation in the agricultural sector, the concept of food systems has been largely absent, since food has not been a business concept. The world has enjoyed multiple advancements in yield growth from the 17th century to the present, leading to the modernized farming industry we know today. However, at a time when we are close to or already exceeding planetary boundaries, we may no longer be able to afford the luxury of living on a stable and resilient planet without a serious transformation of the global food system. The focus must shift away from one singularly trained on agriculture to an inclusive approach in which information and ideas are cultivated across silos of knowledge and innovation to make the entire food system — from farm to fork to landfill — more efficient. This is an opportunity to call upon experts across all of the different sectors that interact with food systems, including technology, energy and transportation, to name a few.
FIGURE 34: Effect on GHGEs of a 1% intended reduction of FLW (shown in percent changes) — four commodities
n Total GHGs
Fruit—reduction of 0.02953 million tons
0
-.2
-.4
-.6
-.8
Bread—reduction of 0.01138 million tons
0.0 -0.1 -0.2 -0.3 -0.4 -0.5 -0.6
At home con-
sump-tion
Food services
Away from home con-
sump-tion
Retailer Proces-sor
THS Farm
At home con-
sump-tion
Away from home con-
sump-tion
Retailer Proces-sor
Food services
Farm THS
Chicken—reduction of 0.01187 million tons
0
-.1
-.2
-.3
-.4
Milk—reduction of 0.01478 million tons
0.00
-0.02
-0.04
-0.06
-0.08
-0.10
Processor Food services
At home consump-
tion
Retailer Farm THS
Away from home
consump-tion
At home consump-
tion
Retailer Processor Farm THS Food services Away
from home
consump-tion
Stage of the value chain where the reduction takes place

68
FACILITATING CHANGE CONTINUED
134. Consumers are increasingly knowledgeable and demand reform from retail and restaurant industries; but they still lack sufficient information to change at-home practices. Waste is largely a phenomenon of urban areas and developed economies, where we see rates of food waste around 40 percent. But over the past two decades, we have witnessed the rise of the informed consumer — one who demands product and supply chain transparency, and who makes purchasing decisions based on related information. So why is the rate of waste so high? We see information asymmetry and distribution challenges. Beyond the fact that food prices do not account for the environmental externalities associated with production and reinforce an undervaluation of food, challenges remain regarding the aesthetics of “ugly” perishables, improper storage, over purchasing, and date labeling. To fully realize the potential of consumer influence to reduce food waste requires that consumers apply sustainability concepts at home that are analogous to those they expect from retailers. If we couple this at-home transformation with a robust distribution network that can redistribute excess food or near-spoiling perishables to a secondary market, we can correct supply chain distortions that prevent food that is still edible from reaching locations where food is needed. But what are the types of technologies that can correct these information and distribution constraints to enable this more efficient food system?
135. The agriculture sector, which is where food is created, lags in investment, hence in opportunities to introduce new technologies — despite being one of the World’s largest industry and employer, employing 60 percent of workers in less developed countries (WWF 2019; FAO 2017). For example, if we compare investment and entrepreneurship in the agriculture sector versus the healthcare sector, another massive industry, the disparity is staggering. We see in Figure 35 that the agriculture sector employs nearly 17 times the number of people in healthcare. And yet the healthcare industry benefits from around ten times the size of investment and 18 times the number of start-ups of the agriculture sector. In addition, although developing countries are the source of around 75 percent of agricultural value added, only 25 percent of investments in technology for agriculture are dedicated to them (WEF 2019). The lower levels of investment in food creation systems are due in great part to the complexity of the sector. Fragmented rural markets, poor infrastructure, high regulatory burdens, and other factors raise costs, while revenues are constrained by customers’ limited ability and willingness to pay (WEF 2018).

69
FIGURE 35: Differences in investment between the agriculture and healthcare sectors
Source: WEF (2018); WWF (2019); healthcare employment figure
136. In addition to needing more investment, agricultural research needs to shift from a fragmented institutional structure to a comprehensive and system-wide food system approach across the food value chain. Research today is characterized by specific interventions in narrow concentrations, such as biofortification or resistance to drought or pests. But to deliver a food system that can feed an additional 2-3 billion people in the next three decades, without increasing the environmental burden, requires innovative thinking surrounding the adoption of current, effective technologies, as well as the development of new technologies, in particular for reducing FLW. We need to be asking what financially viable technologies exist, how they can be deployed, and in which areas future research should be applied.
137. Revolutionizing the global food system will require the implementation of scalable technologies along the entire food value chain. We need to be able to address market failures efficiently and at scale, which in turn necessitates that adopters benefit from a financial return within a sensible timeframe. Although myriad technologies exist at the rural producer level to reduce losses, adoption is seen as piecemeal and ineffective. According to extensive research, this is due to uncertain profitability given pricing variations, barriers to financing, as well as other reasons. For the private sector, where the cost of capital is reasonable, other barriers, such as risky regulatory environments and low marginal benefit of interventions, prevent action.
AGRICULTURAL SECTOR
1 BillionEmployees
14 BillionInvestment
HEALTHCARE SECTOR
59 MillionEmployees
145 BillionInvestment
1,000Start-Ups
18,000Start-Ups
70
FACILITATING CHANGE CONTINUED
138. Fundamentally, policy failures at multiple levels are preventing adoption of viable technologies to address FLW. Despite the existence of technological advances, insufficient transformation is occurring at any stage of the agriculture value chain, particularly in developing countries. More than 75 percent of agriculture and food technology investments take place in developed countries (WEF 2019). At the smallholder farmer level, we witness costly interventions and low food prices preventing rudimentary technology adoption, let alone new “disruptive” technologies.
139. With policy failures addressed, food priced correctly, and social safety nets put into place, stakeholders along the food value chain are ready to implement FLW prevention technologies at scale. In this new enabling environment, we can revisit technologies that already exist,that previously were unviable but now will thrive. Looking to the next decade, the World Economic Forum listed twelve technologies that could deliver significant impacts on food systems by 2030 (2018). Among these, three of them specifically target FLW:
• Food-sensing technologies for food safety, quality and traceability (estimated 20 million tons of FLW reduction): Use of sensors for non-destructive analysis of food, helping to determine perishability and composition, and preventing recalls.
• Internet of Things (IOT) for real-time supply chain transparency and traceability (estimated 35 million tons of FLW reduction): Implementation of IOT in 50-70 percent of developed countries, reducing losses of an estimated 10 to 50 million tons of FLW by 2030, while increasing transparency through traceable supply chains.
• Blockchain-enabled traceability (estimated 30 million tons of FLW reduction): Used to monitor information about food moving through the supply chain, thereby reducing the possibility of information tampering by retailers and other actors. (If blockchains monitored the information along half of the world’s supply chains, an estimated reduction of 10 to 30 million tons of food loss would result.)
B. FINANCING
140. These technologies seek to address fundamental market failure related to information asymmetry and enable a smarter distribution and infrastructure network. Even as we have identified promising areas for the growth of innovative technologies, we still need to address the financing gap that persists.
141. Financing the global transformation of our food system, including the reduction of FLW, is achievable within a few decades. Unlike other global challenges that will require a trillion dollars over the course of an entire generation, we have the ability to use a variety of financial instruments to make the necessary transformation affordable. The world has witnessed the successful scale-up of climate finance as well as the on-going transition to a low-carbon energy system.
142. Globally, a dedicated financing facility would provide a catalyst for momentum. The Climate Investment Funds (CIF), founded in 2008, provided one of the first dedicated financing mechanisms for climate finance. It elevated the climate agenda globally and paved the way for many new climate financing facilities. Markets and the private sector alone will not address certain objectives of FLW reduction, such as reducing the environmental footprint of food systems and improving food and nutrition. This leaves it to the public sector to play an important role in creating necessary incentives. Specifically, there is a public need to incentivize early adoption of technologies that help bring FLW back into the food supply chain, technologies that may be perceived as risky by the private sector. Following the example of climate finance, a dedicated financing facility needs to be
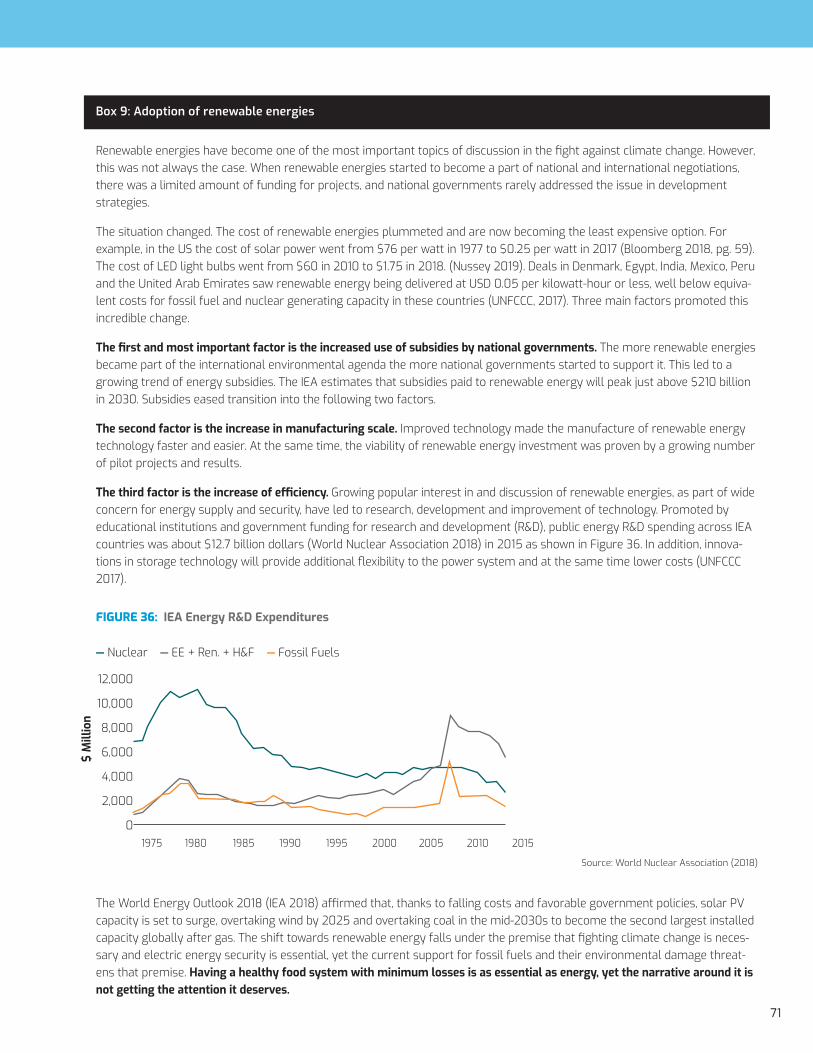
71
Box 9: Adoption of renewable energies
Renewable energies have become one of the most important topics of discussion in the fight against climate change. However, this was not always the case. When renewable energies started to become a part of national and international negotiations, there was a limited amount of funding for projects, and national governments rarely addressed the issue in development strategies.
The situation changed. The cost of renewable energies plummeted and are now becoming the least expensive option. For example, in the US the cost of solar power went from $76 per watt in 1977 to $0.25 per watt in 2017 (Bloomberg 2018, pg. 59). The cost of LED light bulbs went from $60 in 2010 to $1.75 in 2018. (Nussey 2019). Deals in Denmark, Egypt, India, Mexico, Peru and the United Arab Emirates saw renewable energy being delivered at USD 0.05 per kilowatt-hour or less, well below equiva-lent costs for fossil fuel and nuclear generating capacity in these countries (UNFCCC, 2017). Three main factors promoted this incredible change.
The first and most important factor is the increased use of subsidies by national governments. The more renewable energies became part of the international environmental agenda the more national governments started to support it. This led to a growing trend of energy subsidies. The IEA estimates that subsidies paid to renewable energy will peak just above $210 billion in 2030. Subsidies eased transition into the following two factors.
The second factor is the increase in manufacturing scale. Improved technology made the manufacture of renewable energy technology faster and easier. At the same time, the viability of renewable energy investment was proven by a growing number of pilot projects and results.
The third factor is the increase of efficiency. Growing popular interest in and discussion of renewable energies, as part of wide concern for energy supply and security, have led to research, development and improvement of technology. Promoted by educational institutions and government funding for research and development (R&D), public energy R&D spending across IEA countries was about $12.7 billion dollars (World Nuclear Association 2018) in 2015 as shown in Figure 36. In addition, innova-tions in storage technology will provide additional flexibility to the power system and at the same time lower costs (UNFCCC 2017).
FIGURE 36: IEA Energy R&D Expenditures
— Nuclear — EE + Ren. + H&F — Fossil Fuels
12,000
10,000
8,000
6,000
4,000
2,000
0 1975 1980 1985 1990 1995 2000 2005 2010 2015
Source: World Nuclear Association (2018)
The World Energy Outlook 2018 (IEA 2018) affirmed that, thanks to falling costs and favorable government policies, solar PV capacity is set to surge, overtaking wind by 2025 and overtaking coal in the mid-2030s to become the second largest installed capacity globally after gas. The shift towards renewable energy falls under the premise that fighting climate change is neces-sary and electric energy security is essential, yet the current support for fossil fuels and their environmental damage threat-ens that premise. Having a healthy food system with minimum losses is as essential as energy, yet the narrative around it is not getting the attention it deserves.
$ M
illio
n

72
FACILITATING CHANGE CONTINUED
created to jumpstart financing for the transformation of the global food systems. This will increase the global prominence and progress of FLW reduction. Food systems encompass many topics, including food loss and waste, food safety, and nutrition. A dedicated financing facility would support efforts that address these topics across policy, research, and investment. But who will pay for the facility?
143. One pathway would be to dedicate a proportion of aid budgets to finance food system transformation, research, and action on the ground. This concept could be applied at the government level or at the international cooperation level with the creation of a global public goods (GPG) fund for food system transformation. The fund would therefore financially incentivize borrowers to undertake GPG-related projects. With food systems critical to maintaining and producing global public-good goals, such as climate change, environmental commitments, or unanticipated shocks, a fund of this nature could provide a scalable model to drive funding where it needs to go and reduce the financial burden for recipient countries.
144. Governments should capitalize on existing mechanisms and embed FLW into their current Nationally Determined Contribution (NDC) commitments. FLW is a direct contributor to climate change, accounting for 8 percent of global annual GHG emissions. The NDC process provides an existing avenue for governments not only to commit to FLW reductions, but also to disclose financing gaps for achieving those targets. The FLW facility would then be in a strong position to match financing with countries that have outlined strategies and targets as part of their global commitment to the Paris Climate Agreement.
145. Development finance institutions (DFIs) are well positioned to finance food system solutions on the ground in client countries. The World Bank has a robust agriculture lending portfolio, which reached $4.7 billion in fiscal year 2018. Analytical tools, such as Food Smart Country Diagnostics, can identify public sector failure(s) for key commodities in select countries where losses and waste are significant, which then can serve as a roadmap for interventions and financing on the ground, both for multilateral development banks (MDBs) and governments. The World Bank’s International Development Association (IDA) lending arm, which is the single largest source of donor funds for basic social services in the world’s poorest countries, has a special theme on climate change. This enables low-income countries to access concessional financing or grants to address both mitigation and adaptation challenges, and it provides a natural entry point for food system interventions. With expertise across every sector, the World Bank can design projects to address issues in a systems-wide approach along the entire food value chain.
146. IDA’s Private Sector Window (PSW) provides risk mitigation financing to enable private sector participation and growth in the poorest countries. To attract foreign investment and grow the domestic private sector in these countries, the PSW de-risks at both the country and transaction levels. In a transaction, a portion of the risk will be transferred from private sector participants, as well as IFC and the Multilateral Investment Guarantee Agency (MIGA), to IDA to make otherwise risk-prohibitive yet impactful projects viable. Support includes strengthening the business environment as well as project preparation and capacity building activities. Mitigating risk at the transactional level can mobilize pioneering investments that in turn help reduce investor risk perceptions and enable additional domestic and foreign capital to flow. The PSW is another public financing instrument that, when well-coordinated and sequenced with policy reforms, can aid in the development of the private sector to implement FLW solutions in countries where potential losses are the highest.
73
147. Capital markets need to be explored because public finance alone cannot address the FLW challenge. The capital markets are demanding products that support responsible investing, where non-financial factors, such as those related to environmental, social and governance performance, are considered in investment processes and decision-making. In fact, sustainable, responsible and impact investing (SRI) assets have expanded to $12.0 trillion in the US, up 38 percent from $8.7 trillion in 2016 (US SIF 2018). Globally, SRI assets have reached over $20 trillion, or approximately a quarter of all professionally managed assets around the world (Kell 2018). We can capitalize on this demand to finance food systems transformation through a variety of innovative debt and insurance instruments.
148. The World Bank has already demonstrated the appetite of the capital markets to raise awareness and finance solutions for food systems challenges. In March 2019, the World Bank issued the first ever Sustainable Development Bond highlighting food loss and waste, raising $300 million for IBRD in a sole transaction with a Swedish investor. As of August 2020, the World Bank has issued over $2.1 billion of this food loss and waste bond through 29 transactions to investors around the world. These transactions were the result of testing the market with an issue that is underrepresented in thematic investing yet resonates globally, all at a time where asset managers are increasingly searching for investments that meet their own responsible investment mandates, such as those related to the Sustainable Development Goals. Bonds related to food systems are well positioned to fulfill SRI mandates, as the topic touches upon many global issues, including responsible production and consumption, climate change, natural resource use, and hunger.
Box 10: The Transformative Carbon Asset Facility Model
The Transformative Carbon Asset Facility (TCAF), in alignment with the Paris Climate Agreement, was created to support countries in meeting their Nationally Determined Contributions (NDC) commitments. The TCAF is a finance facility piloting an innovative, results-based mechanism using mitigation outcomes (MOs), also known as emission reductions or carbon credits, produced from World Bank operations. Financing from the facility’s contributors is blended with World Bank financing, and sometimes additional external financing, to fund projects in developing countries that produce mitigation outcomes. Con-tributors may be governments or private sector actors with an interest in greenhouse gas mitigation. The TCAF contributors acquire the prorated portion of carbon credits generated from financed projects for their own NDC commitment compliance (or cancelation), while the host country can use the remaining credits toward its NDC commitment. The facility also develops innovative carbon accounting methodologies to attribute emission reductions of policies and economy/sector-wide pro-grams.
Given the mitigation outcome potential of addressing food loss and waste along the food value chain, this type of mech-anism could provide a way for projects in this area to be co-financed, leveraging additional public and private financing. Providing improved storage capacity or sustainable cold chain infrastructure could prevent the spoilage of harvested crops and perishables, eliminating the carbon footprint associated with losses that otherwise would occur. Another opportunity for increasing the scale of this type of mechanism is to draw upon the capital markets as another source of financing for projects. Investors could buy bonds to finance projects with MOs and then choose to receive their payout/coupon in car-bon credits or in cash, depending on which is more economical at the point of generation. This then reduces the amount of financing required from the public sector, leverages the capital markets, and enables larger scale impact on the ground. The application of this concept — co-financing for FLW projects through the generation of MOs from WB operations for use in carbon markets, and potentially leveraging the capital markets for increased financing — is aligned with current develop-ments under Article 6 of the Paris Climate Agreement, and while innovative, the methodological framework (for generating and transacting MOs) is available and could be piloted.

74
TAKEAWAYS
149. The private sector has an opportunity to deploy solutions across their supply chains and operations. If companies along the entire food value chain, including processors, distributors, retailers, hotels and restaurants, could repurpose 0.5 percent of their revenue either to research or to scaling up the use of current technologies throughout their operations, gains in efficiency of the food system could be realized quickly. The implementation of solutions, especially in developing countries, will only occur if there is an enabling policy environment that is attractive to the private sector as well as clear financial viability. The facility could help de-risk the entry of the private sector on the ground.
150. One innovative debt product that could raise capital for food systems solutions in the private sector is an equity-linked note. An equity-linked note is a structured product in which the payout is linked to the performance of an underlying equity, such as an equity index. A food systems equity-linked note could follow the performance of an index characterized by top-performing corporations involved in the food value chain with operations in both developed and developing countries. The index could prioritize companies that demonstrate leadership in waste reduction, such as those that set targets and report data, or those that are developing solutions to reduce FLW along supply chains. Companies involved in food systems from production through retail could be eligible, including the agricultural machinery, fertilizer and chemicals, storage, energy, transportation, packaged foods and processors, technology, distribution, restaurant, hotel, and food retail industries. This enables a broader segment of sectors available for selection in the index, thereby implicitly supporting leaders along the entire food value chain, and reducing the likelihood of industry bias.
151. Governments around the world can raise debt to finance food systems solutions on the ground through sovereign green bonds. Green bonds finance projects that contribute to climate change mitigation and adaptation. Green food systems bonds could be used to raise funds for renewable cold chain infrastructure or anaerobic digesters that convert food waste into energy. Sovereign green bonds have been on the rise in the last few years, accounting for 10.5 percent of the total green bond market in 2018, or around $17.5 billion issued (Climate Bonds Initiative 2018). In October 2017, Fiji issued the first developing country green bond, raising $50 million for climate resilience, followed by Nigeria, which raised around $30 million in green bonds in December 2017. Notable issuances in 2018 in developing countries include Indonesia ($1.25 billion), Lithuania ($24 million), and Seychelles ($15 million). Issuing these bonds necessitates a strong governmental capacity to develop a green bond framework, regulations, and impact reporting, as well as to identify eligible projects. The World Bank provides pre- and post-issuance technical assistance to governments to facilitate the development of green bonds in emerging markets (WBG Thematic Bond Advisory). With investors often oversubscribing to sovereign green bonds, the market is ready to finance food systems transformation through green bonds.
152. A complement to traditional venture capital and philanthropy, patient capital is an emerging asset class uniquely positioned to finance food systems innovation and technology on the ground. Impact investors are increasingly interested in this type of longer-term investment, where financial returns are often equally as important as social or environmental returns, and investors are not seeking a quick profit (see Figure 37). When a technology needs to be tested, a market may not yet exist, or the investment is deemed too risky for commercial markets, patient capital can maintain the momentum and development of emerging technology before financial returns are feasible (Dogson and Gann 2018). Often bridging the gap between angel investing and traditional venture capital, patient capital exists not only to help bring viable commercial products or services to market, but also to maximize impact through solving critical challenges of our time. FLW, let alone the transformation of the global food systems, is an example of an urgent, critical field that

75
will rely on patient capital and entrepreneurship to find solutions that are flexible enough to be tailored to specific geographical constraints, yet scalable enough to move the needle and bring about the required shift in how the world produces and consumes food.
FIGURE 37: A Spectrum of Capital
Traditional venture capital Aim to maximize financial returns
Maximize Impact investors Blend financial and social returnsFinancial return orientation
0% IRR
Traditional philanthropy Aim to maximize social returns
No return
Minimal Optimal
Impact achieved per dollar of pateint capital
Source: Trelstad
VIII. Takeaways from the Study
153. This report focused on the role that FLW could play in reducing the environmental footprint of food systems while attempting to meet the caloric and nutrient needs of a population deemed to increase by 3 billion people in the next 30 years. The report acknowledged that the world is transgressing some key planetary boundaries in part due to food systems that are predatory to the environment while unfulfilling the caloric and nutrient needs of a large population. Notwithstanding the extraordinary success in the past century in making food more accessible, affordable and safe, food systems have contributed to unsustainable land use changes, over-depletion of fresh water, pollution from chemicals, disruption of the nitrogen and phosphorus cycles, biodiversity loss, and climate change.
154. While food systems generate an unsustainable environmental footprint, the amount of food that is lost or wasted is, according to some estimates, about 30 percent of the total world food supply. Increasingly, many who are alarmed with the need to transform food systems see reducing FLW as a promising strategy for helping feed the planet while reducing FLW’s environmental footprint. From the G20 to many governments, local governments, international agencies such as the World Bank, IDB, UNEP, FAO, think tanks, NGOs, and many others, there are numerous analyses and recommendations, and a myriad of initiatives offering solutions on how to reduce FLW. The private sector is also increasingly adopting measures to reduce FLW, recognizing them as a business opportunity and key to their corporate social responsibility strategies.

76
TAKEAWAYS CONTINUED
155. However, other than its role in generating GHG emissions, FLW is not the cause of a problem. Some amount of FLW will always exist because it does not pay for producers or consumers to incur the costs of eliminating all FLW. So, other than as a cause of GHGEs, what would be the rationale for reducing FLW? Perhaps FLW could be one of the solutions to environmental degradation and food insecurity; that is, by reducing FLW, countries could decrease the need for food newly produced reducing stress on production systems. This is a question that demands empirical investigation, and is a central topic of this study.
156. By looking at the food supply chain, this report sought to analyze in greater depth what drives FLW, how reducing FLW would reverberate through the food system, and what the relevant insights for FLW policy making are. Surprisingly and despite the extensive literature on FLW, there is a lack of studies looking into the relationship between changes in FLW and the behavior of food systems. This study looked at a disaggregated supply chain comprised of seven stages — from farm to fork to landfill — and acknowledged that any shock to the system, for example through reduced FLW, will have direct and indirect effects as prices change and in turn trigger more changes in food supplies and demands.
157. The analysis used an economic model of the food system that is based on optimizing behaviors by producers, intermediaries, and consumers as well as market clearing prices, and reports the impacts of exogenous shocks on welfare and policy objectives. Welfare and policy objectives of interest include stress on natural resources, food security, farm welfare, GHGEs, and value of trade. This economic model is a powerful tool for analyzing country- and commodity-specific circumstances and objectives, and for helping policy makers decide on FLW reduction strategies. The model covers farming; transportation, handling and storage; processing; retailing; food services; and away-from-home and at-home consumption. The distinction is that it includes FLW as an output of each stage of the supply chain. Thus, supply (production) does not equal demand (purchases). The model allows for assumptions regarding the openness of the economy and role of trade, along with varying demand and supply elasticities. The model has been applied to four commodities in the UK — chicken, bread, fruit and milk. More recent simulations for Rwanda covered maize, rice and tomatoes, and for Vietnam rice and catfish.
158. Low food prices are a key driver of FLW at all levels of the food supply chain. The first insight of the analysis is that the large amount of FLW is probably caused by food prices that are too low. If food prices, or equivalently food production and consumption costs, reflected the opportunity costs of natural resources consumed or of GHGEs, the amounts of FLW would be considerably lower, both from less production and consumption and from reductions of rates of FLW. This is because food would be seen as scarcer, and there would be incentives to conserve more, and to produce, consume and waste less.
159. Policies that lower food prices or costs, such as production and consumption subsidies, are also a driver of FLW. Governments often subsidize production, mostly in developed countries, or consumption, primarily in developing countries. More often than not, they also subsidize inputs, including energy, water and land conversions. Lower subsidies would have the same effect as higher food prices. Food lost or wasted would decline.
160. The strongest rationale for reducing FLW is that it would help reduce the environmental footprint of food systems while at the same time improving food security. Different strategies to reduce the environmental footprint of food systems have different welfare implications. A strategy of pricing environmental externalities and future scarcity correctly would result in higher production and consumption costs. While it would decrease production and rates of wastage — and thus save
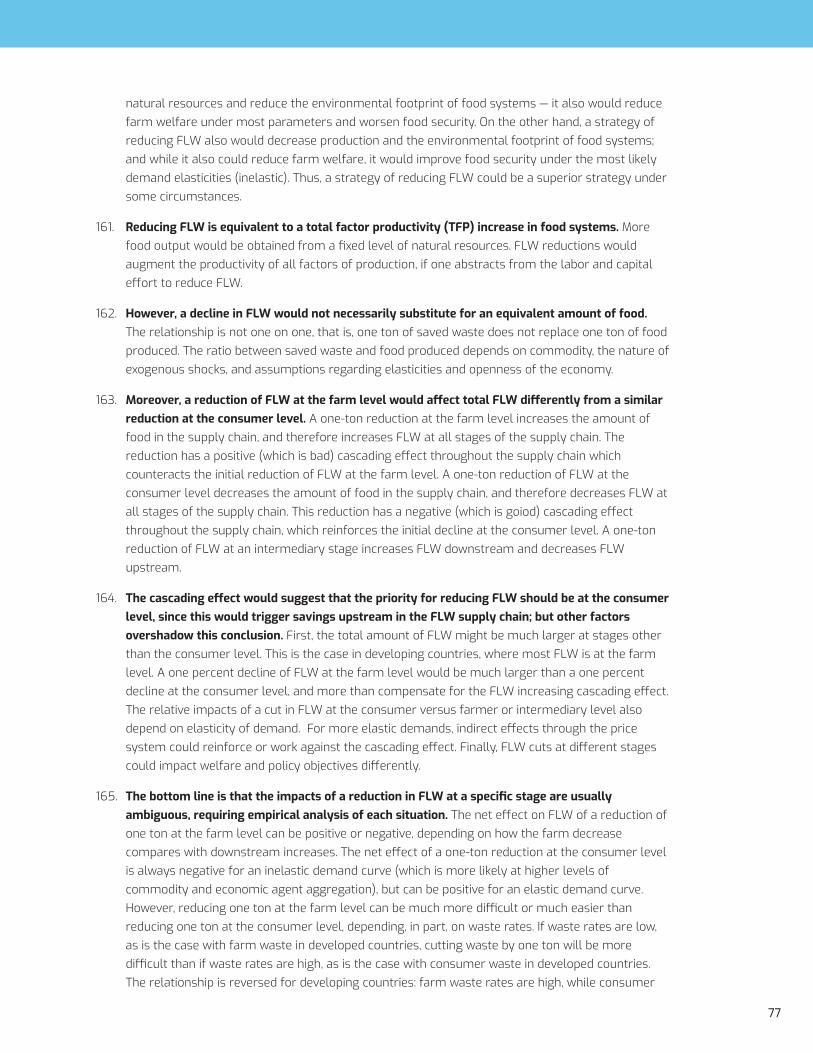
77
natural resources and reduce the environmental footprint of food systems — it also would reduce farm welfare under most parameters and worsen food security. On the other hand, a strategy of reducing FLW also would decrease production and the environmental footprint of food systems; and while it also could reduce farm welfare, it would improve food security under the most likely demand elasticities (inelastic). Thus, a strategy of reducing FLW could be a superior strategy under some circumstances.
161. Reducing FLW is equivalent to a total factor productivity (TFP) increase in food systems. More food output would be obtained from a fixed level of natural resources. FLW reductions would augment the productivity of all factors of production, if one abstracts from the labor and capital effort to reduce FLW.
162. However, a decline in FLW would not necessarily substitute for an equivalent amount of food. The relationship is not one on one, that is, one ton of saved waste does not replace one ton of food produced. The ratio between saved waste and food produced depends on commodity, the nature of exogenous shocks, and assumptions regarding elasticities and openness of the economy.
163. Moreover, a reduction of FLW at the farm level would affect total FLW differently from a similar reduction at the consumer level. A one-ton reduction at the farm level increases the amount of food in the supply chain, and therefore increases FLW at all stages of the supply chain. The reduction has a positive (which is bad) cascading effect throughout the supply chain which counteracts the initial reduction of FLW at the farm level. A one-ton reduction of FLW at the consumer level decreases the amount of food in the supply chain, and therefore decreases FLW at all stages of the supply chain. This reduction has a negative (which is goiod) cascading effect throughout the supply chain, which reinforces the initial decline at the consumer level. A one-ton reduction of FLW at an intermediary stage increases FLW downstream and decreases FLW upstream.
164. The cascading effect would suggest that the priority for reducing FLW should be at the consumer level, since this would trigger savings upstream in the FLW supply chain; but other factors overshadow this conclusion. First, the total amount of FLW might be much larger at stages other than the consumer level. This is the case in developing countries, where most FLW is at the farm level. A one percent decline of FLW at the farm level would be much larger than a one percent decline at the consumer level, and more than compensate for the FLW increasing cascading effect. The relative impacts of a cut in FLW at the consumer versus farmer or intermediary level also depend on elasticity of demand. For more elastic demands, indirect effects through the price system could reinforce or work against the cascading effect. Finally, FLW cuts at different stages could impact welfare and policy objectives differently.
165. The bottom line is that the impacts of a reduction in FLW at a specific stage are usually ambiguous, requiring empirical analysis of each situation. The net effect on FLW of a reduction of one ton at the farm level can be positive or negative, depending on how the farm decrease compares with downstream increases. The net effect of a one-ton reduction at the consumer level is always negative for an inelastic demand curve (which is more likely at higher levels of commodity and economic agent aggregation), but can be positive for an elastic demand curve. However, reducing one ton at the farm level can be much more difficult or much easier than reducing one ton at the consumer level, depending, in part, on waste rates. If waste rates are low, as is the case with farm waste in developed countries, cutting waste by one ton will be more difficult than if waste rates are high, as is the case with consumer waste in developed countries. The relationship is reversed for developing countries: farm waste rates are high, while consumer
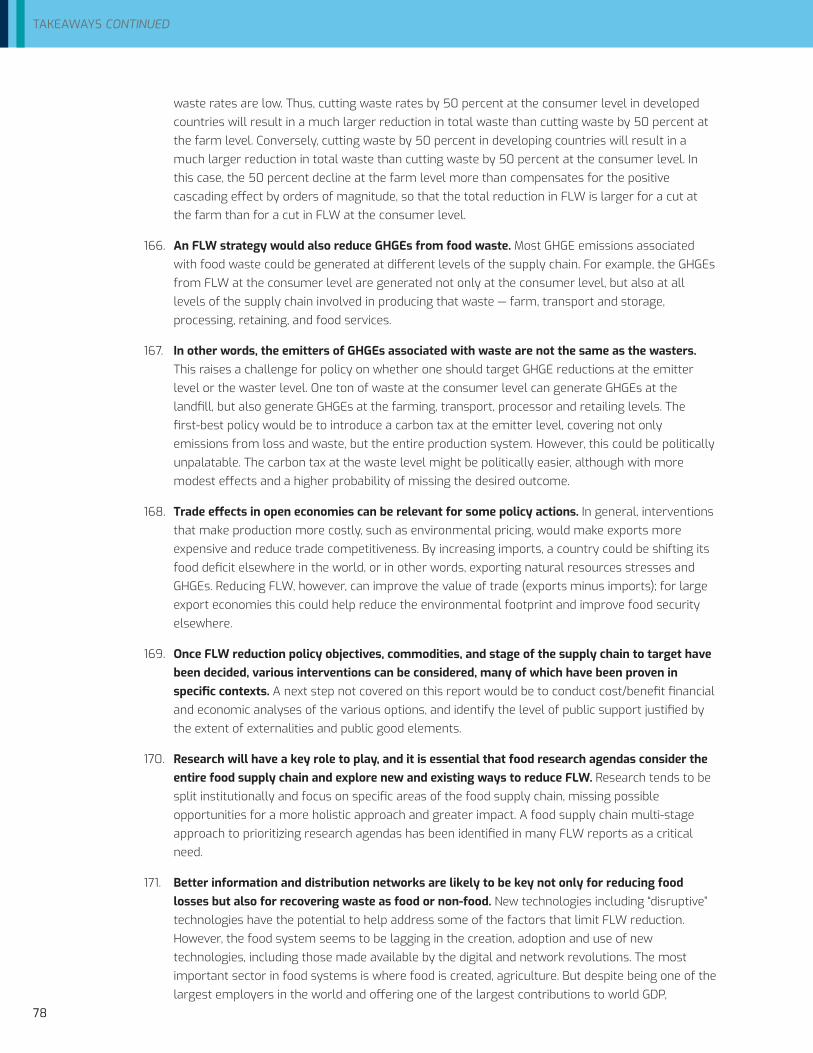
78
TAKEAWAYS CONTINUED
waste rates are low. Thus, cutting waste rates by 50 percent at the consumer level in developed countries will result in a much larger reduction in total waste than cutting waste by 50 percent at the farm level. Conversely, cutting waste by 50 percent in developing countries will result in a much larger reduction in total waste than cutting waste by 50 percent at the consumer level. In this case, the 50 percent decline at the farm level more than compensates for the positive cascading effect by orders of magnitude, so that the total reduction in FLW is larger for a cut at the farm than for a cut in FLW at the consumer level.
166. An FLW strategy would also reduce GHGEs from food waste. Most GHGE emissions associated with food waste could be generated at different levels of the supply chain. For example, the GHGEs from FLW at the consumer level are generated not only at the consumer level, but also at all levels of the supply chain involved in producing that waste — farm, transport and storage, processing, retaining, and food services.
167. In other words, the emitters of GHGEs associated with waste are not the same as the wasters. This raises a challenge for policy on whether one should target GHGE reductions at the emitter level or the waster level. One ton of waste at the consumer level can generate GHGEs at the landfill, but also generate GHGEs at the farming, transport, processor and retailing levels. The first-best policy would be to introduce a carbon tax at the emitter level, covering not only emissions from loss and waste, but the entire production system. However, this could be politically unpalatable. The carbon tax at the waste level might be politically easier, although with more modest effects and a higher probability of missing the desired outcome.
168. Trade effects in open economies can be relevant for some policy actions. In general, interventions that make production more costly, such as environmental pricing, would make exports more expensive and reduce trade competitiveness. By increasing imports, a country could be shifting its food deficit elsewhere in the world, or in other words, exporting natural resources stresses and GHGEs. Reducing FLW, however, can improve the value of trade (exports minus imports); for large export economies this could help reduce the environmental footprint and improve food security elsewhere.
169. Once FLW reduction policy objectives, commodities, and stage of the supply chain to target have been decided, various interventions can be considered, many of which have been proven in specific contexts. A next step not covered on this report would be to conduct cost/benefit financial and economic analyses of the various options, and identify the level of public support justified by the extent of externalities and public good elements.
170. Research will have a key role to play, and it is essential that food research agendas consider the entire food supply chain and explore new and existing ways to reduce FLW. Research tends to be split institutionally and focus on specific areas of the food supply chain, missing possible opportunities for a more holistic approach and greater impact. A food supply chain multi-stage approach to prioritizing research agendas has been identified in many FLW reports as a critical need.
171. Better information and distribution networks are likely to be key not only for reducing food losses but also for recovering waste as food or non-food. New technologies including “disruptive” technologies have the potential to help address some of the factors that limit FLW reduction. However, the food system seems to be lagging in the creation, adoption and use of new technologies, including those made available by the digital and network revolutions. The most important sector in food systems is where food is created, agriculture. But despite being one of the largest employers in the world and offering one of the largest contributions to world GDP,

79
agriculture pales with other sectors, for example the health sector, in number of start-ups and levels of investment.
172. The financing needed to address FLW on a significant world scale is large, and requires both significant public financing, globally and nationally, and private capital. The evolution and growth of climate financing offers a parallel model that could be adopted for a global strategy of reducing FLW. In climate financing, an initial seed fund, the Climate Investment Fund, signaled to financiers both the importance of the agenda and the opportunities and need for public financial support. In parallel, capital markets need to be tapped as well, given the magnitude of financial needs. In this regard, a promising development is investors’ growing interest in investments that yield social returns.
173. In summary, this study intended to answer three main questions. These are: (i) Are low food prices a driver of food loss and waste? (ii) Would reducing FLW improve the environmental footprint of food systems and reduce GHGEs, while generating co-benefits for other policy goals such as food security? (iii) Which stage of the food supply chain would be best for FLW reduction policy interventions?
174. To answer these questions, the study used a simulation economic model of a 7-stage food supply chain. The conclusions are: (i) Low food prices that are subsidized and do not reflect environmental values and the costs of GHGEs are a driver of FLW; (ii) Reducing FLW would reduce GHGEs from the food system and improve FLW’s environmental footprint, while generating co-benefits for food security and food trade, but possibly lowering farm welfare; (iii) The best stage of the supply chain to intervene depends on the policy objective and circumstances and parameters of the country. Since there is no dominant strategy, this needs to be investigated case by case at the country or sub-country level.
175. Reducing FLW is an important strategy for feeding the planet and reducing the environmental footprint of food systems; but there are critical welfare and policy objective trade-offs between different strategies, and the ambiguity that clouds the best course of action to take needs to be resolved through empirical investigation of the circumstances. These need to be addressed at the country level, including further analysis of the specific circumstances, for which the global framework of this study can be a useful approach. However, this is not enough, and needs to be complemented by detailed cost/benefit economic analyses of alternative strategies, along with raising the public and private financing needed to create the right incentives and support the necessary investments.

80
ANNEX A
Annex A. Suggested FLW Interventions
The table that follows lists some of the FLW policies and interventions that have been recommended in recent studies by the WBG, FAO and WRI.
TABLE 18: Interventions to reduce Food Loss and Waste by type of intervention, stage of the supply chain and nature of agent
Reducing costs of abating FLW Reducing costs of Selling (or donating) as food
Reducing costs of recovering as food or non-food
Increasing costs of sending to landfill
Sector-wide interventions — across the supply chain
Develop and implement national strategies for reducing food loss and waste — A robust national strategy should affirm commitment to SDG 12.3, outline a roadmap for achieving the target, identify supporting policy frameworks and incentives (existing and new), define roles, allocate financial resources, and establish a monitoring mechanism for corrective actions
Create national-level public-private partnerships — Establish national-level public-private partnerships dedicated to halving food loss and waste that can involve multiple stakeholders active in the country, as well as NGOs and research institutions
POLICYMAKERS: Embed into agricultural extension services food loss reduction awareness, technical assistance, and financial aid
POLICYMAKERS: Implement policies to prevent unfair trading practices
FINANCIERS: Increase the number of philanthropic institutions funding food loss and waste prevention activities
POLICYMAKERS: Make measurement and reporting of food loss and waste by large companies mandatory
POLICYMAKERS: Develop, facilitate, and promote climate-smart infrastructure (e.g., roads, electricity, irrigation, community storage) and access, especially for smallholder farmers
POLICYMAKERS: Remove barriers to food redistribution to facilitate safe donation of food to charities or those in need
INNOVATORS AND INTERMEDIARIES: Develop and improve availability of processing and preservation facilities (including aggregation centers and mobile low-carbon options)
CIVIL SOCIETY: Increase awareness and shift social norms so food loss and waste are considered unacceptable, including higher-income consumers
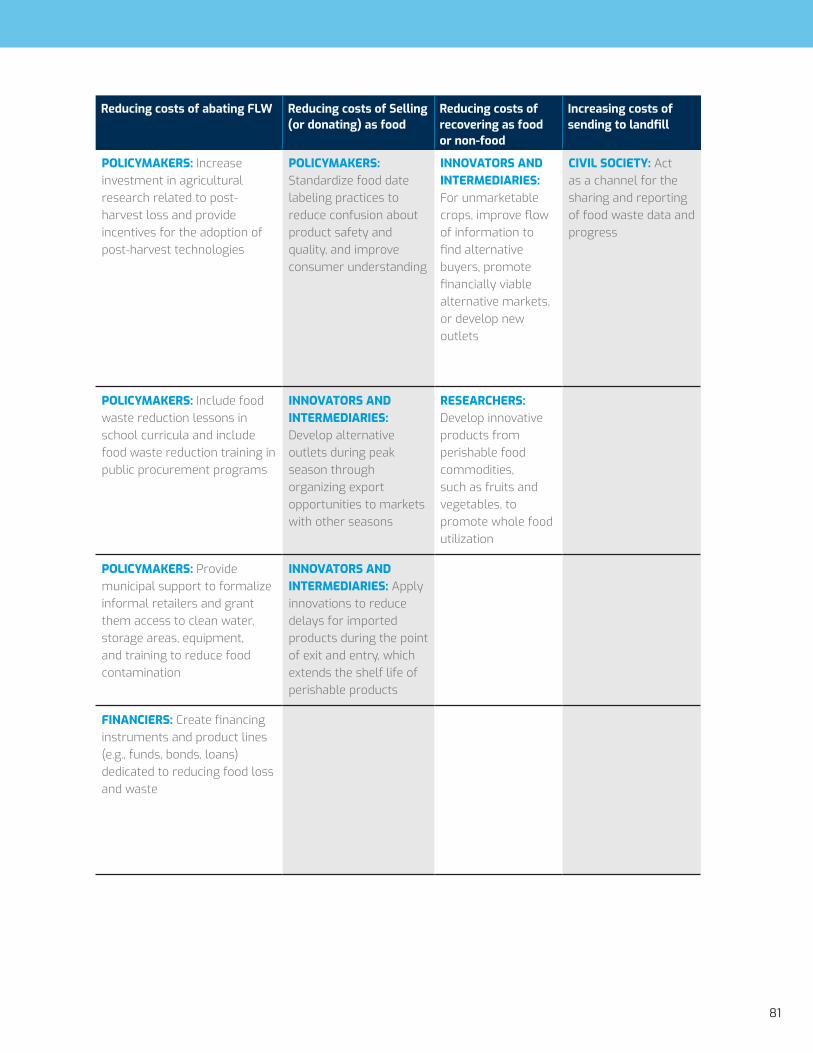
81
Reducing costs of abating FLW Reducing costs of Selling (or donating) as food
Reducing costs of recovering as food or non-food
Increasing costs of sending to landfill
POLICYMAKERS: Increase investment in agricultural research related to post-harvest loss and provide incentives for the adoption of post-harvest technologies
POLICYMAKERS: Standardize food date labeling practices to reduce confusion about product safety and quality, and improve consumer understanding
INNOVATORS AND INTERMEDIARIES: For unmarketable crops, improve flow of information to find alternative buyers, promote financially viable alternative markets, or develop new outlets
CIVIL SOCIETY: Act as a channel for the sharing and reporting of food waste data and progress
POLICYMAKERS: Include food waste reduction lessons in school curricula and include food waste reduction training in public procurement programs
INNOVATORS AND INTERMEDIARIES: Develop alternative outlets during peak season through organizing export opportunities to markets with other seasons
RESEARCHERS: Develop innovative products from perishable food commodities, such as fruits and vegetables, to promote whole food utilization
POLICYMAKERS: Provide municipal support to formalize informal retailers and grant them access to clean water, storage areas, equipment, and training to reduce food contamination
INNOVATORS AND INTERMEDIARIES: Apply innovations to reduce delays for imported products during the point of exit and entry, which extends the shelf life of perishable products
FINANCIERS: Create financing instruments and product lines (e.g., funds, bonds, loans) dedicated to reducing food loss and waste
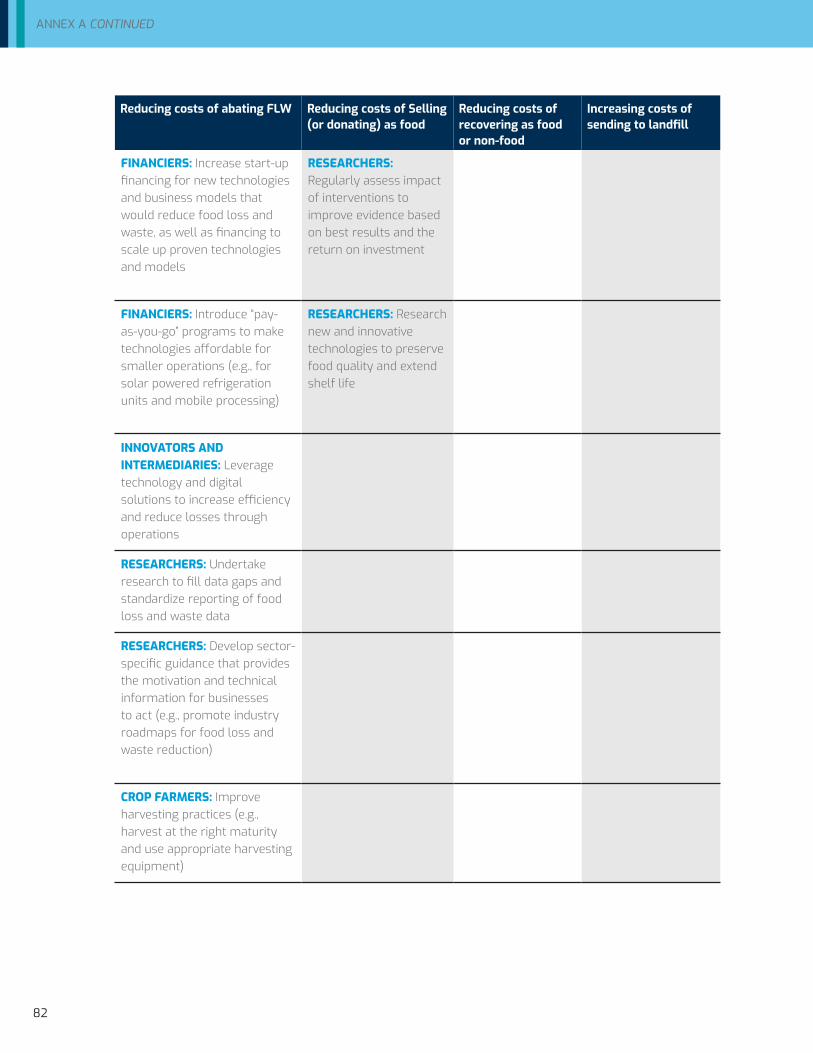
82
ANNEX A CONTINUED
Reducing costs of abating FLW Reducing costs of Selling (or donating) as food
Reducing costs of recovering as food or non-food
Increasing costs of sending to landfill
FINANCIERS: Increase start-up financing for new technologies and business models that would reduce food loss and waste, as well as financing to scale up proven technologies and models
RESEARCHERS: Regularly assess impact of interventions to improve evidence based on best results and the return on investment
FINANCIERS: Introduce “pay-as-you-go” programs to make technologies affordable for smaller operations (e.g., for solar powered refrigeration units and mobile processing)
RESEARCHERS: Research new and innovative technologies to preserve food quality and extend shelf life
INNOVATORS AND INTERMEDIARIES: Leverage technology and digital solutions to increase efficiency and reduce losses through operations
RESEARCHERS: Undertake research to fill data gaps and standardize reporting of food loss and waste data
RESEARCHERS: Develop sector-specific guidance that provides the motivation and technical information for businesses to act (e.g., promote industry roadmaps for food loss and waste reduction)
CROP FARMERS: Improve harvesting practices (e.g., harvest at the right maturity and use appropriate harvesting equipment)

83
Reducing costs of abating FLW Reducing costs of Selling (or donating) as food
Reducing costs of recovering as food or non-food
Increasing costs of sending to landfill
CROP FARMERS: Improve skills or use tools to better schedule harvesting (including accessing better data on weather)
FISHERS: Identify (or create) markets for unavoidable bycatch (e.g., animal feed or processed products).
CROP FARMERS: Engage customers (e.g., wholesalers, retailers) to communicate implications of order changes
PRODUCTIONTRANSPORT,
HANDLING, AND STORAGE
PROCESSING WHOLESALE AND RETAIL CONSUMERS
RANCHERS AND ANIMAL FARMERS: Build capacity in practices to reduce losses (e.g., reduce milk spills, minimize contamination)
FISHERS: Identify (or create) markets for unavoidable bycatch (e.g., animal feed or processed products
CROP FARMERS: Engage customers to communicate implications of order changes and explore changes in quality specifications to enable more sales.
POLICYMAKERS AND FINANCIERS: Facilitating implementation of agriculture insurance
RANCHERS AND ANIMAL FARMERS: Implement best practices in animal welfare to avoid stress and injuries that can reduce the shelf life of meat from animals
POLICYMAKERS AND RESEARCHERS: Cooperation to establish early warning systems to reduce the impact of climatic conditions
CROP FARMERS: Identify financially viable alternative markets or use for crops otherwise left in the field
CROP FARMERS: Identify financially viable alternative markets or use for alternative products for non-food parts of crops
PRODUCERS: Promote the formation of cooperatives for shared storage and climate and market data

84
ANNEX A CONTINUED
Reducing costs of abating FLW Reducing costs of Selling (or donating) as food
Reducing costs of recovering as food or non-food
Increasing costs of sending to landfill
PRODUCTIONTRANSPORT,
HANDLING, AND STORAGE
PROCESSING WHOLESALE AND RETAIL CONSUMERS
PACKINGHOUSES: Adopt best practices to provide the clean, cool, and/or dry conditions required to reduce postharvest losses
CROP FARMERS: Improve training in best practices (e.g., handling to reduce damage, drying, fumigation treatments, and on-farm processing)
TRANSPORTATION AND LOGISTICS PROVIDERS: Create access to alternative markets for products that cannot be marketed
TRANSPORTATION AND LOGISTICS PROVIDERS: Work upstream with customers to provide planning tools and handling and storage technologies that help them reduce losses
PACKINGHOUSES: Reexamine handling and storage practices to reduce damage (e.g., use liners in wood and basket containers, reduce the size of sacks or crates)
POLICYMAKERS AND INNOVATORS: Establish aggregation centers that provide adequate storage and preservation options, such as cooling chambers.
PACKINGHOUSES: Build near-farm facilities to convert unmarketable crops and by-products into value-added products
TRANSPORTATION AND LOGISTICS PROVIDERS: Improve handling practices during loading and unloading
FISHERS: Improve temperature management, handling, and preservation techniques
STORAGE PROVIDERS: Adopt low-cost storage and handling technologies that prevent spoilage and increase shelf life
RANCHERS AND ANIMAL FARMERS: Improve handling and preservation options (e.g., milk collection centers with cooling tanks). Improve conditions during transportation of food-producing animals from farm to markets

85
Reducing costs of abating FLW Reducing costs of Selling (or donating) as food
Reducing costs of recovering as food or non-food
Increasing costs of sending to landfill
STORAGE PROVIDERS: Work with intended users and community experts to design and produce locally relevant storage solutions
STORAGE PROVIDERS: Use storage containers that protect against temperature variations, humidity and precipitation, and insect and rodent infestation
TRANSPORTATION AND LOGISTICS PROVIDERS: Use technology innovations to improve the flow of information (e.g., about road and traffic conditions, as well as timing of pickup and delivery) to optimize movement of food
TRANSPORTATION AND LOGISTICS PROVIDERS: Introduce (or expand) energy-efficient, clean, low-carbon cold chains from farm to wholesalers
POLICYMAKERS AND ORGANIZATIONS: Review investment opportunities and policy options to increase the uptake of efficient cold chains, along with other climate technologies
PRODUCTIONTRANSPORT,
HANDLING, AND STORAGE
PROCESSING WHOLESALE AND RETAIL CONSUMERS
PROCESSORS AND MANUFACTURES (OPERATIONS-RELATED): Improve training of staff to reduce technical malfunctions and errors during processing
PROCESSORS AND MANUFACTURES (OPERATIONS-RELATED): Reengineer production processes and product design to reduce waste during product line changeovers
PROCESSORS AND MANUFACTURES (CUSTOMER-RELATED): Develop new food products or secondary uses (e.g., animal feed or other value-added products) from what cannot be marketed (e.g., spent grains, fruit trimmings, vegetable peels)
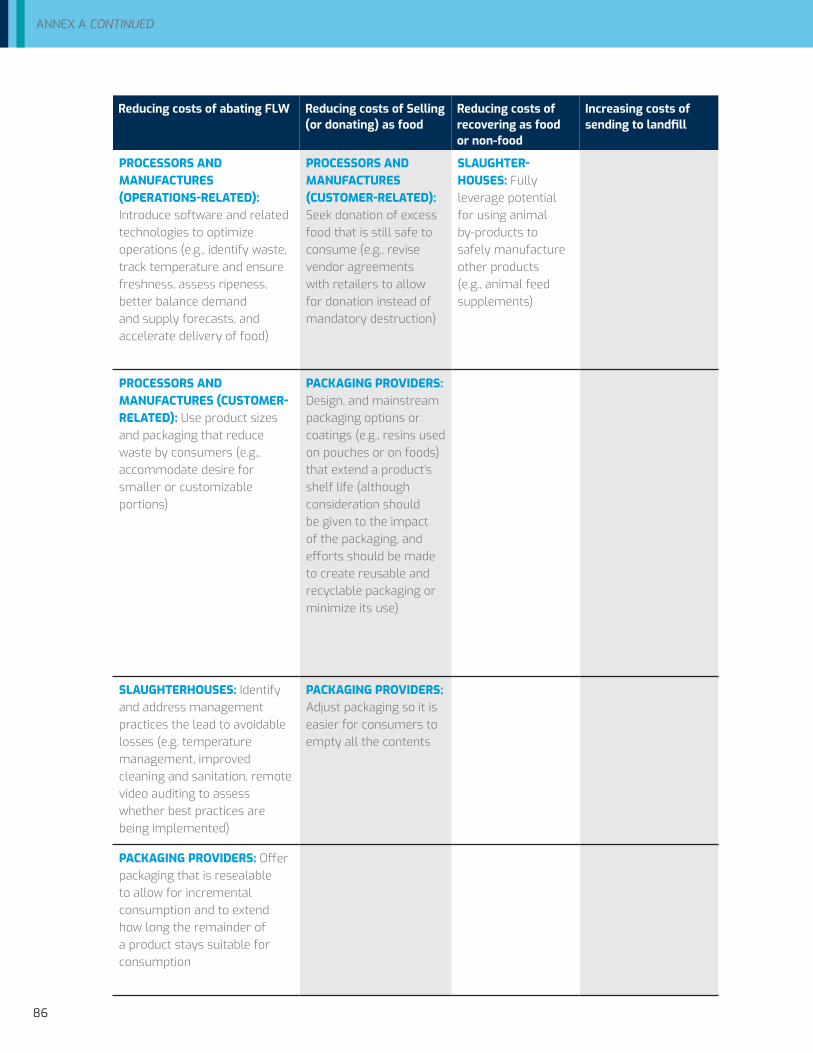
86
ANNEX A CONTINUED
Reducing costs of abating FLW Reducing costs of Selling (or donating) as food
Reducing costs of recovering as food or non-food
Increasing costs of sending to landfill
PROCESSORS AND MANUFACTURES (OPERATIONS-RELATED): Introduce software and related technologies to optimize operations (e.g., identify waste, track temperature and ensure freshness, assess ripeness, better balance demand and supply forecasts, and accelerate delivery of food)
PROCESSORS AND MANUFACTURES (CUSTOMER-RELATED): Seek donation of excess food that is still safe to consume (e.g., revise vendor agreements with retailers to allow for donation instead of mandatory destruction)
SLAUGHTER- HOUSES: Fully leverage potential for using animal by-products to safely manufacture other products (e.g., animal feed supplements)
PROCESSORS AND MANUFACTURES (CUSTOMER-RELATED): Use product sizes and packaging that reduce waste by consumers (e.g., accommodate desire for smaller or customizable portions)
PACKAGING PROVIDERS: Design, and mainstream packaging options or coatings (e.g., resins used on pouches or on foods) that extend a product’s shelf life (although consideration should be given to the impact of the packaging, and efforts should be made to create reusable and recyclable packaging or minimize its use)
SLAUGHTERHOUSES: Identify and address management practices the lead to avoidable losses (e.g. temperature management, improved cleaning and sanitation, remote video auditing to assess whether best practices are being implemented)
PACKAGING PROVIDERS: Adjust packaging so it is easier for consumers to empty all the contents
PACKAGING PROVIDERS: Offer packaging that is resealable to allow for incremental consumption and to extend how long the remainder of a product stays suitable for consumption

87
Reducing costs of abating FLW Reducing costs of Selling (or donating) as food
Reducing costs of recovering as food or non-food
Increasing costs of sending to landfill
PRODUCTIONTRANSPORT,
HANDLING, AND STORAGE
PROCESSING WHOLESALE AND RETAIL CONSUMERS
WHOLESALERS: Build capacity for beter handling and storage practices and expand cold storage systems.
WHOLESALERS: Find food rescue partners or establish online marketplaces that facilitate sale or donation of rejected shipments or short-life products
WHOLESALERS: Use backhauling (or other logistics solutions) to enable return of reusable storage containers or rescue of surplus food for people in need
WHOLESALERS: Invest in technologies to track temperature and ensure freshness, streamline routing, track movement of goods in and out of warehouses, and monitor food loss and waste
RETAILERS (FORMAL) – CONSUMERS RELATED: Redesign in-store merchandising to avoid excessive handling of products by consumers (e.g., sort by stage of maturity), and to achieve the desired appearance of abundance but with less damage and excess product (e.g., through smaller bins and bowls)
RETAILERS (FORMAL) – OPERATIONS RELATED: Improve training of staff in temperature management, product handling, and stock rotation as well as optimize inventory management
RETAILERS (INFORMAL): Take advantage of municipal support to access clean water, storage areas, equipment that improves food safety and training in how to reduce food contamination
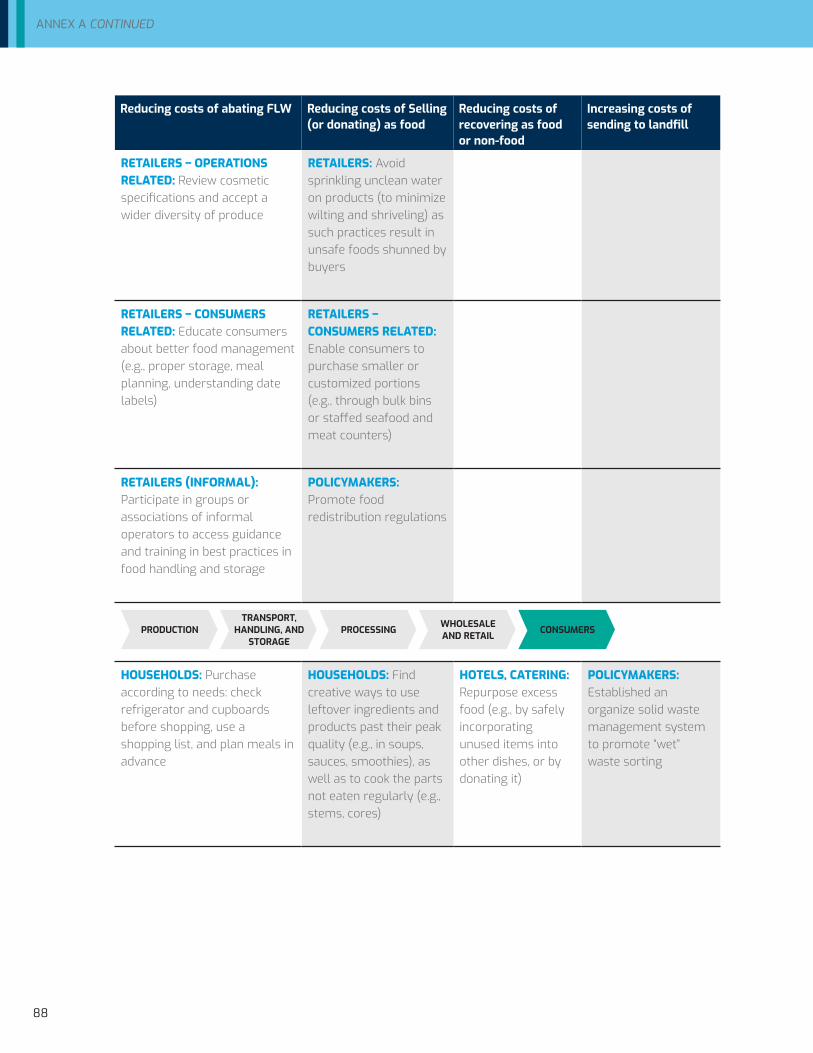
88
ANNEX A CONTINUED
Reducing costs of abating FLW Reducing costs of Selling (or donating) as food
Reducing costs of recovering as food or non-food
Increasing costs of sending to landfill
RETAILERS – OPERATIONS RELATED: Review cosmetic specifications and accept a wider diversity of produce
RETAILERS: Avoid sprinkling unclean water on products (to minimize wilting and shriveling) as such practices result in unsafe foods shunned by buyers
RETAILERS – CONSUMERS RELATED: Educate consumers about better food management (e.g., proper storage, meal planning, understanding date labels)
RETAILERS – CONSUMERS RELATED: Enable consumers to purchase smaller or customized portions (e.g., through bulk bins or staffed seafood and meat counters)
RETAILERS (INFORMAL): Participate in groups or associations of informal operators to access guidance and training in best practices in food handling and storage
POLICYMAKERS: Promote food redistribution regulations
PRODUCTIONTRANSPORT,
HANDLING, AND STORAGE
PROCESSING WHOLESALE AND RETAIL CONSUMERS
HOUSEHOLDS: Purchase according to needs: check refrigerator and cupboards before shopping, use a shopping list, and plan meals in advance
HOUSEHOLDS: Find creative ways to use leftover ingredients and products past their peak quality (e.g., in soups, sauces, smoothies), as well as to cook the parts not eaten regularly (e.g., stems, cores)
HOTELS, CATERING: Repurpose excess food (e.g., by safely incorporating unused items into other dishes, or by donating it)
POLICYMAKERS: Established an organize solid waste management system to promote “wet” waste sorting

89
Reducing costs of abating FLW Reducing costs of Selling (or donating) as food
Reducing costs of recovering as food or non-food
Increasing costs of sending to landfill
HOUSEHOLDS: Seek instruction on date labels
RESTAURANTS: Shift away from preparation methods such as batch cooking, casserole trays, and buffets to reduce overproduction and repurpose excess food
POLICYMAKERS AND PRIVATE-SECTOR: Seek joint projects for waste-to-energy plants, anaerobic digestion and composting plants
HOUSEHOLDS: Freeze or preserve food before it spoils, store appropriately different foods so they stay fresh and safe longer, and organize kitchen and refrigerator to prevent waste
HOTELS, CATERING: Repurpose excess food (e.g., by safely incorporating unused items into other dishes, or by donating it)
POLICYMAKERS: Consider financial incentives or deterrents for retailers that discard unspoiled food
RESTAURANTS, INSTITUTIONS: Revisit inventory management and purchasing/ procurement practices (as well as menus) to better fit needs based on historical trends and waste data
CATERING: Evaluate contractual obligations between clients and suppliers that generate waste and overproduction (e.g., contracts that stipulate that all hot dishes must be available for the full-service period)
RESTAURANTS, HOTELS, CATERING, AND INSTITUTIONS: Engage staff on food waste reduction
HOTELS: Rethink the buffet (e.g., shift certain items to a la carte near end of mealtimes, reduce the size of dishes used in buffets)
RESTAURANTS, INSTITUTIONS: Use scales in the kitchen to weigh food and track items most commonly wasted (and estimate the financial cost of food disposed, thus creating a financial signal to waste less)
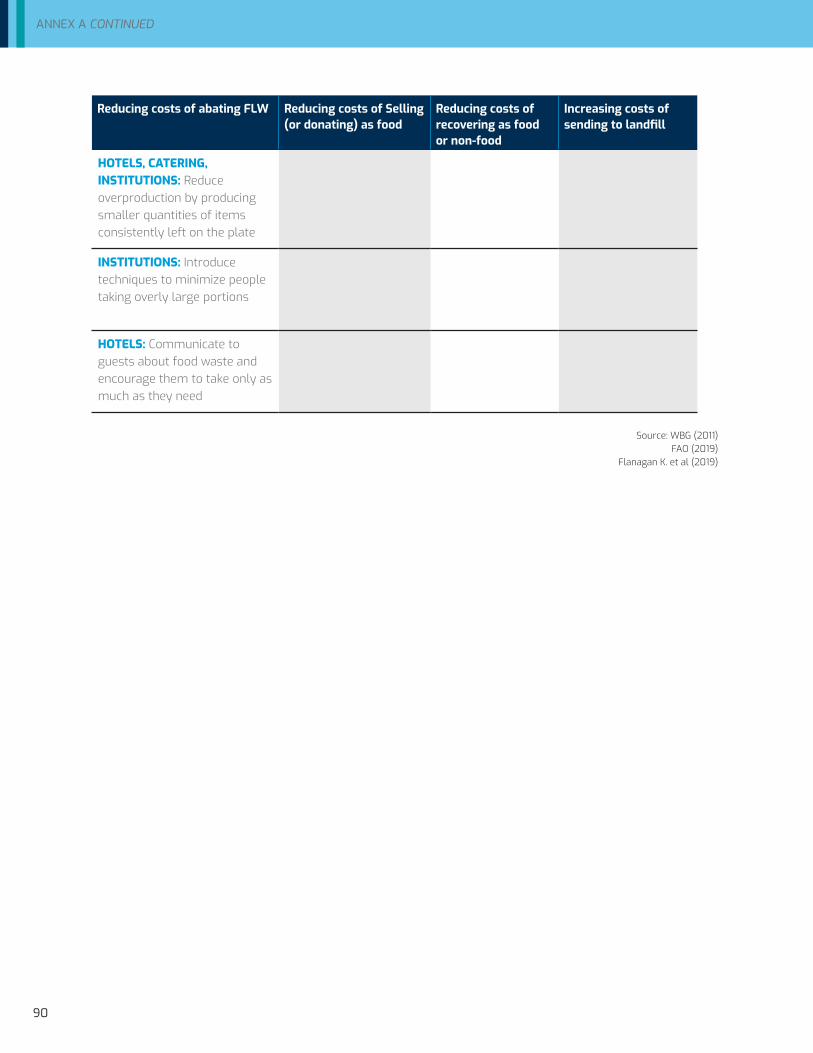
90
ANNEX A CONTINUED
Reducing costs of abating FLW Reducing costs of Selling (or donating) as food
Reducing costs of recovering as food or non-food
Increasing costs of sending to landfill
HOTELS, CATERING, INSTITUTIONS: Reduce overproduction by producing smaller quantities of items consistently left on the plate
INSTITUTIONS: Introduce techniques to minimize people taking overly large portions
HOTELS: Communicate to guests about food waste and encourage them to take only as much as they need
Source: WBG (2011)FAO (2019)
Flanagan K. et al (2019)

91
Annex B. Model Simulation Results
CLOSED ECONOMY (MODEL 1)
Fruit
Welfare impacts of a cut of 0 .02953 million ton at each stage of the supply chain for fruit in a closed economy
Food Away from home At home Farm THS Processor Retailer services consumption consumption Policy Objective: (αF↓) (αT↓) (αP↓) (αR↓) (αH)↓ (αA↓) (αC↓)
Farm production -0.15 -0.14 -0.13 -0.12 -0.04 0.01 -0.13
Farm welfare -0.35 -0.32 -0.29 -0.26 -0.08 0.01 -0.29
Food consumption 0.44 0.48 0.53 0.53 0.95 1.04 0.90
Consumer food price -0.53 -0.57 -0.63 -0.86 -0.03 0.00 -0.11
Total GHGs -0.35 -0.35 -0.43 -0.50 -0.62 -0.61 -0.74
Total Quantity FLW -0.73 -0.74 -0.76 -0.74 -0.99 -0.99 -1.13
Total value FLW -0.8 -0.9 -1.02 -1.21 -1.09 -1.41 -1.55
Chicken
Welfare impacts of a cut of 0 .01187 million tons per stage of the supply chain for chicken in a closed economy
Food Away from home At home Farm THS Processor Retailer services consumption consumption Policy Objective: (αF↓) (αT↓) (αP↓) (αR↓) (αH)↓ (αA↓) (αC↓)
Farm production -0.24 -0.23 -0.30 -0.22 -0.25 0.06 -0.20
Farm welfare -0.71 -0.69 -0.88 -0.67 -0.74 0.19 -0.61
Food consumption 0.27 0.28 0.37 0.36 0.68 1.01 0.75
Consumer food price -0.34 -0.35 -0.45 -0.82 -0.17 0.04 -0.14
Total GHGs -0.23 -0.22 -0.33 -0.26 -0.32 -0.05 -0.32
Total Quantity FLW -0.77 -0.77 -0.99 -0.84 -1.22 -0.94 -1.20
Total value FLW -0.67 -0.7 -0.76 -1.17 -1.47 -1.89 -2.24
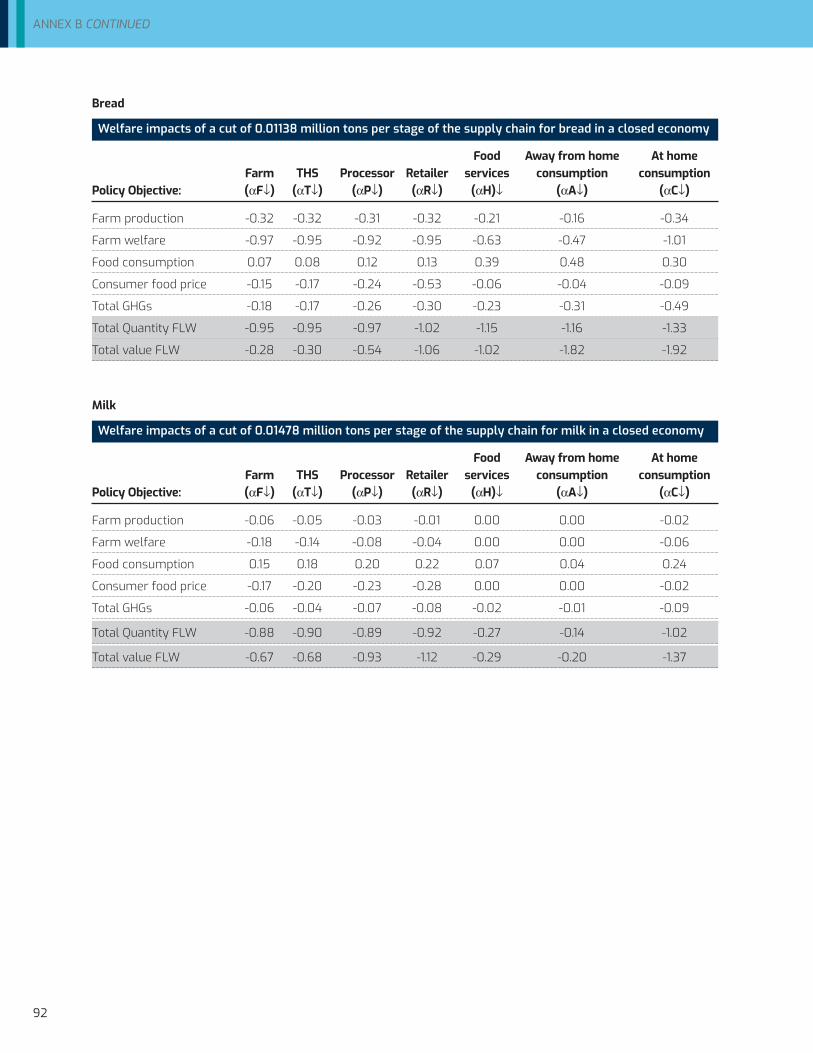
92
ANNEX B CONTINUED
Bread
Welfare impacts of a cut of 0 .01138 million tons per stage of the supply chain for bread in a closed economy
Food Away from home At home Farm THS Processor Retailer services consumption consumption Policy Objective: (αF↓) (αT↓) (αP↓) (αR↓) (αH)↓ (αA↓) (αC↓)
Farm production -0.32 -0.32 -0.31 -0.32 -0.21 -0.16 -0.34
Farm welfare -0.97 -0.95 -0.92 -0.95 -0.63 -0.47 -1.01
Food consumption 0.07 0.08 0.12 0.13 0.39 0.48 0.30
Consumer food price -0.15 -0.17 -0.24 -0.53 -0.06 -0.04 -0.09
Total GHGs -0.18 -0.17 -0.26 -0.30 -0.23 -0.31 -0.49
Total Quantity FLW -0.95 -0.95 -0.97 -1.02 -1.15 -1.16 -1.33
Total value FLW -0.28 -0.30 -0.54 -1.06 -1.02 -1.82 -1.92
Milk
Welfare impacts of a cut of 0 .01478 million tons per stage of the supply chain for milk in a closed economy
Food Away from home At home Farm THS Processor Retailer services consumption consumption Policy Objective: (αF↓) (αT↓) (αP↓) (αR↓) (αH)↓ (αA↓) (αC↓)
Farm production -0.06 -0.05 -0.03 -0.01 0.00 0.00 -0.02
Farm welfare -0.18 -0.14 -0.08 -0.04 0.00 0.00 -0.06
Food consumption 0.15 0.18 0.20 0.22 0.07 0.04 0.24
Consumer food price -0.17 -0.20 -0.23 -0.28 0.00 0.00 -0.02
Total GHGs -0.06 -0.04 -0.07 -0.08 -0.02 -0.01 -0.09
Total Quantity FLW -0.88 -0.90 -0.89 -0.92 -0.27 -0.14 -1.02
Total value FLW -0.67 -0.68 -0.93 -1.12 -0.29 -0.20 -1.37

93
LARGE OPEN ECONOMY (MODEL 2)
Fruit
Welfare impacts of a cut of 0 .02953 million tons per stage of the supply chain for fruit in a large open economy
Food Away from home At home Farm THS Processor Retailer services consumption consumption Policy Objective: (αF↓) (αT↓) (αP↓) (αR↓) (αH)↓ (αA↓) (αC↓)
Farm production 0.43 0.49 -0.09 -0.09 -0.03 0.00 -0.10
Farm welfare 0.96 1.10 -0.21 -0.19 -0.06 0.01 -0.21
Food consumption 0.03 0.04 0.50 0.51 0.95 1.04 0.88
Consumer food price -0.04 -0.04 -0.60 -0.84 -0.02 0.00 -0.08
Value of Trade -0.14 -0.15 -0.26 -0.24 -0.07 0.01 -0.27
Total GHGs -0.75 -0.78 -0.46 -0.52 -0.63 -0.61 -0.77
Total Quantity FLW -0.88 -0.88 -1.14 -0.86 -1.24 -0.93 -1.22
Total value FLW -0.64 -0.74 -1.01 -1.20 -1.08 -1.41 -1.54
Chicken
Welfare impacts of a cut of 0 .01187 million tons per stage of the supply chain for chicken in a large open economy
Food Away from home At home Farm THS Processor Retailer services consumption consumption Policy Objective: (αF↓) (αT↓) (αP↓) (αR↓) (αH)↓ (αA↓) (αC↓)
Farm production -0.04 -0.03 -0.03 -0.20 -0.21 0.05 -0.18
Farm welfare -0.12 -0.08 -0.10 -0.59 -0.64 0.16 -0.53
Food consumption 0.16 0.17 0.22 0.34 0.66 1.02 0.73
Consumer food price -0.20 -0.21 -0.27 -0.80 -0.15 0.04 -0.12
Value of Trade -0.86 -0.90 -1.16 -0.58 -0.63 0.16 -0.52
Total GHGs -0.34 -0.34 -0.47 -0.28 -0.34 -0.05 -0.33
Total Quantity FLW -0.88 -0.88 -1.14 -0.86 -1.24 -0.93 -1.22
Total value FLW -0.57 -0.60 -0.63 -1.16 -1.45 -1.90 -2.24

94
ANNEX B CONTINUED
Bread
Welfare impacts of a cut of 0 .01138 million tons per stage of the supply chain for bread in a large open economy
Food Away from home At home Farm THS Processor Retailer services consumption consumption Policy Objective: (αF↓) (αT↓) (αP↓) (αR↓) (αH)↓ (αA↓) (αC↓)
Farm production -0.24 -0.23 -0.20 -0.28 -0.19 -0.14 -0.30
Farm welfare -0.73 -0.67 -0.58 -0.84 -0.56 -0.42 -0.89
Food consumption 0.06 0.07 0.10 0.13 0.38 0.48 0.29
Consumer food price -0.12 -0.14 -0.21 -0.52 -0.05 -0.04 -0.08
Value of Trade -0.83 -0.96 -1.27 -0.53 -0.35 -0.26 -0.56
Total GHGs -0.19 -0.19 -0.28 -0.31 -0.24 -0.31 -0.50
Total Quantity FLW -0.96 -0.96 -0.98 -1.03 -1.15 -1.16 -1.34
Total value FLW -0.27 -0.28 -0.52 -1.05 -1.01 -1.82 -1.91
Milk
Welfare impacts of a cut of 0 .01478 million tons per stage of the supply chain for milk in a large open economy
Food Away from home At home Farm THS Processor Retailer services consumption consumption Policy Objective: (αF↓) (αT↓) (αP↓) (αR↓) (αH)↓ (αA↓) (αC↓)
Farm production -0.05 -0.04 -0.02 -0.01 0.00 0.00 -0.02
Farm welfare -0.16 -0.11 -0.07 -0.04 0.00 0.00 -0.06
Food consumption 0.14 0.17 0.19 0.22 0.07 0.04 0.24
Consumer food price -0.17 -0.20 -0.22 -0.28 0.00 0.00 -0.02
Value of Trade 0.50 0.58 0.43 0.04 0.00 0.00 0.06
Total GHGs -0.06 -0.05 -0.07 -0.08 -0.02 -0.01 -0.09
Total Quantity FLW -0.88 -0.91 -0.89 -0.92 -0.27 -0.14 -1.02
Total value FLW -0.66 -0.68 -0.93 -1.12 -0.29 -0.20 -1.37
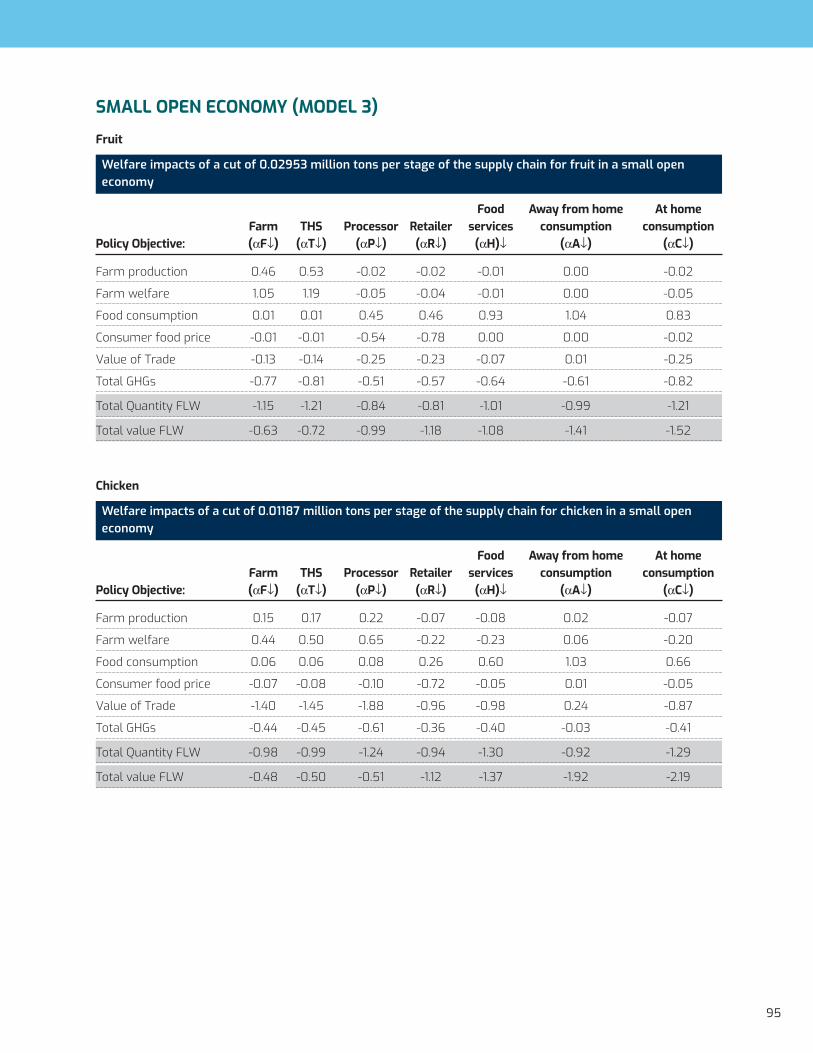
95
SMALL OPEN ECONOMY (MODEL 3)
Fruit
Welfare impacts of a cut of 0 .02953 million tons per stage of the supply chain for fruit in a small open economy
Food Away from home At home Farm THS Processor Retailer services consumption consumption Policy Objective: (αF↓) (αT↓) (αP↓) (αR↓) (αH)↓ (αA↓) (αC↓)
Farm production 0.46 0.53 -0.02 -0.02 -0.01 0.00 -0.02
Farm welfare 1.05 1.19 -0.05 -0.04 -0.01 0.00 -0.05
Food consumption 0.01 0.01 0.45 0.46 0.93 1.04 0.83
Consumer food price -0.01 -0.01 -0.54 -0.78 0.00 0.00 -0.02
Value of Trade -0.13 -0.14 -0.25 -0.23 -0.07 0.01 -0.25
Total GHGs -0.77 -0.81 -0.51 -0.57 -0.64 -0.61 -0.82
Total Quantity FLW -1.15 -1.21 -0.84 -0.81 -1.01 -0.99 -1.21
Total value FLW -0.63 -0.72 -0.99 -1.18 -1.08 -1.41 -1.52
Chicken
Welfare impacts of a cut of 0 .01187 million tons per stage of the supply chain for chicken in a small open economy
Food Away from home At home Farm THS Processor Retailer services consumption consumption Policy Objective: (αF↓) (αT↓) (αP↓) (αR↓) (αH)↓ (αA↓) (αC↓)
Farm production 0.15 0.17 0.22 -0.07 -0.08 0.02 -0.07
Farm welfare 0.44 0.50 0.65 -0.22 -0.23 0.06 -0.20
Food consumption 0.06 0.06 0.08 0.26 0.60 1.03 0.66
Consumer food price -0.07 -0.08 -0.10 -0.72 -0.05 0.01 -0.05
Value of Trade -1.40 -1.45 -1.88 -0.96 -0.98 0.24 -0.87
Total GHGs -0.44 -0.45 -0.61 -0.36 -0.40 -0.03 -0.41
Total Quantity FLW -0.98 -0.99 -1.24 -0.94 -1.30 -0.92 -1.29
Total value FLW -0.48 -0.50 -0.51 -1.12 -1.37 -1.92 -2.19
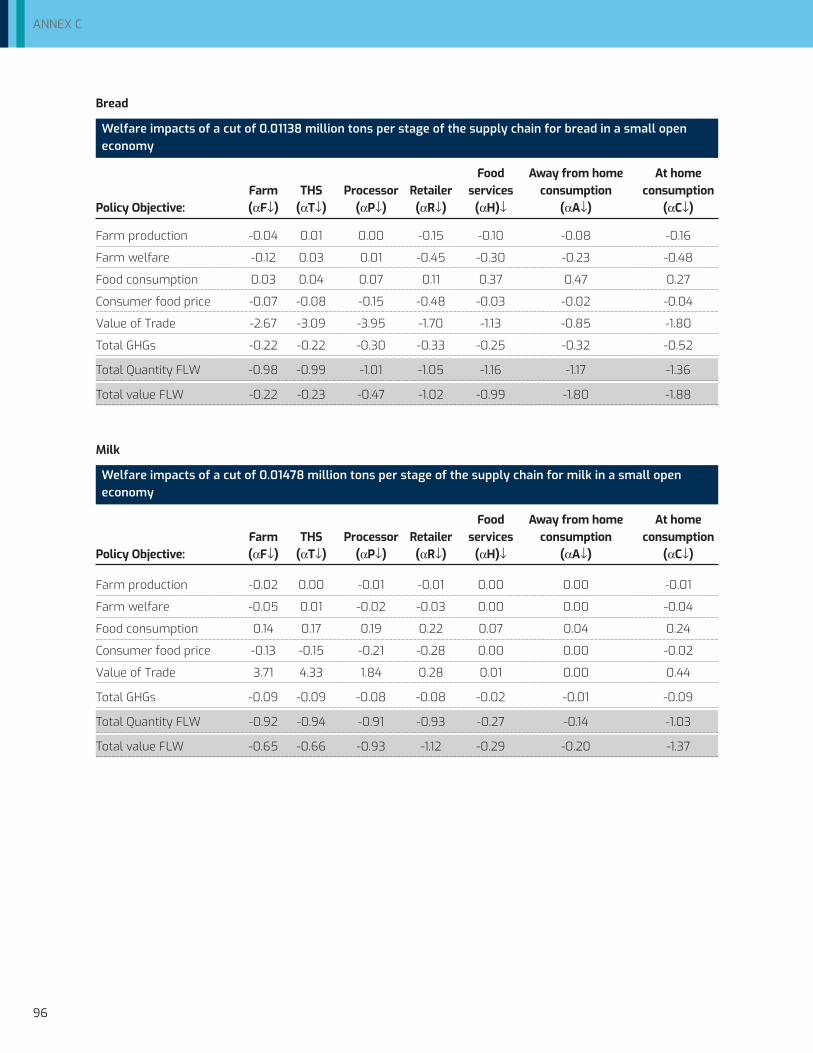
96
ANNEX C
Bread
Welfare impacts of a cut of 0 .01138 million tons per stage of the supply chain for bread in a small open economy
Food Away from home At home Farm THS Processor Retailer services consumption consumption Policy Objective: (αF↓) (αT↓) (αP↓) (αR↓) (αH)↓ (αA↓) (αC↓)
Farm production -0.04 0.01 0.00 -0.15 -0.10 -0.08 -0.16
Farm welfare -0.12 0.03 0.01 -0.45 -0.30 -0.23 -0.48
Food consumption 0.03 0.04 0.07 0.11 0.37 0.47 0.27
Consumer food price -0.07 -0.08 -0.15 -0.48 -0.03 -0.02 -0.04
Value of Trade -2.67 -3.09 -3.95 -1.70 -1.13 -0.85 -1.80
Total GHGs -0.22 -0.22 -0.30 -0.33 -0.25 -0.32 -0.52
Total Quantity FLW -0.98 -0.99 -1.01 -1.05 -1.16 -1.17 -1.36
Total value FLW -0.22 -0.23 -0.47 -1.02 -0.99 -1.80 -1.88
Milk
Welfare impacts of a cut of 0 .01478 million tons per stage of the supply chain for milk in a small open economy
Food Away from home At home Farm THS Processor Retailer services consumption consumption Policy Objective: (αF↓) (αT↓) (αP↓) (αR↓) (αH)↓ (αA↓) (αC↓)
Farm production -0.02 0.00 -0.01 -0.01 0.00 0.00 -0.01
Farm welfare -0.05 0.01 -0.02 -0.03 0.00 0.00 -0.04
Food consumption 0.14 0.17 0.19 0.22 0.07 0.04 0.24
Consumer food price -0.13 -0.15 -0.21 -0.28 0.00 0.00 -0.02
Value of Trade 3.71 4.33 1.84 0.28 0.01 0.00 0.44
Total GHGs -0.09 -0.09 -0.08 -0.08 -0.02 -0.01 -0.09
Total Quantity FLW -0.92 -0.94 -0.91 -0.93 -0.27 -0.14 -1.03
Total value FLW -0.65 -0.66 -0.93 -1.12 -0.29 -0.20 -1.37

97
Annex C. Variables and NotationsItem modeled Model notation
Rates of loss or waste
Farm production loss : αF
THS loss : αT
Processor loss : αP
Retail loss : αR
HRI loss : αH
Away-consumption waste : αA
At-home consumption waste : αC
Margins (pounds - £ - per kg or per liter)
THS : mT
Processor : m PRetail : m R
HRI : m H
Quantities
Gross farm production : qF
Farm sales (= THS purchases) : qTS = (1-αF) ∙ qF
THS sales (= processor purchases) : qT = (1-αT) ∙ qTS
Processor sales (= retail purchases) : qP = (1-αP) ∙ qT
Retail sales (= consumption purchases) : qR = RSH ∙ (1-αR) ∙ qP
At-home consumption : qC = (1-αC) ∙ qR
HRI sales (= away from home purchases) : qH = (1-RSH)∙(1-αH) ∙qP
Away-from-home consumption : qA = (1-αA) ∙ qH
Prices
Effective farm production price : PEF = (1-αF) ∙ PF
Farm sales price : PF
THS sales price : PT = PF / (1-αT) + mT
Processor sales price : PP = PT / (1-αP) + mP
Retail price = at-home purchase price : PR = PP / (1-αR) + mR
HRI price = away-home purchase price : PH = PP / (1-αH) + mH
Effective at-home consumption price : PC = PR / (1-αC)
Effective away-home consumption price : PA = PH / (1-αA)

98
ANNEX C CONTINUED
Farm loss : WF = αF ∙ qF
THS loss : WT = αT ∙ qTS
Processor loss : WP = αP ∙ qT
Retail loss : WR = αR∙qP∙RSH∙qP
HRI loss : WH = αH∙qP∙(1-RSH)∙qP
At-home consumption waste : WC = αC ∙ qR
Away-home consumption waste : WA = αA ∙ qH
Total loss and waste : WTOTAL
Total quantities of loss and waste (million tonnes)
Farm loss : KF
Consumer waste : KC
Total FLW : KT
Farm welfare : WEF
Effective consumption costs : CE
Net value exports : VNX
Total FLW elasticity w.r.t.:
Gross farm production : %∆qF/%∆KT
Total farm welfare : %∆WEF/%∆KT
Effective consumption costs : %∆CE/%∆KT
Value of net exports : %∆VNX/%∆KT
Units cons per unit of FLW : qC+A/KT
∆ farm production / ∆ FLW : ∆qF/∆KT
Other equations
Production imported : M/qF
Consumer $ to farmer : PF/PR
At-home purchases : qR/qp
Production wasted : Wtotal/qF*
Prices continued

99
NOTATIONS ON GREENHOUSE GAS EMISSIONS
Greenhouse gas emissions (GHGEs) per unit product (kg of CO2 eq/kg of product)
Farm production : EF
THS : ET
Processor : EP
Retail/HRI : ER or EH
Consumption : EC or EA
Total : Etotal = ∑(EF, ET, EP, ER, (EA or EC)
Share of stage in GHG emissions
Agricultural impact : EF/ETOTAL
Post-harvest handling and storage : ET/ETOTAL
Processing and packaging : EP/ETOTAL
Distribution : ER or EH/ETOTAL
Consumption : EC or EA/ETOTAL
Total GHGEs production and consumption system wide (million tonnes CO2e)
Agricultural impact : qF ∙ EF
Post-harvest handling and storage : qTS ∙ ET
Processing and packaging : qPS ∙ EP
Retail : qRS ∙ ER
Out of home (preparation) : qHS ∙ ER
Out of home (consumption) : qA ∙ EA
Consumption at home : qC ∙ EC
Total : ₼total impact = ∑( qF∙EF, qTS∙ET, qPS∙EP, qRS∙ER, qHS∙ER, qA∙EA, qC∙EC)
Share of GHGE in each stage of total GHGEs
Agricultural impact : qF ∙ EF/₼total impact
Post-harvest handling and storage : qTS ∙ ET/₼total impact
Processing and packaging : qPS ∙ EP/₼total impact
Retail : qRS ∙ ER/₼total impact
Out of home (preparation) : qHS ∙ ER/₼total impact
Out of home (consumption) : qA ∙ EA/₼total impact
Consumption at home : qC ∙ EC/₼total impact

100
ANNEX C CONTINUED
Loss and waste GHGEs, accounted for where loss or waste
Agricultural impact : KF ∙ EF
Post-harvest handling and storage : KT ∙ ∑ (EF, ET)
Processing and packaging : KP ∙ ∑ (EF, ET, EP)
Retail : KR ∙ ∑ (EF, ET, EP, ER)
Out of home (preparation) : KHS ∙ ∑ (EF, ET, EP, ER)
Out of home (consumption) : KA ∙ ∑ (EF, ET, EP, ER, EC)
Consumption at home : KC ∙ ∑ (EF, ET, EP, ER, EC)
Total : ∑ (KF∙EF, KT∙∑(EF, ET), KR∙∑(EF, ET, EP), KHS∙∑(EF, ET, EP, ER), KA∙∑(EF, ET, EP, ER, EC), KC∙∑(EF, ET, EP, ER, EC)
Loss and waste GHGEs accounted where the emissions occur in the food system (system allocated) due to that loss or waste (million tonnes CO2e)
Agricultural impact : ∑ (KF, KT, KP, KR, KH, KA, KC)∙EF
Post-harvest handling and storage : ∑ (KT, KP, KR, KH, KA, KC) ∙ ET
Processing and packaging : ∑ (KP, KR, KH, KA, KC) ∙ EP
Retail : ∑ (KR, KC) ∙ ER
Out of home (preparation) : ∑ (KH, KA) ∙ ER
Out of home (consumption) : KA ∙ EA
Consumption at home : KC ∙ EC
Total : ∑ ((∑(KF, KT, KP, KR, KH, KA, KC)∙EF), (∑(KT, KP, KR, KH, KA, KC)∙ET), (∑(KP, KR, KH, KA, KC)∙EP), (∑(KR, KC)∙ER), (∑(KH, KA)∙ER), KA∙EA, KC∙EC
Scale of system allocated GHGEs FLW compared to total GHGE system wide at each level of the FSC
Agricultural impact : ∑(KF, KT, KP, KR, KH, KA, KC)·EF/qF·EF
Post-harvest handling and storage : ∑(KT, KP, KR, KH, KA, KC)·ET/qTS·ET
Processing and packaging : ∑(KP, KR, KH, KA, KC)·Ep/qPS·EP
Retail : ∑(KR, KC)·ER/qRS·ER
Out of home (preparation) : ∑(KH, KA)·ER/qHS·ER
Out of home (consumption) : KA·EA/qA·EA
Consumption at home : KC·EC/qC·EC

101
Annex D. The Theoretical And Numerical Model
Working papers by De Gorter, Harry, Dusan Brabik and David R. Just (2019) on a separate document to be provided upon request.
1. PART I: A Conceptual Framework to Analyze the Economics of Food Loss and Waste and Interventions
2. PART II: Analyzing the Economics of Food Loss and Waste Reductions in a Food Supply Chain
3. PART III: The Implications of an Endogenous Rate of Food Waste in Simulating Exogenous Shocks to the Food Supply Chain
4. PART IV: Section on GHGs and Food Waste
References 1. AGRA (2017). Africa Agriculture Status Report: The Business of Smallholder Agriculture in Sub-Saharan Africa
(Issue 5). Nairobi, Kenya: Alliance for a Green Revolution in Africa (AGRA). Issue No. 5
2. APHLIS — African Post-Harvest Losses Information System (2018). Rwanda maize and rice losses. https://www.aphlis.net/en#/
3. Baoua et al. (2012). Comparative evaluation of six storage methods for postharvest preservation of cowpea grain. J. Stored Prod. Res., 49, pp. 171-175. URL: https://www.sciencedirect.com/science/article/pii/S0022474X12000148
4. Biennial Report to the AU Assembly on implementing the June 2014 Malabo Declaration: 2017 Report to the Janu-ary 2018 Assembly — by Department of Rural Economy and Agriculture (DREA) of the African Union
5. Bloomberg (2018). Sustainable energy in America Factbook. Growth sectors of the US energy economy. Bloomberg New Energy Finance. The Business council for sustainable energy. URL: https://data.bloomberglp.com/bnef/sites/14/2018/02/Sustainable-Energy-in-America-2018-Factbook.pdf
6. Brun, Julien and Mattos, Roberto (2018). The shocking reality. Food Losses in Vietnam. CEL Consulting. URL: https://www.cel-consulting.com/single-post/2018/08/10/Food-Losses-in-Vietnam-the-shocking-reality
7. Campbell, B. M., et al. (2017). “Agriculture production as a major driver of the Earth system exceeding planetary boundaries”. Ecology and Society 22(4):8. URL: https://www.ecologyandsociety.org/vol22/iss4/art8/
8. Carbon Tracker (2018). 42% of global coal power plants run at a loss, finds world-first study. URL: https://www.carbontracker.org/42-of-global-coal-power-plants-run-at-a-loss-finds-world-first-study/
9. Carraz, René (2012). Improving science, technology and innovation governance to meet global challenges. In: OECD, Meeting Global Challenges through Better Governance: International Co-operation in Science, Technology and In-novation, OECD Publishing, Paris. URL: https://www.oecd-ilibrary.org/science-and-technology/meeting-global-chal-lenges-through-better-governance/improving-science-technology-and-innovation-governance-to-meet-glob-al-challenges_9789264178700-13-en
10. CCAFS (2018). Food Systems Finance Advantage: Enabling scaled climate action. Summary from a COP24 event. URL: https://ccafs.cgiar.org/news/food-systems-finance-advantage-enabling-scaled-climate-action#.XOL3Fo18BiV
11. Cernansky, Rachel. (2015). Combating food waste in Sub-Saharan Africa. Mongabay News & Inspira-tion from Nature’s frontline. Tanzania: April, 2015. URL: https://news.mongabay.com/2015/04/combat-ing-food-waste-in-sub-saharan-africa/
12. CFU — Climate Funds Update (2017). Bird, N., C. Watson and L. Schalatek. The Global Climate Finance Architecture. URL: https://www.odi.org/sites/odi.org.uk/files/resource-documents/11850.pdf
13. CDFA — Council of Development: Finance Agencies. Food Systems and development finance. URL: https://www.cdfa.net/cdfa/cdfaweb.nsf/pages/food-system-finance.html
14. Champions 12.3 (2019). The Business case for reducing food loss and waste: restaurants. URL: https://champi-ons123.org/the-business-case-for-reducing-food-loss-and-waste-restaurants/
15. Champions 12.3 (2018). The Business case for reducing food loss and waste: hotels. URL: https://champions123.org/the-business-case-for-reducing-food-loss-and-waste-hotels/
16. CIF — Climate Investment Funds (2009). Building partnerships for climate action. Climate Investment Funds Administrative Unit, The World Bank Group. URL: https://www.climateinvestmentfunds.org//sites/cif_enc/files/cif_annual_report_final_021810_0.pdf
102
REFERENCES CONTINUED
17. Climate Bonds Initiative (2018). 2018 Green Bond Market Summary. URL: https://www.climatebonds.net/resourc-es/reports/2018-green-bond-market-highlights
18. Commission for Environmental Cooperation (CEC) (2017). Characterization and Management of Food Loss and Waste in North America. Canada. URL: http://www3.cec.org/islandora/fr/item/11774-characterization-and-manage-ment-food-waste-in-north-america-foundational-report-en.pdf
19. Costa, S. (2014). Reducing food losses in Sub-Saharan Africa (improving post-harvest management and storage technologies of smallholder farmers). UN World Food Programme. Uganda. URL: https://documents.wfp.org/stellent/groups/public/documents/special_initiatives/WFP265205.pdf
20. CPI — Climate Policy Initiative (2017). Global Landscape of Climate Finance 2017. B. Buchner, et al. URL: https://cli-matepolicyinitiative.org/wp-content/uploads/2017/10/2017-Global-Landscape-of-Climate-Finance.pdf
21. CPI — Climate Policy Initiative (2016). The role of the Climate Investment Funds in meeting investment needs. Chiara Trabacchi, Jessica Brown, et al. URL: http://climatepolicyinitiative.org/wp-content/uploads/2016/06/The-role-of-the-Climate-Investment-Funds-in-meeting-investment-needs.pdf
22. De Groote, et al. (2013). Effectiveness of hermetic systems in controlling maize storage pests in Kenya. J. Stored Prod. Res., 53, pp. 27-36. URL: https://www.sciencedirect.com/science/article/pii/S0022474X13000039
23. Deloitte (2015). Reducing Food Loss along the African agricultural value chains. South Africa. URL: https://www2.deloitte.com/content/dam/Deloitte/za/Documents/consumer-business/ZA_FL1_ReducingFoodLossAlongAfrican-AgriculturalValueChains.pdf
24. Dogson, M. and Gann, D. (2018). The missing ingredient in innovation: patience. URL: https://www.weforum.org/agenda/2018/04/patient-capital/
25. Elemasho et al. (2017). Farmers’ perception of adoption of post-harvest technologies of selected food crops in rivers state, Nigeria. URL: https://www.researchgate.net/publication/322476841_Farmers’_perception_of_adop-tion_of_postharvest_technologies_of_selected_food_crops_in_rivers_state_Nigeria
26. Ellaban, Omar et al. (2014). Renewable energy resources: current status, future prospects and their enabling technology. Renewable energy and sustainable energy reviews. URL: https://reader.elsevier.com/reader/sd/pii/S1364032114005656?token=9F9A963A8687075BAEDB2CE238A87D68D46AB731A0F19D2637781553062F-4C5A4915D66BA2978A69C3A9AA31B07D2A22
27. FAO (2011). Global Food Losses and Food Waste—Extent, Causes and Prevention. Rome: FAO. URL: http://www.fao.org/3/a-i2697e.pdf
28. FAO (2013). Food wastage footprint: Impacts on natural resources. Summary report. URL: http://www.fao.org/3/i3347e/i3347e.pdf
29. FAO (2014). Food Wastage footprint: Full-cost Accounting, Final Report. URL: http://www.fao.org/3/a-bb144e.pdf
30. FAO (2016). Peace And food security — Investing in resilience to sustain rural livelihoods amid conflicts.
31. FAO (2017). Africa — Regional Overview of food insecurity and nutrition. The food insecurity-conflict nexus: building resilience for food security, nutrition and peace. Accra.
32. FAO (2017). The future of food and agriculture: Trends and challenges. URL: http://www.fao.org/3/a-i6583e.pdf
33. FAO and Sathguru Management Consultants (2017). Food loss analysis: causes and solutions — a case study on the chickpea value chain in the Republic of India. Rome.
34. FAO and IFPRI (2017). Conflict, Migration and Food Security — the role of agriculture and rural development. FAO-IF-PRI Joint Brief.
35. FAO and WFP (2019). Monitoring food security in countries with conflict situations. Joint FAO/WFP update for the UN Security Council. URL: http://www.fao.org/3/ca3113en/CA3113EN.pdf
36. FAO. 2019. The State of Food and Agriculture 2019. Moving forward on food loss and waste reduction. Rome. Licence: CC BY-NC-SA 3.0 IGO.
37. FAO, IFAD, UNICEF, WFP and WHO. 2020. The State of Food Security and Nutrition in the World 2020. Transforming food systems for affordable healthy diets. Rome, FAO. https://doi.org/10.4060/ca9692en
38. FAOSTAT. Food and agriculture data. http://www.fao.org/faostat/en/#home
39. Femenia, F. (2015). The effects of direct storage subsidies under limited rationality: a general equilibrium analysis. Agric. Econ., 46 (6), pp. 715-728. URL: https://onlinelibrary.wiley.com/doi/full/10.1111/agec.12187
40. Flanagan K., et al (2019). Reducing food loss and waste — Setting a Global Action Agenda. World Resources Insti-tute.
41. FOLU (2019). 2018 Global Nutrition Report. Shining a light to spur action on nutrition. Bristol, UK. Development Initiatives, 2018.
42. Gitonga, Z.M., et al. (2013). Impact of metal silos on households’ maize storage, storage losses and food security: an application of a propensity score matching. Food Policy, 43, pp. 44-55. url: https://www.sciencedirect.com/sci-ence/article/pii/S0306919213001097

103
43. Global Nutrition Report (2018). Global nutrition report — Shining a light to spur action on nutrition. Chapter 2. URL: https://globalnutritionreport.org/reports/global-nutrition-report-2018/burden-malnutrition/
44. Global Panel on Agriculture and Food Systems for Nutrition (2018). Preventing nutrient loss and waste across the food system: Policy actions for high-quality diets. Policy Brief No. 12. Global Panel
45. Godfrey, Boyle (2004). Renewable Energies. Oxford University Press. URL: http://adsabs.harvard.edu/abs/2004reen.book.....B
46. Gordon, L., et al. (2017). Rewiring food systems to enhance human health and biosphere stewardship. Environmen-tal Research Letters 12 (10).URL: https://iopscience.iop.org/article/10.1088/1748-9326/aa81dc/pdf
47. Gustavsson et al. (2011). Global Food Losses and Food Waste. URL: http://www.fao.org/fileadmin/user_upload/su-istainability/pdf/Global_Food_Losses_and_Food_Waste.pdf
48. Hegnsholt, E, et al. (2018). Tackling the 1.6 billion-ton food loss and waste crisis. Chicago: The Boston Consulting Group.
49. Herrero Acosta, Mario, Daniel Mason-d’Cros, and Jeda Palmer (2019). Transforming food systems under a chang-ing climate. October 2019. CGIAR CCAFS - Research program on climate change, agriculture and food security.
50. HLPE (2014). Food losses and waste in the context of sustainable food systems. A report by the High-Level Panel of Experts on Food Security and Nutrition of the Committee on World Food Security. Rome. URL: http://www.fao.org/3/a-i3901e.pdf
51. iDMC — Internal displacement monitoring centre (2019). Global report on internal displacement. GRID. URL: https://reliefweb.int/sites/reliefweb.int/files/resources/2019-IDMC-GRID_1.pdf
52. IEA (2018). World Energy Outlook: The gold standards of energy analysis. International Energy Agency. URL: https://www.iea.org/weo2018/electricity/
53. IFPRI — International Food Policy Research Institute (2017). The Reality of Food Losses, a new measurement methodology. Luciana Delgado, Monica Schuster and Máximo Torero. IFPRI Discussion Paper 01686. Washington DC.
54. IGD — Initiative for Global Development (2015). Private sector-led solutions to reduce post-harvest loss in Africa. URL: https://www.igdleaders.org/private-sector-led-solutions-to-reduce-post-harvest-loss-in-africa/
55. IISD (2018). Where can we find the finance for a food systems transformation? Written by Marissa Van Epp. URL: http://sdg.iisd.org/commentary/guest-articles/where-can-we-find-the-finance-for-a-food-systems-transforma-tion/
56. Jones, et al. (2014). A simple methodology for measuring profitability of on-farm storage pest management in developing countries. J. Stored Prod. Res., 58, pp. 67-76. URL: https://www.sciencedirect.com/science/article/pii/S0022474X13001033
57. Kell, George (2018). The Remarkable Rise Of ESG. URL: https://www.forbes.com/sites/georgkell/2018/07/11/the-re-markable-rise-of-esg/#36ecdfa21695
58. Kinda S. R. (2017). Climatic Shocks and Food Security: The Role of Foreign Aid, Working Paper Series N° 286. African Development Bank, Abidjan, Côte d’Ivoire. URL: https://www.afdb.org/fileadmin/uploads/afdb/Documents/Publica-tions/WPS_No_286_Climatic_Shocks_and_Food_Security_The_Role_of_Foreign_Aid.pdf
59. Kitinoja, Lisa. (2016). Innovative Approaches to Food Loss and Waste Issues. Frontier Issues Brief submitted to the Brookings Institution’s Ending Rural Hunger project. URL: https://www.researchgate.net/publication/303185499_Innovative_Approaches_to_Food_Loss_and_Waste_Issues
60. Kiunguyu, Kylie. (2019). African entrepreneurs fighting food waste. News article at This Is Africa. Accessed: April 11, 2019. URL: https://thisisafrica.me/african-entrepreneurs-food-waste/
61. Kummu M, de Moel H, Porkka M, Siebert S, Varis O, Ward PJ. (2012) Lost food, wasted resources: global food supply chain losses and their impacts on freshwater, cropland, and fertilizer use. Sci Total Environ URL: 438:477—89.10.1016/j.scitotenv.2012.08.092
62. Laborde, David, Will Martin and Rob Vos (2020). Poverty and food insecurity could grow dramatically as COVID-19 spreads. IFPRI Blog, Research Post. April 16, 2020. URL: https://www.ifpri.org/blog/poverty-and-food-insecuri-ty-could-grow-dramatically-covid-19-spreads
63. Lattanzio, Richard K., (2010). Climate Investment Funds (CIFs): An Overview. Congressional Research Service (CRS) report for Congress. URL: https://nationalaglawcenter.org/wp-content/uploads/assets/crs/R41302.pdf
64. Lipinski, B., Hanson, C., Lomax, J., Kitinoja, L., Waite, R. and Searchinger, T. (2013). Reducing food loss and waste. Installment 2 of Creating a Sustainable Food Future. URL: http://pdf.wri.org/reducing_food_loss_and_waste.pdf
65. Liu, J., Ma, K., Ciais, P. and Polasky, S. (2016). Reducing human nitrogen use for food production. Sci Rep 6: (30104). URL: https://www.ncbi.nlm.nih.gov/pmc/articles/PMC4957089/
66. Manyika, James, et al. (2013). Disruptive technologies: Advances that will transform life, business, and the global economy. McKinsey Global Institute, McKinsey & Company. May 2013. URL: https://www.mckinsey.com/busi-ness-functions/digital-mckinsey/our-insights/disruptive-technologies

104
REFERENCES CONTINUED
67. Mead, Leila (2014). CIF expands to 63 countries. IISD SDG Knowledge Hub. URL: http://sdg.iisd.org/news/cif-ex-pands-to-63-countries/
68. Mercandalli, S. & Losch, B., eds. (2017). Rural Africa in motion. Dynamics and drivers of migration South of the Sahara. Rome, FAO and CIRAD. 60 p. URL: http://www.fao.org/3/i7951en/I7951EN.pdf
69. Messer, E. and M. Cohen (2004). Breaking the Links Between Conflict and Hunger in Africa. International Food Poli-cy Research Institute. URL: http://ebrary.ifpri.org/utils/getfile/collection/p15738coll2/id/73166/filename/73167.pdf
70. Ministry of Environment, Forest & Climate Change (2019). India Cooling Action Plan. New Delhi: Ministry of Environment, Forest & Climate Change. URL: http://ozonecell.in/wp-content/uploads/2019/03/INDIA-COOLING-AC-TION-PLAN-e-circulation-version080319.pdf
71. Nahman A, de Lange W. (2013) Costs of food waste along the value chain: Evidence from South Africa. Waste Management. 2013;33(11):2493-500
72. Neill, Daniel W.O, Andrew L Fanning, William F Lamb, and Julia K Steinberger. (2018). A good life for all within plan-etary boundaries. Nature Sustainability. Nature Sustainability 88 (95): 1-21. URL: eprints.whiterose.ac.uk/127264/1/GoodLifeWithinPB_AuthorAcceptedVersion.pdf.
73. Newbold, T., et al. (2015). Global effects of land use on local terrestrial biodiversity. Nature 520: 45-50. URL: https://www.researchgate.net/publication/274381828_Global_effects_of_land_use_on_local_terrestrial_biodi-versity
74. NRDC (2012). Issue paper. Wasted: How America is losing up to 40 percent of its food from farm to fork to landfill Pg. 7. URL: https://www.nrdc.org/sites/default/files/wasted-food-IP.pdf
75. Nussey, Bill (2019). Why does the cost of renewable energy continue to get cheaper? Accessed: June 20th, 2019. URL: https://www.freeingenergy.com/why-does-the-cost-of-renewable-energy-continue-to-get-cheaper-and-cheaper/
76. PWC. Are you ready for tomorrow — no matter what tomorrow brings? URL: https://www.pwc.com/us/4IR?WT.mc_id=CT3-PL300-DM1-TR1-LS40-ND40-TTA9&eq=CT3-PL300-DM1-CN_4IReady-GoogleNonBranded&gclid=CjwKCAjwwZrmBRA7EiwA4iMzBAnIGpyRln6eBxYh9IPnJ6NINZ31Oe-4l9sYUn6i2pbHsh4RAxplERoCvJMQAvD_BwE
77. ReFED (2016). A Roadmap to Reduce U.S. Food Waste by 20 Percent. United States. URL: https://www.refed.com/?sort=economic-value-per-ton
78. Rockefeller Foundation (2014). Reducing global food waste and spoilage — A Rockefeller Foundation Initiative. Assessing resources needed and available to reduce post-harvest food loss in Africa. The Rockefeller Foundation, Global knowledge initiative. New York.
79. Rockström, J, et al. (2009). Planetary boundaries: exploring the safe operating space for humanity. Ecology and Society 14(2): 32. URL: http://www.ecologyandsociety.org/vol14/iss2/art32/
80. Rockström, J, et al., (2019). Food in the Anthropocene: the EAT—Lancet Commission on healthy diets from sustain-able food systems. Stockholm: The Lancet, 393(10170).
81. Russel, S. (2014). Everything You Need to Know About Agricultural Emissions. URL: https://www.wri.org/blog/2014/05/everything-you-need-know-about-agricultural-emissions
82. Scialabba, N., et al. (2013). Food Wastage Footprint: Impacts on Natural Resources. Summary Report. URL: http://www.fao.org/docrep/018/i3347e/i3347e.pdf
83. Searchinger, T, Et al.,(2018). Creating a Sustainable Food future: A Menu of Solutions to Feed Nearly 10 Billion Peo-ple by 2050. Washington D.C.: World Resources Institute.
84. Shah, S., Agarwal, R., & Sonka, S. (2018). Resolving the Post-Harvest Loss Paradox: Private Sector Solutions and Aid Agency Engagement. URL: http://edsnidercenter.org/wp-content/uploads/2018/01/Resolving-the-Post-Har-vest-Loss-Paradox.pdf
85. Sheahan, M., and C. Barrett (2017). Review: Food loss and waste in Sub-Saharan Africa. Published by Else-vier Ltd. URL: https://reader.elsevier.com/reader/sd/pii/S0306919217302440?token=3FE43F694C9C9EE-33AD18A5349A9400B9052C5EECCEF68FC0BAD4943152BFF5E526EB951FBF148BFD8F03DACA97D7AA0
86. Shcherbak, L., Millar N., and Robertson, P.G. (2014). Global meta-analysis of the nonlinear response of soil nitrous oxide (N2O) emissions to fertilizer nitrogen. URL: https://www.pnas.org/content/pnas/111/25/9199.full.pdf
87. Springmann, M., et al. (2018). Options for keeping the food system within environmental limits. Nature 562: 519-525. URL: https://www.nature.com/articles/s41586-018-0594-0
88. The EAT-Lancet Commission on Food, Planet, Health (2019). Food in the Anthropocene: the EAT—Lancet Commis-sion on healthy diets from sustainable food systems
89. The Economist (2014). Global food security index 2014. Special report: food loss and its intersection with food security. URL: https://foodsecurityindex.eiu.com/Home/DownloadResource?fileName=EIU_GFSI%202014_Spe-cial%20report_Food%20loss.pdf
90. The Guardian (2019). Kidnapping, insurgency to cause food crisis, loss of 10m jobs by 2020. Written by Femi Ibirog-ba. URL: https://guardian.ng/features/kidnapping-insurgency-to-cause-food-crisis-loss-of-10m-jobs-by-2020/
105
91. The Local (2018). Danish consumers reduced food waste by 14 000 tonnes in six years. URL: https://www.thelocal.dk/20180418/danish-consumers-reduced-food-waste-by-14000-tonnes-in-6-years
92. Thyberg, K.L. and D.J. Tonjes (2015). Drivers of food waste and their implications for sustainable policy develop-ment. United States. URL: https://www.sciencedirect.com/science/article/pii/S0921344915301439?via%3Dihub
93. Tomlins, K. et al., (2007). On farm evaluation of methods for storing fresh sweet potato roots in East Africa. Trop. Sci., 47 (4), pp. 197-210. URL: https://onlinelibrary.wiley.com/doi/abs/10.1002/ts.214
94. Trelstad, K. (2010). Patient Capital in an Impatient World. URL: https://www.kauffmanfellows.org/journal_posts/patient-capital-in-an-impatient-worldB
95. UNDP (2012). Food security, violent conflict and human development causes and consequences. Author: Philip Verwimp. URL: https://www.undp.org/content/dam/rba/docs/Working%20Papers/Food%20Security%20Vio-lent%20Conflict.pdf
96. United Nations Environment Programme (2019). India advances ground-breaking plan to keep planet and people cool. URL: https://www.unenvironment.org/news-and-stories/story/india-advances-ground-breaking-plan-keep-planet-and-people-cool
97. UNFCCC (2017). Another record-breaking year for renewable energy. June 2017. Accessed on June 24, 2019. URL: https://unfccc.int/news/another-record-breaking-year-for-renewable-energy
98. UNFCCC (2015). External statement: Donor States determined to commit 100 billion for climate finance. URL: https://unfccc.int/news/18-industrial-states-release-climate-finance-statement
99. US SIF (2018). US SIF Foundation Releases 2018 Biennial Report On US Sustainable, Responsible And Impact Invest-ing Trends. URL: https://www.ussif.org/blog_home.asp?display=118
100. USAID (2018). Post-harvest loss assessment of tomatoes in Rwanda. Feed the Future Innovation Lab for Horticul-ture. Pg. 11. URL: https://horticulture.ucdavis.edu/sites/g/files/dgvnsk1816/files/extension_ material_files/Posthar-vest%20Loss%20Assessment%20of%20Tomatoes%20in%20Rwanda.pdf
101. World Bank Database. URL: https://data.worldbank.org/indicator/AG.LND.AGRI.K2?locations=ZG
102. World Bank Group — WBG (2019). Future of Food. Harnessing Digital Technologies to Improve Food System Out-comes. Washington DC
103. World Bank Group — WBG (2019). World Bank and Folksam Group Join Global Call to Action on Food Loss and Waste. URL: https://www.worldbank.org/en/news/press-release/2019/03/20/world-bank-and-folksam-group-join-global-call-to-action-on-food-loss-and-waste
104. World Bank Group (2017). Atlas of Sustainable Development Goals, 2017 Word Development Indicators.
105. World Bank Group (2011). Missing Food: The case of post-harvest grain losses in Sub-Saharan Africa. Report No. 60371-AFR.
106. World Bank Group. Thematic Bond Advisory. URL: http://treasury.worldbank.org/en/about/unit/treasury/client-ser-vices/green-bond-advisory#2
107. World Economic Forum — WEF. (2019). Innovation with a purpose: improving traceability in food value chains through technology innovations. In collaboration with McKinsey & Company. Geneva
108. World Economic Forum — WEF. (2018). Innovation with a purpose: The role of technology innovation in accelerat-ing food systems transformation. In collaboration with McKinsey & Company. Geneva: January 2018. URL: http://www3.weforum.org/docs/WEF_Innovation_with_a_Purpose_VF-reduced.pdf
109. World Nuclear Association (2018). Energy Subsidies. February 2018. Accessed: June 24, 2019. URL: https://www.world-nuclear.org/information-library/economic-aspects/energy-subsidies.aspx
110. World Population Review — WPR (2019). Sub Saharan Africa Population. (2019-05-12). Retrieved 2019-06-10, URL: http://worldpopulationreview.com/continents/sub-saharan-africa/
111. World Wildlife Fund. URL: https://www.worldwildlife.org/industries/sustainable-agriculture
112. WRAP (2018). Household food waste: restated data for 2007-2015 p33
113. WRI (2019). Monster Avocados and Bread Beer: 12 Technologies Fighting Food Waste.
106
Endnotes1 By 2016, 559 of the 6,190 domesticated breeds of mammals used for food and agriculture (over 9 percent) had
become extinct and at least 1,000 more are threatened.
2 The G20 presidencies of Turkey, China, Germany and Argentina have been advocates of FLW
3 SDG target 12.3 calls to halve per capita global food waste at the retail and consumer levels and reduce food losses along production and supply chains, including post-harvest losses by 2030.
4 As per a review of the 161 INDCs conducted by UNFCCC in May 2016
5 Available upon request.
6 The country’s share of the world market is a major factor determining the size of this elasticity.
7 The ratio of domestic production (consumption) to imports (exports) is a major factor determining the size of this elasticity.
8 “Effective” prices to consumers are higher than purchase prices because the consumer wastes part of their purchases.
9 See Box 5 for the distinction between the trade elasticity of a country (versus the trade elasticity facing a coun-try) and why the share of domestic production imported can be a key factor in the analysis.
10 In our empirical analysis, GHGEs are calculated on final consumption and back upstream as if all production occurred in the UK (of course, waste and GHGE rates would differ across countries, but we ignore that for now). GHGEs from exports are not counted so the adjusted variable qf* backs out exports as if produced elsewhere.
11 Independent of the share of food going where, the cross-price elasticity and relative rates of consumer food waste at-home versus away-from-home.
12 Results for milk and fruit are not shown.
13 For these results higher prices are modelled as an increase in margins for intermediaries and a shift in supply for farmers that lead to a farm price increase of 50%.
14 A shift in farm supply due to an exogenous shock could improve farm welfare despite a decline in farm produc-tion and farm sales since the increase in sales price could more than cover for the decline in sales.
15 These changes are calculated doubling the impacts of a 20% tax to approach the impacts of a 40% tax; this is a rough approximation since different tax magnitudes may trigger effects that are not proportional.
16 Annex B reports equal values for some impacts due to rounding
107
© 2020 International Bank for Reconstruction and Development / The World Bank
1818 H Street NW Washington DC 20433 Telephone: 202-473-1000 Internet: www.worldbank.org
This work is a product of the staff of The World Bank with external contributions. The findings, interpretations, and conclusions expressed in this work do not necessarily reflect the views of The World Bank, its Board of Executive Directors, or the governments they represent.
The World Bank does not guarantee the accuracy of the data included in this work. The boundaries, colors, denominations, and other information shown on any map in this work do not imply any judgment on the part of The World Bank concerning the legal status of any territory or the endorsement or acceptance of such boundaries.
Rights and Permissions
The material in this work is subject to copyright. Because The World Bank encourages dissemination of its knowledge, this work may be reproduced, in whole or in part, for noncommercial purposes as long as full attribution to this work is given.
Any queries on rights and licenses, including subsidiary rights, should be addressed to World Bank Publications, The World Bank Group, 1818 H Street NW, Washington, DC 20433, USA; fax: 202-522-2625; e-mail: [email protected].
